Embed Size (px)
Citation preview
©Climate Interactive
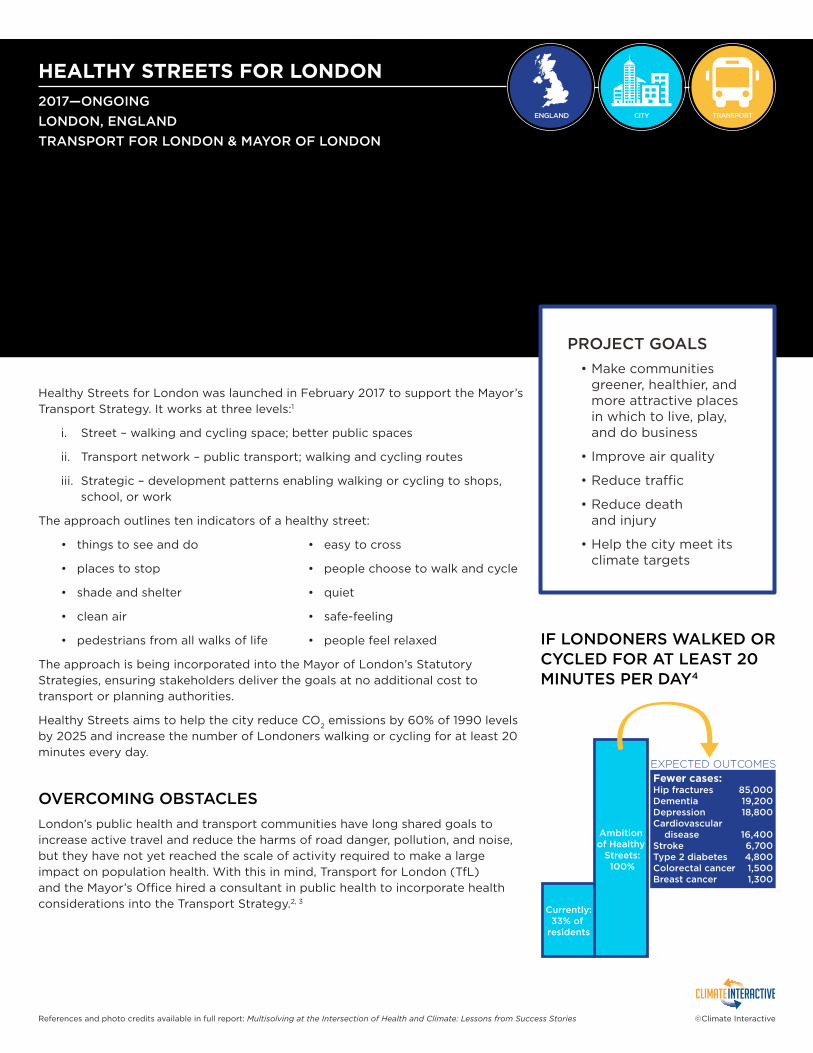
HEALTHY STREETS FOR LONDON
2017—ONGOING
LONDON, ENGLAND
TRANSPORT FOR LONDON & MAYOR OF LONDON
Healthy Streets for London was launched in February 2017 to support the Mayor’s Transport Strategy. It works at three levels:1
i. Street – walking and cycling space; better public spaces
ii. Transport network – public transport; walking and cycling routes
iii. Strategic – development patterns enabling walking or cycling to shops, school, or work
The approach outlines ten indicators of a healthy street:
• things to see and do
• places to stop
• shade and shelter
• clean air
• pedestrians from all walks of life
• easy to cross
• people choose to walk and cycle
• quiet
• safe-feeling
• people feel relaxed
The approach is being incorporated into the Mayor of London’s Statutory Strategies, ensuring stakeholders deliver the goals at no additional cost to transport or planning authorities.
Healthy Streets aims to help the city reduce CO2 emissions by 60% of 1990 levels
by 2025 and increase the number of Londoners walking or cycling for at least 20 minutes every day.
PROJECT GOALS
• Make communities greener, healthier, and more attractive places in which to live, play, and do business
• Improve air quality
• Reduce traffic
• Reduce death and injury
• Help the city meet its climate targets
OVERCOMING OBSTACLES
London’s public health and transport communities have long shared goals to increase active travel and reduce the harms of road danger, pollution, and noise, but they have not yet reached the scale of activity required to make a large impact on population health. With this in mind, Transport for London (TfL) and the Mayor’s Office hired a consultant in public health to incorporate health considerations into the Transport Strategy.2, 3
IF LONDONERS WALKED OR CYCLED FOR AT LEAST 20 MINUTES PER DAY4
References and photo credits available in full report: Multisolving at the Intersection of Health and Climate: Lessons from Success Stories
Currently:33% of
residents
Ambition of Healthy
Streets:100%
EXPECTED OUTCOMES
Fewer cases:Hip fracturesDementiaDepressionCardiovascular diseaseStrokeType 2 diabetesColorectal cancerBreast cancer
85,000 19,200 18,800
16,400 6,700 4,800 1,500 1,300
©Climate Interactive
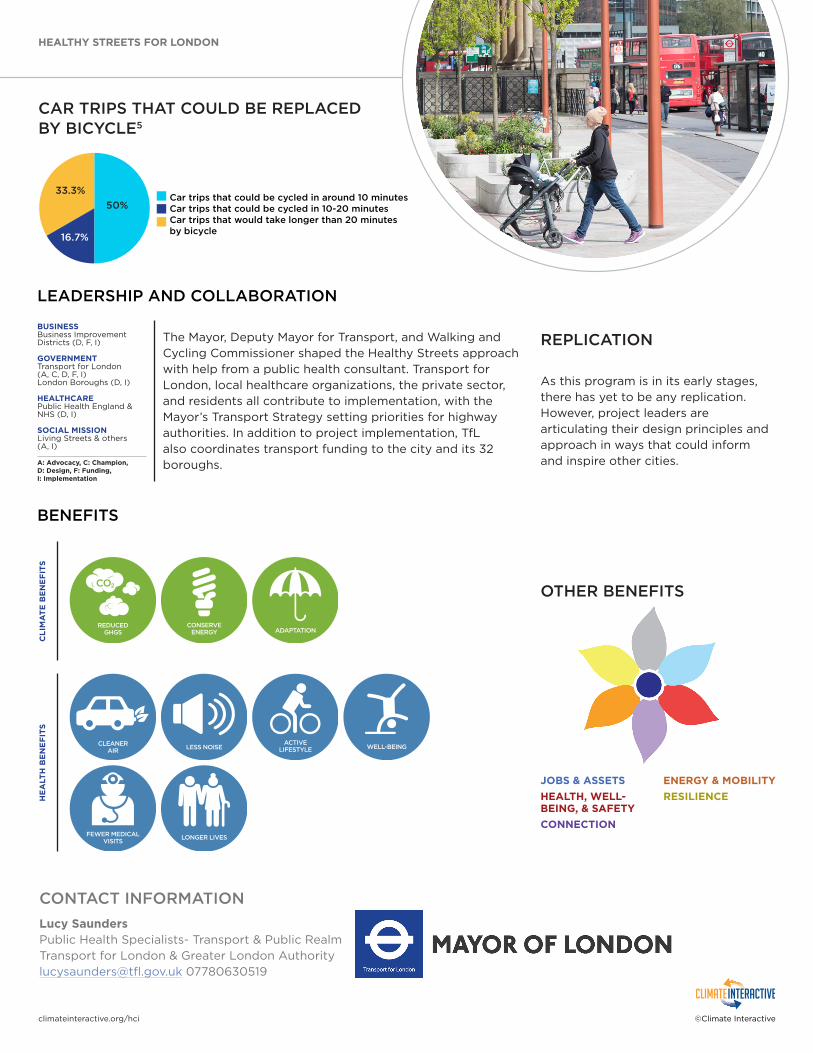
CAR TRIPS THAT COULD BE REPLACED BY BICYCLE5
OTHER BENEFITS
JOBS & ASSETS
HEALTH, WELL-BEING, & SAFETY
CONNECTION
ENERGY & MOBILITY
RESILIENCE
REPLICATION
As this program is in its early stages, there has yet to be any replication. However, project leaders are articulating their design principles and approach in ways that could inform and inspire other cities.
CONTACT INFORMATION
Lucy SaundersPublic Health Specialists- Transport & Public RealmTransport for London & Greater London [email protected] 07780630519
HEALTHY STREETS FOR LONDON
LEADERSHIP AND COLLABORATION
BENEFITS
The Mayor, Deputy Mayor for Transport, and Walking and Cycling Commissioner shaped the Healthy Streets approach with help from a public health consultant. Transport for London, local healthcare organizations, the private sector, and residents all contribute to implementation, with the Mayor’s Transport Strategy setting priorities for highway authorities. In addition to project implementation, TfL also coordinates transport funding to the city and its 32 boroughs.
CL
IMA
TE
BE
NE
FIT
SH
EA
LTH
BE
NE
FIT
S
BUSINESS Business Improvement Districts (D, F, I)
GOVERNMENT Transport for London (A, C, D, F, I) London Boroughs (D, I)
HEALTHCARE Public Health England & NHS (D, I)
SOCIAL MISSION Living Streets & others (A, I)
A: Advocacy, C: Champion, D: Design, F: Funding, I: Implementation
climateinteractive.org/hci
Car trips that could be cycled in around 10 minutesCar trips that could be cycled in 10-20 minutesCar trips that would take longer than 20 minutesby bicycle
50%
16.7%
33.3%