Embed Size (px)
Citation preview

Heat of Neutralization Purpose The purpose of this experiment is to determine the heat of reaction for a neutralization reaction.
HA NAOH NaA HOH+ → + Problem to be Investigated For which acid, HCL, H2SO4, or CH3COOH, is the greatest quantity of heat released per mole of H+. Why? Discussion The literature indicates that 57.2 kJ (13.7kcal) are released as heat for the reaction
H OH HOH+ −+ → However, a higher value may be obtained in moderately concentrated solutions, and a lower value may be obtained if a weak (partially ionized) acid is used. In this experiment you will determine the quantity of heat evolved when a strong base, sodium hydroxide, neutralizes various acids. Equipment and Chemicals Parr model 1451 solution calorimeter, 0.1 M HCL, 0.05M H2SO4, 0.1M CH3COOH, 1.0 M NaOH (Know safety precautions!) Directions Carefully read the instructions supplied by the instrument manufacturer. (see attachment.) The following modifications are suggested: 1. Standardize the instrument as directed. 2. Place 90 ml acid solution in the Dewar flask. Place 10 ml 1.0 M base in the rotating
sample cell. This will give a slight excess of base, assuring that all the acid is neutralized.

3. All liquid solutions should be adjusted to nearly the same temperature before they
are loaded into the calorimeter. 4. Clean the Dewar and sample cell thoroughly after each run. 5. In most cases good results can be obtained with the recorder set on the 10 millivolt
scale (one degree full scale). If the pen goes off scale during the run, change the temperature scale on the thermometer.
NOTE: This experiment requires very careful work!
INSTRUCTIONS FOR THE 1451 SOLUTION CALORIMETER Introduction The 1451 Solution Calorimeter described in these instructions is an easily operated instrument which can be used to measure the heat evolved or absorbed by chemical reactions in a liquid media. Measurements are made at room temperature and atmospheric pressure for systems producing energy changes ranging from 2 to 1000 calories. At the start of a test in this calorimeter one liquid is held in a glass Dewar while the other reactant, either solid or liquid, is held in a sealed glass rotating cell which is immersed in the first liquid. After both reactants come to thermal equilibrium, the operator starts the reaction by depressing a push rod to drop the contents of the cell into the surrounding liquid. The reaction then proceeds to completion under the vigorous stirring action of the rotating cell. Throughout the test, temperatures in the calorimeter are sensed by a thermistor and read from a bridge which is built into the calorimeter case. Deviations from the bridge reading are traced by a potentiometric strip chart recorder to produce a thermogram showing the temperature change produced by the reaction. Data from the thermogram can then be used to compute the change in enthalpy. The instructions given in this manual cover the basic steps to e followed in: setting up and operating the calorimeter; recording temperature changes; standardizing the calorimeter and computing energy values. Calorimeter Operations

Sample Size. The rotating sample cell will hold up to 20 ml of liquid sample or a solid sample weighing up to one gram. More than one gram of solid may be used in some cases,s but smaller samples are preferred so that the heat capacity and ionic strength of the system will not change significantly when the reactants are mixed. The Dewar must be filled with not less than 90 ml and not more than 120 ml of liquid to properly cover the rotating cell. Filling the Dewar. It is best to lift the Dewar out of the air can during the filling operation. The liquid to be placed in it can be measured volumetrically, or the Dewar can be placed on a solution or trip balance and filled by weight. After filling the Dewar, set it in the air can and gently push the spacer ring down as far as it will go. Loading a Solid Sample. Solid samples should be suitable ground so that they will dissolve quickly or mix uniformly with the liquid in the Dewar. Place the 126C Teflon dish on an analytical balance and weigh the sample directly into the dish. Be careful not to drop any of the sample into the push rod socket. After the final weighing, set the dish on a flat surface and carefully press the glass bell over the dish to assemble the cell. Do not grasp or press the thin-walled glass stem during this operation; it is fragile and will break easily. Instead, grasp the bell and press it firmly onto the dish. Then lift the cover from the calorimeter and attach the cell to the stirring shaft by sliding the plastic coupling onto the shaft as far as it will go and turning the thumb screw finger tight. Hold the cover in a horizontal position and lower it carefully until the bottom of the rotating cell rests on a firm, flat surface; then insert the push rod through the pulley hub and press the end of the rod into the socket in the 126C sample dish. Loading a Liquid Sample. Liquid samples can be measured into the rotating cell either by volume or by weight. Best precision is obtained by weighing, but filling from a volumetric pipet may be adequate in some cases. Set the 126C Teflon dish on a flat surface and press the glass bell over the dish, handling the glass carefully as described above. If the sample is to be weighed, tare the empty cell on a laboratory balance; insert a pipet through the glass stem and add the liquid; then reweigh the cell. Attach the cell to the stirring shaft and insert the push rod. Install the thermistor probe in the cover opening and press the bushing firmly into place to anchor the probe in its proper position. Handle the cover carefully after installing the probe since the glass stem will break easily. Lower the cover assembly with the cell and thermistor probe into the Dewar and set the cover in place on the air can; then drop the drive belt over the pulleys and start the motor. Combining the Reactants. Each test in a solution calorimeter can be divided into three distinct time periods: (1) a preperiod during which the reactants are allowed to come to thermal equilibrium; (2) a reaction period during which the reactants are combined and an enthalpy change occurs in the system; and (3) a postperiod during which the

calorimeter again comes to equilibrium. At the end of the preperiod, start the reaction by pressing the push rod downward to drop the sample out of the rotating cell. This should be done quickly without interrupting the rotation of the rod and without undue friction from the finger. Push the rod down as far as it will go; after which it should continue to rotate with the pulley. Let the stirrer continue to run during the postperiod until a uniform slop is established, as explained later in these instructions. Thermometer and Recorder Operations The temperature measuring system is this calorimeter consists of a thermistor probe and a special bridge designed for use within the ten-degree span from 20o to 30o C. Within this range the response of the thermometer is linear, with each 10 microvolt change in output representing a temperature change of exactly .001o C. Thus, when the output signal is fed to a recorder and plotted on a 1, 10, or 100 millivolt chart, temperatures can be read directly from the chart without applying a conversion factor. The following values will apply when equating changes in thermometer output to temperature changes.
10 microvolts .000010 V = .001°C 1 millivolt .001 V = .100°C 10 millivolts .010 V = 1.000°C 100 millivolts .100 V = 10.00°C
Once these basic relationships are understood the bridge can be balanced to a zero output at any baseline temperature from 20° to 30° C and a recording range can be selected to produce a full-scale trace corresponding to a temperature change of 0.1°, 1.0° or 10°C. The true temperature at any point on the chart can then be determined by adding the chart reading to the baseline setting shown by the unit temperature switch and digital potentiometer located within the marked box on the thermometer panel. There are five switch positions on the selector switch in the center of the thermometer panel, the middle three of which have adjusting knobs. OFF ZERO NULL CAL READ In the OFF position no power is supplied to the thermometer and the system is dead. The switch should remain in this position whenever the calorimeter is not in use. The ZERO control adjusts the output of the bridge to zero voltage. The NULL control adjusts the bridge to indicate a temperature of exactly 20°C at zero voltage output. The CAL adjustments set the full scale output of the bridge at exactly 100 millivolts, corresponding to a temperature exactly 10°C above the bridge null. The READ position is used to feed the thermometer signal to the recorder.
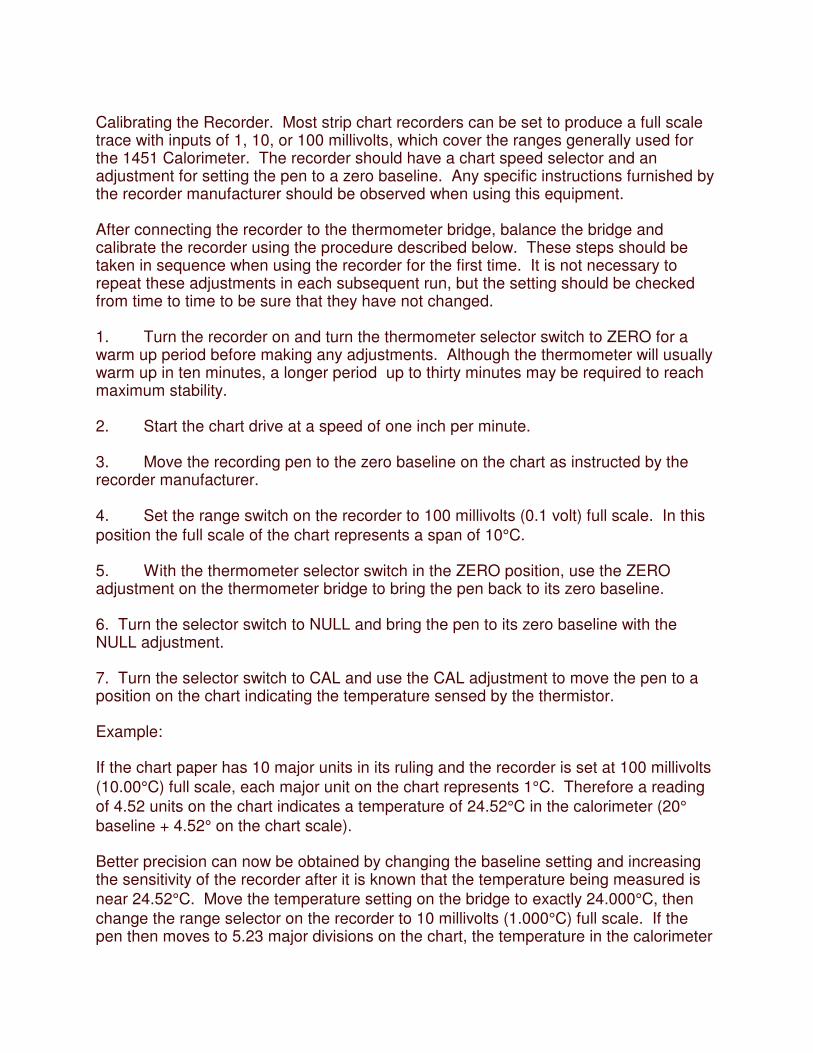
Calibrating the Recorder. Most strip chart recorders can be set to produce a full scale trace with inputs of 1, 10, or 100 millivolts, which cover the ranges generally used for the 1451 Calorimeter. The recorder should have a chart speed selector and an adjustment for setting the pen to a zero baseline. Any specific instructions furnished by the recorder manufacturer should be observed when using this equipment. After connecting the recorder to the thermometer bridge, balance the bridge and calibrate the recorder using the procedure described below. These steps should be taken in sequence when using the recorder for the first time. It is not necessary to repeat these adjustments in each subsequent run, but the setting should be checked from time to time to be sure that they have not changed. 1. Turn the recorder on and turn the thermometer selector switch to ZERO for a warm up period before making any adjustments. Although the thermometer will usually warm up in ten minutes, a longer period up to thirty minutes may be required to reach maximum stability. 2. Start the chart drive at a speed of one inch per minute. 3. Move the recording pen to the zero baseline on the chart as instructed by the recorder manufacturer. 4. Set the range switch on the recorder to 100 millivolts (0.1 volt) full scale. In this position the full scale of the chart represents a span of 10°C. 5. With the thermometer selector switch in the ZERO position, use the ZERO adjustment on the thermometer bridge to bring the pen back to its zero baseline. 6. Turn the selector switch to NULL and bring the pen to its zero baseline with the NULL adjustment. 7. Turn the selector switch to CAL and use the CAL adjustment to move the pen to a position on the chart indicating the temperature sensed by the thermistor. Example: If the chart paper has 10 major units in its ruling and the recorder is set at 100 millivolts (10.00°C) full scale, each major unit on the chart represents 1°C. Therefore a reading of 4.52 units on the chart indicates a temperature of 24.52°C in the calorimeter (20° baseline + 4.52° on the chart scale). Better precision can now be obtained by changing the baseline setting and increasing the sensitivity of the recorder after it is known that the temperature being measured is near 24.52°C. Move the temperature setting on the bridge to exactly 24.000°C, then change the range selector on the recorder to 10 millivolts (1.000°C) full scale. If the pen then moves to 5.23 major divisions on the chart, the temperature in the calorimeter

is 24.523°C (24° baseline + 0.523°C on the chart). Or, for best precision, set the temperature dials to exactly 24.520°C and change the range selector on the recorder to 1 millivolt (0.100°C) full scale. Now use the recorder as a null indicator and adjust the digital potentiometer to bring the pen back to the zero baseline. If the digital meter then reads 0.525, the temperature in the calorimeter is 24.525°C.
PRODUCING THE THERMOGRAM Choosing the range. Before starting a run, try to estimate the total energy change involved in the experiment so that the recorder can be set in a range which will produce the best thermogram. The following settings are recommended: Up to 10 calories, set at .001 V (0.100°C) full scale. 10 to 100 calories, set at .010 V (1.000°C) full scale. 100 to 1000 calories, set at .100 V (10.00°C) full scale. If the sign and magnitude of the enthalpy change cannot be estimated before starting an experiment, set the recorder at .01 V (1.000°C)full scale and make a trial run starting with a baseline in the middle of the chart. The temperature change observed in this experiment can then be used as a guide for setting the recorder to a different range and baseline to produce a better thermogram in a subsequent run. Resetting the Pen. If the reaction to be examined is expected to be endothermic, the pen must be raised to a higher position in order to record a temperature drop during the reaction. To raise the pen, simply turn the unit temperature switch or the digital potentiometer to a lower setting. This change can be made at any time without affecting the range and calibration of the recorder. In exothermic experiments, a baseline adjustment may be desirable at this time if the temperature in the calorimeter has changed significantly during the initial equilibration period. Beginning the Trace. The liquid in the Dewar and the sample in the rotating cell must reach thermal equilibrium, and the recorder must trace a straight line for at least 3 or 4 minutes before starting the reaction. To minimize this equilibration period, the reactants should be at approximately the same temperature when they are placed in the calorimeter. This is particularly important when working with reactions which produce low enthalpy changes. In such cases any temperature difference between the two solutions in a liquid-liquid system should not exceed 0.2° when the calorimeter is loaded. The calorimeter should then be allowed to run for about 15 minutes before starting the trace. Solid-liquid systems will usually come to equilibrium within a shorter period.

Completing the Trace. Having established the initial drift, start the reaction by depressing the push rod to open the rotating cell. This will produce a distinct temperature change which will soon taper off to a uniform drift as the calorimeter again comes to equilibrium. Continue the trace until the drift line becomes straight and remains straight for at least three minutes. Usually this condition will be reached within ten minutes or less after starting the reaction. At the conclusion of the test, stop the recorder; lift the pen and turn the thermometer selector switch to ZERO. Remove the chart from the recorder and mark it to identify the run and the reactants involved. Also, write in the baseline temperature and show the recorder range setting for this run. Emptying the Calorimeter. Stop the calorimeter motor; raise the cover carefully and wipe any excess liquid from the parts that were immersed in the Dewar. Remove the thermistor probe from the cover and remove the sample dish from the end of the push rod; then remove the rod and release the glass cell from the drive shaft. Lift the Dewar out of the air can and empty it; then wash and dry all wetted parts carefully.
READING THE THERMOGRAM
In order to determine the net temperature change produced by the reaction it is necessary to locate a point on the thermogram at which the temperature reached 63 per cent of its total rise (or fall). This can be done easily using the graphic procedure which is described below, although other variations of this method can be used as well. 1. Place a straight edge over the preperiod drift line and extend this line well past the
point at which the cell was opened to start the reaction. 2. Move the straight edge to the postperiod drift line and extrapolate this line backward
to the time when the cell was opened. If there are fluctuations in the drift lines due to noise or other variations in the signal, use the best average when drawing these extrapolations.
3. Using a centimeter scale, measure the vertical distance, R, between the two
extrapolated lines at a point near the middle of the reaction period. 4. Multiply the distance, R, by 0.63, then 5. Set the zero end of the centimeter scale on the extrapolated preperiod drift line and
move the scale along this line to locate a vertical intercept with the thermogram which is exactly 0.63R above the preperiod drift line. Draw a vertical line through this point to intercept both draft lines.
6. Read the initial temperature, iT ,and the final temperature, fT , at the points of
intersection with the drift lines and subtract to determine the corrected temperature rise, T∆ :

f iT T T∆ = − Although the thermogram shown on page 14 to illustrate this graphic method is taken from an exothermic reaction, the same steps can be used to established the corrected temperature change for an endothermic reaction. If it was necessary to reset the pen during the test, the graphic procedure can still be used by taking into account the two different baseline temperatures when reading the intercepts. However, in such cases it usually will be desirable to re-run the experiment using a different baseline or a higher span on the recorder to produce an unbroken thermogram.
POST PERIODREACTION PERIODPREPERIOD
TIME
TE
MPE
RA
TU
RE
Graphic Procedure for Determining ∆TC
∆TC
.63R
Tf
Ti


CALCULATING THE ENERGY CHANGE
The energy change, Q , measured in this calorimeter is calculated by multiplying the net corrected temperature change, T∆ , by the energy equivalent, e, of the calorimeter and its contents,
eQ T= ∆ ⋅ (Note that the energy equivalent, e, is the same as the heat capacity, c.) If T∆ is measured in degrees °C and e is expressed in calories per °C, Q will be reported in calories. The energy equivalent, e , is determined by a calibration procedure which is described below under Standardization. The change in enthalpy, H∆ , at the mean reaction temperature is equal to -Q divided by the amount of sample used in the experiment, expressed either in moles or grams.
QH
m∆ = −
where T is the temperature. Enthalpy values are usually expressed in kilocalories per mole. Procedures for converting enthalpy changes, H∆ , to thermodynamic standard conditions and for using H∆ in other computations can be obtained from thermodynamics or thermochemistry textbooks, or from literature references.
STANDARDIZING THE CALORIMETER
As explained above, in order to calculate the energy change, Q , involved in a reaction, the energy equivalent, e, of the calorimeter and its contents must be known. Values of e are determined by running several calibration experiments in which the calorimeter is operated in the usual manner but with reactants which release ( or absorb) a known amount of energy. The energy equivalent in then calculated by dividing the known energy input, EQ , by the corrected temperature rise, T∆ .
EQe
T=
∆

Standardization with TRIS. A sample of tris (hydroxymethyl) aminomethane, commonly called TRIS, is furnished with the 1451 calorimeter to provide a reliable standardizing reagent. TRIS is furnished as a dry powder which can be used directly from the bottle as supplied without further preparation, but undue exposure to air and moisture should be avoided in order to preserve the integrity of the standard. For standardizing the 1451 calorimeter, solid TRIS can be dissolved in dilute hydrochloric acid in a controlled reaction for which the amount of heat evolved is well established. In the recommended standardization procedure described below, 0.5 gram of TRIS is dissolved in 100 ml of 0.1 N HC1 to evolve 58.738 calories per gram of TRIS at 25°C. This is the procedure: 1. Tare the Dewar on a solution or trip balance and add exactly 100.00 ± 0.05 grams of 0.100 N HCl. 2. Weigh 0.50 ± 0.01 grams of TRIS into the 126C Teflon dish on an analytical balance to an accuracy of ± 0.0001 g. 3. Assemble the rotating cell; place it in the calorimeter and start the motor. 4. Let the calorimeter come to equilibrium; the set the recorder at .01 V (1.000°C) full scale; set the baseline at the bottom of the chart for an exothermic reaction and trace a thermogram as previously described. 5. Analyze the thermogram to determine the net corrected temperature rise, T∆ .
6. Calculate the known energy input by substituting in the equation:
[ ]heat of neutralization of TRISEQ m= ⋅
where,
the energy input in caloriesEQ = the weight of TRIS in gramsm =
7. Calculate the energy equivalent of the calorimeter and its contents by substituting in the equation:

e EQT
=∆
where e will be expressed in calories per °C. 8. Determine the energy equivalent of the empty calorimeter by subtracting the heat capacity of the 100 g of 0.1 N HC1 from e, as follows: e’ = e - (100.00) (.99894) where, e’ = the energy equivalent of the empty calorimeter in calories per °C. 100.00 = the weight of 0.100 N HCl in grams .99894 = the specific heat of 0.1 N HC1 at 25°C Example: A standardization reaction involving: 0.5017 grams of TRIS, and 100.00 grams of 0.100 N HCl

produces a net corrected temperature rise of: 0.244 CT∆ = � In the reaction the known energy input is:
[ ]0.5017 58.977 29.589 caloriesEQ = ⋅ = The energy equivalent, e, of the calorimeter and its contents is then computed:
29.589121.27 caloires/ C
0.244e = = �
The energy equivalent, e’ , of the empty calorimeter in then computed:
( )( )121.27 100.00 0.99894 21.38 calories/ Ce′ = − = �

EXAMPLE A - An Exothermic Reaction Problem: Determine the change in enthalpy for solid sodium sulfate,
4NaSO , when dissolved in a 5 gram/liter aqueous solution of barium
chloride, 2 2BaCl 2H O• . 4NaSO 0.1458 gramsm = ++Ba 100.00 gramsm =
Corr. temp. rise 0.042 CT∆ = � (from chart, p. 20) Energy equivalent 121.46 cal/ Ce = � Energy evolved ( ) ( )0.042 121.46 5.1013 caloriesQ T e= ∆ ⋅ = ⋅ =
Enthalpy change 5.1013
34.99 cal/g @ 24.885 C0.1458T
QH
m−∆ = − = = − �
Or, multiplying by 142.04 (the molecular weight of 4NaSO ) ( ) ( )34.99 cal/g 142.04g/molTH∆ = − ⋅
4.970 Kcal/mol @ 24.885 C= − �

TIME
TE
MPE
RA
TU
RE
∆T
Tf
Ti
Example A: An Exothermic Reaction
0.1458 g solid 4NaSO dissolved in 100.00 g of 5 g/l aqueous 4 2BaSO 2H O• Full Scale 1mV = 0.1°C Baseline = 24.852°C Tf = 0.0494 + 24.852 Ti = 0.0074 + 24.852 ∆T = 0.0420°C

SAMPLE CALCULATIONS Experiment: Exp. 9.1 Heat of Neutralization Data: Standardization with TRIS
0.500m g= , ∆t=0.26°C
Time (s) Volt (V) Temp (°C) Time (s) Volt (V) Temp (°C) 0 -0.0219 17.81 360 -0.0195 18.05 60 -0.0205 17.95 420 -0.0194 18.06 120 -0.0202 17.98 480 -0.0194 18.06 180 -0.0199 18.01 540 -0.0193 18.07 240 -0.0198 18.02 600 -0.0193 18.07 300 -0.0196 18.04
( ) ( ) ( )heat of neutralization of TRIS 0.500 TRIS 58.75cal/ 29.375calEQ m g g= × = × =
29.375cal
112.98cal/ C0.26 C
EQe
T= = = °
∆ °
HCl
Time (s) Voltage (V) Temp (°C) Time (s) Voltage (V) Temp (°C) 0 -0.0115 18.85 120 -0.0019 19.81 15 -0.0026 19.74 150 -0.0019 19.81 30 -0.0017 19.83 180 -0.0020 19.81 45 -0.0018 19.82 210 -0.0020 19.80 60 -0.0018 19.82 240 -0.0020 19.80 75 -0.0018 19.82 270 -0.0020 19.80 90 300 -0.0021 19.79 105 -0.0019 19.82
∆t=0.98°C, HCl=90.0mLV
0.1molHCl0.0900 0.009molHClL
L× =
( )( )112.98cal/ C 0.98 C 110.72calQ e t= ⋅ ∆ = ° ° =
110.72cal12302.22cal/mol
0.009molTH−∆ = =

2 4H SO
( ) ( )1 2 33.91 77.77 kJ/mol 111.68kJ/mol 26.692cal/molH H H∆ = ∆ + ∆ = − + − = − = −� �� � Calculations:
2HCl+NaOH NaCl+H O→
+ -2H +OH H O→
- -
22 4 4 1H SO +OH H O+HSO H→ ∆
- - 2-24 4 2HSO +OH H O+SO H→ ∆
- -
2HAcc+OH Acc +H O→