Embed Size (px)
Citation preview
- 1 -
HEDS Discussion Paper 03/01
Disclaimer: This is a Discussion Paper produced and published by the Health Economics and Decision Science (HEDS) Section at the School of Health and Related Research (ScHARR), University of Sheffield. HEDS Discussion Papers are intended to provide information and encourage discussion on a topic in advance of formal publication. They represent only the views of the authors, and do not necessarily reflect the views or approval of the sponsors. White Rose Repository URL for this paper: http://eprints.whiterose.ac.uk/11035/ Once a version of Discussion Paper content is published in a peer-reviewed journal, this typically supersedes the Discussion Paper and readers are invited to cite the published version in preference to the original version. Published paper Dolan P, Tsuchiya A. The social welfare function and individual responsibility: Sometheoretical issues and empirical evidence from health. Journal of Health Economics2009;28:210–20.
White Rose Research Online

- 2 -
1
The University of Sheffield
ScHARR School of Health and Related Research�
�
Sheffield Health Economics Group
Discussion Paper Series
August 2003
Ref: 03/1
The social welfare function and individual responsibility:
Some theoretical issues and empirical evidence from health
Paul Dolan & Aki Tsuchiya
Corresponding Author: Aki Tsuchiya Sheffield Health Economics Group School of Health and Related Research University of Sheffield Regent Court, Sheffield, UK S1 4DA Email: [email protected] This series is intended to promote discussion and to provide information about work in progress. The views expressed are those of the authors, and should not be quoted without their permission. The authors welcome your comments.

2
Acknowledgements
We would like to thank Jan Abel Olsen, Peter Smith and Alan Williams for their
comments on earlier versions of this paper. We are indebted to Atsushi Higuchi for
technical advice and to Rebecca Shaw for her work on the collection of the data. The
empirical study was financed by the Economic and Social Research Council (Award
No: L128251050).
3
The social welfare function and individual responsibility:
Some theoretical issues and empirical evidence from health
ABSTRACT
The literature on income distribution has attempted to quantitatively analyse different
degrees of inequality using a social welfare function (SWF) approach. However, it has
largely ignored the source of such inequalities, and has thus failed to consider different
degrees of inequity. The literature on egalitarianism has addressed issues of equity,
largely in relation to individual responsibility. This paper brings these two literatures
together by introducing the concept of individual responsibility into the SWF approach.
The results from an empirical study of people’s preferences in relation to the
distribution of health benefits are presented to illustrate how the parameter values in
such a SWF might be determined.
Key words: equity, social welfare function, individual responsibility
JEL Classification: D63
4
INTRODUCTION
How to allocate resources in the public sector so as to achieve a fair and efficient
distribution of benefits has been a major concern for economists. A social welfare
function (SWF), which seeks to show the trade-off between the maximisation of
benefits and an equitable distribution of those benefits, is often used to analyse
distributional issues. There are a number of ways in which the SWF can be specified
and there has been much theoretical work in this area. There have been some, though
far fewer, attempts to estimate SWFs from the stated preferences of individuals. In an
extensive programme of research over many years, Amiel and Cowell have, in various
ways, asked respondents to choose between different distributions of income in order to
explore the extent to which axioms used in the income distribution literature are
supported by the lay public (Amiel, Cowell 1999). The results from these studies can
be used to determine the SWF for income.
These studies have focused on the extent to which people are willing to trade-off overall
benefits for a more equal distribution of benefits i.e. equality-efficiency trade-offs. But
is an unequal distribution necessarily an inequitable one? Might some inequalities (in
income, health or whatever) be considered fair? To answer these questions – about
equity-efficiency trade-offs – we would need to know something about the reasons for
the inequalities. If, for example, they were caused by factors outside people’s control,
then we might be willing to pay a higher price (in terms of overall benefits foregone) in
order to reduce them. If, however, the inequalities were the result of people’s
autonomous choices, then we might see them as the acceptable consequences of
expressions of free will (Miller 1992).
There has been much debate in the ethical literature on egalitarianism about the role that
individual responsibility should play in judging the fairness of various inequalities in
society. The central question for any egalitarian theory is “equality of what?”. This
question involves identifying those things that ought – and ought not – to be equal
across individuals. Dworkin (1981) draws a distinction – referred to as Dworkin’s cut –
between an individual’s “preferences” and his “resources”, holding him responsible for
inequalities that result from differences in the former but not the latter. Cohen (1989)
5
redefines this distinction to be one between “choice” and “luck” (also see Rawls, 1971,
Arneson, 1990, Roemer, 1993). Fleurbaey (1995a, 1995b) distinguishes further
between kinds of responsibility (by individual “control” or by social “delegation”) and
the object of responsibility (over “factors” or over “outcomes”), and argues for the
equality of delegated outcomes. Whatever the details of the different approaches, the
key egalitarian concept is that inequalities for which individuals can be held responsible
are not unjust – an inequality only becomes an inequity if an individual cannot be held
responsible for his disadvantage.
So, if we are to say something meaningful about equity-efficiency trade-offs, and hence
to express this in a SWF, we need to go beyond consequences and consider the causes
of, and whether individuals can be held responsible for, any inequalities in addition to
their extent. This paper addresses some of the theoretical and empirical issues
associated with estimating the parameters of a specified SWF, with particular reference
to health benefits. Section 1 sets out the functional form of the SWF used in this study,
and then considers health as the argument in the SWF. Section 3 discusses the
relevance of different causes of health inequality, and Section 4 illustrates how, based
on empirical data, the parameters of the SWF can be determined. Section 5 presents the
results from an empirical study that elicited the general public’s preferences over the
equity-efficiency trade-off in health, and these data are used to determine the parameters
of the SWF. Section 6 discusses the implications of the results for estimating the
parameters of SWFs across different contexts.
I. THE SOCIAL WELFARE FUNCTION
There are a number of functional forms that the SWF can take. In order to deal with
varying degrees of inequality, an additive SWF with convexity to the origin to allow for
inequality aversion has been widely used in the literature (see Layard, Walters, 1994;
Ray, 1984; Little, Mirrlees, 1974; Wagstaff, 1994). This kind of generalised
Benthamite SWF can be traced back to Atkinson (1970). Here, a SWF with a constant
elasticity of substitution (CES) for the two-party case is assumed, so that:
[ ] ,)1(1
rrB
rA UUW
−−− −+= αα ,0, ≥BA UU 10 ≤≤ α , ,1−≥r ,0≠r [1]
6
where W is the level of social welfare and UA and UB are the total level of individual
well-being (u) of groups A and B so that U = Σ u. What U and u actually represent can
be kept fairly open so long as: a) it is a measure of well-being which is capable of being
expressed on a cardinal scale; b) the individual well-being functions are identical across
individuals; and c) the level of u associated with death is zero. The groups A and B are
of equal size, homogeneous, and identical in terms of their non-responsibility attributes.
As is well established, parameter r of equation [1] represents the degree of inequality
aversion, ranging from the inequality neutral utilitarian-type SWF at r = -1, to the
maximin Rawlsian-type SWF as r approaches infinity. The parameter . reflects the
weight given to one group relative to the other, and is reflected by he steepness of the
iso-welfare contours about the 45º ray. If both groups are weighted equally in the social
welfare calculus, then . = (1 - .) = 0.5, thus resulting in contours that are symmetric
around the 45o ray, with a gradient of -1. When . �����- .), the contour will be
asymmetric, and the gradient at the intersection with the 45o ray will be less steep when
α < (1 - α), and more steep when α > (1 - α).
Whilst the asymmetric case of .�≠ (1 - .) is presented as the “generalised” form of the
Benthamite SWF, the literature typically assumes symmetry and thus .�= (1 - .). In
relation to income distribution, for example, the argument is that the social welfare
calculus should ignore information about individuals other than their income levels (see
Musgrave, 1959; Boadway, Bruce, 1984; Harsanyi, 1992). This anonymity requirement
implies that all parties are equally deserving of any given gain in well-being, but this
should only be restricted to attributes beyond an individual’s responsibility. If, for
example, the extent to which individuals have control over their well-being is relevant,
then the SWF needs to reflect this.
The above discussion has referred to well-being but has used the notation U to represent it.
This is no coincidence since most SWFs rely on an individual’s subjective assessment of
her own utility. Whilst there has been increasing interest in the source of an individual’s
utility – for example, correcting it for mistaken beliefs (Broome 1991) or excluding
certain ‘antisocial’ preferences, such as envy and malice (Harsanyi 1982) – all standard
7
economic models are concerned with the distribution of individual utility. As a result, the
reasons why one individual may obtain more utility than another from the consumption
of a good is not an issue: one may have different needs or one may simply be a more
effective ‘pleasure generating machine’ i.e. he may be easier to please.
However, ignoring the source of differences in individual utility may also have
damaging limitations in the context of interpersonal comparisons of well-being (Sen
1987). The utility that an individual gets from a given input is to some extent
determined by her past investment (a poorly educated person may be less productive in
generating utility from unit consumption) and by her expectations (a socially
disadvantaged person may adapt not to expect much). And because of this, a deprived
poor person might generate less utility from a given health improvement, say, than a
richer person. If health care were to be distributed so as to maximise utility, then in
such circumstances the rich person would be given priority. This is a solution that
would contradict many people’s conception of fairness.
This has led to alternative conceptions of welfare that, in various ways, use ‘objective’
criteria to define well-being. For example, Sen (1987) has argued that attention should be
focused on an individual’s basic capabilities, which looks at what certain goods (such as
health care) can do for her, rather than at the utility she derives from them. Sen’s work
has been influential in the debate about why health care is considered to be more
important than many other commodities. For example, Culyer (1989) has argued that
health care, through its impact on health, enables an individual to ‘flourish’. So people
need health care that improves their health. Thus, in the case of distributing health care,
what matters is not an individual’s subjective assessment of her own utility from health
care but rather an ‘objective’ assessment of the improved health that health care may
produce. When the objective is to distribute health (rather than utility), the SWF
approach is potentially useful in a policy context since health is more readily
interpersonally comparable than utility is (see Olsen 1997; Dolan 1998).
II. THE CAUSES OF HEALTH INEQUALITIES
Some inequalities in health might be considered less inequitable than others if they are
attributed to individual responsibility. For example, Le Grand (1991) has argued that
8
entitlements to public services depend in part on the goodness of social actions, and so a
citizen who has been destructive to her health might deserve less entitlement to such
services. And Roemer (1993) suggests that different choices in relation to lifestyle etc.
are legitimate grounds for different entitlements – provided that proper allowance has
been made for the fact that some ‘types’ of people are better able to make informed
choices than others. There is obviously much controversy around the issues e.g. insofar
as the degree of control that people have over their own actions is concerned, and the
extent to which there exists a relationship between a particular action and subsequent ill
health. We make no substantive claims about these issues here. For our purposes, we
need only to assume that all conditions can be located along an analytical spectrum from
being exogenously determined (e.g. due to ‘bad luck’) through to being endogenously
determined (e.g. as a result of well-informed ‘own choices’).
So far as the exogenous causes of ill health are concerned, some people might simply
have been unlucky in the biological lottery to be born with an inherited disease, whilst
others may have been the innocent victims of an identified cause of their ill health e.g.
being hit by a car on the pavement. In such circumstances, where an individual
experiences ill health through no fault of her own, it would seem that she has a
relatively large claim to improved health through publicly funded health care. With
endogenous causes, ill health would rarely be entirely attributable to a person’s own
actions – for example, with smoking-related conditions there is much unexplained
variation in who contracts those conditions. Nevertheless, most people would consider
ill health as a result of smoking to be located closer towards the endogenous end of the
spectrum than ill health through genetic inheritance, and that is all that is required here
for smokers to be afforded a relatively smaller claim to improved health from health
care than those with inherited diseases.
There is now empirical evidence that many people wish to give less priority to those
who are considered to be in some way responsible for their ill health. For example, a
large-scale general population survey found that about 50% of the UK general public
support discrimination against smokers (Jowell et al 1996). Further, in a study that
explicitly explored the location of Dworkin’s cut, Schokkaeart and Devooght (1999)
found that the modal preference was not to compensate smokers with lung cancer who
9
incurred extra treatment costs – in contrast with the case of genetic disorders, where the
overwhelming majority supported full or partial compensation of the extra cost.
If people with the same level of health are seen to have different claims depending on
where they fall on the endogenous/exogenous spectrum, then it should also be the case
that those granted smaller (larger) claims would continue to do so even when their
health is worse (better). Based purely on concerns for equality, those in worse health
(such as smokers) have the potential to be given a larger weight due to the parameter r
in equation [1]. But if .�< 0.5 (because smoking is to some extent a matter of individual
responsibility), then this will work to partially or even fully cancel out the effect of
inequality aversion. An interesting issue, then, is whether or not individual
responsibility associated with smoking is strong enough to overturn the concern for the
smokers’ poorer health. To answer this question, we need empirical data to determine
the parameter values of both r and .�in the SWF.
III. USING EMPIRICAL DATA TO DETERMINE THE SWF
In order to calculate the values of r and α, we need to identify two points on the same
contour that are judged to be equally good in terms of social welfare. Note that this
requires respondents to identify points that they consider to be equally good for society,
rather than points they consider to be equally good for them personally. As such, the
exercise taps into the respondents’ preferences as citizens, rather than as consumers (see
Dolan et al 2003).
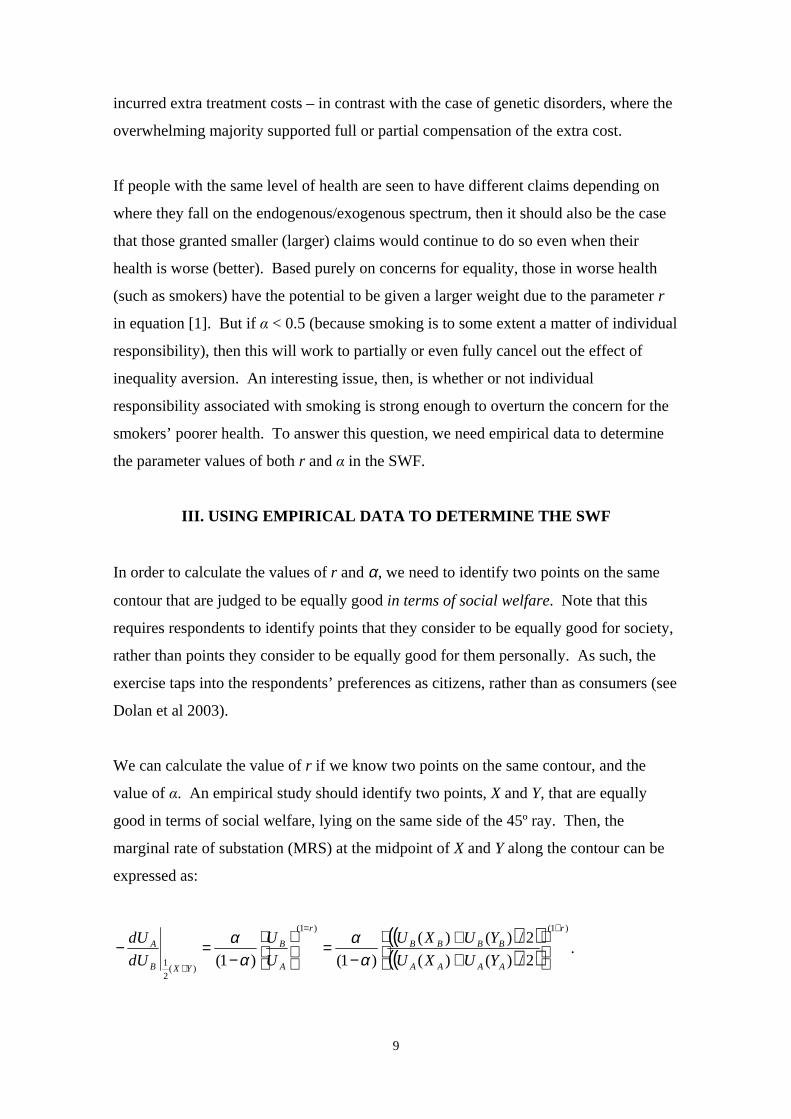
We can calculate the value of r if we know two points on the same contour, and the
value of .. An empirical study should identify two points, X and Y, that are equally
good in terms of social welfare, lying on the same side of the 45º ray. Then, the
marginal rate of substation (MRS) at the midpoint of X and Y along the contour can be
expressed as:
( )( )( )( )
)1()1(
)(2
1 2/)()(
2/)()(
)1()1(
r
AAAA
BBBB
r
A
B
YXB
A
YUXU
YUXU
U
U
dU
dU+=
+
++
−=
−
=−α
αα
α.

10
Further, by definition,
)()(
)()(
AAAA
BBBB
A
B
XUYU
XUYU
dU
dU
−−
≈
applies as an approximation at the same point. By taking the logarithms of these, and
solving for r,
[ ] [ ][ ] 1
))()(())()((log
)1/(log))()(())()((log−
++−−−−
≈AAAABBBB
AAAABBBB
YUXUYUXU
XUYUYUXUr
αα. [2]
Thus, the value of r is approximated as a function of ., and it is straightforward to show
that there is only one value of r for each value of ..
Along the 45° diagonal, where UA = UB, the MRS is independent of r and is entirely a
function of α, and this fact can be used to calculate the value of α. Starting from an
initial point, where UA = UB, an empirical study could seek to identify another set of
states, X and Y, with the same level of social welfare. Suppose for simplicity that there
are only two levels of individual well-being, survival and death. Under state X,
individuals in group A are split into two sub-groups: p will survive and N - p will die,
while all N individuals in group B will die (p < N). Under state Y, the opposite applies,
so that all N individuals in group A will die, while q individuals in group B will survive
and N - q will die (q < N). If p and q are sufficiently small, then the gradient of the
tangent at the initial point can be approximated by a ratio of these two, as
p
q
dU
dU
BA UUB
A −≈−
−=−= α
α1
so that
qp
q
+≈α . [3]
Therefore, values for r and . can be calculated by designing appropriate empirical
studies that identify the relevant points on the UA – UB plane. Moreover, since the
MRSAB along the contour represents the importance of the well-being of group A
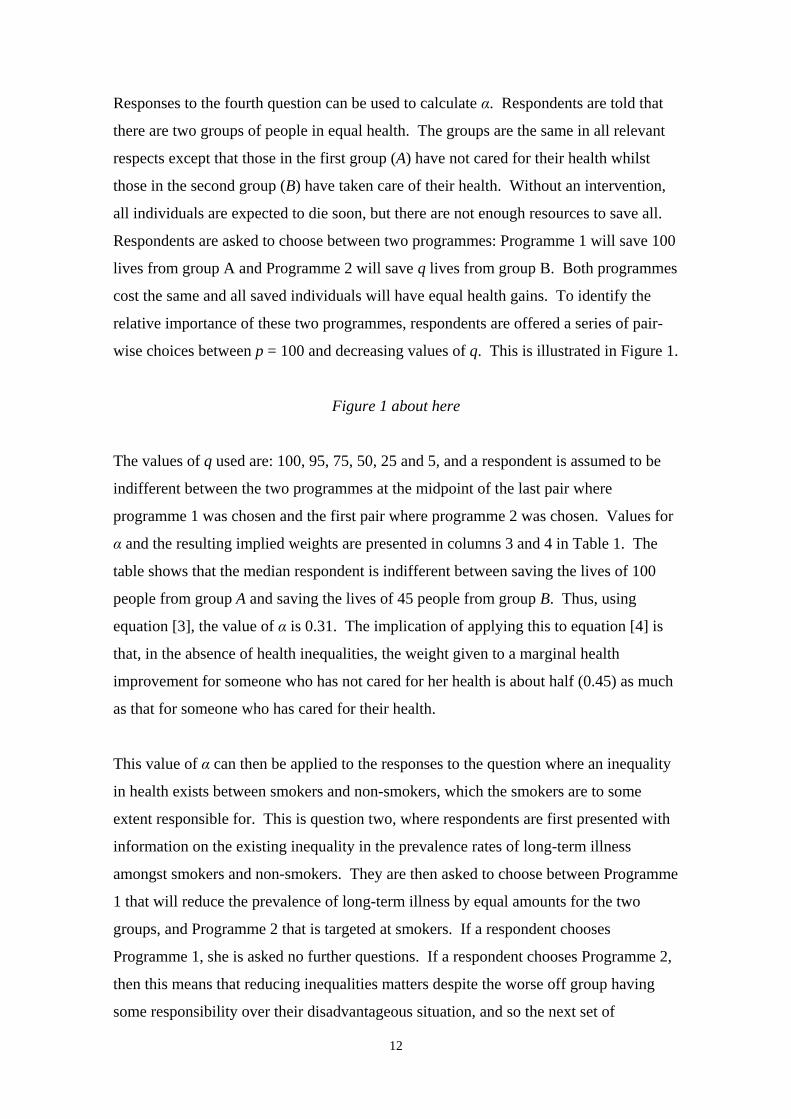
11
relative to the well-being of group B, it will also represent the relative weights at the
margin given to the well-being of the two groups. This ‘equity weight’ is thus
calculated as:
W
U
U
W
dU
dUMRS B
AA
BAB ∂
∂∂∂=−≡
)1(
)1(
r
A
B
U
U+
−
=α
α. [4]
IV. AN EMPIRICAL STUDY
Letters inviting potential respondents to attend a one-to-one interview were sent out to
1,500 individuals randomly drawn from the electoral register in three wards in York.
From the 467 who agreed to take part, 140 were selected for interview based on the
background characteristics they supplied in a reply slip. Of these, 130 turned up for
interview. The achieved sample was broadly representative of the population of
Yorkshire and Humberside in terms of sex, age, employment status, number of years of
schooling and the percentage of smokers. All interviews were carried out at the
University of York by three trained interviewers. Each interview consisted of a series
of questions, which in total took about an hour to complete.
There were a number of versions of the questionnaire that were administered over two
rounds of interviewing (full details of the study design can be found in Shaw et al
2001). However, the general structure of the interview was that each respondent was
asked questions relating to: 1) inequalities in life expectancy at birth by social class or
by sex; 2) inequalities in rates of long-term illness by social class or by smoking status;
3) inequalities in rates of childhood mortality by social class; and 4) the treatment of
two groups of people, one that has taken care of their health and one that has not. The
second question concerning smoking status, and the fourth question are relevant to this
study. Given different versions of the questionnaire, 31 respondents answered the
second question in relation to smoking status and 56 answered the fourth question.
12
Responses to the fourth question can be used to calculate .. Respondents are told that
there are two groups of people in equal health. The groups are the same in all relevant
respects except that those in the first group (A) have not cared for their health whilst
those in the second group (B) have taken care of their health. Without an intervention,
all individuals are expected to die soon, but there are not enough resources to save all.
Respondents are asked to choose between two programmes: Programme 1 will save 100
lives from group A and Programme 2 will save q lives from group B. Both programmes
cost the same and all saved individuals will have equal health gains. To identify the
relative importance of these two programmes, respondents are offered a series of pair-
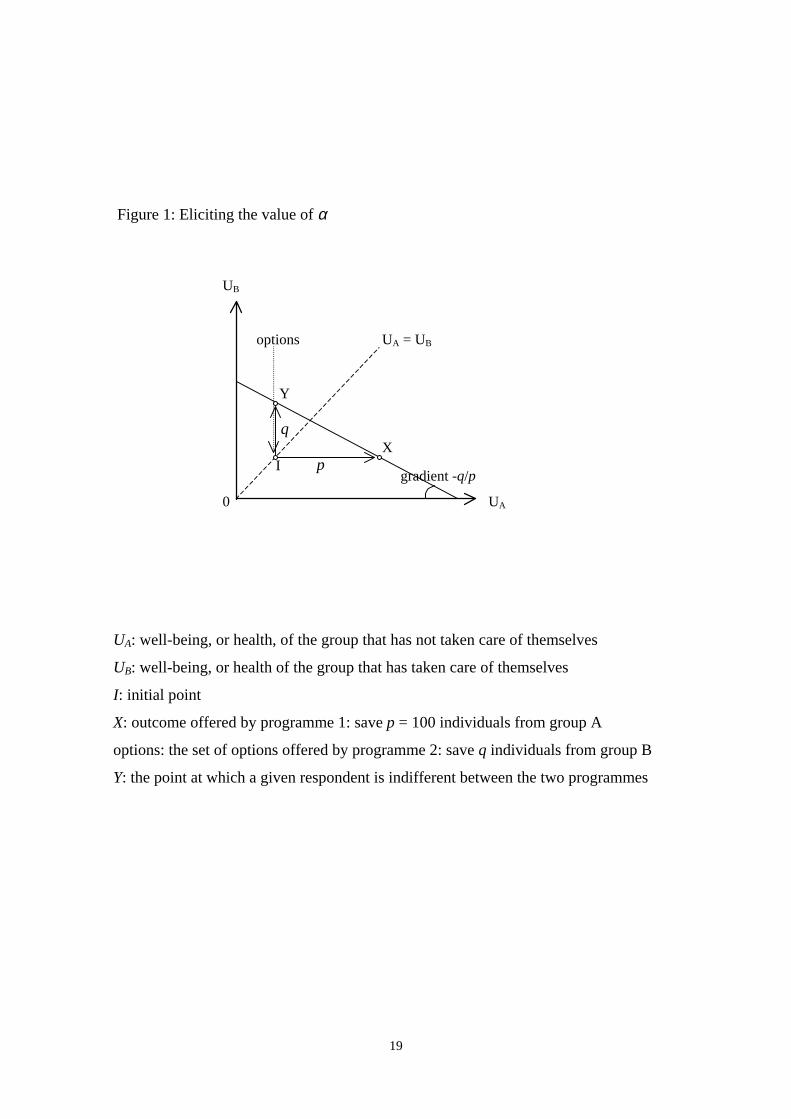
wise choices between p = 100 and decreasing values of q. This is illustrated in Figure 1.
Figure 1 about here
The values of q used are: 100, 95, 75, 50, 25 and 5, and a respondent is assumed to be
indifferent between the two programmes at the midpoint of the last pair where
programme 1 was chosen and the first pair where programme 2 was chosen. Values for
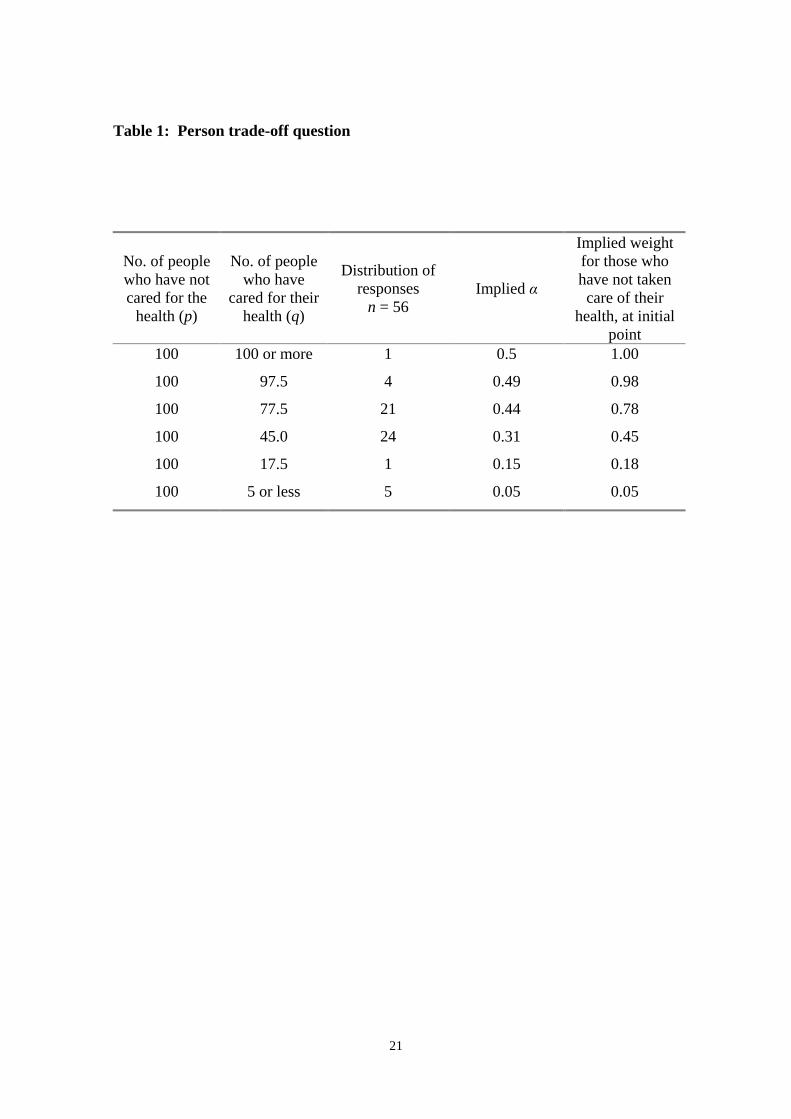
. and the resulting implied weights are presented in columns 3 and 4 in Table 1. The
table shows that the median respondent is indifferent between saving the lives of 100
people from group A and saving the lives of 45 people from group B. Thus, using
equation [3], the value of . is 0.31. The implication of applying this to equation [4] is
that, in the absence of health inequalities, the weight given to a marginal health
improvement for someone who has not cared for her health is about half (0.45) as much
as that for someone who has cared for their health.
This value of .�can then be applied to the responses to the question where an inequality
in health exists between smokers and non-smokers, which the smokers are to some
extent responsible for. This is question two, where respondents are first presented with
information on the existing inequality in the prevalence rates of long-term illness
amongst smokers and non-smokers. They are then asked to choose between Programme
1 that will reduce the prevalence of long-term illness by equal amounts for the two
groups, and Programme 2 that is targeted at smokers. If a respondent chooses
Programme 1, she is asked no further questions. If a respondent chooses Programme 2,
then this means that reducing inequalities matters despite the worse off group having
some responsibility over their disadvantageous situation, and so the next set of
13
questions explores the extent to which this is so by making Programme 2 less effective
until the respondent switches from programme 1 to programme 2. As before, it is
assumed that the respondent is indifferent between the two programmes at the midpoint
of the options immediately before and after switching. Thus, the exercise will lead to
identifying two points on the same iso-welfare curve. This is illustrated in Figure 2,
under the α = 0.5 assumption. When α < 0.5, the contour will pass through the same
two points, but the gradient at the 45° ray will be less steep.
Figure 2 about here
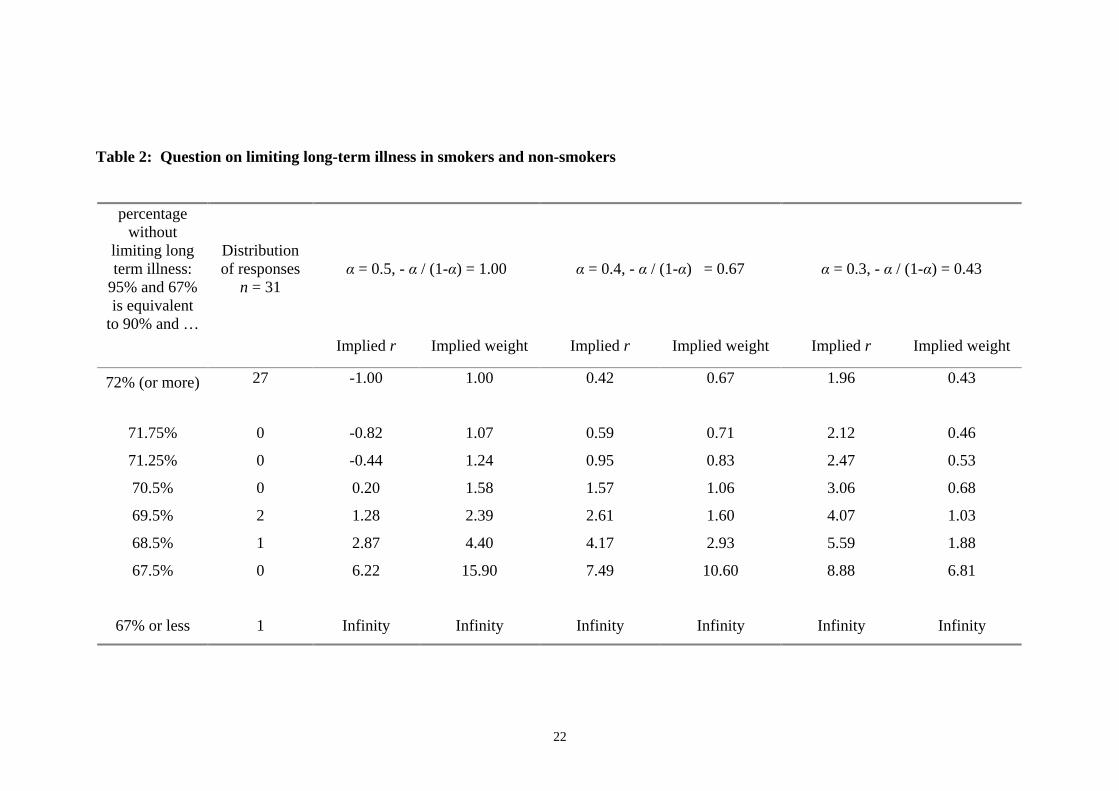
The value of r can be calculated from equation [2], for different values of α. Table 2
presents values of r for three values of ., from the case where . = 0.5 (i.e. both smokers
and non-smokers are given the same weight) to the case where .�= 0.3 (as identified
from the responses to the fourth question). The implied equity weights for a marginal
health improvement at the initial point (derived from equation [4]) are given for each
value of�.. When there is no concern for how health is distributed and no concern for
the extent to which individuals are responsible for their health (i.e. r = -1, . = 0.5), the
relative weight given to smokers (and non-smokers) is one. When there is some
concern for equality but more concern for responsibility, the weights are smaller than
one, but as the concern for inequality in health grows (i.e. in the lower rows), this will
begin to outweigh the responsibility factor so that the weight will eventually be larger
than one. From responses to this study, the relative weight given to a marginal health
improvement to a smoker in poorer health relative to a non-smoker in better health
could be as low as 0.43 (on the assumption that the poorer health of smokers is entirely
their responsibility).
V. DISCUSSION
The SWF represents two things – the trade-off between equality and efficiency and the
relative weight given to different individuals or groups. Some empirical studies have
attempted to measure people’s preferences regarding the former, assuming that .�= 0.5.
However, there are good reasons – and some related empirical evidence – for supposing
14
that some inequalities (in health or whatever) are less inequitable than others; in
particular, that those resulting from individual choices are less unfair. Moreover, two
people with very different preferences – one who cares a lot about inequalities but who
wishes to blame the worse off for those inequalities and one who cares less about
inequalities but who also blames the worse off less – might give precisely the same
answer to many of the questions that have been asked in empirical studies to date that
have not distinguished between equality and equity.
In the study reported in this paper, we have tried to estimate not only the value of r, but
also the value of . in the health-related SWF. The responses suggest that people who
have not cared for their own health are given about half as much weight as those who
have cared for their health. And, on average, respondents were unwilling to reduce
inequalities in health that were due to smoking behaviour. Of course, it is very difficult
to calculate precise values for . independently of r – they may be formally separable
from one another but are inextricably related in any empirical investigation. And it is
difficult to discern respondents’ beliefs about a) how much control individuals have
over their actions, such as their smoking behaviour, and b) the causal relationship
between those actions and resulting inequalities, such as in rates of long-term illness.
The results presented here should be seen to represent a lower limit on the weight given
to smokers vis-à-vis non-smokers, rather than as a precise weight.
There are at least two more general reasons for treating the results with caution. First, it
is well recognised that people’s preferences are to some extent constructed during the
process by which they are elicited (see Rabin 1998 for an excellent review). Whilst
many of the well-known framing effects were controlled for, it is impossible to remove
all possible sources of bias. For example, it is now well established that respondents
may give greater weight to the losses of one group as compared to an equivalent gain to
the other group (Schweitzer 1995). Therefore, the questions were designed so that
neither programme in the smoking question involved any losses, and so that neither
programme was presented as representing the status quo. However, loss aversion may
also be present when considering potential as well as actual losses from a particular
reference point (Dolan and Robinson 2001) and, if some respondents to the second
question adopted the potential gains available to both groups in programme 1 as their
reference point, then programme 2 would involve a ‘loss’ to the non-smokers.
15
Second, there are questions relating to the reliability of stated preference data,
particularly of the kind gathered in this study, which asked respondents to consider their
preferences over benefits to other people. As with other studies that have sought to
elicit citizen-type preferences over different public policies, it is not possible to test our
results against the preferences that respondents reveal in their private consumer-type
behaviour. In addition, we cannot rule out the possibility that some respondents may
have given what Miller (1992) refers to as ‘Sunday Best’ responses; that is, “the views
that people think they ought to hold according to some imbibed theory as opposed to the
operational beliefs that would guide them in a practical situation.” However, most
respondents were willing to discriminate against those who have not cared for their
health, so evidence of this would appear to be weak.
In general terms, this study has shown that, when considering inequalities in health,
people seem to give a great deal of weight to the extent to which individuals can be held
responsible for those inequalities. It is unclear whether the same results would be found
in other contexts. The study by Schokkaert and Devooght (1999) referred to above used
examples of public financing of health care and also of the redistribution of labour
income. They found that these two contexts invoke significantly different patterns of
responses regarding which inequalities should be compensated for, and how.
Unfortunately, the question on health care financing was related to additional
expenditure whilst the question on income concerned redistribution within the two
groups, and so the results are not strictly comparable across these two contexts.
However, their results, like ours reported here, suggest that the parameter . is as
important in the construction of a SWF as the parameter r, and future empirical studies
that seek to estimate the SWF across a range of different contexts should take due
account of this.
16
References
Amiel, Y., Cowell, F.A. (1999), Thinking about Inequality: Cambridge University Press
Arneson, R.J. (1990), Liberalism, distributive subjectivism, and equal opportunity for
welfare. Philosophy and Public Affairs, 19: 158-194
Atkinson, A.B. (1970), On the measurement of inequality. Journal of Economic Theory,
2: 244-263
Boadway, R., Bruce, N. (1984), Welfare Economics: Basil Blackwell
Broome, J. (1991), Weighing Goods: Basil Blackwell
Cohen, G.A. (1989), On the currency of egalitarian justice, Ethics, 99(4):906-944
Culyer, A.J. (1989), The normative economics of health care finance and provision.
Oxford Review of Economic Policy, 5(1): 34-58
Dolan, P. (1998), The measurement of individual utility and social welfare. Journal of
Health Economics, 17: 39-52
Dolan, P., Olsen, J.A., Menzel, P., Richardson, J. (2003), An inquiry into the different
perspectives that can be used to elicit preferences to inform priority-setting, Health
Economics, 12(7): 545-551
Dolan, P., Robinson, A. (2001), The measurement of preferences over the distribution
of benefits: the importance of reference points. European Economic Review.
Dworkin, R. (1981), What is equality? Philosophy and Public Affairs, 10:185-246 (part
1) and 10:283-345 (part 2)
Fleurbaey, M. (1995a), Equal opportunity or equal social outcome?, Economics and
Philosophy, 11, 25-55.
17
Fleurbaey, M. (1995b), Equality and responsibility, European Economic Review, 39,
683-689.
Harsanyi, J.C. (1982), Morality and the theory of rational behaviour, in Sen, A.,
Williams, B. (eds.), Utilitarianism and Beyond, Cambridge University Press
Jowell, R., Curtice, J., Park, A., Brook, L. and Thomson, K. (1996) British Social
Attitudes: the 13th report.
Layard, R., Walters, A.A. (1994), Allowing for income distribution. In Layard, R. and
Glasiter, S. (eds.), Cost-Benefit Analysis (2 ed.): Cambridge University Press (reprinted
from Layard, R., Walters, A. A. (1978), Microeconomic Theory, McGraw-Hill)
Le Grand, J. (1991), Equity and choice, Harper Collins, London.
Little, I.M.D., Mirrlees, J.A. (1974), Project Appraisal and Planning for Developing
Countries: Heinemann Educational Books
Miller, D. (1992), Distributive justice: what do people think? Ethics, 102, 555-593.
Musgrave, R.A. (1959), The Theory of Public Finance, McGraw Hill
Olsen, J.A. (1997), Theories of justice and their implications for priority setting in
health care. Journal of Health Economics: 625-639
Ray, A. (1984), Cost-Benefit Analysis: Issues and Methodologies: World Bank/Johns
Hopkins
Roemer, J.E. (1993), A pragmatic theory of responsibility for the egalitarian planner.
Philosophy and Public Affairs, 22(2): 146-166
Rabin, M. (1998). Psychology and economics. Journal of Economic Literature, 36, 11-
46.
18
Rawls, J. (1971), A Theory of Justice, Harvard University Press
Sen, A. (1987), On Ethics and Economics: Blackwell
Shaw, R., Dolan, P., Tsuchiya, A., Williams, A., Smith, P., Burrows, R. (2001),
Development of a questionnaire to elicit people’s preferences regarding health
inequalities, Occasional Paper, Centre for Health Economics, University of York
Schweitzer, M. (1995), Multiple reference points, framing and the status quo bias in
health care financing decisions. Organisational Behaviour and Human Decision
Processes 63, 69-72.
Schokkaert,E., Devooght, K. (1999), Responsibility-Sensitive Fair Compensation in
Different Cultures, Discussion Paper DARP 46, STICERD, London School of
Economics (forthcoming in Social Choice and Welfare)
Wagstaff, A. (1994), QALYs and the equity-efficiency tradeoff. In Layard, A. and
Glaister, S. (eds.), Cost-Benefit Analysis (2 ed.): Cambridge University Press (reprinted
from Journal of Health Economics, 10:21-41, 1991)
19
Figure 1: Eliciting the value of α
q
UB
options UA = UB
Y
X I
gradient -q/p
0 UA
p
UA: well-being, or health, of the group that has not taken care of themselves
UB: well-being, or health of the group that has taken care of themselves
I: initial point
X: outcome offered by programme 1: save p = 100 individuals from group A
options: the set of options offered by programme 2: save q individuals from group B
Y: the point at which a given respondent is indifferent between the two programmes

20
UA: health of the less advantaged group
UB: health of the more advantaged group
I: initial point
It is assumed that .�= 0.5
X: outcome offered by programme 1
the horizontal broken line: the set of options (1 to n) offered by programme 2
Y: the point at which the median respondent is indifferent between the two programmes,
and thus the point through which the iso-welfare curve crosses the broken line
Figure 2: Eliciting the value of r
UB
X UA = UB
n . … Y …1 I
iso -welfare
0 UA
21
Table 1: Person trade-off question
No. of people who have not cared for the
health (p)
No. of people who have
cared for their health (q)
Distribution of responses
n = 56 Implied .
Implied weight for those who have not taken care of their
health, at initial point
100 100 or more 1 0.5 1.00
100 97.5 4 0.49 0.98
100 77.5 21 0.44 0.78
100 45.0 24 0.31 0.45
100 17.5 1 0.15 0.18
100 5 or less 5 0.05 0.05
22
Table 2: Question on limiting long-term illness in smokers and non-smokers
percentage without
limiting long term illness:
95% and 67% is equivalent
to 90% and …
Distribution of responses
n = 31 . = 0.5, - .�/ (1-.) = 1.00 . = 0.4, - .�/ (1-.) = 0.67 . = 0.3, - .�/ (1-.) = 0.43
Implied r Implied weight Implied r Implied weight Implied r Implied weight
72% (or more) 27 -1.00 1.00 0.42 0.67 1.96 0.43
71.75% 0 -0.82 1.07 0.59 0.71 2.12 0.46
71.25% 0 -0.44 1.24 0.95 0.83 2.47 0.53
70.5% 0 0.20 1.58 1.57 1.06 3.06 0.68
69.5% 2 1.28 2.39 2.61 1.60 4.07 1.03
68.5% 1 2.87 4.40 4.17 2.93 5.59 1.88
67.5% 0 6.22 15.90 7.49 10.60 8.88 6.81
67% or less 1 Infinity Infinity Infinity Infinity Infinity Infinity