Embed Size (px)
Citation preview
-1
HEDS Discussion Paper 10/12
Disclaimer: This is a Discussion Paper produced and published by the Health Economics and Decision Science (HEDS) Section at the School of Health and Related Research (ScHARR), University of Sheffield. HEDS Discussion Papers are intended to provide information and encourage discussion on a topic in advance of formal publication. They represent only the views of the authors, and do not necessarily reflect the views or approval of the sponsors.
White Rose Repository URL for this paper:
http://eprints.whiterose.ac.uk/11227/
Once a version of Discussion Paper content is published in a peer-reviewed journal, this typically supersedes the Discussion Paper and readers are invited to cite the published version in preference to the original version.
Published paper
Peasgood, T., Ward SE, Brazier J., Health-state Utility values in breast cancer. Expert
Review, Pharmacoeconomics Outcomes Research. 10(5): 553-566. October 2010.
White Rose Research Online [email protected]

-2
ScHARR SCHOOL OF HEALTH AND
RELATED RESEARCH

1
Health-state Utility values in breast cancer
Peasgood, T, Ward SE, Brazier J.
Health Economics and Decision Science
School of Health and Related Research
University of Sheffield
30 Regent Street
Sheffield
Email: [email protected]
Keywords: utility, combining, comorbid, quality of life
Word count: 7,176
2
ABSTRACT
Background: Analysts frequently estimate the health state utility values (HSUVs) for
combined health conditions (CHCs) using data from cohorts with single health conditions.
The methods used to estimated the HSUVs can produce very different results and there is
currently no consensus on the most appropriate technique that should be used.
Objective: To conduct a detailed critical review of existing empirical literature to gain an
understanding of the reasons for differences in results and identify where uncertainty remains
that may be addressed by further research.
Results: Of the eleven studies identified, ten assessed the additive method, ten the
multiplicative method, seven the minimum method, and three the combination model. Two
studies evaluated just one of the techniques while the others compared results generated using
two or more. The range of the HSUVs can influence general findings and methods are
sometimes compared using descriptive statistics that may not be appropriate for assessing
predictive ability. None of the proposed methods gave consistently accurate results across the
full range of possible HSUVs and the values assigned to normal health influence the accuracy
of the methods.
Conclusions: While there is no unequivocal evidence for supporting one particular method,
the combination linear model appeared to give more accurate results in the studies reviewed.
However, before a method can be recommended, research is required in datasets covering the
full range of the preference-based indices and health conditions typically defined in decision
analytic models. The methods used to assess performance and the statistics used when
reporting results require improvement in general.
3
BACKGROUND
To fulfil demands from policy decision makers in health care, there has been a growth in the
number of economic evaluations of interventions in health care reporting results in terms of
cost per quality adjusted life years (QALY). The QALY combines both survival and health
related quality of life (HRQoL) into a single metric that facilitates comparison of results
across disparate interventions and disease areas thus allowing optimal allocation of resources.
Many decision making bodies require that HRQoL data used in economic evaluations are
derived from preference-based utility measures with weights obtained from members of the
general public.[1] These preference-based measures generate an index of health state utility
values (HSUVs) whereby perfect health and death are anchored at one and zero respectively
and negative values represent health states considered to be worse than death. The most
frequently used generic instruments are the EQ-5D, the HUI and the SF-6D.[2-4]
Economic models in health care describe the clinical pathway of health conditions. They can
become quite complex involving health states representing the primary health condition and
additional health states representing comorbidities where an additional condition exists
concurrently with the primary health condition. For example, a comorbid health condition
(CHC) would be a woman with osteoporosis who then develops breast cancer, while an
adverse event might be someone with influenza developing nausea as a side effect of
treatment given for influenza. HSUVs used to inform health states are often collected in the
clinical studies assessing the effectiveness of treatments under evaluation. When these data
are not available, HSUVs may be elicited directly from patients or sourced from the literature.
While the former has the advantage that the health states valued can be precisely defined to
match those in an economic model, they are resource intensive and the end product is not the
preferred data for policy decision making.[1] The latter is problematic as while there is a
substantial evidence base providing HSUVs for individuals with single health conditions, the
volume of data describing HSUVs for CHCs is limited. Consequently analysts frequently
4
estimate the HSUVs for CHCs using data from cohorts with single health conditions and
assumptions about how they should be combined.
A number of different approaches have been adopted in practice and recent literature has
sought to provide empirical evidence for these alternatives. However, this is limited and there
is currently no consensus on which is the most suitable approach. As the technique used to
estimate HSUVs for CHCs could potentially influence a policy decision based on a cost per
QALY threshold,[5] inconsistencies in the approaches used could undermine optimal
allocation of scarce health care resources.
The objective of the current study is to conduct a detailed critical review of existing empirical
literature. This will permit an understanding of the reasons for differences in the results,
identify hypotheses that are consistent with the empirical evidence and identify where
uncertainty remains that may be addressed by further research. As HSUVs for CHCs in
economic models are generally estimated using summary statistics from generic instruments
reported in the literature, the greatest interest is on studies that use mean HSUVs from cohorts
with single health conditions to estimate mean HSUVs for CHCs
The following section introduces the methods frequently used to estimate HSUVs for CHCs
with a summary of obvious limitations. This is followed by a brief description of the
literature search, a synopsis of the studies identified and their corresponding datasets . The
next section provides details of the methods used to estimate HSUVs for CHCs in each of the
studies. This is followed by a section describing the results and the statistics used when
comparing results and drawing conclusions. We culminate with a summary of the evidence
base and suggestions for future research. Throughout the article, emphasis is placed on
determining differences in the studies and methodologies which may explain the contradictory
findings reported.
5
Baseline HRQoL
Before describing the methods used to estimate HSUVs for CHCs it is useful to consider the
“baseline” utility. The “baseline” utility is defined as the HSUV a person would have if they
did not have a particular health condition and the impact on HRQoL attributable to a health
condition is defined as the difference between the HSUV associated with the particular health
condition and the baseline. The baseline utility used can make a large difference to the
estimated decrement on HRQoL associated with particular conditions as shown in the
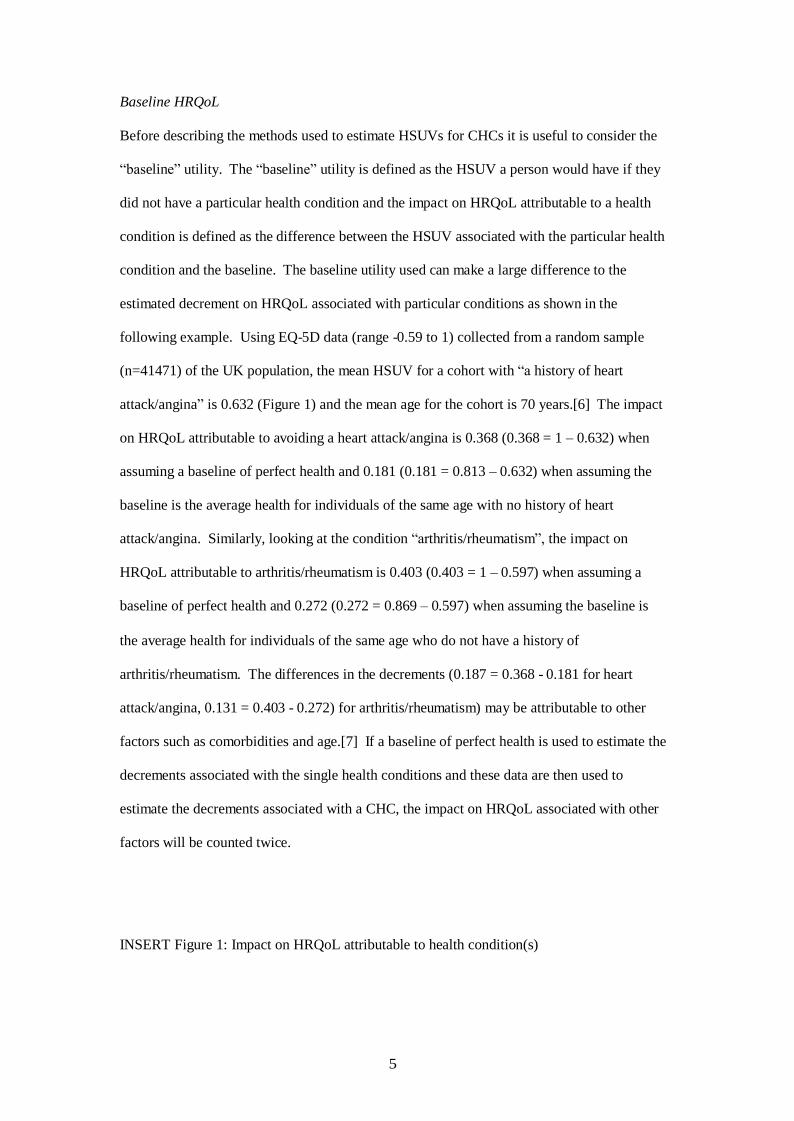
following example. Using EQ-5D data (range -0.59 to 1) collected from a random sample
(n=41471) of the UK population, the mean HSUV for a cohort with “a history of heart
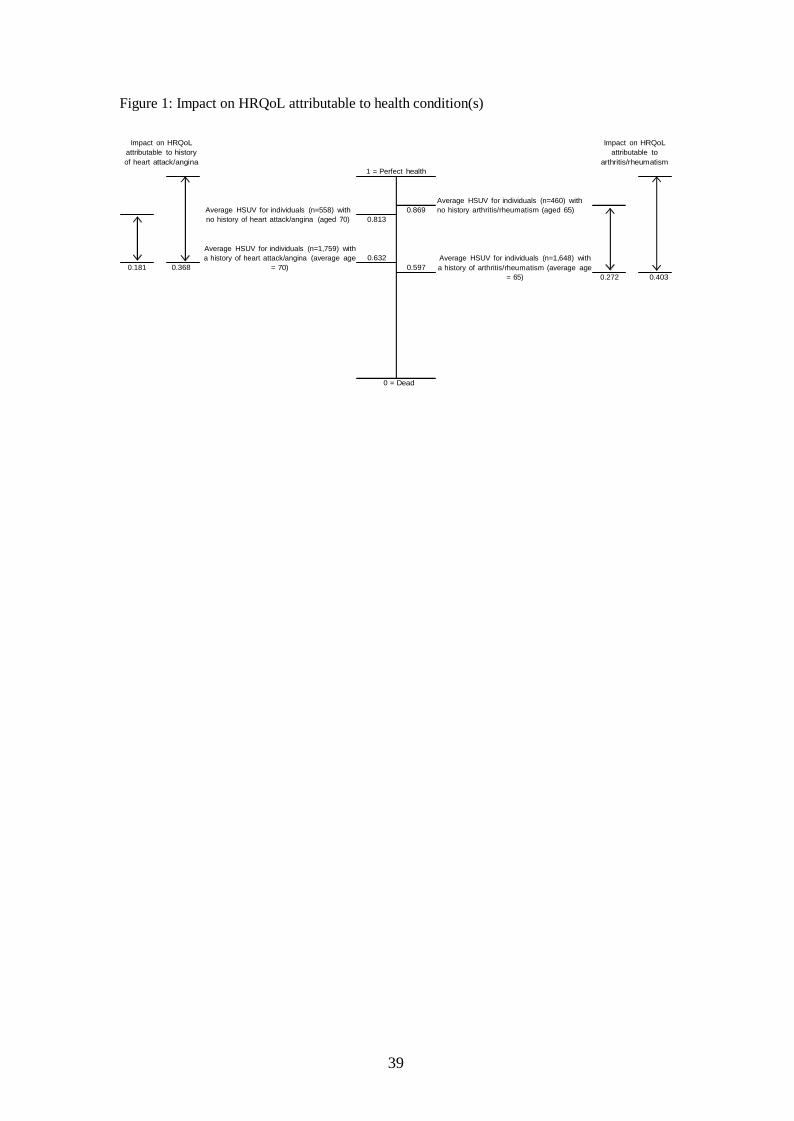
attack/angina” is 0.632 (Figure 1) and the mean age for the cohort is 70 years.[6] The impact
on HRQoL attributable to avoiding a heart attack/angina is 0.368 (0.368 = 1 – 0.632) when
assuming a baseline of perfect health and 0.181 (0.181 = 0.813 – 0.632) when assuming the
baseline is the average health for individuals of the same age with no history of heart
attack/angina. Similarly, looking at the condition “arthritis/rheumatism”, the impact on
HRQoL attributable to arthritis/rheumatism is 0.403 (0.403 = 1 – 0.597) when assuming a
baseline of perfect health and 0.272 (0.272 = 0.869 – 0.597) when assuming the baseline is
the average health for individuals of the same age who do not have a history of
arthritis/rheumatism. The differences in the decrements (0.187 = 0.368 - 0.181 for heart
attack/angina, 0.131 = 0.403 - 0.272) for arthritis/rheumatism) may be attributable to other
factors such as comorbidities and age.[7] If a baseline of perfect health is used to estimate the
decrements associated with the single health conditions and these data are then used to
estimate the decrements associated with a CHC, the impact on HRQoL associated with other
factors will be counted twice.
INSERT Figure 1: Impact on HRQoL attributable to health condition(s)

6
The alleviation of a particular health condition will not restore the HRQoL of the average
person to full health as they will still have other health problems and it has been suggested
that, on average, a treatment will increase HRQoL to the same level of persons without the
condition.[8] Several approaches have been taken to adjust the baseline when estimating
HSUVs for CHCs. These include: “purifying” data by dividing all HSUVs by the average
HSUV obtained from individuals who report none of the health conditions identified in a
survey;[9,10] using condition specific data obtained from individuals who do not report the
particular health condition(s) of interest,[11] using age adjusted data obtained from
individuals who report none of the health conditions identified in a survey.[12,13]
Methods Used To Estimate HSUVs For Comorbid Health Conditions
The techniques described below use mean HSUVs from cohorts with single health conditions
to estimate mean HSUVs for cohorts with CHCs. There are three main methods used to
estimate the utility value for a combined health state when data only exist for relevant single
health states. These can be termed the “additive”, “multiplicative” and “minimum”
approaches. Alternatives recently proposed include: the adjusted decrement estimator (ADE)
which is a variation of the minimum method, and a simple linear model, based on multi-
attribute utility theory and prospect theory, which incorporates terms representing the
additive, multiplicative and minimum methods.[10,14]
Given two health conditions, condition A and condition B, there are four possible
combinations of these conditions: individuals have condition A but not condition B,
individuals have condition B but not condition A, individuals have both condition A and
condition B; individuals do not have either condition A or condition B. The HSUVs
associated with these four alternatives are defined as: UA, UB, UA,B, and UnA,nB.
Additive method. The additive method assumes a constant absolute decrement relative to the
baseline and the estimated HSUV for the additive CHC is calculated using:

7
U add
A ⋅
U mult
min
min
))
add
nA nB (( nA A ) (
nb B
U A, B = U , − U − U + U − U (Eqn 1)
where the superscript “add” denotes the additive method.
If a baseline of perfect health is used, the additive method can be calculated using:
A, B = U A + U B − 1 (Eqn 2)
Multiplicative method. The multiplicative method assumes a constant proportional decrement
relative to the baseline and the estimated HSUV is calculated using:
U Mult
= U ⋅ U U
B
(Eqn 3)
A, B nA,nB
U nA
U nB
where the superscript “Mult” denotes the multiplicative method.
If a baseline of perfect health is used, the multiplicative method can be calculated using:
A, B = U A ⋅ U
B
(Eqn 4)
Minimum method. The minimum method assumes the decrement on HRQoL associated with
a comorbidity is equal to the maximum decrement attributable to the individual single health
conditions, and the estimated HSUV is calculated using:
U A, B = min(U nA,nB ,U A ,U B ) (Eqn 5)
where the superscript “min” denotes the minimum method.
If a baseline of perfect health is used, the minimum method can be calculated using:
U A, B = min(U A ,U B ) (Eqn 6)
Adjusted decrement estimator. The adjusted decrement estimator (ADE) has recently been
proposed as an alternative method to estimate HSUVs for CHCs. This estimator is a variation
of the minimum method and assumes the estimated HSUV for the CHC has an upper bound
equal to the minimum of the HSUVs from the two single health conditions. The proposed

8
method is described by:
9
ADE
comb
3 ⋅ ⋅
U A, B = min(U A ,U B ) − min(U A ,U B )⋅ (1 − U A )⋅ (1 − U B
(Eqn 7)
)
where the superscript “ADE” denotes the adjusted decrement estimator.
Combination model. Basu et al. recently proposed a simple linear model which incorporates
terms representing the additive, multiplicative and minimum methods.[14] The model is
formulated from a) an adaptation of work originally presented by Keeny and Raiffa (1976,
1993) which was based on decision theory and multi-attribute utility functions,[15-16] and b)
a prospect theory that proposes the value function is convex for losses with a marginal rate of
decrement in value with increasing losses, as presented by Tversky and Kahneman
(1992).[17] The model is defined by:
comb β0 + β1 ⋅ min((1 − U A ), (1 − U B )) + β 2 ⋅ max((1 − U A ), (1 − U B )) U A, B = 1 −
+ β 3
⋅ (1 − U
A ) ⋅ (1 − U B
)
+ ε
(Eqn 8)
where the superscript “comb” denotes the combination model, ε the residual and the beta
coefficients are obtained using ordinary least square regressions. Equation 8 uses a baseline
of perfect health. Using an adjusted baseline, the combination model can be defined by:
U A,B = β 0 + β1 ⋅ min((U nA − U A ), (U nb − U B )) + β ⋅ max((U nA − U A ), (U nb − U B ))
2
U + β ⋅
U nA,nB
A U B + ε
U nA U nb
(Eqn 9)
The combination model reduces to the three traditional methods under the following
conditions:[14]
When β0 = 0, β1 = 1, β2 = 1 and β3 = 0, then Eqn 8 collapses to Eqn 2 (additive method)
When β0 = 0, β1 = 1, β2 = 1 and β3 = -1, then Eqn 8 collapses to Eqn 4 (multiplicative method)
When β0 = 0, β1 = 1, β2 = 0 and β3 = 0, then Eqn 8 collapses to Eqn 6 (minimum method)
10
There are a number of limitations with the methods described above including access to the
required baseline data, combining negative HSUVs and estimating HSUVs for CHCs that
consist of more than two health conditions. Sourcing appropriate baseline data will be
difficult as ideally each health condition requires a unique baseline obtained from individuals
who do not have the specific condition(s). While these data may be derived from large
datasets, due to the enormous number of possible combinations of health conditions, in
practice the required data may not be readily available. For some preference based measures
such as the EQ-5D or the HUI3, it is possible to have negative HSUVs for one or more of the
single health conditions. This has implications for both the additive and multiplicative
methods. For the additive method, the decrements associated with the single health
conditions can be relatively large if negative HSUVs are involved thus the resulting estimated
HSUV for the CHC could be outside the lower limit of the preference based index. The
multiplicative method is not valid if used to combine an even number of negative HSUVs as
the estimated HSUV for the CHC will be positive (i.e. higher than either of the HSUVs for
the single health conditions). While it is simple to incorporate additional conditions into the
multiplicative and minimum methods, multiple health conditions will be problematic when
using the additive method as again the sum of the corresponding decrements could produce
HSUVs below the lower limit of the preference based index.
LITERATURE SEARCH and SYNOPSIS OF STUDIES INCLUDED
A systematic literature search of the following databases: Cinahl, the Cochrane library,
Embase, Medline, PsycInfo and Web of Science, was carried out using keywords combining
variations of terms for HRQoL (e.g. health state utility, quality of life, Euroqol, EQ5D, health
utilities mark, HUI, short form six D, SF-6D etc), methodological terms (e.g. standard
gamble, SG, time trade off, TTO, additive, multiplicative, minimum, regression, model) and
terms for joint health states (e.g. joint health state, comorbid, combined health states,
concurrent, multiple). Based on a few core papers identified, a citation search was carried out

11
using the Web of Knowledge and Google Scholar databases. The citation search was
undertaken both forwards and backwards. The forward search ensures that all papers that cite
the core papers are reviewed. The backwards search ensures that all papers cited by the core
papers are reviewed. Reference lists of all papers included in the review were checked for
additional relevant articles. The searches were not restricted by publication type, language, or
date of publication.
Synopsis of studies included
The number of relevant papers was reduced to 11 based on a review of the titles and abstracts.
Papers were not assessed on the basis of study design, setting or quality, only on whether they
involved estimating or predicting HSUVs for CHCs using data from single health conditions.
The aim of the review was to examine the literature to gain an understanding of possible
reasons for differences in results and conclusions drawn with a view to informing future
research in this area. This was addressed by extracting data reported to describe model fit,
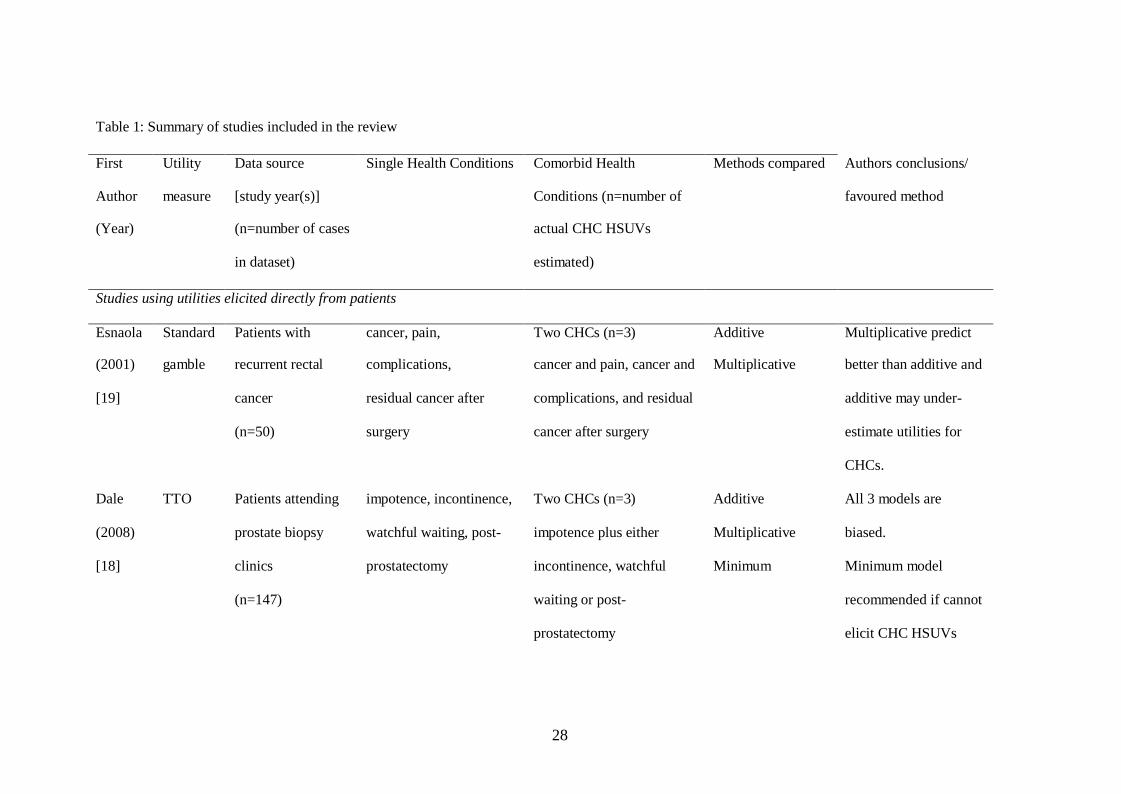
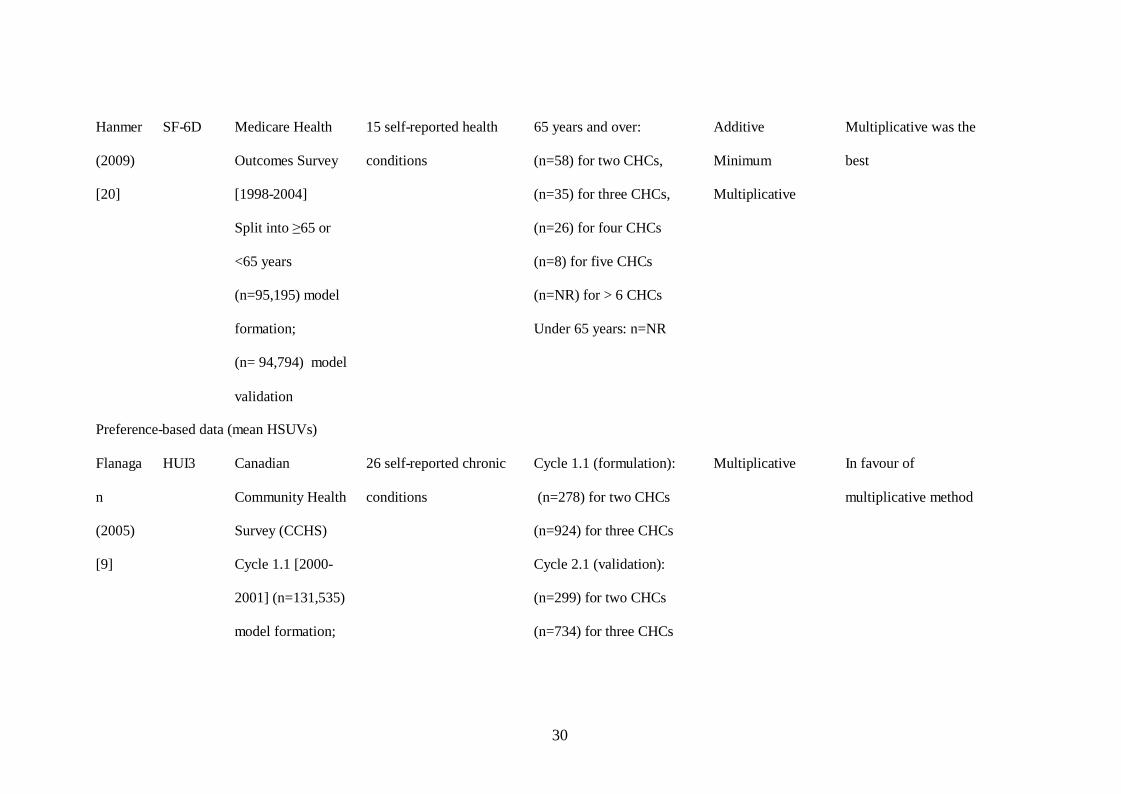
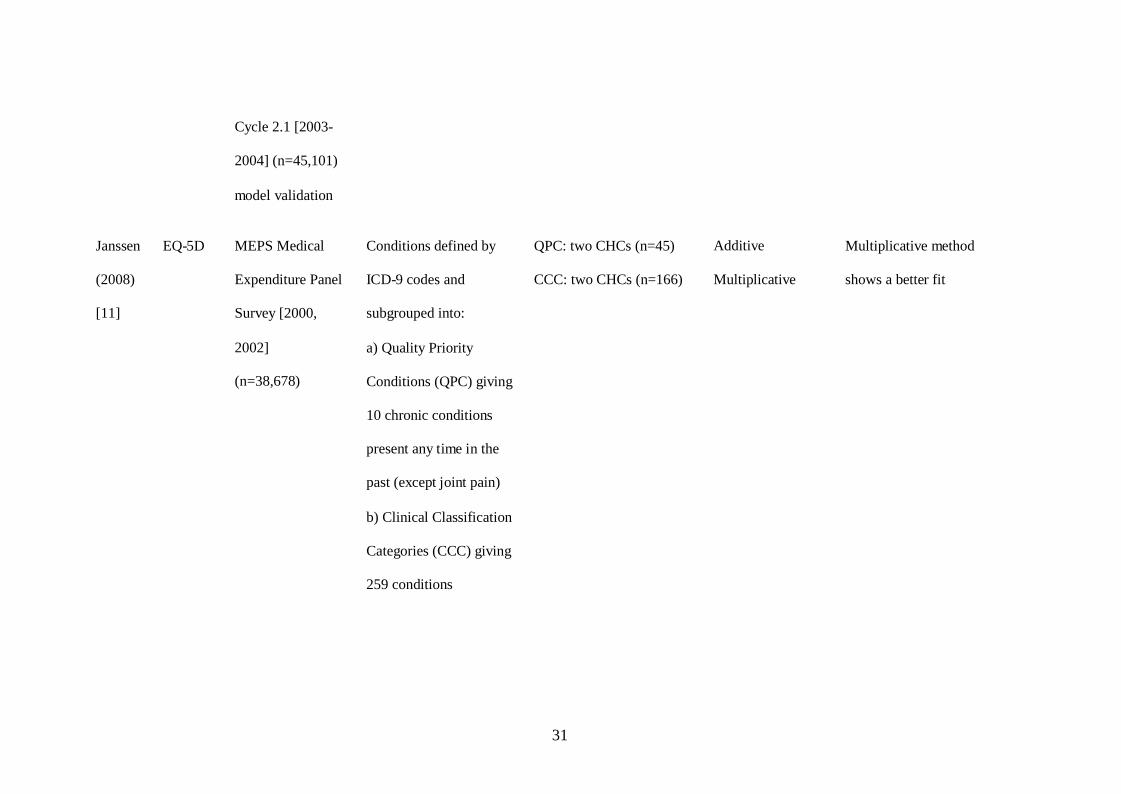
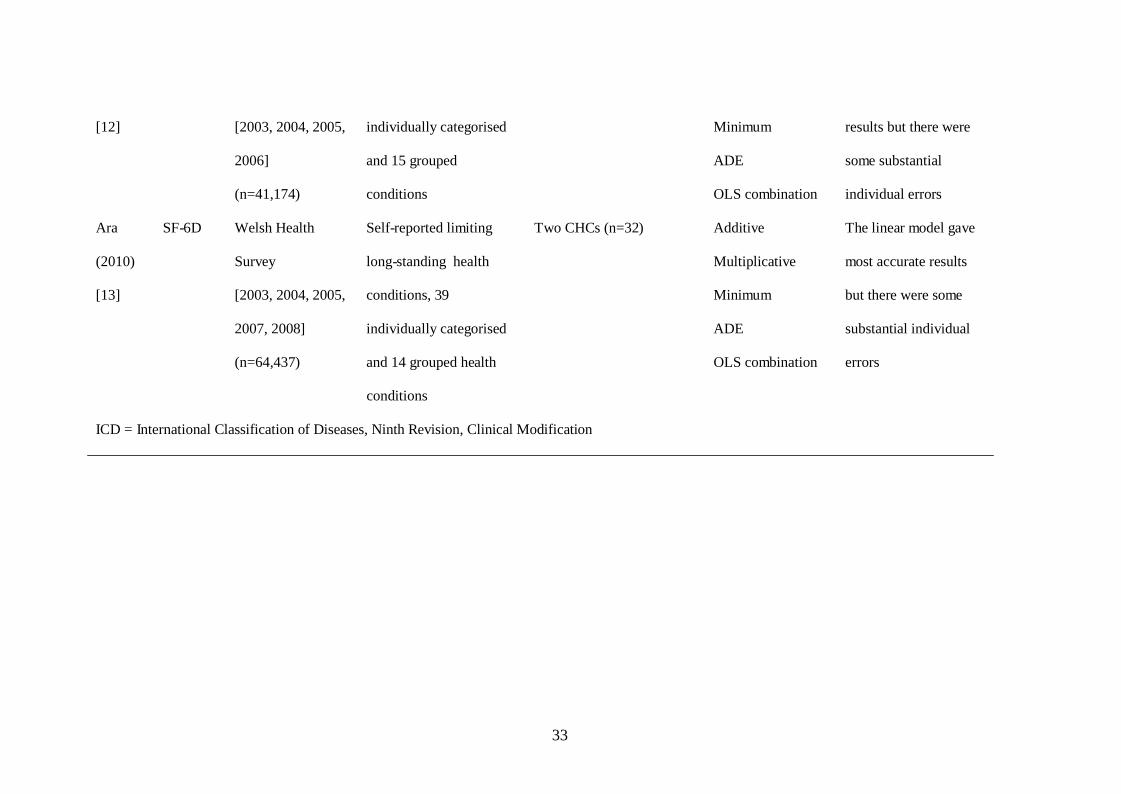
performance, diagnostics and the main conclusions reported by the authors (Table 1).
INSERT Table 1: Synopsis of studies included in the review
Three of the studies used data directly elicited from patients, using the same people to value
HSUVs for both single and combined health conditions.[14,18-19] HSUVs for the single
health conditions were then used to estimate HSUVs for the CHCs and accuracy in the
estimates were compared with the actual HSUVs on an individual level. The eight remaining
studies used large databases where preference-based data were obtained using responses to
generic quality of life questionnaires.[9-13,20-22] Six of these studies used mean HSUVs
obtained from subgroups with single health conditions to estimate mean HSUVs for
subgroups with CHCs.[9-13,21] The remaining two studies used regressions to explore the
relationship between HSUVs and presence of health conditions using individual level
data.[20,22]
12
Of the three studies that elicited HSUVs directly from patients; two used data obtained from
patients (n= 147,[18] n=207[14]) with recurrent rectal cancer whereby a trade-off was made
between remaining in a described health state for the duration of life expectancy versus living
in perfect health for a shorter period of time. Single health conditions were defined as
“impotence”, “incontinence”, “watchful waiting” and “post-prostatectomy without
complications”, and CHCs were defined as “impotence” plus one of the other three SHCs.
The third, which is published in abstract form only, used HSUVs elicited using standard
gamble from patients with recurrent rectal cancer.[19] Single health conditions were defined
as: “cancer”, “pain”, “complications”, and “surgery”; and CHCs were defined as: “cancer and
pain”, “cancer and complications”, and “residual cancer after surgery”.
The eight studies that used preference-based HSUVs obtained from generic HRQoL
questionnaires evaluated data (range 5,224 [22] to 131,535 respondents [9]) from large
surveys. Four used EQ-5D,[10-12,21] three used SF-6D,[13,20,22] and one used HUI3
data.[9] The definitions for the health conditions in the primary surveys ranged from specific
conditions such as “diabetes mellitus without complications”[21] and “asthma”[11] to more
general definitions such as “back problems”,[9] “cancer (neoplasm) including lumps,
mass”,[12] “musculoskeletal or arthritis/rheumatism/fibrositis”.[13] One of the studies was
slightly different in that it concentrated on data from individuals with: just diabetes, diabetes
plus hypertension, diabetes plus heart disease, or diabetes plus musculoskeletal illnesses.[22]
Number of CHCs and range of estimated HSUVs
In each case the three studies using the directly elicited data estimated HSUVs for just three
CHCs (Table 1 and Table 2).[14,18-19]. In contrast, the majority of the studies using
responses from generic HRQoL questionnaires estimated HSUVs for much larger numbers of
pairs of CHCs (range: 32[13] to 760[21]). In addition to predicting HSUVs for CHCs, one
study also examined the relationship between SF-36 health dimensional scores for single
13
health conditions and CHCs,[22] while another study estimated results for CHCs involving
more than two conditions.[9]
For the studies using the elicited data, the actual HSUVs for the CHCs were all 0.5 (medians)
in one study[19] and covered the ranges 0.66 to 0.72 (means),[18] and 0.63 to 0.70
(means)[14] in the other two. Possible ranges for the preference-based indices for the generic
HRQoL questionnaires used are: SF-6D range: 0.3 to 1; EQ-5D range: -0.59 to 1; HUI3 range
-0.36 to 1. None of the studies analysing these data estimated mean HSUVs that covered the
full ranges of the indices. The smallest range in actual mean HSUVs was for EQ-5D data
(0.734 to 0.819) from the US Medical Expenditures Panel Survey (MEPS 2000, 2002)[11]
and the largest range was for HUI3 data (-0.01 to 1.00) from the Canadian Community Health
Survey (2001, 2003).[9] The authors of the latter study reported that while there was a wide
variation in the mean HUI3 scores for subgroups with CHCs, the majority (184/278) were
greater than 0.80. Conversely, two thirds of the actual mean EQ-5D HSUVs for the CHCs
identified in a study using data from the Health Survey for England were below 0.60 (range
0.360 to 0.917). Obviously the range in actual HSUVs is highly relevant when comparing
accuracy of the different techniques as the method should be generalisable for use across the
full utility index including negative values where applicable.
METHODS USED TO ESTIMATE HSUVs for CHCs
Baseline HRQoL
When estimating HSUVs for the CHCs, the three studies analysing directly elicited data used
a baseline of perfect health.[14,18-19] I.e. when the elicited data for the single health
conditions were used to estimate HSUVs for CHCs, the decrements on HRQoL were
calculated using a baseline of perfect health. Flanagan et al. “purified” their data by dividing
all age and sex standardised HSUVs by the mean HSUV (HUI3 = 0.94) from respondents
reporting none of the health conditions identified in the primary survey.[9] The objective of
14
the purification was to remove the loss of functional health due to health problems other than
the chronic conditions reported in the primary survey.[9] Fu and Kattan used a similar
approach in secondary analyses; dividing the HSUVs by the mean HSUV (EQ-5D = 0.952)
from respondents reporting none of the health conditions in their dataset, and presented
results using a baseline of perfect health as the primary analyses.[21] Ara and Brazier
estimated age-adjusted baselines using HSUVs from respondents reporting none of the health
conditions identified in the primary surveys[12-13] and Janssen used mean values from the
respondents who did not report either condition in each individual CHC for the baseline.[11]
Methods used to estimate or predict HSUVs for CHCs
Table 2 provides an indication of the methods compared in each of the studies. The studies
are subgrouped into those (n=3) using directly elicited HSUVs and those (n=8) using HSUVs
obtained from generic HRQoL instruments. The latter are further subgrouped into the two
studies predicting HSUVs from regression models and the six studies estimating mean
HSUVs for CHCs using mean HSUVs from subgroups with single health conditions.
Ten studies assessed the additive method, ten the multiplicative method, seven the minimum
method, and three the combination model. Two studies[9,22] evaluated just one of the
techniques while the others compared results generated using two,[11,19] three,[18,20-21] or
more techniques.[10,12-13,14]
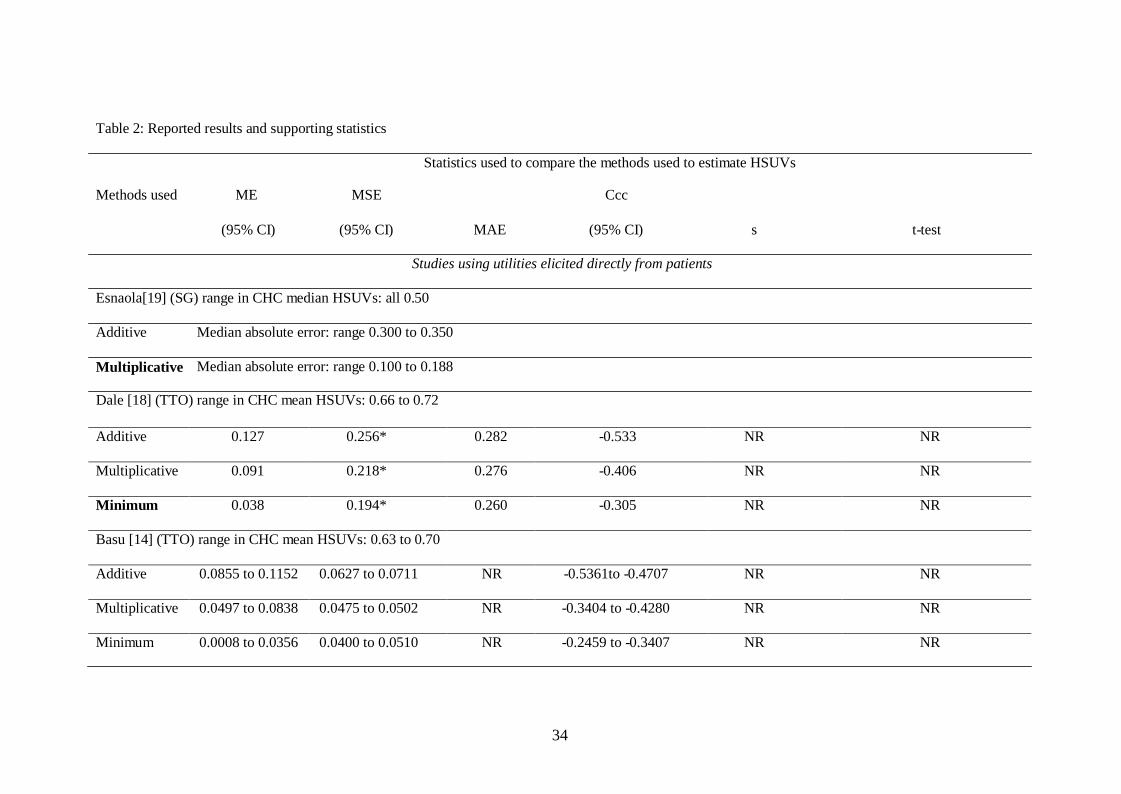
INSERT TABLE 2: Reported results and supporting statistics
REPORTED RESULTS
Studies using utilities elicited directly from patients
Of the three studies using the elicited HSUVs,[14,18-19] Esnaola reported the median
absolute difference between the actual and estimated HSUVs for the multiplicative method
was significantly lower than that for the additive method (Wilcoxon signed ranks test,

15
p<0.001).[19] Dale assessed bias in the estimated HSUVs, assuming an unbiased method
would give a mean error (ME) insignificantly different from zero and errors uncorrelated with
estimated HSUVs.[18] They reported the additive, minimum and multiplicative methods all
produced biased estimates (ME: range 0.038 to 0.127, p<0.05, correlations: range -0.305 to -
0.533, p<0.05.[18] While the minimum method had the smallest RMSE (0.194) and the
smallest MAE (0.260), plots showed higher HSUVs were substantially under-predicted and
lower HSUVs substantially over-predicted demonstrating that mean statistics are not
particularly informative or useful for comparison purposes. The authors recommended
HSUVs for CHCs should be elicited directly as the additive, multiplicative and minimum
methods are biased and inefficient. If an elicitation exercise is not possible they recommend
the minimum method.[18] Basu reported the combination model (UA,B = 1 – (0.05 +
0.72*max (1-UA, 1–UB)+0.33*min(1-UA, 1–UB) -0.18*(1-UA)(1–UB)) produced up to 50%
reduction in the MSE compared to the three traditional methods (additive, multiplicative,
minimum).[14] The correlations between the residuals and predicted HSUVs were much
smaller (range 0.0006 to 0.0682 when subgrouped by CHC) for the combination model
compared to the correlations between the errors and estimated HSUVs for the other methods
(< - 0.246 for all CHCs and methods). Plots of the mean residuals across quartiles of
estimated HSUVs, showed the four mean residuals from the combination model were close to
zero while the other three methods over-estimated low HSUVs and under-estimated high
HSUVs.
There are difficulties when generalising from these findings and concerns regarding the validity
and generalisability of the results. First, there are problems with the definitions of the health
conditions valued. For example, the health states “cancer” and “pain” used in two of the studies
are not mutually exclusive as the condition cancer intuitively involves pain, similarly,
comparing a diagnosis of recurrent cancer, “incontinence” appears trivial.[14,18]
In the third study, “watchful waiting” relates to a management strategy as opposed to a health
condition.[19] Second, the studies used the same participants to value both the single health
16
conditions and the CHCs consequently the value attributed to the CHC could be influenced by
the value given to the single condition(s). Self-correction prompts in the TTO software were
not employed in two of the studies[14,18] and 28-40% of valuations were inconsistent in that
the elicited HSUVs for the CHC were greater than those for the corresponding single health
conditions.[23] Third, the actual CHC HSUVs in all three studies covered a very narrow
range of possible values, limiting generalisability. Finally, it is not clear if the OLS model
obtained will perform well in external data.
These limitations withstanding, when estimating HSUVs for CHCs using data elicited directly
from patients, the authors findings can be ranked as follows. When comparing the additive and
multiplicative methods alone, the multiplicative method is best.[19] Comparing the additive,
multiplicative and minimum methods, the minimum is best followed by the multiplicative and
then the additive.[18] Comparing all four methods, the combination model is more accurate
than the others with the minimum method being better than the
multiplicative method which is better than the additive method.[14] However, these findings
are based on analyses using a very limited range of HSUVs for the CHCs and the coefficients
in the combination model may not be generalisable to external data. This draws attention to
the danger in drawing conclusions from analyses comparing a limited number of the
alternative estimating methods.
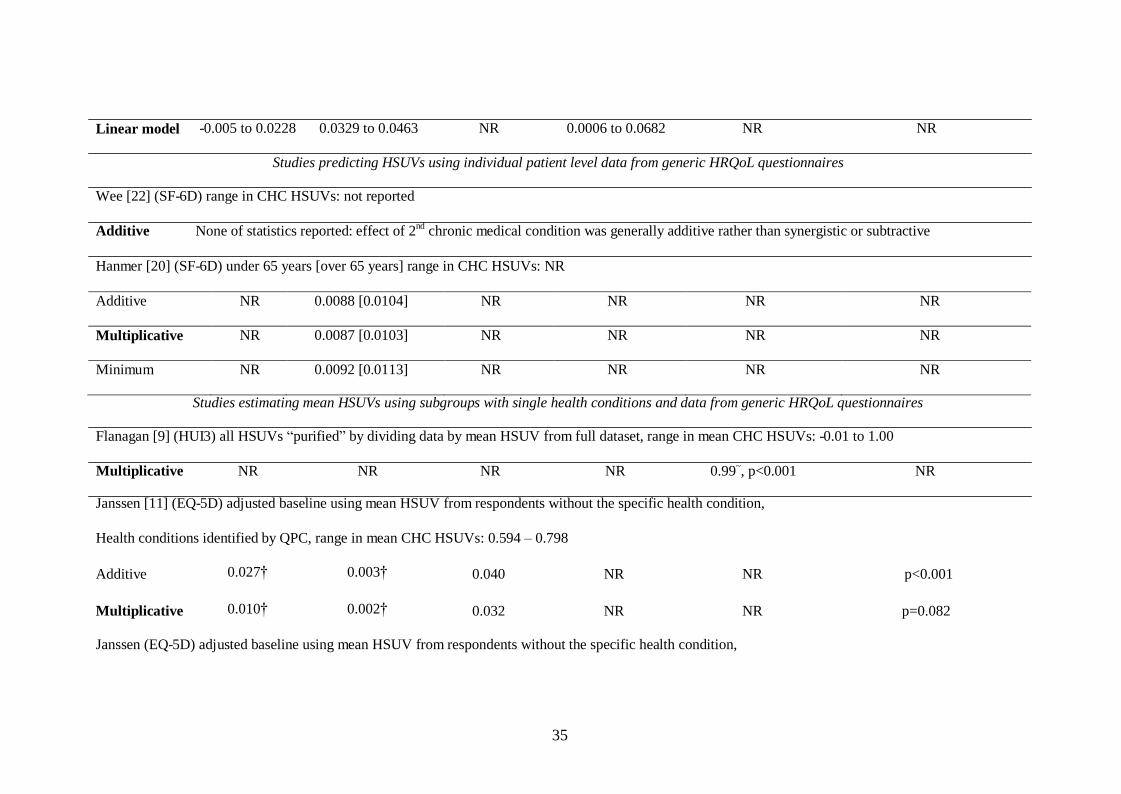
Studies using individual level data obtained from generic HRQoL instruments
Of the two studies using the individual level data obtained from generic HRQoL instruments
(both SF-6D), Wee et al. favoured the additive method while Hanmer et al. favoured the
multiplicative method.[20,22] Wee et al. derived three linear models (n=5,224) with one pair
of CHCs (diabetes plus either hypertension, heart disease or musculoskeletal illnesses) in each
model.[22] The dependent variable was the SF-6D and independent variables were: diabetes,
one of the second chronic medical conditions, the interaction between these, and socio-
demographic variables. The regressions were used to determine if the combined independent
17
effects of two single health conditions were additive (i.e. the effect is equal to the sum of the
two independent effects and the interaction term is not significant), subtractive (i.e. the effect is
smaller than the sum of the two independent effects and the interaction term is significant and
positive), or synergistic (i.e. the effect is greater than the sum of the two independent effects
and the interaction term is significant and negative).[22] While the coefficients for both single
health conditions were negative and statistically significant (p<0.05) in each of the three
regressions, the interaction term was reported to be not significant (coefficients and p- values
not reported), implying the combined effect was additive with no evidence of either a
synergistic or subtractive effect.
Hanmer et al. compared the additive, multiplicative and minimum methods in regressions
(n=5,969 under 65 years; n=89,226 for 65 and over) using a latent define summary health
scale censored at 0.30 and 1 to match the boundaries of the SF-6D.[20] The
utilities/disutilities associated with numbers of health conditions were entered as independent
variables (from no conditions up to a maximum of 12 or more conditions) and models were
obtained with/without socio-demographic covariates. The minimum method used the same
model form but entered individuals as having the health condition with the greatest aggregate
impact on health utility. In addition to evaluating the models’ performance in terms of
accuracy in predicted scores for individuals, results were also reported for subgroups
identified by the number of CHCs. For respondents aged 65 years and over, the
multiplicative (minimum) model had the smallest (largest) ME and MSE when subgrouped by
number of health conditions. Box plots describing errors (actual mean minus predicted mean)
for subgroups with two or three CHCs showed a much larger variation in errors from the
minimum model compared to the other two. While the vast majority of errors for the additive
and multiplicative models were within the reported minimally important difference for the
SF-6D (0.03 to 0.04),[24-25] there were several outliers beyond these limits. The authors
concluded that all the methods were imperfect with the multiplicative linear model
performing best followed by the additive linear model and the minimum linear model. They
18
cautioned that the analyses should be replicated in other large datasets before making strong
recommendations on the best methodology and in particular mentioned that censoring at the
limits of the SF-6D index could be important in skewed data sets.
It is not possible to determine the most accurate method for predicting HSUVs for CHCs
using the findings of these two studies. As the CHCs used in Wee’s study were limited to
diabetes plus one other health condition, this limits generalisability of results to other
CHCs.[22] The findings from Hanmer’s study are also limited due to the potentially small
range in actual HSUVs evaluated where the decrement on utility was reported to be relatively
small (-0.02 to -0.03) for the majority of the single health conditions.[20]
Studies using mean data obtained from generic HRQoL instruments
Of the six studies that used mean HSUVs from subgroups with single health conditions to
estimate mean HSUVs for CHCs, one found the multiplicative method gave a good fit
(synergy coefficient = 0.99, p< 0.001) for HUI3 data;[9] one found the multiplicative gave a
better fit than the additive method for EQ-5D data;[11] one reported that the minimum
method outperformed the additive and multiplicative methods for EQ-5D data;[21] one
reported the ADE outperformed the three traditional nonparametric estimators;[10] and two
found the combination linear model performed better than the nonparametric estimators, one
for EQ-5D data,[12] and one for SF-6D data.[13]
Flanagan tested the multiplicative method on “purified” data by mapping the purified mean
HSUVs for the single health conditions onto the actual mean HUI3 scores for the CHCs
(n=278) using OLS regressions.[9] They reported the multiplicative method gave a good fit
(synergy coefficient (s)=0.99, p<0.001) in CHCs involving two conditions, where a synergy
coefficient (i.e. the coefficient for the independent variable in a regression model with no
constant) close to one indicates that the majority of the utility associated with the CHC is
explained by the product of the HSUVs for the single health conditions. This was supported
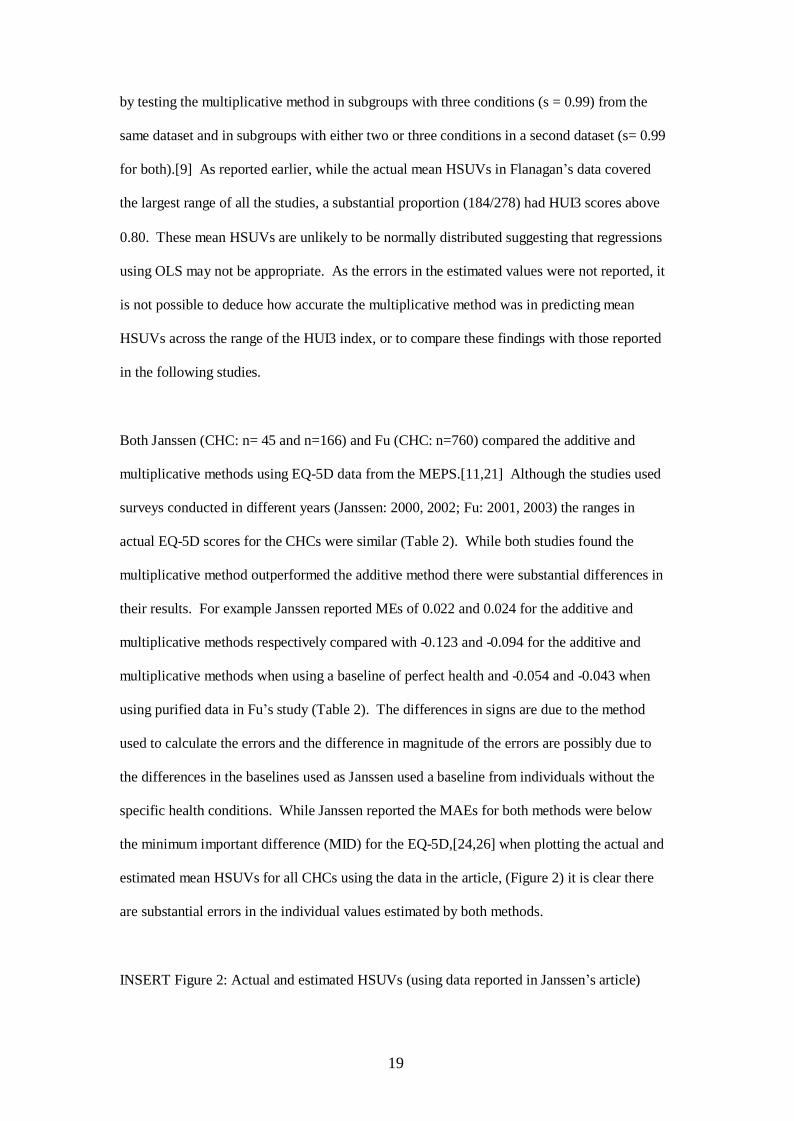
19
by testing the multiplicative method in subgroups with three conditions (s = 0.99) from the
same dataset and in subgroups with either two or three conditions in a second dataset (s= 0.99
for both).[9] As reported earlier, while the actual mean HSUVs in Flanagan’s data covered
the largest range of all the studies, a substantial proportion (184/278) had HUI3 scores above
0.80. These mean HSUVs are unlikely to be normally distributed suggesting that regressions
using OLS may not be appropriate. As the errors in the estimated values were not reported, it
is not possible to deduce how accurate the multiplicative method was in predicting mean
HSUVs across the range of the HUI3 index, or to compare these findings with those reported
in the following studies.
Both Janssen (CHC: n= 45 and n=166) and Fu (CHC: n=760) compared the additive and
multiplicative methods using EQ-5D data from the MEPS.[11,21] Although the studies used
surveys conducted in different years (Janssen: 2000, 2002; Fu: 2001, 2003) the ranges in
actual EQ-5D scores for the CHCs were similar (Table 2). While both studies found the
multiplicative method outperformed the additive method there were substantial differences in
their results. For example Janssen reported MEs of 0.022 and 0.024 for the additive and
multiplicative methods respectively compared with -0.123 and -0.094 for the additive and
multiplicative methods when using a baseline of perfect health and -0.054 and -0.043 when
using purified data in Fu’s study (Table 2). The differences in signs are due to the method
used to calculate the errors and the difference in magnitude of the errors are possibly due to
the differences in the baselines used as Janssen used a baseline from individuals without the
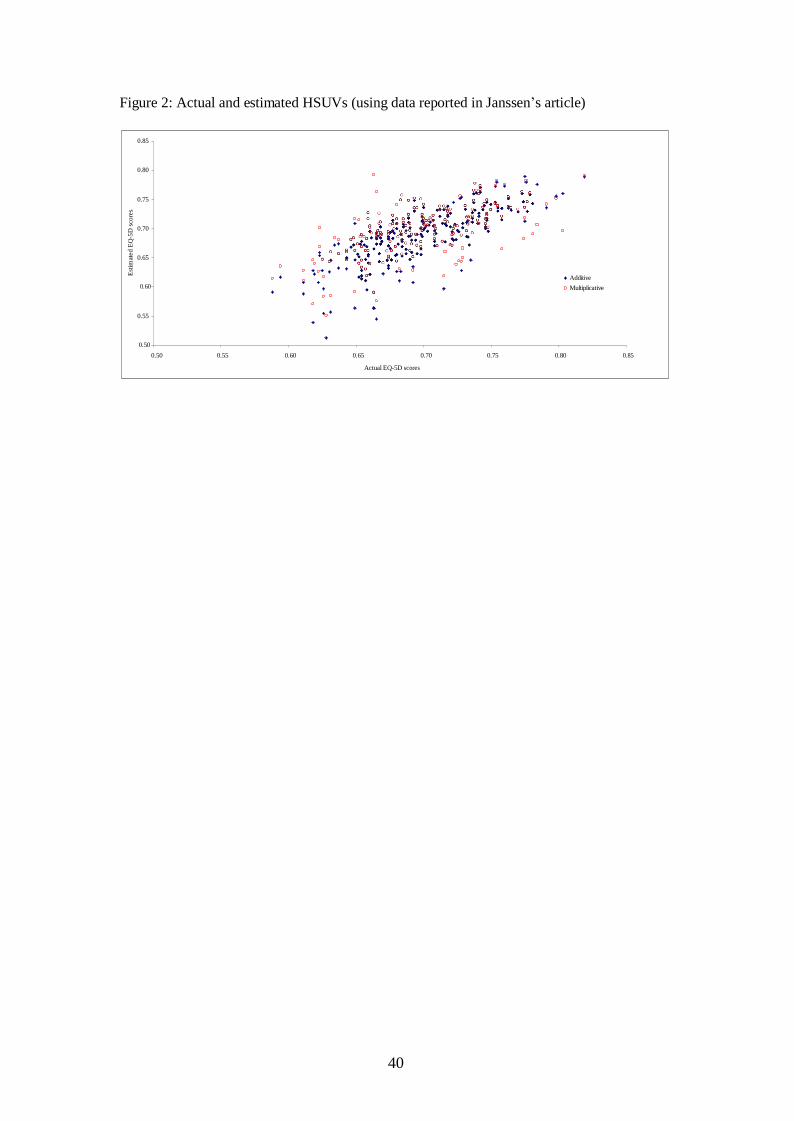
specific health conditions. While Janssen reported the MAEs for both methods were below
the minimum important difference (MID) for the EQ-5D,[24,26] when plotting the actual and
estimated mean HSUVs for all CHCs using the data in the article, (Figure 2) it is clear there
are substantial errors in the individual values estimated by both methods.
INSERT Figure 2: Actual and estimated HSUVs (using data reported in Janssen’s article)
20
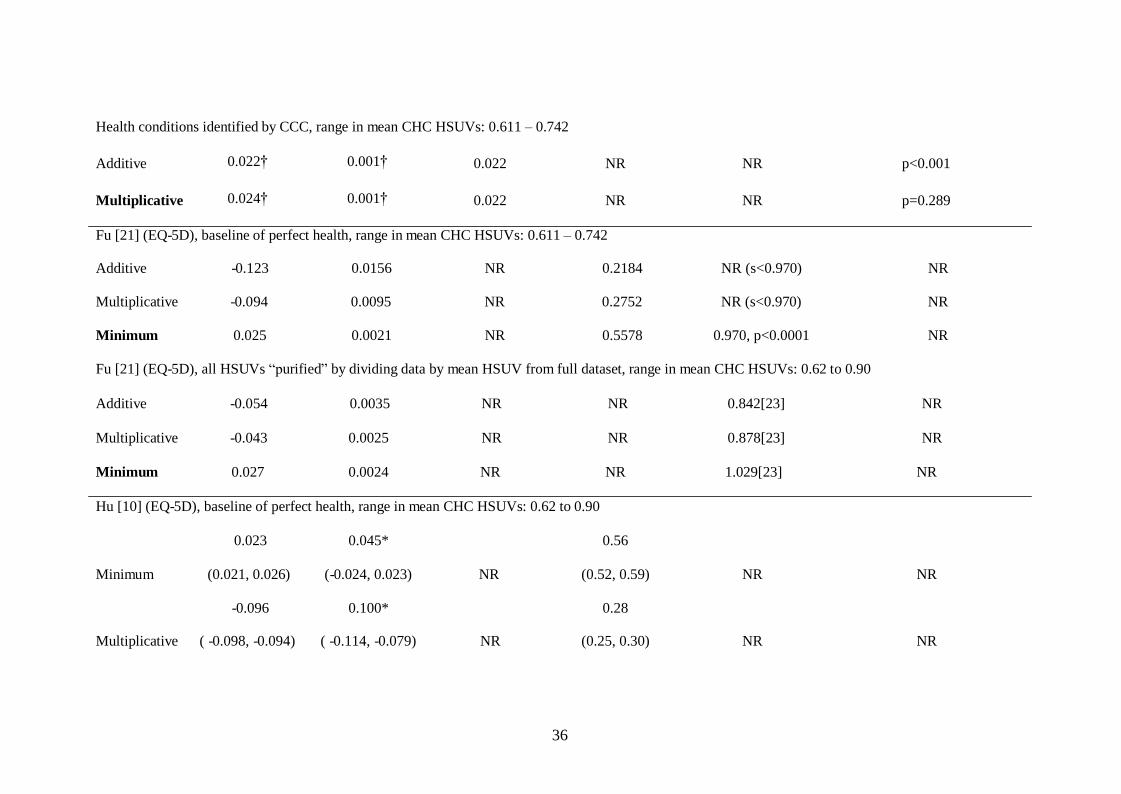
Fu also assessed the minimum method and found this outperformed both the additive and the
multiplicative methods in terms of MEs, MSEs and paired t-tests obtained from regressing the
estimated CHC HSUVs onto actual values. Conversely, based on the same statistics, the
multiplicative method outperformed the minimum method in two other studies that assessed all
three methods.[12,13] A scatter plot of the actual and estimated HSUVs showed
heteroskedasticity in the errors in HSUVs estimated using the minimum method with errors
increasing in magnitude as the actual HSUVs decreased.[12]
Fu’s article has been superseded by more recent analyses of the data conducted by the same
group of researchers.[10] Scatter plots of the estimated and actual HSUVs reported in the
second article showed approximately 25% of mean HSUVs estimated using the minimum
method were smaller than the actual mean HSUVs for the CHCs. This is only possible if one
or more of the mean HSUVs for the single health conditions are smaller than the mean HSUV
for the corresponding CHC. This is illogical as it implies that a comorbidity will improve
HRQoL. While one might expect a proportion of irregularities due to random error/noise,
these anomalies could suggest that the data being combined were not comparable in terms of
disease severity. For example a subgroup with the CHC rheumatism and heart disease may
have a milder form of rheumatism than a subgroup with just rheumatism.
In addition, the ranges of actual HSUVs estimated differed between the studies which may
contribute to the difference in the findings. Fu and Hu estimated HSUVs ranging from
approximately 0.62 to 0.90 while Ara estimated HSUVs ranging between 0.36 to 0.92 (with
80% of values smaller than 0.6) for EQ-5D and HSUVs ranging between 0.45 and 0.61 for
SF-6D. As mentioned previously, Ara reported errors in the HSUVs estimated using the
minimum method increased as the actual HSUVs decreased and this was also visible in Hu’s
smaller range.[10]
21
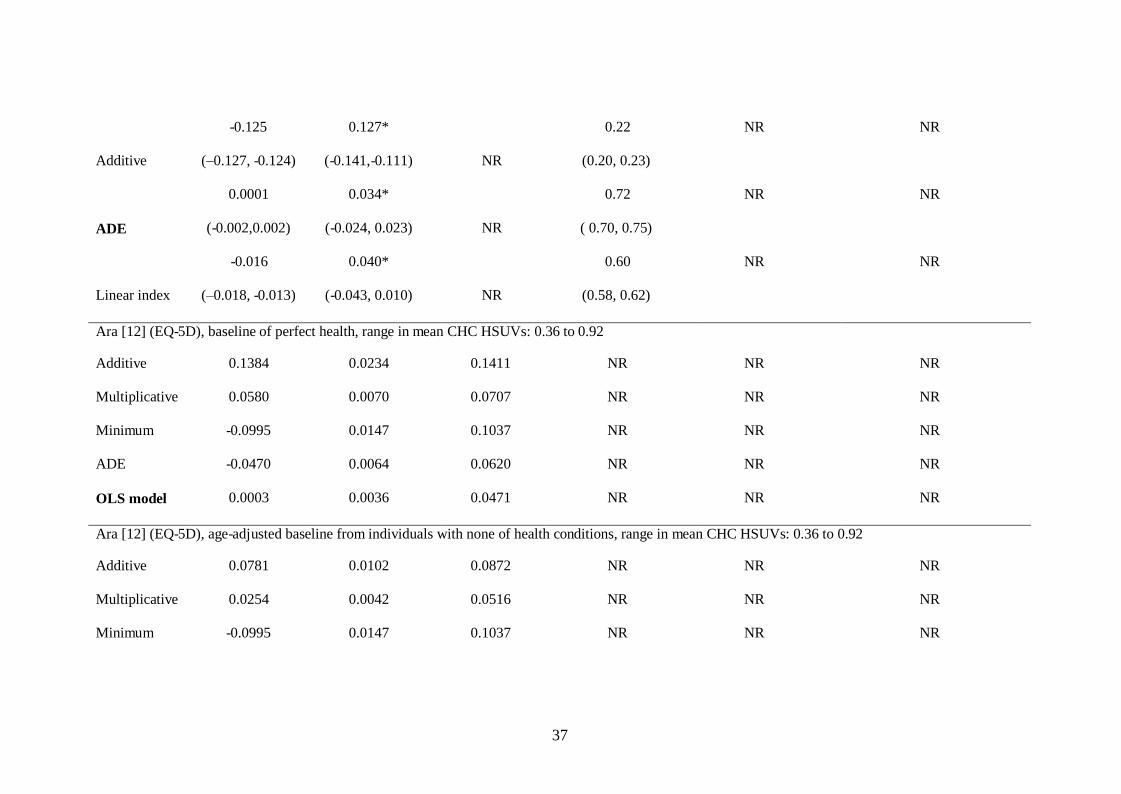
In addition to estimates obtained using the three traditional methods, Hu predicted HSUVs
using the linear model obtained by Basu.[14] They compared results with HSUVs estimated
using a proposed variation of the minimum method which they call the adjusted decrement
estimator (ADE). They found the ADE method outperformed the others in terms of mean
errors in estimated HSUVs but the scatter plot of estimated and actual HSUVs showed the
errors increased substantially as actual HSUVs decreased. Basu’s linear model outperformed
the three traditional methods in terms of mean errors in predicted HSUVs. Ara used the ADE
proposed by Hu et al. and found the ME in estimated HSUVs were smaller than those for the
three traditional methods when using a baseline of perfect health.[12,13] However, the
estimated HSUVs were much more accurate for both the multiplicative and the minimum
methods when using an adjusted baseline and in these analyses the multiplicative method
performed better than the ADE.
Overall, Ara found the linear combination model obtained regressing the mean HSUVs for the
single health conditions onto the corresponding mean HSUV for the CHCs outperformed all
the nonparametric estimators in both SF-6D and EQ-5D data.[12,13] When examining the
errors across the range of actual HSUVs they reported that almost all values were under-
estimated across the full range of values when using the additive method. For the
multiplicative method there was a tendency for the errors to decrease for lower HSUVs with
the largest errors in values above 0.6. Conversely, for both the minimum and ADE methods
the errors increased as the actual HSUV decreased. Although the errors in the HSUVs
predicted using the OLS models were smaller than those in the other methods, there was a
tendency to under-predict higher HSUVs and over-predict lower HSUVs. They cautioned
that while the linear model produced more accurate results than the non parametric
estimators, none of the coefficients in the model were significant. They recommended that
their model was validated using external data and suggested an alternative model
specification may be warranted. It is worth noting that the mean HSUVs for the actual CHCs
22
were normally distributed in this dataset, whereas HRQoL data, and in particular EQ-5D data
are typically bimodal with a long negative skew.
Because of the differences in the five studies such as the methods compared, the preference
data used, the baseline HSUVs, and the actual range of HSUVs for the CHCs, it is difficult to
recommend one particular method. In general, any recommendations by the study authors
were accompanied by caveats or limitations. Bias in the estimated values from the additive,
multiplicative and minimum methods was reported in many of the studies. The statistics
typically used to assess accuracy of the estimated CHCs, such as mean errors, were not
particularly informative with regard to systematic errors. Systematic errors in the estimated
CHCs were observed in four of the studies and were even visible in the analyses estimating a
narrow ranges of HSUVs. While MIDs were used as criteria to measure the proportion of
estimated values within an “acceptable” range in several of the studies, these statistics could be
perceived as arbitrary as a very small error in a HSUV can make a substantial difference to
results from decision analytic models where the benefits of treatment are small. It is clear that
conclusions drawn can differ when methods are assessed across different ranges of actual
HSUVs, suggesting the relationship between the HSUVs for the single health conditions and
the corresponding CHC may not be linear. In general the analyses using an adjusted baseline
produced more accurate results. Overall the parametric approach appears to produce the most
accurate results and additional research in this area would be beneficial.
SUMMARY and SUGGESTIONS FOR FUTURE RESEARCH
This review provides an overview of the current evidence base, describing some of the
methodological issues when estimating HSUVs for CHCs. In summary, we found the range
of actual HSUVs can influence findings; the statistics commonly used to assess the
performance of the methods were not particularly useful for assessing relevance for
applications in external data; none of the proposed methods gave consistently accurate results;
23
adjusted baselines increased accuracy. However, there are caveats associated with this
conclusion and additional research is required, both of which are discussed below.
It is clear that the range in actual HSUVs estimated can have a bearing on findings. For
example, while the minimum method and the ADE performed relatively well in terms of
mean errors when using a truncated range at the higher end of a utility index,[10,21] these
methods were less accurate when assessed in subgroups at the lower end of a utility
index.[12] While a simple chart showing the actual and estimated HSUVs gives a clear
picture of systematic bias in estimated values, few of the studies examined systematic bias in
any detail relying on mean statistics to support their findings. This has implications when
generalising the results for use in practical applications as decision analytic models frequently
include health states in the upper and lower quartiles of preference-based utility indices. For
example, it is often the case that a lifetime horizon can be appropriate for assessing cost
effectiveness, where patients are simulated in extreme states of disease severity. Additional
research assessing the methods across the full range of the utility indices is required. There is
also a need for analysts to be more thorough when assessing performance and reporting
results.
The baseline used in the estimating method is important and results from the studies included
in this review suggest that estimates obtained using an adjusted baseline were more accurate
in general. However, acquiring data which is unique to the individual health condition(s) may
be problematic when the estimation methods are used in future applications where access to
large datasets are not possible. Using data (n=1356) collected using the Quality of Well
Being Index (range 0 to 1) in the Beaver Dam Health Outcomes Study, Fryback et al. proposed
that analysts conducting cost utility analyses use average age specific HRQoL data from
population based studies to represent the state of not having a particular condition.[7] This
may generalise to the area of estimating HSUVs for CHCs and additional research in this area
would be beneficial.
24
There will inevitably be issues with the definition of the baseline used, including
inconsistencies in data. For example, there may be occasions when the mean HSUVs for
subgroups with a particular health condition are higher than the mean HSUVs for subgroups
without the health condition,[27] particularly if the data are obtained from different sources. In
addition, anomalies in data such as the apparent inconsistencies in expected HSUVs for CHCs
observed in Hu’s dataset require further consideration.[10] As stated previously, these
anomalies could suggest that the data being combined are not comparable in terms of disease
severity. For example a subgroup who have the CHC rheumatism and heart disease may have
a milder form of rheumatism than a subgroup who have just rheumatism. If this is the case,
then results generated from datasets similar to those used in the studies in this review may not
be the most appropriate data for testing the methods. Again, research in these areas would be
informative.
To our knowledge, no one has assessed the accuracy of the alternative methods in terms of
estimating HSUVs for subgroups of CHCs classified by type of health condition. It is
possible that the findings may differ depending on the health dimensions affected by the
health conditions being combined. Alternatively, and particularly for prevalent conditions,
correlations between the HSUVs for particular health conditions could affect the accuracy of
the methods differently. Research comparing the accuracy of the methods in subgroups of
health conditions would add to our understanding. In addition, no-one has assessed the
methods using more than one HRQoL instrument within the same dataset. This would be
informative with regard to generalisability of the results.
The results from the studies included in this review show that simple linear models tend to
under-predict higher HSUVs and over-predict lower HSUVs suggesting that an alternative
model could be warranted. In addition, each preference-based utility index will require a
25
different model. Additional research in this area involving data from a variety of HRQoL
instruments and exploring alternative model forms would be beneficial.
While the use of survey data is attractive due to the relative ease of access and the large
sample sizes which provide HSUVs for both single and CHCs, there are problems with these
data. First, the prevalence of health conditions tend to be self-reported and it has been shown
that the potential for bias is relatively high. For example 53% of respondents with a
physician’s diagnosis of diabetes indicated they did not have the condition in a Canadian
health survey.[8] Consequently a proportion of respondents identified as not having a
particular health condition may actually have the health condition which could give
misleading measurements when analysing data from subgroups of individuals based on self-
reported health conditions. Second, national surveys tend to recruit randomly from the
general population living in private households, therefore excluding individuals in residential
homes and medical establishments. In general, the latter will have poorer HRQoL than
individuals in private residents and it is likely that a larger proportion will have CHCs which
is the data required to evaluate the methods.
Due to the enormous number of combinations of health conditions it is impractical to obtain
actual HSUVs for each possible CHC and the volume of resources required is prohibitive. As
a consequence, researchers performing cost effectiveness analyses will estimate HSUVs for
CHCs using data that is readily available such as data from cohorts with the single health
conditions within the CHC. Although this review has helped to aid understanding of the
alternative approaches and the potential reasons for differences in reported findings, it is clear
that additional research is required before a particular method is advocated.
26
REFERENCES
1. NICE Guide to the methods of technology appraisal. 2008. London, NICE
2. Dolan P, Gudex C, Kind P, Williams A. The time trade-off method: results from a
general population study. Health Econ 1996;5:141-54.
3. Feeny D, Furlong W, Torrance G W, Goldsmith C H, Zhu Z, DePauw S et al.
Multiattribute and single-attribute utility functions for the health utilities index mark 3
system. Medical Care 2002;40(2):113–128.
4. Brazier JE, Roberts JF, Deverill MD. The estimation of a preference-based measure
of health from the SF-36. J Health Econ 2002;21:271-92.
5. Ara R, Brazier J. Populating an economic model with health state utility values:
moving towards better practice. HEDS Discussion Paper No. 09/11. Available at
http://www.sheffield.ac.uk/scharr/sections/heds/dps-2009.html
6. Joint Health Surveys Unit of Social and Community Planning Research and
University College London, Health Survey for England 200x [computer file] (3rd ed.).
Colchester, Essex: UK Data Archive, [distributer], 2008
7. Fryback DG, Lawrence WF, Dollars may not buy as man QALYs as we think: A
problem with defining quality of life adjustments, Med Decis Making 1997;17;276.
8. Manuel DG, Schultz SE, Kopec JA. Measuring the health burden of chronic disease
and injury using health adjusted life expectancy and the Health Utilities Index. J Epidemiol
Community Health 2002;56:843-850.
9. Flanagan W, McIntosh C, Le Petit C, Berthelot J. Deriving utility scores for co-
morbid conditions: a test of the multiplicative model for combining individual condition
scores. Population Health Metrics 2006:4(13) doi:10.1186/1478-7954-4-13.
10. Hu B, Fu AF, Predicting utility for joint health states, a general framework and a new
non parametric estimator. 2010 MDM in press
11. Janssen M, Bonsel G Estimating preference weights for chronic multimorbidity:
Don’t add, multiply. Proceedings of the EuroQol Group 2008.

27
12. Ara R, Brazier J. Comparing EQ-5D scores for comorbid health conditions estimated
using five different methods. Available from http://eprints.whiterose.ac.uk/
13. Ara R, Brazier J. Estimating health state utility values for comorbid health conditions
using SF-6D data. Available from http://eprints.whiterose.ac.uk/
14. Basu A, Dale W, Elstein A, Meltzer D. A linear index for predicting joint health state
utilities from single health state utilities. Health Economics 2009;18:403-19.
15. Keeney RL, Raifa H. 1993. The multiplicative utility function. In Decisions with
Multiple Objectives: Preferences and Value Tradeoffs. Cambridge University Press:
Cambridge; 288-292.
16. Keeney RL, Raiffa H. 1976. Decision Making with Multiple Objectives. Wiley: New
York.
17. Tversky A, Kaheman D. 1992. Advances in prospect theory: cumulative
representation of uncertainty. Journal of Risk and Uncertainty 5: 297-323.
18. Dale W, Basu A, Elstein A, Meltzer D. Predicting utility ratings for joint health states
from single health states in prostate cancer: Empirical testing of 3 alternative theories.
Medical Decision Making 2008:28:102-12.
19. Esnaoloa NF, Doherty DA, Johnson ML, Ellis VO, Miller AR, Janjan NA et al.
Comparison of additive and multiplicative utility predictions to predict the utilities of
combined health states. Abstracts from the 23rd Annual Meeting of the Society for Medical
Decision Making. Med Decis Making 2001:21;517
20. Hanmer J, Vanness D, Gangnon R, Palta M, Fryback DG. Three methods tested to
model SF-6D health utilities for health states involving comorbidity/co-curring conditions.
Journal of Clinical Epidemiology 2009;63(3)31-341.
21. Fu A, Katan M. Utilities should not be multiplied. Medical Care 2008;46:984-90.
22. Wee H, Cheung Y, Li S, Fong K, Thumboo J. The impact of diabetes mellitus and
other chronic medical conditions on health related quality of life: Is the whole greater than the
sum of its parts? Health and Quality of Life Outcomes.2005 3(2) doi:10,1186/1477-7525-3-2.

28
23. McIntosh CN. Utility scores for comorbid conditions: methodological issues and
advances In Handbook of Disease Burdens and Quality of Life Measures, Springer New York
2010. Available from: http://www.springerlink.com/content/l01412u145142nt7/
24. Walters SJ, Brazier JE, What is the relationship between the minimally important
difference and health state utility values? The case of the SF-6D. Health Qual Life Outcomes
2003;1:4.
25. Walters SJ, Brazier JE. Comparison of the minimally important difference for two
health state utility measures: EQ-5D SF-6D. Qual Life Res 2005;14:1423-32.
26. Guyatt GH, Osoba D, Wu AW, Wyrwich KW, Norman GR; Clinical Significance
Consensus Meeting Group. Methods to explain the clinical significance of health status
measures. Mayo Clin Proc. 2002;77:371-383.
27. Fryback DG, Dasbach EJ, Klein BEK, Dorn N, Peterson K, Martin P.The Beaver
Dam Health Outcomes study: Initial Catalogue of Health-state Quality Factors Med Decis
Making 1993:13;89.
28
Table 1: Summary of studies included in the review
First
Author
Utility
measure
Data source
[study year(s)]
Single Health Conditions Comorbid Health
Conditions (n=number of
Methods compared Authors conclusions/ favoured method
(Year)
(n=number of cases
actual CHC HSUVs
in dataset)
estimated)
Studies using utilities elicited directly from patients
Esnaola Standard Patients with cancer, pain, Two CHCs (n=3) Additive Multiplicative predict
(2001)
gamble
recurrent rectal
complications,
cancer and pain, cancer and
Multiplicative
better than additive and
[19]
cancer
residual cancer after
complications, and residual
additive may under-
(n=50)
surgery
cancer after surgery
estimate utilities for
CHCs.
Dale
TTO
Patients attending
impotence, incontinence,
Two CHCs (n=3)
Additive
All 3 models are
(2008)
prostate biopsy
watchful waiting, post-
impotence plus either
Multiplicative
biased.
[18]
clinics
prostatectomy
incontinence, watchful
Minimum
Minimum model
(n=147)
waiting or post-
prostatectomy
recommended if cannot
elicit CHC HSUVs

29
directly.
Basu
(2009)
[14]
TTO Patients attending
prostate biopsy
clinics
(n=207)
75% model
formation, 25%
model validation
impotence, incontinence,
watchful waiting, post-
prostatectomy
Two CHCs (n=3)
impotence plus either
incontinence, watchful
waiting or post-
prostatectomy
Additive
Multiplicative
Minimum
linear model
Regression
combination model is
the best approach.
Preference-based data (individual patient level HSUVs)
Wee SF-6D Sample of ethnic, Diabetes, hypertension, Two CHCs (n=3) Additive In favour of additive
(2005)
Chinese, Malays
heart disease,
diabetes plus one of:
Synergistic
method
[22]
and Indians in
musculoskeletal illnesses
hypertension
Subtractive
Singapore
heart disease [
(n=5,224)
musculoskeletal illnesses
30
Hanmer
(2009)
SF-6D Medicare Health
Outcomes Survey
15 self-reported health
conditions
65 years and over:
(n=58) for two CHCs,
Additive
Minimum
Multiplicative was the
best
[20]
[1998-2004]
(n=35) for three CHCs,
Multiplicative
Split into ≥65 or
(n=26) for four CHCs
<65 years
(n=8) for five CHCs
(n=95,195) model
(n=NR) for > 6 CHCs
formation;
(n= 94,794) model
Under 65 years: n=NR
validation
Preference-based data (mean HSUVs)
Flanaga
HUI3
Canadian
26 self-reported chronic
Cycle 1.1 (formulation):
Multiplicative
In favour of
n
Community Health
conditions
(n=278) for two CHCs
multiplicative method
(2005)
[9]
Survey (CCHS)
Cycle 1.1 [2000-
(n=924) for three CHCs
Cycle 2.1 (validation):
2001] (n=131,535)
(n=299) for two CHCs
model formation;
(n=734) for three CHCs
31
Cycle 2.1 [2003-
2004] (n=45,101)
model validation
Janssen
(2008)
[11]
EQ-5D MEPS Medical
Expenditure Panel
Survey [2000,
2002]
(n=38,678)
Conditions defined by
ICD-9 codes and
subgrouped into:
a) Quality Priority
Conditions (QPC) giving
10 chronic conditions
present any time in the
past (except joint pain)
b) Clinical Classification
Categories (CCC) giving
259 conditions
QPC: two CHCs (n=45)
CCC: two CHCs (n=166)
Additive
Multiplicative
Multiplicative method
shows a better fit

32
Fu
(2008)
EQ-5D Medical
Expenditure Panel
Clinical classification
Categories system (CCC),
Two CHCs (n=760) Additive
Multiplicative
None of the methods
provide an unbiased
[21]
Survey
defined by ICD-9 codes
Minimum
estimate but the
[2001, 2003]
Maximum
minimum outperformed
(n=40,846)
Average
the others
Mean of condition
with smaller
sample
Hu
EQ-5D
Medical
Clinical classification
Two CHCs (n=760)
Additive
The ADE generated
(2010)
Expenditure Panel
Categories system (CCC),
Multiplicative
unbiased estimates for
[10]
Survey
using combinations of
Minimum
joint health states
[2001, 2003]
ICD-9 codes
ADE
(n=40,846)
Linear
model[Basu]
Ara
EQ-5D
Health Survey for
Self-reported chronic
Two CHCs (n=91)
Additive
The linear model gave
(2010)
England
health conditions, 39
Multiplicative
the most accurate
33
[12] [2003, 2004, 2005,
2006]
individually categorised
and 15 grouped
Minimum
ADE
results but there were
some substantial
(n=41,174)
conditions
OLS combination
individual errors
Ara
SF-6D
Welsh Health
Self-reported limiting
Two CHCs (n=32)
Additive
The linear model gave
(2010)
Survey
long-standing health
Multiplicative
most accurate results
[13]
[2003, 2004, 2005,
conditions, 39
Minimum
but there were some
2007, 2008]
(n=64,437)
individually categorised
and 14 grouped health
ADE
OLS combination
substantial individual
errors
conditions
ICD = International Classification of Diseases, Ninth Revision, Clinical Modification
34
Table 2: Reported results and supporting statistics
Statistics used to compare the methods used to estimate HSUVs
Methods used ME
(95% CI)
MSE
(95% CI) MAE
Ccc
(95% CI) s t-test
Studies using utilities elicited directly from patients
Esnaola[19] (SG) range in CHC median HSUVs: all 0.50
Additive Median absolute error: range 0.300 to 0.350
Multiplicative Median absolute error: range 0.100 to 0.188
Dale [18] (TTO) range in CHC mean HSUVs: 0.66 to 0.72
Additive 0.127 0.256* 0.282 -0.533 NR NR
Multiplicative 0.091 0.218* 0.276 -0.406 NR NR
Minimum 0.038 0.194* 0.260 -0.305 NR NR
Basu [14] (TTO) range in CHC mean HSUVs: 0.63 to 0.70
Additive 0.0855 to 0.1152 0.0627 to 0.0711 NR -0.5361to -0.4707 NR NR
Multiplicative 0.0497 to 0.0838 0.0475 to 0.0502 NR -0.3404 to -0.4280 NR NR
Minimum 0.0008 to 0.0356 0.0400 to 0.0510 NR -0.2459 to -0.3407 NR NR
35
Linear model -0.005 to 0.0228 0.0329 to 0.0463 NR 0.0006 to 0.0682 NR NR
Studies predicting HSUVs using individual patient level data from generic HRQoL questionnaires
Wee [22] (SF-6D) range in CHC HSUVs: not reported
Additive None of statistics reported: effect of 2
nd chronic medical condition was generally additive rather than synergistic or subtractive
Hanmer [20] (SF-6D) under 65 years [over 65 years] range in CHC HSUVs: NR
Additive NR 0.0088 [0.0104] NR NR NR NR
Multiplicative NR 0.0087 [0.0103] NR NR NR NR
Minimum NR 0.0092 [0.0113] NR NR NR NR
Studies estimating mean HSUVs using subgroups with single health conditions and data from generic HRQoL questionnaires
Flanagan [9] (HUI3) all HSUVs “purified” by dividing data by mean HSUV from full dataset, range in mean CHC HSUVs: -0.01 to 1.00
Multiplicative NR NR NR NR 0.99
~, p<0.001 NR
Janssen [11] (EQ-5D) adjusted baseline using mean HSUV from respondents without the specific health condition,
Health conditions identified by QPC, range in mean CHC HSUVs: 0.594 – 0.798
Additive 0.027† 0.003† 0.040 NR NR p<0.001
Multiplicative 0.010† 0.002† 0.032 NR NR p=0.082
Janssen (EQ-5D) adjusted baseline using mean HSUV from respondents without the specific health condition,
36
Health conditions identified by CCC, range in mean CHC HSUVs: 0.611 – 0.742
Additive 0.022† 0.001† 0.022 NR NR p<0.001
Multiplicative 0.024† 0.001† 0.022 NR NR p=0.289
Fu [21] (EQ-5D), baseline of perfect health, range in mean CHC HSUVs: 0.611 – 0.742
Additive -0.123 0.0156 NR 0.2184 NR (s<0.970) NR
Multiplicative -0.094 0.0095 NR 0.2752 NR (s<0.970) NR
Minimum 0.025 0.0021 NR 0.5578 0.970, p<0.0001 NR
Fu [21] (EQ-5D), all HSUVs “purified” by dividing data by mean HSUV from full dataset, range in mean CHC HSUVs: 0.62 to 0.90
Additive -0.054 0.0035 NR NR 0.842[23] NR
Multiplicative -0.043 0.0025 NR NR 0.878[23] NR
Minimum 0.027 0.0024 NR NR 1.029[23] NR
Hu [10] (EQ-5D), baseline of perfect health, range in mean CHC HSUVs: 0.62 to 0.90
0.023 0.045* 0.56
Minimum (0.021, 0.026) (-0.024, 0.023) NR (0.52, 0.59) NR NR
-0.096 0.100* 0.28
Multiplicative ( -0.098, -0.094) ( -0.114, -0.079) NR (0.25, 0.30) NR NR
37
-0.125 0.127* 0.22 NR NR
Additive
(–0.127, -0.124)
(-0.141,-0.111)
NR
(0.20, 0.23)
0.0001
0.034*
0.72
NR
NR
ADE
(-0.002,0.002)
(-0.024, 0.023)
NR
( 0.70, 0.75)
-0.016
0.040*
0.60
NR
NR
Linear index
(–0.018, -0.013)
(-0.043, 0.010)
NR
(0.58, 0.62)
Ara [12] (EQ-5D), baseline of perfect health, range in mean CHC HSUVs: 0.36 to 0.92
Additive
0.1384
0.0234
0.1411
NR
NR
NR
Multiplicative
0.0580
0.0070
0.0707
NR
NR
NR
Minimum
-0.0995
0.0147
0.1037
NR
NR
NR
ADE
-0.0470
0.0064
0.0620
NR
NR
NR
OLS model
0.0003
0.0036
0.0471
NR
NR
NR
Ara [12] (EQ-5D), age-adjusted baseline from individuals with none of health conditions, range in mean CHC HSUVs: 0.36 to 0.92
Additive
0.0781
0.0102
0.0872
NR
NR
NR
Multiplicative
0.0254
0.0042
0.0516
NR
NR
NR
Minimum
-0.0995
0.0147
0.1037
NR
NR
NR
38
ADE -0.0695 0.0090 0.0781 NR NR NR
OLS model
0.0001
0.0036
0.0466
NR
NR
NR
Ara [13] (SF-6D), age-adjusted baseline from individuals with none of health conditions, range in mean CHC HSUVs: 0.465 to 0.607
Additive
0.1209
0.0157
0.1209
NR
NR
NR
Multiplicative
0.0745
0.0064
0.0745
NR
NR
NR
Minimum
-0.0546
0.0038
0.0546
NR
NR
NR
ADE
0.0383
0.0022
0.0006
NR
NR
NR
OLS model
0.0000
0.0006
0.0191
NR
NR
NR
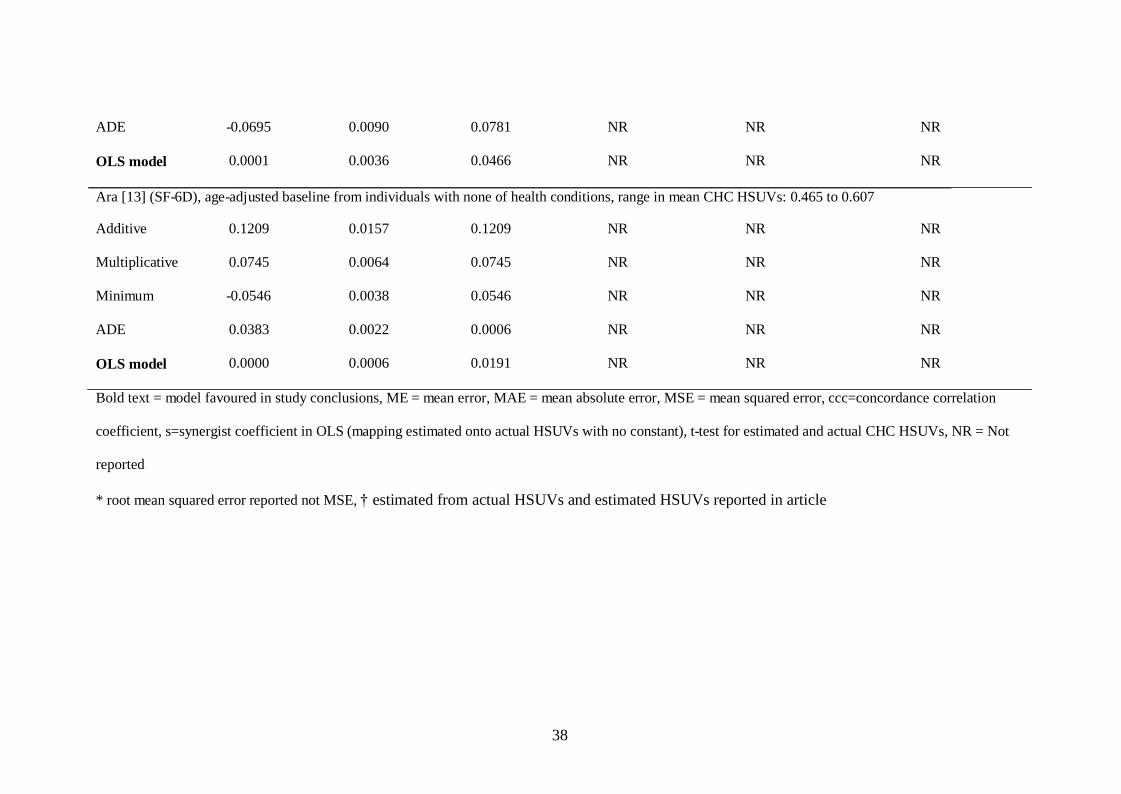
Bold text = model favoured in study conclusions, ME = mean error, MAE = mean absolute error, MSE = mean squared error, ccc=concordance correlation
coefficient, s=synergist coefficient in OLS (mapping estimated onto actual HSUVs with no constant), t-test for estimated and actual CHC HSUVs, NR = Not
reported
* root mean squared error reported not MSE, † estimated from actual HSUVs and estimated HSUVs reported in article
39
Figure 1: Impact on HRQoL attributable to health condition(s)
Impact on HRQoL
attributable to history
of heart attack/angina
1 = Perfect health
Impact on HRQoL
attributable to
arthritis/rheumatism
Average HSUV for individuals (n=558) with
no history of heart attack/angina (aged 70) 0.813
0.869
Average HSUV for individuals (n=460) with
no history arthritis/rheumatism (aged 65)
0.181 0.368
Average HSUV for individuals (n=1,759) with
a history of heart attack/angina (average age
= 70)
0.632
0.597
Average HSUV for individuals (n=1,648) with
a history of arthritis/rheumatism (average age
= 65) 0.272 0.403
0 = Dead
40
Est
imat
ed E
Q-5
D s
core
s
Figure 2: Actual and estimated HSUVs (using data reported in Janssen’s article)
0.85
0.80
0.75
0.70
0.65
0.60
Additive
Multiplicative
0.55
0.50
0.50 0.55 0.60 0.65 0.70 0.75 0.80 0.85
Actual EQ-5D scores