Embed Size (px)
Citation preview
HEMATOPOIESIS AND T-CELL SPECIFICATION AS A MODEL DEVELOPMENTAL SYSTEM
Ellen V. Rothenberg*, Hao Yuan Kueh, Mary A. Yui, and Jingli A. Zhang†
Division of Biology & Biological Engineering, California Institute of Technology, Pasadena, CA 91125 USA
SUMMARY
The pathway to generate T cells from hematopoietic stem cells guides progenitors through a
succession of fate choices while balancing differentiation progression against proliferation, stage
to stage. Many elements of the regulatory system that controls this process are known, but the
requirement for multiple, functionally distinct transcription factors needs clarification in terms of
gene network architecture. Here we compare the features of the T-cell specification system with
the rule sets underlying two other influential types of gene network models: first, the
combinatorial, hierarchical regulatory systems that generate the orderly, synchronized increases in
complexity in most invertebrate embryos; second, the dueling “master regulator” systems that are
commonly used to explain bistability in microbial systems and in many fate choices in terminal
differentiation. The T-cell specification process shares certain features with each of these prevalent
models but differs from both of them in central respects. The T-cell system is highly combinatorial
but also highly dose-sensitive in its use of crucial regulatory factors. The roles of these factors are
not always T-lineage specific, but they balance and modulate each other’s activities long before
any mutually exclusive silencing occurs. T-cell specification may provide a new hybrid model for
gene networks in vertebrate developmental systems.
Keywords
Gene regulatory networks; Transcription factors; Commitment; Lineage hierarchy
Introduction: T Cell Development as a Developmental Model System
From the vantage point of immunology, the program of T cell development seems
unexceptional, even particularly well-ordered. The hierarchy of intermediate states in early T
cell development is well defined by multiple molecular criteria and the succession of these
states has been shown to progress faithfully in adult life, in fetal life, and in very useful in
vitro culture systems. Compared to other hematopoietic programs, T-cell development is a
distinctive showcase for interesting cell fate determination mechanisms. T cell functional
maturation is very distinct from the classic terminal differentiation programs of erythrocytes,
*Corresponding author: Division of Biology & Biological Engineering, California Institute of Technology, 1200 E. California Blvd., MC 156-29, Pasadena, CA 91125-001, USA, Tel +1-626-395-4992, [email protected].†Present address: Genentech, 1 DNA Way, South San Francisco, CA 94080
Conflict of Interest: None of the authors has a conflict of interest.
HHS Public AccessAuthor manuscriptImmunol Rev. Author manuscript; available in PMC 2017 May 01.
Published in final edited form as:Immunol Rev. 2016 May ; 271(1): 72–97. doi:10.1111/imr.12417.
Author M
anuscriptA
uthor Manuscript
Author M
anuscriptA
uthor Manuscript
megakaryocytes, and granulocytes, for example, where maturity is tightly coupled with
permanent growth arrest and commitment to die. The whole range of T-cell development
also includes many more known branches than erythroid development or even B-cell
development. This means that the questions of how choices are made, and whether choices
are irreversible, once made, pervade any consideration of T-cell function. However, the basic
principles that enable stem cells to generate T cells throughout fetal and postnatal life are
normal and exemplary for the hematopoietic system.
Seen in a different light, however, T cell development has arrestingly strange properties. It
has indeterminate timing; it comes in different variants depending on adult vs. fetal context;
it includes a prolonged period of indeterminacy of cell fate, based on the delay in ability to
repress key transcription factors of alternative lineages; and it shares different modular parts
of its program with different alternative cell types (innate lymphoid cells for its functional
components, B cells for its receptor-generating components), blurring the hierarchy of its
relationships to other fates. Most glaringly, this program generates a huge excess of
immature T cells that will be ruthlessly culled by a selection mechanism before maturation
to discard all but a lucky few percent. These properties typify the difference between this
developmental system based on multipotent stem cells and one based on rapid, efficient, and
precise fate-determination mechanisms operating in early embryos of many organisms.
Here, T cell development is less an exception than a prototype of the opportunities provided
by a stem-cell based system as opposed to the rigorously scheduled program of cell type
definitions created by gene network operation in the early embryos.
This comparison is timely in light of the recent death of our colleague, Eric H. Davidson,
whose lively exposition of gene network rules governing early embryo development
provided a framework for many far-reaching discussions. Which elements in developmental
system design are essential and universal? What aspects of gene networks make parts of the
developmental program more evolutionarily malleable? The answers obtained from early
embryos of multiple types of invertebrates are very strong, but they are in some respects
different from the ones that would emerge from an analysis based on vertebrate
hematopoietic systems, as exemplified by T cell development. Thus, the question arises, how
do particular rules of gene network design serve different biological needs?
This article considers how the set of gene network features that we must account for in early
T cell development connect to and distinguish it from other established gene network models
for development. These network features force some revisions of common paradigms, and
they have broader consequences for understanding of the mechanism of T-cell specification
and of hematopoietic specification more generally.
Paradigms for Development
Two kinds of gene network models have been highly influential in explaining development.
One is to account for the highly ordered creation of complexity from a single totipotent cell
in embryonic development, which has been investigated in key invertebrate systems. The
other is for the choice between terminal differentiation fates in bipotent precursor cells,
formulated as a duel between two mutually antagonistic transcription factors.
Rothenberg et al. Page 2
Immunol Rev. Author manuscript; available in PMC 2017 May 01.
Author M
anuscriptA
uthor Manuscript
Author M
anuscriptA
uthor Manuscript
Development at high efficiency: principles from invertebrate embryos
The most universal features of multicellular, highly organized metazoan animal life can be
identified as those that are found in all three main branches of animal phylogeny:
ecdysozoans (e.g. insects, crustacea, nematodes), lophotrochozoans (e.g. annelid worms, and
mollusks ranging from clams to snails to octopuses), and deuterostomes (e.g. echinoderms,
ascidians, fish, humans). All three branches have three germ layers and bilateral symmetry
in their embryos (metazoans) and have numerous points of molecular similarity, despite
often-alien looking body plans. All three branches share the use of a mode of embryonic
development that has been called “Type I” embryogenesis (1–3). This set of developmental
rules enables embryos to become capable of feeding independently in a short time. Such
embryos start subdividing into future tissue types in an organized way during the early
cleavage divisions soon after fertilization. Every cell counts. Future body axes of the
bilaterally symmetric embryo are established from the time the egg is fertilized, due in part
to localized deposits of signaling proteins or RNA in a particular region of the egg that are
laid down during oogenesis, and often combined with polarized cytoskeletal movements
triggered by the entry of the sperm. A cascade of signaling begins to create spatially
differential gene expression as cleavage gets under way, and the fates of the cells become
highly predictable due to the canonical nature of the cleavage pattern. Cells inheriting the
cytoplasm with localized maternal determinants signal to their neighbors, which in turn
activate genes encoding new signaling molecules to affect the next tier of neighbors. Cell
types begin to turn on fate-specific distinctive gene expression patterns many cell cycles
before they differentiate morphologically, and their fates are predictable and usually
invariant from this early stage. Thus, despite its burgeoning variety of cell types and their
morphogenetic changes in position, the embryo develops canonically and synchronously.
The crucial feature of this kind of development is its predictability and lack of ambiguity.
Gene networks in these cases are used not only to generate complexity but also to make the
process fail-safe: thus cells are used parsimoniously but regulatory genes are not, and gene
network circuits are typically “over-engineered” (4). These features of gene networks have
been demonstrated explicitly in a non-vertebrate deuterostome, the purple sea urchin
Strongylocentrotus purpuratus (e.g. (5, 6)), and most of them are mirrored by evidence from
another deuterostome, the sea squirt Ciona intestinalis (7–9), and two key embryonic model
systems from the ecdysozoan branch of evolution, the nematode worm Caenorhabditis elegans (10, 11) and the fruit fly Drosophila melanogaster (12–15). Although the mode of
embryonic development of Drosophila is divergent from the basic type I embryo (1), many
features of type I embryonic networks still pertain to it. All these gene networks use the
initially localized signals to trigger a hierarchy of progressive subdivisions to specify future
tissue types. To enable different cells to express different genes at the end, the key is to set
up diverse, stable patterns of transcription factor expression; to make an embryo, these
expression domains must be strictly spatially organized.
A transcription factor coding gene as a rule is expressed not in the same pattern as any one
of its own positive regulators, but rather, in a defined subset of the region in which each of
its “upstream” regulators is active. This is because each regulatory gene is activated only by
a particular combination of positive regulators in the absence of a certain set of negative
Rothenberg et al. Page 3
Immunol Rev. Author manuscript; available in PMC 2017 May 01.
Author M
anuscriptA
uthor Manuscript
Author M
anuscriptA
uthor Manuscript
regulators (16). These conditions are “computed” by transcription factor binding to cis-
regulatory elements of the gene, so that new transcription factors are turned on only in cells
where the domains of two old ones overlap, or in the region excluded by their overlap (e.g.
(17–21)). Several tiers of factors are activated as development gets under way, in a
sequential Boolean hierarchy (22). The increase in complexity of the developing embryo
arises because each intermediate transcription factor coding gene in the network responds to
a distinct, unique combination of inputs, thus propagating different state information to its
own targets. Importantly, the set of factors activated in an early embryonic cell also usually
includes at least one negative regulatory factor that excludes the expression of genes that
might otherwise be expressed, e.g. in a sister cell. Repressors in the best-studied embryonic
systems do not simply compete with activators at an enhancer, as a rule, but rather exert a
veto over the ability of that enhancer to drive the target gene’s expression, and this helps to
sharpen boundaries between future tissues (16). Once a fully specific set of transcription
factors is active in a cell, then these collaborate to turn on the correct battery of cell type-
defining differentiation genes, and the cell’s fate is set. Because of the canonical positioning
of the “upstream” factors in the embryo, though, each cell’s fate is predictable from one
embryo to another even before this molecular lockdown has occurred.
This type I mode of embryonic development is different in a number of respects from the
kind of development that dominates in vertebrates, which has been labeled “type II”.
Vertebrate embryos during cleavage tend to establish large populations of cells whose fates
are not defined until after they migrate across other domains of the embryo and experience
different signals from the environments through which they move. Lineage is much less
clearly specified and thus the regulatory state preconditions for particular pathways of
development are less clear until much later in the developmental process. An exception that
may prove the rule is the relatively early specification of trophectoderm in mammals: but
this is the only part of the mammalian embryo that functionally performs like a type I
embryo – an early-specified part that enables feeding. Because of the indeterminacy of the
cell fates and their relationships to initial gene expression patterns in most vertebrate
embryos, gene network models have not been able to capture the early events of these
embryos to date. In contrast, strong and highly detailed gene network models have been
developed and extensively tested for both the early sea urchin (22) and the early Drosophila
embryos (14). These models have revealed the logical power of cross-regulation among
transcription factor coding genes, evident even from the topological layout of the network
interactions (23, 24), to specify novel organismal structures and cell type identities
The early theories about the role of diffusible signals called “morphogens” in patterning
embryos led to predictions that transcription factors should cause different effects at
different doses. The biophysics of transcription factor binding make it reasonable to imagine
that the regulatory sites that a factor might need to bind in two different cell type-specific
genes might have evolved to require different concentrations of the factor per nucleus in
order to be engaged effectively. However, surprisingly, the evidence from the well-studied
invertebrate embryos is ambivalent about dosage sensitivity (25, 26). Although the
boundaries of expression of individual genes can be sensitive to different levels of a
transcription factor, embryogenesis as a process seems to compensate, making it robust to
substantial changes in absolute transcription factor activity levels so long as the right
Rothenberg et al. Page 4
Immunol Rev. Author manuscript; available in PMC 2017 May 01.
Author M
anuscriptA
uthor Manuscript
Author M
anuscriptA
uthor Manuscript
relationships are maintained between levels at different parts of the embryo. What
establishes the boundaries between cell types is not the absolute level of a transcription
factor, then, but the gene network relationships between one part of the embryo and another,
i.e. the ability of a repressor for genes of a particular cell type to be activated in one domain
while the right combination of activators is turned on elsewhere.
Thus, the spatial subdivisions that are important for such embryogenesis programs use
combinatoriality and gene network architecture to define a sequence of Boolean rules to
generate an organized, diversified embryo. These rules are robust to considerable noise in
absolute gene expression levels. This gives embryonic systems the ability to activate a
massively diverse set of genes accurately in different parts of the embryo with precisely
coordinated timing, despite the dependence of different cell types on different factors. This
mechanism ensures that when a migrating mesenchyme cell is eventually brought into
contact with a different cell type, it will be ready to receive and the other cell type will be
ready to deliver the signals needed to trigger the next step of differentiation.
Duels between “Master Regulators”
A very different view of cell type specification has come from a “bottom up” approach to
characterizing lineage identity, and from the precedents set by binary fate choices in
microbial systems (27, 28). In this “master regulator” model, there is an option for much
more cell-to-cell diversity in fate choice and in the timing of fate decisions even within an
initially equivalent precursor population.
When terminally differentiated cells execute their specific gene expression programs, there
are often a small number of transcription factors that work on many of the cells’
characteristic set of genes in parallel. Whereas the actual cis-regulatory systems of these
differentiation genes can receive inputs from multiple transcription factors, some of them
fairly broadly distributed, attention is usually focused on the handful of factors that drive
cell-type specific genes and are themselves most narrowly expressed in the cell types of
interest. Then, any gene expression that depends on those factors is inferred to be the result
of the factors’ “Master Regulator”1 functions. The simplification possible when seeing the
world through a lens of a few “master regulators” can be enticing. Even more attractively,
some “master regulators” appear to be capable of positive autoregulation, while the “master
regulators” of some differentiation programs appear to be able to antagonize the action of
transcription factors that are viewed as “master regulators” of alternative differentiation
programs; the Thpok (Zbtb7b)--Runx3 antagonism governing CD4/CD8 T cell maturation
lineage choice provides a good example (rev. by (29–31)). Thus with a very small number of
key molecular actors, far fewer than in a comprehensive gene network, there is the prospect
of explaining both expression of one differentiated fate and exclusion of an alternative
differentiated fate.
1“Master regulator” is in quotes throughout because in molecular terms, none of these transcription factors work in isolation or override the context in which they are expressed. Authors refer to them as “master regulators” in some cases to emphasize their functional contributions to the processes in which they participate, and in other cases to propose a deliberately simplified model of those processes.
Rothenberg et al. Page 5
Immunol Rev. Author manuscript; available in PMC 2017 May 01.
Author M
anuscriptA
uthor Manuscript
Author M
anuscriptA
uthor Manuscript
The examples of such potent regulatory factors with simple circuits of interactions between
them have prompted creation of models in which developmental choice is based on a
proposed duel between the contending “master regulators” (32–34). This kind of model is
very easy to convert into systems of differential equations, which makes such a model
appealing across disciplines. The solutions to these systems of equations predict a state
space defined by the levels of these two regulators with dynamically stable and unstable
nodes resulting from their cross-regulation. Such state space diagrams have a canonical
form, and predict that cells must ultimately be driven to a state in which one or the other
“master regulator” dominates; the main difference among various versions is how long a cell
is likely to persist in the region outside of these extremes. Note that these aspects of the
model can be accurate representations of “lockdown” machinery that maintains lineage
fidelity in the committed, differentiated states, no matter how the cells arrived at them. Note
also that such models incorporate a stochastic element that allows substantial asynchrony
between different cells in a population in their transitions to irreversible fates.
However, with such a model in hand, it is often gradually suspected that there is a stage of
real development that corresponds to the unstable equilibrium between the two “master
regulators”. The model predicts that such a cell type would be perfectly bipotent, and that
the real developmental choice is based on the contest between the two factors in the cell to
drive it to one of the stable end states. Interestingly, the idea of a perfectly bistable switch
imposes on this single-cell decision the binary choice bias that is also common in embryonic
systems, where for completely understandable reasons cell fates frequently segregate at
mitosis (e.g. because one daughter cell remains near a signal source while the other is
separated from it). The idea that metastable precursors exist that express low levels of the
regulators of more than one fate has been supported by early evidence of multi-lineage
priming in hematopoietic precursors. However, note that the (widespread) assumption that
there should be two alternative fates in contention is not precisely required by the biological
evidence. From hematopoietic multipotent progenitors to their differentiated descendants,
there is no evidence for any particular mitosis at which the two daughter cells are required to
adopt different fates, in contrast to the embryonic cases. Furthermore, since mitosis does not
play the role here that it does in canonical embryonic cleavages, the only reason the
alternatives can be assumed to be only two is because of a choice to include only two
“master regulator” transcription factor genes in the model.
Key differences between gene networks for type I embryonic and dueling “master regulator” models
The cardinal features of these two kinds of models have implications for the relationship
between gene network architectures and the biological phenomena that the network models
seek to explain. Table 1 summarizes points of comparison between them. The features
optimized by the type I embryo system are to increase complexity with precise timing and
predictable cell-fate assignments. The source of the steadily increasing complexity comes
from the combinatorial logic that is the rule, not the exception, for gene expression. That is,
these early embryos require each newly expressed regulatory gene to be activated by a new
combination of several transcription factors that were already activated in intersecting but
different regions of the embryo. The precision of timing comes from a well-defined time
Rothenberg et al. Page 6
Immunol Rev. Author manuscript; available in PMC 2017 May 01.
Author M
anuscriptA
uthor Manuscript
Author M
anuscriptA
uthor Manuscript
zero point (fertilization of a mature oocyte), and from the observation that there are few if
any initial silencing mechanisms to be overcome. This means that target genes rapidly
respond once the correct combination of trans-acting positive regulators is available in a cell.
The precision of fate assignments comes from the potency of negative regulators where they
are present. In these embryonic systems, repression generally trumps activation in a
noncompetitive way. Spatial patterning-associated repressors abort target gene expression in
their domains, even if activators are present at high level (18).
By contrast, the dueling repressor models apply best to more terminal differentiation
decisions when two alternative end states are already defined by the reciprocal actions of
two alternative transcription factors, and where it does not matter precisely which fate is
adopted by which cell. Combinatoriality is explicitly left out of these models in which the
two “master” factors are used to account for the whole response. Indeed, the only genes of
interest that must respond to more than one regulator in these models are the genes encoding
the factors themselves. Unlike the embryonic models, the entire dynamic response of the
system is highly dose-dependent as well as noise-sensitive, because of the simplicity of the
regulatory inputs. At high levels of the factors, the one with higher effective activity wins all.
At low levels of both factors, the system can remain balanced in a bipotent state, but
unstable regulator expression accelerates the transition to differentiation in either direction.
The ability of the alternative transcription factors to repress their antagonists’ positive targets
may be included but need not be absolute, because the two factors will repress each other.
Thus, quickly or slowly, the winning factor will starve the alternative factor’s targets of their
positive inputs. An often-overlooked corollary of this kind of model is that it is strongly
influenced by relative doses of the two factors but becomes dosage-insensitive as each factor
approaches dominance. Because winning also allows a factor to increase its own expression,
each individual factor must coherently keep driving the developmental system to the same
endpoint as its own levels increase.
Key elements of both kinds of models can be found in early T-cell development, but there
are sharp divergences from the assumptions of both model types as well.
T cell emergence seen from perspectives of established developmental
models
Pathways, stages, and major factors: overview
Hematopoietic differentiation from stem cells in postnatal mammals is a multi-outcome,
branched developmental system. Most of the developmental options are implemented in the
bone marrow, where there are likely to be different local signaling environments that foster
different outcomes, but these are still anatomically somewhat obscure. The thymus is an
outstanding exception, since cells that are to become T cells almost always need to
immigrate to the thymus from the bone marrow through the blood. The thymus provides a
specialized architecture to guide T cell development of the precursors through migration
through a sequence of distinct anatomical domains. Because there are very few cells taking
non-T cell developmental fates in the thymus, the analysis of thymocytes over the years has
provided a very fine-grained picture of T-cell developmental stages, characterized by
Rothenberg et al. Page 7
Immunol Rev. Author manuscript; available in PMC 2017 May 01.
Author M
anuscriptA
uthor Manuscript
Author M
anuscriptA
uthor Manuscript
different surface markers, gene expression patterns, cell cycle behaviors, T-cell receptor
(TCR) gene rearrangement statuses, and intrathymic locations (35–37). Because the cells are
viable and functional upon transfer to host mice, thymic organ cultures, or stromal co-
cultures that mimic the thymic microenvironment, it has also been possible to characterize
the different stages of thymocyte development in depth in terms of developmental potential
at each stage and developmental kinetics of transition to the next stage.
These stages and their relationships are shown in Fig. 1A. Here are defined [i] the early
intrathymic precursor “ETP” stage, [ii] the immediately precommitment DN2a stage
(DN=double negative for mature T-cell coreceptors CD4 and CD8), [iii] the newly
committed DN2b stage, [iv] the DN3a stage that is the first major period of TCR gene
rearrangement, [v] the DN3b, DN4, and Immature Single Positive stages when cells
proliferate vigorously following the first successful TCR locus gene rearrangement, and
finally [vi] the DP (CD4, CD8 double positive) stage when the second TCR locus is
rearranged and successful cells for the first time express their final TCR recognition
specificity. The DP stage is the point of departure for differentiation all the later effector
subsets of T cells using the αβ form of the TCR, and considerable work is dedicated to
understanding the mechanisms involved in those branching pathways. That later set of
lineage specializations is outside the scope of this review. However, the identity of the cells
as T cells of one kind or another is set by the end of DN3 stage (Fig. 1A).
In postnatal mice, the whole T-cell pathway emanates from a multipotent precursor that still
has the ability to give rise to natural killer cells, at least one or two additional types of innate
lymphoid cells, B cells, dendritic cells, granulocytes, and macrophages, and to some extent
also mast cells. The relationships of cells with this combination of potentials to other
hematopoietic cells are shown in Fig. 1B. The thymus-settling precursors are closest to the
Lymphoid-biased Multipotent Precursors and the Common Lymphoid Precursors, i.e.
uncommitted intermediates with a strong preference for lymphoid fates in vivo but a latent
capacity to adopt myeloid fates in vitro. These adult progenitor cells are thought to have lost
erythroid and megakaryocytic potential at an earlier stage. As noted above, it is still
controversial whether other precursors may exist that maintain erythroid and granulocyte/
macrophage potential but lack lymphoid potential; cells with these features are most evident
in early fetal liver before the emergence of true hematopoietic stem cells. But the connection
of lymphoid and myeloid fates is the one that needs to be resolved for T cell development.
Key regulatory factors that are known to be differentially important in these pathways are
introduced in Fig. 1A and discussed further below. Importantly, the thymus provides a clear
extrinsic signal to trigger T cell development, activating the Notch pathway by interaction of
the Notch ligand Delta-like 4 on the thymic stroma with Notch1 molecules on the surfaces
of the immigrant precursors and their immediate descendants. Although Notch pathway
activation is not unique to the thymus, the thymus provides a particularly strong Notch
signal in the context of cytokines that support lymphocyte proliferation and developmental
progression. Notch signaling creates a specification mechanism that converts the cells from
multipotency to committed pro-T cells, and then the committed state becomes Notch-
independent.
Rothenberg et al. Page 8
Immunol Rev. Author manuscript; available in PMC 2017 May 01.
Author M
anuscriptA
uthor Manuscript
Author M
anuscriptA
uthor Manuscript
Explanation of T cell specification by a “Type I embryo” model: combinatorial definition of identity
To think about a stem-cell differentiation process using terms developed for embryonic
differentiation, it is convenient to consider lineage choice to be the equivalent of spatial
demarcation of distinct embryonic territories. Thus, the identity of the cells like the identity
of the embryonic territory depends on the overlap between positive regulatory inputs to the
cell type gene network, and the exclusion of negative regulatory inputs. T cell differentiation
from ETP stage to DP stage depends on a collection of disparate transcription factors, each
with its own expression profile. Myb, Runx1 with its partner CBFβ, and Ikaros combine
with GATA-3, TCF-1 (encoded by Tcf7), Gfi1, Bcl11b, some representation of Ets1-
subfamily ETS factors (“E26 transformation-specific”, a large family with many members
expressed), and strong, unencumbered activity of E protein dimers, either E2A-E2A
(encoded by Tcf3) or E2A-HEB (encoded by Tcf12). The factors that need to be excluded
are EBF1 and Pax5, which would otherwise divert the cells to B-cell lineage; antagonists of
E protein dimers like Id2, which would promote an innate lymphoid type fate; and C/EBP
factors and PU.1, which would otherwise promote neutrophilic granulocyte or macrophage
fates (C/EBP factors and PU.1) and dendritic-cell fates (PU.1). Other factors that probably
need to be excluded are Irf8, a key participant in macrophage, B-cell, and dendritic-cell
development; factors involved in erythroid and megakaryocytic development; and factors
that would otherwise promote self-renewal in a multipotent state. Thus, the prediction would
be that if the right combination of factors could be established in a hematopoietic precursor,
it would become a T cell.
In reality, the triggering and execution of the T-cell developmental program depend on
Notch pathway signaling. This is needed directly to activate Tcf7 at least, and probably also
to help activate Gata3 and Bcl11b, to optimize the levels of Runx1 expression, and to induce
repressors like Hes1 that silence Cebpa. However, this signal is not a stable component of
the regulatory state mix. Notch responsiveness cuts off before the DP stage, and once
induced, most of the regulatory genes that contribute positively to the T-cell program sustain
maximal levels of expression even when Notch signaling is withdrawn. This can be viewed
as a classic case of the kind of embryonic circuitry that “transforms transient spatial
regulatory inputs into stable regulatory state” (2, 38). The conversion from Notch-
dependence to Notch-independence in this kind of model would arise from the positive
regulation that the Notch-induced regulatory genes provide for each other which collectively
renders the Notch input dispensable.
There are two large questions in using this kind of formalism to explain the T-cell
developmental process. First is to explain how the thymic microenvironment can cause the
right combination of factors to be expressed in the hematopoietic progenitor cells with other
factors excluded. Lacking organized spatial axes along which different signaling cues can be
provided in complex anatomical crossing patterns, the thymic stroma mainly seems to
provide the single, repeated Notch signal. Thus, the developing T-cell progenitor needs to
respond to Notch with its own intracellular cascade of successive, new regulatory states to
enable this simple input to affect the levels of so many regulatory genes, considering that
these genes otherwise have disparate expression patterns. The second question is whether the
Rothenberg et al. Page 9
Immunol Rev. Author manuscript; available in PMC 2017 May 01.
Author M
anuscriptA
uthor Manuscript
Author M
anuscriptA
uthor Manuscript
predicted combination of transcription factors really is necessary, or really is sufficient, to
create a T-cell identity. Is it the simple presence of the right combination of factors, or the
cell’s achieving the right relative levels of this combination of factors, or the order in which
the right combination of factors is induced to work, that generates T-cell identity? The
identifications of a collection of required factors and a collection of factors to be excluded
still leave some distance to the answers to these questions.
Explanation of T cell specification by a “dueling master regulators” model: defining the sequence of binary choices
In a dueling regulator model each choice is seen as binary, and hematopoietic stem cells
generate far more than simply two cell types, as described in more detail below. Therefore,
by this kind of model the T-cell pathway must emerge from a succession of binary choices,
each governed by a different regulatory antagonist pair. As discussed in more detail in the
next section, this view fits well with the classic hematopoietic lineage diagrams that
dominated the literature until about 2005 (39), where the hematopoietic stem cell would first
commit to a lymphoid vs. erythromyeloid fate (choice 1), followed by a subdivision of B
from T and NK and/or a subdivision of NK from B and T (choice 2), and then followed by
the separation of T cell fate from either an NK or a B cell alternative (choice 3). Crucial
antagonist pairs in this scheme could include Ikaros as the pro-lymphoid factor with E
proteins vs. Id2 in the (B or T) vs. NK choice, and GATA-3 vs. EBF1 in the T vs. B choice.
A modification of the model would still work with the revised lineage diagrams more widely
accepted from 2005 onward that first separate erythroid/megakaryocyte precursors
(GATA-1+) away from a lymphomyeloid precursor (PU.1+)(40–44). Only then would
lymphoid progeny be separated from myeloid progeny of the lymphomyeloid precursor, by
antagonism of “myeloid” C/EBPα by “lymphoid” EBF1 in the B cell case, and by GATA-3
and Runx-mediated silencing of PU.1 in the T cell case.
By a dueling regulator model, the correct analysis of the circuitry of T-lineage choice
depends on the agonist-antagonist regulator pair at the heart of the mechanism. Thus, to
explain T cell specification by such a model, the central issue is to define the most relevant
alternative to T-cell differentiation in the cell immediately before it commits to the T cell
fate. The “master regulator” duel itself can then be validated by showing that the agonist and
antagonist transcription factors actually coexist in the cells before they choose between these
options. Proving whether the system really is bistable at that point then depends on showing
that the factors engaged in the struggle actually do regulate themselves positively, do
antagonize each other’s expression, and do each promote one of the outcomes in the balance
in a monotonically increasing way.
A closer look at the details of T cell specification in the context of hematopoietic
differentiation suggests that both kinds of models incorporate useful elements, but that the
real program uses a distinctive hybrid kind of mechanism.
Rothenberg et al. Page 10
Immunol Rev. Author manuscript; available in PMC 2017 May 01.
Author M
anuscriptA
uthor Manuscript
Author M
anuscriptA
uthor Manuscript
Hematopoiesis: a distinctive terrain for gene networks
A multidimensional landscape of hematopoietic transcription factors
One way to reduce a complex developmental landscape to a form in which dueling master
regulator models can work is to posit that all fates are generated by a hierarchical series of
binary decisions. Indeed, this has been a classic theme in hematopoiesis research. As already
noted, hematopoiesis was long assumed to begin with a split between erythromyeloid and
lymphoid fates, followed by splits between erythroid and myeloid cells and splits between B
and T lymphocytes, then finally myeloid cells were supposed to split between granulocyte
and macrophage fates (39). Dueling master regulator models scored key successes in this
binary choice hierarchy, as the divergence between erythroid and megakaryocytic fates on
the one hand and macrophage and granulocytic fates on the other hand (here termed
“myeloid fates”) could be explained in terms of GATA-1 and PU.1 (32, 45–48). Then, also,
granulocyte vs. macrophage divergence could be explained in terms of relative expression of
C/EBPα and PU.1 (49), using an additional continuous-to-discrete conversion subcircuit of
Gfi1 in opposition to Egr1, Egr2 and Nab2 (33).
The founding model of this kind was the PU.1-GATA-1 relationship, which is thought to
play a key role in the separation between myeloid and erythro-megakaryocytic lineages.
Both PU.1 and GATA-1 are indeed potent positive regulators of these respective fates, and
they both have mechanisms for positive autoregulation and for mutual repression at the
transcriptional level plus protein-protein antagonism. However, through more than 15 years
of intense investigation, it remained controversial whether there is any true common
(erythro-)myeloid precursor in which these factors compete on a level playing field for a
winner-take-all outcome (40, 43, 50–54). Evidence for biased, GATA-1-dominant or PU.1-
dominant precursors is ample, and in the past year single-cell transcriptome analyses
coupled with single-cell fate determination methods have showed that in the great majority
of these supposed bipotent precursors the contest has already been won by one or the other
(55–57). Then in the PU.1-expressing multipotent cells, at least, there is a variety of possible
lymphoid and myeloid developmental options that depend on more than simply PU.1 itself
(58, 59). Evidence from zebrafish embryos shows that the mutual antagonism of PU.1 and
GATA-1 is not hard-wired but actually depends on a transcriptional modulating factor,
Trim33 (Tif-1γ)(60). In mammalian hematopoiesis also, it has been suggested that the
mutual antagonism is not a simple function of PU.1 and GATA-1 themselves, but occurs
primarily when C/EBPα and FOG-1 (Zfpm1) provide “henchman” duties (61). In agreement
with this, multipotent hematopoietic precursors also generate mast cells, the highly robust
and sustainable regulatory state of which excludes FOG-1 and C/EBP factors but requires
stable expression of PU.1 together with GATA-1 and GATA-2 (62–65). Thus, factor-factor
reciprocal antagonism within network circuits is a valuable and potent mechanism for
driving cells to different end states, but in reality more than two factors may be involved, and
thus the decisions may involve more than two potential cell fates.
The ability to use these simple circuits to explain hematopoietic development has been
further challenged as increasing evidence showed most lymphoid cells to branch off from
myeloid cell precursors some time after erythroid potential had been lost or minimized (40,
Rothenberg et al. Page 11
Immunol Rev. Author manuscript; available in PMC 2017 May 01.
Author M
anuscriptA
uthor Manuscript
Author M
anuscriptA
uthor Manuscript
41, 52). This meant that the actual GATA-1-PU.1 choice was between erythro-
megakaryocytic fates and a mixture of lymphoid and myeloid potential. Thus a new binary
choice needed to be postulated to explain lymphoid vs. myeloid divergence. One switch-
determining factor appeared to be C/EBPα, which would be retained in myeloid lineages but
silenced in B and T cell lineages, and in an alternative model Ikaros, E proteins, and Gfi1
were all postulated to work against PU.1 to confer lymphoid identity (66). However, neither
Ikaros, E proteins, nor Gfi1 are unique to lymphocytes, none of them directly repress C/
EBPα (which activates Gfi1 in the macrophage-granulocyte model), and the complexity of
the circuitry required opened new questions. In fact, although C/EBPα is repressed in both B
and T cell precursors, it is not repressed by a common pan-lymphoid mechanism: EBF1
and/or Pax5 silence it in B cells (67, 68), whereas Notch signaling via Hes1 silences it in T
cells (69). Therefore, even the lymphoid-myeloid split needs to be modeled as more than a
binary choice (discussed further below).
Most importantly, expression patterns of candidate “master regulators” themselves do not
fall into the neat hierarchical system of binary exclusions that would be required by a
system-wide use of a dueling regulator model (Fig. 2). A multidimensional picture gives a
clearer representation of the domains of different transcription factors’ actions in
hematopoiesis. In Fig. 2, this is approximated by overlapping colored contours that are
superimposed on a putative lineage tree leading to developmental end states.
One glaring exception to the GATA-1-PU.1 antagonism, just noted, is the existence of mast
cells which depend upon sustained activity of both factors, albeit with lower PU.1 levels
than in mature macrophages. Dueling regulator models predict that cells can exist with low
levels of both antagonists, but they predict that such cells should be developmentally
unstable. By contrast, mast cells are not only stable but also capable of maintaining their
phenotype through many generations of proliferative expansion. Also relevant are the classes
of granulocytes that use GATA-1 and/or GATA2 along with PU.1 and high levels of C/EBP
factors, such as eosinophils and basophils (64, 70, 71)(Fig. 2). If the separation between
erythroid cells and myeloid cells involves a decisive choice between silencing GATA-1 and
silencing PU.1 and/or C/EBPα, then the origin of these cells is obviously problematic – do
they emerge before or after the split, or do they have some special mechanism to reactivate
the silenced master regulators in the presence of the others? The potential compatibility
between GATA factors and myeloid factors is strikingly underlined by results of
manipulating developmentally arrested mutant pro-B cells. Here, despite the lymphoid-
biased context, GATA factor introduction not only fails to protect the cells from direction to
myeloid fates, but actually promotes conversion to myeloid fates, acting similarly to C/
EBPα (72).
The domains of action of these transcription factors obviously intersect each other in
different combinations across the diagram. It is also evident that the biological system
exploits the freedom of this combinatoriality, often violating hierarchy, to specify multiple
distinct cell types with a minimal number of different factors in play. This requires a
network with greater complexity in its drivers than a simple succession of “master-regulator”
duels.
Rothenberg et al. Page 12
Immunol Rev. Author manuscript; available in PMC 2017 May 01.
Author M
anuscriptA
uthor Manuscript
Author M
anuscriptA
uthor Manuscript
Lineage-specific ordering of developmental fate exclusions
Cell fate choices may depend on cross-regulation between different potent transcription
factors, but again the fate decisions do not fall into a strict hierarchy. Indeed, it appears that
cells expressing C/EBP factors have access to fates that depend on this factor, such as
neutrophil, macrophage, basophil or eosinophil fates, while those that express GATA-1 have
access to erythroid, megakaryocytic, eosinophil, basophil, or mast cell fates. Lymphocyte
precursors express none of these. However, the order in which lymphocyte fates subdivide as
compared to the order in which they separate from macrophage, granulocyte, and dendritic
cell fates is surprisingly dependent on the fate chosen.
Precursors of both B and T cells have been examined in detail by flow cytometric separation
followed by single-cell assays of developmental potential in broadly permissive conditions
in vitro, as well as by transfer to adoptive hosts in vivo (Fig. 3). In the B cell pathway,
myeloid potential is excluded quite early, whereas for another stage or two B cell precursors
still appear to be able to give rise to T cells if exposed to inducing Notch ligands (73–75).
Thus, from the B lineage vantage point, myeloid potential is apparently lost before the
bifurcation of the B and T-cell branches. However, in the T-cell lineage, this order is
reversed. Access to at least some myeloid fates continues for multiple cell divisions after
entry into the thymus, and through the ETP to DN2 transition: DN2a pro-T cells can be
trans-differentiated into macrophages, granulocytes, or dendritic cells simply by changing
the culture conditions (44, 76–83). However, T-cell precursors lose B cell potential much
earlier, within a very short time after arriving in the thymus, and despite the cells’ still
retaining obvious myeloid potential (79, 80, 84–87). From the T-cell precursor perspective,
then, lymphoid lineage bifurcation between B and T cells becomes cell-intrinsic even before
the split between lymphoid and myeloid fates (Fig. 3).
The discrepancy is not a contradiction; it simply shows that exclusion of a given fate
alternative (a repressive mechanism) is carried out by a different mechanism than initiation
of progress toward another fate alternative (an activating mechanism). B cells block the T-
cell pathway only after they begin to express their own distinctive regulators, EBF1 and
Pax5, which inhibit Gata3, Tcf7, and even the expression of the Notch1 signal receptor that
would be required to activate either one. To exclude the myeloid fates, different mechanisms
are used in most T cell precursors, which can simply turn off PU.1, than in B cell precursors,
which must exclude myeloid development despite continuing to express PU.1. (It is
interesting to speculate whether any of the rare pro-B cells that can be converted to T-cell
precursors in vitro would transiently regain access to dendritic-cell or myeloid pathways in
the process, but this would be difficult to test.) Most cells have to start down either a Notch-
influenced T-cell pathway or a Notch-averse B cell pathway before it is clear which tool they
can use to jettison their heritage of myeloid potential.
In general, a cell can remain in a single lineage path due to a combination of intrinsic and
extrinsic factors, so that the dominant role of Notch signaling in T-cell development and the
differential expression of myeloid-potentiating factor PU.1 gives B and T cells different
options (Fig. 4). B and myeloid cells share the strong regulator PU.1 throughout B cell
maturation, but require different dosages of PU.1 for their differentiation (88, 89). B cells
sharply reduce PU.1 expression levels at the beginning of their development from
Rothenberg et al. Page 13
Immunol Rev. Author manuscript; available in PMC 2017 May 01.
Author M
anuscriptA
uthor Manuscript
Author M
anuscriptA
uthor Manuscript
multipotent precursors (58), possibly even preceding their expression of EBF1 and Pax5.
Cells becoming pro-B cells from fetal liver appear to escape the mechanism that allows PU.1
to regulate itself positively (90–92), and developing B cell precursors can also dilute out
higher levels of PU.1 from their precursors by maintaining a rapid rate of proliferation
throughout specification: this is important because the PU.1 protein itself is very stable(58).
It is known that different PU.1 regulatory sites are open in a pre B cell line than in a
macrophage cell line or mature macrophages (91). It has been argued that a key negative
regulator of PU.1 is Ikaros (66), although this is not consistent with all progenitor-cell gene
expression data (93). Indeed, in B lineage cells Ikaros acts to repress PU.1 although in
myeloid cells it can cooperate in upregulating PU.1 (90). PU.1-driven myeloid development
might still pose a threat to B cell lineage fidelity until C/EBPα is fully silenced by EBF1 and
Pax5, but the downregulation of PU.1 is intrinsically controlled. This could help to reduce
detectable myeloid potential in cell transfer assays from an early stage.
By contrast, T cells cannot be specified without Notch signaling, so that in the
microenvironment where B cells normally develop, an intrinsic blockade of T-cell potential
may be optional until much later. The chromatin status of the earliest B-cell and T-cell
signature regulatory genes is also notably asymmetric in the early precursors of the opposite
lineages. In E2A−/− or EBF1−/− pre-pro B cells, the Gata3 and Tcf7 loci are in an accessible
chromatin state similar to their states in ETP pro-T cells, whereas in early T-cell precursors,
both the Ebf1 and the Pax5 genes are maintained in chromatin states repressed by Polycomb
Repressive Complex 2 (H3K27me3).
Developing T cells initially express a considerable level of PU.1, but silence it completely
during lineage commitment (78, 94, 95), approximately 10–14 cell divisions after entering
the thymus (96, 97). Thus these cells have only a short time in which myeloid potential
poses a threat to lineage fidelity. The thymic microenvironment is nonpermissive for
expression of this myeloid potential. First, there is no myeloid-supporting growth factor
present, and second, the extrinsic Notch signals in the thymus not only push forward the T-
cell program but also restrain PU.1 from implementing the myeloid or dendritic cell program
effectively in vivo (98). One aspect of the mechanism is that the Notch-activated factor Hes1
represses C/EBPα expression (69), but Notch signaling also affects the spectrum of genes
regulated by PU.1 in the absence of C/EBPα (99). The persistent myeloid potential is only
visible if the cells are removed from contact with Notch ligand in an experimental
commitment test during these sensitive stages (99–101).
Whereas myeloid alternatives are only a transient threat for developing T cells, T cell and B
cell precursors share their use of Ikaros, Myb, Gfi1, Runx factors, and especially their use of
E proteins and IL-7/IL-7 receptors as major regulators and proliferation signals throughout
their development. The thymus can be a very favorable site for B cell development except
where cells can receive Notch signals by direct contact with Notch ligands: Notch1−/−
precursors generate B cells abundantly in the thymus (102). Thus, when B-cell potential is
blocked early in mammalian T-cell precursors (86, 103, 104), it is tempting to speculate that
this is not only to maintain lineage fidelity but also to make sure T-cell precursors do not
need to compete for the local supply of IL-7 (105–107). Imposing this block intrinsically is
seen to be one of the earliest events in T-cell development, and it is mediated at least in part
Rothenberg et al. Page 14
Immunol Rev. Author manuscript; available in PMC 2017 May 01.
Author M
anuscriptA
uthor Manuscript
Author M
anuscriptA
uthor Manuscript
by the Notch-dependent induction of GATA-3 which then maintains B lineage exclusion
even when Notch signals are withdrawn (84, 85). The reason B and T cells need to exclude
different fate options in this piecemeal way is precisely because their precursors do not first
pass through a binary choice at which all nonlymphoid fates are excluded.
Dose dependence and diverse mechanisms of dosage control
The definition of cell type by various mixtures of overlapping transcription factors is more
consistent with the multiple-input combinatorial mechanisms of territorial patterning in the
“type I embryo” models than with the binary fate subdivisions that would emerge from
“dueling master regulator” models. However, one aspect of the hematopoietic system stands
out in contrast to the models used to explain boundary formation in embryos. Transcription
factors have highly dose-sensitive effects in hematopoietic fate choice; they do not work in a
simple digital way. The preceding section referred to the need for B cells to keep PU.1
expression at much lower levels than those needed for this same factor in myeloid
development. Lineage-specific and stage-specific dose restrictions for a given factor in
different contexts are not exceptional but common in mammalian postnatal hematopoiesis.
In marked contrast to the model systems in which embryonic development has been
dissected genetically, in mammalian hematopoiesis transcription factor activities are
frequently haplo-insufficient, with altered development resulting from even a small twofold
change in expression. Stem cell establishment and self-renewal are sensitive to
heterozygosity in Runx1 (108, 109) and Gata2 (110), all dendritic cell development and
choices between macrophage vs. granulocyte development are sensitive to PU.1
heterozygosity(49, 111), generation and stability of B cells are sensitive to heterozygosity in
EBF1 particularly when combined with heterozygosity in E2A, Runx1, or Pax5 (112–114),
and early T cell development is sensitive to twofold dosage reductions in GATA-3 (84, 115,
116).
This dose dependence implies, first, that positive regulation of cell lineage features (and
survival) depends on transcription factor binding to non-optimal sites at key loci, where
binding is not saturated easily; and second, that the ability of one transcription factor to
repress the major regulator of a competing program is likewise graded and incomplete. A
clear example is the effect of modest reduction in GATA-3 expression in the early T cell
precursors that coexpress GATA-3 with PU.1: reduced GATA-3 expression leads quickly to
upregulation of PU.1 levels, implying that GATA-3 is already damping down PU.1
expression but in a weak, concentration-sensitive way. These weak cross-regulatory effects
and the dose-dependence that pervades the system are features that are not common in
deterministic embryonic systems, although they are accommodated in the dueling master
regulator models within the range of expression levels where the ultimate winner is not yet
decided.
Dosage differences can result from many mechanisms besides heterozygosity for a
functional gene, or changes in the activity of an upstream regulator. A recent addition to the
list of mechanisms for graded dosage control came from analysis of the dynamics of PU.1
expression in multipotent progenitors (58), a population which in principle contains the
precursors of macrophages, granulocytes, B cells and T cells, all of which will go on to
Rothenberg et al. Page 15
Immunol Rev. Author manuscript; available in PMC 2017 May 01.
Author M
anuscriptA
uthor Manuscript
Author M
anuscriptA
uthor Manuscript
regulate PU.1 in clearly divergent patterns (Fig. 4). These cells initially express high levels
of PU.1, but as they differentiate, two different regulatory mechanisms combine to drive PU.
1 levels higher or lower in different progeny types. One is the maintenance or termination of
PU.1 autoregulation. The myeloid descendants of the progenitors maintain positive
autoregulation of PU.1 (Spi1 gene) expression mediated through at least three different site
clusters in the Spi1 cis-regulatory system (91, 117), and their absolute rates of Spi1 transcription are constant at a high level. The B lymphoid descendants, on the other hand,
lose sensitivity to autoregulation and reduce their own absolute rates of Spi1 transcription by
nearly an order of magnitude. (Introduction of exogenous PU.1 does not appear to
upregulate transcription from the endogenous locus in these cells, although this is hard to
prove because many developing B cells are killed by excess PU.1.) Another mechanism is
needed, however, to increase PU.1 activity from the level in the precursors to the level
needed for macrophage maturation, and the surprise is that this mechanism is not
transcriptional. Instead, it depends on the fact that PU.1 protein in these cells is extremely
stable, to the extent that a major contributor to its turnover function in a cell is not actual
decay but rather the dilution caused by cell division. Because of this stability, PU.1 levels
can be increased in cells that maintain a constant rate of PU.1 synthesis simply by slowing
the cell cycle (58). In the cells becoming macrophages, PU.1 itself promotes a cell cycle
lengthening, in part by reducing the expression of Myc and Myb. However, this mechanism
can be manipulated experimentally, with the same cells adopting macrophage or non-
macrophage fates depending upon whether they are allowed or encouraged to slow their cell
cycles or not (58).
Making cell cycle control a regulatory input as well as a simple effect of other factors is an
important change of perspective. Interestingly, cell cycle control as an input to
developmental decisions is reminiscent of the highly regulated cell cycle timings and
geometries of embryos, but in the hematopoietic case it is being used in a cell autonomous,
geometrically random, stochastic way very different from the rules in embryos. An
important corollary of this mechanism is that the ratio of long-lived factors like PU.1 to
short-lived factors such as C/EBPα in the cell nucleus should be extremely sensitive to cell
cycle length changes, without change in their transcription rates, because the relative
contributions of mitotic dilution to their protein steady state accumulations should be so
different for the two proteins. Thus any third factor that affected cell division rates could
dominantly alter the balance between two other factors, affecting cell fate in a dose-sensitive
system like hematopoiesis, even when their synthesis rates remain the same. Furthermore, as
single-cell RNA-seq analysis has been used to dissect stem and progenitor cell populations,
it has become increasingly clear that differential expression of cell cycle genes is a major
criterion of functional distinction (118). The role of cell cycle length control in
developmental choice may help to distinguish different kinds of stem cells too.
Cytokine dependence and cell fate: cell cycle arrest and death for commitment and boundary formation
Cell cycle control in hematopoiesis is clearly dependent on microenvironmental conditions,
especially the availability of appropriate cytokines. Thus the ability to read out any of the
gene network control circuitry that is influenced by cell cycle length and continuation will
Rothenberg et al. Page 16
Immunol Rev. Author manuscript; available in PMC 2017 May 01.
Author M
anuscriptA
uthor Manuscript
Author M
anuscriptA
uthor Manuscript
perforce be microenvironment-dependent. A fundamental aspect of differentiation along
each hematopoietic pathway is the activation of distinctive lineage-specific cytokine
receptors that will become essential for progenitor proliferation and survival along that
pathway. It is well understood that the potentials of different progenitors will not be read out
accurately if some of the key growth factors needed by certain classes of descendants are not
included in the assay conditions, because those descendants will not expand or survive.
However, the ability to proliferate also enables cells to shift from one regulatory state to
another by diluting away prior transcription factors and prior chromatin marks. In a key
transition of T-cell development, β-selection, the clearance of immature characteristics only
occurs normally if the cells are able to undergo a full extent of proliferation (usually >5 cell
cycles)(119, 120). By the same token, when cell division stops, it enables terminal states to
be stabilized by reducing chromatin state changes and allowing transcriptional regulators
like PU.1 to accumulate.
Cytokine dependence does more than control the extent of clonal expansion of precursors. It
is also used in hematopoiesis as a mechanism for enforcing lineage fidelity of a cell’s gene
expression pattern. One aspect of this is the positive feedback circuitry connecting cytokine
receptors to the transcription factors important to promote the receptors’ expression. An
elegant example is the ability of PU.1 to drive the expression of two growth factor receptors,
GM-CSF receptor (Csf2ra/Csf2rb) and M-CSF receptor (Csf1r), which upon ligand binding
transduce signals that feed back to stimulate transcription of Spi1 (PU.1 coding gene)(121,
122). Another example, from B cell development, is the ability of IL-7R dependent signals
to enhance expression of EBF1, which then reciprocally helps to sustain IL-7R expression
(123–127)(although also see (128)).
But cytokine receptor dependence does not simply enhance growth: it can also set the
boundary between regulatory states of permitted cell types, by creating a no-man’s land
between them. Interestingly, when a cell is shifting from one developmental state to another,
it not only gains responsiveness to a new cytokine, but also can lose responsiveness to the
cytokine that had been supporting it till then. Typical cases are the losses of sensitivity to
Kit/Kit ligand (Stem Cell Factor) signaling during lineage commitment in both early T cells
and early erythroid cells (78, 129, 130). The stringency of this regulation is shown in
experiments where a developing cell is perturbed by the forced expression of a transcription
factor used in another lineage. If the growth factor environment is unchanged, then very
commonly there is severe mortality in the transduced cells (100, 131, 132). This can occur
within a day or two, even before the cells lose expression of their previously supportive
growth factor receptors from the cell surface, and the death can substantially mask any
transdifferentiation effects of the introduced factor. However, many of the
transdifferentiating cells can be rescued simply by shifting the cells quickly into a different
growth factor environment matching the one in which the introduced factor usually works
(101), or more neutrally, by adding a Bcl2 transgene without changing the growth factor
environment (95, 99, 100, 132). Then transdifferentiating cells with inter-lineage phenotypes
at the single-cell level become readily detectable.
The implication is that in vivo, the integration of cytokine receptor functional pathways into
particular cell lineage programs act as a quality control to make any improperly specified
Rothenberg et al. Page 17
Immunol Rev. Author manuscript; available in PMC 2017 May 01.
Author M
anuscriptA
uthor Manuscript
Author M
anuscriptA
uthor Manuscript
cells nonviable. Generation of cells with abnormal cytokine signaling behavior is a sensitive
indicator of an abnormal regulatory state, and may immediately condemn the cell to die,
unless its microenvironment dramatically changes. Note that this process can be seen as the
equivalent of an auxiliary cell-type boundary formation mechanism. If cells with defective
fate specification can simply be killed by their loss of response to survival promoting
cytokines, there is no need to make the specification process itself perfect.
Thus, cytokine dependence as an integral aspect of fate determination enables the system to
dispense with the need for the sharp, dominant repression machinery of embryonic systems.
It opens the ability to use damping repression primarily, which tunes regulator levels
quantitatively. This makes possible transcription factor dosage control to specify an
increasing diversity of cell types, while allowing the system as a whole still to generate
strikingly efficient and coherent differentiation decisions.
T-cell specification: something old, something new, something borrowed
An inheritance of multipotent precursor transcription factors in early T cells
The migration of T-cell precursors to the thymus before commitment means that the most
immature thymocytes at any given time provide a clear early view of cells that are fated to
become T cells eventually, long before they express many T-cell genes yet. This opportunity
is rare as compared to precursors of other hematopoietic cell lineages, mixed together in the
bone marrow or fetal liver, which often cannot be recognized as such until after they begin to
express a distinctive lineage-specific gene expression program. In T cell precursors, perhaps
uniquely, it is possible to distinguish the initiation of the developmental program from its
culmination.
Molecular and functional characterization of T-cell precursors has shown that early T-cell
precursors at ETP and DN2a stages maintain expression of a variety of stem and progenitor-
associated regulatory genes. Some of the factors encoded by these genes remain essential
parts of the T-cell gene network and are either sustained or upregulated, e.g. Myb, Runx1,
Ikaros, and E2A. Others of these factors are expressed, apparently through as many as ten
cell cycles, and then silenced as the cells commit intrinsically to a T-cell fate (36, 96). This
early-expressed set of factors has been labeled “phase 1 regulators” and is enriched for
transcription factors that would cause acute lymphoblastic leukemia if not repressed
efficiently, such as SCL (Tal1), Lyl1, Lmo2, Mef2c, Bcl11a, Hhex, Erg, and Mycn, and the
growth factor receptors Kit and Flt3. The myeloid-promoting factor PU.1 and the erythroid-
linked factor Gfi1b are also expressed like Phase 1 genes, with robust expression in early T
cell precursors, although less directly associated with leukemia. PU.1, like Bcl11a and
several of the other phase 1 factors, is a clear holdover from the lymphoid-biased
multipotent precursors found in the bone marrow (43, 133, 134).
This load of prior regulatory apparatus might be assumed to promote self-renewal with
continuation of the multipotent state. However, it is flexible enough to permit induction of a
new program, the T-cell development program, under the influence of Notch signaling and
IL-7/IL-7R signaling in the thymic microenvironment.
Rothenberg et al. Page 18
Immunol Rev. Author manuscript; available in PMC 2017 May 01.
Author M
anuscriptA
uthor Manuscript
Author M
anuscriptA
uthor Manuscript
Understanding the role of the phase 1 factors is still incomplete, but several examples are
now in hand. The factors implicated in T-cell leukemia are thought to be involved normally
in some of the initial proliferative expansion that the ETP and early DN2a cells undergo
before lineage commitment, even though the exact target genes are not identified. The proto-
oncogene Lyl1 also plays a needed positive role in activating expression of at least one other
important T-cell gene, the zinc finger factor Gfi1 (135). Our own evidence focuses on PU.l,
which is not only a myeloid “master regulator” but also a factor important to maintain
survival, lineage identity, and growth factor receptor expression in multipotent
lymphomyeloid precursors, macrophage precursors, and dendritic cells.
In early T cells, PU.1 is important to arm the cells for optimal proliferation, and PU.1
protein binds to a large fraction of active regulatory sequences in the cells, but its roles are
complex (136, 137). First, in a muted version of the binary competition model, PU.1
dampens the intensity of Notch pathway signals, while at the same time the presence of
continuing Notch pathway stimulation restrains PU.1 from activating a myeloid program
(99). The “soft” mutual antagonism between PU.1 and Notch signaling is still being
dissected in terms of mechanism, but it has the consequence that when PU.1 is finally
silenced during commitment, one of the systemic impacts is an increase in most Notch target
gene expression (136). Second, PU.1 drives expression of a fascinating set of cell biology
genes likely to be involved in chemokine response, G protein coupled receptor signaling,
and cytoskeletal dynamics, which may be important specifically in the early intrathymic
migrations of the precursor cells. Third, at the same time, PU.1 cross-regulates other phase 1
transcription factor genes, sustaining some (Bcl11a, Lmo2, Mef2c) and damping down
expression of others (Erg, Mycn, Gfi1b, Kit) (99, 136). Finally, it is possible that PU.1 in the
precommitment stages of T-cell development acts as a pioneer factor to open certain sites for
later-dominant factors that will contribute positively to T-cell differentiation, like Ets1 (138).
The split impact of PU.1 on other phase 1 genes is an important feature of the T-cell system.
It shows that the progenitor-associated regulatory genes are themselves responding to
multiple positive and negative regulatory inputs in a balanced progenitor state. The
persistence of this pattern through multiple cell cycles seems inconsistent with a dueling
regulator model. The limits of PU.1’s “master regulator” activity in the T-cell pathway are
also evident from the fact that several of the genes most responsive to PU.1, including
regulatory genes Mef2c and Lmo2, are downregulated at least one stage before PU.1 levels
themselves drop (99, 136, 137). This implies that other factors must be modulating PU.1’s
activity. At the same time, however, the reproducible, sustained co-expression of PU.1
together with some of its negative regulation targets show again that PU.1 negative
regulatory effects work to reduce the amplitude of target gene expression without silencing.
This kind of damping repression is typical of the relationships among many regulators in the
T-cell program, but is substantially different from the silencing repression that is central to
boundary formation in type I embryos.
Activation of the T-cell program
Phase 1 gene expression and regulatory activity overlaps with the activation of the T cell
program itself at the single cell level. The T-cell program can be recognized by the induction
Rothenberg et al. Page 19
Immunol Rev. Author manuscript; available in PMC 2017 May 01.
Author M
anuscriptA
uthor Manuscript
Author M
anuscriptA
uthor Manuscript
of three regulatory genes: Gata3, Tcf7 (encoding TCF-1), and the Notch-triggered target
gene Hes1. T cells complete their commitment multiple cell cycles later, when they progress
to DN2A stage and then finally turn on expression of the Bcl11b gene. This is the most
nearly T-cell specific of all the regulatory genes in the program and one of the two
regulatory genes in the whole genome with the greatest increase in expression from the ETP
stage to the newly-committed DN2b stage.
Multiple other regulatory changes take place between the initiation of the program and the
success of lineage commitment; several phase 1 genes are already silent by the time that
Bcl11b is turned on. However, while they are expressed, these phase 1 genes are an integral
part of the T-cell program and foreshadow its activation. Single-cell analysis using
fluorescent reporters for the Bcl11b locus together with reporters for phase 1 genes Bcl11a (133) or Spi1 (PU.1; Fig. 5) confirm that the cells first activating Bcl11b expression still
have detectable expression of these phase 1 gene reporters, though they become
downregulated afterwards. DN2b cells, by now functionally committed, still clearly retain
PU.1 protein as shown by single-cell fluorescent staining (78). As discussed below, they also
sustain a clear pattern of PU.1 binding at many regulatory sites throughout the genome, as
shown by ChIP-seq of these purified populations (chromatin immune precipitation analyzed
by deep sequencing) (137). These results make it highly unlikely that phase 1 gene
expression signals are coming from non-T contaminants; instead, the T-cell program is built
on a multilineage hematopoietic precursor foundation.
Molecular features of the emergent T-cell program are once again unexpected from the
dichotomous perspectives of either the dueling regulator models or the boundary formation
functions in type I embryos. The T-lineage specific genes to be activated are presumably
being driven in their expression by the positive regulators that are newly activated during T-
cell development, and their activation supposedly distinguishes these cells from their stem/
progenitor antecedents. However, although only limited ChIP-seq data are available for
phase 1 regulators in early T cells, the results seen to date open the possibility of an
intermediate phase of active collaboration between the prior state regulators and the new
regulators. Following PU.1 as a factor obviously alien to the eventual T-cell program, it is
remarkable that PU.1 binds in ETP cells to a pattern of sites with numerous points of
difference from its occupancy patterns in EBF1−/− pre-pro B cells, B cells, or macrophages
(137). Many of the differences concern sites uniquely occupied in the ETP and DN2a cells,
where PU.1 is recruited to the vicinity of genes specifically activated in the T-cell lineage
(137). The functional significance of these binding events is not certain, but it is noteworthy
that these genes do not require PU.1 binding to be silent in non-T lineage cells. Thus it is
quite possible that PU.1 is being drawn to participate in gene regulatory complexes that
activate T-cell genes or poise them for future activation. Such an interpretation is further
suggested by the fact that the earliest sites where T-lineage factor GATA-3 is seen binding to
the DNA, soon after its own induction in ETP cells, are often closely associated with sites of
PU.1 binding as well; at later stages when the PU.1 protein levels fall, GATA-3 redistributes
to other sites (137). The sustained presence of phase 1 regulators could thus promote a
gradual regulatory handover to the T-cell regulatory state, rather than a boundary erected
immediately, or a winner-take-all duel.
Rothenberg et al. Page 20
Immunol Rev. Author manuscript; available in PMC 2017 May 01.
Author M
anuscriptA
uthor Manuscript
Author M
anuscriptA
uthor Manuscript
Complex regulatory interactions within the T-cell program
GATA-3: essential but troublesome regulator
There is indeed a need for cross-regulatory constraint in T-cell development, but some of it
must be exerted within the T-cell program itself, and not only to exclude non-T cell program
elements. Ironically, a particularly urgent example is provided by GATA-3, the T-lineage
relative of GATA-1 that has such a paradigmatic role in the PU.1-GATA-1 dueling regulator
model. GATA-3 is essential for T-cell development from the earliest stage throughout
multiple later developmental checkpoints, and it is restricted in its hematopoietic expression
to T cells and T-cell-like Innate Lymphoid Cells (116, 139–141). GATA-3 can indeed
antagonize alternative developmental program regulators, through its ability to repress PU.1
and its ability to squelch access to the B-cell program (84, 85, 132, 142). But in other
respects it is very unlike a “master regulator”.
GATA-3 not only has dose-dependent effects on different aspects of the commitment process
(84), but also has the capacity to destroy T-lineage specification if it is overexpressed (132,
143). In this way, its role in early mouse T-cell development differs from its roles in mature
Th2 effector differentiation or its role in Innate Lymphoid Cell Type 2 development, where
overexpression promotes stronger differentiation along the same pathway where endogenous
expression is essential (144–146). In early T cells, GATA-3 inadequacy leads to poor
viability from the ETP stage, poor ETP to DN2 progression (84, 85), derangement of the
DN2 stage so that DN2 and DN3-like features are intermixed (84), and failure to undergo
TCRβ rearrangement (147). However, overlapping the time windows of these effects,
GATA-3 overexpression also leads to gross losses of viability from ETP and CLP stages,
steep losses of expression of PU.1 (transiently) and IL-7Rα, abnormalities at the ETP and
DN2 stages if the viability loss is compensated, and a preference to redirect development to
a mast-cell like fate (84, 132, 142, 143). More moderate degrees of overexpression transform
developing thymocytes to lymphoma (148). Thus, strict dosage control is vital to keep
GATA-3 levels appropriate for the developmental stage even within the T-cell program.
One aspect of the delicacy of GATA-3 function is that its pattern of DNA binding is quite
variable. Other factors, including PU.1, exhibit lineage-specific differences in their binding
sites across the genome, which probably reflects different chromatin accessibility at these
sites in different contexts combined with different opportunities for crowd-binding with the
other transcription factors available in those contexts (137, 149–154). GATA-3 takes this
flexibility to an extreme, however, as its genomic occupancies redistribute considerably even
between different stages of DN thymocyte development and between later branches of
effector T-cell development (137, 155). Some of the sites with dynamic occupancy are
associated with important regulatory genes of lympho-hematopoietic development, and
although they are not among its most sensitive target genes, there is evidence that GATA-3
contributes positive regulation at least to Ets1 and Bcl11b and negative regulation to Spi1 (PU.1) and Bcl11a (84). It is likely that binding to many of these sites is intrinsically weak
enough so that it depends either on cooperation with other transcription factors, or on
dosage. If the system is tuned to require GATA-3 action to be targeted by the availability of
Rothenberg et al. Page 21
Immunol Rev. Author manuscript; available in PMC 2017 May 01.
Author M
anuscriptA
uthor Manuscript
Author M
anuscriptA
uthor Manuscript
other partners, then an increase in GATA-3 dosage could override this specificity, to bad
effect.
Fortunately for homeostasis, in early T cells GATA-3 is not positively autoregulating.
Exogenous GATA-3 cannot enhance endogenous Gata3 expression (132), and Gata3 knockout early T cells from which the exons encoding the DNA-binding domain have been
deleted continue to express RNA from the Gata3 promoter at stable or even increased levels
(84). Thus GATA-3 levels appear to be dependent primarily on other factors. Later in T-cell
development, GATA-3 expression levels come under control of the signaling pathways
responding to TCR engagement and Stat6, but these do not account for the expression
dynamics in the early stages. Instead, Gata3 control after initial Notch-dependent induction
is probably maintained by Myb and TCF-1 as likely positive regulators (99, 156, 157), and
PU.1 and E2A as conditional or mild negative regulators (99, 136, 143). In fact, Gata3 expression at RNA and protein levels in developing mouse pro-T cells appears to be kept
within a ~3x range from late ETP through DN3a stage (84), and recent evidence suggests
that for much of this time only a single Gata3 allele is active, suggesting a constraint on
chromatin opening as well (115). GATA-3 is powerful and important, but it cannot be the
controlling protagonist in a regulatory duel for the T-cell fate.
Roles of Bcl11b: imposing commitment over shadow priming for innate lymphoid programs
In the past six years, a discrete new T-lineage commitment function has been identified that
is not also needed for ETP survival, and this has been helpful to dissect components of the
fate determination process. This new function is the role of Bcl11b. The combinatorial
action of GATA-3, TCF-1, Notch signaling, and the inherited progenitor factor Runx1/CBFβ
converge to cause the Bcl11b gene to be turned on in late DN2a stage (H. Y. Kueh, M. A.
Yui, K. K. H. Ng, et al., submitted)(85, 157–160). This event is functionally linked to T-cell
lineage commitment (159, 161, 162), and in vivo it is accompanied by a wave of repression
of phase 1 regulatory genes (Kueh, Yui, Ng, et al., submitted)(rev in (36)). If Bcl11b is
deleted before the cells undergo commitment, but strong Notch and IL-7 signals from the
environment are maintained, the cells proliferate in an uncommitted, DN2a-like state.
However, the cells become less sensitive to Notch signals than controls when Bcl11b fails to
be expressed, and even modest reductions in Notch ligand availability then enable Bcl11b-
deleted pro-T cells to shift quickly to an NK-like regulatory state (159). In the thymus in vivo, interestingly, Bcl11b-knockout pro-T cells do not have adequate access to these
proliferation requirements to sustain self-renewal (163). However, the robust growth of
Bcl11b knockout cells in Notch-stimulating conditions in vitro (162) offer a valuable look at
the intrinsic sustainability of an uncommitted pro-T cell gene network state over many days
or weeks.
Genome-wide analysis of RNA expression in Bcl11b knockout pro-T cells situates them
between DN2a and DN2b stages (Fig. 6A)(164)(J. A. Zhang, L. Li, and E.V.R., unpublished
data). This is a satisfying result insofar as Bcl11b itself is not turned on until late in DN2a
stage, and thus should only be able to affect gene expression after that. Focusing on the
genes that normally change expression from DN2a to DN2b, Bcl11b-knockout DN2 cells
Rothenberg et al. Page 22
Immunol Rev. Author manuscript; available in PMC 2017 May 01.
Author M
anuscriptA
uthor Manuscript
Author M
anuscriptA
uthor Manuscript
resemble DN2a cells in maintaining expression of genes that are normally turned off in
DN2b, while failing to turn on many genes that are normally turned on in DN2b (Fig. 6A,
DN2a-like groups 1 & 2). However, with respect to a smaller number of genes, Bcl11b-
knockout DN2 cells appear more DN2b-like; a certain number of DN2b-specific genes are
activated and a certain number of DN2a-specific genes are repressed in Bcl11b-knockout
cells as though they were normal DN2b cells (DN2b-like groups 1 & 2). Interestingly,
important developmental regulators are represented in both DN2a-like and DN2b-like
groups (Fig. 6B). The incomplete arrest phenotype shows that the effects of Bcl11b loss are
gene specific. Bcl11b is not a “master regulator” any more than GATA-3, since direct
Bcl11b targets or gene network subcircuits dependent on Bcl11b are a select subcomponent
of the gene expression changes that normally accompany commitment, not a switch
governing the whole process.
Strikingly, in addition there is also a third class of gene expression changes in the Bcl11b
knockout cells that does not fit into the pattern of either DN2a or DN2b. Affected genes in
this class include Notch 1, which is under-expressed in Bcl11b-knockout cells as compared
to either DN2a or DN2b normal controls. However, the most common feature of the mutant-
specific gene expression phenotype is the overexpression of a large and highly coherent
group of genes that would not normally be expressed in early T cells at all, neither before
nor after the onset of Bcl11b expression (Fig. 6B, Bcl11b-deficiency-specific) (164). These
upregulated genes include many that are implicated in innate lymphoid cell function, NK
cell function, and innate-like T cell specification: Id2, Il2rb, Fcgr3, Zbtb16, and Nfil3. Also
precociously activated are Maf, Ikzf2, Zbtb7b, and Pou2af1, factors expressed in other
mature T-cell subsets (165). At a lower level, but markedly above background, Bcl11b-
knockout cells activate the highly NK-specific transcription factor Zfp105 as well (159,
162). These gene expression responses give Bcl11b-knockout cells an NK cell (or NKT-like)
functional bias that distinguishes them from mainstream normal T cells. However, they also
represent a surprise.
The emergence of a new program of gene expression by deletion of one transcription factor
implies that that factor would normally be acting as a repressor for the program. In the case
of Bcl11b, the absence of expression of these genes in normal cells would imply that Bcl11b
is a very efficient repressor of these genes. However, the comparison should not just be
between fully committed (DN2b) normal cells and their Bcl11b-deficient counterparts; the
developmentally informative comparison is also with precursor normal cells that have not
had any opportunity to express Bcl11b yet (DN2a cells). It would make sense for Bcl11b-
deficient cells to continue to express phase 1 genes that are normally expressed until Bcl11b
is activated, if Bcl11b were needed to terminate their expression. But the results here show
that many genes that are initially silent in the cells before Bcl11b is ever expressed change to
become expressed by default just around the time that Bcl11b is turned on to restrain them.
In other words, the phenotype of Bcl11b-knockout cells implies that developing T cells are
not only programmed to acquire T-cell characteristics, but also programmed to acquire
innate-like characteristics – yet to hold those characteristics in check, using Bcl11b to
prevent activation of this parallel gene expression program.
Rothenberg et al. Page 23
Immunol Rev. Author manuscript; available in PMC 2017 May 01.
Author M
anuscriptA
uthor Manuscript
Author M
anuscriptA
uthor Manuscript
Why does this make sense? Importantly, there are few genes yet known to be truly unique to
innate lymphocytes; much of the distinction between innate lymphocytes and T cells at the
single-cell level has to do with the types of triggering receptors they express and the
thresholds for their effector responses, which are higher for T cells. Thus, the arming of
normal mature T cells for effector function is very close to the establishment of an innate
lymphocyte effector gene expression program, except that in the T cell there is also a
stronger restraint mechanism to keep the cells quiescent until unleashed. Thus it seems
plausible that as T-cell specification proceeds toward its climax, the cells could also gain
latent properties that we classify as “innate” programs.
In accord with this view, we know that at least three important T-cell regulators are shared
with the innate program: GATA-3, TCF-1, and Runx1; Notch is used for ILC2 and ILC3
specification as well (rev. by (35, 166)). In fact, Bcl11b itself is also an essential enabling
factor for one particular innate cell subset (ILC2) to emerge as opposed to the others (NK,
ILC1, ILC3)(167–169). There are also hints that cytokine receptor stimulation, such as the
stimulation that fosters early pro-T cell expansion, also stimulates expression of regulatory
infrastructure for T/innate lymphocyte effector function. The mechanism that appears to
control all these effector programs, from data in hand thus far, is the balance between E
protein dominance and Id2 dominance. A role for Bcl11b on the E protein side of this
balance is strongly hinted by the massive upsurge in Id2 expression when Bcl11b is deleted
(Fig. 7)(159). Here again, the type of repression that Bcl11b is likely to be providing is not
permanent silencing repression. The genes repressed by Bcl11b will permanently remain
accessible in mature T cells for conditional activation in response to the appropriate
combination of TCR and cytokine signals, conditions which cause Bcl11b to undergo
modest downregulation (170). From the point of view of the NK, ILC1, CD8 effector, and
NKT cell programs, Bcl11b activation would thus be the key event in an incoherent
feedforward loop, activated by the same regulators that may contribute to the innate-cell
programs, but then acting as an antagonist to them.
Transcription factor vector addition defines cell type
The evidence is strong that T-cell specification depends on multiple transcription factor
combinatorial action. However, there are different ways to understand this requirement for
combinatoriality in executing the T-cell developmental program. Most often the model is
that of a pathway, and indications of the stages at which different factors work are based on
an implicit model that there is a kind of regulatory relay. Thus, in this model each factor is
working to push the cells inexorably toward the T-cell goal, even as “and” logic requires
more and more of them to be active for the last genes in the pathway to achieve correct
regulation. We can visualize what this could mean for the different factors if we imagine
development as a series of gene expression changes that can be plotted to form a linear
trajectory in principal component space (Fig. 7A). According to this additive pathway-relay
model, all the gene expression changes driven by any of the individual factors would be
vectors parallel to the main trajectory (Fig. 7A; different colored arrows represent effects of
different factors). If this is the correct way to explain the roles of these factors, then any loss
of T-cell factor expression would arrest T-cell development, but leave the regulatory state at
some point on the same pathway (Fig. 7A, right).
Rothenberg et al. Page 24
Immunol Rev. Author manuscript; available in PMC 2017 May 01.
Author M
anuscriptA
uthor Manuscript
Author M
anuscriptA
uthor Manuscript
The phenotypes of Bcl11b knockout cells and GATA-3 overexpressing cells suggest that the
combinatoriality may depend on something else, however. In these cases, the cells not only
become arrested but also acquire new, non-T identities, similar to what happens when a
factor working mainly outside the T-cell program, like PU.1, is overexpressed. The gain of
function effects of PU.1 and GATA-3 are not a simple reversal of the defects seen when
these factors are deleted in early T cells. As already mentioned, the asymmetry is partly due
to dose dependence, but it is manifested through the gene network effects that different
regulators have on each other, partly antagonizing each other’s expression (GATA-3 vs. PU.
1, even Bcl11b vs. GATA-3) and selectively blunting some of each other’s functions (Notch
signals vs. PU.1). Thus, a better way to represent the action of successive factors in our gene
expression principal component space may be as a vector addition among non-parallel
vectors (Fig. 7B, left). In this model, the correctly coordinated action of the different factors
drives the cell from the initial state to the end state, but with actions that partially synergize
and partially counterbalance each other. Then in such a model, when one factor is lost or
excessively activated, the cell naturally falls off the T-cell trajectory to a different end state
(Fig. 7B, right). In this case, combinatoriality is not only required to complete the pathway,
but to define the direction of the pathway itself.
Stabilizing fate in the T-cell system
In classic models of differentiation, the mature cell that emerges is postmitotic. This acts as
a natural source of stability for the regulatory state of the cells that controls gene expression.
For T-cell precursors, however, cell cycle arrest may be a checkpoint or a pause, but it is not
the end of proliferation or differentiation choices, which continue long after maturation is
complete. Even more interestingly, the relative expression levels of different factors among
the T-cell specification core may keep changing. Some relationships can be maintained in
certain T-cell subsets: for example, the positive regulatory cooperation of GATA-3 and
TCF-1 appears to continue through the CD4/CD8 lineage choice into the Th2 effector T-cell
differentiation program (171, 172). However, Notch signaling stops after β-selection and
may only resume in the periphery as part of the antigen stimulation program. GATA-3 levels
are variable among helper cell lineages and between helper and killer cells, Myb and Gfi1
are turned off after the cells leave the thymus, and the correlation between Bcl11b and
TCF-1 expression levels is dramatically shattered in the Treg lineage (173, 174). E protein
activity levels are particularly dynamic, as the E protein HEB (Tcf12) rises to a sharp peak
in the DP stage, then declines, while all encounters with TCR stimuli throughout T cell
development and function activate one or another of the E protein antagonists, Id2 or Id3
(175, 176). Rather than using T-cell transcription factors to set up a stabilizing mutual
activation feedback circuitry, the T cells treat them as free variables for additional
combinatorial diversification of regulatory states. Yet despite this transcription factor
instability, T cells retain stable expression of their key signature genes through weeks,
months, or years of function, migration, and proliferation in different environments. Thus
even if the developmental process triggered by Notch signaling uses “fuzzy logic” to
establish T-cell identity, this identity is surprisingly durable.
One of the consequences of the first TCR-dependent selection event, during the transition
from DN3 to DP, is a general increase in H3K27me3 repressive marking of quiescent loci
Rothenberg et al. Page 25
Immunol Rev. Author manuscript; available in PMC 2017 May 01.
Author M
anuscriptA
uthor Manuscript
Author M
anuscriptA
uthor Manuscript
across the genome (177), even when these genes had been transcriptionally silenced one or
two stages previously (137). The deep silencing of progenitor-associated transcription factor
genes is indeed likely to contribute to stability, but it remains mysterious what really is
needed to sustain positive regulation of the T-cell identity genes themselves. In at least one
case, we have preliminary evidence that the regulatory requirements for activation of an
important gene are considerably more complex than the requirements for keeping it on,
starting almost immediately after its activation (Kueh, Yui, Ng, et al., submitted). This kind
of phenomenon suggests that a major threshold could lie at the level of a process like
chromatin opening.
Concluding remarks
There are many unknowns yet to be revealed in this culmination aspect of the T-cell
development process. Does T-cell development require such a large number of regulatory
inputs only in order to open genes, so that only a few factors are needed to sustain them
later? Does the extended proliferation in the early stages of T-cell development make its own
regulatory contribution, either by dilution of previously expressed transcription factors or by
helping to remodel chromatin structure? How small, in the end, might be the core
“maintenance” T cell gene regulatory network? Could only a few stably expressed
regulatory factors in fact be enough, and are those that are needed truly T lineage-unique at
all? Finally, how important is the order in which T-cell regulators are serially deployed in
order to guide the process to the right endpoints? Can the process be substantially
accelerated and simplified?
In this review we have drawn a picture of the T-cell development process as one guided from
a multipotent stem cell state by a gradual process that depends on extensive transcription
factor combinatoriality but permits fluid combinations of factors to occur and then reform
with other partners through multiple stages. One enabling feature of the process is its
hallmark use of damping repression rather than silencing in most transcription factor cross-
repressive interactions, which both permits coexistence and restrains overexpression. The
dosage restraint makes it possible for this program to use factors which at other levels of
expression, or without the constraint of Notch signaling, push cells to completely different
end states. This mechanism is important to understand in depth through modeling, but the
right framework has to be chosen. This system has obvious differences in its functional rules
of operation both from the Boolean behavior of well-characterized embryonic cell networks
and from the simple bistability of the dueling regulator models.
But in the context of emergence from stem cells, the process through which T cells emerge
makes sense. Recall that vertebrate embryos in general arise from a different process than
type I embryos; vertebrate embryonic cells as a rule proliferate extensively and migrate to
new parts of the embryo, defying fate maps, before their future identities are determined. It
is possible that the rule set needed to solve the T-cell specification network will also prove to
be a fine model for vertebrate development in general.
Rothenberg et al. Page 26
Immunol Rev. Author manuscript; available in PMC 2017 May 01.
Author M
anuscriptA
uthor Manuscript
Author M
anuscriptA
uthor Manuscript
Acknowledgments
We gratefully acknowledge the late Eric Davidson for stimulating discussions of developmental gene network properties in diverse systems. We thank past and present members of the Rothenberg and Michael Elowitz groups for valuable advice and sharing of unpublished results, Maria Lerica Gutierrez Quiloan for mouse colony supervision, and Rochelle Diamond, Keith Beadle, and Diana Perez for flow cytometry. The ideas presented here were developed with support by grants from NIH: RC2CA148278, R01AI083514, R01AI095943, R01CA90233, R01HD076915 and R01HL119102 to E.V.R., R01AI064590 to M.A.Y., and K99HL119638A to H.Y.K.; also by the L. A. Garfinkle Memorial Laboratory Fund, and by the Albert Billings Ruddock Professorship to E.V.R.
References
1. Davidson EH. Spatial mechanisms of gene regulation in metazoan embryos. Development. 1991; 113:1–26. [PubMed: 1684931]
2. Davidson, EH. The Regulatory Genome: Gene Regulatory Networks in Development and Evolution. San Diego: Academic Press; 2006.
3. Peter, IS.; Davidson, EH. Genomic Control Process: Development and Evolution. San Diego, CA: Academic Press, Elsevier; 2015.
4. Davidson EH, Erwin DH. Gene regulatory networks and the evolution of animal body plans. Science. 2006; 311:796–800. [PubMed: 16469913]
5. Oliveri P, Tu Q, Davidson EH. Global regulatory logic for specification of an embryonic cell lineage. Proc Natl Acad Sci USA. 2008; 105:5955–5962. [PubMed: 18413610]
6. Peter IS, Davidson EH. The endoderm gene regulatory network in sea urchin embryos up to mid-blastula stage. Dev Biol. 2009; 340:188–199. [PubMed: 19895806]
7. Davidson B, Christiaen L. Linking chordate gene networks to cellular behavior in ascidians. Cell. 2006; 124:247–250. [PubMed: 16439196]
8. Kubo A, Imai KS, Satou Y. Gene-regulatory networks in the Ciona embryos. Brief Funct Genomic Proteomic. 2009; 8:250–255. [PubMed: 19535506]
9. Lemaire P, Smith WC, Nishida H. Ascidians and the plasticity of the chordate developmental program. Curr Biol. 2008; 18:R620–631. [PubMed: 18644342]
10. Maduro MF. Developmental robustness in the Caenorhabditis elegans embryo. Mol Reprod Dev. 2015
11. Hobert O. Development of left/right asymmetry in the Caenorhabditis elegans nervous system: from zygote to postmitotic neuron. Genesis. 2014; 52:528–543. [PubMed: 24510690]
12. Stathopoulos A, Levine M. Localized repressors delineate the neurogenic ectoderm in the early Drosophila embryo. Dev Biol. 2005; 280:482–493. [PubMed: 15882587]
13. Stathopoulos A, Levine M. Genomic regulatory networks and animal development. Dev Cell. 2005; 9:449–462. [PubMed: 16198288]
14. Jaeger J. The gap gene network. Cell Mol Life Sci. 2011; 68:243–274. [PubMed: 20927566]
15. Chen H, Xu Z, Mei C, Yu D, Small S. A system of repressor gradients spatially organizes the boundaries of Bicoid-dependent target genes. Cell. 2012; 149:618–629. [PubMed: 22541432]
16. Barolo S, Posakony JW. Three habits of highly effective signaling pathways: principles of transcriptional control by developmental cell signaling. Genes Dev. 2002; 16:1167–1181. [PubMed: 12023297]
17. Arnosti DN, Barolo S, Levine M, Small S. The eve stripe 2 enhancer employs multiple modes of transcriptional synergy. Development. 1996; 122:205–214. [PubMed: 8565831]
18. Small S, Kraut R, Hoey T, Warrior R, Levine M. Transcriptional regulation of a pair-rule stripe in Drosophila. Genes Dev. 1991; 5:827–839. [PubMed: 2026328]
19. Kim J, et al. Integration of positional signals and regulation of wing formation and identity by Drosophila vestigial gene. Nature. 1996; 382:133–138. [PubMed: 8700202]
20. Yuh CH, Bolouri H, Davidson EH. Genomic cis-regulatory logic: experimental and computational analysis of a sea urchin gene. Science. 1998; 279:1896–1902. [PubMed: 9506933]
21. Flores GV, et al. Combinatorial signaling in the specification of unique cell fates. Cell. 2000; 103:75–85. [PubMed: 11051549]
Rothenberg et al. Page 27
Immunol Rev. Author manuscript; available in PMC 2017 May 01.
Author M
anuscriptA
uthor Manuscript
Author M
anuscriptA
uthor Manuscript
22. Peter IS, Faure E, Davidson EH. Predictive computation of genomic logic processing functions in embryonic development. Proc Natl Acad Sci U S A. 2012; 109:16434–16442. [PubMed: 22927416]
23. Longabaugh WJ, Davidson EH, Bolouri H. Visualization, documentation, analysis, and communication of large-scale gene regulatory networks. Biochim Biophys Acta. 2009; 1789:363–374. [PubMed: 18757046]
24. Longabaugh WJR, Davidson EH, Bolouri H. Computational representation of developmental genetic regulatory networks. Dev Biol. 2005; 283:1–16. [PubMed: 15907831]
25. Bolouri H, Davidson EH. Transcriptional regulatory cascades in development: initial rates, not steady state, determine network kinetics. Proc Natl Acad Sci USA. 2003; 100:9371–9376. [PubMed: 12883007]
26. Ochoa-Espinosa A, Yu D, Tsirigos A, Struffi P, Small S. Anterior-posterior positional information in the absence of a strong Bicoid gradient. Proc Natl Acad Sci USA. 2009; 106:3823–3828. [PubMed: 19237583]
27. Johnson AD, Poteete AR, Lauer G, Sauer RT, Ackers GK, Ptashne M. λ Repressor and cro--components of an efficient molecular switch. Nature. 1981; 294:217–223. [PubMed: 6457992]
28. Ptashne M, et al. How the λ repressor and cro work. Cell. 1980; 19:1–11. [PubMed: 6444544]
29. Naito T, Taniuchi I. The network of transcription factors that underlie the CD4 versus CD8 lineage decision. Int Immunol. 2010; 22:791–796. [PubMed: 20732858]
30. Collins A, Littman DR, Taniuchi I. RUNX proteins in transcription factor networks that regulate T-cell lineage choice. Nat Rev Immunol. 2009; 9:106–115. [PubMed: 19165227]
31. Wang L, Bosselut R. CD4-CD8 lineage differentiation: Thpok-ing into the nucleus. J Immunol. 2009; 183:2903–2910. [PubMed: 19696430]
32. Huang S, Guo YP, May G, Enver T. Bifurcation dynamics in lineage-commitment in bipotent progenitor cells. Dev Biol. 2007; 305:695–713. [PubMed: 17412320]
33. Laslo P, et al. Multilineage transcriptional priming and determination of alternate hematopoietic cell fates. Cell. 2006; 126:755–766. [PubMed: 16923394]
34. Roeder I, Glauche I. Towards an understanding of lineage specification in hematopoietic stem cells: a mathematical model for the interaction of transcription factors GATA-1 and PU. 1. J Theor Biol. 2006; 241:852–865. [PubMed: 16510158]
35. De Obaldia ME, Bhandoola A. Transcriptional regulation of innate and adaptive lymphocyte lineages. Annu Rev Immunol. 2015; 33:607–642. [PubMed: 25665079]
36. Yui MA, Rothenberg EV. Developmental gene networks: a triathlon on the course to T cell identity. Nat Rev Immunol. 2014; 14:529–545. [PubMed: 25060579]
37. Love PE, Bhandoola A. Signal integration and crosstalk during thymocyte migration and emigration. Nat Rev Immunol. 2011; 11:469–477. [PubMed: 21701522]
38. Davidson EH. Emerging properties of animal gene regulatory networks. Nature. 2010; 468:911–920. [PubMed: 21164479]
39. Akashi K, Reya T, Dalma-Weiszhausz D, Weissman IL. Lymphoid precursors. Curr Opin Immunol. 2000; 12:144–150. [PubMed: 10712944]
40. Månsson R, et al. Molecular evidence for hierarchical transcriptional lineage priming in fetal and adult stem cells and multipotent progenitors. Immunity. 2007; 26:407–419. [PubMed: 17433729]
41. Adolfsson J, et al. Identification of Flt3+ lympho-myeloid stem cells lacking erythro-megakaryocytic potential: a revised road map for adult blood lineage commitment. Cell. 2005; 121:295–306. [PubMed: 15851035]
42. Akashi K, Traver D, Zon LI. The complex cartography of stem cell commitment. Cell. 2005; 121:160–162. [PubMed: 15851023]
43. Arinobu Y, et al. Reciprocal activation of GATA-1 and PU. 1 marks initial specification of hematopoietic stem cells into myeloerythroid and myelolymphoid lineages. Cell Stem Cell. 2007; 1:416–427. [PubMed: 18371378]
44. Doulatov S, Notta F, Eppert K, Nguyen LT, Ohashi PS, Dick JE. Revised map of the human progenitor hierarchy shows the origin of macrophages and dendritic cells in early lymphoid development. Nat Immunol. 2010; 11:585–593. [PubMed: 20543838]
Rothenberg et al. Page 28
Immunol Rev. Author manuscript; available in PMC 2017 May 01.
Author M
anuscriptA
uthor Manuscript
Author M
anuscriptA
uthor Manuscript
45. Graf, T.; Zon, LI. Hematopoiesis: a Developmental Approach. New York: Oxford University Press; 2001. Transcription factors that induce commitment of multipotent hematopoietic progenitors: lessons from the MEP system; p. 355-362.
46. Nerlov C, Querfurth E, Kulessa H, Graf T. GATA-1 interacts with the myeloid PU.1 transcription factor and represses PU. 1-dependent transcription. Blood. 2000; 95:2543–2551. [PubMed: 10753833]
47. Rekhtman N, Radparvar F, Evans T, Skoultchi A. Direct interaction of hematopoietic transcription factors PU. 1 and GATA-1: functional antagonism in erythroid cells. Genes Dev. 1999; 13:1398–1411. [PubMed: 10364157]
48. Zhang P, et al. Negative cross-talk between hematopoietic regulators: GATA proteins repress PU. 1. Proc Natl Acad Sci USA. 1999; 96:8705–8710. [PubMed: 10411939]
49. Dahl R, et al. Regulation of macrophage and neutrophil cell fates by the PU. 1:C/EBPα ratio and granulocyte colony-stimulating factor. Nat Immunol. 2003; 4:1029–1036. [PubMed: 12958595]
50. Guo G, et al. Mapping cellular hierarchy by single-cell analysis of the cell surface repertoire. Cell Stem Cell. 2013; 13:492–505. [PubMed: 24035353]
51. Moignard V, et al. Characterization of transcriptional networks in blood stem and progenitor cells using high-throughput single-cell gene expression analysis. Nat Cell Biol. 2013; 15:363–372. [PubMed: 23524953]
52. Lu M, Kawamoto H, Katsube Y, Ikawa T, Katsura Y. The common myelolymphoid progenitor: a key intermediate stage in hemopoiesis generating T and B cells. J Immunol. 2002; 169:3519–3525. [PubMed: 12244141]
53. Akashi K, Traver D, Miyamoto T, Weissman IL. A clonogenic common myeloid progenitor that gives rise to all myeloid lineages. Nature. 2000; 404:193–197. [PubMed: 10724173]
54. Katsura Y, Kawamoto H. Stepwise lineage restriction of progenitors in lympho-myelopoiesis. Int Rev Immunol. 2001; 20:1–20. [PubMed: 11342295]
55. Paul F, et al. Transcriptional heterogeneity and lineage commitment in myeloid progenitors. Cell. 2015; 163:1663–1677. [PubMed: 26627738]
56. Perié L, Duffy KR, Kok L, de Boer RJ, Schumacher TN. The branching point in erythro-myeloid differentiation. Cell. 2015; 163:1655–1662. [PubMed: 26687356]
57. Notta F, et al. Distinct routes of lineage development reshape the human blood hierarchy across ontogeny. Science. 2016; 351:aab2116. [PubMed: 26541609]
58. Kueh HY, Champhekar A, Nutt SL, Elowitz MB, Rothenberg EV. Positive feedback between PU. 1 and the cell cycle controls myeloid differentiation. Science. 2013; 341:670–673. [PubMed: 23868921]
59. Nutt SL, Metcalf D, D’Amico A, Polli M, Wu L. Dynamic regulation of PU. 1 expression in multipotent hematopoietic progenitors. J Exp Med. 2005; 201:221–231. [PubMed: 15657291]
60. Monteiro R, Pouget C, Patient R. The gata1/pu1 lineage fate paradigm varies between blood populations and is modulated by tif1γ. EMBO J. 2011; 30:1093–1103. [PubMed: 21336259]
61. Chickarmane V, Enver T, Peterson C. Computational modeling of the hematopoietic erythroid-myeloid switch reveals insights into cooperativity, priming, and irreversibility. PLoS Comput Biol. 2009; 5:e1000268. [PubMed: 19165316]
62. Chlon TM, Dore LC, Crispino JD. Cofactor-mediated restriction of GATA-1 chromatin occupancy coordinates lineage-specific gene expression. Mol Cell. 2012; 47:608–621. [PubMed: 22771118]
63. Cantor AB, et al. Antagonism of FOG-1 and GATA factors in fate choice for the mast cell lineage. J Exp Med. 2008; 205:611–624. [PubMed: 18299398]
64. Iwasaki H, et al. The order of expression of transcription factors directs hierarchical specification of hematopoietic lineages. Genes Dev. 2006; 20:3010–3021. [PubMed: 17079688]
65. Walsh JC, et al. Cooperative and antagonistic interplay between PU. 1 and GATA-2 in the specification of myeloid cell fates. Immunity. 2002; 17:665–676. [PubMed: 12433372]
66. Spooner CJ, Cheng JX, Pujadas E, Laslo P, Singh H. A recurrent network involving the transcription factors PU. 1 and Gfi1 orchestrates innate and adaptive immune cell fates. Immunity. 2009; 31:576–586. [PubMed: 19818654]
Rothenberg et al. Page 29
Immunol Rev. Author manuscript; available in PMC 2017 May 01.
Author M
anuscriptA
uthor Manuscript
Author M
anuscriptA
uthor Manuscript
67. Hsu CL, King-Fleischman AG, Lai AY, Matsumoto Y, Weissman IL, Kondo M. Antagonistic effect of CCAAT enhancer-binding protein-α and Pax5 in myeloid or lymphoid lineage choice in common lymphoid progenitors. Proc Natl Acad Sci USA. 2006; 103:672–677. [PubMed: 16407117]
68. Pongubala JM, et al. Transcription factor EBF restricts alternative lineage options and promotes B cell fate commitment independently of Pax5. Nat Immunol. 2008; 9:203–215. [PubMed: 18176567]
69. De Obaldia ME, et al. T cell development requires constraint of the myeloid regulator C/EBP-α by the Notch target and transcriptional repressor Hes1. Nat Immunol. 2013; 14:1277–1284. [PubMed: 24185616]
70. McNagny KM, Sieweke MH, Doderlein G, Graf T, Nerlov C. Regulation of eosinophil-specific gene expression by a C/EBP-Ets complex and GATA-1. EMBO J. 1998; 17:3669–3680. [PubMed: 9649437]
71. Du J, et al. Novel combinatorial interactions of GATA-1, PU. 1, and C/EBPî isoforms regulate transcription of the gene encoding eosinophil granule major basic protein. J Biol Chem. 2002; 277:43481–43494. [PubMed: 12202480]
72. Heavey B, Charalambous C, Cobaleda C, Busslinger M. Myeloid lineage switch of Pax5 mutant but not wild-type B cell progenitors by C/EBPα and GATA factors. EMBO J. 2003; 22:3887–3897. [PubMed: 12881423]
73. Zandi S, Åhsberg J, Tsapogas P, Stjernberg J, Qian H, Sigvardsson M. Single-cell analysis of early B-lymphocyte development suggests independent regulation of lineage specification and commitment in vivo. Proc Natl Acad Sci U S A. 2012; 109:15871–15876. [PubMed: 23019372]
74. Welinder E, Åhsberg J, Sigvardsson M. B-lymphocyte commitment: identifying the point of no return. Semin Immunol. 2011; 23:335–340. [PubMed: 21944938]
75. Mansson R, et al. Single-cell analysis of the common lymphoid progenitor compartment reveals functional and molecular heterogeneity. Blood. 2010; 115:2601–2609. [PubMed: 19996414]
76. De Obaldia ME, Bell JJ, Bhandoola A. Early T-cell progenitors are the major granulocyte precursors in the adult mouse thymus. Blood. 2013; 121:64–71. [PubMed: 23152541]
77. Luc S, et al. The earliest thymic T cell progenitors sustain B cell and myeloid lineage potential. Nat Immunol. 2012; 13:412–419. [PubMed: 22344248]
78. Yui MA, Feng N, Rothenberg EV. Fine-scale staging of T cell lineage commitment in adult mouse thymus. J Immunol. 2010; 185:284–293. [PubMed: 20543111]
79. Bell JJ, Bhandoola A. The earliest thymic progenitors for T cells possess myeloid lineage potential. Nature. 2008; 452:764–767. [PubMed: 18401411]
80. Wada H, et al. Adult T-cell progenitors retain myeloid potential. Nature. 2008; 452:768–772. [PubMed: 18401412]
81. Balciunaite G, Ceredig R, Rolink AG. The earliest subpopulation of mouse thymocytes contains potent T, significant macrophage, and natural killer cell but no B-lymphocyte potential. Blood. 2005; 105:1930–1936. [PubMed: 15522952]
82. Perry SS, Wang H, Pierce LJ, Yang AM, Tsai S, Spangrude GJ. L-Selectin defines a bone marrow analogue to the thymic Early T-lineage Progenitor. Blood. 2004; 103:2990–2996. [PubMed: 15070675]
83. Wu L, Antica M, Johnson GR, Scollay R, Shortman K. Developmental potential of the earliest precursor cells from the adult mouse thymus. J Exp Med. 1991; 174:1617–1627. [PubMed: 1683894]
84. Scripture-Adams DD, et al. GATA-3 dose-dependent checkpoints in early T cell commitment. J Immunol. 2014; 193:3470–3491. [PubMed: 25172496]
85. García-Ojeda ME, et al. GATA-3 promotes T cell specification by repressing B cell potential in pro-T cells. Blood. 2013; 121:1749–1759. [PubMed: 23287858]
86. Heinzel K, Benz C, Martins VC, Haidl ID, Bleul CC. Bone marrow-derived hemopoietic precursors commit to the T cell lineage only after arrival in the thymic microenvironment. J Immunol. 2007; 178:858–868. [PubMed: 17202347]
87. Allman D, et al. Thymopoiesis independent of common lymphoid progenitors. Nat Immunol. 2003; 4:168–174. [PubMed: 12514733]
Rothenberg et al. Page 30
Immunol Rev. Author manuscript; available in PMC 2017 May 01.
Author M
anuscriptA
uthor Manuscript
Author M
anuscriptA
uthor Manuscript
88. Kamath MB, et al. Dose-dependent repression of T-cell and natural killer cell genes by PU. 1 enforces myeloid and B-cell identity. Leukemia. 2008; 22:1214–1225. [PubMed: 18354487]
89. DeKoter RP, Singh H. Regulation of B lymphocyte and macrophage development by graded expression of PU. 1. Science. 2000; 288:1439–1441. [PubMed: 10827957]
90. Zarnegar MA, Rothenberg EV. Ikaros represses and activates PU. 1 cell-type-specifically through the multifunctional Sfpi1 URE and a myeloid specific enhancer. Oncogene. 2012; 31:4647–4654. [PubMed: 22231443]
91. Leddin M, et al. Two distinct auto-regulatory loops operate at the PU. 1 locus in B cells and myeloid cells. Blood. 2011; 117:2827–2838. [PubMed: 21239694]
92. Chen H, et al. PU. 1 (Spi-1) autoregulates its expression in myeloid cells. Oncogene. 1995; 11:1549–1560. [PubMed: 7478579]
93. Ng SY, Yoshida T, Zhang J, Georgopoulos K. Genome-wide lineage-specific transcriptional networks underscore Ikaros-dependent lymphoid priming in hematopoietic stem cells. Immunity. 2009; 30:493–507. [PubMed: 19345118]
94. Masuda K, Kakugawa K, Nakayama T, Minato M, Katsura Y, Kawamoto H. T cell lineage determination precedes the initiation of TCRβ rearrangement. J Immunol. 2007; 179:3699–3706. [PubMed: 17785806]
95. Anderson MK, Weiss AH, Hernandez-Hoyos G, Dionne CJ, Rothenberg EV. Constitutive expression of PU. 1 in fetal hematopoietic progenitors blocks T cell development at the pro-T cell stage. Immunity. 2002; 16:285–296. [PubMed: 11869688]
96. Manesso E, Chickarmane V, Kueh HY, Rothenberg EV, Peterson C. Computational modelling of T-cell formation kinetics: output regulated by initial proliferation-linked deferral of developmental competence. J R Soc Interface. 2013; 10:20120774. [PubMed: 23152106]
97. Lu M, et al. The earliest thymic progenitors in adults are restricted to T, NK, and dendritic cell lineage and have a potential to form more diverse TCRβ chains than fetal progenitors. J Immunol. 2005; 175:5848–5856. [PubMed: 16237077]
98. Schlenner SM, et al. Fate mapping reveals separate origins of T cells and myeloid lineages in the thymus. Immunity. 2010; 32:426–436. [PubMed: 20303297]
99. Del Real MM, Rothenberg EV. Architecture of a lymphomyeloid developmental switch controlled by PU. 1, Notch and Gata3. Development. 2013; 140:1207–1219. [PubMed: 23444353]
100. Franco CB, et al. Notch/Delta signaling constrains reengineering of pro-T cells by PU. 1. Proc Natl Acad Sci U S A. 2006; 103:11993–11998. [PubMed: 16880393]
101. Laiosa CV, Stadtfeld M, Xie H, de Andres-Aguayo L, Graf T. Reprogramming of committed T cell progenitors to macrophages and dendritic cells by C/EBPα and PU. 1 transcription factors. Immunity. 2006; 25:731–744. [PubMed: 17088084]
102. Wilson A, MacDonald HR, Radtke F. Notch 1-deficient common lymphoid precursors adopt a B cell fate in the thymus. J Exp Med. 2001; 194:1003–1012. [PubMed: 11581321]
103. Sambandam A, et al. Notch signaling controls the generation and differentiation of early T lineage progenitors. Nat Immunol. 2005; 6:663–670. [PubMed: 15951813]
104. Tan JB, Visan I, Yuan JS, Guidos CJ. Requirement for Notch1 signals at sequential early stages of intrathymic T cell development. Nat Immunol. 2005; 6:671–679. [PubMed: 15951812]
105. El-Kassar N, et al. High levels of IL-7 cause dysregulation of thymocyte development. Int Immunol. 2012; 24:661–671. [PubMed: 22899673]
106. Prockop SE, Petrie HT. Regulation of thymus size by competition for stromal niches among early T cell progenitors. J Immunol. 2004; 173:1604–1611. [PubMed: 15265888]
107. Munitic I, et al. Dynamic regulation of IL-7 receptor expression is required for normal thymopoiesis. Blood. 2004; 104:4165–4172. [PubMed: 15328149]
108. Cai Z, et al. Haploinsufficiency of AML1 affects the temporal and spatial generation of hematopoietic stem cells in the mouse embryo. Immunity. 2000; 13:423–431. [PubMed: 11070161]
109. Lacaud G, Kouskoff V, Trumble A, Schwantz S, Keller G. Haploinsufficiency of Runx1 results in the acceleration of mesodermal development and hemangioblast specification upon in vitro differentiation of ES cells. Blood. 2004; 103:886–889. [PubMed: 14525762]
Rothenberg et al. Page 31
Immunol Rev. Author manuscript; available in PMC 2017 May 01.
Author M
anuscriptA
uthor Manuscript
Author M
anuscriptA
uthor Manuscript
110. Rodrigues NP, et al. Haploinsufficiency of GATA-2 perturbs adult hematopoietic stem-cell homeostasis. Blood. 2005; 106:477–484. [PubMed: 15811962]
111. Carotta S, et al. The transcription factor PU. 1 controls dendritic cell development and Flt3 cytokine receptor expression in a dose-dependent manner. Immunity. 2010; 32:628–641. [PubMed: 20510871]
112. O’Riordan M, Grosschedl R. Coordinate regulation of B cell differentiation by the transcription factors EBF and E2A. Immunity. 1999; 11:21–31. [PubMed: 10435576]
113. Lukin K, et al. Compound haploinsufficiencies of Ebf1 and Runx1 genes impede B cell lineage progression. Proc Natl Acad Sci USA. 2010; 107:7869–7874. [PubMed: 20385820]
114. Ungerbäck J, Ahsberg J, Strid T, Somasundaram R, Sigvardsson M. Combined heterozygous loss of Ebf1 and Pax5 allows for T-lineage conversion of B cell progenitors. J Exp Med. 2015; 212:1109–1123. [PubMed: 26056231]
115. Ku CJ, Lim KC, Kalantry S, Maillard I, Engel JD, Hosoya T. A monoallelic-to-biallelic T-cell transcriptional switch regulates GATA3 abundance. Genes Dev. 2015; 29:1930–1941. [PubMed: 26385963]
116. Hosoya T, et al. GATA-3 is required for early T lineage progenitor development. J Exp Med. 2009; 206:2987–3000. [PubMed: 19934022]
117. Zarnegar MA, Chen J, Rothenberg EV. Cell type-specific activation and repression of PU. 1 by a complex of discrete, functionally specialized cis-regulatory elements. Mol Cell Biol. 2010; 30:4922–4939. [PubMed: 20696839]
118. Wilson NK, et al. Combined single-cell functional and gene expression analysis resolves heterogeneity within stem cell populations. Cell Stem Cell. 2015; 16:712–724. [PubMed: 26004780]
119. Kreslavsky T, et al. β-Selection-induced proliferation is required for αβ T cell differentiation. Immunity. 2012; 37:840–853. [PubMed: 23159226]
120. Falk I, Biro J, Kohler H, Eichmann K. Proliferation kinetics associated with T cell receptor-β chain selection of fetal murine thymocytes. J Exp Med. 1996; 184:2327–2339. [PubMed: 8976187]
121. Mossadegh-Keller N, et al. M-CSF instructs myeloid lineage fate in single haematopoietic stem cells. Nature. 2013; 497:239–243. [PubMed: 23575636]
122. Shibata Y, Berclaz PY, Chroneos ZC, Yoshida M, Whitsett JA, Trapnell BC. GM-CSF regulates alveolar macrophage differentiation and innate immunity in the lung through PU. 1. Immunity. 2001; 15:557–567. [PubMed: 11672538]
123. Tsapogas P, et al. IL-7 mediates Ebf-1-dependent lineage restriction in early lymphoid progenitors. Blood. 2011; 118:1283–1290. [PubMed: 21652681]
124. Kikuchi K, Kasai H, Watanabe A, Lai AY, Kondo M. IL-7 specifies B cell fate at the common lymphoid progenitor to pre-proB transition stage by maintaining early B cell factor expression. J Immunol. 2008; 181:383–392. [PubMed: 18566404]
125. Dias S, Silva H Jr, Cumano A, Vieira P. Interleukin-7 is necessary to maintain the B cell potential in common lymphoid progenitors. J Exp Med. 2005; 201:971–979. [PubMed: 15767371]
126. Kikuchi K, Lai AY, Hsu CL, Kondo M. IL-7 receptor signaling is necessary for stage transition in adult B cell development through up-regulation of EBF. J Exp Med. 2005; 201:1197–1203. [PubMed: 15837809]
127. Boller S, Grosschedl R. The regulatory network of B-cell differentiation: a focused view of early B-cell factor 1 function. Immunol Rev. 2014; 261:102–115. [PubMed: 25123279]
128. Malin S, et al. Role of STAT5 in controlling cell survival and immunoglobulin gene recombination during pro-B cell development. Nat Immunol. 2010; 11:171–179. [PubMed: 19946273]
129. Massa S, Balciunaite G, Ceredig R, Rolink AG. Critical role for c-kit (CD117) in T cell lineage commitment and early thymocyte development in vitro. Eur J Immunol. 2006; 36:526–532. [PubMed: 16482516]
130. Seshasayee D, Gaines P, Wojchowski DM. GATA-1 dominantly activates a program of erythroid gene expression in factor-dependent myeloid FDCW2 cells. Mol Cell Biol. 1998; 18:3278–3288. [PubMed: 9584168]
Rothenberg et al. Page 32
Immunol Rev. Author manuscript; available in PMC 2017 May 01.
Author M
anuscriptA
uthor Manuscript
Author M
anuscriptA
uthor Manuscript
131. Dionne CJ, et al. Subversion of T lineage commitment by PU. 1 in a clonal cell line system. Dev Biol. 2005; 280:448–466. [PubMed: 15882585]
132. Taghon T, Yui MA, Rothenberg EV. Mast cell lineage diversion of T lineage precursors by the essential T cell transcription factor GATA-3. Nat Immunol. 2007; 8:845–855. [PubMed: 17603486]
133. Yu Y, et al. Bcl11a is essential for lymphoid development and negatively regulates p53. J Exp Med. 2012; 209:2467–2483. [PubMed: 23230003]
134. Dakic A, Metcalf D, Di Rago L, Mifsud S, Wu L, Nutt SL. PU. 1 regulates the commitment of adult hematopoietic progenitors and restricts granulopoiesis. J Exp Med. 2005; 201:1487–1502. [PubMed: 15867096]
135. Zohren F, et al. The transcription factor Lyl-1 regulates lymphoid specification and the maintenance of early T lineage progenitors. Nat Immunol. 2012; 13:761–769. [PubMed: 22772404]
136. Champhekar A, Damle SS, Freedman G, Carotta S, Nutt SL, Rothenberg EV. Regulation of early T-lineage gene expression and developmental progression by the progenitor cell transcription factor PU. 1. Genes Dev. 2015; 29:832–848. [PubMed: 25846797]
137. Zhang JA, Mortazavi A, Williams BA, Wold BJ, Rothenberg EV. Dynamic transformations of genome-wide epigenetic marking and transcriptional control establish T cell identity. Cell. 2012; 149:467–482. [PubMed: 22500808]
138. Cauchy P, et al. Dynamic recruitment of Ets1 to both nucleosome-occupied and -depleted enhancer regions mediates a transcriptional program switch during early T-cell differentiation. Nucleic Acids Res. 2015
139. Hendriks RW, Nawijn MC, Engel JD, van Doorninck H, Grosveld F, Karis A. Expression of the transcription factor GATA-3 is required for the development of the earliest T cell progenitors and correlates with stages of cellular proliferation in the thymus. Eur J Immunol. 1999; 29:1912–1918. [PubMed: 10382753]
140. Hosoya T, Maillard I, Engel JD. From the cradle to the grave: activities of GATA-3 throughout T-cell development and differentiation. Immunol Rev. 2010; 238:110–125. [PubMed: 20969588]
141. Ho IC, Tai TS, Pai SY. GATA3 and the T-cell lineage: essential functions before and after T-helper-2-cell differentiation. Nat Rev Immunol. 2009; 9:125–135. [PubMed: 19151747]
142. Anderson MK, Hernandez-Hoyos G, Dionne CJ, Arias AM, Chen D, Rothenberg EV. Definition of regulatory network elements for T cell development by perturbation analysis with PU. 1 and GATA-3. Dev Biol. 2002; 246:103–121. [PubMed: 12027437]
143. Xu W, Carr T, Ramirez K, McGregor S, Sigvardsson M, Kee BL. E2A transcription factors limit expression of Gata3 to facilitate T lymphocyte lineage commitment. Blood. 2013; 121:1534–1542. [PubMed: 23297135]
144. Lee HJ, et al. GATA-3 induces T helper cell type 2 (Th2) cytokine expression and chromatin remodeling in committed Th1 cells. J Exp Med. 2000; 192:105–115. [PubMed: 10880531]
145. Ouyang W, et al. Stat6-independent GATA-3 autoactivation directs IL-4-independent Th2 development and commitment. Immunity. 2000; 12:27–37. [PubMed: 10661403]
146. Klein Wolterink RGJ, et al. Essential, dose-dependent role for the transcription factor Gata3 in the development of IL-5+ and IL-13+ type 2 innate lymphoid cells. Proc Natl Acad Sci U S A. 2013; 110:10240–10245. [PubMed: 23733962]
147. Pai SY, Truitt ML, Ting CN, Leiden JM, Glimcher LH, Ho IC. Critical roles for transcription factor GATA-3 in thymocyte development. Immunity. 2003; 19:863–875. [PubMed: 14670303]
148. Nawijn MC, et al. Enforced expression of GATA-3 during T cell development inhibits maturation of CD8 single-positive cells and induces thymic lymphoma in transgenic mice. J Immunol. 2001; 167:715–723. [PubMed: 11441075]
149. Ostuni R, et al. Latent enhancers activated by stimulation in differentiated cells. Cell. 2013; 152:157–171. [PubMed: 23332752]
150. Pham T-H, et al. Mechanisms of in vivo binding site selection of the hematopoietic master transcription factor PU. 1. Nucleic Acids Res. 2013; 41:6391–6402. [PubMed: 23658224]
151. Heinz S, et al. Effect of natural genetic variation on enhancer selection and function. Nature. 2013; 503:487–492. [PubMed: 24121437]
Rothenberg et al. Page 33
Immunol Rev. Author manuscript; available in PMC 2017 May 01.
Author M
anuscriptA
uthor Manuscript
Author M
anuscriptA
uthor Manuscript
152. Wontakal SN, et al. A core erythroid transcriptional network is repressed by a master regulator of myelo-lymphoid differentiation. Proc Natl Acad Sci U S A. 2012; 109:3832–3837. [PubMed: 22357756]
153. Pham TH, et al. Dynamic epigenetic enhancer signatures reveal key transcription factors associated with monocytic differentiation states. Blood. 2012; 119:e161–171. [PubMed: 22550342]
154. Heinz S, et al. Simple combinations of lineage-determining transcription factors prime cis-regulatory elements required for macrophage and B cell identities. Mol Cell. 2010; 38:576–589. [PubMed: 20513432]
155. Wei G, et al. Genome-wide analyses of transcription factor GATA3-mediated gene regulation in distinct T cell types. Immunity. 2011; 35:299–311. [PubMed: 21867929]
156. Gimferrer I, et al. Regulation of GATA-3 expression during CD4 lineage differentiation. J Immunol. 2011; 186:3892–3898. [PubMed: 21357543]
157. Weber BN, et al. A critical role for TCF-1 in T-lineage specification and differentiation. Nature. 2011; 476:63–68. [PubMed: 21814277]
158. Li L, et al. A far downstream enhancer for murine Bcl11b controls its T-cell specific expression. Blood. 2013; 122:902–911. [PubMed: 23741008]
159. Li P, et al. Reprogramming of T cells to natural killer-like cells upon Bcl11b deletion. Science. 2010; 329:85–89. [PubMed: 20538915]
160. Guo Y, Maillard I, Chakraborti S, Rothenberg EV, Speck NA. Core binding factors are necessary for natural killer cell development, and cooperate with Notch signaling during T cell specification. Blood. 2008; 112:480–492. [PubMed: 18390836]
161. Ikawa T, et al. An essential developmental checkpoint for production of the T cell lineage. Science. 2010; 329:93–96. [PubMed: 20595615]
162. Li L, Leid M, Rothenberg EV. An early T cell lineage commitment checkpoint dependent on the transcription factor Bcl11b. Science. 2010; 329:89–93. [PubMed: 20595614]
163. Wakabayashi Y, et al. Bcl11b is required for differentiation and survival of αβ T lymphocytes. Nat Immunol. 2003; 4:533–539. [PubMed: 12717433]
164. Zhang, JA. PhD Thesis. California Institute of Technology; 2012. Global Analysis of Dynamic Epigenetic Marking and Transcriptional Regulation Underlying T-cell Lineage Commitment.
165. Mingueneau M, et al. The transcriptional landscape of αβ T cell differentiation. Nat Immunol. 2013; 14:619–632. [PubMed: 23644507]
166. Serafini N, Vosshenrich CA, Di Santo JP. Transcriptional regulation of innate lymphoid cell fate. Nat Rev Immunol. 2015; 15:415–428. [PubMed: 26065585]
167. Walker JA, et al. Bcl11b is essential for group 2 innate lymphoid cell development. J Exp Med. 2015; 212:875–882. [PubMed: 25964370]
168. Yu Y, et al. The transcription factor Bcl11b is specifically expressed in group 2 innate lymphoid cells and is essential for their development. J Exp Med. 2015; 212:865–874. [PubMed: 25964371]
169. Califano D, et al. Transcription factor Bcl11b controls identity and function of mature Type 2 innate lymphoid cells. Immunity. 2015; 43:354–368. [PubMed: 26231117]
170. Cismasiu VB, et al. BCL11B participates in the activation of interleukin-2 gene expression in CD4+ T lymphocytes. Blood. 2006; 108:2695–2702. [PubMed: 16809611]
171. Yu Q, et al. T cell factor 1 initiates the T helper type 2 fate by inducing the transcription factor GATA-3 and repressing interferon-γ. Nat Immunol. 2009; 10:992–999. [PubMed: 19648923]
172. Steinke FC, et al. TCF-1 and LEF-1 act upstream of Th-POK to promote the CD4+ T cell fate and interact with Runx3 to silence Cd4 in CD8+ T cells. Nat Immunol. 2014; 15:646–656. [PubMed: 24836425]
173. Vanvalkenburgh J, et al. Critical role of Bcl11b in suppressor function of T regulatory cells and prevention of inflammatory bowel disease. J Exp Med. 2011; 208:2069–2081. [PubMed: 21875956]
174. Barra MM, et al. Transcription Factor 7 Limits Regulatory T Cell Generation in the Thymus. J Immunol. 2015; 195:3058–3070. [PubMed: 26324778]
Rothenberg et al. Page 34
Immunol Rev. Author manuscript; available in PMC 2017 May 01.
Author M
anuscriptA
uthor Manuscript
Author M
anuscriptA
uthor Manuscript
175. De Pooter RF, Kee BL. E proteins and the regulation of early lymphocyte development. Immunol Rev. 2010; 238:93–109. [PubMed: 20969587]
176. Kaech SM, Cui W. Transcriptional control of effector and memory CD8+ T cell differentiation. Nat Rev Immunol. 2012; 12:749–761. [PubMed: 23080391]
177. Vigano MA, et al. An epigenetic profile of early T-cell development from multipotent progenitors to committed T-cell descendants. Eur J Immunol. 2014; 44:1181–1193. [PubMed: 24374622]
178. Richie Ehrlich LI, Serwold T, Weissman IL. In vitro assays misrepresent in vivo lineage potentials of murine lymphoid progenitors. Blood. 2011; 117:2618–2624. [PubMed: 21163922]
179. Inlay MA, et al. Ly6d marks the earliest stage of B-cell specification and identifies the branchpoint between B-cell and T-cell development. Genes Dev. 2009; 23:2376–2381. [PubMed: 19833765]
180. Wong SH, et al. Transcription factor RORα is critical for nuocyte development. Nat Immunol. 2012; 13:229–236. [PubMed: 22267218]
Rothenberg et al. Page 35
Immunol Rev. Author manuscript; available in PMC 2017 May 01.
Author M
anuscriptA
uthor Manuscript
Author M
anuscriptA
uthor Manuscript
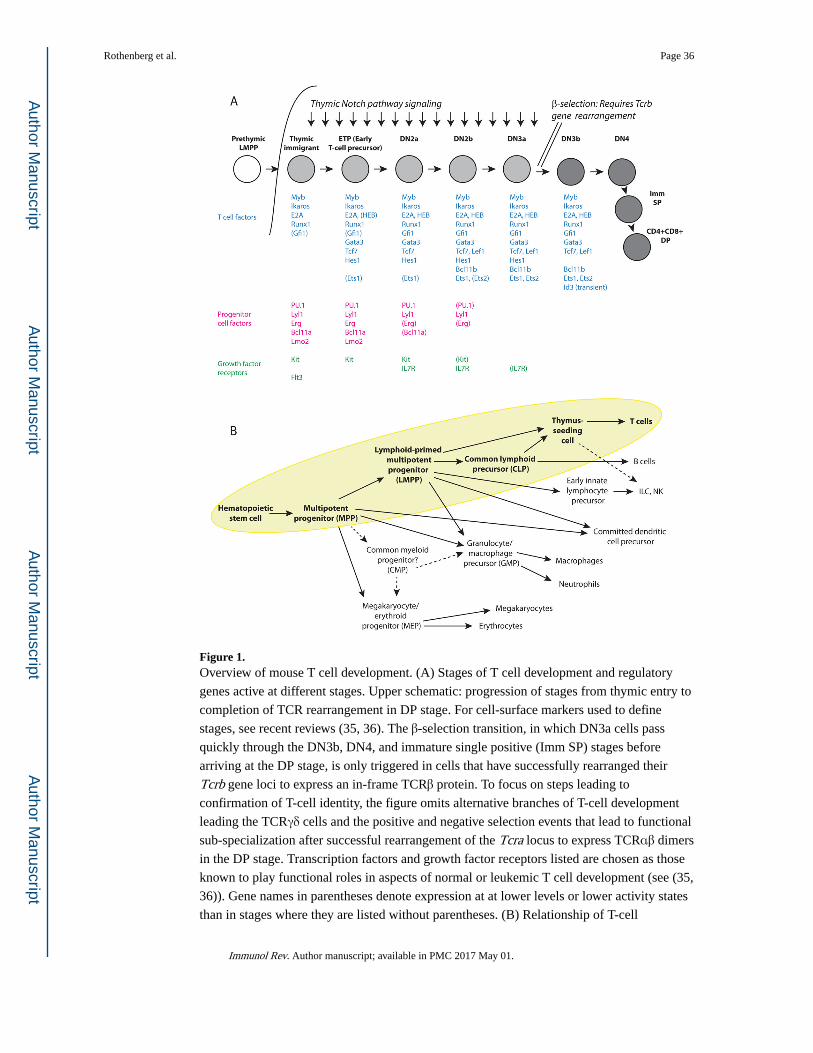
Figure 1. Overview of mouse T cell development. (A) Stages of T cell development and regulatory
genes active at different stages. Upper schematic: progression of stages from thymic entry to
completion of TCR rearrangement in DP stage. For cell-surface markers used to define
stages, see recent reviews (35, 36). The β-selection transition, in which DN3a cells pass
quickly through the DN3b, DN4, and immature single positive (Imm SP) stages before
arriving at the DP stage, is only triggered in cells that have successfully rearranged their
Tcrb gene loci to express an in-frame TCRβ protein. To focus on steps leading to
confirmation of T-cell identity, the figure omits alternative branches of T-cell development
leading the TCRγδ cells and the positive and negative selection events that lead to functional
sub-specialization after successful rearrangement of the Tcra locus to express TCRαβ dimers
in the DP stage. Transcription factors and growth factor receptors listed are chosen as those
known to play functional roles in aspects of normal or leukemic T cell development (see (35,
36)). Gene names in parentheses denote expression at at lower levels or lower activity states
than in stages where they are listed without parentheses. (B) Relationship of T-cell
Rothenberg et al. Page 36
Immunol Rev. Author manuscript; available in PMC 2017 May 01.
Author M
anuscriptA
uthor Manuscript
Author M
anuscriptA
uthor Manuscript
precursors to other hematopoietic fates. The figure presents a compromise view of the main
inputs to the T-cell pathway relative to MPPs, LMPPs, and myeloid or erythroid-committed
cell types. The yellow background and boldface type highlight stages that are in the pathway
to generate T cells. For simplicity, pathways leading to eosinophils, basophils, and mast cells
and the complexities of precursor relationships in the Innate Lymphoid Cell (ILC)—Natural
Killer (NK) and Dendritic cell (DC) pathways are omitted. As described in the text, the roles
of certain restricted progenitors in the erythromyeloid lineages are still controversial (dashed
arrows). The main pathways indicated here are supported by recent single-cell analyses (55,
56).
Rothenberg et al. Page 37
Immunol Rev. Author manuscript; available in PMC 2017 May 01.
Author M
anuscriptA
uthor Manuscript
Author M
anuscriptA
uthor Manuscript
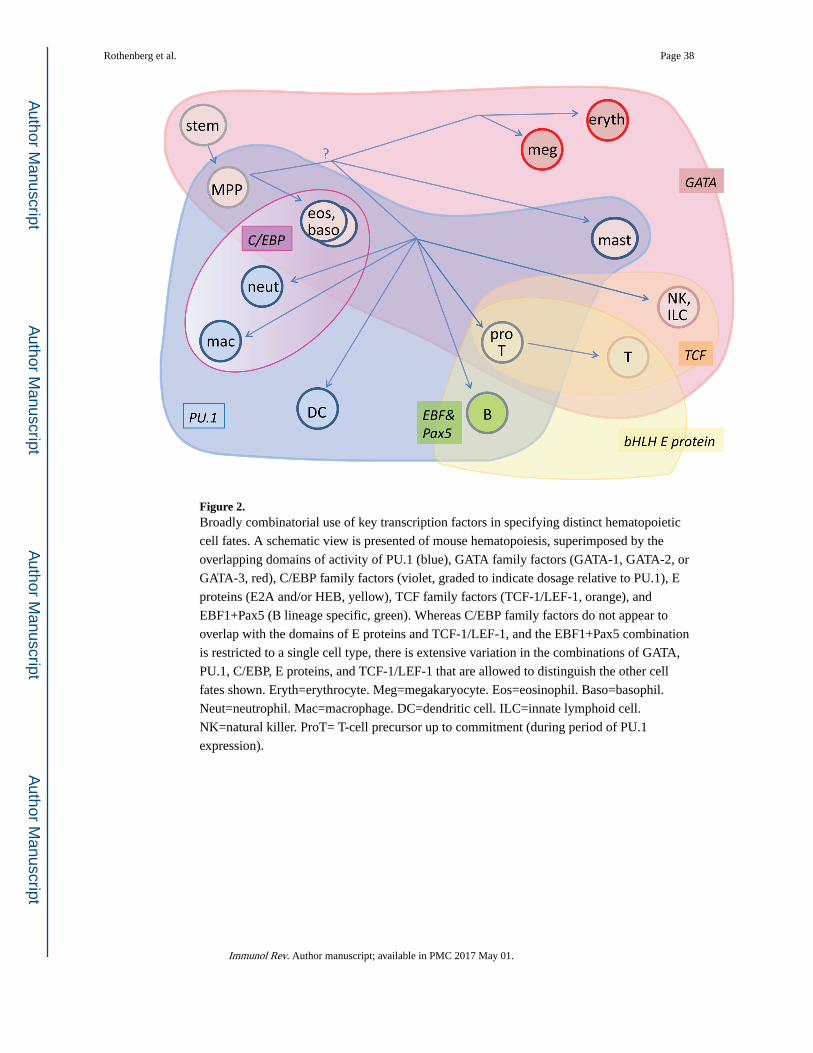
Figure 2. Broadly combinatorial use of key transcription factors in specifying distinct hematopoietic
cell fates. A schematic view is presented of mouse hematopoiesis, superimposed by the
overlapping domains of activity of PU.1 (blue), GATA family factors (GATA-1, GATA-2, or
GATA-3, red), C/EBP family factors (violet, graded to indicate dosage relative to PU.1), E
proteins (E2A and/or HEB, yellow), TCF family factors (TCF-1/LEF-1, orange), and
EBF1+Pax5 (B lineage specific, green). Whereas C/EBP family factors do not appear to
overlap with the domains of E proteins and TCF-1/LEF-1, and the EBF1+Pax5 combination
is restricted to a single cell type, there is extensive variation in the combinations of GATA,
PU.1, C/EBP, E proteins, and TCF-1/LEF-1 that are allowed to distinguish the other cell
fates shown. Eryth=erythrocyte. Meg=megakaryocyte. Eos=eosinophil. Baso=basophil.
Neut=neutrophil. Mac=macrophage. DC=dendritic cell. ILC=innate lymphoid cell.
NK=natural killer. ProT= T-cell precursor up to commitment (during period of PU.1
expression).
Rothenberg et al. Page 38
Immunol Rev. Author manuscript; available in PMC 2017 May 01.
Author M
anuscriptA
uthor Manuscript
Author M
anuscriptA
uthor Manuscript
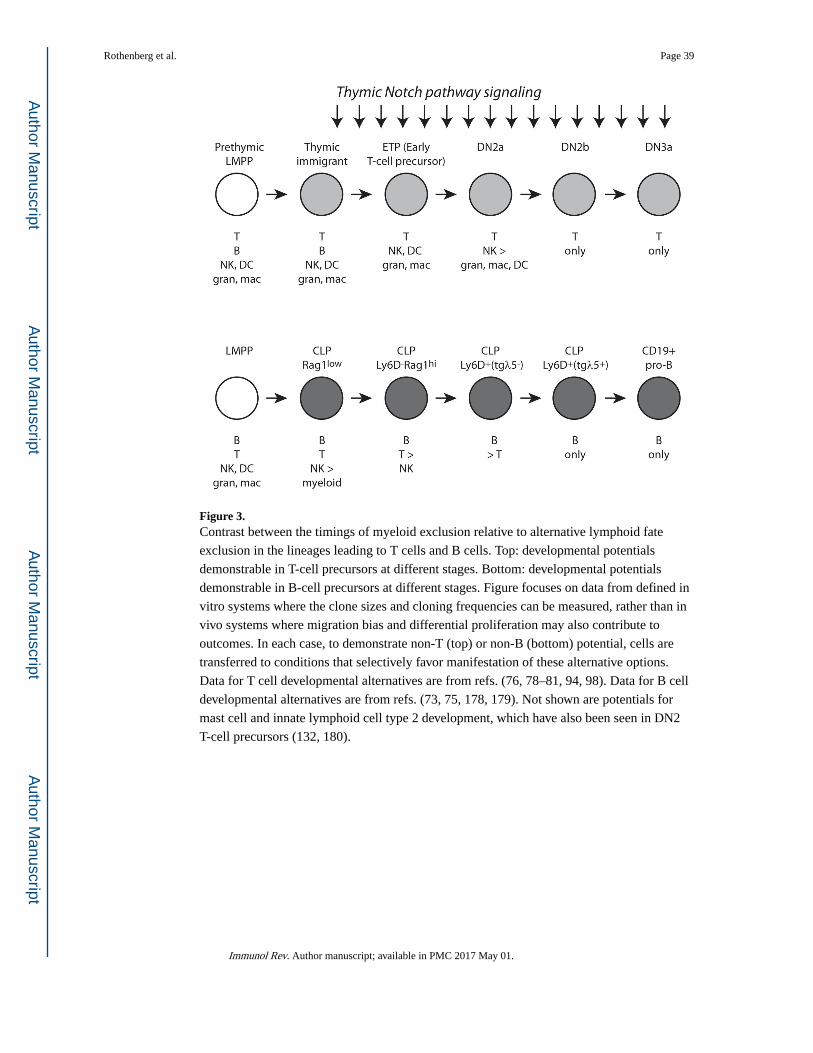
Figure 3. Contrast between the timings of myeloid exclusion relative to alternative lymphoid fate
exclusion in the lineages leading to T cells and B cells. Top: developmental potentials
demonstrable in T-cell precursors at different stages. Bottom: developmental potentials
demonstrable in B-cell precursors at different stages. Figure focuses on data from defined in
vitro systems where the clone sizes and cloning frequencies can be measured, rather than in
vivo systems where migration bias and differential proliferation may also contribute to
outcomes. In each case, to demonstrate non-T (top) or non-B (bottom) potential, cells are
transferred to conditions that selectively favor manifestation of these alternative options.
Data for T cell developmental alternatives are from refs. (76, 78–81, 94, 98). Data for B cell
developmental alternatives are from refs. (73, 75, 178, 179). Not shown are potentials for
mast cell and innate lymphoid cell type 2 development, which have also been seen in DN2
T-cell precursors (132, 180).
Rothenberg et al. Page 39
Immunol Rev. Author manuscript; available in PMC 2017 May 01.
Author M
anuscriptA
uthor Manuscript
Author M
anuscriptA
uthor Manuscript
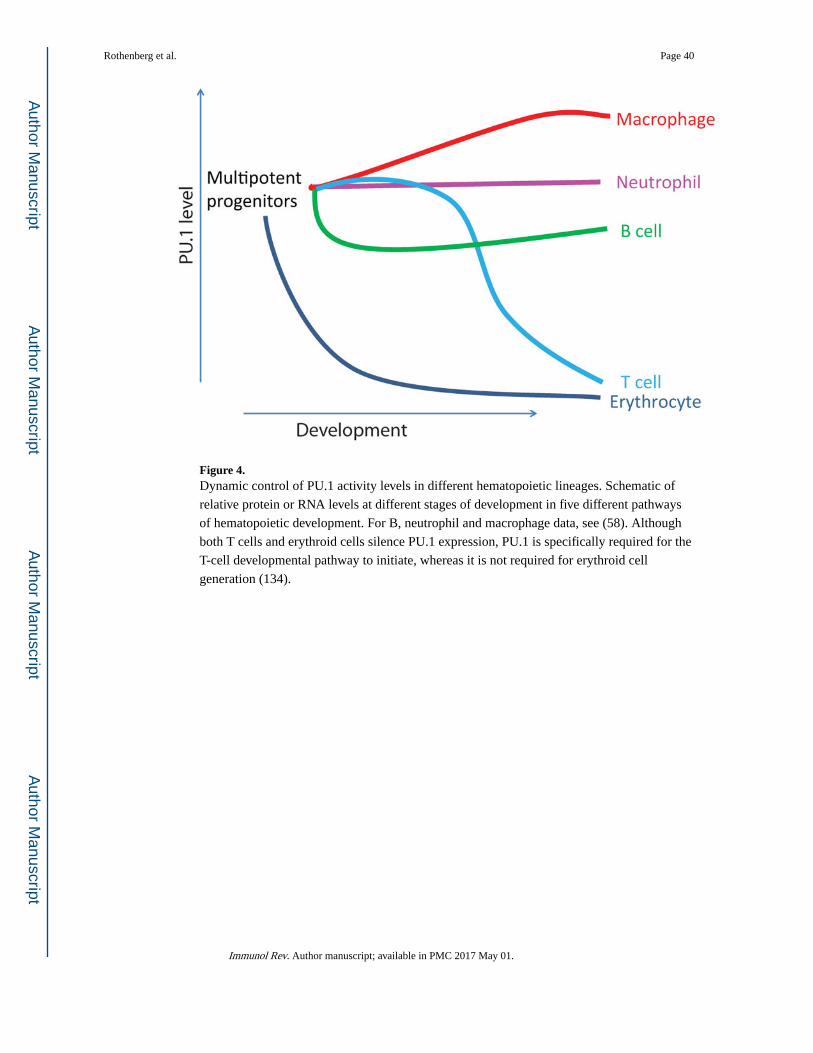
Figure 4. Dynamic control of PU.1 activity levels in different hematopoietic lineages. Schematic of
relative protein or RNA levels at different stages of development in five different pathways
of hematopoietic development. For B, neutrophil and macrophage data, see (58). Although
both T cells and erythroid cells silence PU.1 expression, PU.1 is specifically required for the
T-cell developmental pathway to initiate, whereas it is not required for erythroid cell
generation (134).
Rothenberg et al. Page 40
Immunol Rev. Author manuscript; available in PMC 2017 May 01.
Author M
anuscriptA
uthor Manuscript
Author M
anuscriptA
uthor Manuscript
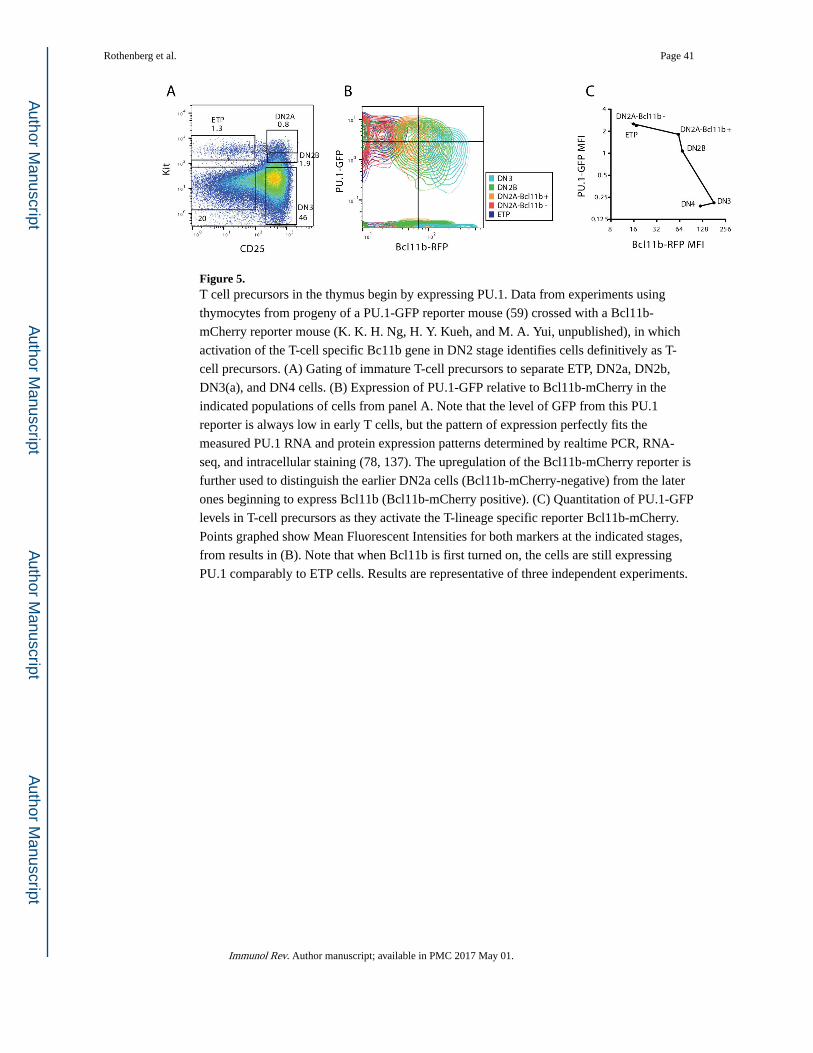
Figure 5. T cell precursors in the thymus begin by expressing PU.1. Data from experiments using
thymocytes from progeny of a PU.1-GFP reporter mouse (59) crossed with a Bcl11b-
mCherry reporter mouse (K. K. H. Ng, H. Y. Kueh, and M. A. Yui, unpublished), in which
activation of the T-cell specific Bc11b gene in DN2 stage identifies cells definitively as T-
cell precursors. (A) Gating of immature T-cell precursors to separate ETP, DN2a, DN2b,
DN3(a), and DN4 cells. (B) Expression of PU.1-GFP relative to Bcl11b-mCherry in the
indicated populations of cells from panel A. Note that the level of GFP from this PU.1
reporter is always low in early T cells, but the pattern of expression perfectly fits the
measured PU.1 RNA and protein expression patterns determined by realtime PCR, RNA-
seq, and intracellular staining (78, 137). The upregulation of the Bcl11b-mCherry reporter is
further used to distinguish the earlier DN2a cells (Bcl11b-mCherry-negative) from the later
ones beginning to express Bcl11b (Bcl11b-mCherry positive). (C) Quantitation of PU.1-GFP
levels in T-cell precursors as they activate the T-lineage specific reporter Bcl11b-mCherry.
Points graphed show Mean Fluorescent Intensities for both markers at the indicated stages,
from results in (B). Note that when Bcl11b is first turned on, the cells are still expressing
PU.1 comparably to ETP cells. Results are representative of three independent experiments.
Rothenberg et al. Page 41
Immunol Rev. Author manuscript; available in PMC 2017 May 01.
Author M
anuscriptA
uthor Manuscript
Author M
anuscriptA
uthor Manuscript
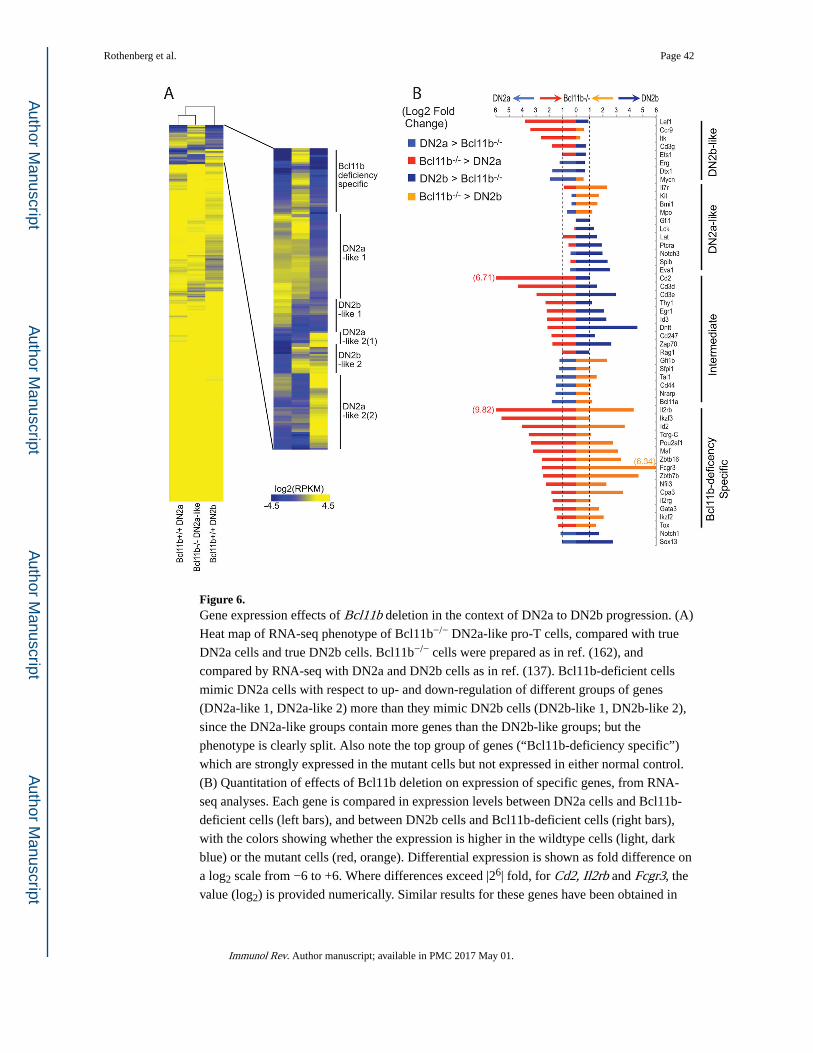
Figure 6. Gene expression effects of Bcl11b deletion in the context of DN2a to DN2b progression. (A)
Heat map of RNA-seq phenotype of Bcl11b−/− DN2a-like pro-T cells, compared with true
DN2a cells and true DN2b cells. Bcl11b−/− cells were prepared as in ref. (162), and
compared by RNA-seq with DN2a and DN2b cells as in ref. (137). Bcl11b-deficient cells
mimic DN2a cells with respect to up- and down-regulation of different groups of genes
(DN2a-like 1, DN2a-like 2) more than they mimic DN2b cells (DN2b-like 1, DN2b-like 2),
since the DN2a-like groups contain more genes than the DN2b-like groups; but the
phenotype is clearly split. Also note the top group of genes (“Bcl11b-deficiency specific”)
which are strongly expressed in the mutant cells but not expressed in either normal control.
(B) Quantitation of effects of Bcl11b deletion on expression of specific genes, from RNA-
seq analyses. Each gene is compared in expression levels between DN2a cells and Bcl11b-
deficient cells (left bars), and between DN2b cells and Bcl11b-deficient cells (right bars),
with the colors showing whether the expression is higher in the wildtype cells (light, dark
blue) or the mutant cells (red, orange). Differential expression is shown as fold difference on
a log2 scale from −6 to +6. Where differences exceed |26| fold, for Cd2, Il2rb and Fcgr3, the
value (log2) is provided numerically. Similar results for these genes have been obtained in
Rothenberg et al. Page 42
Immunol Rev. Author manuscript; available in PMC 2017 May 01.
Author M
anuscriptA
uthor Manuscript
Author M
anuscriptA
uthor Manuscript
>4 independent experiments (J. A. Zhang, W. Zeng, L. Li, A. Mortazavi, E. V. Rothenberg,
unpublished).
Rothenberg et al. Page 43
Immunol Rev. Author manuscript; available in PMC 2017 May 01.
Author M
anuscriptA
uthor Manuscript
Author M
anuscriptA
uthor Manuscript
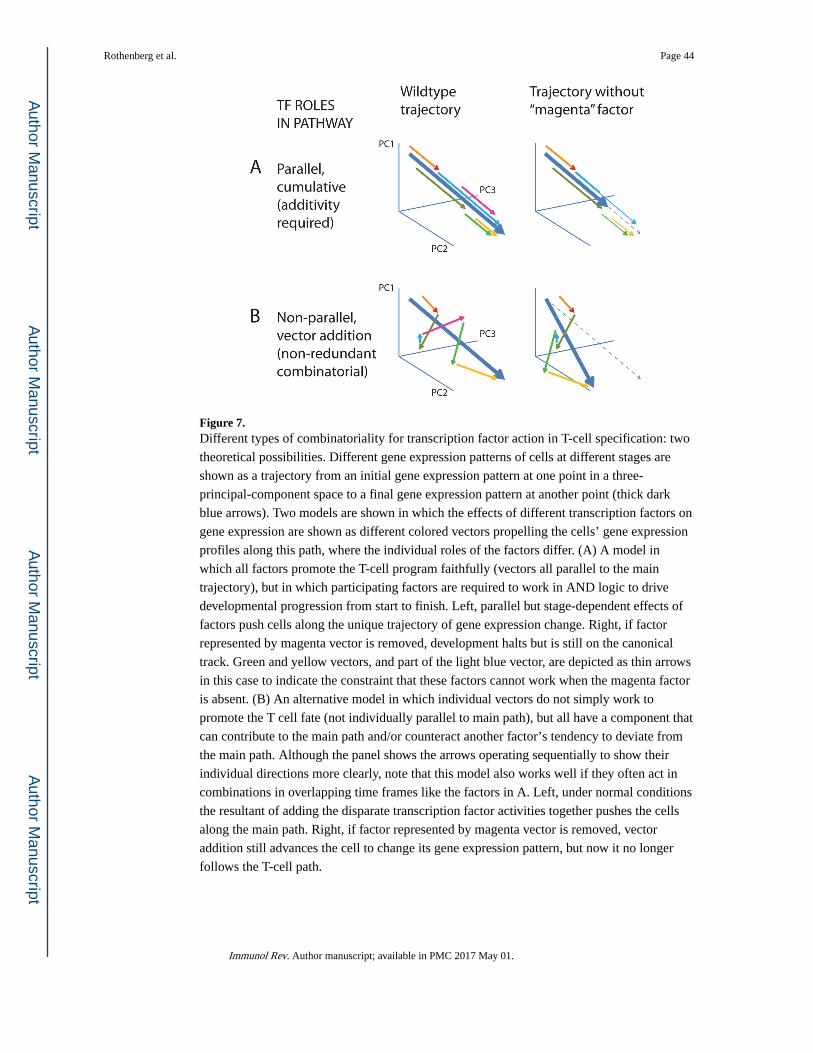
Figure 7. Different types of combinatoriality for transcription factor action in T-cell specification: two
theoretical possibilities. Different gene expression patterns of cells at different stages are
shown as a trajectory from an initial gene expression pattern at one point in a three-
principal-component space to a final gene expression pattern at another point (thick dark
blue arrows). Two models are shown in which the effects of different transcription factors on
gene expression are shown as different colored vectors propelling the cells’ gene expression
profiles along this path, where the individual roles of the factors differ. (A) A model in
which all factors promote the T-cell program faithfully (vectors all parallel to the main
trajectory), but in which participating factors are required to work in AND logic to drive
developmental progression from start to finish. Left, parallel but stage-dependent effects of
factors push cells along the unique trajectory of gene expression change. Right, if factor
represented by magenta vector is removed, development halts but is still on the canonical
track. Green and yellow vectors, and part of the light blue vector, are depicted as thin arrows
in this case to indicate the constraint that these factors cannot work when the magenta factor
is absent. (B) An alternative model in which individual vectors do not simply work to
promote the T cell fate (not individually parallel to main path), but all have a component that
can contribute to the main path and/or counteract another factor’s tendency to deviate from
the main path. Although the panel shows the arrows operating sequentially to show their
individual directions more clearly, note that this model also works well if they often act in
combinations in overlapping time frames like the factors in A. Left, under normal conditions
the resultant of adding the disparate transcription factor activities together pushes the cells
along the main path. Right, if factor represented by magenta vector is removed, vector
addition still advances the cell to change its gene expression pattern, but now it no longer
follows the T-cell path.
Rothenberg et al. Page 44
Immunol Rev. Author manuscript; available in PMC 2017 May 01.
Author M
anuscriptA
uthor Manuscript
Author M
anuscriptA
uthor Manuscript
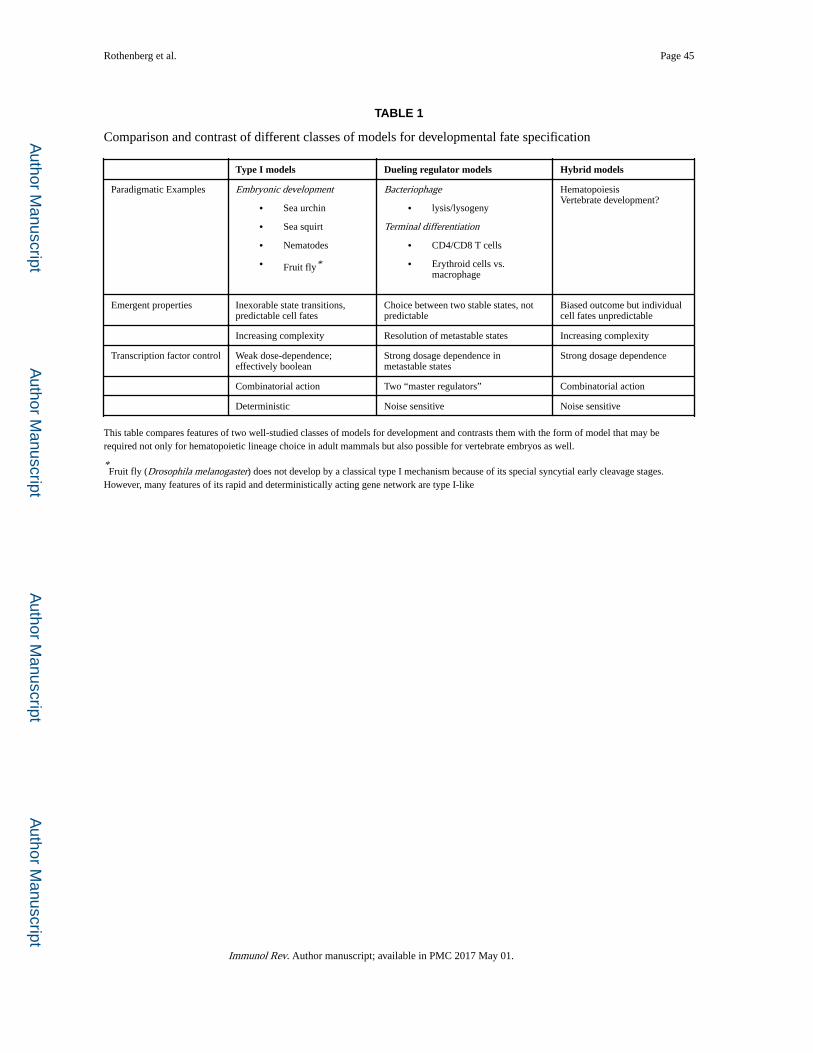
Author M
anuscriptA
uthor Manuscript
Author M
anuscriptA
uthor Manuscript
Rothenberg et al. Page 45
TABLE 1
Comparison and contrast of different classes of models for developmental fate specification
Type I models Dueling regulator models Hybrid models
Paradigmatic Examples Embryonic development
• Sea urchin
• Sea squirt
• Nematodes
• Fruit fly*
Bacteriophage
• lysis/lysogeny
Terminal differentiation
• CD4/CD8 T cells
• Erythroid cells vs. macrophage
HematopoiesisVertebrate development?
Emergent properties Inexorable state transitions, predictable cell fates
Choice between two stable states, not predictable
Biased outcome but individual cell fates unpredictable
Increasing complexity Resolution of metastable states Increasing complexity
Transcription factor control Weak dose-dependence; effectively boolean
Strong dosage dependence in metastable states
Strong dosage dependence
Combinatorial action Two “master regulators” Combinatorial action
Deterministic Noise sensitive Noise sensitive
This table compares features of two well-studied classes of models for development and contrasts them with the form of model that may be required not only for hematopoietic lineage choice in adult mammals but also possible for vertebrate embryos as well.
*Fruit fly (Drosophila melanogaster) does not develop by a classical type I mechanism because of its special syncytial early cleavage stages.
However, many features of its rapid and deterministically acting gene network are type I-like
Immunol Rev. Author manuscript; available in PMC 2017 May 01.