Embed Size (px)
Citation preview
Hemoglobin A1C as a diagnostic tool for diabetes screening and new-tool for diabetes screening and new-onset diabetes prediction - A 6-year community-based prospective study -
임 수 MD, MPH, PHD, Dr.PHSeoul National University College of MedicineSeoul National University Bundang Hospital
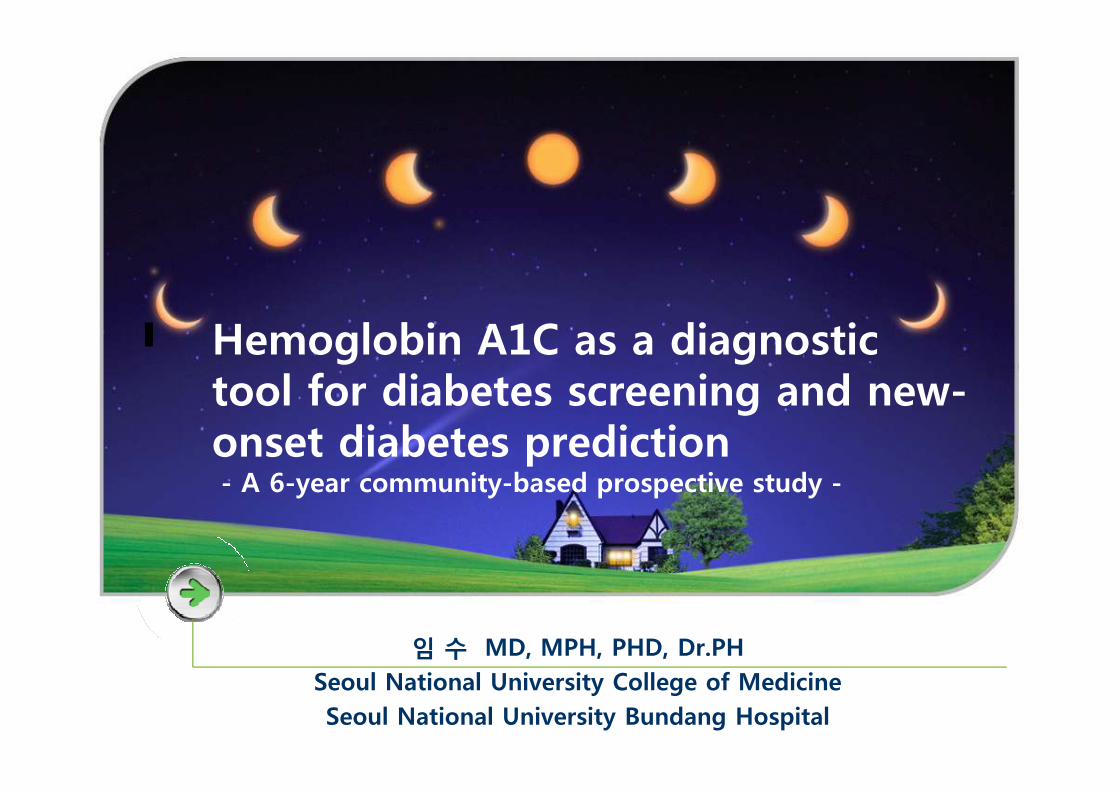
Global Projections for the DiabetesGlobal Projections for the DiabetesEpidemic: 2003Epidemic: 2003--2025 (millions)2025 (millions)
25.025.0
39.739.7
59%59%
38.2
44.2
16%
81.8
156.1
91%
18.2
North AmericaNorth America
EuropeEurope AsiaAsia
AfricaAfrica
MidMid-- EastEast
WORLDWORLD
2003 = 189 million2003 = 189 million
2025 = 324 million2025 = 324 million
Increase 72%Increase 72%
10.4
19.7
88%1.11.1
1.71.7
59%59%
13.613.6
26.926.9
98%98%
18.2
35.9
97%
OceaniaOceania
SouthSouth
andand
CentralCentral
AmericaAmerica
AfricaAfrica
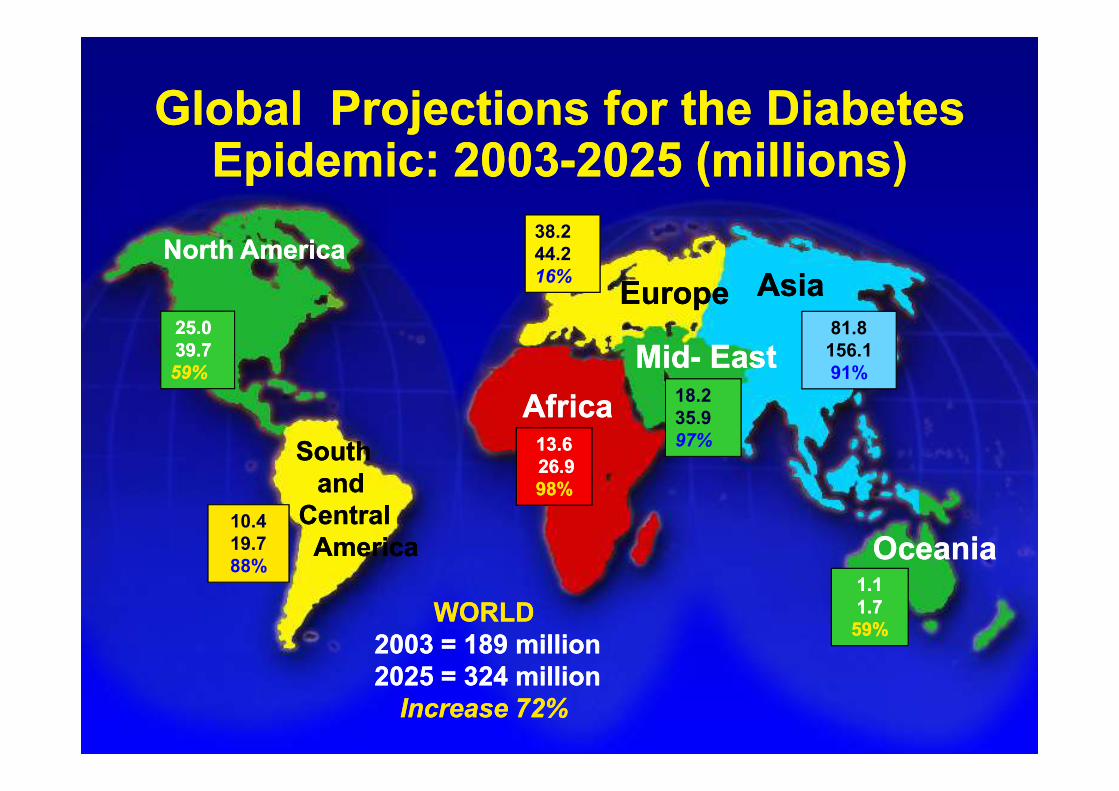
Type 2 Diabetes Prevalence Is Projected
to Reach 7 Million by 2020 in KOREA
1000만
1970 2003 202045만
500만
Statistical office, Korea 2005
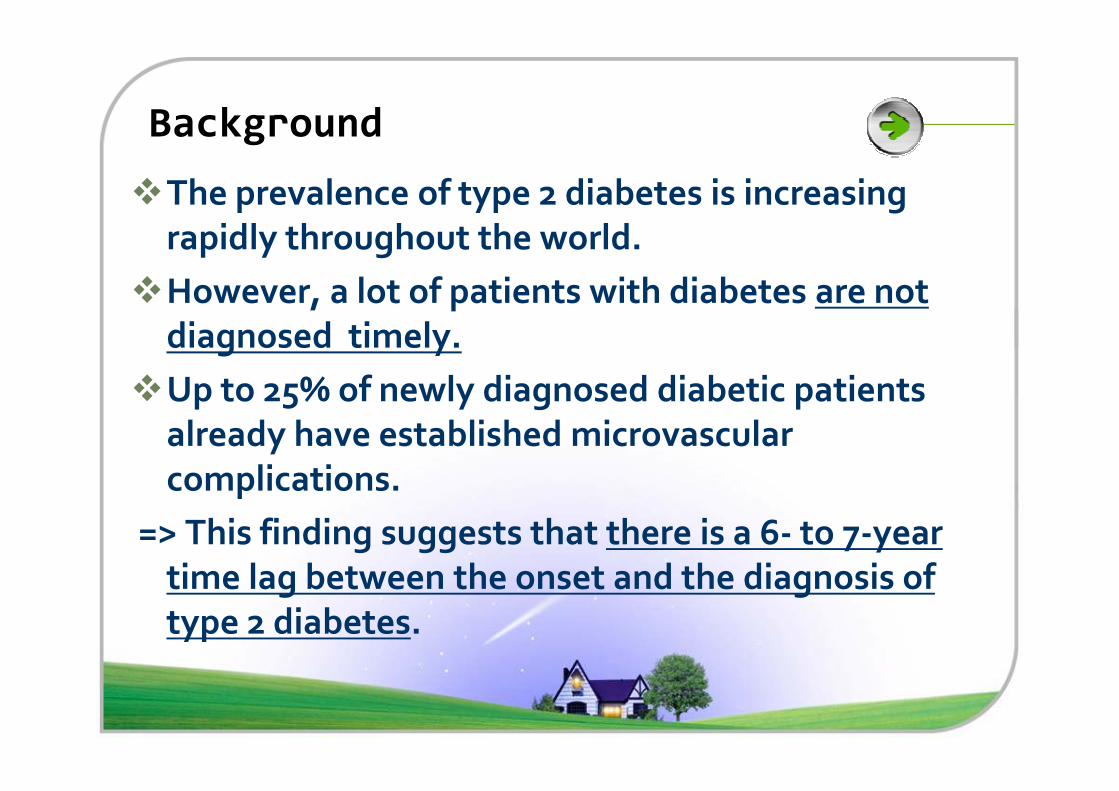
Background
�The prevalence of type 2 diabetes is increasing
rapidly throughout the world.
�However, a lot of patients with diabetes are not
diagnosed timely.
�Up to 25% of newly diagnosed diabetic patients �Up to 25% of newly diagnosed diabetic patients
already have established microvascular
complications.
=> This finding suggests that there is a 6- to 7-year
time lag between the onset and the diagnosis of
type 2 diabetes.
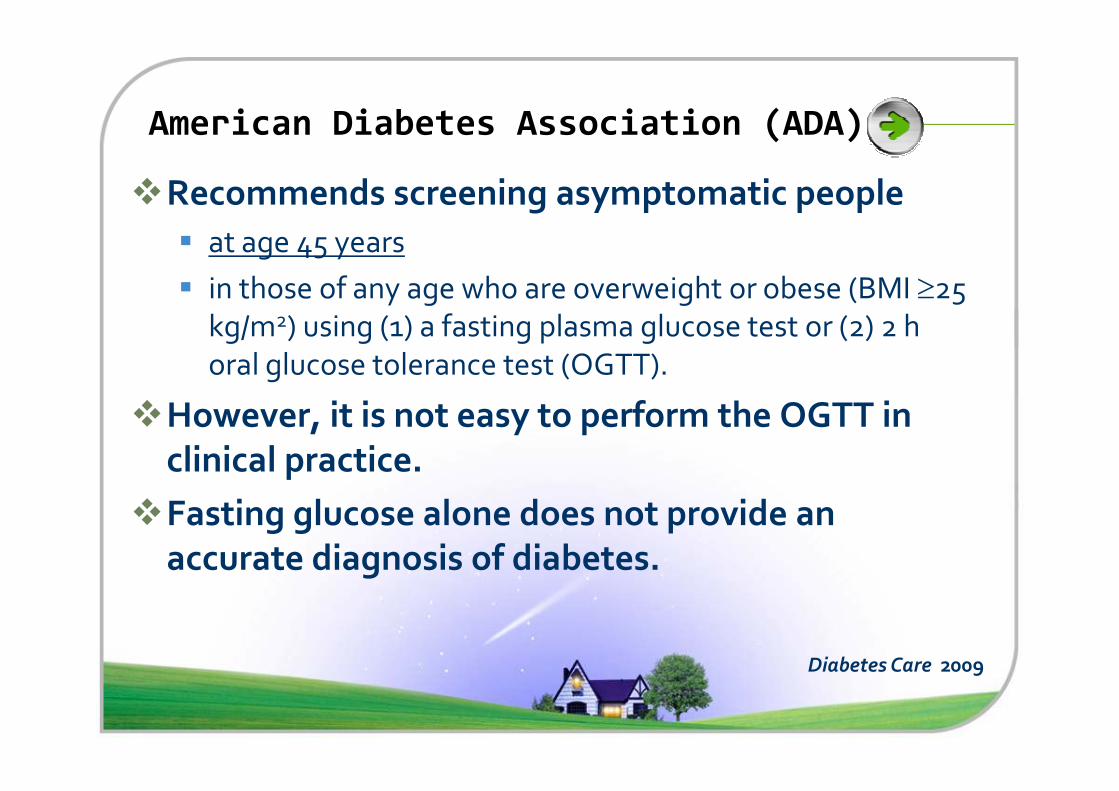
American Diabetes Association (ADA)
�Recommends screening asymptomatic people
� at age 45 years
� in those of any age who are overweight or obese (BMI ≥25 kg/m2) using (1) a fasting plasma glucose test or (2) 2 h
oral glucose tolerance test (OGTT).
�However, it is not easy to perform the OGTT in �However, it is not easy to perform the OGTT in
clinical practice.
�Fasting glucose alone does not provide an
accurate diagnosis of diabetes.
Diabetes Care 2009
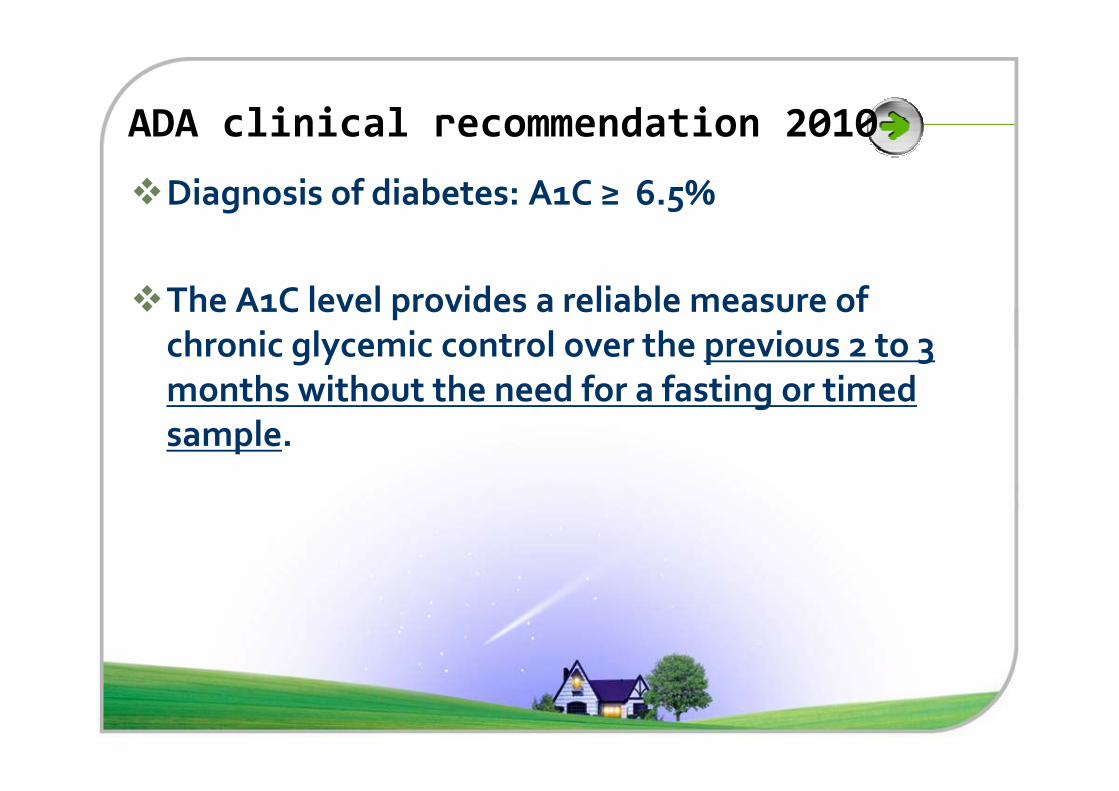
ADA clinical recommendation 2010
�Diagnosis of diabetes: A1C ≥ 6.5%
�The A1C level provides a reliable measure of
chronic glycemic control over the previous 2 to 3
months without the need for a fasting or timed months without the need for a fasting or timed
sample.
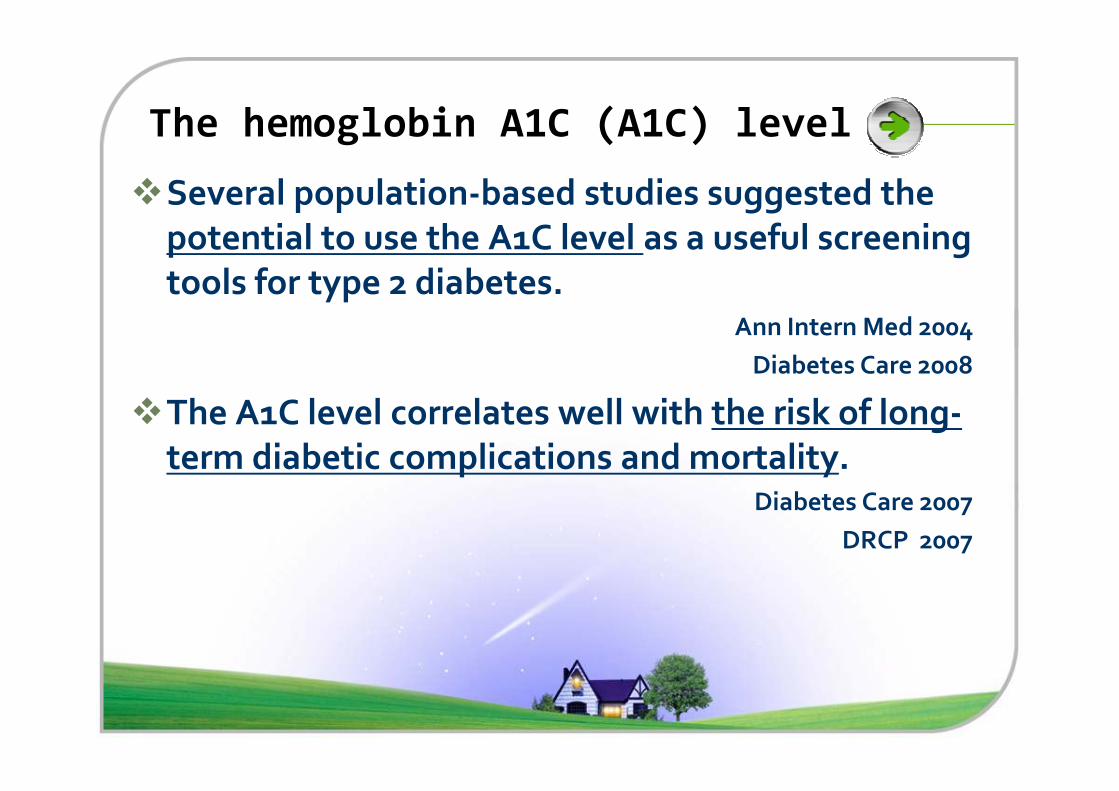
The hemoglobin A1C (A1C) level
�Several population-based studies suggested the
potential to use the A1C level as a useful screening
tools for type 2 diabetes.Ann Intern Med 2004
Diabetes Care 2008
�The A1C level correlates well with the risk of long-�The A1C level correlates well with the risk of long-
term diabetic complications and mortality. Diabetes Care 2007
DRCP 2007
Glycated Hemoglobin, Diabetes,
and Cardiovascular Risk
in Nondiabetic Adultsin Nondiabetic Adults
Background
�Fasting glucose is the standard measure used for the diagnosis of diabetes in the United States.
�Glycated hemoglobin (A1c) has been recommended only for the determination of glucose control. glucose control.
�New clinical practice recommendations from the American Diabetes Association advocate the use of A1c in the diagnosis of diabetes.
Objective
�To compare the prognostic value of A1c and
fasting glucose for identifying adults at risk
for (1) diabetes, (2) coronary heart disease,
(3) ischemic stroke, and (4) death from any (3) ischemic stroke, and (4) death from any
cause in a large community-based cohort of
middle-aged adults who did not have a
history of diabetes.
Study Population
�The Atherosclerosis Risk in Communities (ARIC) study
:community-based prospective cohort study of 15,792 middle-aged adults from four U.S. communities.
�The baseline visit � attended by 14,348 participants
� during 1990–1992
� stored whole-blood samples were available
for measurement of A1c
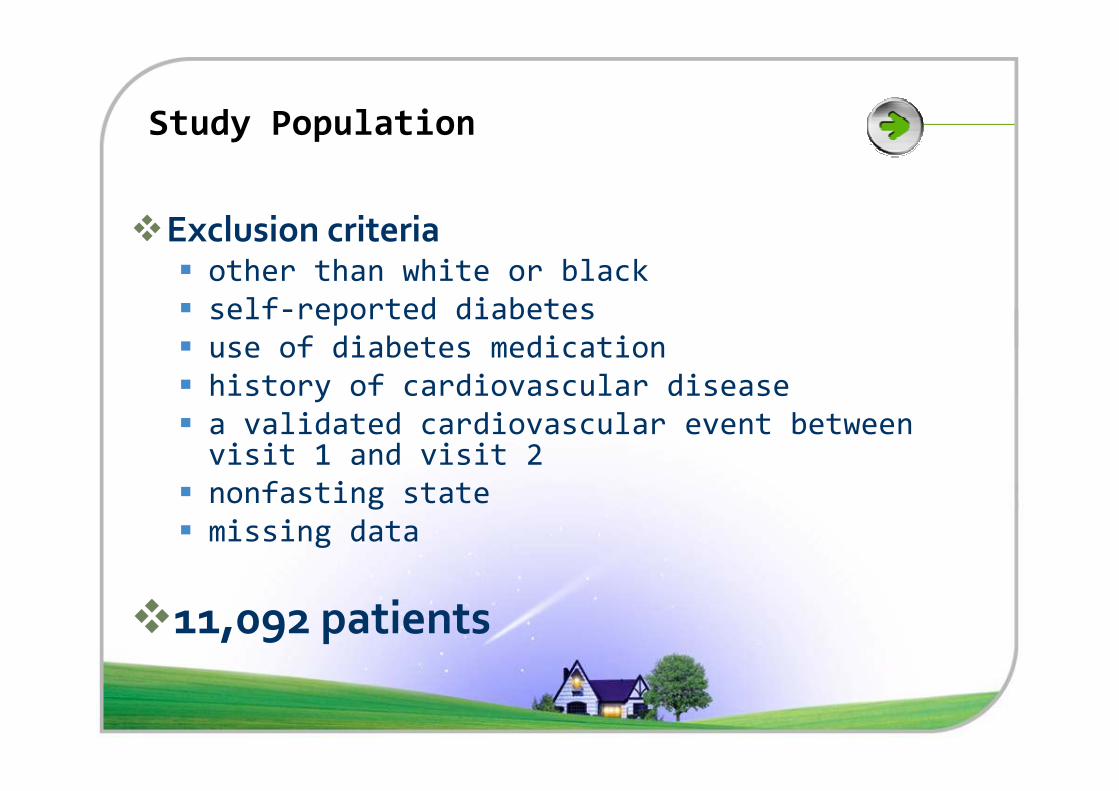
Study Population
�Exclusion criteria� other than white or black
� self-reported diabetes
� use of diabetes medication
� history of cardiovascular disease� history of cardiovascular disease
� a validated cardiovascular event between visit 1 and visit 2
� nonfasting state
� missing data
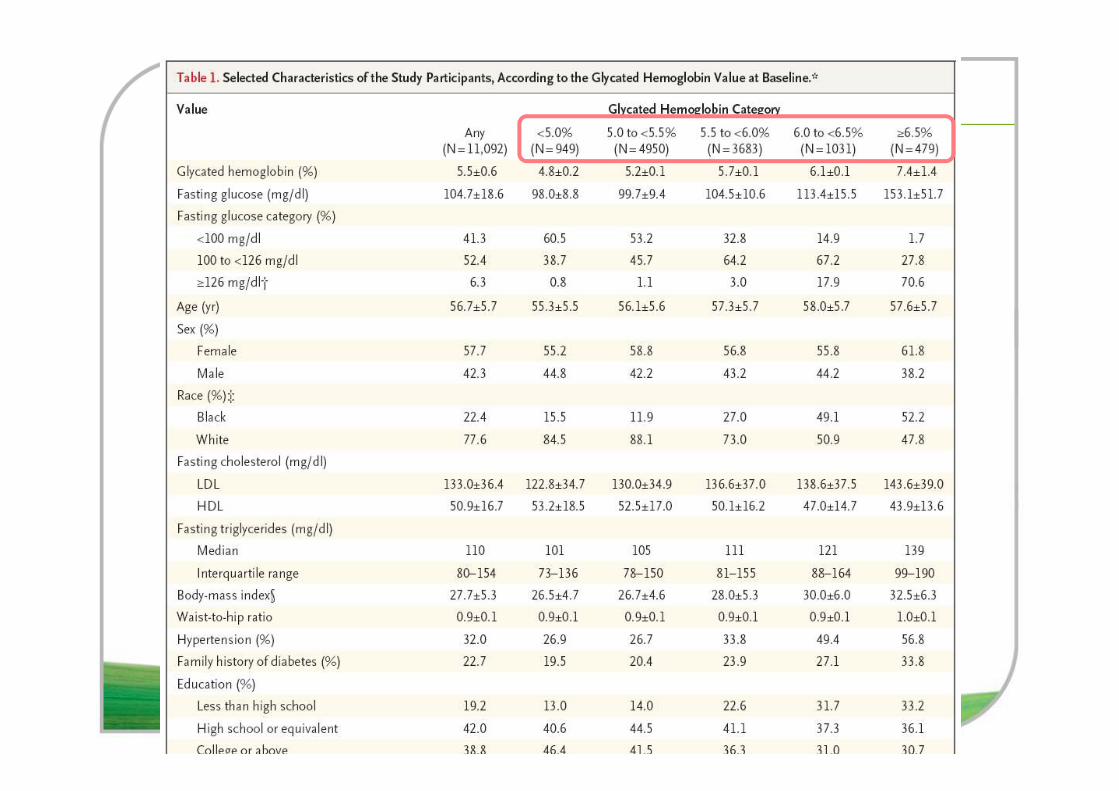
�11,092 patients
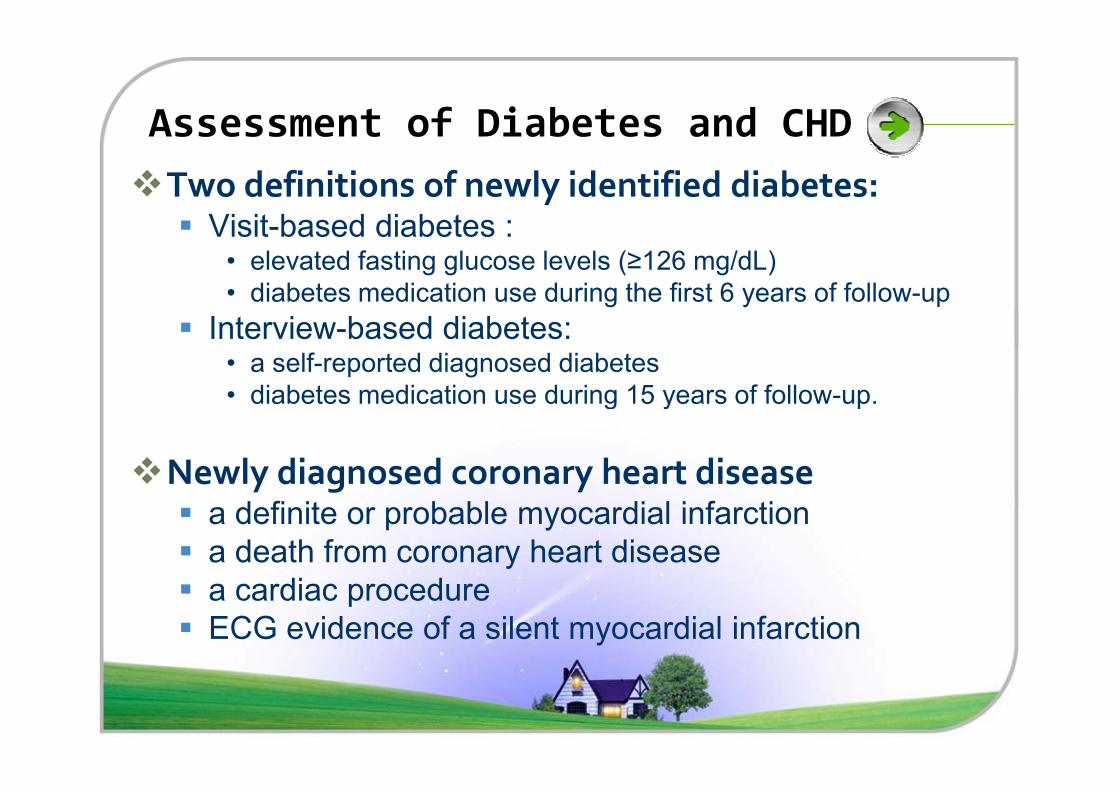
Assessment of Diabetes and CHD
�Two definitions of newly identified diabetes:� Visit-based diabetes :
• elevated fasting glucose levels (≥126 mg/dL)
• diabetes medication use during the first 6 years of follow-up
� Interview-based diabetes: • a self-reported diagnosed diabetes
• diabetes medication use during 15 years of follow-up.• diabetes medication use during 15 years of follow-up.
�Newly diagnosed coronary heart disease� a definite or probable myocardial infarction
� a death from coronary heart disease
� a cardiac procedure
� ECG evidence of a silent myocardial infarction
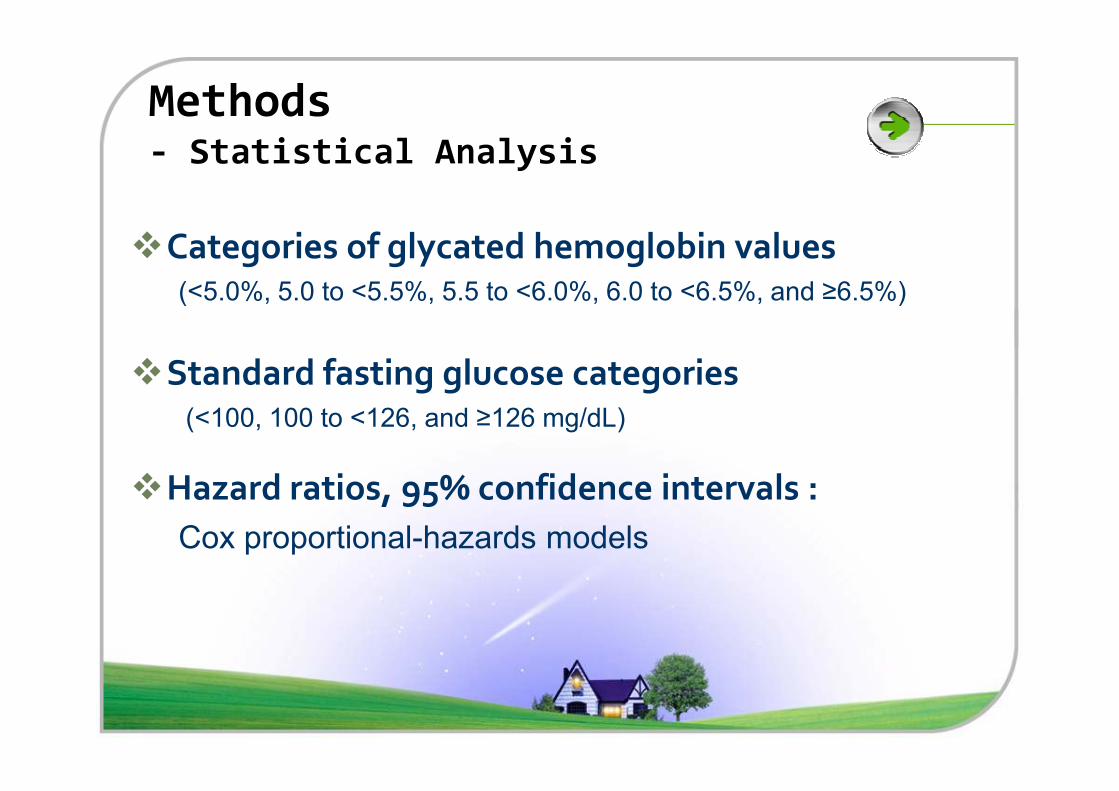
Methods- Statistical Analysis
�Categories of glycated hemoglobin values (<5.0%, 5.0 to <5.5%, 5.5 to <6.0%, 6.0 to <6.5%, and ≥6.5%)
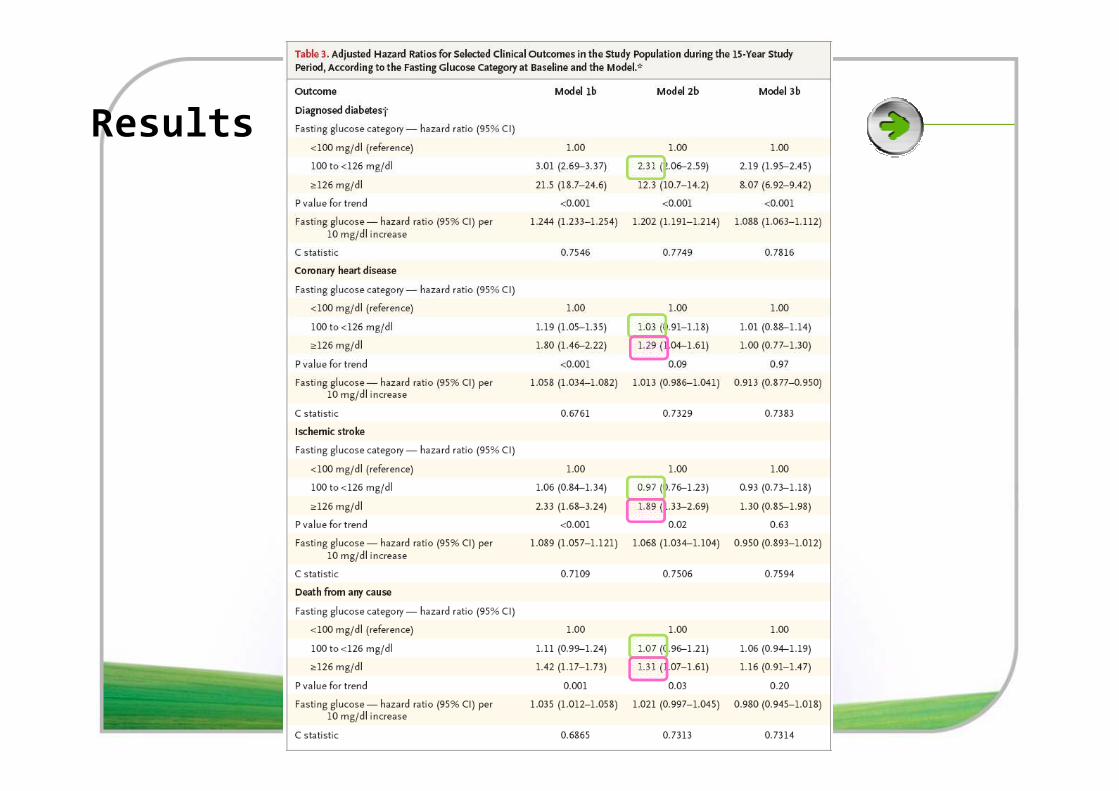
�Standard fasting glucose categories (<100, 100 to <126, and ≥126 mg/dL)
�Hazard ratios, 95% confidence intervals :
Cox proportional-hazards models
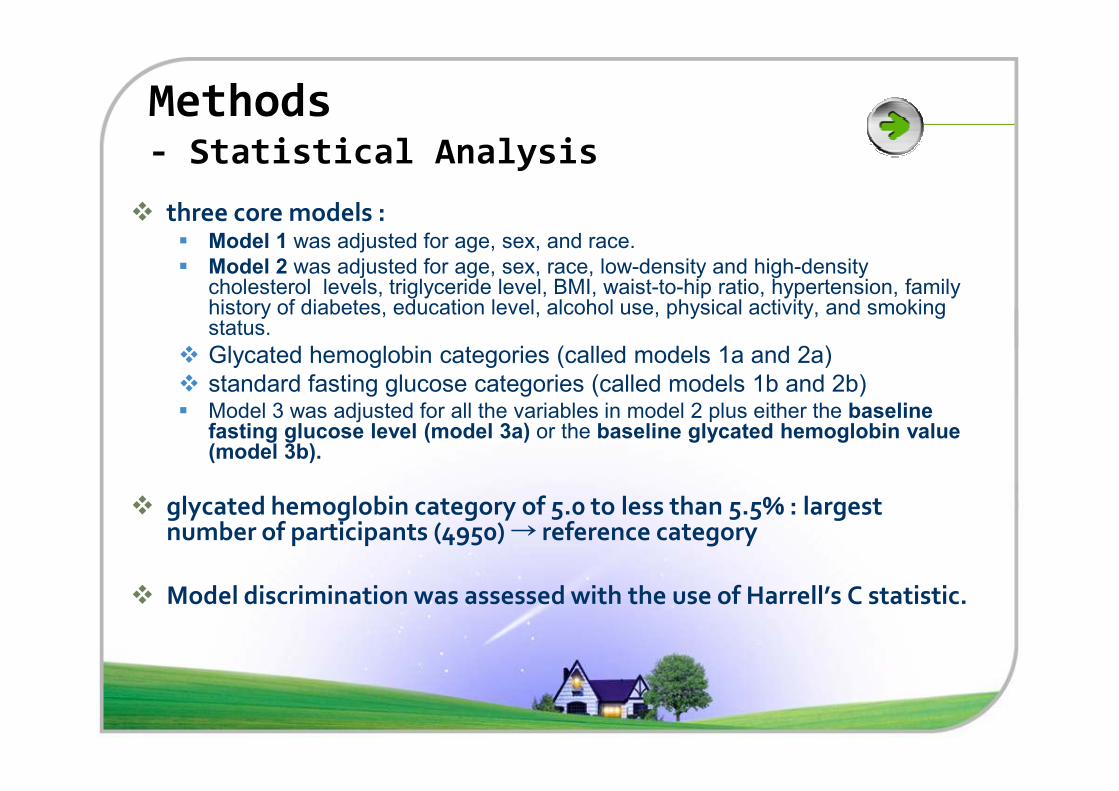
Methods- Statistical Analysis
� three core models : � Model 1 was adjusted for age, sex, and race.
� Model 2 was adjusted for age, sex, race, low-density and high-density cholesterol levels, triglyceride level, BMI, waist-to-hip ratio, hypertension, family history of diabetes, education level, alcohol use, physical activity, and smoking status.
� Glycated hemoglobin categories (called models 1a and 2a)
� standard fasting glucose categories (called models 1b and 2b)� standard fasting glucose categories (called models 1b and 2b)� Model 3 was adjusted for all the variables in model 2 plus either the baseline
fasting glucose level (model 3a) or the baseline glycated hemoglobin value (model 3b).
� glycated hemoglobin category of 5.0 to less than 5.5% : largest number of participants (4950) → reference category
� Model discrimination was assessed with the use of Harrell’s C statistic.
RESULTS
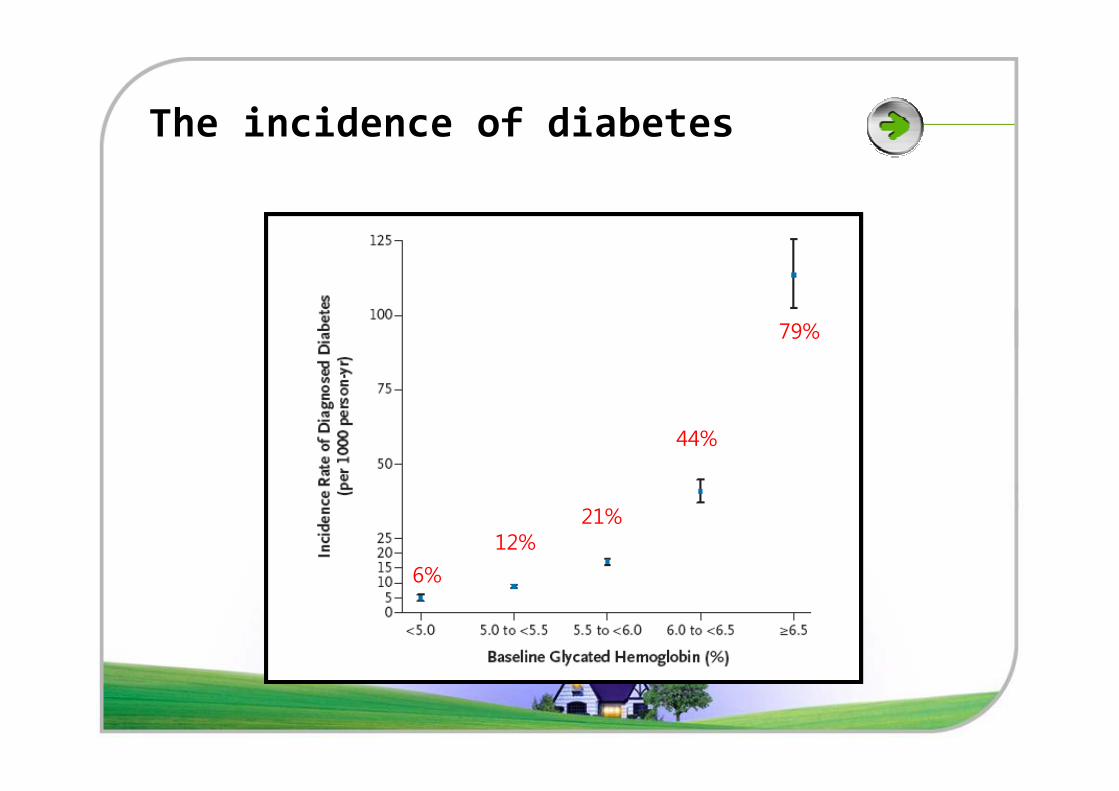
The incidence of diabetes
79%
6%
12%
44%
21%
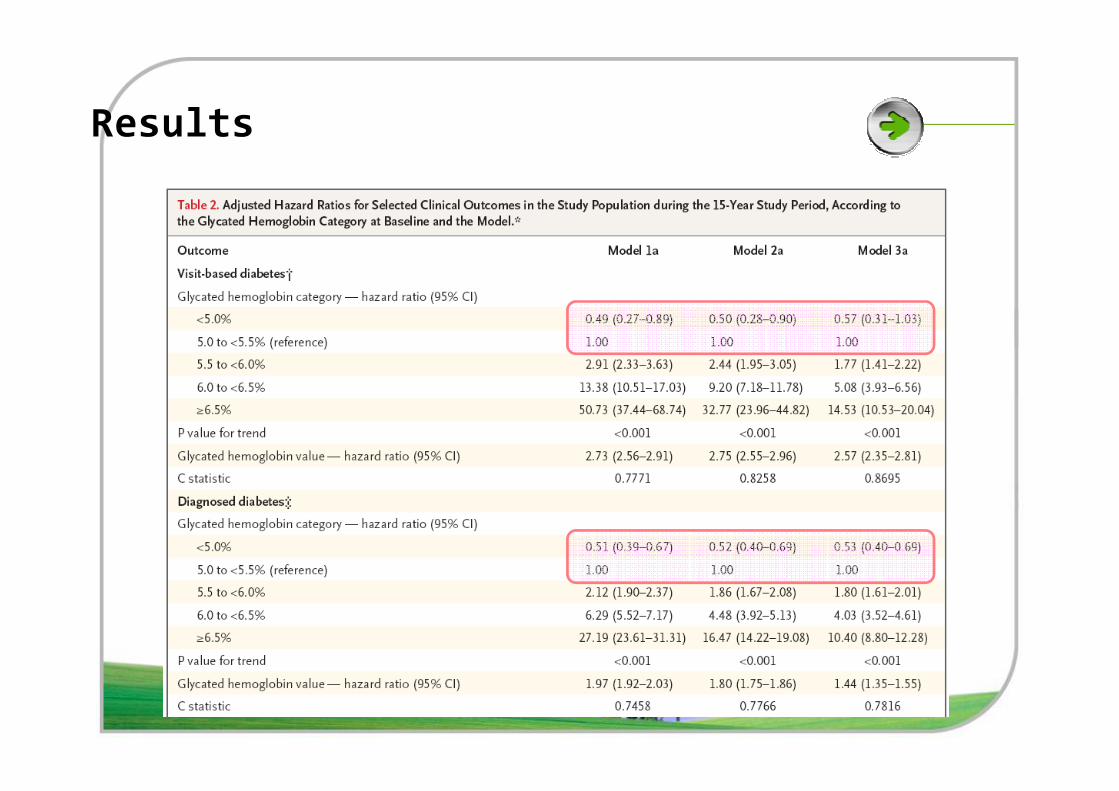
Results
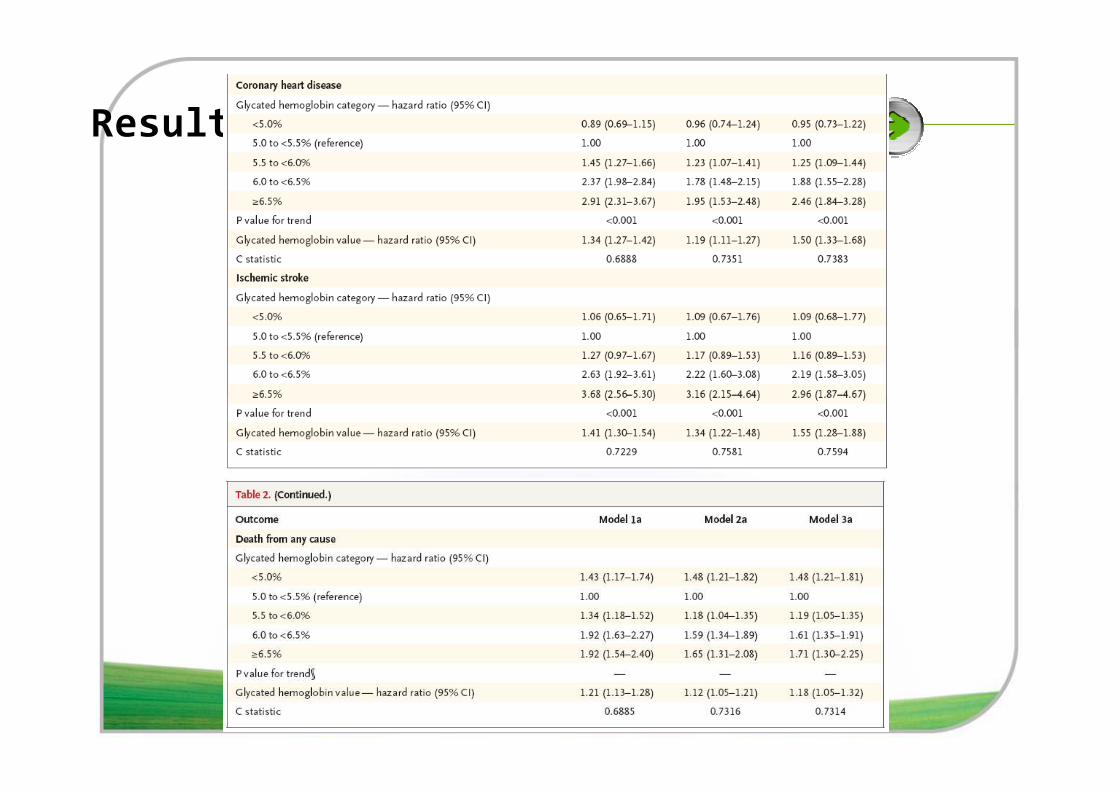
Results
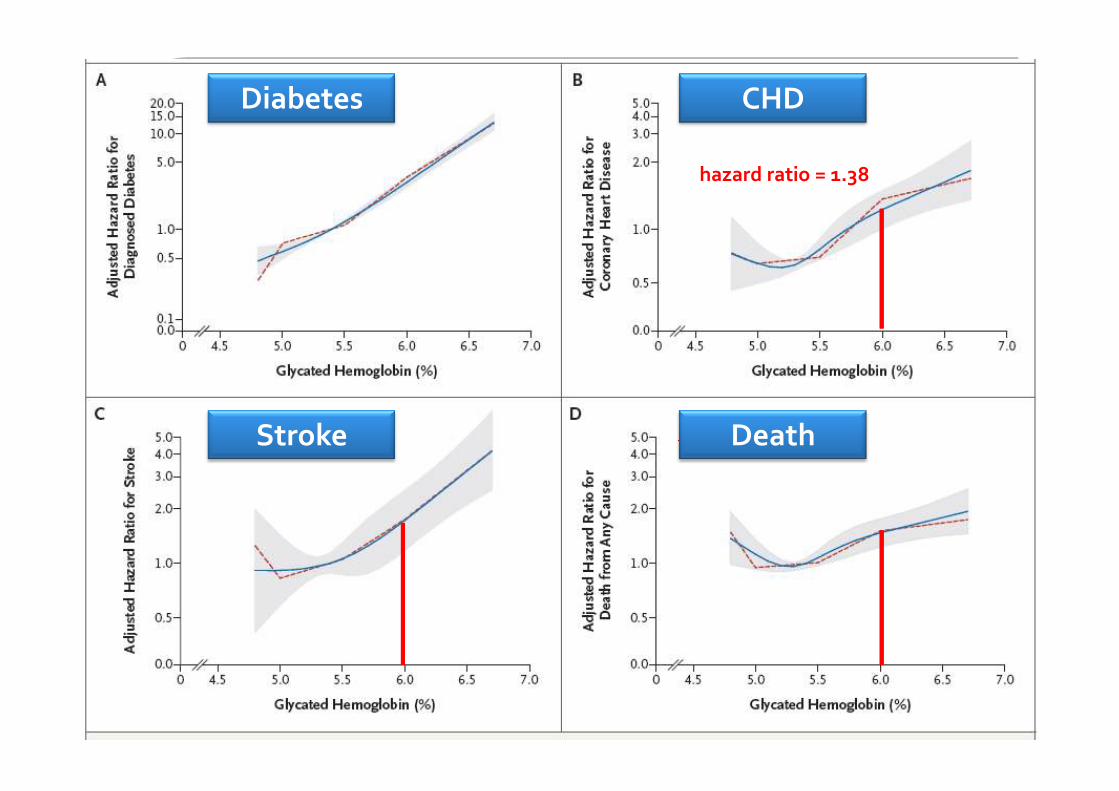
hazard ratio = 1.38
Diabetes CHD
J-shaped associationStroke Death
Results
Results
� no significant interaction between sex and glycated hemoglobin category for any of the clinical outcomes (P>0.20 for all interactions).
� no significant interaction between race and glycated hemoglobin value regarding the risk of coronary heart disease, ischemic stroke, or death from any cause (P>0.80 disease, ischemic stroke, or death from any cause (P>0.80 for all interactions).
� Blacks had lower hazard ratios for reporting a diagnosis of diabetes during the 15 years of follow-up.
Summary
�A1c value ≥ 6.0% : clinically useful marker for the
development of
(1) Diabetes
(2) Cardiovascular disease and death.
�A1c remained associated with cardiovascular
disease and death even after adjustment for the
baseline fasting glucose levels
�A1c values have low intra-individual variability.
Conclusion
�A1c may be superior to fasting glucose for long
term macrovascular risk stratification.
�The prognostic data may add to the evidence
supporting the use of A1c as a diagnostic test for supporting the use of A1c as a diagnostic test for
diabetes.
Discussion
�limitations of this study:
� The reliance on single glycated hemoglobin
and glucose measurements at baseline
� a limited number of fasting glucose
measurements during the follow-up periodmeasurements during the follow-up period
� lack of validation of self reported diabetes for
the 15-year analyses
The recent ADA redefinition
�Considers many aspects of diagnostic testing and
the economic burden, raises concerns about the
possible delay in diagnosing diabetes, the ADA
redefined the diagnosis of diabetes using an A1c
level ≥ 6.5%.
�However, there are many debates about the
appropriate A1C cut-off value for diagnosing
diabetes throughout the world.
Hemoglobin A1C as a diagnostic tool for diabetes screening in Korea
최성희, 김태혁, 임 수, 장학철, 조남한Seoul National University College of Medicine
Ajou University School of Medicine
Objective
�Recently, various levels of A1c have been
suggested when screening for diabetes.
�However, there needs more consensus about the
best level for screening especially for different
ethnicities.ethnicities.
�We evaluated the usefulness of A1C level as a
predictor of incident diabetes in a prospective,
population-based cohort study.
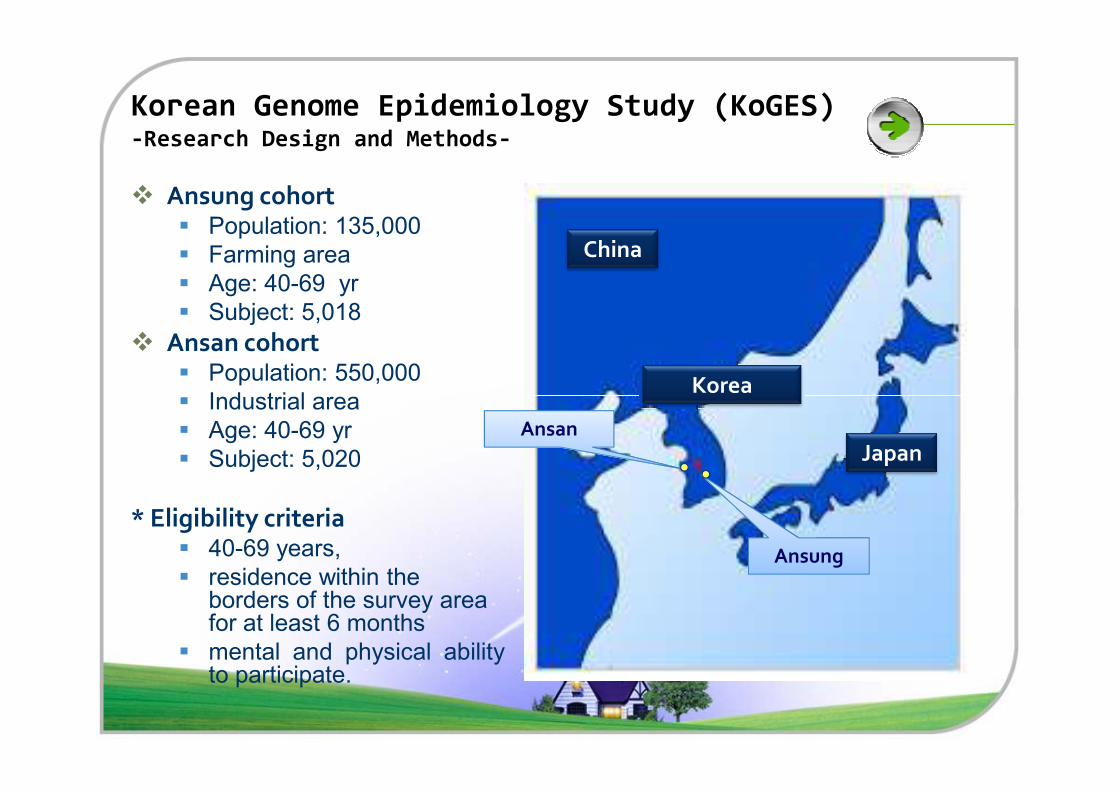
Korean Genome Epidemiology Study (KoGES) -Research Design and Methods-
� Ansung cohort� Population: 135,000
� Farming area
� Age: 40-69 yr
� Subject: 5,018
� Ansan cohort� Population: 550,000
� Industrial area
China
Korea� Industrial area
� Age: 40-69 yr
� Subject: 5,020
* Eligibility criteria� 40-69 years,
� residence within the borders of the survey area for at least 6 months
� mental and physical abilityto participate.
Ansung
AnsanJapan
Korea
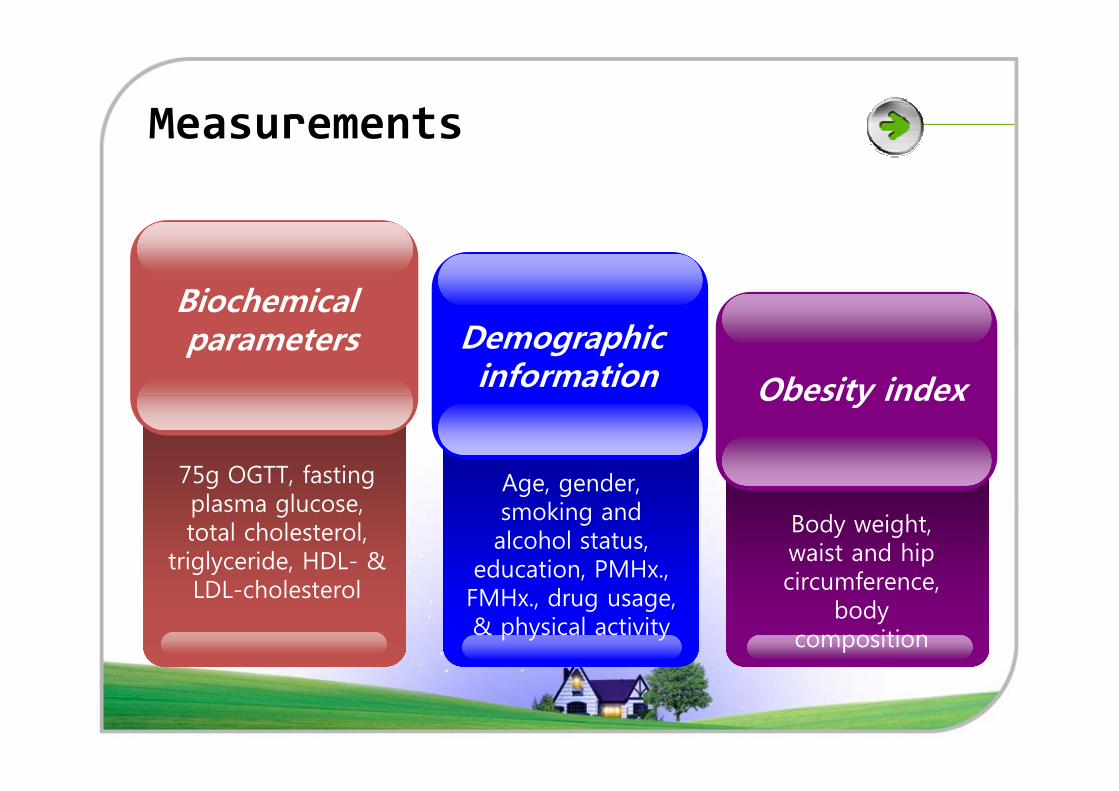
Measurements
Biochemical parameters
Obesity index
Demographic information
75g OGTT, fasting plasma glucose, total cholesterol,
triglyceride, HDL- & LDL-cholesterol
Obesity index
Body weight, waist and hip circumference,
body composition
Age, gender, smoking and alcohol status,
education, PMHx., FMHx., drug usage, & physical activity
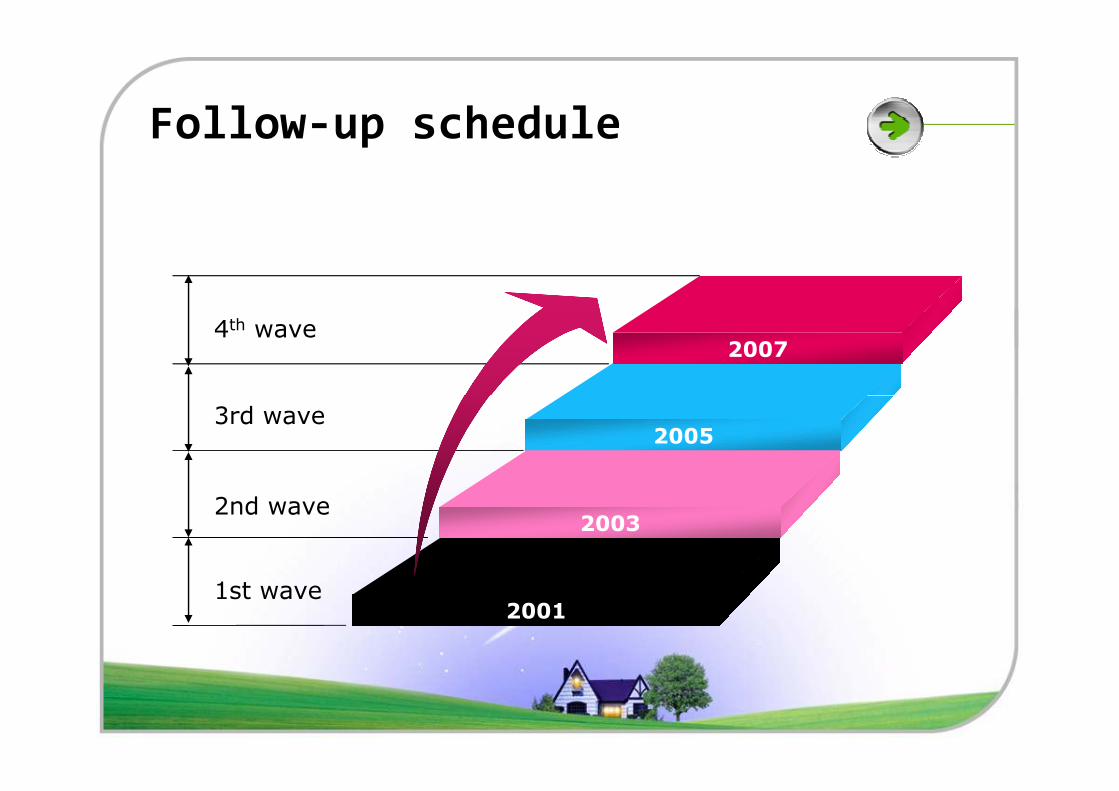
Follow-up schedule
4th wave 2007
3rd wave
2nd wave
1st wave
2005
2003
2001
Research Design
�From the Korean Genome Epidemiology Study ,
10,038 participants aged 40–69 years were
recruited.
�All subjects underwent a 75 g oral glucose
tolerance test at baseline and at each biennial tolerance test at baseline and at each biennial
follow-up.
�HbA1c was measured by HPLC method (Rio-Rad,
CA, USA).
Methods
�Subjects with prior history of diabetes (n=572)
were excluded.
�The receiver operating characteristic (ROC) curve
was used to evaluate the diagnostic accuracy of was used to evaluate the diagnostic accuracy of
the A1C cut-off.
�The Cox proportional hazard model was used to
predict diabetes at 6 years.
RESULTS
Men Women
Nondiabetic
(n = 2,328)
Diabetic
(n = 478)P
Nondiabetic
(n = 2,722)
Diabetic
(n = 417)P
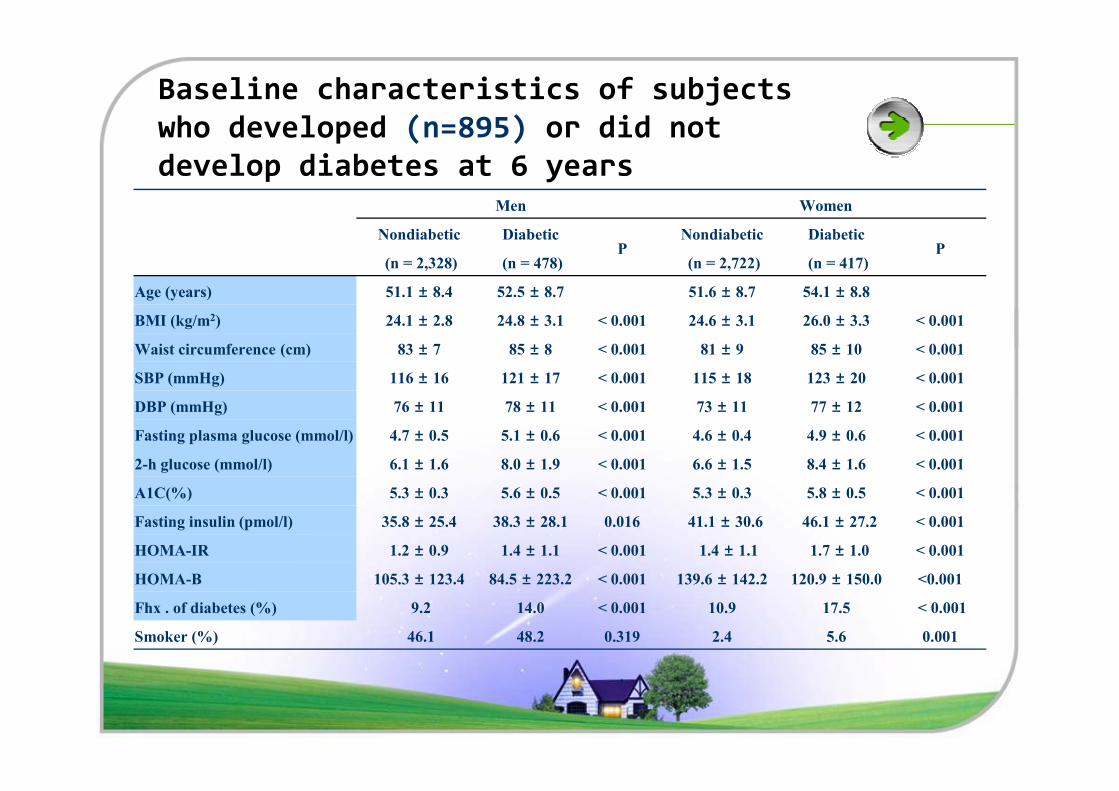
Age (years) 51.1 ± 8.4 52.5 ± 8.7 51.6 ± 8.7 54.1 ± 8.8
BMI (kg/m2) 24.1 ± 2.8 24.8 ± 3.1 < 0.001 24.6 ± 3.1 26.0 ± 3.3 < 0.001
Waist circumference (cm) 83 ± 7 85 ± 8 < 0.001 81 ± 9 85 ± 10 < 0.001
SBP (mmHg) 116 ± 16 121 ± 17 < 0.001 115 ± 18 123 ± 20 < 0.001
± ± ± ±
Baseline characteristics of subjects
who developed (n=895) or did not
develop diabetes at 6 years
DBP (mmHg) 76 ± 11 78 ± 11 < 0.001 73 ± 11 77 ± 12 < 0.001
Fasting plasma glucose (mmol/l) 4.7 ± 0.5 5.1 ± 0.6 < 0.001 4.6 ± 0.4 4.9 ± 0.6 < 0.001
2-h glucose (mmol/l) 6.1 ± 1.6 8.0 ± 1.9 < 0.001 6.6 ± 1.5 8.4 ± 1.6 < 0.001
A1C(%) 5.3 ± 0.3 5.6 ± 0.5 < 0.001 5.3 ± 0.3 5.8 ± 0.5 < 0.001
Fasting insulin (pmol/l) 35.8 ± 25.4 38.3 ± 28.1 0.016 41.1 ± 30.6 46.1 ± 27.2 < 0.001
HOMA-IR 1.2 ± 0.9 1.4 ± 1.1 < 0.001 1.4 ± 1.1 1.7 ± 1.0 < 0.001
HOMA-B 105.3 ± 123.4 84.5 ± 223.2 < 0.001 139.6 ± 142.2 120.9 ± 150.0 <0.001
Fhx . of diabetes (%) 9.2 14.0 < 0.001 10.9 17.5 < 0.001
Smoker (%) 46.1 48.2 0.319 2.4 5.6 0.001
400
500
600
700
Frequency
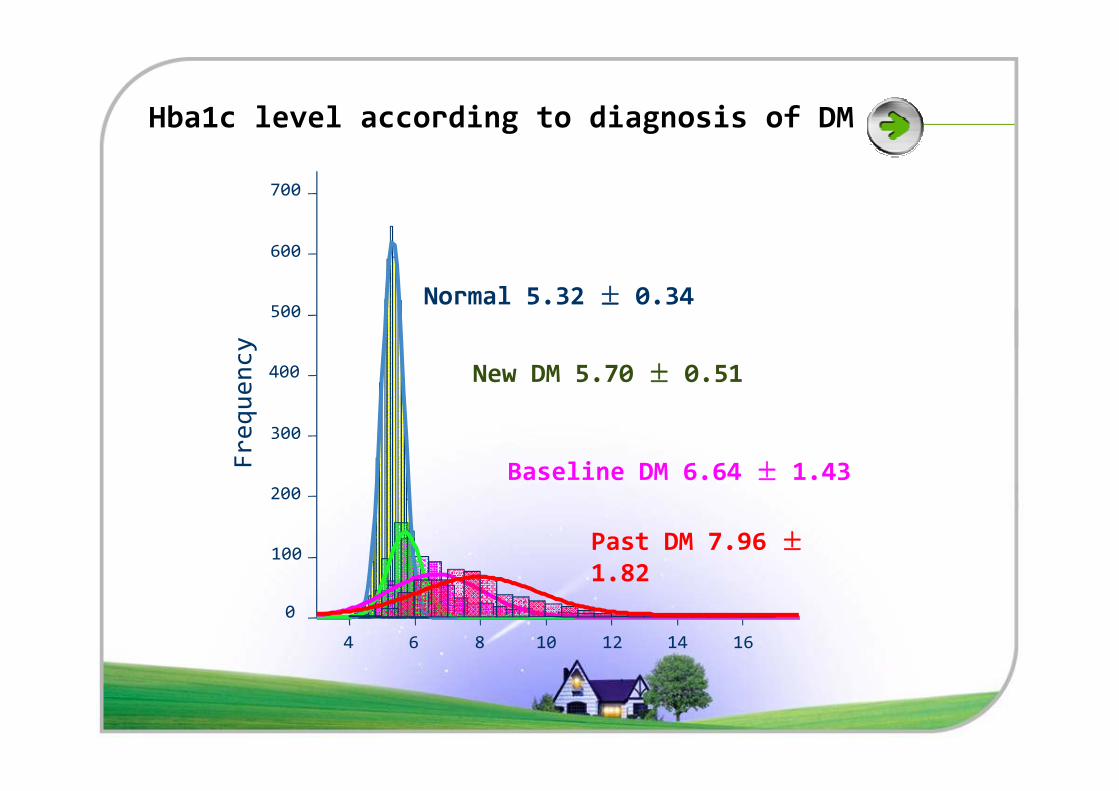
Normal 5.32 ± 0.34
New DM 5.70 ± 0.51
Hba1c level according to diagnosis of DM
4 6 8 10 12 14 16
0
100
200
300
Frequency
Baseline DM 6.64 ± 1.43
Past DM 7.96 ±1.82
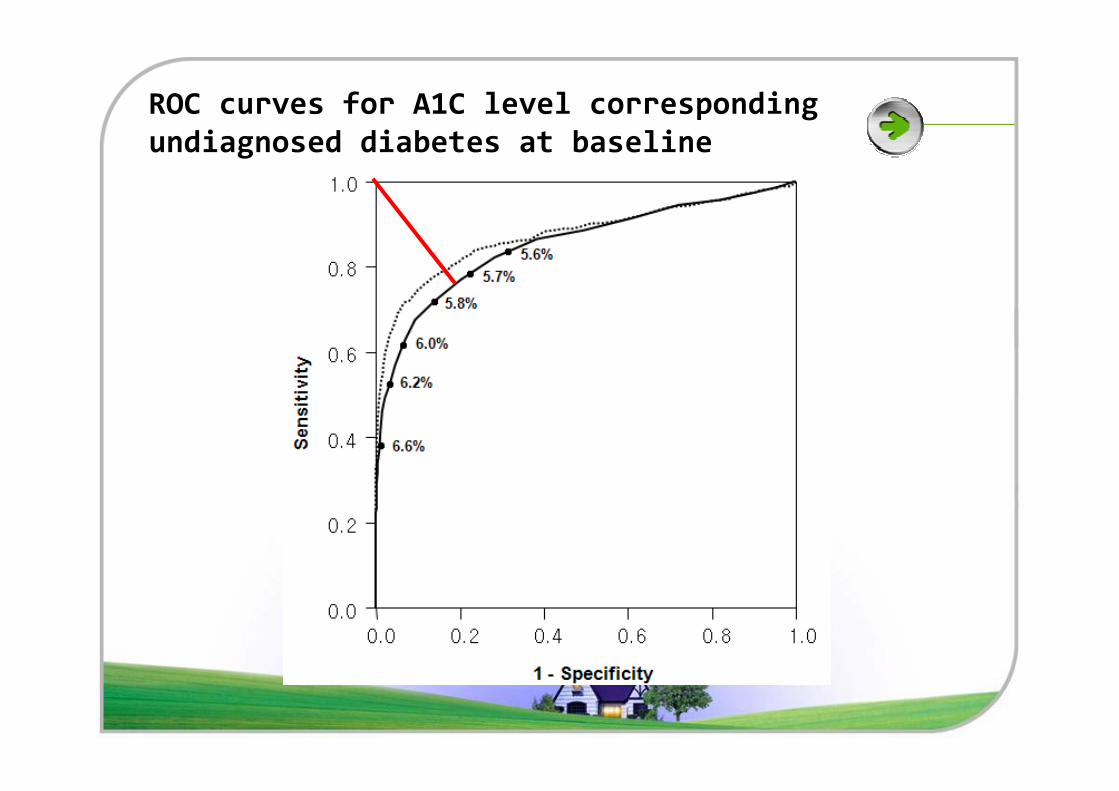
ROC curves for A1C level corresponding
undiagnosed diabetes at baseline
0.6
0.8
1.0
HbA1cReference Line
Sensitivity
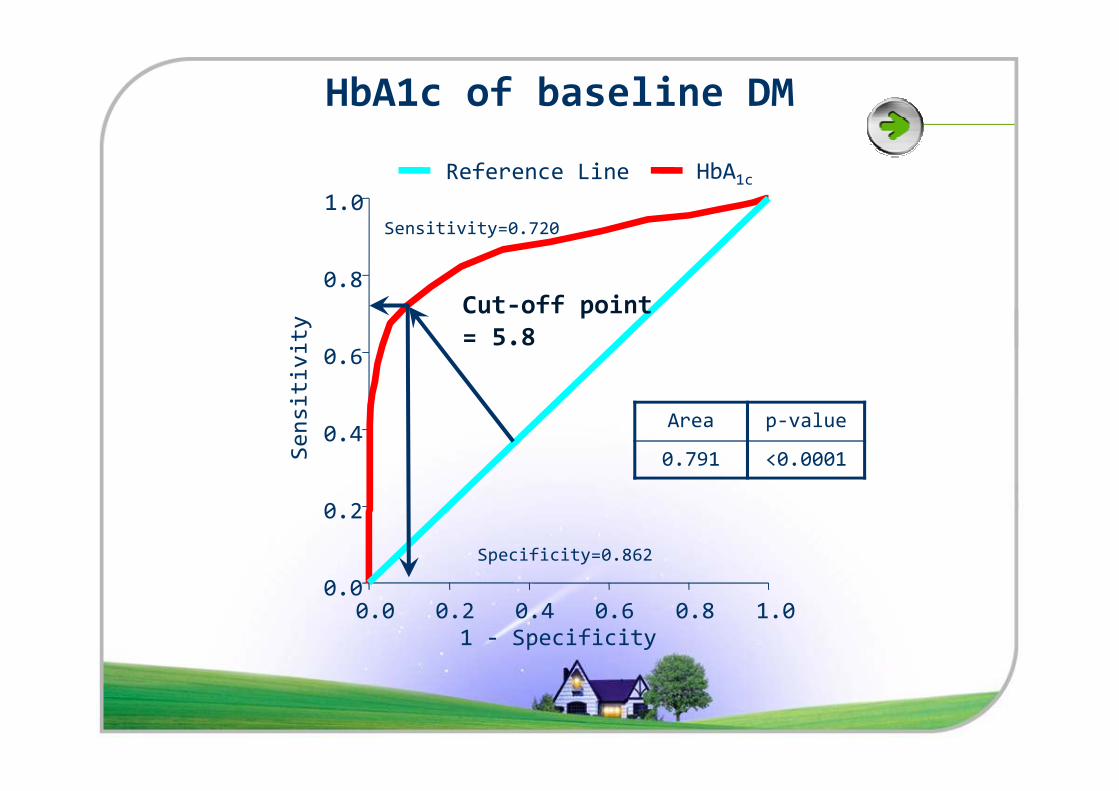
Sensitivity=0.720
Cut-off point
= 5.8
HbA1c of baseline DM
Area p-value
0.791 <0.0001
0.0 0.2 0.4 0.6 0.8 1.00.0
0.2
0.4
Sensitivity
1 - Specificity
Specificity=0.862
Area p-value
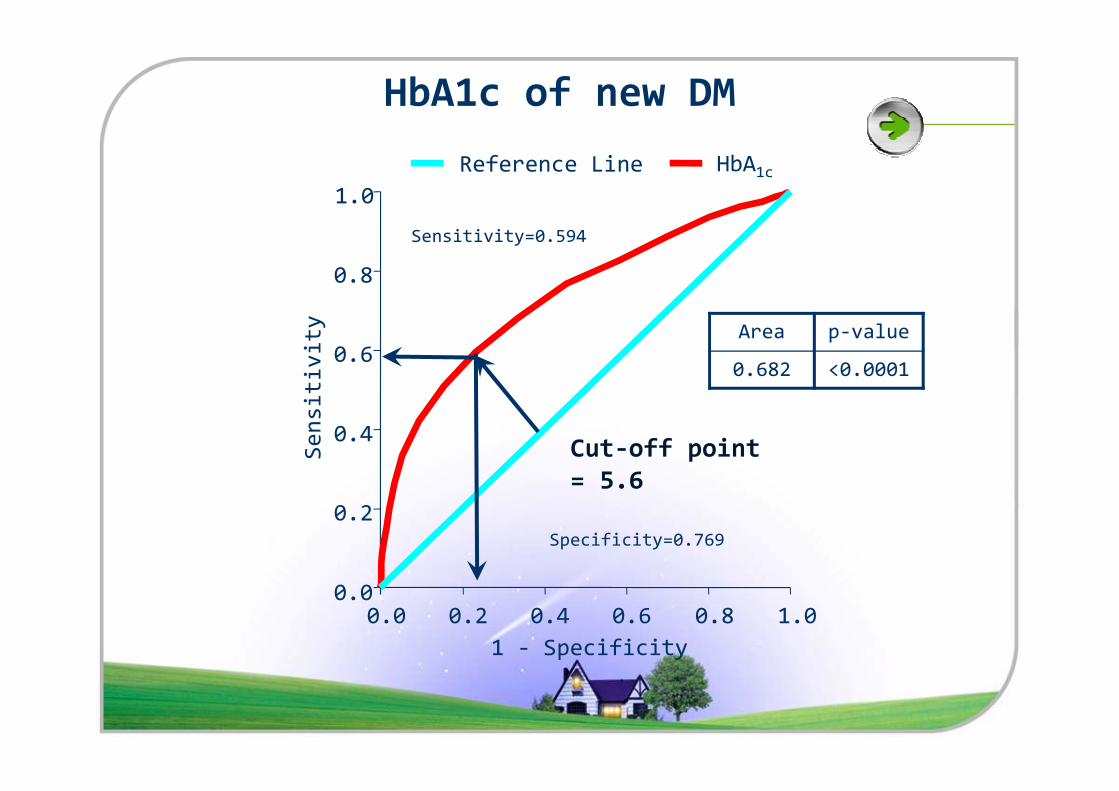
0.682 <0.00010.6
0.8
1.0
HbA1cReference Line
Sensitivity
Sensitivity=0.594
HbA1c of new DM
0.0 0.2 0.4 0.6 0.8 1.00.0
0.2
0.4
Sensitivity
1 - Specificity
Specificity=0.769
Cut-off point
= 5.6
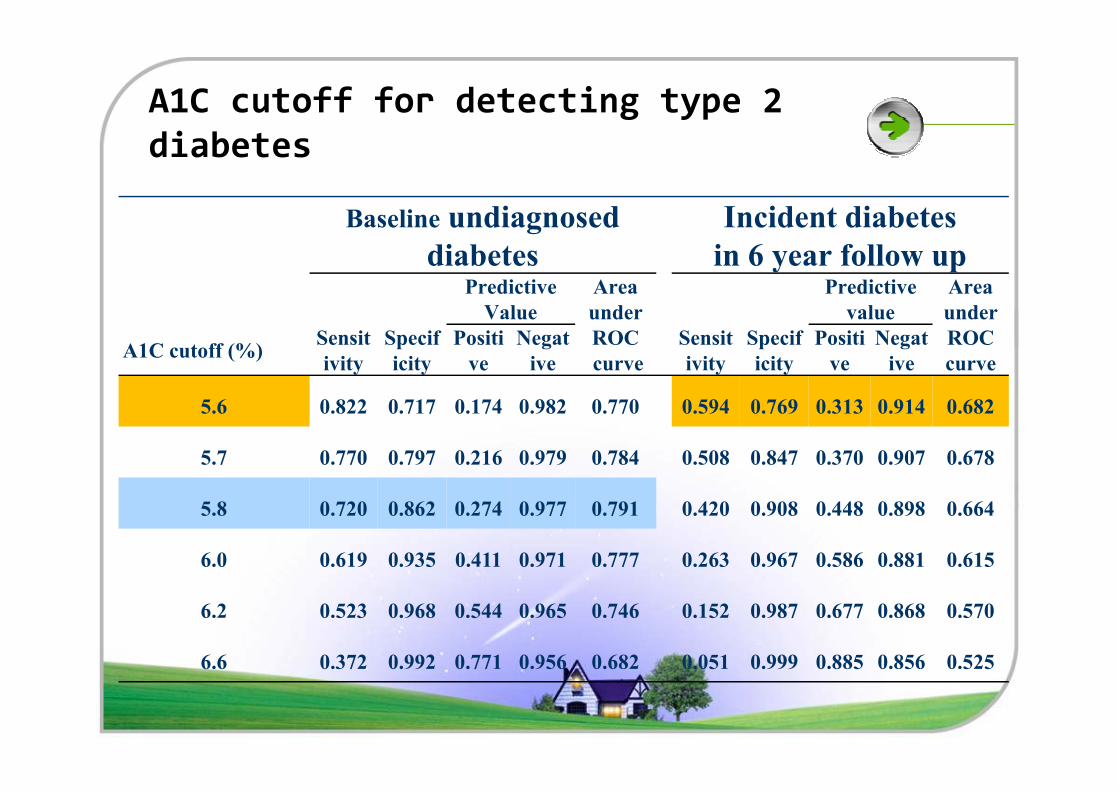
A1C cutoff for detecting type 2
diabetes
Baseline undiagnosed
diabetes
Incident diabetes
in 6 year follow upPredictive
Value
Area
under
Predictive
value
Area
under
A1C cutoff (%)Sensit
ivity
Specif
icity
Positi
ve
Negat
ive
ROC
curve
Sensit
ivity
Specif
icity
Positi
ve
Negat
ive
ROC
curve
5.6 0.822 0.717 0.174 0.982 0.770 0.594 0.769 0.313 0.914 0.6825.6 0.822 0.717 0.174 0.982 0.770 0.594 0.769 0.313 0.914 0.682
5.7 0.770 0.797 0.216 0.979 0.784 0.508 0.847 0.370 0.907 0.678
5.8 0.720 0.862 0.274 0.977 0.791 0.420 0.908 0.448 0.898 0.664
6.0 0.619 0.935 0.411 0.971 0.777 0.263 0.967 0.586 0.881 0.615
6.2 0.523 0.968 0.544 0.965 0.746 0.152 0.987 0.677 0.868 0.570
6.6 0.372 0.992 0.771 0.956 0.682 0.051 0.999 0.885 0.856 0.525
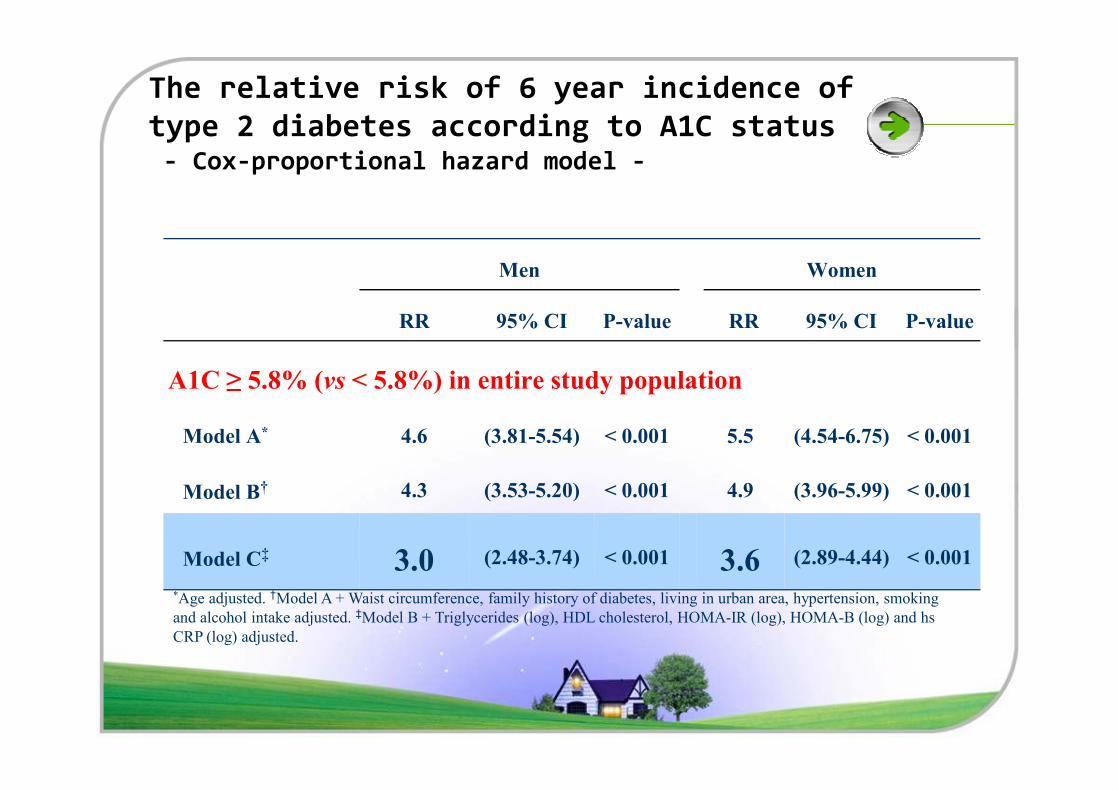
The relative risk of 6 year incidence of
type 2 diabetes according to A1C status - Cox-proportional hazard model -
Men Women
RR 95% CI P-value RR 95% CI P-value
A1C ≥ 5.8% (vs < 5.8%) in entire study population
Model A* 4.6 (3.81-5.54) < 0.001 5.5 (4.54-6.75) < 0.001
Model B† 4.3 (3.53-5.20) < 0.001 4.9 (3.96-5.99) < 0.001
Model C‡ 3.0 (2.48-3.74) < 0.001 3.6 (2.89-4.44) < 0.001
*Age adjusted. †Model A + Waist circumference, family history of diabetes, living in urban area, hypertension, smoking
and alcohol intake adjusted. ‡Model B + Triglycerides (log), HDL cholesterol, HOMA-IR (log), HOMA-B (log) and hs
CRP (log) adjusted.
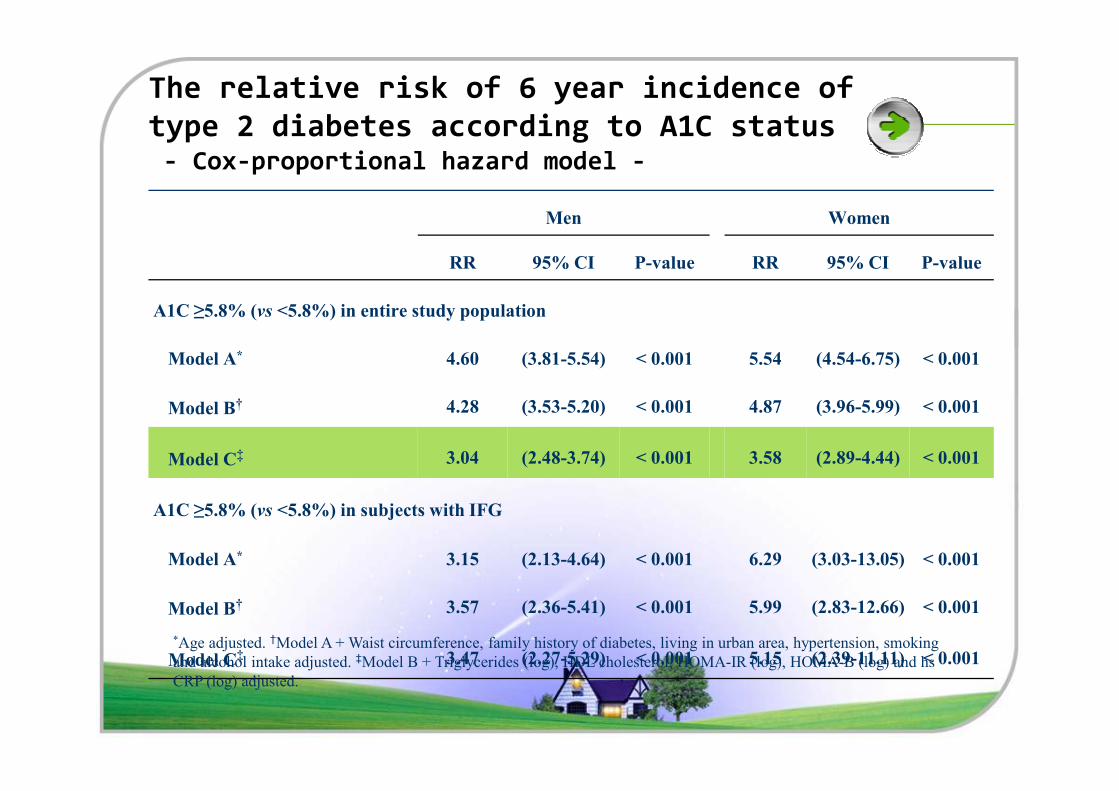
The relative risk of 6 year incidence of
type 2 diabetes according to A1C status - Cox-proportional hazard model -
Men Women
RR 95% CI P-value RR 95% CI P-value
A1C ≥5.8% (vs <5.8%) in entire study population
Model A* 4.60 (3.81-5.54) < 0.001 5.54 (4.54-6.75) < 0.001
† 4.28 (3.53-5.20) < 0.001 4.87 (3.96-5.99) < 0.001Model B† 4.28 (3.53-5.20) < 0.001 4.87 (3.96-5.99) < 0.001
Model C‡ 3.04 (2.48-3.74) < 0.001 3.58 (2.89-4.44) < 0.001
A1C ≥5.8% (vs <5.8%) in subjects with IFG
Model A* 3.15 (2.13-4.64) < 0.001 6.29 (3.03-13.05) < 0.001
Model B† 3.57 (2.36-5.41) < 0.001 5.99 (2.83-12.66) < 0.001
Model C‡ 3.47 (2.27-5.29) < 0.001 5.15 (2.39-11.11) < 0.001
*Age adjusted. †Model A + Waist circumference, family history of diabetes, living in urban area, hypertension, smoking
and alcohol intake adjusted. ‡Model B + Triglycerides (log), HDL cholesterol, HOMA-IR (log), HOMA-B (log) and hs
CRP (log) adjusted.
Summary
�At 6 years, 895 (10.2%) had developed incident
diabetes (annual incidence rate = 1.7).
�The cut-off A1C of 5.8% was the most accurate for
predicting 6-year incident diabetes.
�After multivariate adjustment, men with baseline �After multivariate adjustment, men with baseline
A1C ≥5.8% had a 3.0-fold increased risk and women had a 3.6-fold increased risk of new-onset
diabetes compared with those with A1C<5.8%.
Consideration points
�All participants were enrolled from a Korean rural
and urban community of homogeneous ethnic
background.
�At present, the significant differences in A1c level �At present, the significant differences in A1c level
is not clear in different races.
�The use of different A1C values according to
ethnicity is not currently recommended.
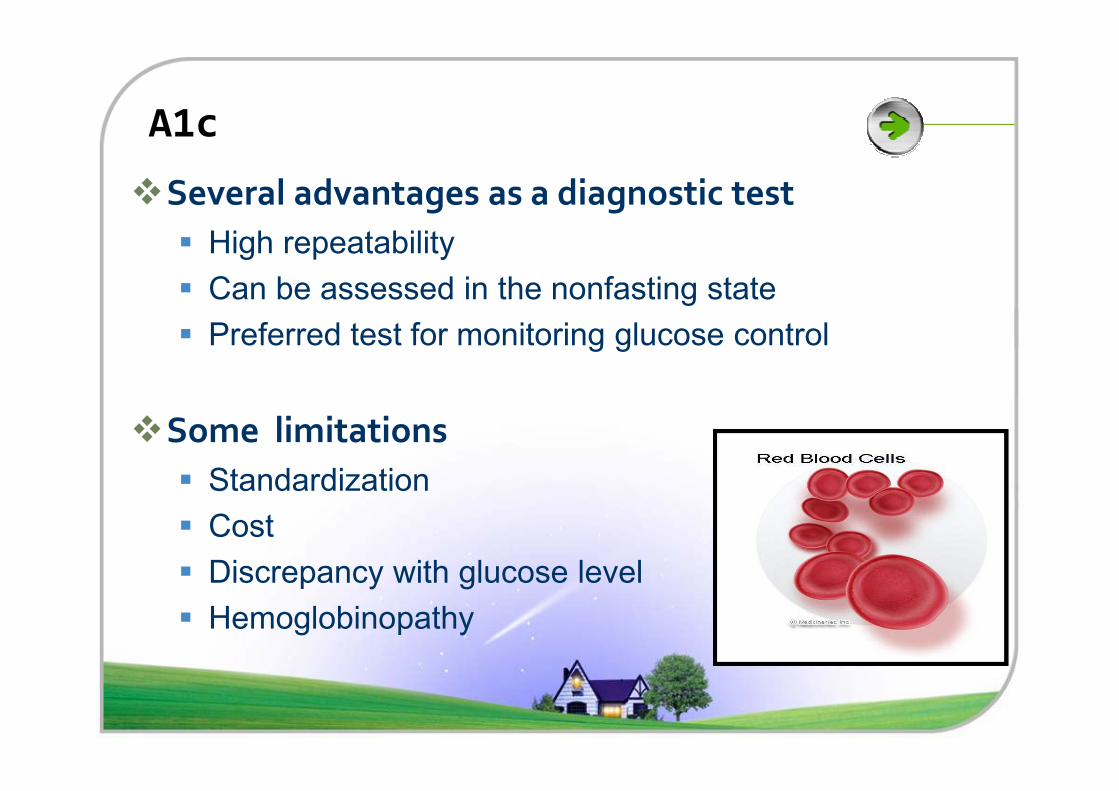
A1c
�Several advantages as a diagnostic test
� High repeatability
� Can be assessed in the nonfasting state
� Preferred test for monitoring glucose control
�Some limitations
� Standardization
� Cost
� Discrepancy with glucose level
� Hemoglobinopathy
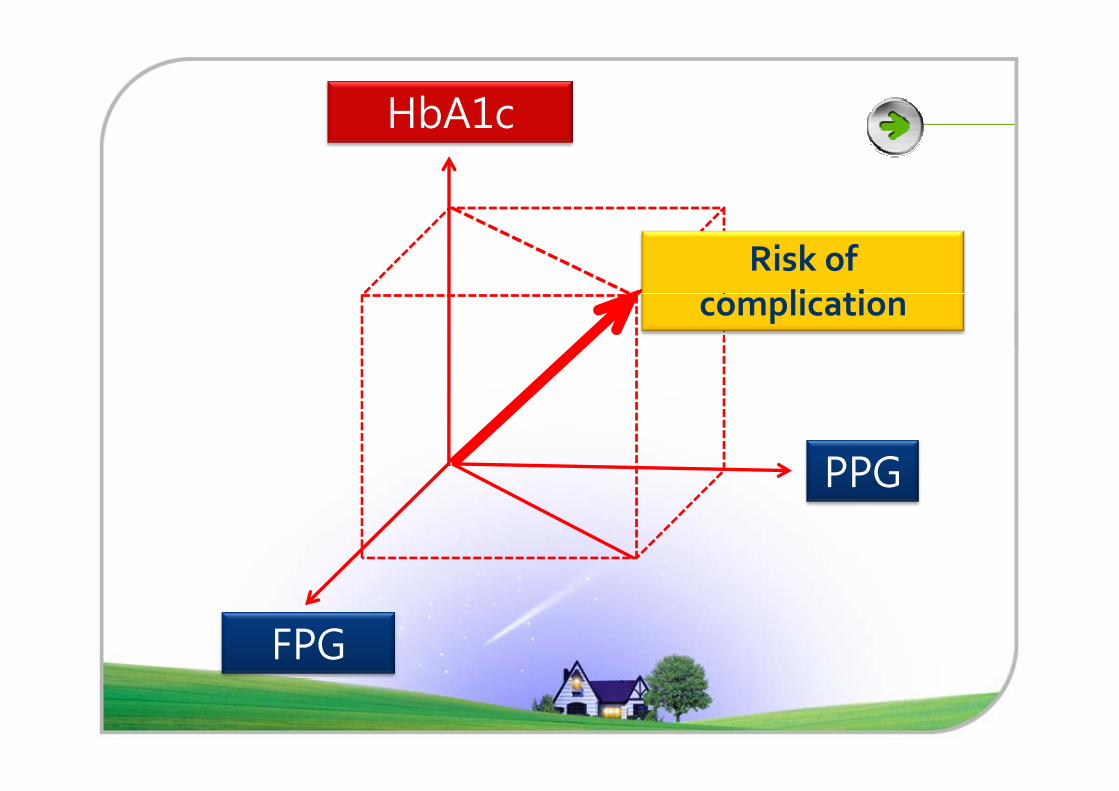
HbA1c
Risk of
complication
PPG
FPG
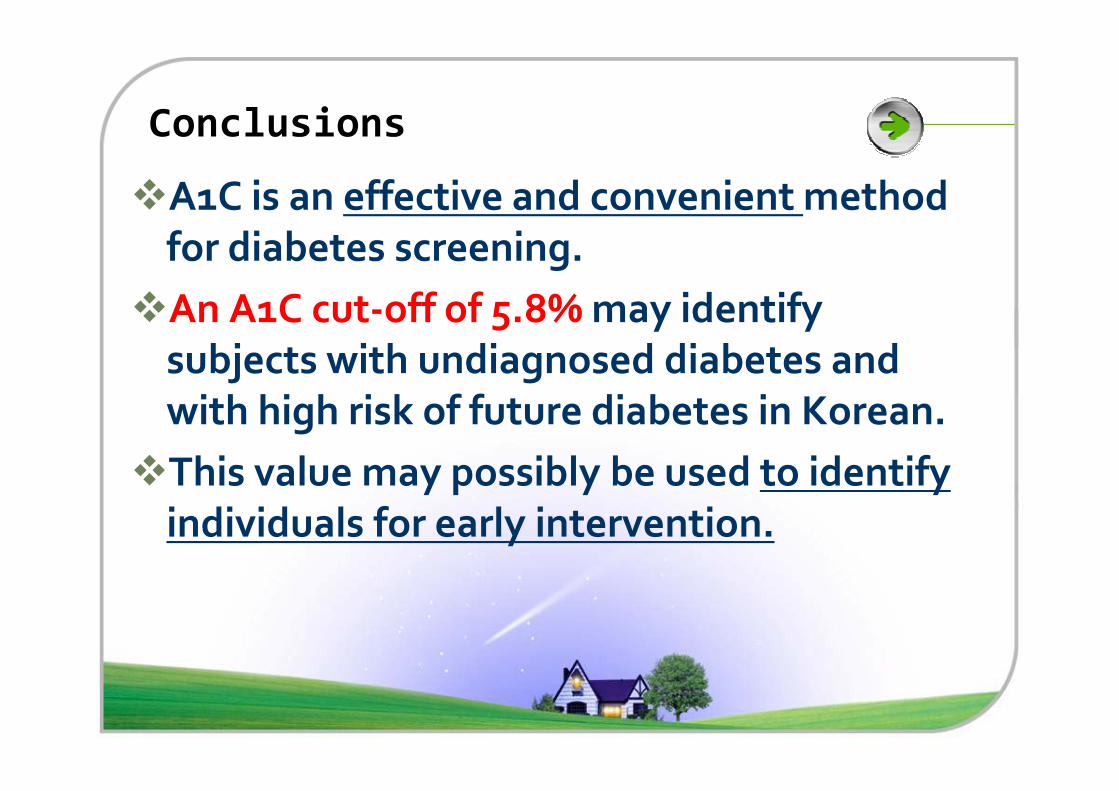
Conclusions
�A1C is an effective and convenient method
for diabetes screening.
�An A1C cut-off of 5.8% may identify
subjects with undiagnosed diabetes and
with high risk of future diabetes in Korean. with high risk of future diabetes in Korean.
�This value may possibly be used to identify
individuals for early intervention.
Acknowledgements
� Nam Han Cho, MD, PHD� Department of Preventive Medicine, Ajou University School of
Medicine, Suwon, Korea
� Hyungrae Kim, MD, PHD� National Genome Research Institute, Seoul, Korea
� Sung Hee Choi, Tae Hyuk Kim, Ji Won Yoon, � Sung Hee Choi, Tae Hyuk Kim, Ji Won Yoon, Seon Mee Kang, Young Joo Park, Kyong Soo Park, Hak Chul Jang, Seong Yeon Kim, Hong Kyu Lee� Seoul National University College of Medicine, Department of
Internal Medicine

Many thanks for your attention

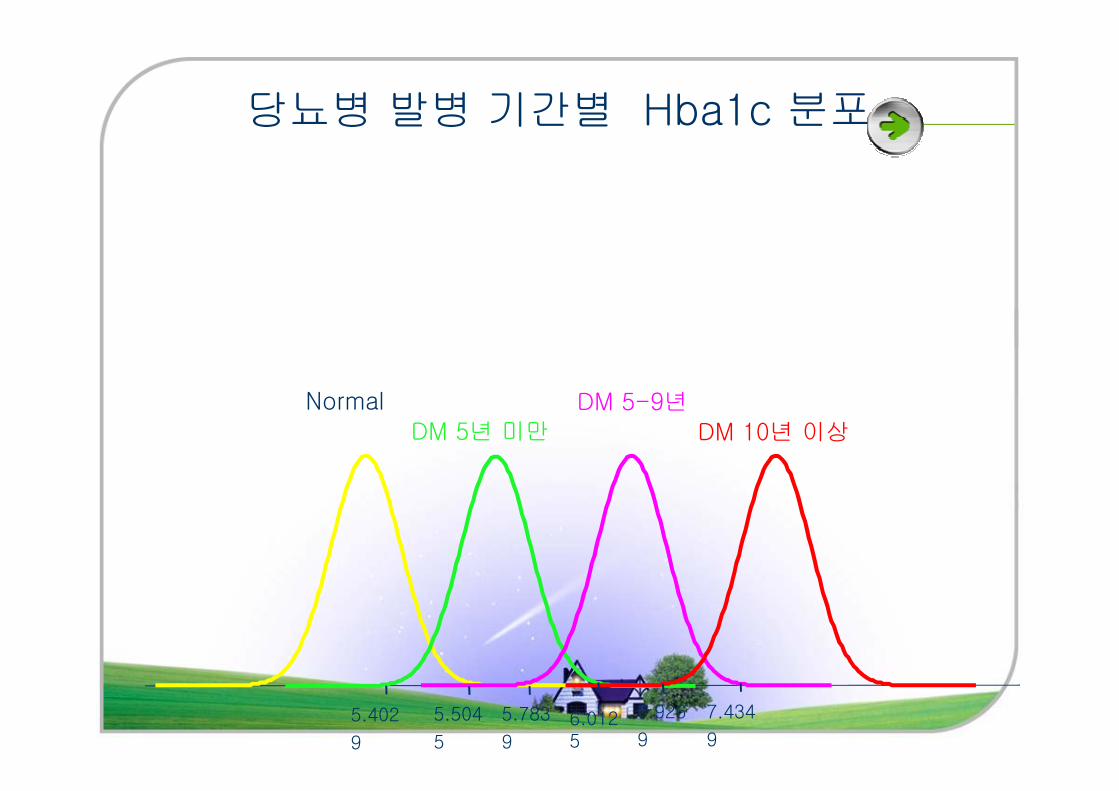
당뇨병 발병 기간별 Hba1c 분포
Normal DM 5-9년Normal
DM 5년 미만DM 5-9년
DM 10년 이상
5.402
9
5.504
5
5.783
96.0125
6.926
9
7.434
9
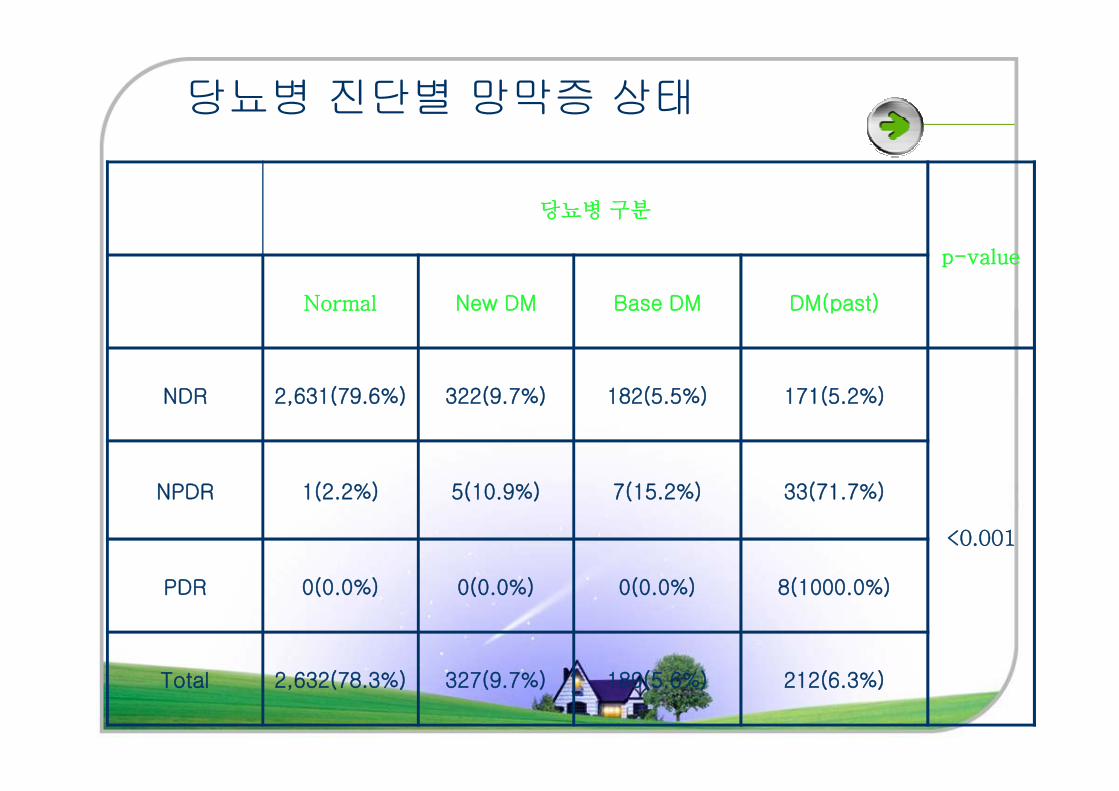
당뇨병 진단별 망막증 상태
당뇨병구분
p-value
Normal New DM Base DM DM(past)
NDR 2,631(79.6%) 322(9.7%) 182(5.5%) 171(5.2%)NDR 2,631(79.6%) 322(9.7%) 182(5.5%) 171(5.2%)
<0.001
NPDR 1(2.2%) 5(10.9%) 7(15.2%) 33(71.7%)
PDR 0(0.0%) 0(0.0%) 0(0.0%) 8(1000.0%)
Total 2,632(78.3%) 327(9.7%) 189(5.6%) 212(6.3%)
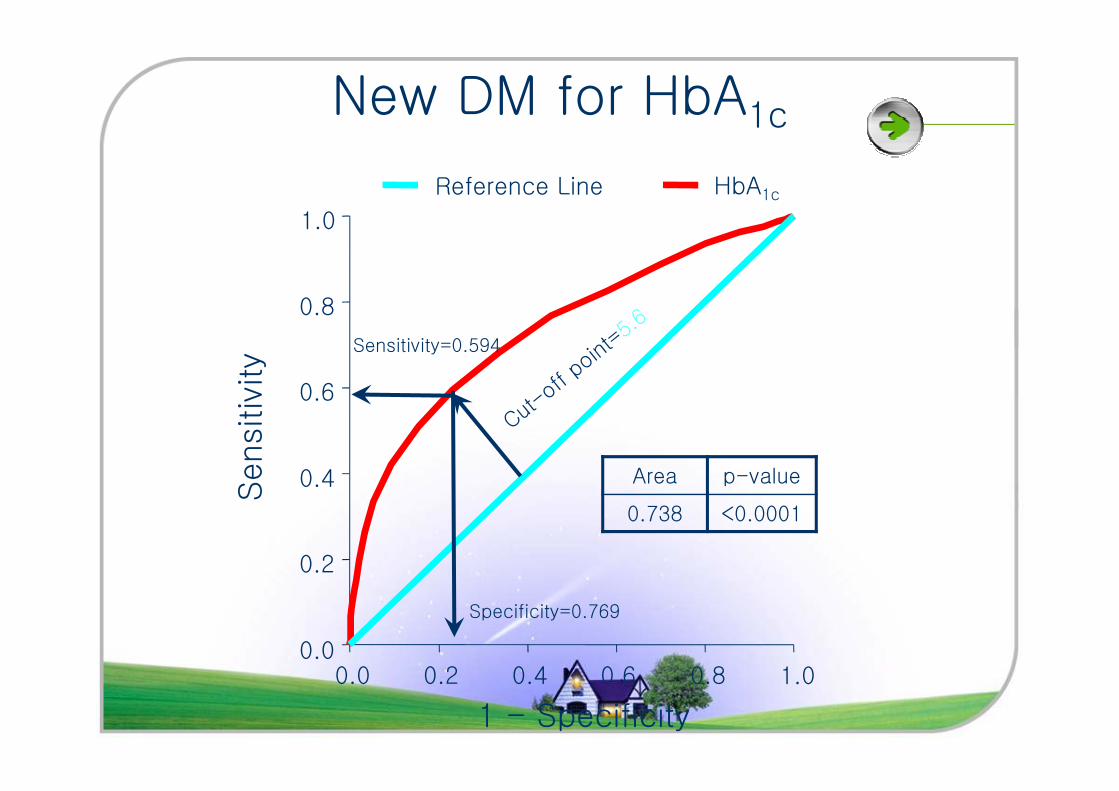
0.6
0.8
1.0
New DM for HbA1c
HbA1cReference Line
Sensitiv
ity
Sensitivity=0.594
0.0 0.2 0.4 0.6 0.8 1.00.0
0.2
0.4
0.6
Sensitiv
ity
1 - Specificity
Area p-value
0.738 <0.0001
Specificity=0.769
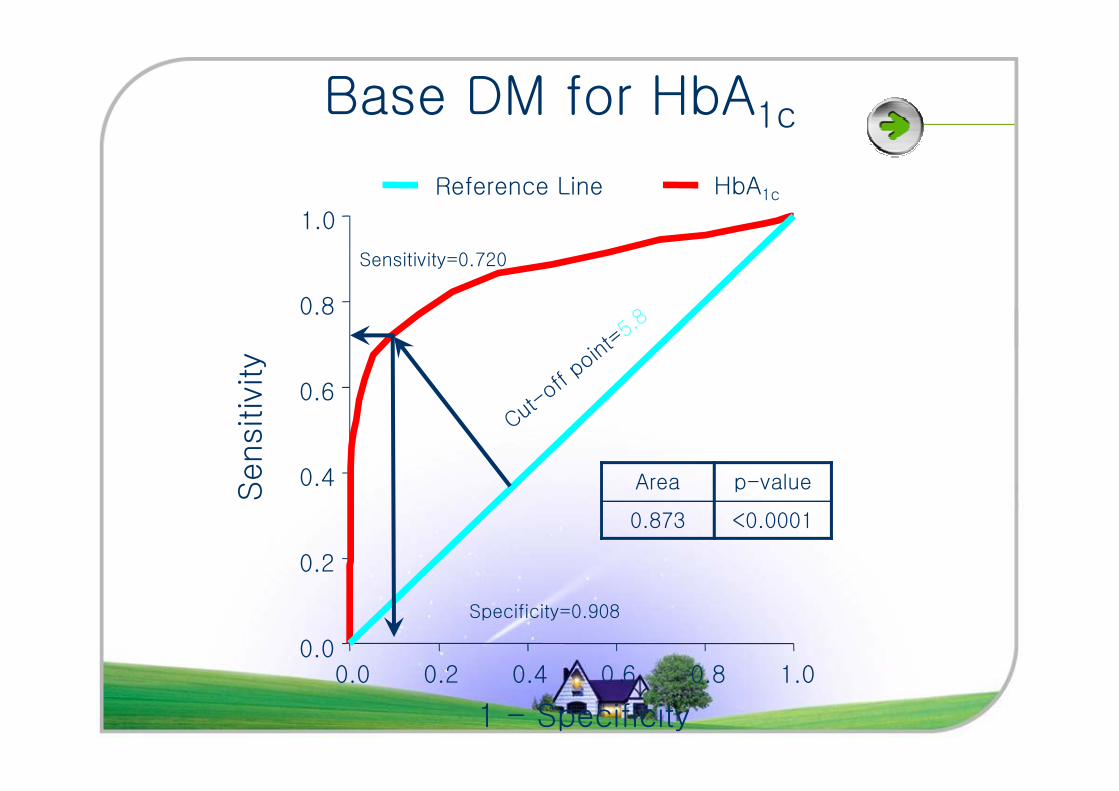
0.6
0.8
1.0
HbA1cReference Line
Sensitiv
ity
Sensitivity=0.720
Base DM for HbA1c
0.0 0.2 0.4 0.6 0.8 1.00.0
0.2
0.4
0.6
Sensitiv
ity
1 - Specificity
Area p-value
0.873 <0.0001
Specificity=0.908
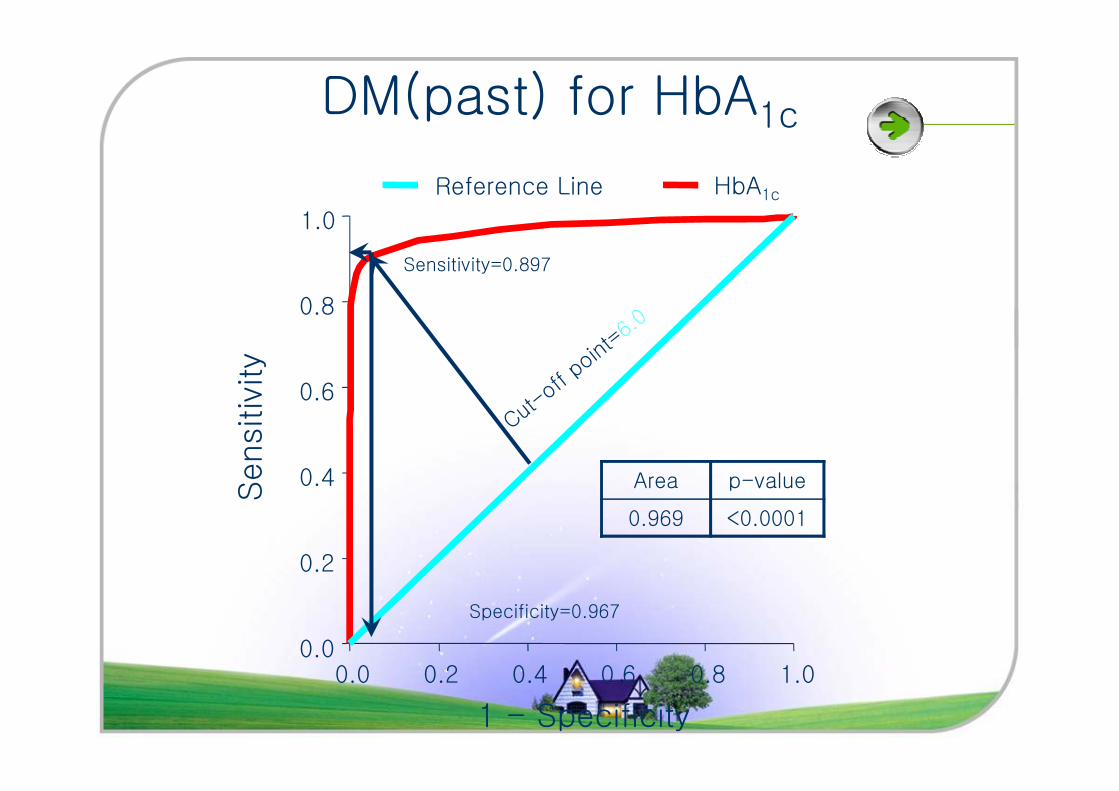
0.6
0.8
1.0
HbA1cReference Line
Sensitiv
ity
Sensitivity=0.897
DM(past) for HbA1c
0.0 0.2 0.4 0.6 0.8 1.00.0
0.2
0.4
0.6
Sensitiv
ity
1 - Specificity
Area p-value
0.969 <0.0001
Specificity=0.967
SURVIVAL AS A FUNCTION OF HBA1C
IN PEOPLE WITH TYPE 2 DIABETES:
A RETROSPECTIVE COHORT STUDY
Craig J Currie, John R Peters, Aodan Tynan, Marc Evans, Robert J Heine, Oswaldo L Bracco, Tony Zagar, Chris D Poole
Lancet 2010; 375: 481–89
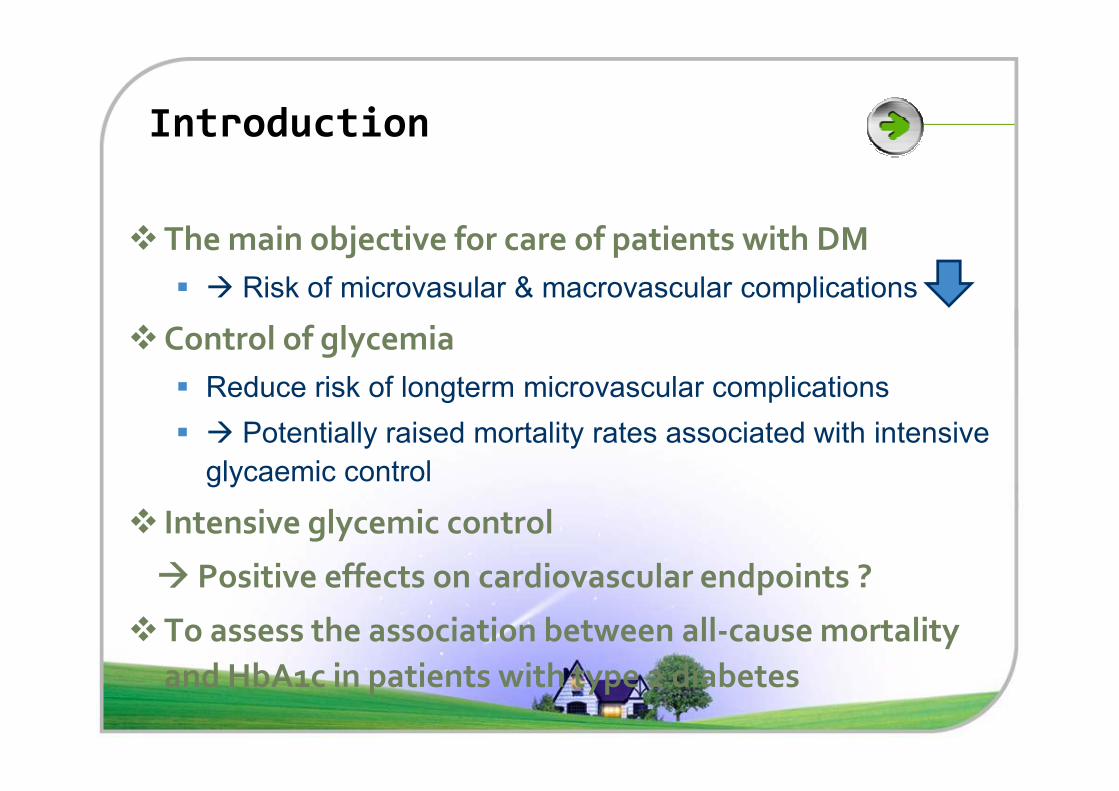
Introduction
�The main objective for care of patients with DM
� � Risk of microvasular & macrovascular complications
�Control of glycemia
� Reduce risk of longterm microvascular complications� Reduce risk of longterm microvascular complications
� � Potentially raised mortality rates associated with intensive
glycaemic control
� Intensive glycemic control
� Positive effects on cardiovascular endpoints ?
�To assess the association between all-cause mortality
and HbA1c in patients with type 2 diabetes
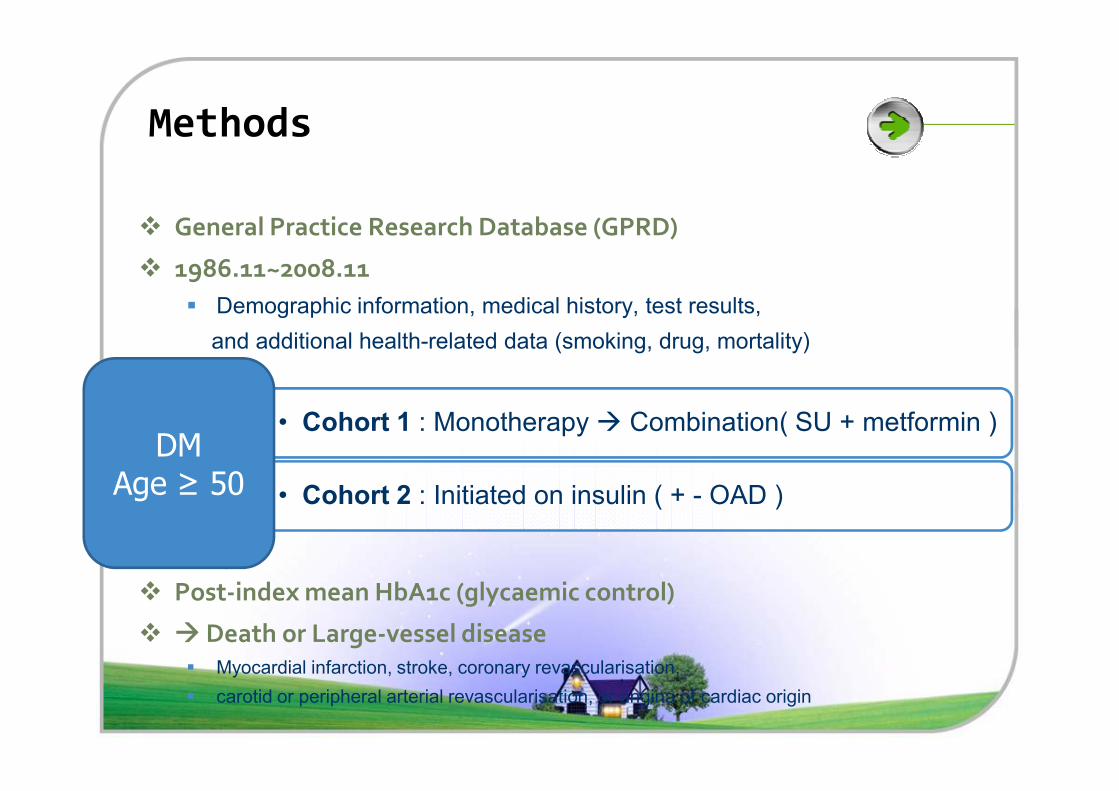
Methods
� General Practice Research Database (GPRD)
� 1986.11~2008.11
� Demographic information, medical history, test results,
and additional health-related data (smoking, drug, mortality)
� Post-index mean HbA1c (glycaemic control)
� � Death or Large-vessel disease� Myocardial infarction, stroke, coronary revascularisation,
� carotid or peripheral arterial revascularisation, or angina of cardiac origin
• Cohort 1 : Monotherapy � Combination( SU + metformin )
• Cohort 2 : Initiated on insulin ( + - OAD )
DM
Age ≥ 50
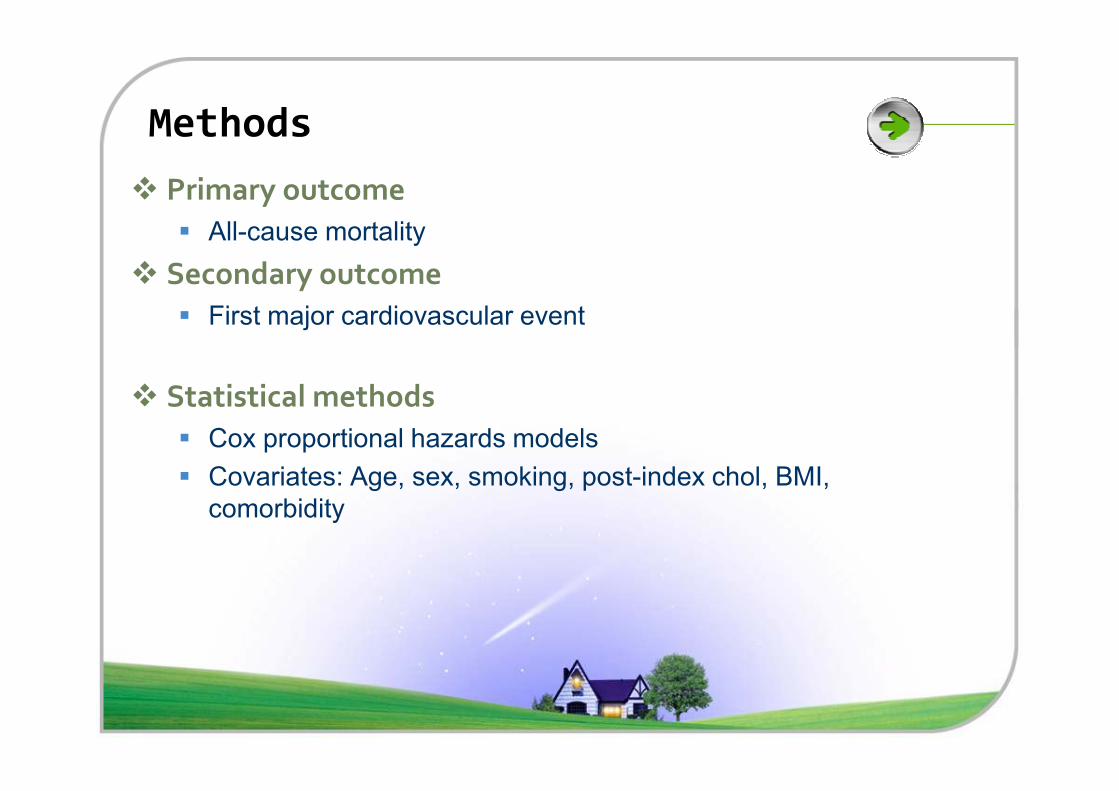
Methods
� Primary outcome
� All-cause mortality
� Secondary outcome
� First major cardiovascular event
� Statistical methods� Statistical methods
� Cox proportional hazards models
� Covariates: Age, sex, smoking, post-index chol, BMI,
comorbidity
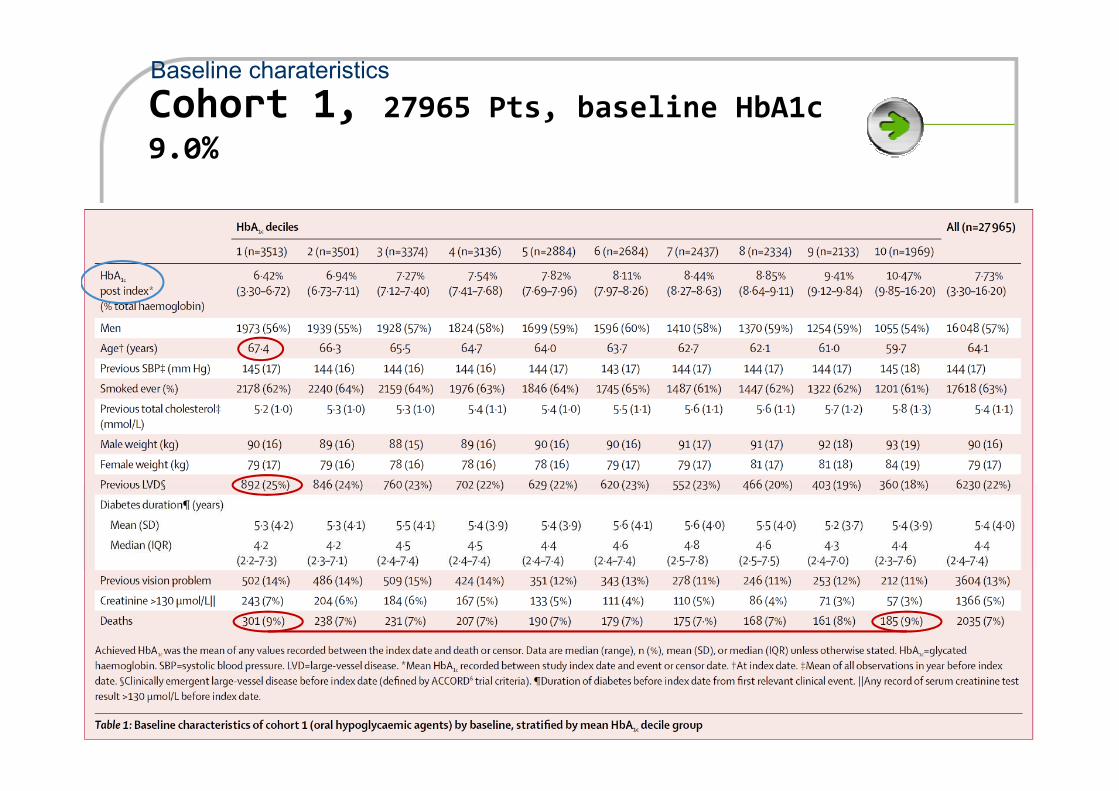
Cohort 1, 27965 Pts, baseline HbA1c 9.0%
Baseline charateristics
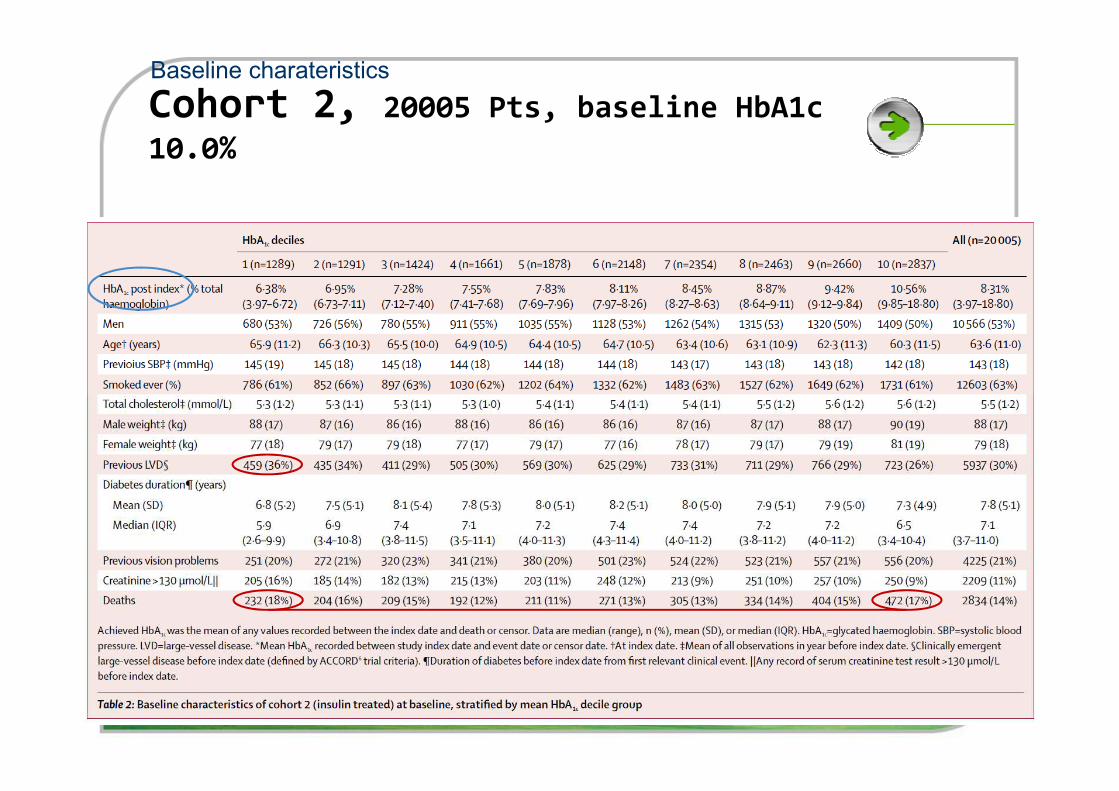
Cohort 2, 20005 Pts, baseline HbA1c 10.0%
Baseline charateristics
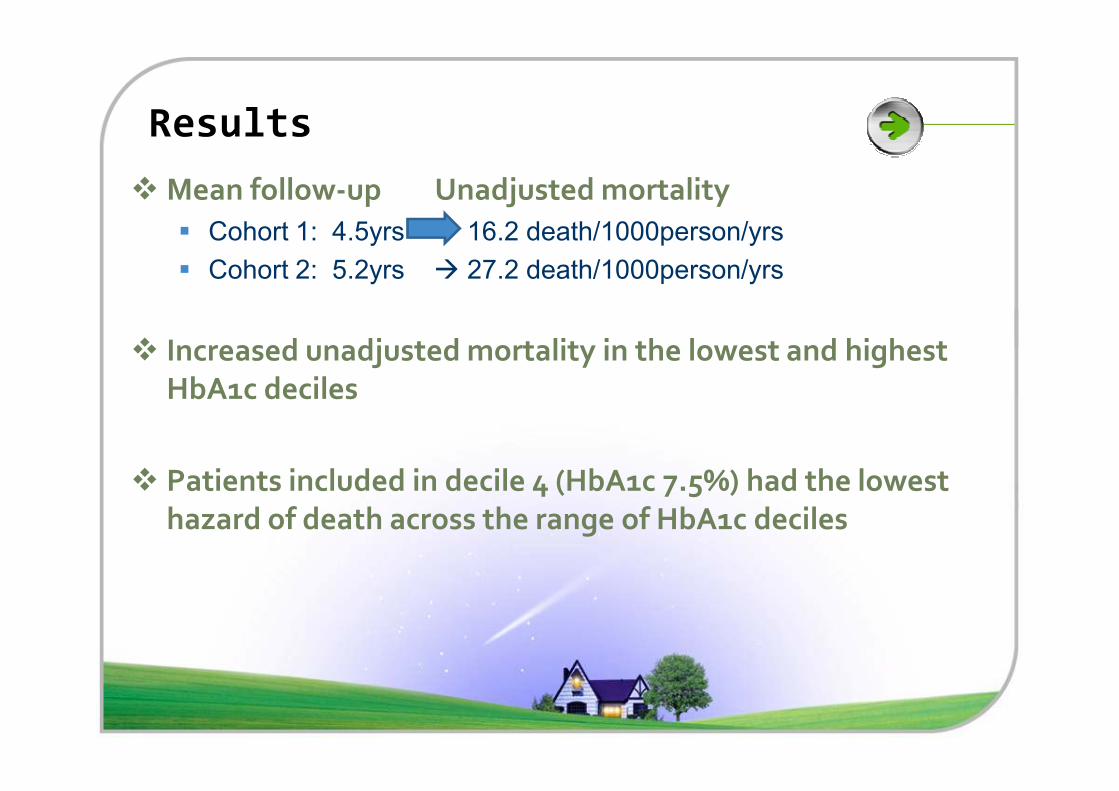
Results
� Mean follow-up Unadjusted mortality
� Cohort 1: 4.5yrs � 16.2 death/1000person/yrs
� Cohort 2: 5.2yrs � 27.2 death/1000person/yrs
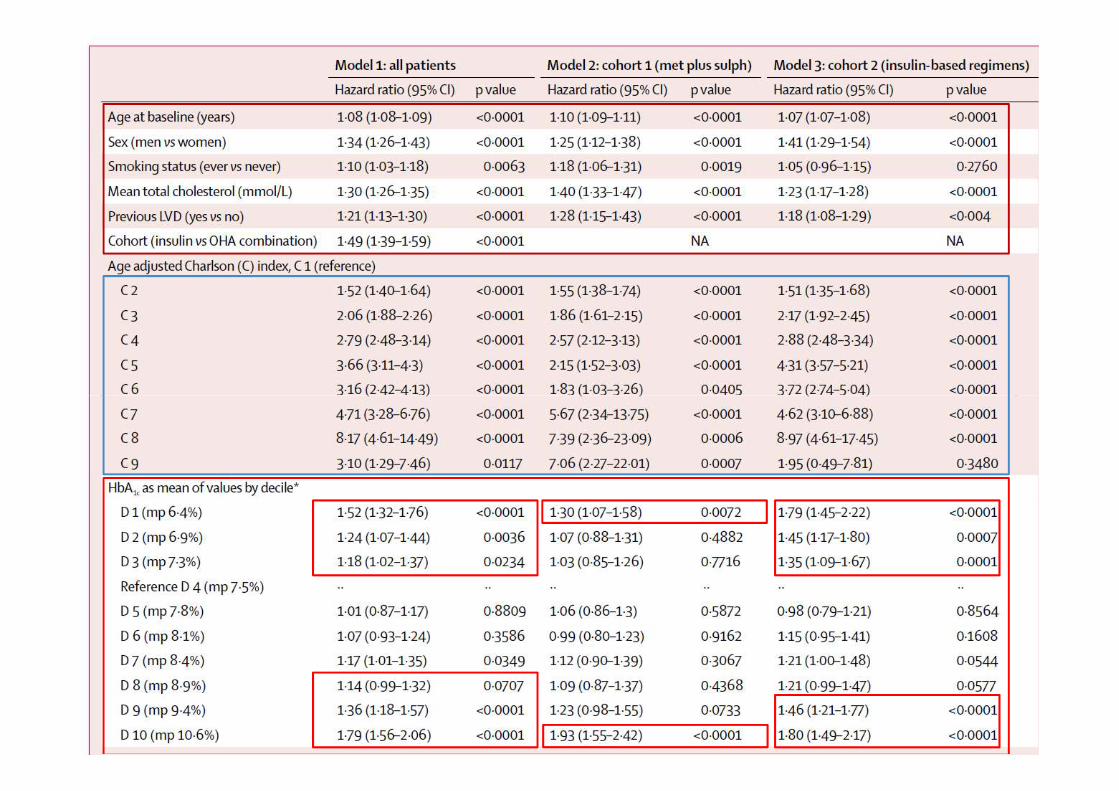
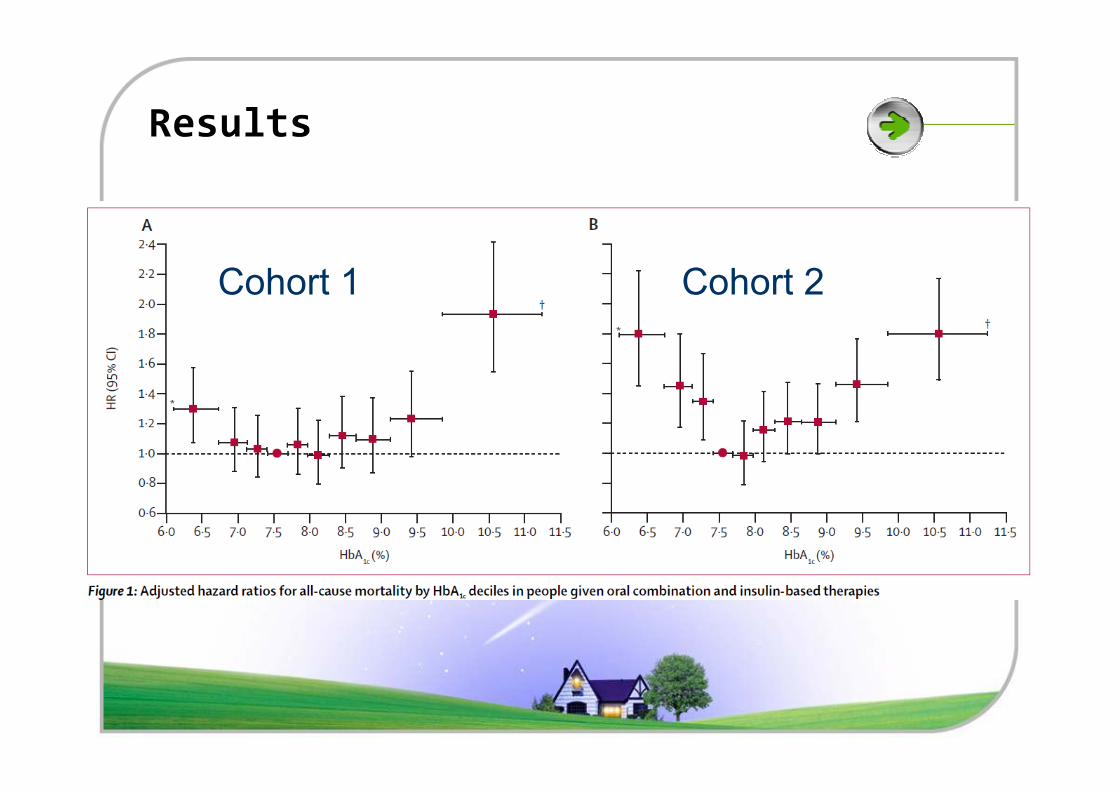
� Increased unadjusted mortality in the lowest and highest
HbA1c decilesHbA1c deciles
� Patients included in decile 4 (HbA1c 7.5%) had the lowest
hazard of death across the range of HbA1c deciles
Results
Cohort 1 Cohort 2
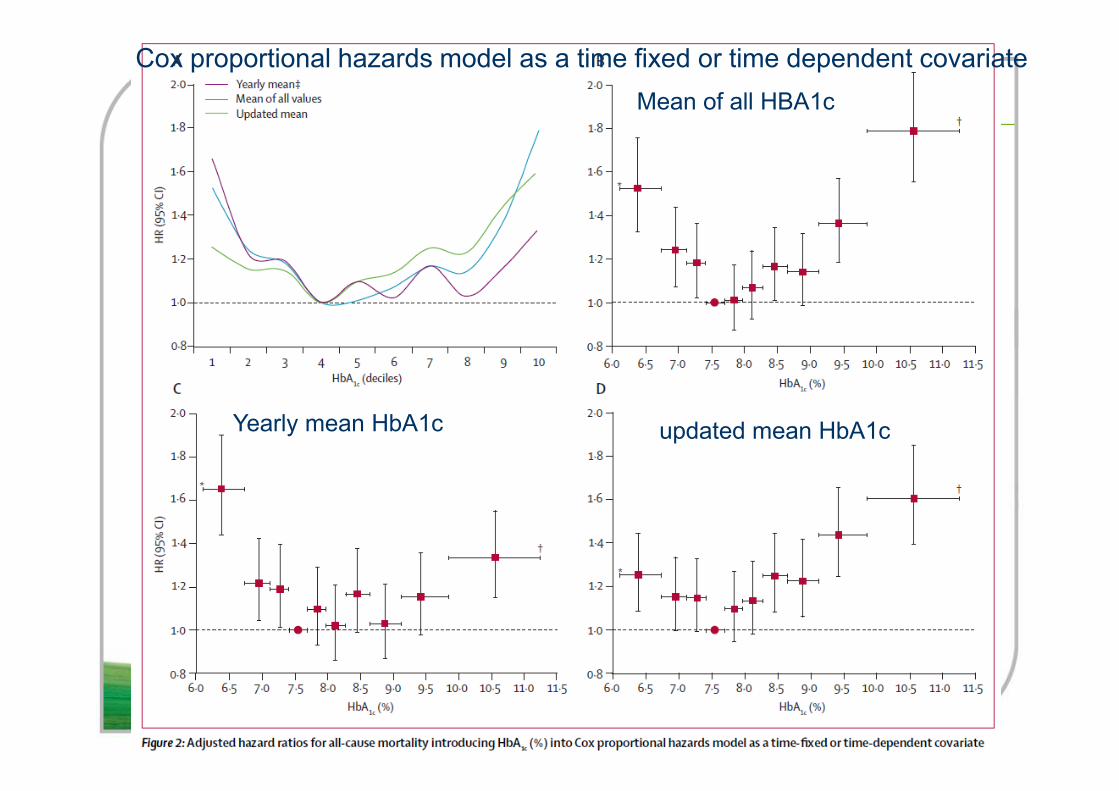
Cox proportional hazards model as a time fixed or time dependent covariate
Mean of all HBA1c
Yearly mean HbA1c updated mean HbA1c
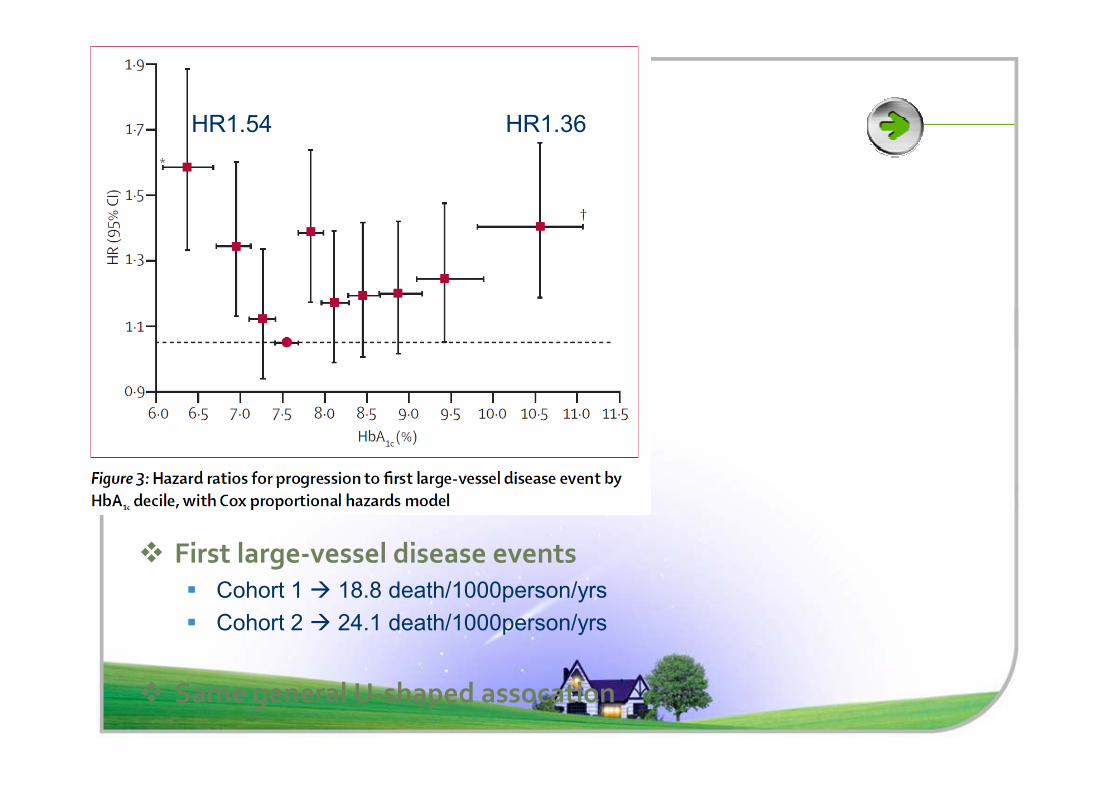
HR1.54 HR1.36
� First large-vessel disease events
� Cohort 1 � 18.8 death/1000person/yrs
� Cohort 2 � 24.1 death/1000person/yrs
� Same general U-shaped assocation
Discussion
� Low and high mean HbA1c values were associated with
increased all-cause mortality and cardiac events
� HbA1c of approximately 7.5% was associated with lowest
all-cause mortality and lowest progression to large-vessel
disease eventsdisease events
� Support to findings of the ACCORD trial
� Hypoglycaemia is associated with various sequelae that
could increase mortality
Discussion
�Insulin might heighten mortality risk
� Old, comorbidities, diabetes duration
� Direct cardiotoxic effect in type 2 diabetes ?
�Limitations�Limitations
� Missing data
� HbA1c standardization
� Not randomised

�At baseline, 635 participants (6.8%) had
previously undiagnosed diabetes.
�An A1C cut-off of 5.8% produced the highest
sensitivity (72%) and specificity (86%).
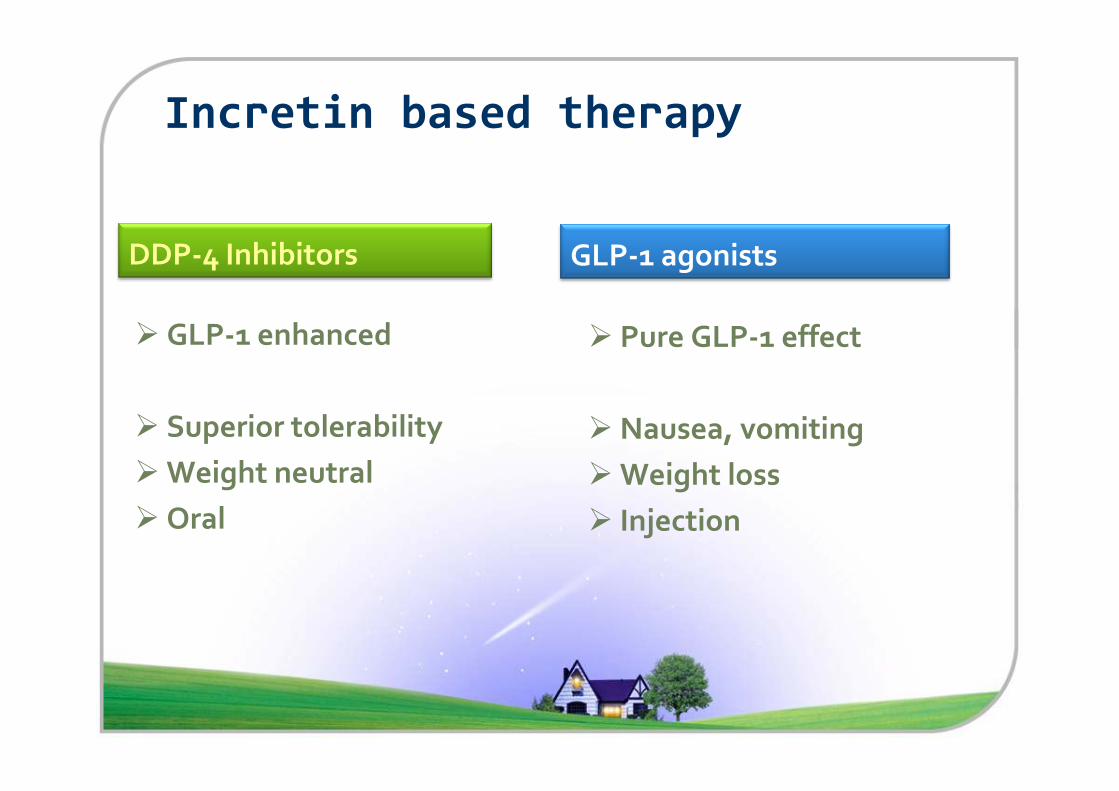
Incretin based therapy
DDP-4 Inhibitors
� GLP-1 enhanced
GLP-1 agonists
� Pure GLP-1 effect
� Superior tolerability
� Weight neutral
� Oral
� Nausea, vomiting
� Weight loss
� Injection
Agenda of today’s talk
1. Glucose fluctuation
2. Overall Adverse Events
3. Hypoglycemia
4. Hepatic safety
5. Pancreatitis, Immune system
6. Cardiovascular safety data
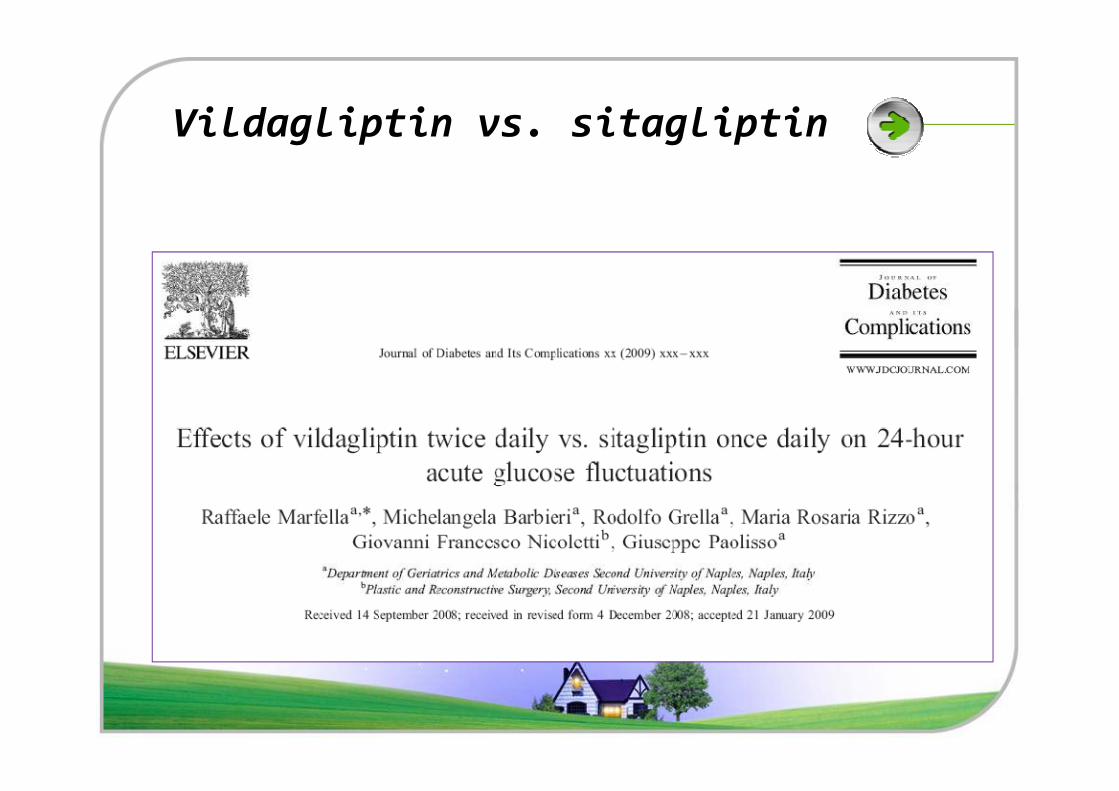
Vildagliptin vs. sitagliptin
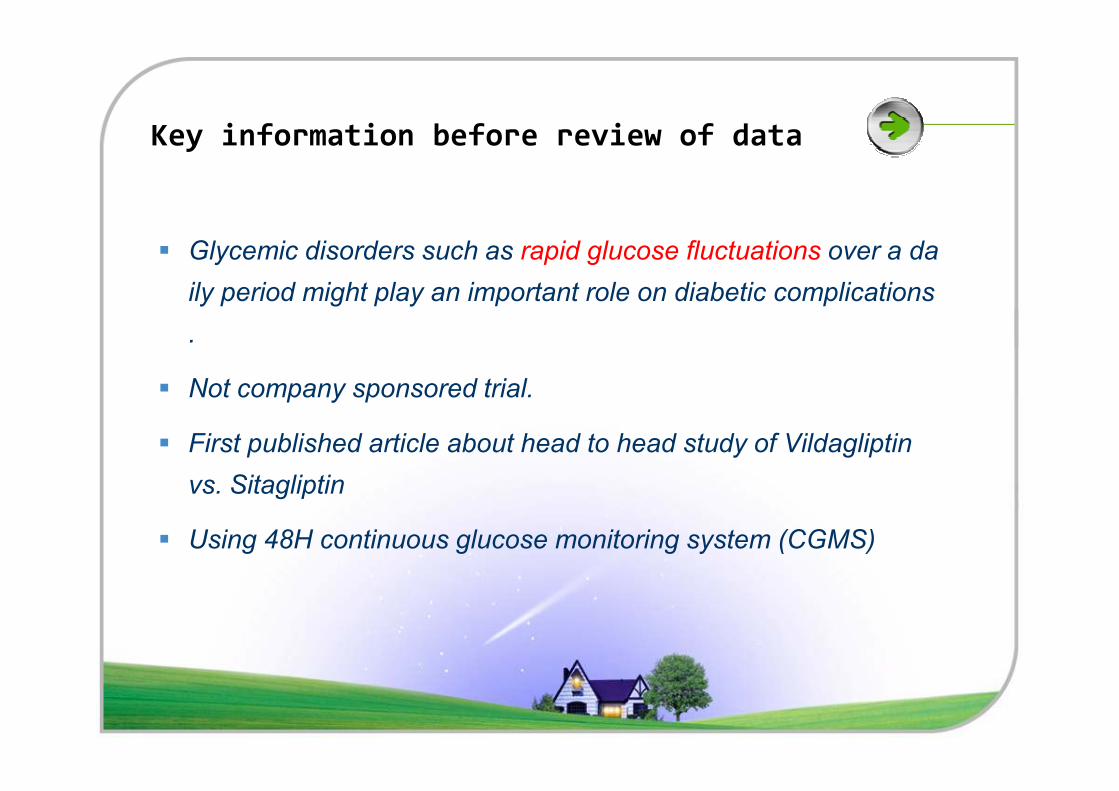
� Glycemic disorders such as rapid glucose fluctuations over a da
ily period might play an important role on diabetic complications
.
� Not company sponsored trial.
Key information before review of data
� Not company sponsored trial.
� First published article about head to head study of Vildagliptin
vs. Sitagliptin
� Using 48H continuous glucose monitoring system (CGMS)
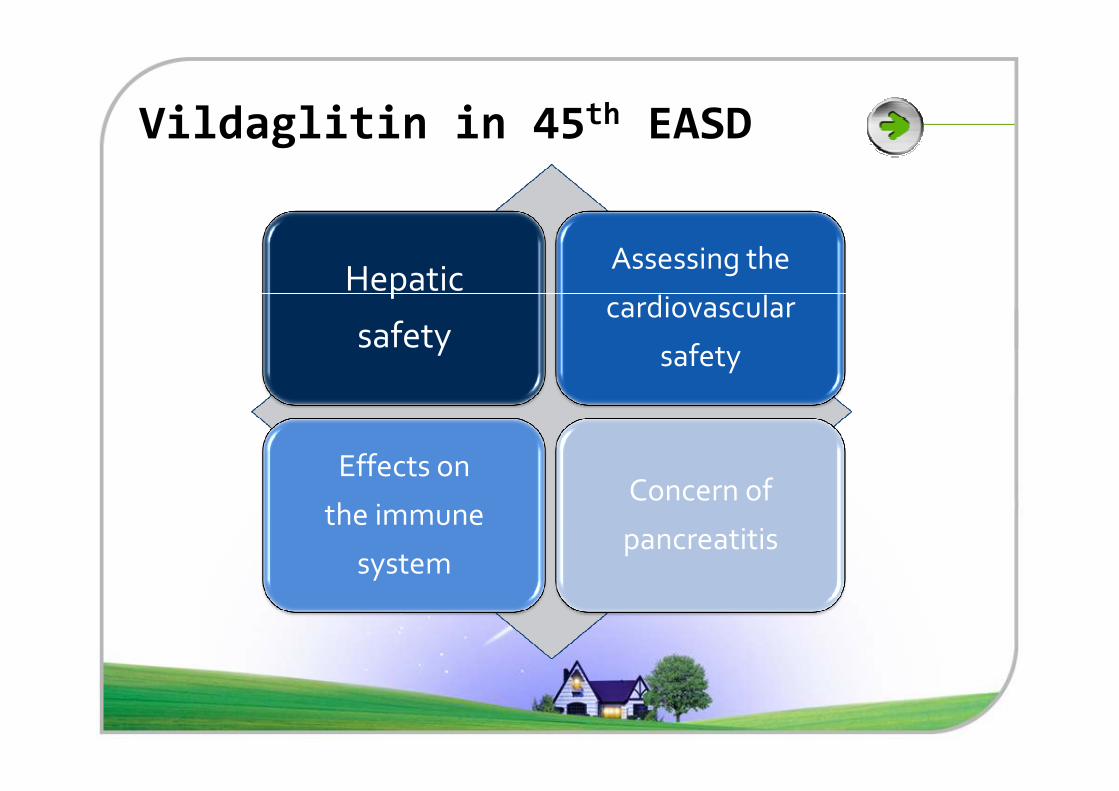
Vildaglitin in 45th EASD
Hepatic
safety
Assessing the
cardiovascular
safety
Effects on
the immune
system
Concern of
pancreatitis
Hepatic Safety
Are there any concerns for hepatic safety?
Hepatic safety profile of vildagliptin, a new
DPP-4 inhibitor for the treatment of type 2
diabetes" (Kothny et al.)
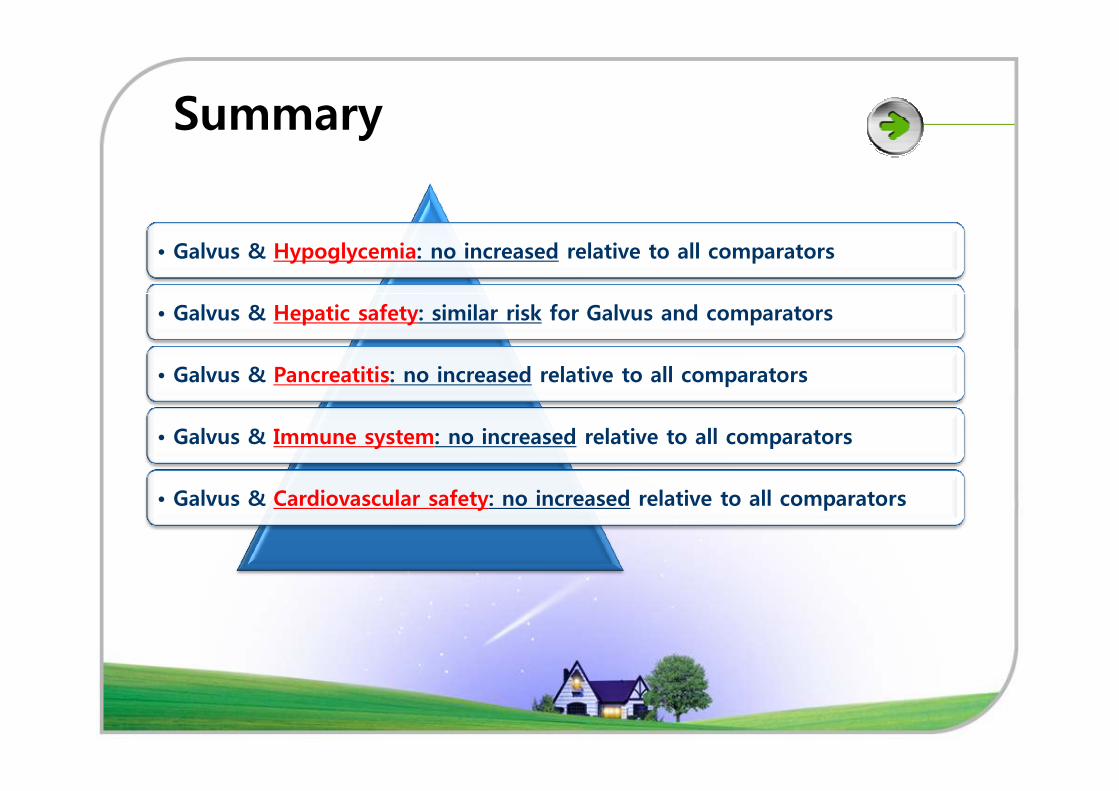
Summary
• Galvus & Hypoglycemia: no increased relative to all comparators
• Galvus & Hepatic safety: similar risk for Galvus and comparators
• Galvus & Pancreatitis: no increased relative to all comparators
• Galvus & Immune system: no increased relative to all comparators
• Galvus & Cardiovascular safety: no increased relative to all comparators