Embed Size (px)
Citation preview
RESEARCH ARTICLE
Heterogeneous Uptake of Nanoparticles in
Mouse Models of Pediatric High-Risk
Neuroblastoma
Ketan B. Ghaghada1, Zbigniew A. Starosolski1, Anna Lakoma2, Caterina Kaffes3¤a,
Saurabh Agarwal4,5, Khannan K. Athreya6¤b, Jason Shohet4,5, Eugene Kim2¤c,
Ananth Annapragada1,5*
1 Department of Pediatric Radiology, Texas Children’s Hospital, Houston, Texas, United States of America,
2 Michael E. DeBakey, Department of Surgery, Division of Pediatric Surgery, Baylor College of Medicine,
Houston, Texas, United States of America, 3 Department of Pediatrics, Baylor College of Medicine, Houston,
Texas, United States of America, 4 Department of Pediatrics, Section of Hematology-Oncology and Center
for Cell and Gene Therapy, Baylor College of Medicine, Houston, Texas, United States of America, 5 Texas
Children’s Cancer Center, Texas Children’s Hospital, Houston, Texas, United States of America, 6 University
of Texas Medical School at Houston, The University of Texas Health Sciences Center at Houston, Houston,
Texas, United States of America
¤a Current address: Department of Diagnostic Imaging, MD Anderson Cancer Center, Houston, Texas,
United States of America
¤b Current address: Baylor College of Medicine, Houston, Texas, United States of America
¤c Current address: Department of Surgery, Division of Pediatric Surgery, Keck School of Medicine,
University of Southern California, Los Angeles, California, United States of America
Abstract
Liposomal chemotherapeutics are exemplified by DOXIL® are commonly used in adult
cancers. While these agents exhibit improved safety profile compared to their free drug
counterparts, their treatment response rates have been ~ 20%, often attributed to the het-
erogeneous intratumoral uptake and distribution of liposomal nanoparticles. Non-invasive
and quantitative monitoring of the uptake and distribution of liposomal nanoparticles in solid
tumors could allow for patient stratification and personalized cancer nanomedicine. In this
study, the variability of liposomal nanoparticle intratumoral distribution and uptake in orthoto-
pic models of pediatric neuroblastoma was investigated using a liposomal nanoprobe visual-
ized by high-resolution computed tomography (CT). Two human neuroblastoma cell lines
(NGP: a MYCN-amplified line, and SH-SY5Y a MYCN non-amplified line) were implanted in
the renal capsule of nude mice to establish the model. Intratumoral nanoparticle uptake was
measured at tumor ages 1, 2, 3 and 4 weeks post implantation. The locations of uptake
within the tumor were mapped in the 3-dimensional reconstructed images. Total uptake was
measured by integration of the x-ray absorption signal over the intratumoral uptake loca-
tions. Both tumor models showed significant variation in nanoparticle uptake as the tumors
aged. Observation of the uptake patterns suggested that the nanoparticle uptake was domi-
nated by vascular leak at the surface/periphery of the tumor, and localized, heterogeneous
vascular leak in the interior of the tumor. Slow growing SH-SY5Y tumors demonstrated
uptake that correlated directly with the tumor volume. Faster growing NGP tumor uptake did
not correlate with any tumor geometric parameters, including tumor volume, tumor surface
PLOS ONE | DOI:10.1371/journal.pone.0165877 November 18, 2016 1 / 12
a11111
OPENACCESS
Citation: Ghaghada KB, Starosolski ZA, Lakoma A,
Kaffes C, Agarwal S, Athreya KK, et al. (2016)
Heterogeneous Uptake of Nanoparticles in Mouse
Models of Pediatric High-Risk Neuroblastoma.
PLoS ONE 11(11): e0165877. doi:10.1371/journal.
pone.0165877
Editor: Surinder K. Batra, University of Nebraska
Medical Center, UNITED STATES
Received: May 9, 2016
Accepted: October 19, 2016
Published: November 18, 2016
Copyright: © 2016 Ghaghada et al. This is an open
access article distributed under the terms of the
Creative Commons Attribution License, which
permits unrestricted use, distribution, and
reproduction in any medium, provided the original
author and source are credited.
Data Availability Statement: The complete dataset
has been uploaded to to Harvard Dataverse, and is
available at the following URL: http://dx.doi.org/10.
7910/DVN/CWDM1V.
Funding: Funding for this work came from the
Gillson Longenbaugh Foundation (AA, JS), and the
National Institutes of Health (R01CA174808 to JS,
and R01DE024392 to AA).
Competing Interests: AA is a founder of, and owns
stock in, Alzeca Inc: "I am stating for the record that
regardless of the fact that I am a founder and
area, and R30 and R50, measures of uptake localized to the interior of the tumor. However,
uptake for both SH-SY5Y and NGP tumors correlated almost perfectly with the leak volume,
as measured by CT. These results suggest that the uptake of nanoparticles is heteroge-
neous and not governed by tumor geometry. An imaging nanoprobe remains the best mea-
sure of nanoparticle uptake in these tumor models.
Introduction
Nanoparticle based therapies continue to be the focus of numerous drug development efforts.
Twenty years after the approval of Doxil1 (Stealth Liposomal Doxorubicin) for the treatment
of Kaposi’s Sarcoma, a recent search of clinical trials.gov revealed that there were over 450
open clinical trials for liposomal drugs, including liposomal formulations of doxorubicin, pac-
litaxel, vincristine, bupivacaine, mitoxantrone, prednisolone, cytarabine, cortisol, irinotecan,
amphotericin B, daunorubicin, amikacin, prostoglandin E1, and numerous siRNA’s. A meta-
analysis of the last 30 years of data on nanoparticle delivery to tumors [1] shows that a very
small fraction (<1%) of the injected dose actually deposits in the target tumor, yet interest in
nanoparticle based therapies remains extremely high: even at this low deposited dose, the ther-
apeutic index achievable with nanoparticle delivery promises to be higher than that from other
delivery approaches, and a persuasive case for a 30 year research plan to increase the deposited
dose has been presented [1]. A continuing problem however, is the variability of nanoparticle
delivery, even within a given tumor type [2–4]. Both Abraxane and Doxil have a ~20%
response rate, and it is yet unknown how much of this is due to low intra-tumoral delivery of
the agent. A biomarker that predicts nanoparticle deposition in tumors could therefore be
extremely useful, guiding therapy by determining which tumors are candidates for nanoparti-
cle based therapy, by virtue of their receiving a larger fraction of the delivered dose of a nano-
particle based therapeutic. In 2009 we introduced the term “physiomarker” to describe such a
parameter [5], distinguishing it from the typical biomarker that is usually characterized as a
molecular or species concentration, predictive of pathology.
In previous work, we showed that a liposome encapsulating iodinated contrast agent, visu-
alized by planar X-ray imaging, exhibited highly variable uptake in a MAT-B-III rat model of
breast cancer [6–8], and that the uptake pattern was highly heterogeneous [9]. We also showed
that when treated with liposomal doxorubicin, these individual tumors showed highly variable,
but predictable response: the tumors that had the highest uptake of the iodinated liposome
also had the best response to the liposomal doxorubicin, while those that showed low uptake of
the iodinated particle exhibited poor response to the liposomal doxorubicin. We further
showed that the uptake levels of nanoprobe were directly related to the level of angiogenesis as
measured by the levels of VEGF-A, VEGF-B and VEGF-R1. MAT-B-III however, is a very rap-
idly growing tumor, with volumetric doubling in as few as 4–5 days, raising the question of
whether such rapid growth resulted in uncontrolled angiogenesis, and perhaps more variabil-
ity in leak through the fenestrations in rampant angiogenic vessels. In other previous work
[10,11], we showed that non-orthotopic implanted tumors develop highly unusual vascular
structures by co-option of surrounding and distant vessels, and by angiogenesis external to the
tumor margin, thereby posing the question of whether tumors in their normally occurring
environment also develop similar uptake heterogeneity. In a recent study, we showed that
uptake heterogeneity also occurs in companion dogs with spontaneous tumors. However, to
date, no studies of uptake heterogeneity have been conducted in pediatric solid tumors[12].
We hypothesize that a nanoparticle-based contrast agent enables non-invasive imaging and
quantitative analysis of uptake and intra-tumoral distribution of nanoparticles. We therefore
Heterogeneity of Nanoparticle Uptake in Neuroblastoma
PLOS ONE | DOI:10.1371/journal.pone.0165877 November 18, 2016 2 / 12
stockholder in Alzeca Inc., This does not alter our
adherence to PLOS ONE policies on sharing data
and materials as detailed online in the guide for
authors."

chose to test the variability of nanoparticle uptake in two orthotopic mouse models of high-risk
neuroblastoma, the most common extracranial solid tumor in pediatric patients. We chose the
SH-SY5Y cell line as an example of a MYCN non-amplified tumor with relatively slow growth,
and the NGP cell line as an example of a MYCN amplified tumor with relatively fast growth,
although not as fast as the MAT-B-III model we studied previously. We probed the uptake of
liposomal nanoparticles in these tumors using a nanoprobe developed previously [6–9], but
unlike previous work, we imaged the localization of the nanoparticles using computed tomogra-
phy (CT), thus recording the locations of particle deposition in 3D, and enabling the quantifica-
tion of total deposition by integration of the iodine signal. The radial distribution of particle
deposition was measured by decomposing the tumor volume into outer-surface contoured con-
centric shells. We demonstrated that rapidly growing NGP tumors showed far higher variability
in nanoparticle deposition than slower growing SH-SY5Y tumors. None of the geometric
parameters of the tumors (diameter, surface area, volume, radial distribution of deposition) was
successful in predicting the overall deposition. However, the volume of leak from the angiogenic
vessels, as estimated by imaging, was able to accurately predict the overall deposition in both
NGP and SH-SY5Y models, suggesting that an imaging based biomarker of nanoparticle depo-
sition faithfully predicts the deposition of nanoparticle payload in the tumor.
Materials and Methods
All animal studies were approved by the Institutional Animal Care and Use Committee
(IACUC) of Baylor College of Medicine. The studies were in compliance with NC3RS-AR-
RIVE guidelines. Human neuroblastoma cells lines NGP and SH-SY5Y were used for tumor
implantation. Xenograft studies were performed in four- to six-week-old female non-obese
diabetic/severe combined immunodeficient (NOD/SCID) mice (NCI-Frederick, Frederick,
MD). A total of 60 mice were used for the study. Tumor implantation was performed following
a previously described orthotopic kidney capsule model of neuroblastoma [13,14]. Briefly, ani-
mals were pre-anesthetized with a cocktail of ketamine and xylazine, administered intra-peri-
toneally, at a dose of 80 mg/kg and 16 mg/kg, respectively. The animals were then brought to
the operating area and placed under 1–1.5% isoflurane inhaled gas anesthesia delivered
through a nose-cone setup for the surgical procedure. The kidney was externalized through a
small lateral incision and one million NB cells (stably transduced with Luciferase), suspended
in phosphate-buffered saline, were surgically injected in the sub-renal capsule. The kidney was
replaced, skin and muscle were then closed with suture and the mice were allowed to recover.
The surgical procedure is complete in under 2 minutes from the induction of anesthesia. Ani-
mals were covered in warm dry gauze with heating lamp and then placed in their cages to
recover and awaken immediately after the procedure. Mice were monitored every 15 minutes
for hypothermia and until they were awake. Animals were monitored daily until surgical
wounds were healed and sutures removed. To minimize pain and distress, mice received cov-
erage with buprenorphine (0.5 mg/kg sub-cutaneously every 12 hours) for a minimum of 48
hours after the procedures and then as necessary to control pain. Tumor-bearing mice were
monitored three times a week until a palpable tumor nodule was present and then daily there-
after. Early euthanasia was considered if the mice were observed in moribund state, exhibited
poor respirations, cachexia or obvious distress/pain, immobility, huddled posture, inability to
eat, self-mutilation or body weight loss of more than 20%.
Nanoparticle Contrast Agent
The nanoparticle contrast agent was prepared as per procedures described previously [10].
Briefly, 1,2-dipalmitoyl-sn-glycero-3-phospho- choline (DPPC), cholesterol, and
Heterogeneity of Nanoparticle Uptake in Neuroblastoma
PLOS ONE | DOI:10.1371/journal.pone.0165877 November 18, 2016 3 / 12

1,2-distearoyl-sn-glycero-3-phosphoethanolamine-N-[methoxy (polyethylene glycol)-2000]
(DSPE- MPEG2000) were dissolved in ethanol at a molar ratio of 56:40:4. The ethanolic lipid
solution was hydrated with an aqueous solution of iodixanol (550 mg I/mL) and then sequen-
tially extruded at ~65˚C on a Lipex Thermoline extruder (Northern Lipids, Vancouver, British
Columbia, Canada) to size the liposomes to ~140 nm. The extruded liposomal nanoparticle
solution was diafiltered against 150 mM saline solution to remove free iodixanol. The size dis-
tribution of liposomes in the final formulation was determined by dynamic light scattering
(DLS). The iodixanol concentration in the final solution was determined by measuring UV
absorbance at a wavelength of 245 nm. The average liposome size in the final formulation was
135±20 nm. The overall iodine concentration was 110 mg I/mL and the ratio of iodine to total
lipid was 1:1 (mg/mg). For in vivo imaging studies, the nanoparticle contrast agent was admin-
istered intravenously via the tail vein at an iodine dose of 2.2 mg/gm body weight (2.2 mg total
lipid/kg), delivered over a 1–2 minute period.
Micro-CT
Imaging was performed on a small animal micro-CT system (Inveon, Siemens Inc., Knoxville,
TN, USA). The animals were placed prone on the scanner bed and scanned while free breath-
ing under anesthesia using 1.5–2.5% isoflurane delivered by face-cone. An electrical resistive
heating element was used to maintain and control body temperature during the entire imaging
session. The respiratory rate was monitored using a pressure-pad placed under the animal in
the abdominal region. CT image acquisition was performed using the following parameters
set: 70 kVp peak voltage, 0.5 mA tube current, 850 ms X-ray exposure time, 540 projections
over a 360 degree rotation, resulting in a 20 minute scan time. The estimated radiation dose,
determined using a point source dosimeter, was 1.4 Gy. Images were reconstructed by filtered
back-projection, using the COBRA v6.1 software package (EXXIM Computing Corp., Liver-
more, CA, USA), at an isotropic resolution of 35 μm. 60 animals inoculated with tumor cells
(NGP or SH-SY5Y) were divided into four groups. Group 1 animals (n = 6) were imaged at
one week, group 2 (n = 6) at two weeks, group 3 (n = 12) at three weeks and group 4 (n = 6) at
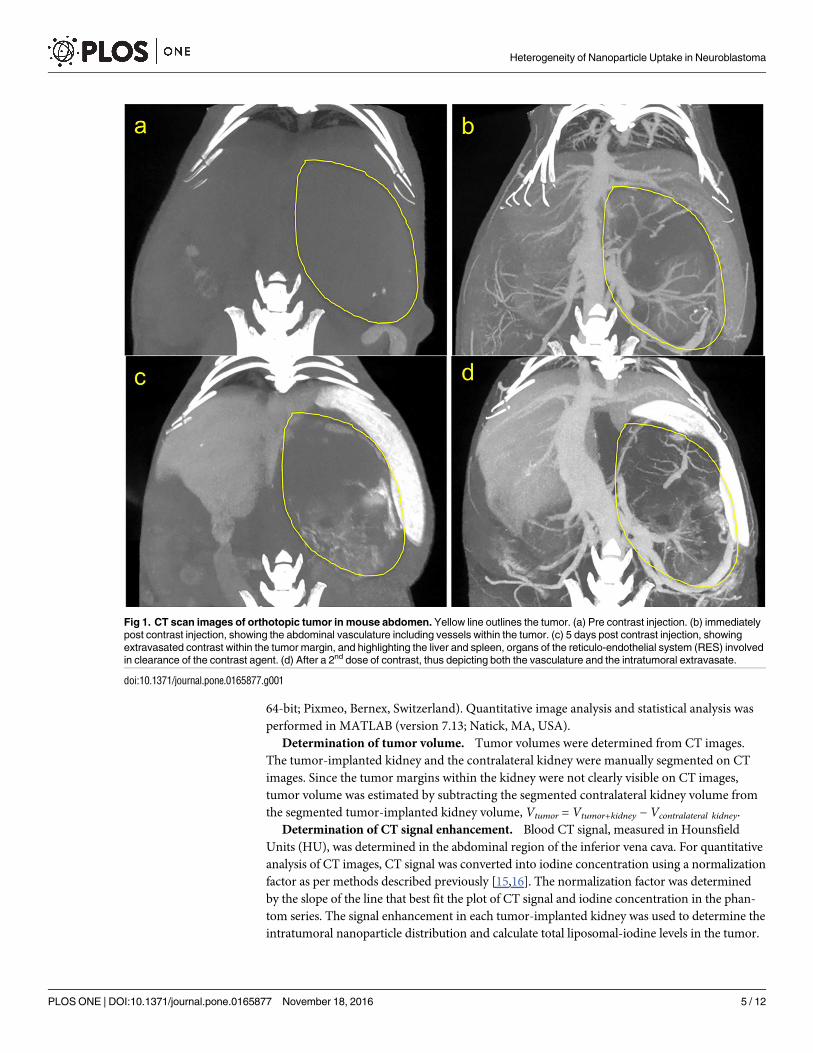
four weeks, post-tumor implantation. Fig 1 shows a typical set of scans, before contrast injec-
tion, immediately after contrast injection showing the vasculature, 5 days post contrast injec-
tion showing the extravasated contrast and highlighting the leak within the tumor, and finally
post a second dose of contrast showing the vasculature and the extravasated contrast in the
same field. Phantoms containing solutions of known iodine concentration were placed in the
field of view of every scan, enabling quantification of the iodine uptake in tumors. Each animal
underwent a pre-contrast scan followed by administration of the contrast agent. An immediate
post-contrast scan was performed within one hour after administration of the contrast agent
(acute post-contrast). Thereafter, the animals were scanned four days (for SH-SY5Y tumor-
bearing animals) or five days (for NGP tumor-bearing animals) post-administration of the
contrast agent (delayed post-contrast). The animals were subsequently sacrificed by CO2 inha-
lation followed by cervical dislocation, and both the kidneys (tumor-implanted and contralat-
eral) were extracted and weighed. The kidneys were formalin-fixed, paraffin-embedded,
sectioned and stained with hematoxylin and eosin. A board-certified pathologist reviewed the
slides for the presence or absence of tumor.
Data Analysis
Tumor weight was estimated by subtracting the weight of contralateral kidney from the weight
of tumor-implanted kidney. Image segmentation was performed in Osirix (version 5.8.5
Heterogeneity of Nanoparticle Uptake in Neuroblastoma
PLOS ONE | DOI:10.1371/journal.pone.0165877 November 18, 2016 4 / 12
64-bit; Pixmeo, Bernex, Switzerland). Quantitative image analysis and statistical analysis was
performed in MATLAB (version 7.13; Natick, MA, USA).
Determination of tumor volume. Tumor volumes were determined from CT images.
The tumor-implanted kidney and the contralateral kidney were manually segmented on CT
images. Since the tumor margins within the kidney were not clearly visible on CT images,
tumor volume was estimated by subtracting the segmented contralateral kidney volume from
the segmented tumor-implanted kidney volume, Vtumor = Vtumor+kidney − Vcontralateral kidney.
Determination of CT signal enhancement. Blood CT signal, measured in Hounsfield
Units (HU), was determined in the abdominal region of the inferior vena cava. For quantitative
analysis of CT images, CT signal was converted into iodine concentration using a normalization
factor as per methods described previously [15,16]. The normalization factor was determined
by the slope of the line that best fit the plot of CT signal and iodine concentration in the phan-
tom series. The signal enhancement in each tumor-implanted kidney was used to determine the
intratumoral nanoparticle distribution and calculate total liposomal-iodine levels in the tumor.
Fig 1. CT scan images of orthotopic tumor in mouse abdomen. Yellow line outlines the tumor. (a) Pre contrast injection. (b) immediately
post contrast injection, showing the abdominal vasculature including vessels within the tumor. (c) 5 days post contrast injection, showing
extravasated contrast within the tumor margin, and highlighting the liver and spleen, organs of the reticulo-endothelial system (RES) involved
in clearance of the contrast agent. (d) After a 2nd dose of contrast, thus depicting both the vasculature and the intratumoral extravasate.
doi:10.1371/journal.pone.0165877.g001
Heterogeneity of Nanoparticle Uptake in Neuroblastoma
PLOS ONE | DOI:10.1371/journal.pone.0165877 November 18, 2016 5 / 12
Determination of leak volume. The separation of tumor margins from healthy kidney
margins in the delayed post-contrast CT images was not possible in both the orthotopic tumor
models because the kidney was essentially obliterated by the tumor. As a result, 3D analysis of
nanoparticle uptake was performed on the entire tumor-bearing kidney in those mice where
tumor weights were greater than contralateral kidney weight (15 mice in NGP group and 4
mice in SH-SY5Y group). The intensity distribution of CT signal in tumor-implanted kidney
and contralateral kidney was well-represented by a Gaussian (normal) distribution. Each image
was thresholded using a level 3σ above the mean CT signal, thereby differentiating contrast-
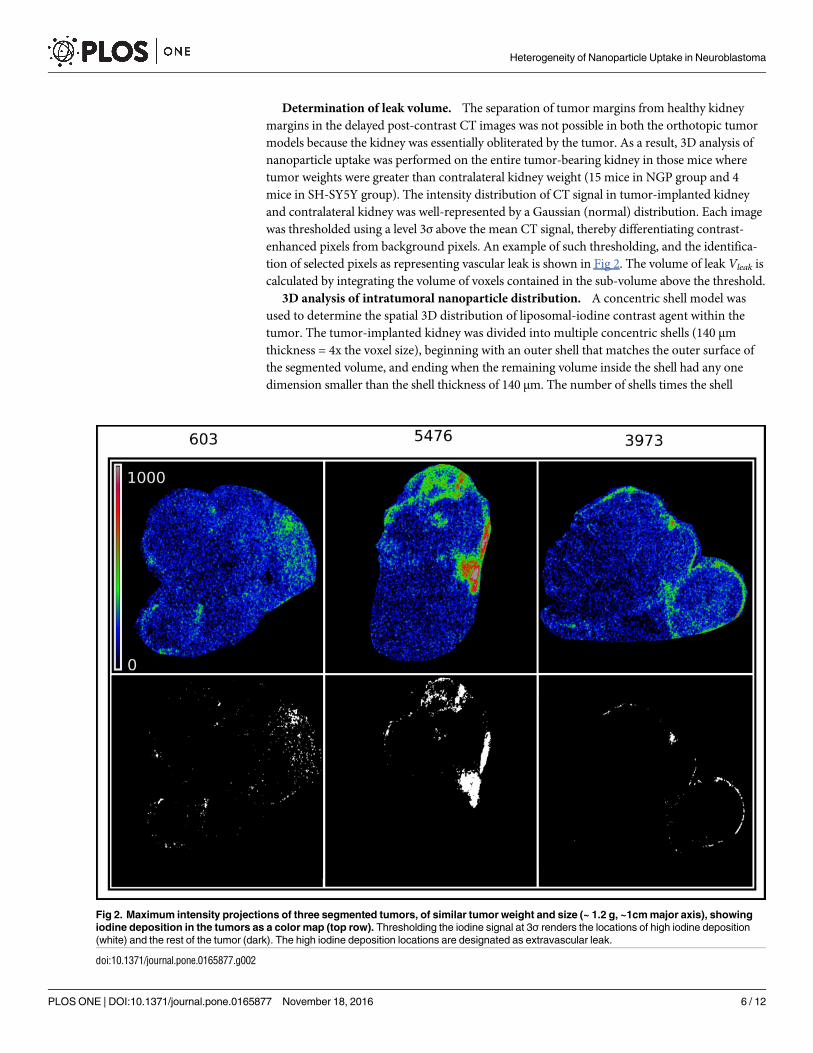
enhanced pixels from background pixels. An example of such thresholding, and the identifica-
tion of selected pixels as representing vascular leak is shown in Fig 2. The volume of leak Vleak is
calculated by integrating the volume of voxels contained in the sub-volume above the threshold.
3D analysis of intratumoral nanoparticle distribution. A concentric shell model was
used to determine the spatial 3D distribution of liposomal-iodine contrast agent within the
tumor. The tumor-implanted kidney was divided into multiple concentric shells (140 μm
thickness = 4x the voxel size), beginning with an outer shell that matches the outer surface of
the segmented volume, and ending when the remaining volume inside the shell had any one
dimension smaller than the shell thickness of 140 μm. The number of shells times the shell
Fig 2. Maximum intensity projections of three segmented tumors, of similar tumor weight and size (~ 1.2 g, ~1cm major axis), showing
iodine deposition in the tumors as a color map (top row). Thresholding the iodine signal at 3σ renders the locations of high iodine deposition
(white) and the rest of the tumor (dark). The high iodine deposition locations are designated as extravascular leak.
doi:10.1371/journal.pone.0165877.g002
Heterogeneity of Nanoparticle Uptake in Neuroblastoma
PLOS ONE | DOI:10.1371/journal.pone.0165877 November 18, 2016 6 / 12

thickness was used as an estimate of the minor radius rminor of the tumor. Surface area of the
tumor was estimated as Atumor ¼Vtumorrminor
. An example is shown in Fig 3. Iodine intensity in each
shell is calculated by summing the iodine signal within each shell. Similarly, the volume of leak
in each shell is calculated by summing the volume of thresholded voxels within the shell. Cumu-
lative iodine amounts within a shell radius is calculated by summing all iodine amounts for the
chosen, and smaller shells. Shell radii are normalized to the largest radius, thus permitting com-
parison of the distributions within tumors of different sizes. R30 and R50, normalized radii
within which 30% and 50% of the cumulative iodine was deposited, were estimated from the
cumulative distributions. The extent of variability in uptake as a function of each of these param-
eters was estimated by fitting the data to generalized higher degree (n� 5) polynomials and
selecting the fit with the best correlation coefficient. These fits are not meant to depict the actual
relationship between abcissa and ordinate, but are rather, a guide for the eye, and the scatter of
the data around the line an indication of the variability of the uptake with respect to the ordinate.
Results and Discussion
In the NGP group, 4/6 mice showed tumors at day 19, 9/12 mice showed tumors at day 26 and
6/6 mice showed tumors at day 33 post-implantation of tumors cells. In the SH-SY5Y group,
Fig 3. Radial discretization of tumor volume into 140μm thick concentric sections. The process begins at the periphery of the tumor and
creating a sub-volume that penetrates 140μm into the interior of the tumor. The process is repeated for the remaining portion of the tumor until the
remaining portion has a dimension less than 140μm.
doi:10.1371/journal.pone.0165877.g003
Heterogeneity of Nanoparticle Uptake in Neuroblastoma
PLOS ONE | DOI:10.1371/journal.pone.0165877 November 18, 2016 7 / 12
1/6 mice showed tumors at day 12, 4/6 mice showed tumors at day 19, 9/12 mice showed
tumors at day 26 and 3/6 mice showed tumors at day 33 post-implantation of tumor cells.
NGP tumors demonstrated rapid tumor growth compared to SH-SY5Y tumors. By day 26, the
NGP tumors had grown to approximately five times the size of the normal (contralateral) kid-
ney (0.21±0.04 g). 17/19 of histologically visible tumors in the NGP group and 8/17 of histolog-
ically visible tumors in the SH-SY5Y group showed signal enhancement in delayed post-
contrast CT images.
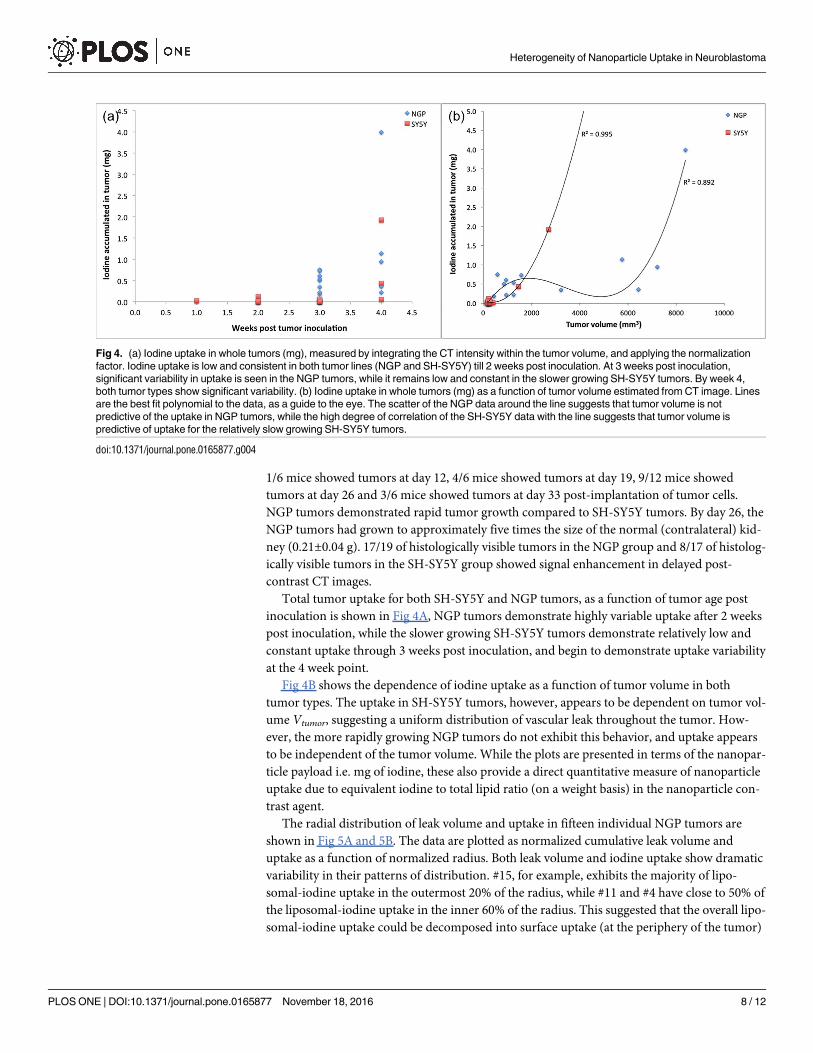
Total tumor uptake for both SH-SY5Y and NGP tumors, as a function of tumor age post
inoculation is shown in Fig 4A, NGP tumors demonstrate highly variable uptake after 2 weeks
post inoculation, while the slower growing SH-SY5Y tumors demonstrate relatively low and
constant uptake through 3 weeks post inoculation, and begin to demonstrate uptake variability
at the 4 week point.
Fig 4B shows the dependence of iodine uptake as a function of tumor volume in both
tumor types. The uptake in SH-SY5Y tumors, however, appears to be dependent on tumor vol-
ume Vtumor, suggesting a uniform distribution of vascular leak throughout the tumor. How-
ever, the more rapidly growing NGP tumors do not exhibit this behavior, and uptake appears
to be independent of the tumor volume. While the plots are presented in terms of the nanopar-
ticle payload i.e. mg of iodine, these also provide a direct quantitative measure of nanoparticle
uptake due to equivalent iodine to total lipid ratio (on a weight basis) in the nanoparticle con-
trast agent.
The radial distribution of leak volume and uptake in fifteen individual NGP tumors are
shown in Fig 5A and 5B. The data are plotted as normalized cumulative leak volume and
uptake as a function of normalized radius. Both leak volume and iodine uptake show dramatic
variability in their patterns of distribution. #15, for example, exhibits the majority of lipo-
somal-iodine uptake in the outermost 20% of the radius, while #11 and #4 have close to 50% of
the liposomal-iodine uptake in the inner 60% of the radius. This suggested that the overall lipo-
somal-iodine uptake could be decomposed into surface uptake (at the periphery of the tumor)
Fig 4. (a) Iodine uptake in whole tumors (mg), measured by integrating the CT intensity within the tumor volume, and applying the normalization
factor. Iodine uptake is low and consistent in both tumor lines (NGP and SH-SY5Y) till 2 weeks post inoculation. At 3 weeks post inoculation,
significant variability in uptake is seen in the NGP tumors, while it remains low and constant in the slower growing SH-SY5Y tumors. By week 4,
both tumor types show significant variability. (b) Iodine uptake in whole tumors (mg) as a function of tumor volume estimated from CT image. Lines
are the best fit polynomial to the data, as a guide to the eye. The scatter of the NGP data around the line suggests that tumor volume is not
predictive of the uptake in NGP tumors, while the high degree of correlation of the SH-SY5Y data with the line suggests that tumor volume is
predictive of uptake for the relatively slow growing SH-SY5Y tumors.
doi:10.1371/journal.pone.0165877.g004
Heterogeneity of Nanoparticle Uptake in Neuroblastoma
PLOS ONE | DOI:10.1371/journal.pone.0165877 November 18, 2016 8 / 12

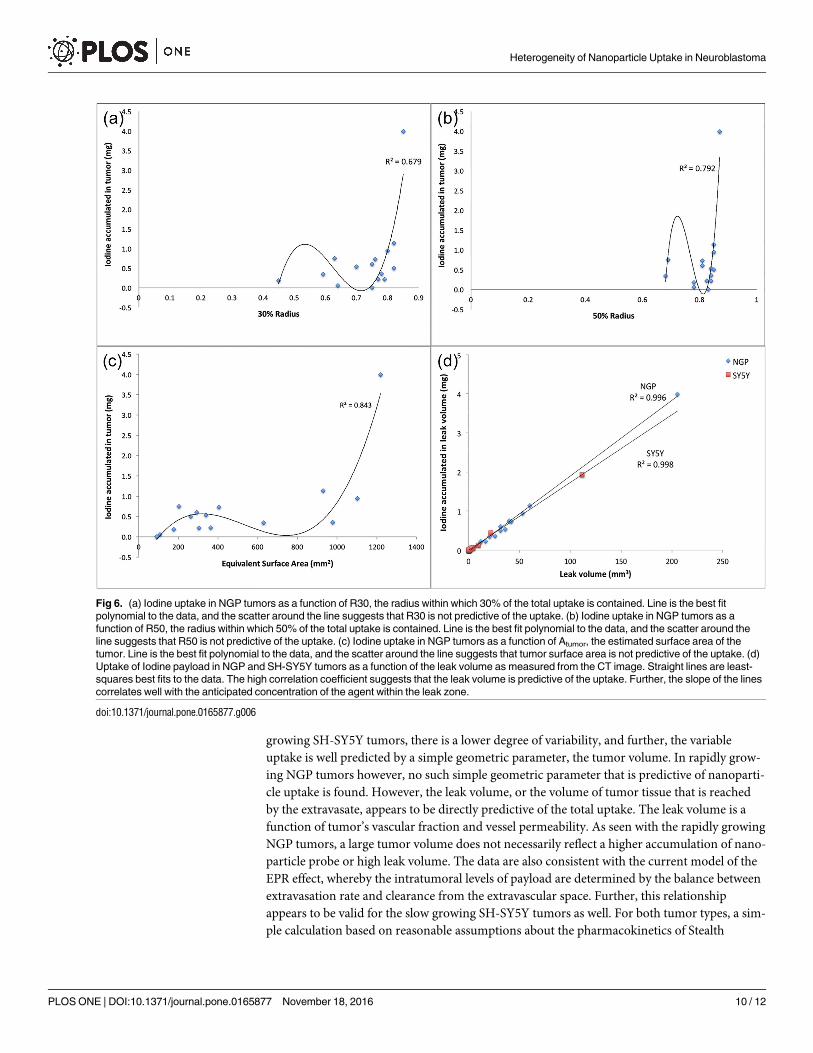
and inner, or core, uptake, within the bulk of the tumor. We therefore calculated R30 and R50
(normalized radii within 30% and 50% respectively, of the total iodine uptake was contained)
as measures of the core uptake in each tumor. However, neither of these parameters, nor the
tumor area Atumor, appears to be predictive of the uptake as evident by the poor correlation
coefficient values (R2) (Fig 6A, 6B and 6C), suggesting that neither the surface area nor the
core uptake determines the distribution of nanoparticle uptake in the tumor.
Since none of the tested tumor geometric parameters appear to be predictive of uptake in
NGP tumors, we resort to a direct measure of the leak volume, Vleak, as measured by nanopar-
ticle contrast extravasation. Fig 6D shows that for both NGP and SH-SY5Y, the uptake is
directly proportional to the leak volume. Straight lines in Fig 6D are least-squares fits to the
data. The slopes of these lines are a measure of the average concentration (mg/mm3) in the
leaks. The leak of Stealth nanoparticles into tumors is attributed to passive extravasation, the
well-known “Enhanced Permeation and Retention Effect” or EPR. One anticipates therefore
that tumor uptake of nanoparticles and nanoparticle payload should be a function of the per-
meable surface area of the intratumoral vasculature. The concentration of tracer in the tumor
extravascular space should be given by a balance between the extravasation rate and clearance
from the extravascular space. Assuming that in the duration of this experiment (~96 hours),
clearance of extravasated particles from the extravascular space is small, the concentration
should be given by the average blood pool concentration of the nanoparticle agent, adjusted
for volume change of the extravasate due to lymphatic drainage. Assuming a blood half-life of
48 hours (or a first order decay constant of 0.014hr-1), the average concentration in the blood
pool over 96 hours is given by
R 96
0Cdt
96¼
R 96
0C0e� kt dt
96= 14.9 mg Iodine/ml, which is 20–25% lower
than the estimated values from Fig 6D of 17.3 mg Iodine/ml for SH-SY5Y tumors and 19.4 mg
Iodine/ml for NGP tumors. If the extravasate were to lose 20–25% of its volume to lymphatic
drainage over the duration of the experiment, this would be consistent with the estimated
concentrations.
The results of this study are consistent with our previous work [6–9]. In rapidly growing
NGP tumors, there is a high degree of variability of liposomal nanoparticle uptake by the
tumors. One anticipates that this variability would translate into an equivalent variability of
uptake of nanoparticle borne drug, resulting in highly variable therapeutic response. In slow
Fig 5. (a) Normalized cumulative leak volume as a function of normalized radial position for 15 individual NGP tumors ranging in age from 2 to 4
weeks post inoculation, and ranging in volume from 150 to 8500 mm3. (b) Normalized cumulative iodine uptake as a function of normalized radial
position for 15 individual NGP tumors ranging in age from 2 to 4 weeks post inoculation, and ranging in volume from 150 to 8500mm3.
doi:10.1371/journal.pone.0165877.g005
Heterogeneity of Nanoparticle Uptake in Neuroblastoma
PLOS ONE | DOI:10.1371/journal.pone.0165877 November 18, 2016 9 / 12
growing SH-SY5Y tumors, there is a lower degree of variability, and further, the variable
uptake is well predicted by a simple geometric parameter, the tumor volume. In rapidly grow-
ing NGP tumors however, no such simple geometric parameter that is predictive of nanoparti-
cle uptake is found. However, the leak volume, or the volume of tumor tissue that is reached
by the extravasate, appears to be directly predictive of the total uptake. The leak volume is a
function of tumor’s vascular fraction and vessel permeability. As seen with the rapidly growing
NGP tumors, a large tumor volume does not necessarily reflect a higher accumulation of nano-
particle probe or high leak volume. The data are also consistent with the current model of the
EPR effect, whereby the intratumoral levels of payload are determined by the balance between
extravasation rate and clearance from the extravascular space. Further, this relationship
appears to be valid for the slow growing SH-SY5Y tumors as well. For both tumor types, a sim-
ple calculation based on reasonable assumptions about the pharmacokinetics of Stealth
Fig 6. (a) Iodine uptake in NGP tumors as a function of R30, the radius within which 30% of the total uptake is contained. Line is the best fit
polynomial to the data, and the scatter around the line suggests that R30 is not predictive of the uptake. (b) Iodine uptake in NGP tumors as a
function of R50, the radius within which 50% of the total uptake is contained. Line is the best fit polynomial to the data, and the scatter around the
line suggests that R50 is not predictive of the uptake. (c) Iodine uptake in NGP tumors as a function of Atumor, the estimated surface area of the
tumor. Line is the best fit polynomial to the data, and the scatter around the line suggests that tumor surface area is not predictive of the uptake. (d)
Uptake of Iodine payload in NGP and SH-SY5Y tumors as a function of the leak volume as measured from the CT image. Straight lines are least-
squares best fits to the data. The high correlation coefficient suggests that the leak volume is predictive of the uptake. Further, the slope of the lines
correlates well with the anticipated concentration of the agent within the leak zone.
doi:10.1371/journal.pone.0165877.g006
Heterogeneity of Nanoparticle Uptake in Neuroblastoma
PLOS ONE | DOI:10.1371/journal.pone.0165877 November 18, 2016 10 / 12

liposomes leads to a quantitative prediction of the concentration of payload in the extravasate.
As demonstrated in this work, the determination of the leak volume, or for that matter the
actual intratumoral deposition or uptake of the nanoparticle payload itself, is relatively easy to
do using a nanoparticle imaging agent such as the one described in this work, and the uptake
prediction is accurate regardless of the growth rate of the tumor. Studies are currently ongoing
to test the utility of this imaging methodology for predicting the uptake of PEGylated lipo-
somal doxorubicin in mouse models of neuroblastoma.
Conclusion
The current study investigated the uptake and intratumoral distribution of liposomal nanopar-
ticles in orthotopic xenograft mouse models of pediatric neuroblastoma. Similar to the models
of adult solid tumors, we demonstrated, using CT imaging and a liposomal contrast agent, that
pediatric solid tumors exhibit heterogeneous uptake and intratumoral distribution of nanopar-
ticles. Furthermore, using high-resolution CT imaging, we were able to visualize and quantify
the uptake and intratumoral distribution of nanoparticles and show that leak volume is
directly predictive of total nanoparticle uptake in slow growing and fast growing neuroblas-
toma models.
Acknowledgments
The authors acknowledge financial support of the Gillson Longenbaugh Foundation. The
authors also acknowledge the Texas Children’s Small Animal Imaging Facility (SAIF) for
access to the micro CT instrument used in this work.
Author Contributions
Conceptualization: KBG JS EK AA.
Data curation: ZAS KBG AL KKA.
Funding acquisition: AA JS.
Investigation: KBG ZAS AL CK SA KKA.
Methodology: KBG ZAS AL.
Project administration: KBG AA.
Resources: JS EK AA.
Software: ZAS KKA.
Supervision: AA JS.
Validation: KBG ZAS.
Visualization: ZAS KBG AA.
Writing – original draft: AA KBG.
Writing – review & editing: KBG ZAS AL CK SA KKA JS EK AA.
References1. Wilhelm S, Tavares AJ, Dai Q, Ohta S, Audet J, Dvorak HF et al. Analysis of nanoparticle delivery to
tumours. Nature Reviews Materials. 2016 Apr 26; 1(5):16014.
Heterogeneity of Nanoparticle Uptake in Neuroblastoma
PLOS ONE | DOI:10.1371/journal.pone.0165877 November 18, 2016 11 / 12
2. Kwon IK, Lee SC, Han B, Park K. Analysis on the current status of targeted drug delivery to tumors. J
Control Release. 2012 Dec 10; 164(2):108–14. doi: 10.1016/j.jconrel.2012.07.010 PMID: 22800574
3. Park K. Facing the Truth about Nanotechnology in Drug Delivery. ACS Nano. 2013 Sep 24; 7(9):7442–
7. doi: 10.1021/nn404501g PMID: 24490875
4. Prabhakar U, Maeda H, Jain RK, Sevick-Muraca EM, Zamboni W, Farokhzad OC et al. Challenges and
key considerations of the enhanced permeability and retention effect for nanomedicine drug delivery in
oncology. 2013. pp. 2412–7. doi: 10.1158/0008-5472.CAN-12-4561 PMID: 23423979
5. Annapragada A, Bellamkonda RV. Image-based determination of “physiomarkers” for personalized
cancer therapy. Future oncology (London, England). 2009 May; 5(4):409–11.
6. Karathanasis E, Suryanarayanan S, Balusu SR, McNeeley K, Sechopoulos I, Karellas A et al. Imaging
nanoprobe for prediction of outcome of nanoparticle chemotherapy by using mammography. Radiology.
2009 Feb; 250(2):398–406. doi: 10.1148/radiol.2502080801 PMID: 19188313
7. Karathanasis E, McNeeley K, Agarwal A, Annapragada A, Bellamkonda R. MR trackable, chemothera-
peutic nanoparticles for patient specific glioma therapy. Microsc Microanal. Cambridge Univ Press;
2007; 13:2.
8. Karathanasis E, Chan L, Balusu SR, D’Orsi CJ, Annapragada AV, Sechopoulos I et al. Multifunctional
nanocarriers for mammographic quantification of tumor dosing and prognosis of breast cancer therapy.
Biomaterials. 2008 Dec; 29(36):4815–22. doi: 10.1016/j.biomaterials.2008.08.036 PMID: 18814908
9. Karathanasis E, Park J, Agarwal A, Patel V, Zhao F, Annapragada AV et al. MRI mediated, non-invasive
tracking of intratumoral distribution of nanocarriers in rat glioma. Nanotechnology. 2008 Aug 6; 19
(31):315101. doi: 10.1088/0957-4484/19/31/315101 PMID: 21828778
10. Ghaghada KB, Badea CT, Karumbaiah L, Fettig N, Bellamkonda RV, Johnson GA et al. Evaluation of
tumor microenvironment in an animal model using a nanoparticle contrast agent in computed tomogra-
phy imaging. Acad Radiol. 2011 Jan; 18(1):20–30. doi: 10.1016/j.acra.2010.09.003 PMID: 21145026
11. Badea CT, Athreya KK, Espinosa G, Clark D, Ghafoori AP, Li Y et al. Computed Tomography Imaging
of Primary Lung Cancer in Mice Using a Liposomal-Iodinated Contrast Agent. Gelovani JG, editor.
PLoS ONE. 2012 Apr 2; 7(4):e34496. doi: 10.1371/journal.pone.0034496 PMID: 22485175
12. Ghaghada KB, Sato AF, Starosolski ZA, Berg J, Vail DM. Computed Tomography Imaging of Solid
Tumors Using a Liposomal-Iodine Contrast Agent in Companion Dogs with Naturally Occurring Cancer.
PLoS ONE. Public Library of Science; 2016; 11(3):e0152718.
13. Patterson DM, Shohet JM, Kim ES. Preclinical models of pediatric solid tumors (neuroblastoma) and
their use in drug discovery. Curr Protoc Pharmacol. 2011 Mar;Chapter 14:Unit14.17.
14. Hsu DM, Agarwal S, Benham A, Coarfa C, Trahan DN, Chen Z et al. G-CSF Receptor Positive Neuro-
blastoma Subpopulations Are Enriched in Chemotherapy-Resistant or Relapsed Tumors and Are
Highly Tumorigenic. Cancer Res. 2013 ed. 2013 Jul 1; 73(13):4134–46. doi: 10.1158/0008-5472.CAN-
12-4056 PMID: 23687340
15. Zheng J, Jaffray D, Allen C. Quantitative CT imaging of the spatial and temporal distribution of lipo-
somes in a rabbit tumor model. Mol Pharm. 2009 Mar; 6(2):571–80. doi: 10.1021/mp800234r PMID:
19298061
16. Tanifum EA, Starosolski ZA, Fowler SW, Jankowsky JL, Annapragada AV. Cerebral vascular leak in a
mouse model of amyloid neuropathology. J Cereb Blood Flow Metab. International Society for Cerebral
Blood Flow & Metabolism, Inc; 2014 Jul 23.
Heterogeneity of Nanoparticle Uptake in Neuroblastoma
PLOS ONE | DOI:10.1371/journal.pone.0165877 November 18, 2016 12 / 12