Embed Size (px)
Citation preview

INTERNATIONAL JOURNAL OF PRECISION ENGINEERING AND MANUFACTURING Vol. 14, No. 6, pp. 1071-1078 JUNE 2013 / 1071
© KSPE and Springer 2013
Heuristic Optimization Method for Cellular StructureDesign of Light Weight Components
Jason Nguyen1, Sang-in Park1, and David Rosen1,#
1 The George W. Woodruff School of Mechanical Engineering, Georgia Institute of Technology, Atlanta, GA, USA # Corresponding Author / E-mail: [email protected], TEL: +1-404-894-9668, FAX: +1-404-894-9342
KEYWORDS: Heuristic optimization method, CAD, Additive manufacturing, Cellular structure, Meso-scale lattice structure, Design
Additive manufacturing can be used to produce structures which would be impossible to manufacture using traditional
manufacturing processes. One application of this technology is for fabrication of customized, light-weight material called meso-
scale lattice structure (MSLS), which is a type of cellular structure with dimensions in the range of 0.1 to 10 mm. The problem
to be addressed in this paper is how to efficiently synthesize MSLS with thousands of struts and, hence, thousands of design
variables. A heuristic optimization method is presented for efficiently synthesizing large MSLS on complex shaped parts that
reduces the multivariate optimization problem to a problem of only two variables. The heuristic is based on the observation
that the stress distribution in a MSLS will be similar to the stress distribution in a solid body of the same overall shape. Based
on local stress states, unit cells from a predefined unit-cell library are selected and sized to support those stress states. In this
paper, the method is applied to design a strong, stiff, and light-weight Micro Air Vehicle fuselage. Weight savings are
demonstrated as a result.
Manuscript received: September 11, 2012 / Accepted: April 26, 2013
1. Introduction
Additive manufacturing (AM) refers to the use of layer-based
additive processes to manufacture finished parts by stacking layers of
thin 2-D cross-sectional slices of materials. This process enable
fabrication of parts with high geometric complexity, material grading,
and customizability.1
Design for manufacturing (DFM) has typically meant that designers
should tailor their designs to eliminate manufacturing difficulties and
minimize costs. However, AM capabilities now provide an opportunity
to re-think DFM to take advantage of the uniqueness of these
technologies.2 Several companies are now using AM technologies for
production manufacturing. For example, Siemens, Phonak, Widex, and
the other hearing aid manufacturers use selective laser sintering (SLS)
and stereolithography (SLA) machines to produce hearing aid shells,
Align Technology uses SLA to fabricate molds for producing clear
braces (“aligners”), and Boeing and its suppliers use SLS to produce
ducts and similar parts for F-18 fighter jets. In the first three cases, AM
machines enable one-off, custom manufacturing of 10’s to 100’s of
thousands of parts. In the last case, AM technology enables low volume
production. In addition, AM can greatly simplify product assembly by
allowing parts that are typically manufactured as multiple components
to be fabricated as one piece. More generally, the unique capabilities of
AM technologies enable new opportunities for customization,
improvements in product performance, multi-functionality, and lower
overall manufacturing costs. These unique capabilities include: shape
complexity, where very complex shapes, lot sizes of one, customized
geometries, and shape optimization are enabled; material complexity,
where material can be processed one point, or one layer, at a time,
enabling the manufacture of parts with complex material compositions
and designed property gradients; and hierarchical complexity, where
multi-scale structures can be designed and fabricated from the
microstructure through geometric mesostructure (sizes in the millimeter
range) to the part-scale macrostructure.
NOMENCLATURE
MSLS = Meso-Scale Lattice Structures
SMS = Size Matching and Scaling Method
CLS = Conformal Lattice Structures
DOI: 10.1007/s12541-013-0144-5

1072 / JUNE 2013 INTERNATIONAL JOURNAL OF PRECISION ENGINEERING AND MANUFACTURING Vol. 14, No. 6
In this paper, we cover two main topics. First, we present geometric
construction methods that enable designers to take advantage of the
shape complexity capabilities of AM processes. Specifically, we
develop a method for constructing cellular materials that conform to the
shapes of part surfaces; when restricted to lattice structures we call such
constructs Conformal Lattice StructuresTM (CLS). The software that
embodies this process is integrated into a commercial computer-aided
design (CAD) system. Second, we present a design method, the
augmented size matching and scaling (SMS) method, to optimize CLS
efficiently and systematically.
1.2 Cellular Materials
The concept of designed cellular materials is motivated by the
desire to put material only where it is needed for a specific application.
From a mechanical engineering viewpoint, a key advantage offered by
cellular materials is high strength accompanied by a relatively low
mass. These materials can provide good energy absorption
characteristics and good thermal and acoustic insulation properties as
well.3 Cellular materials include foams, honeycombs, lattices, and
similar constructions. When the characteristic lengths of the cells are in
the range of 0.1 to 10 mm, we refer to these materials as mesostructured
materials. Mesostructured materials that are not produced using
stochastic processes (e.g. foaming) are called designed cellular
materials. In this paper, we focus on designed lattice materials called
meso-scale lattice structure (MSLS).
The area of lattice materials has received considerable research
attention due to their inherent advantages over foams in providing light,
stiff, and strong materials. Lattice structures tend to have geometry
variations in three dimensions; some of our designs are shown in
Figure 1. Lattices can be three times stronger than foams due to the
nature of material deformation: the foam is governed by cell wall
bending, while lattice elements stretch and compress.4
In order to effectively design cellular structures, we must be able to
accurately model, determine the mechanical properties, and quantify
the performance of these structures. Many methods have been
developed to analyze various cellular structures, including for metal
foams,3 honeycombs,5 and lattice structures with simplified models4
and more complex 3D frame analysis.6
1.3 Design Methods
The design synthesis method for cellular materials consists of size,
shape, and topology optimization to address different aspects of the
structural design problem. In order to understand optimization of
structures, the definitions of three categories of structural optimization
are important.7 A typical size optimization involves finding the optimal
cross-sectional area of each strut in a truss structure. Shape optimization
computes the optimal form that defined by the boundary curves or
boundary surfaces of the body.8 The process may involve moving nodes
to change the shape of the structure; however, the element-node
connectivity remains intact. Topology optimization, according to Rozvany,
finds optimal connective or spatial sequences of members or elements in
a structure.9 In topological optimization, the physical size, shape, and
connectivity of the structure are not known. The only known properties
are the volume of the structure, the loads, and the boundary conditions.7
It can be seen that topology optimization involves aspects of both size
and shape optimization. Size and shape optimizations consider the
material distribution in the structure to satisfy certain loading
conditions while maintaining the same topology. On the other hand, the
initial and optimal structures are completely different in the case of
topology optimization. In this research, optimization variables of the
truss structures are strut diameters. However, each unit cell of the
MSLS can have a different configuration depending on the selection
criteria. Therefore, “topology optimization’ will be the term used in this
research for designing and optimizing MSLS.
The topology optimization techniques used to design truss structures
are based on one of two approaches: the homogenization (continuum)
approach and the ground (discrete) truss approach. Analytical solutions
are possible under limited conditions and are known as Michell
trusses.10 The homogenization approach is a material distribution
method that considers the design space as an artificial composite
material with a large number of periodically distributed small holes.
The sizes of these small holes are the design variables. In the final
optimal structure, regions with small holes are filled while regions with
large holes are considered empty.11
The ground truss approach starts with a ground structure, which is
a grid of all elements connecting the nodes in the design space. The
optimal truss structure is realized by selecting an optimal substructure
from this pre-defined ground structure. Ultimately, the ground-truss
approach is a sizing optimization problem, where the cross-sections of
ground truss members are the continuous design variables for the
optimization. The cross-sections of the struts are sized to support the
applied loads on the structure. Struts with cross-sections near zero are
then removed to obtain the optimal structure.
Fig. 1 Octet truss unit cell and example parts with octet truss
mesostructure
Fig. 2 Cellular primitives: three lattice structures and one web structure

INTERNATIONAL JOURNAL OF PRECISION ENGINEERING AND MANUFACTURING Vol. 14, No. 6 JUNE 2013 / 1073
2. CLS Design Method
The basic idea of how cellular materials are created is presented
here. Four example primitive cell types are shown in Figure 2, three of
which are lattice structures and the fourth is a foam. These cell types
are 2-dimensional for simplicity of presentation. The octet lattice in 1a
is an example 3-D cell type. Lattice structures consist of a set of struts
(beams) that connect the nodes of the lattice.
To generate the cellular designs in Figure 1, the primitive cell types
must be mapped into a mesh. In 2-D, the mesh consists of a set of
connected quadrilaterals. In 3-D the mesh consists of hexahedra (6-
sided volume elements). The uniqueness of our work is our use of
conformal cellular structures, rather than uniform “lattice block”
materials, that can be used to stiffen or strengthen a complex, curved
surface. To observe the difference, Figure 3(a) is an example uniform
lattice structure, while Figure 3(b) shows a conformal lattice. Meshes
for uniform structures consist of cube elements in 3-D (squares in 2-D),
while for conformal structures, the mesh elements are general
hexahedra. We have developed a new algorithm for generating
conformal meshes that are used to create conformal lattice and cellular
structures, based on an older free meshing algorithm.12
The overall algorithm for generating conformal cellular structures
consists of two main stages: computing 3D conformal mesh, and
populating the mesh with cells. The objective of the meshing algorithm
is to generate a conformal hexahedral mesh into which cells from the
cell library can be placed. One or more layers of cellular structure can
be placed to support the part’s skin. The input to the algorithm may be
a CAD solid model of the part, a surface model of the part, or a
triangulated surface model (STL file) of the part.12
The algorithm to generate a 3-D conformal mesh consists of six
main steps. The first step is to divide the part boundary into relatively
flat regions, since it is easier to control the mesh generation method if
regions are not very curved.
For each region, three operations are performed, corresponding to
Steps 2, 3, and 4. Step 2 computes the offset of the object boundary. We
use an offset method developed for tessellated part surfaces,13 but any
offsetting method could be used. Step 3 is to construct a tri-parameter
volume between the original surface and its offset. This step of the
algorithm imposes a surface parameterization on the region of the part
that will be reinforced.14 The same parameterization is transferred to
the offset surface. Finally, a lofted volume is constructed from the
original surface to the offset surface. The fourth step is to generate the
conformal mesh by dividing the parameterized volume into individual
elements (hexahedra). The final step is to ensure that region boundaries
match by adjusting node positions and by adding elements, if necessary.
The algorithm for the second stage (populate mesh with cells) of the
overall CLS design method is described here. One input to the
algorithm is the conformal hexahedral mesh that was generated in the
first step. The other input is the cell types contained within a library.
The first step is to partition the mesh elements into regions such that
within each region the loading conditions are similar on each element.
These need not be the same regions that were used for mesh
construction. For each region, a cell type from the cell type library is
selected to populate the mesh elements in that region. The idea is to
match the region’s loading conditions to the cell type, such that the cell
type is effective at supporting the loading conditions. In this manner,
the resulting cellular structure is more likely to be lighter for a given
level of stress or deflection. These operations may be performed
concurrently or maybe performed sequentially, depending upon the
designer’s preference and may be automated or be performed by the
designer directly.
To construct a STL of the CLS, additional geometric construction
operations must be performed. We utilize the approach described in,12
where solid models of the half-struts incident at each node of the mesh
are constructed using Boolean operations in a solid modeling system.
Then, each solid “node” is tessellated and the triangles are written to a
STL file.
As a final note, the algorithms presented here have been embodied
into a C++ software system, one version of which has been integrated
into the Siemens NX CAD system.
3. Augmented Size Matching and Scaling (SMS) Method
Regardless of which structural optimization approach is used for the
design of meso-scale lattice structures (MSLS), an actual multi-variable
optimization routine must be performed. Since the computational
complexity of the design problem often scales exponentially with the
number of design variables, topology optimization is infeasible or
impractical for large design problems. The Size Matching and Scaling
(SMS) method uses a heuristic to reduce the multivariable optimization
problem to a problem of only two variables.15 The heuristic is based on
the observation that the stress distribution in a MSLS will be similar to
the stress distribution in a solid body of the same overall shape. Based
on the computed local stress states from the solid body analysis, unit
cells from a predefined unit-cell library are selected and sized to
support those stress states. The optimal diameters of these struts are
then computed by performing a two-variable optimization. This design
approach removes the need for a rigorous multi-variable topology
optimization, which is a main bottleneck in designing MSLS. A new
augmented SMS method presented here integrates the CLS
construction methods outlined in Section 2 to the ground structure
generation process of the SMS method.
3.1 Problem Formulation
SMS design problems will be formulated using the Compromise
Decision Support Problem (cDSP),16 which is a multi-objective
Fig. 3 Uniform and conformal lattice structures
1074 / JUNE 2013 INTERNATIONAL JOURNAL OF PRECISION ENGINEERING AND MANUFACTURING Vol. 14, No. 6
formulation based on goal programming, as presented in Table 1.
The symbols pBG, pF, pM represent the boundary, loading and material
properties, respectively. The strut diameter, Di, can either range from
the lower diameter bound, DLB, to the upper diameter bound, DUB, or
zero. The symbol σi represents the axial stress value in each i strut. The
symbols V and d represent the volume and the deformation of the
structure. Wd and WV represent weighting variables for d and V in the
minimization function, Z. The volume of the structure is calculated by
summing the volume of all the struts in the structure, which are
assumed to be cylinders:
(1)
where li represents the length of the i strut. The symbols i, j, and k
represent each unit-cell region in the structure, each unit-cell
configuration in the unit-cell library, and the strut number in each of the
j configurations in the library, respectively; n represents the nodes from
the solid-body finite element analysis.
The SMS method requires additional information besides the
starting topology, and the boundary condition. External sources of
information include the unit-cell library and the solid-body finite
element analysis. Using that information, the determination of the strut
diameters, shown in (a) of Table 1, reduces to a 2-variable optimization
problem. It can be seen that Di,k can be determined using the pre-scaled
maximum and minimum diameter value, DMAX and DMIN, a stress
scaling factor from the unit-cell library, , and a unit-cell scaling
factor from the solid-body stress analysis, . Hence, only DMAX and
DMIN need to be determined through optimization. The objective
function, (g) of Table 1, is formulated in the least-squares format to
minimize the deflection of the structure, d, and deviation of the
structural volume from a target volume, Vt. Wd and WV represent the
weighting variables for d and V.
The optimization process of DMAX and DMIN requires calculation of
deflection, volume, and associate stresses using finite element analysis
of the truss structure. The finite-element package, which assumes each
truss member as a beam element, was developed in MATLAB.14 Once
the optimization is done, the diameter of each strut is obtained using
Equation (a). The optimized maximum and minimum diameters of the
structure are denoted as Dmax and Dmin to differentiate from the pre-
scaled maximum and minimum diameter value, DMAX and DMIN. It is
important to note that the finite element analysis of the truss structure
is conducted using the scaled/true diameters of the structure. Other
problem formulations with different objective functions can also be
used with the SMS method.
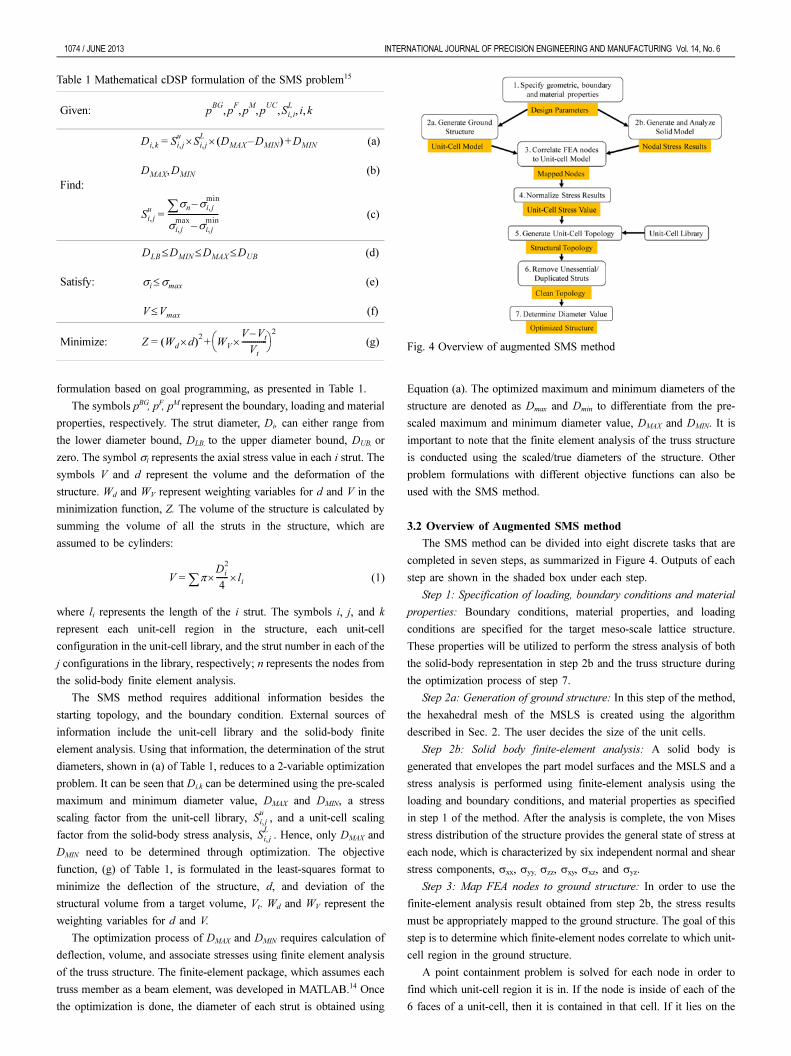
3.2 Overview of Augmented SMS method
The SMS method can be divided into eight discrete tasks that are
completed in seven steps, as summarized in Figure 4. Outputs of each
step are shown in the shaded box under each step.
Step 1: Specification of loading, boundary conditions and material
properties: Boundary conditions, material properties, and loading
conditions are specified for the target meso-scale lattice structure.
These properties will be utilized to perform the stress analysis of both
the solid-body representation in step 2b and the truss structure during
the optimization process of step 7.
Step 2a: Generation of ground structure: In this step of the method,
the hexahedral mesh of the MSLS is created using the algorithm
described in Sec. 2. The user decides the size of the unit cells.
Step 2b: Solid body finite-element analysis: A solid body is
generated that envelopes the part model surfaces and the MSLS and a
stress analysis is performed using finite-element analysis using the
loading and boundary conditions, and material properties as specified
in step 1 of the method. After the analysis is complete, the von Mises
stress distribution of the structure provides the general state of stress at
each node, which is characterized by six independent normal and shear
stress components, σxx, σyy, σzz, σxy, σxz, and σyz.
Step 3: Map FEA nodes to ground structure: In order to use the
finite-element analysis result obtained from step 2b, the stress results
must be appropriately mapped to the ground structure. The goal of this
step is to determine which finite-element nodes correlate to which unit-
cell region in the ground structure.
A point containment problem is solved for each node in order to
find which unit-cell region it is in. If the node is inside of each of the
6 faces of a unit-cell, then it is contained in that cell. If it lies on the
V π∑Di
2
4------× li×=
Si j,
u
Si j,
L
Table 1 Mathematical cDSP formulation of the SMS problem15
Given:
Find:
(a)
(b)
(c)
Satisfy:
(d)
(e)
(f)
Minimize: (g)
pBG
pF
pM
pUC
Si i,
Li k, , , , , ,
Di k, Si j,
uSi j,
L× DMAX DMIN–( ) DMIN+×=
DMAX DMIN,
Si j,
uσn∑ σi j,
min–
σi j,
maxσi j,
min–
--------------------------=
DLB DMIN DMAX DUB≤ ≤ ≤
σi σmax≤
V Vmax≤
Z Wd d×( )2 WV
V Vt–
Vt
-------------×⎝ ⎠⎛ ⎞
2
+= Fig. 4 Overview of augmented SMS method

INTERNATIONAL JOURNAL OF PRECISION ENGINEERING AND MANUFACTURING Vol. 14, No. 6 JUNE 2013 / 1075
boundary of two cells, then it is included in both. After the node
mapping process is done, each unit cell will contain a list of finite
element nodes that will be included in the calculation of the stress
distribution in that unit cell.
Step 4: Stress Scaling and Normalization: After step 3 is complete,
the stress values from the finite-element nodes in each unit cell are
averaged to determine average stress values of the six independent
normal and shear stress components. The stress distribution is of
interest and will be used to guide the setting of strut sizes. Therefore,
the stresses are normalized from zero to one such that the largest value
of stress is equal to one. These six scaling values correlate to six entries
of each configuration in the unit cell.
In topology generation, the diameter values of the selected unit-cell
configuration from the preconfigured unit-cell library are scaled against
the associated stress values (σxx, σyy, σzz, τxy, τxz, and τyz) and then
mapped to the unit cells in the ground structure. However, since the
solid-body results are provided relative to the global coordinate system,
stress transformations are needed to ensure correct topology generation,
which is performed by rigid-body rotation of the axes. Since the unit
cell is not necessarily a cuboid hexahedron, a representative local
coordinate system must be determined. Each unit cell, such as in Figure
5, is characterized by 8 nodes and 12 edges. Three edges of the unit
cell, edge 1-2, edge 1-4, and edge 1-5, respectively, are selected as
reference edges, nominally representing the x, y, and z axes,
respectively. An orthogonal local coordinate system, indicated by X’-
Y’-Z’, is constructed centered at node 1 using the reference edges as
guides. Details are in.17
After obtaining the local coordinate system for the unit cell, the
relative orientation between the local (X’Y’Z’) and global coordinate
(XYZ) system can be determined. Using a standard approach with
rotation matrices and direction cosines, the transformation from the
XYZ to the X’Y’Z’, system is given as
(2)
where cos(α1), cos(β1), cos(θ1) are the direction cosines of X’ on the
global XYZ axes, respectively, and the rotation matrix is denoted R.
The stress state at a point is characterized by six independent normal
and shear stress components, which can be organized into a matrix:
(3)
The grouping of these stress components becomes the components
of a second-order stress tensor, which is defined in the deformed state
of the material and is known as the Cauchy stress tensor.18 The Cauchy
stress tensor in the local coordinate system can be obtained using Eqn. 4.
(4)
RT is the transpose of R, and s and σ' are the Cauchy stress tensors
in global and local coordinate systems, respectively.18 Ultimately, there
will be six stress values for each unit cell, σxx, σyy σzz, τxy, τxz, τyz,
which correspond to the scaling factors, , in (a) of Table 1.
Step 5: Topology generation: The unit-cell lattice structure selection
and mapping process will be described in detail in Section 3.3. After
this step is complete, the structure will have a topology designed for the
anticipated stress distribution in the truss structure. The relative
thickness of one strut to another is known based on step 4. However,
these normalized diameters must be correlated with actual strut
diameter values in step 7 of the method.
Step 6: Ambiguity resolution: Since the unit cells are populated
individually, there will be instances of overlapping struts between
adjacent unit cells. To resolve this ambiguity, the largest diameter strut
is kept and all other smaller struts are removed. Duplicated nodes are
also removed.
Step 7: Diameter Sizing: The normalized strut diameters must be
replaced with the actual diameter values to satisfy the loading and
volume condition. It can be seen from the problem formulation, Table 1,
the only parameters missing to determine the diameter of each strut are
DMIN and DMAX, the pre-scaled thinnest and thickest diameters,
respectively. After DMIN and DMAX are calculated, the diameters of each
strut can be determined using Eqn. 5.
(5)
In the 2-variable approach, values DMIN and DMAX are determined by
performing 2-variable minimization of the objective function (g) in
Table 1. It is rewritten in Eqn. 6 as a function of both DMIN and DMAX,
where V (DMIN, DMAX), volume, and d (DMIN, DMAX), deformation, are
functions of only DMIN and DMAX. Deformation, d, represents any unit
of measure that is directly proportional to structural stiffness, such as
tip deflection or strain energy. The target structure must attempt to
minimize both volume and deflection, which are competing objectives.
The target deflection is usually set to zero. Two algorithms used to
perform this two-variable minimization are the Levenburg-Marquardt
and active-set algorithms. The Levenburg-Marquardt algorithm has
documented success in design and optimization of MSLS,19 while the
active-set algorithm is documented to have success in optimization of
multivariable, nonlinear and constrained optimization problems.20
(6)
x'
y'
z'⎩ ⎭⎪ ⎪⎨ ⎬⎪ ⎪⎧ ⎫ cos α
1( )
cos α2
( )
cos α3
( )
cos β1
( )
cos β2
( )
cos β3
( )
cos θ1
( )
cos θ2
( )
cos θ3
( )
x
y
z⎩ ⎭⎪ ⎪⎨ ⎬⎪ ⎪⎧ ⎫
=
σxx τxy τxz
τyx σyy τyz
τzx τzy σzz
σ'[ ] R σ[ ]RT=
Si j,
u
Di k, Si j,
uSi j,
L× DMAX DMIN–( ) DMIN+×=
Z DMIN
DMAX
,( ) Wd
d DMIN
DMAX
,( )×( )2 WV
V DMIN
DMAX
,( ) Vt
–
Vt
-------------------------------------------------×⎝ ⎠⎛ ⎞
2
+=
Fig. 5 Unit-cell region

1076 / JUNE 2013 INTERNATIONAL JOURNAL OF PRECISION ENGINEERING AND MANUFACTURING Vol. 14, No. 6
3.3 Unit-cell Library
The second component of the augmented SMS method is the unit-
cell library, which was developed to generate the topology for the
MSLS.15 There are seven different unit-cell configurations in the
library. Each configuration has six entries with each specialized for six
independent normal and shear stress components. Entries in the library
were optimized for loading conditions corresponding to each of the six
stress states. The unit-cell library entries are shown in Figure 6. See
Ref.17 for more details.
Unit-cell selection: One way to generate the best topology for the
structure is to iteratively populate each unit cell in the ground structure
with a configuration from the library and analyze the performance of
the structure. However, it is computationally infeasible because there
are MN possible combinations of topologies where M is the number of
configurations in the unit-cell library and N is the number of unit cells
in the ground structure. Therefore, a heuristic was developed for the
selection process.
Since all the configurations of the unit-cell library are optimized
such that they have identical performance, the structure with the
smallest normalized volume is selected. The selection is performed
using the Equation (7),15 which incorporates three terms. The first is the
sum of all lattice structure unit-cell volumes from the 6 stress states.
The second term is the volume of the structure if it were mapped into
the particular mesh element, while the third term represents a
performance term based from empirical results. This term attempts to
predict how well a configuration will perform when multiple instances
of the configuration are utilized.
This selection process is performed for each unit cell from the
ground structure and the configuration with the lowest rating, r, is
selected and mapped into that unit cell.
(7)
where
(8)
(9)
and Wv, Wvn, and Wp are weights (importances) on each term.
Unit-Cell Mapping: Once the best possible configuration is
determined for a unit cell in the ground structure, it is mapped to that
region. If there is a node from the unit-cell configuration that does not
exist in the unit cell of the ground structure, it will be added using 3-
D linear interpolation. After all the missing nodes are added, the unit-
cell configuration can then be populated into the unit cell. The
normalized stress values from step 4 of the augmented SMS method
are scaled against the normalized diameter values from the unit cell
library to determine the relative thickness of one strut to another.
4. Design Example
In order to demonstrate the augmented SMS method, it will be
applied to micro aerial vehicle (MAV) fuselage example. Other
examples have been explored that serve to validate the augmented SMS
method and demonstrate its ability to design large-scale MSLS on
complex-shaped parts with curve or non-rectangular surfaces.17
MAVs play a critical role in modern military operations as they
allow easy surveillance in hazardous environment. The next generation
of these aerial robotic systems needs to have enhanced take-off and
landing capabilities, better endurance, and be adaptable to mission
needs in varying conditions.21 In terms of the design of the wings and
fuselage of these MAVs, some types of structures and/or materials that
are lighter, stronger and customizable are highly desired.
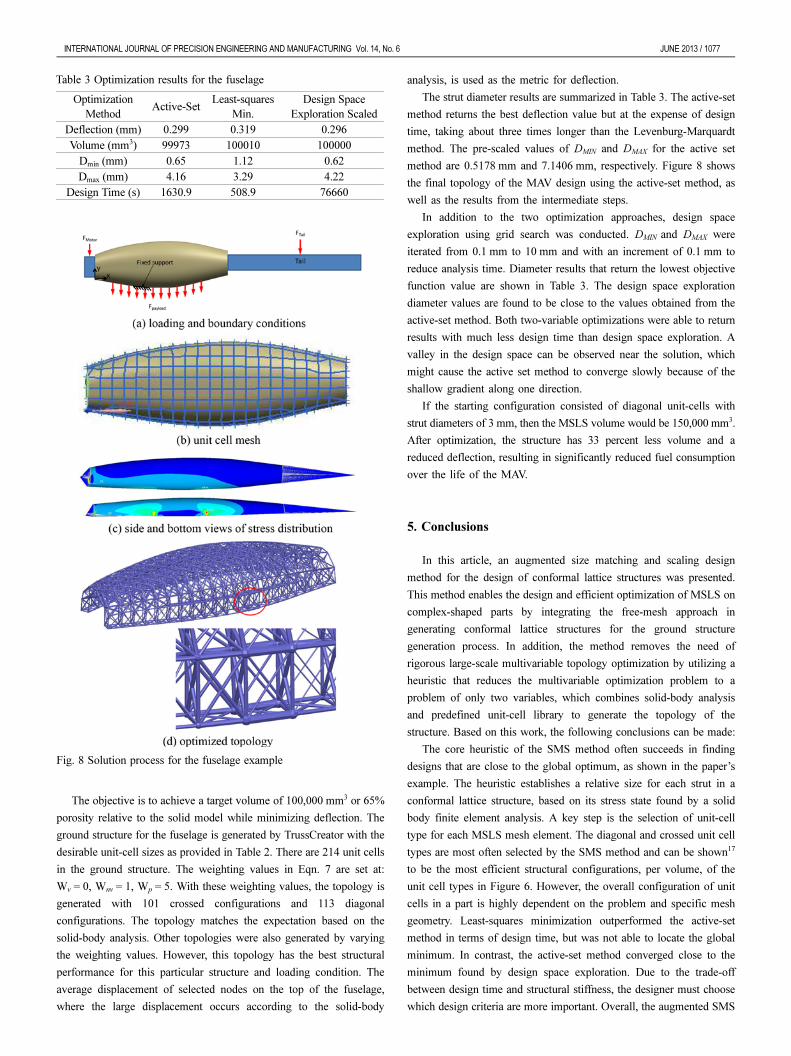
In this design example, the fuselage is designed to withstand the
impact when landing or crashing. There is a distributed load from the
payload applied to the inner surface of the fuselage. The weight of the
motor and the tail are modeled as point loads at their centers of mass.
This is done in ANSYS using a rigid link element. The equivalent
couple is applied to the truss structure. All these weights are scaled by
a factor of ten to simulate impact when crashing. The weight of the
wing is small and assumed to have negligible contribution. A small
area on the bottom of the fuselage is fixed to model the contact zone
as the MAV is crashing. Multiple views of the fuselage are shown in
Figure 7 with key dimensions labeled. The initial properties of the
design problem are provided in Table 2.
r Wv V∑ σWvn Vnet Wp P∑+ + + + +=
Vσ∑ Vxx Vyy Vzz Vxy Vxz Vyz+ + + + +=
P∑ Pxx Pyy Pzz Pxy Pxz Pyz+ + + + +=
Fig. 6 Unit-cell library15
Fig. 7 Multiple views of the fuselage
Table 2 Initial properties for the fuselage
A1 (mm) 47 L (mm) 254
A2 (mm) 90 Fmotor (N) 5.9
A3 (mm) 45 FTail (N) 2.7
D (mm) 45 Fpayload (N/mm2) 0.1
Unit-cell in-plane (mm) 12 Modulus (N/mm2) 1960
Unit-cell in-plane (mm) 12 Poisson Ratio 0.3
Unit-cell out-plane (mm) 08 Target Volume (mm3) 100,000
INTERNATIONAL JOURNAL OF PRECISION ENGINEERING AND MANUFACTURING Vol. 14, No. 6 JUNE 2013 / 1077
The objective is to achieve a target volume of 100,000 mm3 or 65%
porosity relative to the solid model while minimizing deflection. The
ground structure for the fuselage is generated by TrussCreator with the
desirable unit-cell sizes as provided in Table 2. There are 214 unit cells
in the ground structure. The weighting values in Eqn. 7 are set at:
Wv = 0, Wnv = 1, Wp = 5. With these weighting values, the topology is
generated with 101 crossed configurations and 113 diagonal
configurations. The topology matches the expectation based on the
solid-body analysis. Other topologies were also generated by varying
the weighting values. However, this topology has the best structural
performance for this particular structure and loading condition. The
average displacement of selected nodes on the top of the fuselage,
where the large displacement occurs according to the solid-body
analysis, is used as the metric for deflection.
The strut diameter results are summarized in Table 3. The active-set
method returns the best deflection value but at the expense of design
time, taking about three times longer than the Levenburg-Marquardt
method. The pre-scaled values of DMIN and DMAX for the active set
method are 0.5178 mm and 7.1406 mm, respectively. Figure 8 shows
the final topology of the MAV design using the active-set method, as
well as the results from the intermediate steps.
In addition to the two optimization approaches, design space
exploration using grid search was conducted. DMIN and DMAX were
iterated from 0.1 mm to 10 mm and with an increment of 0.1 mm to
reduce analysis time. Diameter results that return the lowest objective
function value are shown in Table 3. The design space exploration
diameter values are found to be close to the values obtained from the
active-set method. Both two-variable optimizations were able to return
results with much less design time than design space exploration. A
valley in the design space can be observed near the solution, which
might cause the active set method to converge slowly because of the
shallow gradient along one direction.
If the starting configuration consisted of diagonal unit-cells with
strut diameters of 3 mm, then the MSLS volume would be 150,000 mm3.
After optimization, the structure has 33 percent less volume and a
reduced deflection, resulting in significantly reduced fuel consumption
over the life of the MAV.
5. Conclusions
In this article, an augmented size matching and scaling design
method for the design of conformal lattice structures was presented.
This method enables the design and efficient optimization of MSLS on
complex-shaped parts by integrating the free-mesh approach in
generating conformal lattice structures for the ground structure
generation process. In addition, the method removes the need of
rigorous large-scale multivariable topology optimization by utilizing a
heuristic that reduces the multivariable optimization problem to a
problem of only two variables, which combines solid-body analysis
and predefined unit-cell library to generate the topology of the
structure. Based on this work, the following conclusions can be made:
The core heuristic of the SMS method often succeeds in finding
designs that are close to the global optimum, as shown in the paper’s
example. The heuristic establishes a relative size for each strut in a
conformal lattice structure, based on its stress state found by a solid
body finite element analysis. A key step is the selection of unit-cell
type for each MSLS mesh element. The diagonal and crossed unit cell
types are most often selected by the SMS method and can be shown17
to be the most efficient structural configurations, per volume, of the
unit cell types in Figure 6. However, the overall configuration of unit
cells in a part is highly dependent on the problem and specific mesh
geometry. Least-squares minimization outperformed the active-set
method in terms of design time, but was not able to locate the global
minimum. In contrast, the active-set method converged close to the
minimum found by design space exploration. Due to the trade-off
between design time and structural stiffness, the designer must choose
which design criteria are more important. Overall, the augmented SMS
Table 3 Optimization results for the fuselage
Optimization
MethodActive-Set
Least-squares
Min.
Design Space
Exploration Scaled
Deflection (mm) 0.299 0.319 0.296
Volume (mm3) 99973 100010 100000
Dmin (mm) 0.65 1.12 0.62
Dmax (mm) 4.16 3.29 4.22
Design Time (s) 1630.9 508.9 76660
Fig. 8 Solution process for the fuselage example

1078 / JUNE 2013 INTERNATIONAL JOURNAL OF PRECISION ENGINEERING AND MANUFACTURING Vol. 14, No. 6
method can be applied effectively in the design of MSLS with highly
optimized stiffness and volume for complex surfaces. This approach
removes the need for rigorous topology optimization, which is a main
bottleneck in designing MSLS.
ACKNOWLEDGEMENT
The authors gratefully acknowledge support from the US Air Force
Research Laboratory, Paramount Industries, Inc. (now part of 3D
Systems), and the US National Science Foundation, grant CMMI-
1200788. Any opinions, findings, and conclusions or recommendations
expressed in this publication are those of the authors and do not
necessarily reflect the views of the National Science Foundation.
REFERENCES
1. Rosen, D. W., “Computer-aided design for additive manufacturing
of cellular structures,” Computer-Aided Design & Applications,
App., Vol. 4, No. 5, pp. 585-594, 2007.
2. Gibson, I., Rosen, D. W., and Stucker, B., “Additive Manufacturing
Technologies: Rapid Prototyping to Direct Digital Manufacturing,”
Springer, 2010.
3. Gibson, L. J. and Ashby, M. F., “Cellular Solids: Structure and
Properties,” Cambridge University Press, 1997.
4. Deshpande, V. S., Fleck, N. A., and Ashby, M. F., “Effective
properties of the octet-truss lattice material.” J. Mech. Phys. Solids,
Vol. 49, No. 8, pp. 1747-1769, 2001.
5. Wang, A. J. and McDowell, D. L., “Yield surfaces of various
periodic metal honeycombs at intermediate relative density,” Int. J.
Plasticity, Vol. 21, No. 2, pp. 285-320, 2005.
6. Johnston, S. R., Reed, M., Wang, H., and Rosen, D. W., “Analysis
of Mesostructure Unit Cells Comprised of Octet-truss Structures,”
Proc. of the The Seventeenth Solid Freeform Fabrication Symposium,
2006.
7. Bendsøe, M. P. and Sigmund, O., “Topology Optimization: Theory,
Methods and Applications,” Springer, 2003.
8. Allaire, G., “Shape Optimization by the Homogenization Method,”
Springer, 2002.
9. Rozvany, G. I. N., “Topology Optimization in Structural Mechanics,”
Springer, 2003.
10. Michell, A. G. M., “Limits of economy material in frame structures,”
Philosophy Magazine, Vol. 8, pp. 589-597, 1904.
11. Bendsøe, M. P. and Kikuchi, N., “Generating optimal topologies in
structural design using a homogenization method,” Comput.
Methods Appl. Mech. Engrg, Vol. 71, No. 2, pp. 197-224, 1988.
12. Wang, H., Chen, Y., and Rosen, D. W., “A hybrid geometric
modeling method for large scale conformal cellular structures,”
ASME Computers and Information in Engineering Conference,
DETC 2005-85366, 2005.
13. Chen, Y., “An accurate sampling-based method for approximating
geometry,” Computer-Aided Design, Vol. 39, No. 11, pp. 975-986, 2007.
14. Wang, H., “A unit-cell approach for lightweight structure and
compliant mechanism,” Georgia Institute of Technology, 2005.
15. Chang, P. S. and Rosen, D. W., “The Size Matching and Scaling
Method: A Synthesis Method for the Design of Mesoscale Cellular
Structures,” Int. J. Comp. Int. Manuf., DOI: 10.1080/0951192X.
2011.650880.
16. Seepersad, C. C., Allen, J. K., McDowell, D. L., and Mistree, F.,
“Robust design of cellular materials with topological and dimension
imperfections,” J. Mech. Des., Vol. 128, No. 6, pp. 1285-1297.
17. Nguyen, J., Park, S. I., and Rosen, D. W., “Heuristic Optimization
Method for Cellular Structure Design of Light Weight Components,”
Proc. of ISGMA, 2012.
18. Malvern, L. E., “Introduction to the Mechanics of a Continuous
Medium,” Prentice-Hall, 1969.
19. Chu, C., Engelbrecht, S., Graf, G. C., and Rosen, D. W, “A
comparison of synthesis methods for cellular structures with
application to additive manufacturing,” Rapid Proto. J., Vol. 16, No. 4,
pp. 275-283, 2010.
20. Portugal, L. F., Judice, J. J., and Vicente, L. N., “A comparison of
block pivoting and interior point algorithms for linear least squares
problems with nonnegative variables,” Math. Comp., Vol. 63, pp.
625-643, 1994.
21. DARPA Public Affairs, “Can You Design, Build, and Fly the Next
Generation UAV?” http://science.dodlive.mil (Accessed 4 May 2012)


![Informed [Heuristic] Search - University of Delawaredecker/courses/681s07/pdfs/04-Heuristic...Informed [Heuristic] Search Heuristic: “A rule of thumb, simplification, or educated](https://img.pdfslide.net/doc/110x75/5aa1e13c7f8b9a84398c48b6/informed-heuristic-search-university-of-delaware-deckercourses681s07pdfs04-heuristicinformed.jpg)


![Dynamic Control in Path-Planning with Real-Time Heuristic Search … · 2007. 10. 22. · ¥ eMTS : version of MTS [Ishida, Korf 1991] ex-tended with lookahead of 10, heuristic weight](https://img.pdfslide.net/doc/110x75/6132c29fdfd10f4dd73aa820/dynamic-control-in-path-planning-with-real-time-heuristic-search-2007-10-22.jpg)