Embed Size (px)
Citation preview
TM
NIOSH HEALTH HAZARD EVALUATION REPORT HETA # 97-0137-3026 New York City Police Department Police Communications Section New York, New York January 2007
DEPARTMENT OF HEALTH AND HUMAN SERVICES Centers for Disease Control and Prevention
National Institute for Occupational Safety and Health
PREFACE The Hazard Evaluation and Technical Assistance Branch (HETAB) of the National Institute for Occupational Safety and Health (NIOSH) conducts field investigations of possible health hazards in the workplace. These investigations are conducted under the authority of Section 20(a)(6) of the Occupational Safety and Health (OSHA) Act of 1970, 29 U.S.C. 669(a)(6) which authorizes the Secretary of Health and Human Services, following a written request from any employers or authorized representative of employees, to determine whether any substance normally found in the place of employment has potentially toxic effects in such concentrations as used or found. HETAB also provides, upon request, technical and consultative assistance to federal, state, and local agencies; labor; industry; and other groups or individuals to control occupational health hazards and to prevent related trauma and disease. Mention of company names or products does not constitute endorsement by NIOSH.
ACKNOWLEDGMENTS AND AVAILABILITY OF REPORT This report was prepared by Richard Driscoll, Randy Tubbs, and Daniel Habes of HETAB, Division of Surveillance, Hazard Evaluations and Field Studies (DSHEFS). Field assistance was provided by Jenise Brassell, Susan Burt, Pam Shumacher, Patricia McGraw, Carol Goetz, Patricia Lovell, Barbara Jenkins, Larry Mazzuckelli, Kathy Mitchell, Elaine Moore, Vera Drake, Betty Walpole, and Tamara Wise. Analytical support was provided by Charles Mueller. Desktop publishing was performed by Robin Smith. Editorial assistance was provided by Ellen Galloway. Copies of this report have been sent to employee and management representatives at the New York Police Department and the OSHA Regional Office. This report is not copyrighted and may be freely reproduced. The report may be viewed and printed from the following internet address: http://www.cdc.gov/niosh/hhe. Copies may be purchased from the National Technical Information Service (NTIS) at 5825 Port Royal Road, Springfield, Virginia 22161.
ii
For the purpose of informing affected employees, copies of this report shall be posted by the employer in a prominent place accessible to the employees for a period of 30 calendar days.
H ighlights of Health Hazard Evaluation
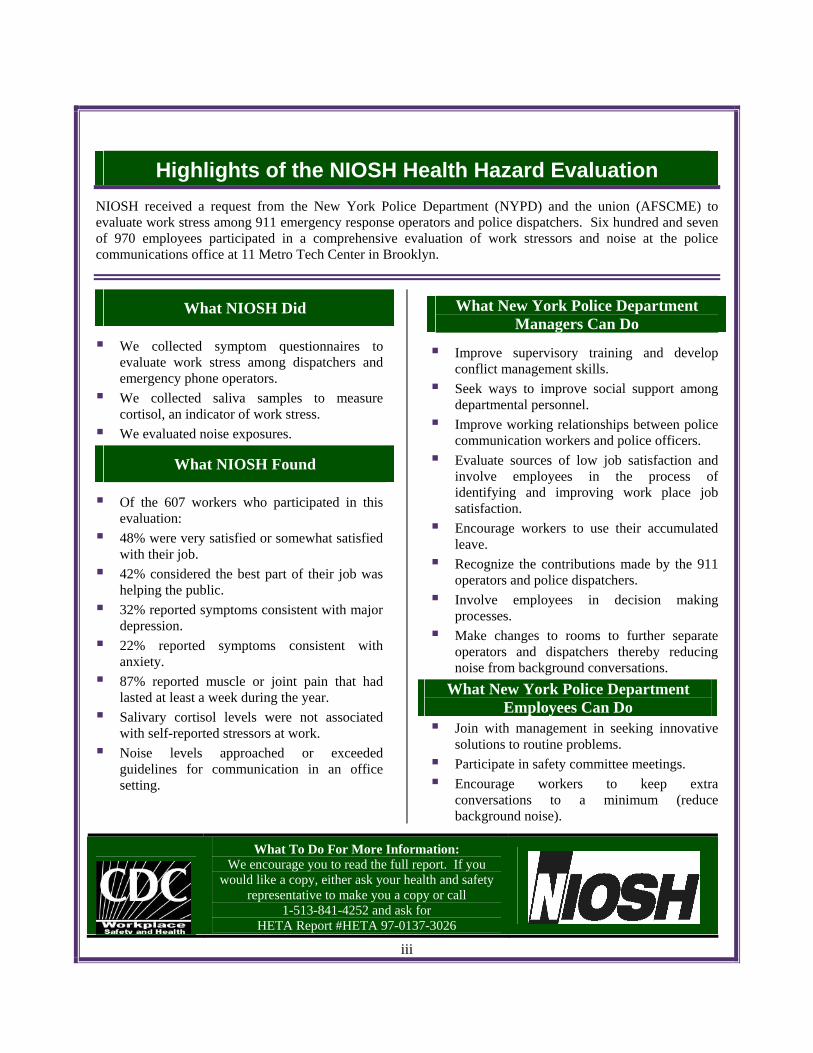
Highlights of the NIOSH Health Hazard Evaluation NIOSH received a request from the New York Police Department (NYPD) and the union (AFSCME) to evaluate work stress among 911 emergency response operators and police dispatchers. Six hundred and seven of 970 employees participated in a comprehensive evaluation of work stressors and noise at the police communications office at 11 Metro Tech Center in Brooklyn.
What NIOSH Did
We collected symptom questionnaires to evaluate work stress among dispatchers and emergency phone operators.
We collected saliva samples to measure ess. cortisol, an indicator of work str
We evaluated noise exposures.
What NIOSH Found
workers who participated in this
satisfied or somewhat satisfied
levels approached or exceeded guidelines for communication in an office setting.
nd improving work place job
age workers to use their accumulated
eparate ing
Of the 607 evaluation: 48% were verywith their job. 42% considered the best p art of their job was helping the public.
32% reported symptoms consistent with major depression.
22% reported symptoms consistent with anxiety.
87% reported muscle or joint pain that had lasted at least a week during the year.
Salivary cortisol levels were not associated with self-reported stressors at work. Noise
Improve supervisory training and develop conflict management skills.
Seek ways to improve social support among departmental personnel.
Improve working relationships between police communication workers and police officers. Evaluate sources of low job satisfaction and involve employees in the process of identifying asatisfaction. Encourleave.
Recognize the contributions made by the 911 operators and police dispatchers.
Involve employees in decision making processes. Make changes to rooms to further soperators and dispatchers thereby reducnoise from background conversations.
What New York Police Department Employees Can Do
Join with management in seeking innovative
rs to keep extra
conversations to a minimum (reduce background noise).
solutions to routine problems. Participate in safety committee meetings. Encourage worke
What New York Police Department Managers Can Do
What To Do For More Information: We encourage you to read the full report. If you
would like a copy, either ask your health and safety representative to make you a copy or call
1-513-841-4252 and ask for HETA Report #HETA 97-0137-3026
iii
Health Hazard Evaluation Report 97-0137-3026 New York City Police Department
Police Communications Section New York, New York
January 2007
Richard J. Driscoll, Ph.D., M.P.H. Randy L. Tubbs, Ph.D.
Daniel J. Habes, M.S.E., C.P.E.
SUMMARY On March 14, 1997, the Senior Safety Coordinator, District 37, American Federation of State, County, & Municipal Employees (AFSCME), contacted the National Institute for Occupational Safety and Health (NIOSH) to request a health hazard evaluation (HHE) at the NYPD’s 911 emergency call center in Brooklyn, New York, and at 1 Police Plaza, New York City. On March 27, 1997, the Safety Director, New York City Police Department, submitted an HHE request on behalf of NYPD management, also requesting an HHE at this location. Both management and union representatives were concerned that work within the 911 Call Center was highly stressful, that workers experienced high demands, potentially hostile interactions with the public, difficulty overcoming distressing call-related memories, increased tension and irritability, and chronic musculoskeletal discomfort because of improperly designed work stations. In response to this labor and management request, NIOSH personnel conducted a series of interviews with managers and employees at the 911 emergency call center at the 11 Metro Tech Building in Brooklyn, New York. Following these meetings, NIOSH personnel developed a study protocol to evaluate each of the concerns expressed in the HHE request and subsequently returned to the 911 emergency call center to carry out the evaluation. Participants completed a 200-item self-administered questionnaire designed to examine a range of work place stressors and health related outcomes (depression, anxiety, lost work days, musculoskeletal injury). Participants submitted saliva samples four times daily for 5 days to assess physiologic reactions to stress. In addition, a comprehensive area noise assessment consisting of octave band noise measurements was made at the active dispatch consoles and 911 operator telephone consoles. Of the estimated 970 on-duty 911 operators and police dispatchers, 607 participated in this study for a participation rate of 63%. Participants were predominately female (88%), had an average age of 38 years (range 21-73 years), and had worked for the city for an average of 10 years (range 1-34 years). One hundred ninety three workers (32%) reported experiencing symptoms that were consistent with major depression according to the Centers for Epidemiologic Studies Depression Scale (CES-D). Predictors of depressive symptoms in this work force included low supervisory social support, anxiety,
iv
low job satisfaction, greater than 6 months since last vacation, increasing age, lower levels of social contact, and increasing years working for the City. Symptoms consistent with anxiety were reported by 138 participants (22%), 68% of whom also had symptoms consistent with major depression. Predictors of anxiety were age, low job satisfaction, more than 6 months since last vacation, and increasing years worked for the City. The annual work absentee rate for participants in this study was approximately two times the rate reported by workers nationwide (New York workers 13.7 vs. 6.2 days nationally). Musculoskeletal symptoms were most commonly reported for the low back (53%), wrists (43%), upper back (40%), and shoulders (40%-43%). According to ANSI S12.2 Criteria for Evaluating Room Noise, ambient noise levels measured in the work area were found to be appropriate for moderately fair listening or just acceptable speech and telephone communication conditions.
NIOSH investigators conclude that conditions at the New York City Police 911 Emergency Response Communications Center contributed to the increased reporting of depressive symptoms and that a health hazard does exist at this location. Recommendations have been made in this report to help improve conditions at this worksite.
v
Keywords: NAICS 922120 (Police Departments), work stress, work organization, psychosocial, noise, ergonomic, depression
Table of Contents Preface..........................................................................................................................................................ii Acknowledgments and Availability of Report..........................................................................................ii Highlights of Health Hazard Evaluation .................................................................................................iii Summary..................................................................................................................................................... iv Introduction................................................................................................................................................. 1 Background ................................................................................................................................................. 1 Methods........................................................................................................................................................ 2
Study Design ............................................................................................................................................ 2 Questionnaire .......................................................................................................................................... 2 Questionnaire Components: Psychosocial Scales................................................................................. 2 Salivary Cortisol: A Marker for Stress................................................................................................. 3 Noise ......................................................................................................................................................... 3 Statistical Analysis .................................................................................................................................. 3 Missing Variables.................................................................................................................................... 4
Evaluation Criteria ..................................................................................................................................... 4 Psychosocial Factors ............................................................................................................................... 4 Noise ......................................................................................................................................................... 4
Results .......................................................................................................................................................... 5 Organizational Climate ...................................................................................................................... 5 Call Monitoring................................................................................................................................... 5 Job Performance Factors ................................................................................................................... 5 Self-Reported Sick Leave ................................................................................................................... 6 Job Satisfaction ................................................................................................................................... 6 Depression............................................................................................................................................ 6 Anxiety ................................................................................................................................................. 7 Musculoskeletal ................................................................................................................................... 7 Salivary Cortisol.................................................................................................................................. 7 Noise ..................................................................................................................................................... 7
Discussion .................................................................................................................................................... 8 Depression................................................................................................................................................ 8 Stressors associated with reports of depressive symptoms in this work force .................................. 8 Anxiety ..................................................................................................................................................... 8
Stressors Common to Anxiety and Depression .................................................................................... 9
Call Monitoring....................................................................................................................................... 9 Conclusions................................................................................................................................................ 10 Recommendations ..................................................................................................................................... 11
Work Organization............................................................................................................................... 11 Noise ....................................................................................................................................................... 11
References.................................................................................................................................................. 12 Tables ......................................................................................................................................................... 14
Figures........................................................................................................................................................ 22
Health Hazard Evaluation Report No. 97-0137-3026 Page 1
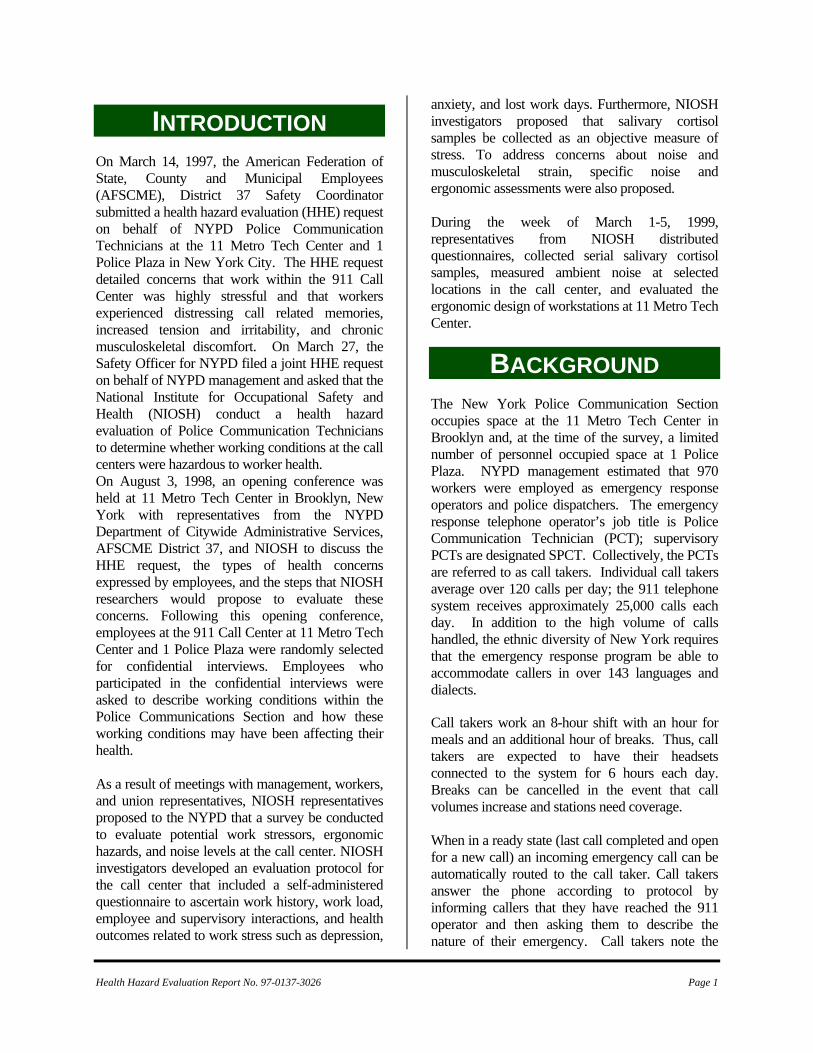
INTRODUCTION On March 14, 1997, the American Federation of State, County and Municipal Employees (AFSCME), District 37 Safety Coordinator submitted a health hazard evaluation (HHE) request on behalf of NYPD Police Communication Technicians at the 11 Metro Tech Center and 1 Police Plaza in New York City. The HHE request detailed concerns that work within the 911 Call Center was highly stressful and that workers experienced distressing call related memories, increased tension and irritability, and chronic musculoskeletal discomfort. On March 27, the Safety Officer for NYPD filed a joint HHE request on behalf of NYPD management and asked that the National Institute for Occupational Safety and Health (NIOSH) conduct a health hazard evaluation of Police Communication Technicians to determine whether working conditions at the call centers were hazardous to worker health. On August 3, 1998, an opening conference was held at 11 Metro Tech Center in Brooklyn, New York with representatives from the NYPD Department of Citywide Administrative Services, AFSCME District 37, and NIOSH to discuss the HHE request, the types of health concerns expressed by employees, and the steps that NIOSH researchers would propose to evaluate these concerns. Following this opening conference, employees at the 911 Call Center at 11 Metro Tech Center and 1 Police Plaza were randomly selected for confidential interviews. Employees who participated in the confidential interviews were asked to describe working conditions within the Police Communications Section and how these working conditions may have been affecting their health. As a result of meetings with management, workers, and union representatives, NIOSH representatives proposed to the NYPD that a survey be conducted to evaluate potential work stressors, ergonomic hazards, and noise levels at the call center. NIOSH investigators developed an evaluation protocol for the call center that included a self-administered questionnaire to ascertain work history, work load, employee and supervisory interactions, and health outcomes related to work stress such as depression,
anxiety, and lost work days. Furthermore, NIOSH investigators proposed that salivary cortisol samples be collected as an objective measure of stress. To address concerns about noise and musculoskeletal strain, specific noise and ergonomic assessments were also proposed. During the week of March 1-5, 1999, representatives from NIOSH distributed questionnaires, collected serial salivary cortisol samples, measured ambient noise at selected locations in the call center, and evaluated the ergonomic design of workstations at 11 Metro Tech Center.
BACKGROUND The New York Police Communication Section occupies space at the 11 Metro Tech Center in Brooklyn and, at the time of the survey, a limited number of personnel occupied space at 1 Police Plaza. NYPD management estimated that 970 workers were employed as emergency response operators and police dispatchers. The emergency response telephone operator’s job title is Police Communication Technician (PCT); supervisory PCTs are designated SPCT. Collectively, the PCTs are referred to as call takers. Individual call takers average over 120 calls per day; the 911 telephone system receives approximately 25,000 calls each day. In addition to the high volume of calls handled, the ethnic diversity of New York requires that the emergency response program be able to accommodate callers in over 143 languages and dialects.
Call takers work an 8-hour shift with an hour for meals and an additional hour of breaks. Thus, call takers are expected to have their headsets connected to the system for 6 hours each day. Breaks can be cancelled in the event that call volumes increase and stations need coverage. When in a ready state (last call completed and open for a new call) an incoming emergency call can be automatically routed to the call taker. Call takers answer the phone according to protocol by informing callers that they have reached the 911 operator and then asking them to describe the nature of their emergency. Call takers note the
Health Hazard Evaluation Report No. 97-0137-3026 Page 2
important facts of the call on their computer screens and then transmit this information to the police dispatcher who finds an available police unit to respond. All incoming calls and conversations between call takers and the public are recorded. In addition, call center supervisors routinely monitor calls to insure that call takers are following established protocols and handling calls efficiently. Call takers complete 7 weeks of training and supervised experience before they are scheduled on a duty roster. The training program includes 2 weeks of training dedicated to using radios, 2 weeks of classroom sessions where prospective call takers learn 10-codes and the use of the computer system, and a minimum of 2 weeks where the trainee sits with an experienced PCT to observe and learn procedures.
METHODS The methods employed in this health hazard evaluation were approved by the NIOSH Human Subjects Review Board.
Study Design This was a cross-sectional study of NYPD Emergency Communication workers. Internal comparisons were made, as were comparisons with another metropolitan police communication program also evaluated by NIOSH.
Questionnaire Data were gathered by means of a 200-item self-administered questionnaire which included questions on work history, demographics, musculoskeletal injury and pain, depression, and psychosocial/work organization factors.
Questionnaire Components: Psychosocial Scales
Cognitive Demands Cognitive demands were assessed by a five-item scale that was developed by Hurrell and McLaney1 to capture the mental demands of workers.
Anxiety Anxiety was assessed by a 12-item scale that has been routinely used in the NIOSH generic job stress questionnaire by Hurrell and McLaney. Participants indicate how often they experienced dry mouth, muscle tension, headache, feeling as if blood was rushing to their head, feeling a lump in their throat, trembling, shortness of breath, pounding heart, sweaty hands, upset stomach, loss of appetite, and difficulty sleeping. Depression Depressive symptomatology was assessed by a modified (short form) version of the Center for Epidemiologic Studies Depression Scale (CES-D).2,3 Participants were asked how often in the last week they experienced any of the scale symptoms. Scores were adjusted to correspond to the full CES-D. Persons who had scores of 12 or greater were considered to have symptoms consistent with major depression (equivalent to a score of 22 or higher on the full CES-D 20-item scale). Social Network The social network scale was developed by Donald and Ware4 and consists of three subscales, social well-being, social contacts, and group participation. The 11-item scale covers a range of social and group activities including quantifying the number of friends and family, frequency of interaction with family and friends, group membership, and the extent of active involvement in groups and religious activity. Quantitative Workload Quantitative workload is assessed by a seven-item scale developed by Caplan, et al.5 that captures the pace of work and the amount of time available to complete an assignment or task. Work Control Work control, a combination of decision control and task control, was derived from job stress research by Greenberger6 and Ganster.7 Hurrell and McLaney used the work of these researchers to compile a 16-item scale for the NIOSH Generic Job Stress Questionnaire that assesses a worker’s control over the selection of tasks and the pace of
completing these tasks, workplace decision making, and influence over policies and procedures. Social Support For the purposes of this study, we focused upon social support provided by supervisory personnel based upon the work of Caplan et al. Job Satisfaction The job satisfaction scale was developed by Caplan et al.5 and determines job satisfaction based upon responses to whether the worker would recommend that a friend take a similar job, whether the worker would decide to take the same type of job again if given the choice, and whether the worker is generally satisfied with his/her job.
Salivary Cortisol: A Marker for Stress Salivary cortisol has been used in numerous studies as an objective measure for psychological stress.8, ,9 10 During periods of stress, the adrenal gland in the body produces a sharp rise in the levels of the glucocortical hormone cortisol. Normally, cortisol levels fluctuate during the day and are highest early in the morning. These levels taper off during late morning, then rise to a high again at noontime, and gradually decline to daily lows at 8-9 p.m. Cortisol levels that fluctuate against the normal daily pattern are considered markers of stressful periods.11,12 We collected salivary cortisol samples from participants four times daily for one week. This schedule allowed us to capture the natural daily variation in cortisol levels. Participants were given a 1-week supply of plastic sampling vials. Each vial contained a 3/8-inch diameter by 1.5-inch long dry cotton roll similar to those routinely used by dentists. At prescribed sampling intervals, workers were asked to remove the cotton swab from the vial and chew it for approximately 1 minute or until the swab was saturated with saliva. Workers then placed the saturated swab back into the plastic vial. Vials were coded to identify the individual providing the sample, the sample time, and the day the sample was collected. Salivary cortisol samples were then refrigerated and shipped to the NIOSH laboratory daily.
Samples were analyzed by NIOSH laboratory personnel using an enzyme-linked immunosorbent assay (ELISA) produced by Oxford Biomedical. Saliva samples were run in duplicate according to the manufacturer’s instructions. Calibration standards were run in duplicate on each plate. Samples yielding results > 10 nanograms/milliliter (ml) were diluted 1:5 with buffer solution and reanalyzed.
Noise Real-time area noise sampling was conducted with a Larson-Davis Laboratory Model 2800 Real-Time Analyzer and a Larson-Davis Laboratory Model 2559 ½-inch random incidence response microphone. The analyzer allowed for the analysis of noise into its spectral components in a real-time mode. The ½-inch diameter microphone had a frequency response range (± 2 decibels [dB]) from 4 Hertz (Hz) to 21 kilohertz (kHz) that allowed for the analysis of sounds in the region of concern. Full octave bands consisting of center frequencies from 31.5 Hz to 16 kHz were integrated and stored in the analyzer. The analyzer was mounted on a tripod and placed at various locations where the police and the 911 telephone operators sat at their consoles with the microphone placed at approximately the level of peoples’ ears.
Statistical Analysis Data were analyzed using SAS® version 8.0. Exploratory data analyses were conducted using univariate data techniques. Associations between questionnaire items were assessed by means of correlation statistics and odds ratios (OR) were calculated. ORs were used to measure the strength of association between psychosocial variables and health outcomes. The OR is a ratio between the odds of an event among those exposed to a specified variable and the odds of an event among those not exposed to that variable. For example, the association between depression (the health outcome) and sex of the participant (exposure variable) would be expressed as an OR in the following manner:
menamongdepressionofOdds
womenamongdepressionofOdds
= OR Health Hazard Evaluation Report No. 97-0137-3026 Page 3
Health Hazard Evaluation Report No. 97-0137-3026 Page 4
If the ratio is 1 (the same odds of depression is found in women as is found in men) then there is no greater prevalence of depression in women compared to men. If the OR exceeds 1, then the prevalence of depression would be higher in women than in men. An OR of 3 would mean that the prevalence of depression is three times greater among women than among men. Conversely, an OR less than 1 indicates that the prevalence of depression is less among women than among men. Each estimated OR also has an associated confidence interval (CI). The confidence intervals are an indication of the statistical significance of the OR. A 95% CI of 1.1 to 2.0 indicates 95% certainty that the true OR is somewhere between 1.1 and 2.0. Conversely, this same range would suggest that there is a 5% chance that the true OR is outside of the range indicated.
Missing Variables We imputed missing variables (i.e., assigned a value when data were missing) within psychometric scales when possible. Scale item responses were imputed when the participant had answered at least 75% of the scale. Individual average response scores were calculated from the scale items present and items where an answer was missing were assigned an average response score that reflected each individual respondent’s tendencies within that specific scale.
EVALUATION CRITERIA Psychosocial Factors With regard to psychosocial factors within the workplace, there are currently no minimum or maximum levels for identified work stressors. The purpose of this study was to assess what work place stressors were most associated with health outcomes, not to determine whether workers exceeded a reference range. National prevalence rates and normative data are available for many of the scales used in this HHE and where practical, comparisons were made with national normative data or comparisons with results from other 911 Call Centers.
Noise The A-weighted decibel (dBA) is the preferred
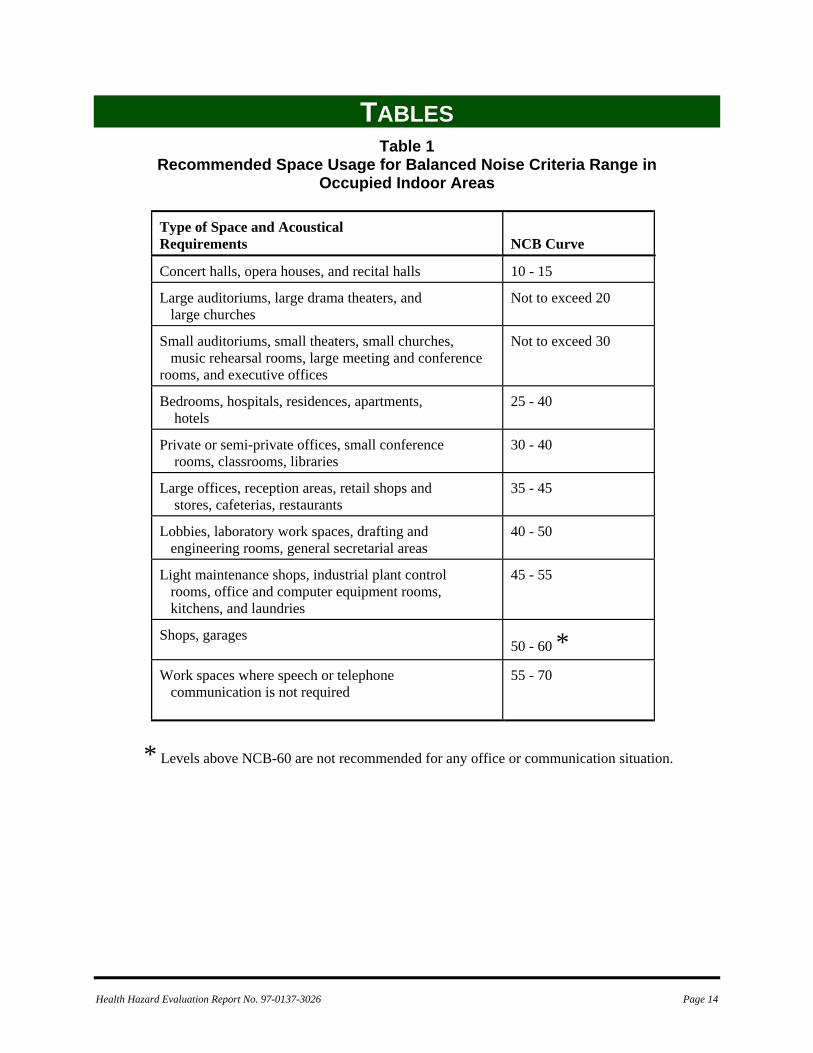
unit for measuring sound levels to assess worker noise exposures. The dB(A) scale is weighted to approximate the sensory response of the human ear to sound frequencies near the threshold of hearing. The decibel unit is dimensionless, and represents the logarithmic relationship of the measured sound pressure level to an arbitrary reference sound pressure (20 micropascals, the normal threshold of human hearing at a frequency of 1000 Hz). Decibel units are used because of the very large range of sound pressure levels audible to the human ear. Because the dB(A) scale is logarithmic, increases of 3 dB(A), 10 dB(A), and 20 dB(A) represent a doubling, tenfold increase, and hundred-fold increase of sound energy, respectively. It should be noted that noise exposures expressed in decibels cannot be averaged by taking the simple arithmetic mean. Neither the occupational noise regulation promulgated by the Occupational Safety and Health Administration (OSHA),13 nor the limits published by NIOSH 14 and the American Conference of Government Industrial Hygienists (ACGIH),15 are appropriate for the situation observed at this work location. The above referenced criteria are designed to prevent hearing losses from exposure to intense noise levels. However, noise of intensities lower than that which may cause a hearing loss can be disruptive in the workplace. Interference with speech and interruption of office activities are possible results of unwanted noise. The noise can interfere with the efficiency and productivity of the office staff and can be detrimental to the occupants’ comfort, health, and sense of well-being. One set of noise criteria for occupied interior spaces, the balanced noise criteria (NCB) curves, have been devised to limit noise to levels where satisfactory speech intelligibility is obtained.16, ,17 18 The noise criteria were devised through the use of extensive interviews with personnel in offices, factories, and public places along with simultaneously measured octave band sound levels. The interviews consistently showed that people rate noise as troublesome when its speech interference level is high enough to make voice communication difficult. The recommended space classification and suggested noise criteria range for steady
Health Hazard Evaluation Report No. 97-0137-3026 Page 5
background noise heard in various indoor occupied activity areas are shown in Table 1. The NCB curves assume occupied spaces, with the heating, ventilation, and air-conditioning systems operating along with all other sources of normal interior and exterior noise. In general, the lower end of the range shown in Table 1 is selected if high reliability of speech communication is desired. The upper end of the range is used when economic conditions dictate that marginal conditions must be accepted and where it is expected that the users will not be overly critical of the space.
RESULTS Of the 970 on-duty police dispatchers and operators, 607 (63%) participated in at least the questionnaire phase of this study. Participants had an average age of 38 (range 21-73 years); the majority were female (88%), married (40%), and either attended some college or were graduates of a community college (63%). Participants had worked for the city an average of 10 years (range <1 to 34 years), and worked as a call taker for 8 years (range <1-27 years).
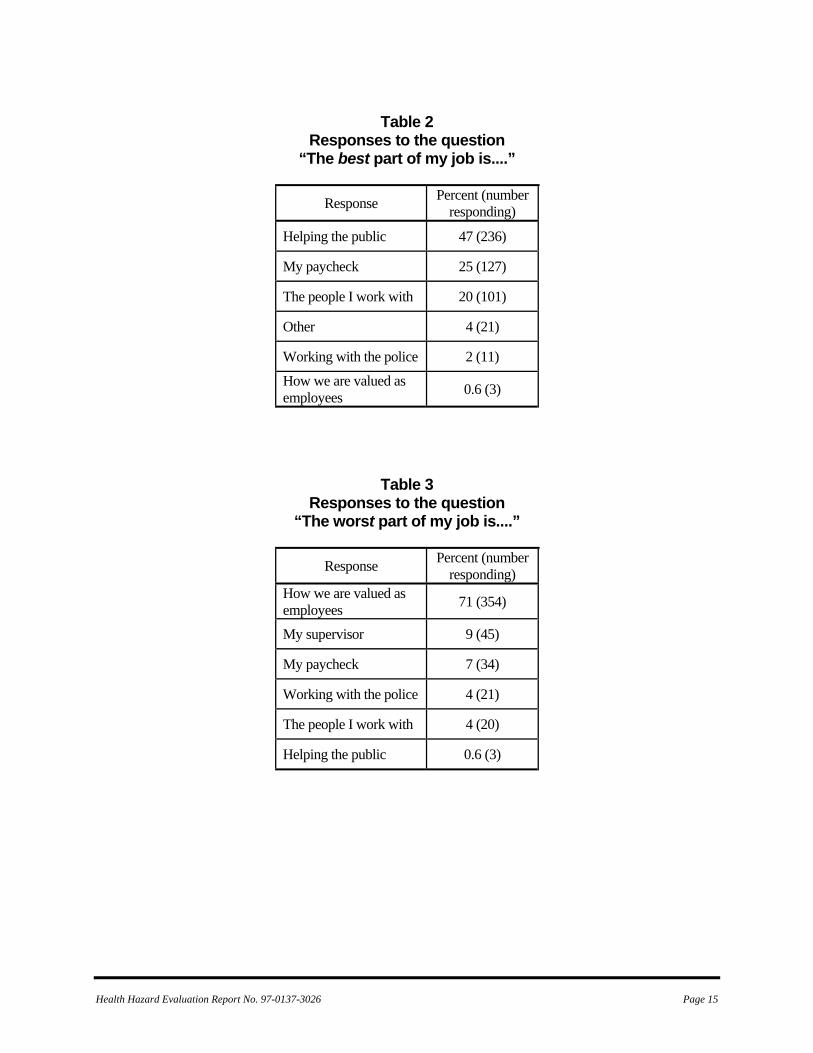
Organizational Climate Participants were asked to select one of seven answers to describe what they liked best about their job. The seven choices represent those responses that were given most frequently during personal interviews with workers when asked the question, “What do you like best and what do you like worst about your job?” Forty seven percent responded “helping the public,” 25% selected “my paycheck”, and 20% selected “the people I work with” as the aspect of their job they liked best (Table 2). “How we are valued as employees” was selected by 354 persons (71%) to represent the single worst part of working as a 911 operator (Table 3).
Call Monitoring Department policy requires supervisory personnel to periodically monitor calls to ensure that operators are adhering to established procedures and determine whether a worker might require additional training. Call takers are aware that supervisors are able to monitor calls and that at
least once per month their calls will be monitored. During a monitored call, the call takers are unaware that the supervisor is on the line. Immediately following the call, supervisors hand the call taker a score sheet that lists any deficiencies noted during the call. To evaluate how workers perceive call monitoring procedures, participants were asked to describe why calls were monitored, whether call monitoring helped them with their job, and what type of feedback was likely after calls were monitored. When presented the statement “Supervisors monitor our call to insure that we follow the correct procedures,” 58% of the respondents “strongly agreed,” and 33% “slightly agreed” with the statement (Table 4). Only 3% strongly disagreed. Additionally, when ask to respond to the statement “Supervisors monitor our calls to help us do our jobs better,” 29% “strongly agreed,” and 42% “slightly agreed.” Fourteen percent strongly disagreed with the statement. To evaluate what is likely to happen if the call taker adheres to policy, call takers were asked to respond to the following statement, “When calls have been monitored by a supervisor and we did a good job, our supervisor will tell us we did a good job.” Among participants, 16% “strongly agreed,” 41% “slightly agreed” and 42% slightly or strongly disagreed with the statement. Overall, when asked to respond to the statement “It bothers me that a supervisor may be listening to me on the phone,” 33% selected “strongly disagree,” 32% selected “slightly disagree,” and 25% selected “slightly agree.” Forty eight persons (10%) strongly agreed that it bothers them when a supervisor monitors their phone conversations.
Job Performance Factors Call takers were asked about their work environment and what aspects of it made it difficult for them to do their job effectively. Three hundred thirty three persons agreed (of these, 31% “strongly agreed,” 37% “slightly agreed”) that it is sometimes difficult to concentrate on a caller because of interfering noise from other operators or dispatchers talking. When responding to the statement, “I can tune out the noise in the room
Health Hazard Evaluation Report No. 97-0137-3026 Page 6
when I am doing my work,” 20% “strongly agreed” and 47% “slightly agreed.” When asked if they can clearly see the information on their computer screen PCTs responded somewhat evenly across the response categories. Twenty one percent “strongly agreed” that they could clearly see the information on the computer screen, 34% “slightly agreed”, 24% “slightly disagreed,” and 21% “strongly disagreed.”
Self-Reported Sick Leave To evaluate sick leave use, participants were asked to estimate the number of days absent in the previous 12 months. Four hundred ninety two persons responded to this question. Of these respondents, 93% indicated that they had been absent from work one or more days during this period. The median number of days absent from work was 10 days (range 0-99 days). Some or all of the sick leave was used to care for a sick family member according to 55% of the respondents. Fifty six percent of the respondents indicated that they had not used leave in the last 30 days. Among those who had used leave in the last 30 days, they were absent an average of 3.5 days. Table 5 presents a comparison of New York Police Communications Center employee absences to those of a smaller urban 911 Call Center in Ohio. New York 911 operators used approximately 19.6 days of sick leave annually compared to 13.7 days among 911 operators in Ohio. In both 911 centers, women used more sick days than men.
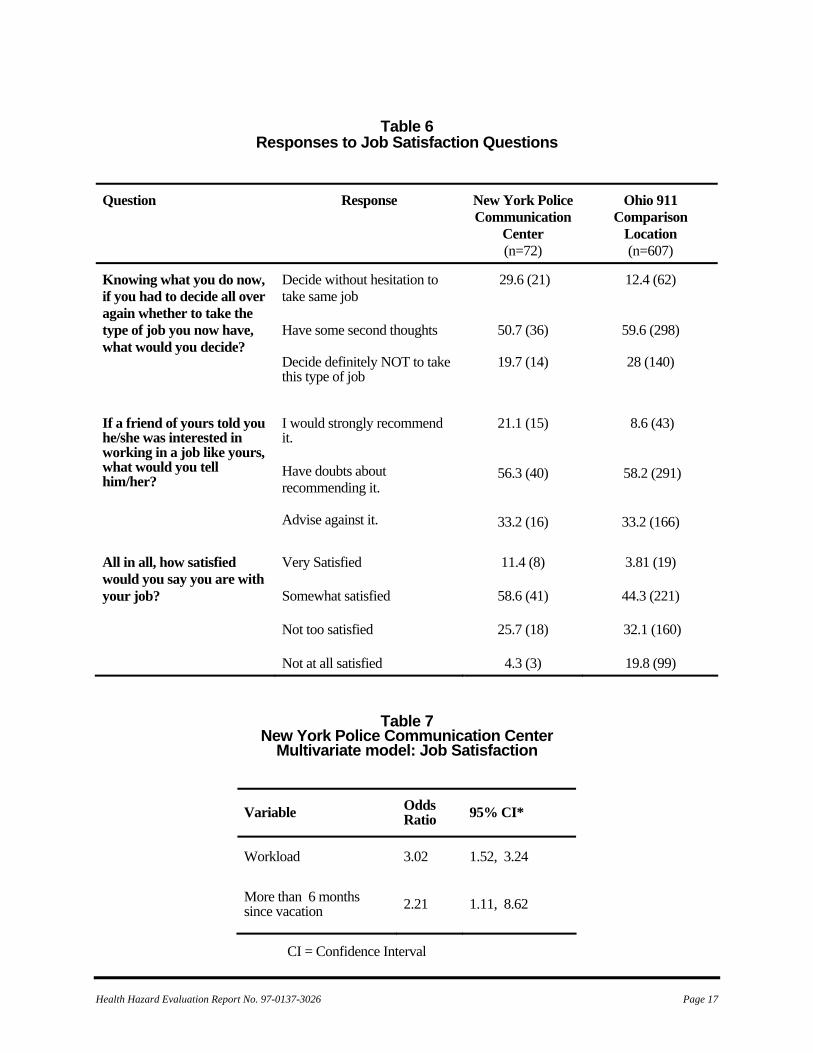
Job Satisfaction Participants were asked three questions pertaining to job satisfaction. Answers to these questions were used to construct an overall job satisfaction score. These overall scores and individual item scores are presented in Table 6 along with comparison scores from the Ohio 911 Call Center. Overall, New York had worse job satisfaction, i.e., higher job dissatisfaction score than the comparison center (New York average job dissatisfaction score = 2.31 vs. 2.04 in Ohio, p<0.0001). Among New York respondents, 62 (9%) would decide without hesitation to take the same job again, however, 438 respondents (88%) would have second thoughts or would definitely not take the same job. When asked if they would recommend this job to a friend, 43
(3%) would recommend it strongly, while 457 (91%) would have doubts about recommending it or would advise their friends against taking a similar job. When asked directly how satisfied they were with their job, 19 (4%) were “very” satisfied, 221 (44%) were “somewhat” satisfied, 16 (32%) were “not too” satisfied, and 99 (20%) were “not at all” satisfied. Table 7 shows the variables associated with job satisfaction in a multivariate statistical model. Call takers who reported perceived workload in the highest quartile (top 25%) were three times more likely than those who reported lower perceived workload to have low job satisfaction scores (OR=3.02, 95% CI 1.11, 8.62) and participants who reported they had not had a vacation in over 6 months were more than twice as likely as those with a recent vacation to report low job satisfaction (OR 2.21, 95% CI 1.52, 8.62).
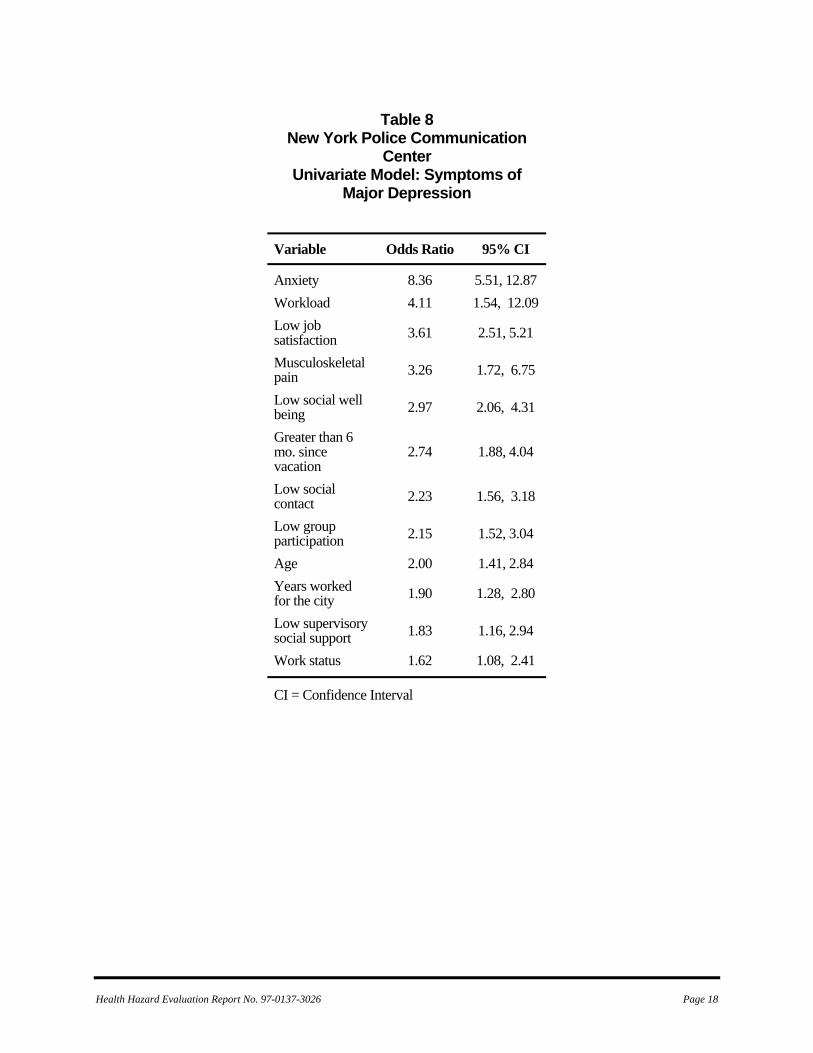
Depression Two hundred sixty nine respondents (44%) reported symptoms consistent with depression (CES-D scale greater than or equal to 16). Of these workers, 193 (72% of those with depressive symptoms and 32% of the overall participants) had depressive symptoms consistent with major depression (CES-D greater than or equal to 22). Women had a slightly higher prevalence of reporting depressive symptoms than men (38% women vs. 35% men) but this difference was not statistically significant (p=0.364). The prevalence of symptoms consistent with depression among New York 911 Call Center employees was compared with those from the Ohio 911 Call Center. Prevalence rates for New York workers were slightly higher than found at the comparison 911 Call Center (32% vs. 29% respectively); however, this difference was not statistically significant. (p=0.65). Univariate (unadjusted ) relationships between predictor variables and depression are presented in Table 8. Persons were more likely to report symptoms consistent with major depression if they reported anxiety (OR 8.36, 95% CI 5.51, 12.86), had high perceived workloads (OR 4.11, 95% CI 1.54, 12.09), had low job satisfaction (OR 3.61,
Health Hazard Evaluation Report No. 97-0137-3026 Page 7
95% CI 2.51, 5.21), had musculoskeletal pain in the last 12 months lasting more than 1 week (OR 3.27, 95% CI 1.72, 6.75), had low levels of social well being (OR 2.98, 95% CI 2.06, 4.31), and had more than 6 months elapse since last vacation (OR 2.74, 95% CI 1.88, 5.21). The final multivariate model had four statistically significant predictor variables, anxiety (OR 6.78, 95% CI 4.33, 10.61), high perceived workload (OR 4.57, 95% CI 1.45, 14.43), low social well being (OR 2.63, 95% CI 1.73, 4.00), and low job satisfaction (OR 2.35, 95% CI 1.56, 3.56).
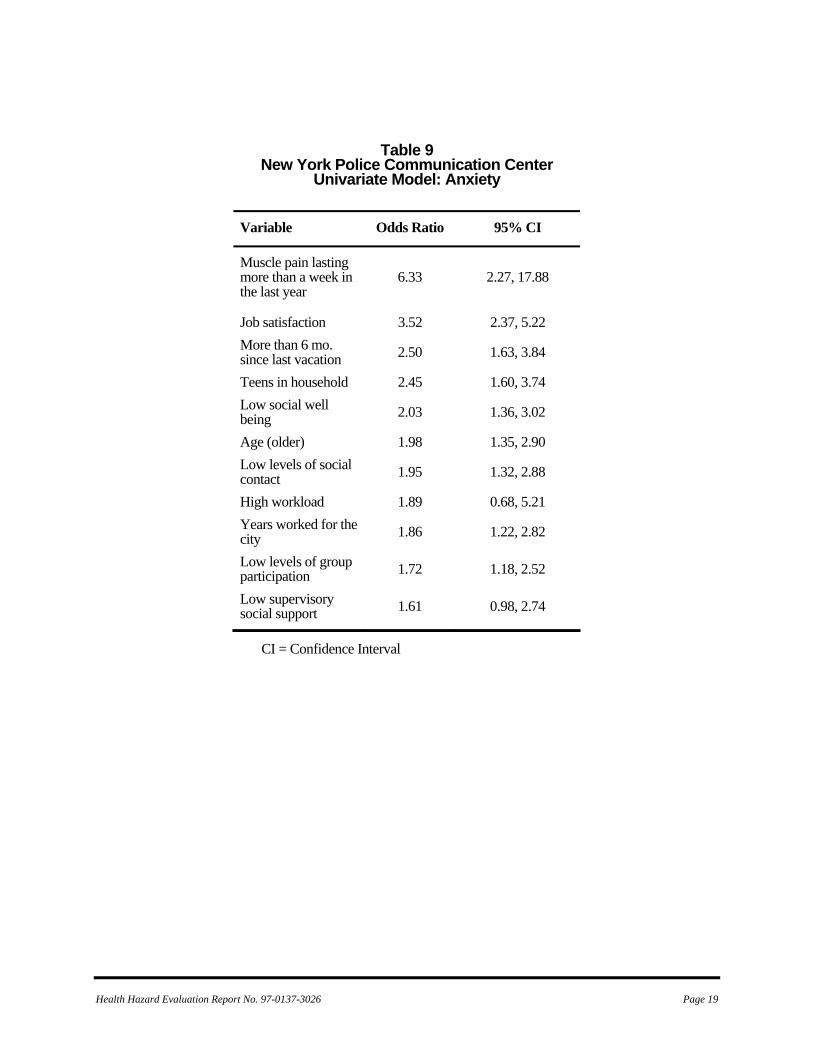
Anxiety Participants were asked to describe how often they experienced symptoms consistent with anxiety. Symptoms consistent with anxiety included dry mouth, muscle tension, headache, feeling as if blood was rushing to their head, feeling a lump in their throat, trembling, shortness of breath, heart pounding, sweaty hands, upset stomach, and loss of appetite or difficulty sleeping. Symptoms consistent with anxiety were reported by 138 respondents (22%). Table 9 lists the unadjusted (crude) relationship between work organization variables and anxiety. Nine of the variables presented in Table 9 showed a statistically significant relationship with anxiety. However, multivariate modeling showed that two items were significantly associated with anxiety, reporting musculoskeletal pain that lasted more than a week in the last year and low job satisfaction. Workers who reported having musculoskeletal pain were more than five times as likely as those without musculoskeletal pain to report having anxiety-related symptoms (OR 5.55, 95% CI 1.96, 15.70). PCTs who reported low job satisfaction (lowest quartile of job satisfaction) were twice as likely as those with better job satisfaction (highest three quartiles) to report anxiety related symptoms (OR 2.03, 95% CI 1.53, 3.4).
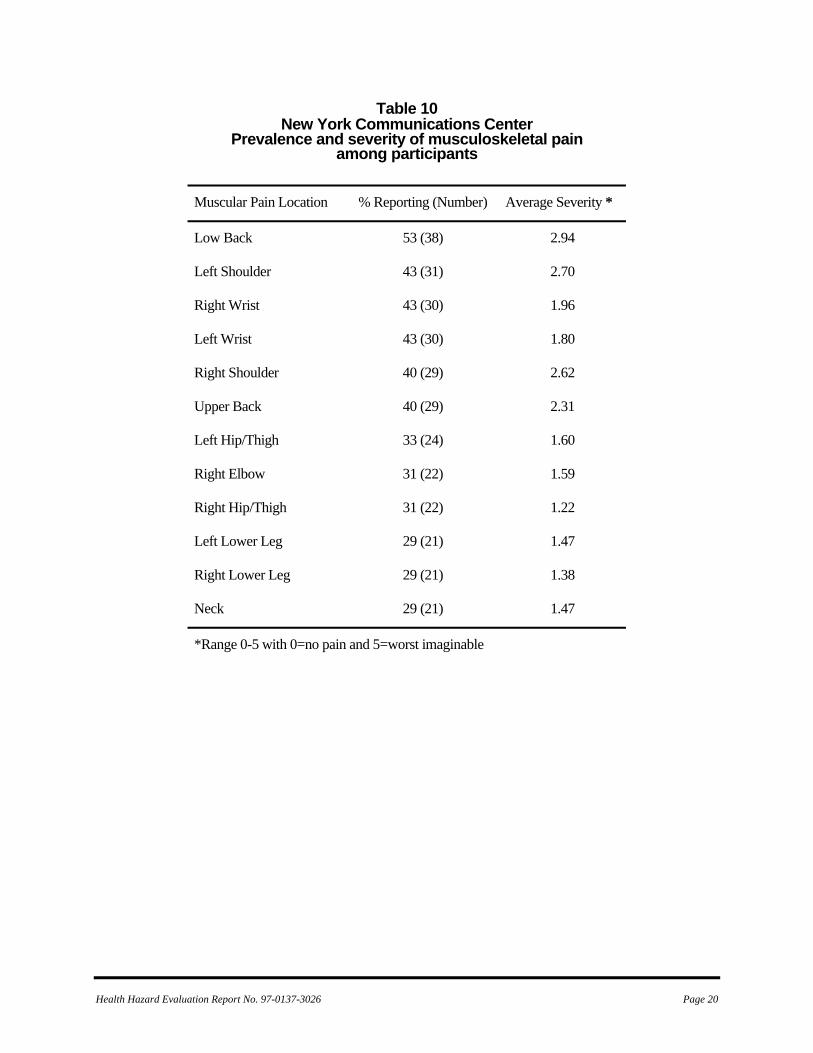
Musculoskeletal Participants were asked to recall whether they had any muscle, joint pain, or discomfort that lasted at least a week during the previous 12-month period. Those who had experienced pain were asked the location of the pain and to rate the pain from 0 (none at all) to 5 (worst imaginable).
Four hundred forty three persons (87%) indicated they had experienced muscular pain or discomfort that had lasted at least a week in the past year. Table 10 describes the location and severity of the pain reported by call center participants.
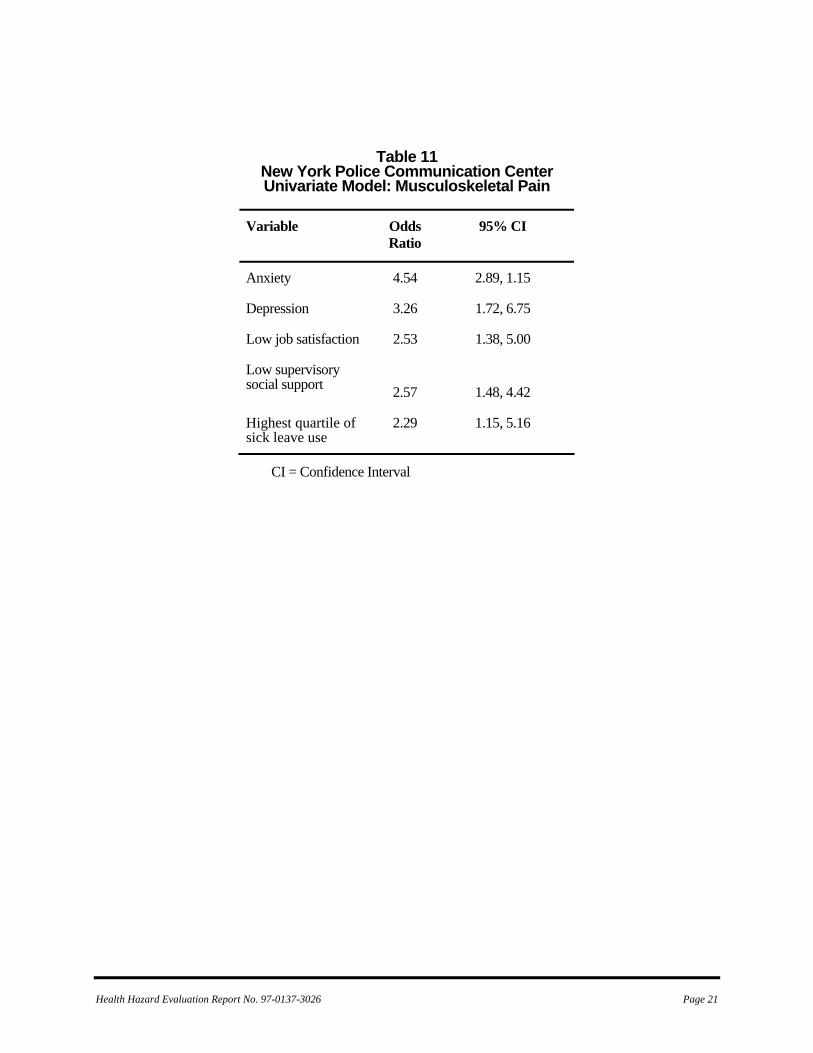
Table 11 lists the results of univariate modeling of musculoskeletal pain. Increased prevalence of musculoskeletal pain is associated with anxiety (OR 4.53, 95% CI 2.89, 7.68), depressive symptomotology (OR 3.26, 95% CI 1.72, 6.75), low job satisfaction (OR 2.54, 95% CI 1.38, 5.00), low supervisory social support (OR 2.57, 95% CI 1.48, 4.42), and being in the highest quartile of sick leave users (OR 2.25, 95% CI 1.15, 5.16). The multivariate model for musculoskeletal pain includes low supervisory social support, anxiety-related symptoms and high use of sick leave. Participants with anxiety-related symptoms were five times more likely to report musculoskeletal pain (OR 5.62, 95% CI 2.37, 18.88), twice as likely to report low supervisory social support (OR 2.25, 95% CI 2.28, 3.92) and twice as likely to be in the highest quartile of sick leave use (OR 2.16, 95% CI 1.07, 4.89).
Salivary Cortisol Salivary cortisol samples were collected from 384 participants who submitted three samples per day for 5 days. In general, individual cortisol responses followed patterns that have been reported in other studies, namely cortisol levels were highest in the morning and decreased as the day progressed.19 Additionally, as others have found, measured salivary cortisol diminished as the week progressed.20 However, salivary cortisol levels were not associated with any of the health outcomes evaluated (no statistically significant difference in salivary cortisol levels was found between groups evaluated). Thus, salivary cortisol was not a predictor of depression, anxiety, or work stress in this study.
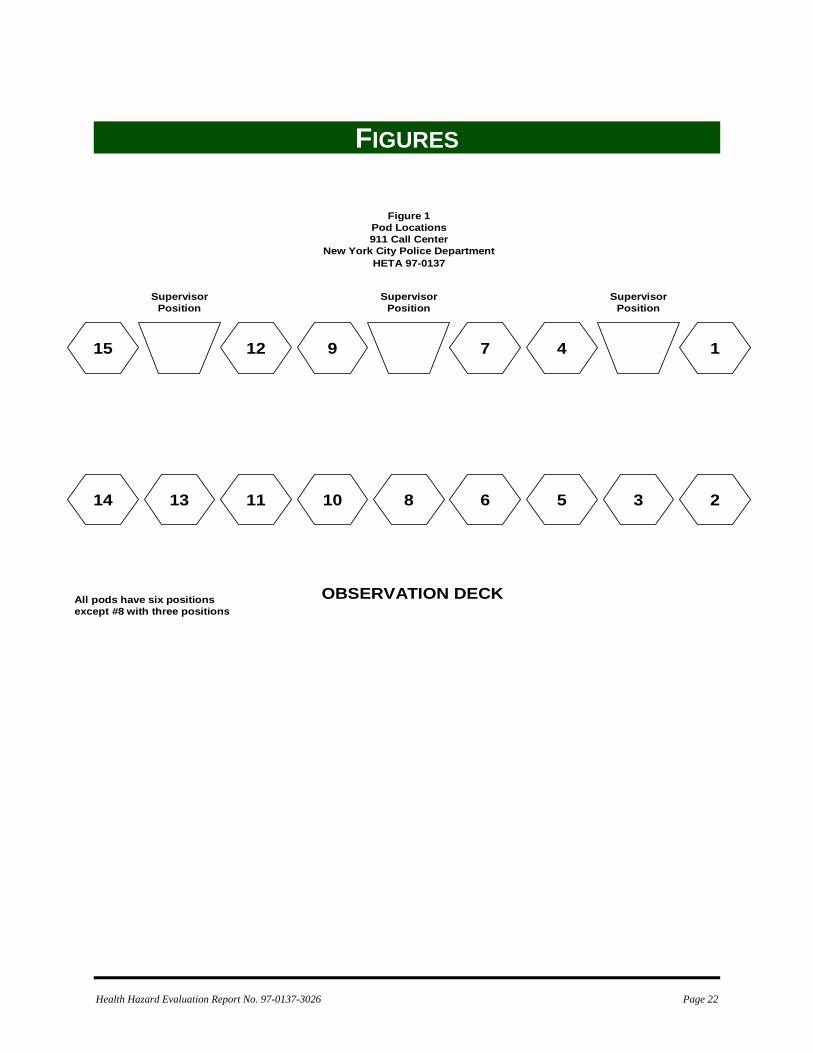
Noise Area octave band noise measurements were made at seven of the fifteen 911 operator pods and at the 11 dispatch stations that were being used in the police dispatch area. Generally, the communication activity in the two locations was very heavy during the 60-second period when
Health Hazard Evaluation Report No. 97-0137-3026 Page 8
the measurements were made. Multiple noise readings were collected at each operator position at a 911 pod or dispatch station. Median noise levels were calculated for the octave bands and overall levels at each pod or dispatch station. The median overall sound levels measured in the 911 Call Center ranged from 62 to 73 dBA. For the police dispatch area, the median overall levels ranged from 65 to 72 dBA. The median octave bands at each measurement site were graphed and are shown in Figures 1-20. The horizontal lines placed on each of the octave bands represent the high and low noise values captured at the measurement site. Each figure has a similar pattern, maximum sound energy in the 16 and 31.5 Hz bands and a second area of higher energy in the 500 and 1000 Hz bands. The lower frequencies are the result of the ventilation system in the office area. The higher frequencies are the result of conversations in the work areas. When the octave bands were compared to the NCB criteria for occupied spaces, the police dispatch and the 911 operator areas met the NCB-62 curve and NCB-59 curve, respectively (Figure 21 and 22). The determining octave band for the measured criteria was 500 Hz in the 911 operator area and 2000 Hz in the police dispatch area. According to the NCB classification scheme, the ambient levels appropriate for fair listening conditions or general secretarial areas are between the range of NCB-40 and NCB-50. Levels above NCB-60 are not recommended for any office or communication situation.7
DISCUSSION The purpose of this health hazard evaluation was to identify work stressors associated with work as a 911 operator and evaluate how these stressors affect worker health. Work stressors (factors that contribute to work stress) evaluated included supervisory social support, job satisfaction, workload, mental demands, and the degree to which workers had control over aspects of their job. Because workers have activities outside of the work environment, we also evaluated the extent of social networks, use of vacation time, amount and frequency of exercise, and ways employees chose
to wind down after their shift. The work-related strains that were measured in this evaluation were symptoms of major depression, anxiety, lost work days (absenteeism) and musculoskeletal injury.
Depression We found that 33% of the NYPD 911 Call Center employees and 29% of the employees at a comparison location in Ohio report symptoms consistent with major depression. Published estimates from the National Institute of Mental Health place the prevalence of major depression in the general public at approximately 9.5%.21 Rates of depressive symptoms among 911 operators and police dispatchers appear higher than what we would expect given the rates observed in the general population; however, the National Institute of Mental Health rates reflect actual diagnosed cases of depression and not responses to a screening questionnaire.
Stressors associated with reports of depressive symptoms in this work force We compared those who reported the highest levels of depressive symptoms to others in this study. Our findings show that NYPD 911 Call Center operators were more likely to report depressive symptoms if they were highly anxious in their work, had low job satisfaction, reported having heavy workloads, and reported not taking a vacation within the last 6 months.
Anxiety We found 22% of the participants reported symptoms consistent with anxiety. This is slightly higher than would be expected in the general population given that the National Institute of Mental Health estimates that 18% of the general adult population can report an anxiety disorder each year.22 Participants who were most likely to report symptoms consistent with anxiety were those who reported low job satisfaction and musculoskeletal pain that lasted longer than a week.
Health Hazard Evaluation Report No. 97-0137-3026 Page 9
Stressors Common to Anxiety and Depression Job satisfaction is a contributor to both depression and anxiety. Thus, factors that can improve job satisfaction may have far-reaching effects including reduced depressive symptomatology, reduced anxiety-related symptoms, and improved attendance at work. Those with poor job satisfaction are more than twice as likely to report depressive symptoms, anxiety-related symptoms, and musculoskeletal-related symptoms. The four statistically significant predictors of depression in this study were anxiety, high perceived workload, low social well being, and low job satisfaction. Two variables, workload and job satisfaction, are work-environment issues that, if properly addressed, could improve the mental health of the workforce. Factors that influenced perceived workload among participants included how much time workers had to think and contemplate their tasks. Unfortunately, work as a 911 operator allows little if any time to contemplate anything other than the emergency situation at hand; however, call takers could be included in decision making along with supervisors to consider broader organizational concerns, such as how to improve working conditions, supervisory/support relationships, or what changes could be implemented to accomplish their jobs more effectively. Factors that influenced job satisfaction were workload and time since last vacation. Persons who had perceived high workload were three times more likely to have low job satisfaction scores (OR 3.02, 95% CI 1.52, 3.24) after controlling for time since last vacation. Persons who reported more than 6 months since their last vacation were more than twice as likely to have low job satisfaction scores (OR 2.21, 95% CI 1.11, 8.62). Work absenteeism, primarily in the form of sick leave, represents one of the major concerns of management. When the rates for the NYPD 911 Call Center were adjusted to reflect a 12-month period, absentee rates for New York were higher than those found in the Ohio 911 center (19.6 vs. 13.7). However, both call centers have absentee rates that exceed the national average for all workers. Factors contributing to absenteeism have
been the subject of numerous studies and researchers have shown absenteeism is associated with not only acute illness but chronic disease, child care responsibilities, low job satisfaction, and work stress.23, ,24 25 In addition, some studies have shown sickness absence rates to be highest among employees who have jobs with high cognitive or physical demands and limited choices or options for coping. On both a national level and within this work group, women tend to use more sick leave than men.26 Among New York 911 participants, women had a median of 5 days sick leave vs. 1 day for men. The higher sick leave use by women may be attributed to the disproportionate responsibility for child care shouldered by the women (although 55% of the men had children in the household, 0% of the men had reported using sick leave to care for others, while 50% of the women had children in the household and 15% of them had used sick leave to care for others).
Call Monitoring Preliminary interviews with workers suggested that the policy of the department to monitor calls was a source of concern to workers. However, worker questionnaire responses seem to contradict the findings from oral interviews. Survey results indicated that call takers understood the reason for call monitoring and were aware that supervisors were monitoring calls to insure that they adhered to correct policies and procedures. This apparent disparity is most likely a factor of the questions asked and the context of the questions. Specifically, we may not have asked the questions in the same way we did in the interviews, and the questionnaire responses reflect an understanding of the reasons calls are monitored but they do not capture the feelings people have about being monitored. Thus, both situations may be correct, that 911 call takers understand why calls are monitored but are disturbed by the process. Similarly, interviews with workers suggested that room noise could at times be distracting and at times it was difficult to hear the callers. Questionnaire responses also seemed to contradict these findings. For instance, 61% strongly or slightly agreed that it is sometimes difficult to concentrate on a caller because of room noise, but 95% reported that they are able to “tune out” the
Health Hazard Evaluation Report No. 97-0137-3026 Page 10
room noise in order to do their work. On the surface, these results, appear to conflict; however, the most likely explanation for this is that room noise is a problem, but each person possesses the ability (at times) to tune out this noise. Thus, it is likely that not all persons are able to tune out all the noise all the time. The ambient sound levels measured during this survey show that the listening conditions are not ideal. The majority of the sound in the room is being created by human speech, which is verified by the octave band sound measurements. The maximum octave band levels are between 500 and 2000 Hz, which is the middle of human speech.27 Thus, it will be very difficult to improve listening conditions with the floor plan currently in use. A reconfiguration of the consoles where the operators and dispatchers are isolated from one another would reduce the ambient speech noise at each location. Also, the use of headsets that have sound attenuation cups over the ear piece, much like a pair of ear muffs, or an eartip that is also a hearing protector would also reduce the ambient noise at each station. The literature on the Plantronics headset that was given to NIOSH investigators by the NYPD management does show that a hearing protector eartip is available for the StarSet system. Musculoskeletal symptoms described by participants were consistent with the type and severity of symptoms shown in other studies involving computer-based communication work. Wrist and extremity pain can be associated with the number of key strokes on the computer as well as static posture while listening to incoming calls.28, ,29 30 The most severe and most frequent symptoms included back, shoulder, and wrist pain. As was shown in the other health outcomes evaluated, two of the strongest predictors of musculoskeletal pain were low job satisfaction and low supervisory social support. However, because these studies were cross-sectional studies, it is not possible to determine causal direction (did low job satisfaction cause musculoskeletal pain or did the presence of musculoskeletal pain result in low job satisfaction). The City’s health and safety program conducted an ergonomic assessment of the chairs and workstations just prior to this study. Steps were in
place to conduct periodic ergonomic training and review of furniture procurement to ensure that furniture purchased would be adjustable and well suited to the needs of the workers.
CONCLUSIONS Of the available workers, 63% participated in this study. Thus, nearly 40% of the population chose not to be included this survey and are, therefore, unaccounted for in the analyses. A low participation rate lessens the confidence one can have about both the associations reported and the conclusions reached. While the results reported may not be as robust as planned, because of the moderately low participation rate, the results do point to specific areas where careful attention could result in improved conditions for workers at the 911 Emergency Response Center. The high prevalence of symptoms consistent with depression and anxiety and the fact that these symptoms increase with time on the job suggest that operators may not be adjusting to the stressors of this job over time and may be at increased risk for worsening symptoms of depression and anxiety. Two of the strongest predictors of depressive symptoms and anxiety in this study were time since last vacation (greater than 6 months) and social support from the immediate supervisor. Both of these variables were highly associated with health outcomes and can be points of focus for management at this center. Management should recognize that the intensity of work requires that employees take a break to mentally rest and regroup. The apparently high use of sick leave among employees may be interpreted as a sign that current work-rest schedules are not sufficient to allow workers to return to work fully rested and ready to resume their duties. The assessment of supervisory support in this study was not a measure of how well supervisors and workers like each other, or a measure of the personality of the supervisor. Rather, it measured the extent the manager and employee are able to communicate and work as a team and the extent to which a supervisor has the employee’s best interest in mind when decisions have to be made. Those who did not feel they had a manager they could talk to, or felt they did not have a manager they could
Health Hazard Evaluation Report No. 97-0137-3026 Page 11
rely on when things got tough at work, or felt they did not have a manager who was willing to listen to their problems, were more likely to report more symptoms consistent with anxiety and depression and were more likely to use sick leave. Thus, efforts on the part of management to improve the relationship between supervisor and employee may have some of the most influential results for improving the health and well being of this workforce. Lastly, we asked participants to list what they perceived to be the worst aspect of their job. By far the choice most often selected was “How we are valued as employees.” Virtually all of the call takers interviewed prior to the survey indicated that they became 911 operators because they wanted to help people. They described a sense of pride in having a job that provided a vital service to the community. Call takers also reported that over time they came to believe that the job is a thankless position. They perceive that they are the first to be blamed if something goes wrong and that their name and picture are likely to be aired on the nightly news. Seldom is the expedient handling of a 911 call praised in the media or by Police Department management. However, this workforce also sees a tremendous good in the work they do. The vast majority of workers indicated that the best part of their job was helping the public and working with the people in the department. The NYPD should be commended for the caliber of people they are able to recruit and retain. The results of this study have shown that health outcomes of 911 operators and dispatchers are associated with the social interaction of the employees and the support they receive from their supervisors. Steps that can be taken to improve managerial social support and job satisfaction will likely reduce absenteeism and reduce the impact of adverse health outcomes.
RECOMMENDATIONS Work Organization 1. Improve social support by identifying areas where supervisors and their employees can increase a sense of teamwork and group cohesion. Include continuing education for
supervisors and employees and establish routine meeting times to solicit staff input on steps that can improve working conditions.
2. Encourage workers to use accumulated leave. Persons who had reported more than 6 months since their last vacation were at increased risk for adverse health outcomes. Insufficient staffing may account for the inability of some of the workers to use vacation time. To that end, workers who have sufficient leave time accrued should be encouraged to periodically use their leave. Conversely, management should not discourage the use of accrued leave. Also, management should evaluate staff levels to see if additional personnel are needed. 3. A greater effort should be made to recognize the accomplishments of this workforce, for example through regular awards, performance step increases, or positive media attention.
Noise 4. Add additional separation between the individual work areas. The pods in the 911 operator area were developed with separation between the stations in mind. However, when the pods are placed adjacent to each other, the conversation at one pod directly travels to the work location of another pod. Partial barriers between pods will help to block some of this direct sound but not all of it. 5. The “6 wire” located at pod 15 was one of the louder positions. The equipment used in the subway system’s emergency communications is different than the land line telephones at the other work stations. This particular operator location could be moved out of the general 911 call area and into its own room. 6. Hold discussions with Plantronics engineers to develop additional ways to eliminate background noise from interfering with communications. Other equipment that is similar to the hearing protector eartips can possibly be devised for the New York City Police Department along with other dispatch and 911 Call Center sites that have similar problems with ambient noise interference.
Health Hazard Evaluation Report No. 97-0137-3026 Page 12
7. Extraneous conversations need to be kept at a minimum with the floor plan currently in use. Additional speech sounds only add to the interference levels in the room.
REFERENCES
1. Hurrell JJ Jr., McLaney MA [1988]. Exposure to job stress-A new psychometric instrument. Scand J Work Environ Health 14:27-28.
2. Anderson EM, Malmgre JA, Carter WB, Patrick DL [1994]. Screening for depression in well older adults: evaluation of a short form of the CES-D. Am J Prev Med 102:77-84.
3. Radloff LS [1977]. The CES-D scale: a self report depression scale for research in the general population. Appl Psychol Measurement 1:385-401.
4. Donald CA, Ware JE Jr. [1982]. The quantification of social contacts and resources. The Rand Corporation R-2937 HHS October.
5. Caplan RD, Cobb SF, French JRP Jr. Van Harrison R, Pinneau SR Jr. [1975]. Job Demands and Worker Health. HEW Publication No. (NIOSH) 75-160.
6. Greenberger DB [1981]. Personal control at work: Its conceptualization and measurement (Technical Report 1-1-14). University of Wisconsin-Madison.
7. Ganster DC [1984]. Antecedents and consequences of employee stress. Final report (NIMH 1 ROL-MH34408).
8. Kunz-Ebrecht SR, Kirschbaum C, Marmot M, Steptoe A [2004]. Differences in cortisol awakening response on work days and weekends in women and men from the Whitehall II cohort. Psychoneuroendocrinology 29(4):516-528.
9. Bremner JD, Vythilingam M, Vermetten E, Adil J, Khan S, Nazeer A, Afzal N, McGlashan T, Elzinga B, Anderson GM, Heninger G, Southwck SM, Charney DS [2003].
Cortisol response to a cognitive stress challenge in posttraumatic stress disorder (PTSD) related to childhood abuse. Psychoneuroendocrinology 28(6):733-750.
10. Steptoe A, Cropley M, Griffith J, Kirschbaum C [2000]. Job strain and anger expression predict early morning elevation in salivary cortisol. Psychosom Med 62(2):286-292.
11. Kirschbaum C, Hellhammer DH [1989]. Salivary cortisol in psychobiological research: an overview. Neuropsychobiology 22(3):150-169.
12. Kirschbaum C, Prüssner JC, Stone AA, Federenko I, Gaab J, Lintz D, Schommer N, Hellhammer D [1995]. Persistent high cortisol responses to repeated psychological stress in a subpopulation of healthy men. Psychosom Med 57:468-474.
13. CFR [1992]. 29 CFR 1910.95. Code of Federal regulations. Washington, DC: U.S. Government Printing Office, Office of the Federal Register.
14. NIOSH [1998]. Criteria for a recommended standard: Occupational noise exposure (Revised criteria 1998). Cincinnati, OH: U.S. Department of Health and Human Services, Public Health Service, Centers for Disease Control and Prevention, National Institute for Occupational Safety and Health, DHHS (NIOSH) Publication No. 98-126.
15 ACGIH® [2001]. 2001 TLVs® and BEIs®: threshold limit values for chemical substances and physical agents. Cincinnati, OH: American Conference of Governmental Industrial Hygienists.
16. Beranek LL [1989]. Balanced noise criterion (NCB) curves. J Acoust Soc Am 86(2):650-664.
17. Beranek LL [1988]. Criteria for noise and vibration in communities, buildings, and vehicles. Noise and Vibration Control, Rev. ed.,
Health Hazard Evaluation Report No. 97-0137-3026 Page 13
pp. 554-623. L.L. Beranek, Ed., Cambridge, Massachusetts: Institute of Noise Control Engineering.
18. American National Standards Institute [1995]. American national standard: criteria for evaluating room noise (ANSI S12.2-1995). New York, New York: Acoustical Society of America.
19. Ockenfels, MC, Porter L, Smyth J, Kirschbaum C, Hellhammer DH, Stone AA [1995]. Effect of chronic stress associated with unemployment on salivary cortisol: overall cortisol levels, diurnal rhythm, and acute stress reactivity. Psychosom Med 57:460-467.
20.. Kirschbaum C, Hellhammer DK [1989]. Salivary cortisol in psychobiological research: an overview. Neuropsychobiology 22:150-169.
21. National Institute of Mental Health [2000]. The effects of depression in the workplace. [http://www.nimh.nih.gov/publicat/depression.cfm]. Retrieved October 2006.
22 Kessler RC, Chiu WT, Demler O, Walters EE [2005]. Prevalence, severity, and comorbidity of twelve-month DSM-IV disorders in the national comorbidity survey replication (NCS-R). Arch Gen Psychiatry Jun;62(6):617-627.
23. Kristensen TS [1991]. Sickness absence and work strain among Danish slaughterhouse workers: an analysis of absence from work regarded as coping behavior. Soc Sci Med 31:1:15-27.
24. Vaananen A, Toppinen TS, Kalima R, Mutanen P, Vahtera J, Peiro JM [2003]. Job characteristics, physical and psychological symptoms and social support as antecedents of sickness absence among men and women in the private sector. Soc Sci Med 57: 5; 807-824.
25. O’Brien-Pallas L, Shamian J, Thomson D, Alksnis C, Koehoorn M, Kerr M, Bruce S [2004]. Work related disability in Canadian Nurses. J Nurs Scholarsh 36(4):352-357.
26. Pines A, Skulkeo K, Pollak E, Peritz E, Steif J [1985]. Rates of sickness absenteeism among employees of a modern hospital: the role of demographic and occupational factors. Brit J Ind Med 42:326-335.
27. Ward WD [1986]. Auditory effects of noise. In: Berger EH, Ward WD, Morrill JC, Royster LH, eds. Noise & hearing conservation manual. 4th ed. Akron, OH: American Industrial Hygiene Association, p. 197.
28. Keir PJ, Wells RP [2002]. The effect of posture on wrist extensor muscle loading. Hum Factors 44(3):392-403.
29. Roquelaure Y, Raumbeau G, Dano C, Martin YH, Pelier-Cady MC, Mechali S, Benetti F, Mariel J, Fanello S, Penneau-Fontbonne D [2000]. Occupational risk factors for radial tunnel syndrome in industrial workers. Scan J Work Environ Health 26(6):507-513.
30. Bergqvist U, Wolgast E, Nilsson B, Voss M [1995]. Musculoskeletal disorders among visual display terminal workers: individual, ergonomic, and work organizational factors. Ergonomics 38(4):763-776.
Health Hazard Evaluation Report No. 97-0137-3026 Page 14
TABLES Table 1
Recommended Space Usage for Balanced Noise Criteria Range in Occupied Indoor Areas
Type of Space and Acoustical Requirements
NCB Curve
Concert halls, opera houses, and recital halls 10 - 15
Large auditoriums, large drama theaters, and large churches
Not to exceed 20
Small auditoriums, small theaters, small churches, music rehearsal rooms, large meeting and conference rooms, and executive offices
Not to exceed 30
Bedrooms, hospitals, residences, apartments, hotels
25 - 40
Private or semi-private offices, small conference rooms, classrooms, libraries
30 - 40
Large offices, reception areas, retail shops and stores, cafeterias, restaurants
35 - 45
Lobbies, laboratory work spaces, drafting and engineering rooms, general secretarial areas
40 - 50
Light maintenance shops, industrial plant control rooms, office and computer equipment rooms, kitchens, and laundries
45 - 55
Shops, garages 50 - 60 *
Work spaces where speech or telephone communication is not required
55 - 70
* Levels above NCB-60 are not recommended for any office or communication situation.
Health Hazard Evaluation Report No. 97-0137-3026 Page 15
Table 2
Responses to the question “The best part of my job is....”
Response Percent (number responding)
Helping the public 47 (236)
My paycheck 25 (127)
The people I work with 20 (101)
Other 4 (21)
Working with the police 2 (11)
How we are valued as employees 0.6 (3)
Table 3 Responses to the question
“The worst part of my job is....”
Response Percent (number responding)
How we are valued as employees 71 (354)
My supervisor 9 (45)
My paycheck 7 (34)
Working with the police 4 (21)
The people I work with 4 (20)
Helping the public 0.6 (3)
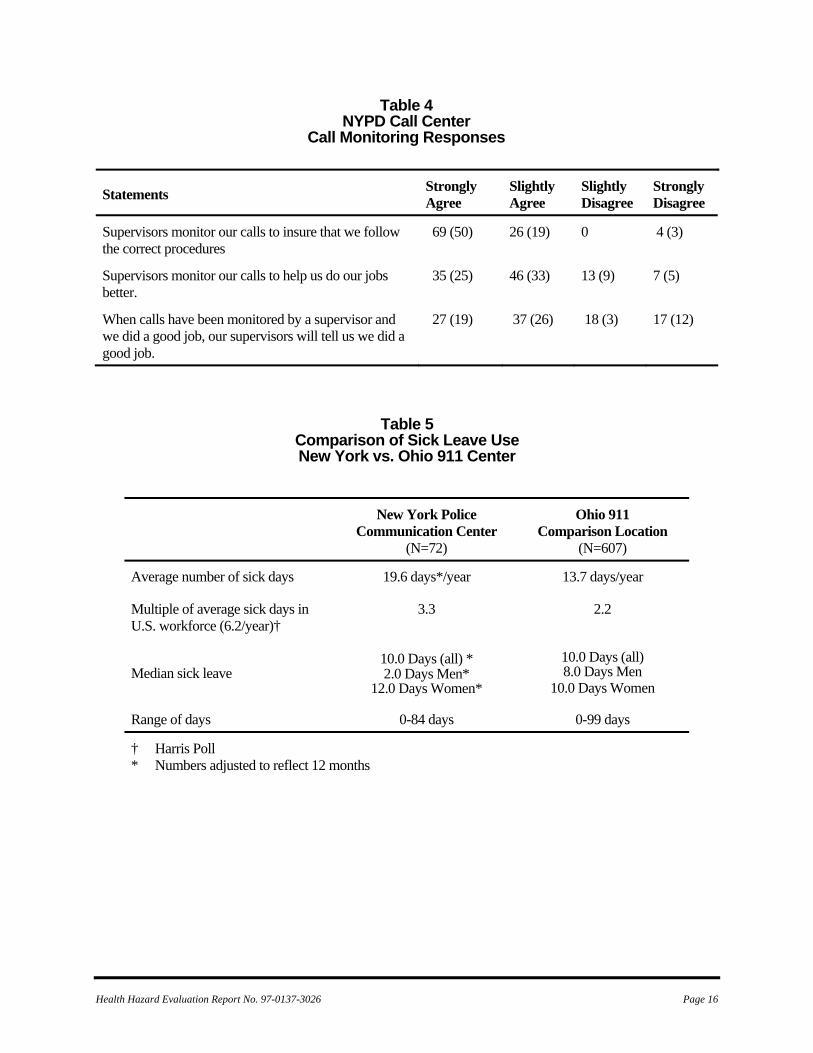
Table 4NYPD Call Center
Call Monitoring Responses
Statements Strongly Agree
Slightly Agree
Slightly Disagree
Strongly Disagree
Supervisors monitor our calls to insure that we follow the correct procedures
69 (50)
26 (19) 0 4 (3)
Supervisors monitor our calls to help us do our jobs better.
35 (25)
46 (33) 13 (9) 7 (5)
When calls have been monitored by a supervisor and we did a good job, our supervisors will tell us we did a good job.
27 (19) 37 (26) 18 (3) 17 (12)
Table 5 Comparison of Sick Leave Use New York vs. Ohio 911 Center
New York Police Communication Center
(N=72)
Ohio 911 Comparison Location
(N=607)
Average number of sick days 19.6 days*/year 13.7 days/year
Multiple of average sick days in U.S. workforce (6.2/year)†
3.3 2.2
10.0 Days (all) 10.0 Days (all) * 2.0 Days Men*
12.0 Days Women* 8.0 Days Men Median sick leave
10.0 Days Women
Range of days 0-84 days 0-99 days
† Harris Poll * Numbers adjusted to reflect 12 months
Health Hazard Evaluation Report No. 97-0137-3026 Page 16
Health Hazard Evaluation Report No. 97-0137-3026 Page 17
Table 6
Responses to Job Satisfaction Questions
Question Response New York Police Communication
Center (n=72)
Ohio 911 Comparison
Location (n=607)
Knowing what you do now, if you had to decide all over again whether to take the type of job you now have, what would you decide?
Decide without hesitation to take same job Have some second thoughts Decide definitely NOT to take this type of job
29.6 (21)
50.7 (36)
19.7 (14)
12.4 (62)
59.6 (298)
28 (140)
If a friend of yours told you he/she was interested in working in a job like yours, what would you tell him/her?
I would strongly recommend it. Have doubts about recommending it. Advise against it.
21.1 (15)
56.3 (40)
33.2 (16)
8.6 (43)
58.2 (291)
33.2 (166)
All in all, how satisfied would you say you are with your job?
Very Satisfied Somewhat satisfied Not too satisfied Not at all satisfied
11.4 (8)
58.6 (41)
25.7 (18)
4.3 (3)
3.81 (19)
44.3 (221)
32.1 (160)
19.8 (99)
Table 7
New York Police Communication Center Multivariate model: Job Satisfaction
Variable Odds Ratio 95% CI*
Workload 3.02 1.52, 3.24
More than 6 months since vacation 2.21 1.11, 8.62
CI = Confidence Interval
Health Hazard Evaluation Report No. 97-0137-3026 Page 18
Table 8
New York Police Communication Center
Univariate Model: Symptoms of Major Depression
Variable Odds Ratio 95% CI
Anxiety 8.36 5.51, 12.87 Workload 4.11 1.54, 12.09 Low job satisfaction 3.61 2.51, 5.21
Musculoskeletal pain 3.26 1.72, 6.75
Low social well being 2.97 2.06, 4.31
Greater than 6 mo. since vacation
2.74 1.88, 4.04
Low social contact 2.23 1.56, 3.18
Low group participation 2.15 1.52, 3.04
Age 2.00 1.41, 2.84 Years worked for the city 1.90 1.28, 2.80
Low supervisory social support 1.83 1.16, 2.94
Work status 1.62 1.08, 2.41
CI = Confidence Interval
Health Hazard Evaluation Report No. 97-0137-3026 Page 19
Table 9 New York Police Communication Center
Univariate Model: Anxiety
Variable Odds Ratio 95% CI
Muscle pain lasting more than a week in the last year
6.33 2.27, 17.88
Job satisfaction 3.52 2.37, 5.22 More than 6 mo. since last vacation 2.50 1.63, 3.84
Teens in household 2.45 1.60, 3.74 Low social well being 2.03 1.36, 3.02
Age (older) 1.98 1.35, 2.90 Low levels of social contact 1.95 1.32, 2.88
High workload 1.89 0.68, 5.21 Years worked for the city 1.86 1.22, 2.82
Low levels of group participation 1.72 1.18, 2.52
Low supervisory social support 1.61 0.98, 2.74
CI = Confidence Interval
Health Hazard Evaluation Report No. 97-0137-3026 Page 20
Table 10 New York Communications Center
Prevalence and severity of musculoskeletal pain among participants
Muscular Pain Location % Reporting (Number) Average Severity *
Low Back 53 (38) 2.94
Left Shoulder 43 (31) 2.70
Right Wrist 43 (30) 1.96
Left Wrist 43 (30) 1.80
Right Shoulder 40 (29) 2.62
Upper Back 40 (29) 2.31
Left Hip/Thigh 33 (24) 1.60
Right Elbow 31 (22) 1.59
Right Hip/Thigh 31 (22) 1.22
Left Lower Leg 29 (21) 1.47
Right Lower Leg 29 (21) 1.38
Neck 29 (21) 1.47
*Range 0-5 with 0=no pain and 5=worst imaginable
Health Hazard Evaluation Report No. 97-0137-3026 Page 21
Table 11
New York Police Communication Center Univariate Model: Musculoskeletal Pain
Variable Odds Ratio
95% CI
Anxiety 4.54 2.89, 1.15
Depression 3.26 1.72, 6.75
Low job satisfaction 2.53 1.38, 5.00
Low supervisory social support
2.57
1.48, 4.42
Highest quartile of sick leave use
2.29 1.15, 5.16
CI = Confidence Interval
FIGURES
14 13 11 10 8 6 5 3 2
15 147912
Figure 1Pod Locations911 Call Center
New York City Police DepartmentHETA 97-0137
Supervisor Position
Supervisor Position
Supervisor Position
OBSERVATION DECKAll pods have six positions except #8 with three positions
Health Hazard Evaluation Report No. 97-0137-3026 Page 22
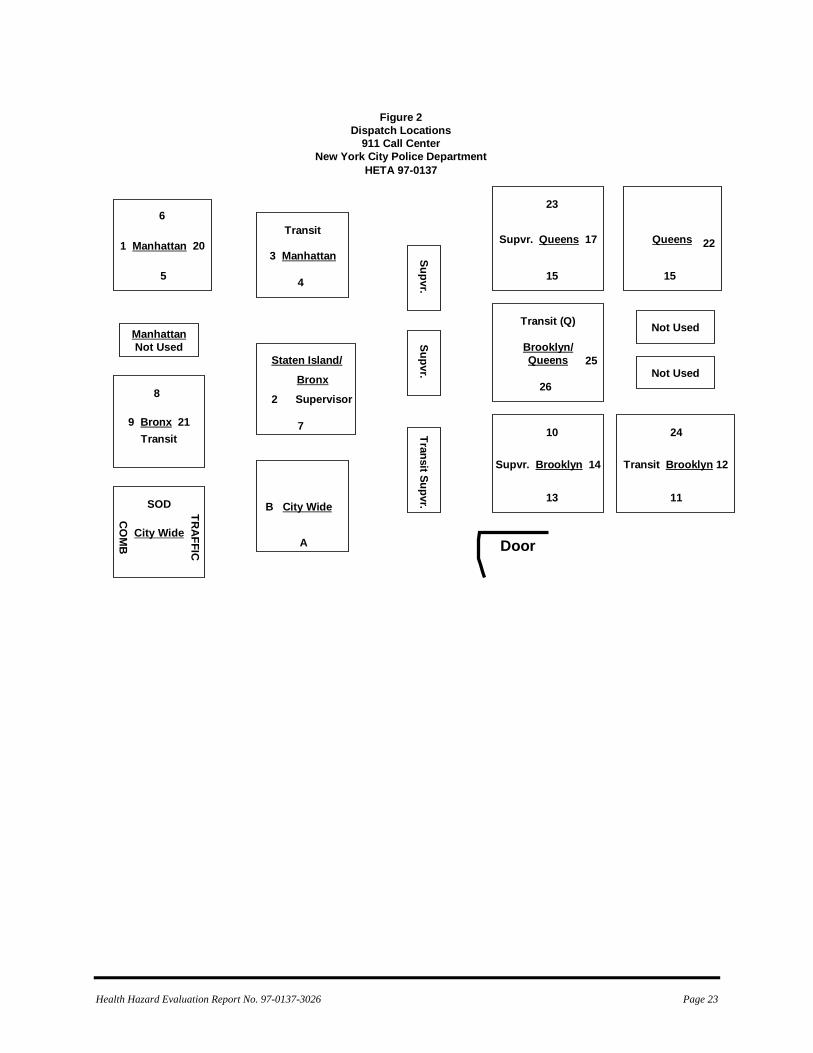
Figure 2Dispatch Locations
911 Call CenterNew York City Police Department
HETA 97-0137
1 Manhattan 20
Supvr. Brooklyn 14
Brooklyn/Queens
Supvr. Queens 17
Transit Brooklyn 12
Not Used
Not Used
Queens
ManhattanNot Used
9 Bronx 21
City Wide
B City Wide
3 Manhattan
Door
6
5
8
Transit
CO
MB
TRAFFIC
SOD
Transit
4
Staten Island/
Bronx
2 Supervisor
7
A
Supvr.Supvr.
Transit Supvr.
23
15
Transit (Q)
25
26
10
13
22
15
24
11
Health Hazard Evaluation Report No. 97-0137-3026 Page 23
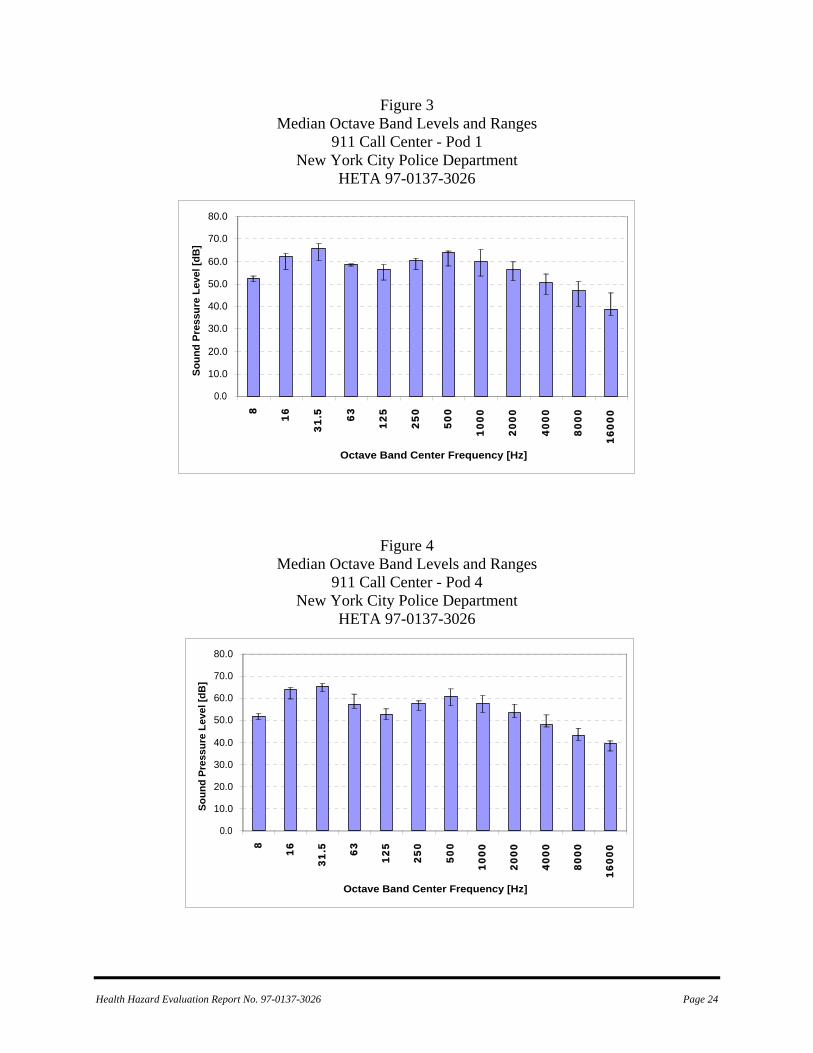
Figure 3 Median Octave Band Levels and Ranges
911 Call Center - Pod 1 New York City Police Department
HETA 97-0137-3026
0.0
10.0
20.0
30.0
40.0
50.0
60.0
70.0
80.0
8
16
31.5 63
125
250
500
1000
2000
4000
8000
1600
0
Octave Band Center Frequency [Hz]
Soun
d Pr
essu
re L
evel
[dB
]
Figure 4 Median Octave Band Levels and Ranges
911 Call Center - Pod 4 New York City Police Department
HETA 97-0137-3026
0.0
10.0
20.0
30.0
40.0
50.0
60.0
70.0
80.0
8
16
31.5 63
125
250
500
1000
2000
4000
8000
1600
0
Octave Band Center Frequency [Hz]
Soun
d Pr
essu
re L
evel
[dB
]
Health Hazard Evaluation Report No. 97-0137-3026 Page 24
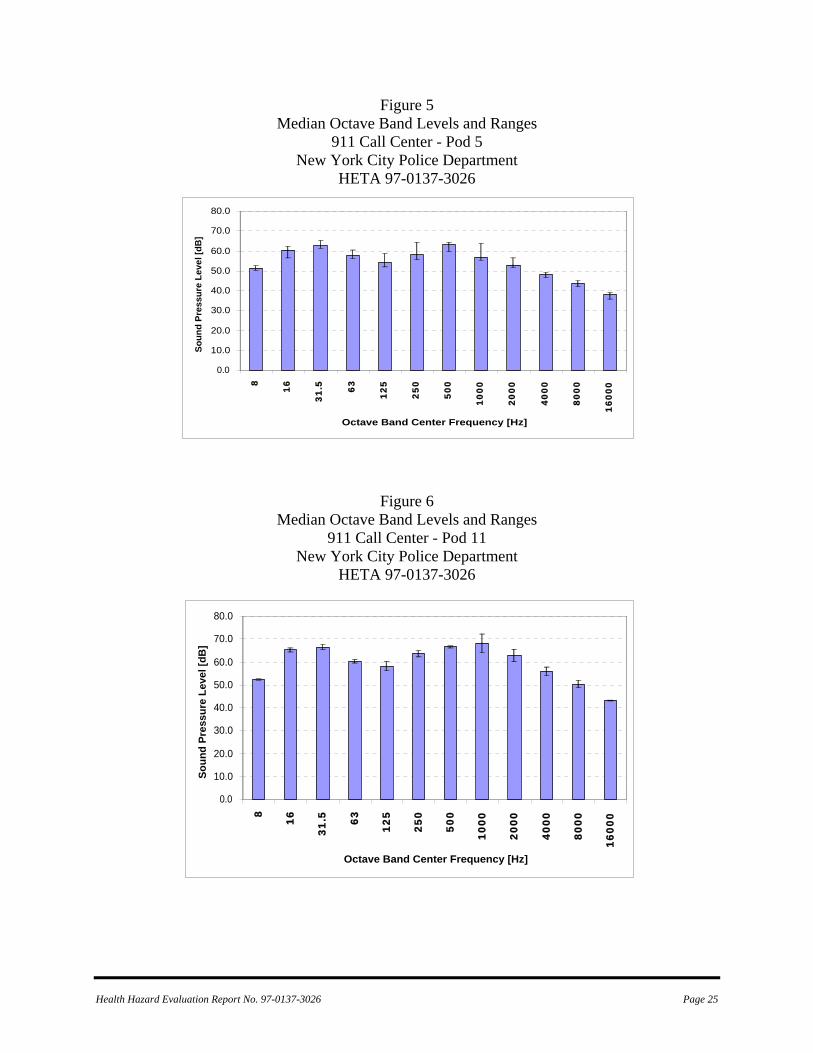
Figure 5 Median Octave Band Levels and Ranges
911 Call Center - Pod 5 New York City Police Department
HETA 97-0137-3026
0.0
10.0
20.0
30.0
40.0
50.0
60.0
70.0
80.0
8
16
31.5 63
125
250
500
1000
2000
4000
8000
1600
0
Octave Band Center Frequency [Hz]
Soun
d Pr
essu
re L
evel
[dB
]
Figure 6
Median Octave Band Levels and Ranges 911 Call Center - Pod 11
New York City Police Department HETA 97-0137-3026
0.0
10.0
20.0
30.0
40.0
50.0
60.0
70.0
80.0
8
16
31.5 63
125
250
500
1000
2000
4000
8000
1600
0
Octave Band Center Frequency [Hz]
Soun
d Pr
essu
re L
evel
[dB
]
Health Hazard Evaluation Report No. 97-0137-3026 Page 25
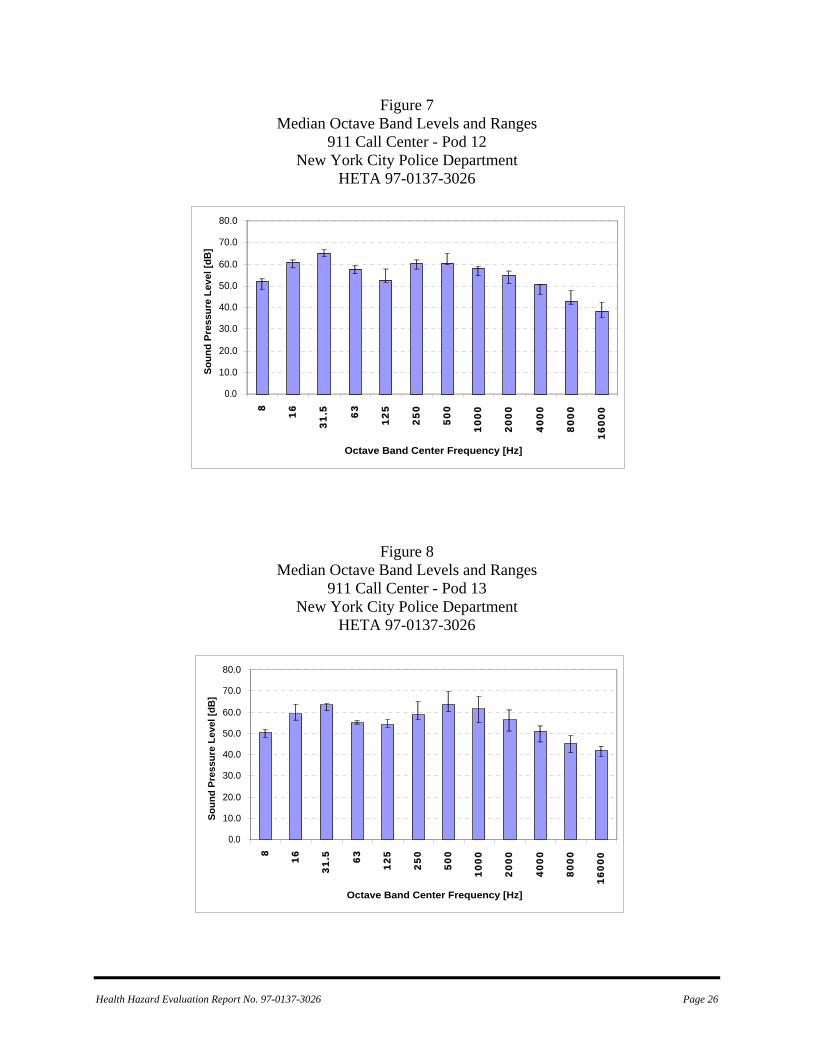
Figure 7 Median Octave Band Levels and Ranges
911 Call Center - Pod 12 New York City Police Department
HETA 97-0137-3026
0.0
10.0
20.0
30.0
40.0
50.0
60.0
70.0
80.0
8
16
31.5 63
125
250
500
1000
2000
4000
8000
1600
0
Octave Band Center Frequency [Hz]
Soun
d Pr
essu
re L
evel
[dB
]
Figure 8
Median Octave Band Levels and Ranges 911 Call Center - Pod 13
New York City Police Department HETA 97-0137-3026
0.0
10.0
20.0
30.0
40.0
50.0
60.0
70.0
80.0
8
16
31.5 63
125
250
500
1000
2000
4000
8000
1600
0
Octave Band Center Frequency [Hz]
Soun
d Pr
essu
re L
evel
[dB
]
Health Hazard Evaluation Report No. 97-0137-3026 Page 26
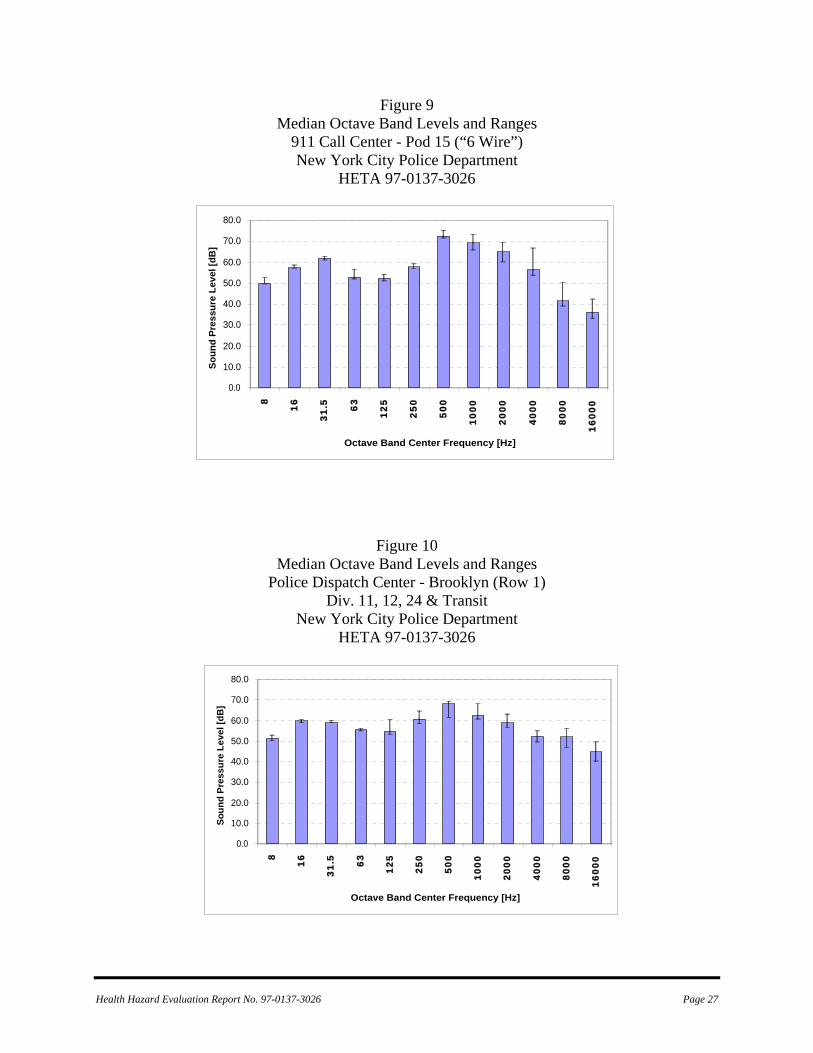
Figure 9 Median Octave Band Levels and Ranges
911 Call Center - Pod 15 (“6 Wire”) New York City Police Department
HETA 97-0137-3026
0.0
10.0
20.0
30.0
40.0
50.0
60.0
70.0
80.0
8
16
31.5 63
125
250
500
1000
2000
4000
8000
1600
0
Octave Band Center Frequency [Hz]
Soun
d Pr
essu
re L
evel
[dB
]
Figure 10 Median Octave Band Levels and Ranges
Police Dispatch Center - Brooklyn (Row 1) Div. 11, 12, 24 & Transit
New York City Police Department HETA 97-0137-3026
0.0
10.0
20.0
30.0
40.0
50.0
60.0
70.0
80.0
8
16
31.5 63
125
250
500
1000
2000
4000
8000
1600
0
Octave Band Center Frequency [Hz]
Soun
d Pr
essu
re L
evel
[dB
]
Health Hazard Evaluation Report No. 97-0137-3026 Page 27
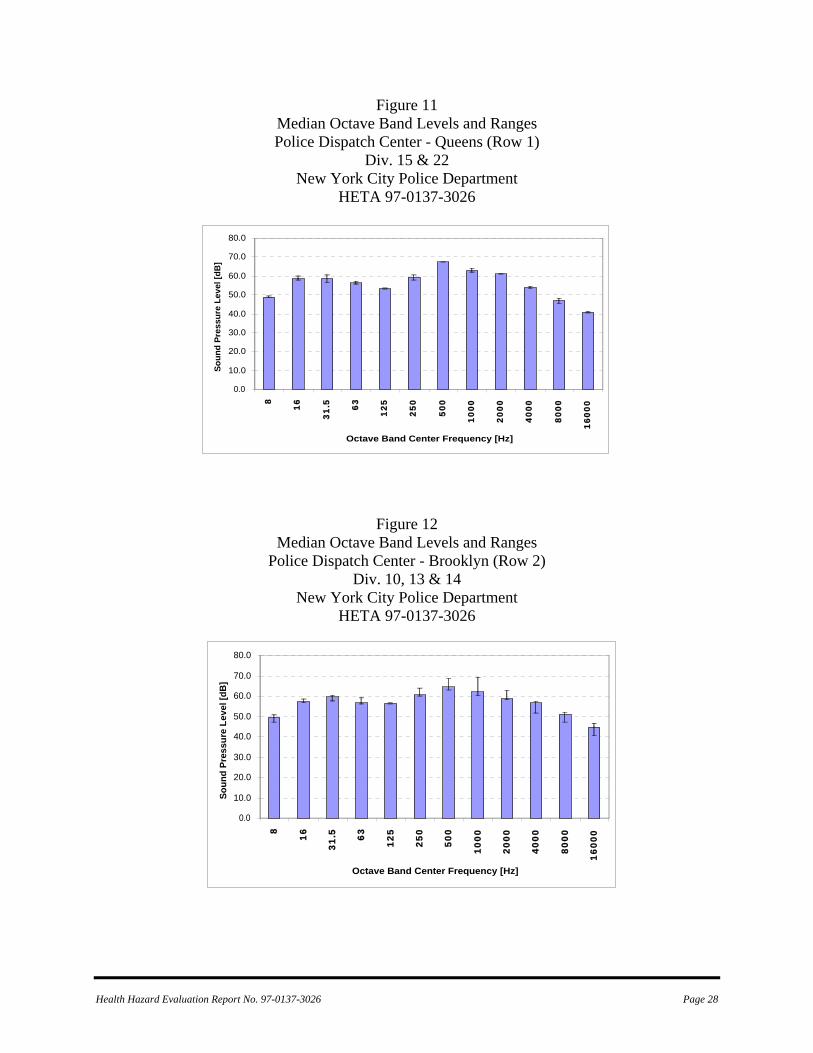
Figure 11 Median Octave Band Levels and Ranges Police Dispatch Center - Queens (Row 1)
Div. 15 & 22 New York City Police Department
HETA 97-0137-3026
0.0
10.0
20.0
30.0
40.0
50.0
60.0
70.0
80.0
8
16
31.5 63
125
250
500
1000
2000
4000
8000
1600
0
Octave Band Center Frequency [Hz]
Soun
d Pr
essu
re L
evel
[dB
]
Figure 12 Median Octave Band Levels and Ranges
Police Dispatch Center - Brooklyn (Row 2) Div. 10, 13 & 14
New York City Police Department HETA 97-0137-3026
0.0
10.0
20.0
30.0
40.0
50.0
60.0
70.0
80.0
8
16
31.5 63
125
250
500
1000
2000
4000
8000
1600
0
Octave Band Center Frequency [Hz]
Soun
d Pr
essu
re L
evel
[dB
]
Health Hazard Evaluation Report No. 97-0137-3026 Page 28
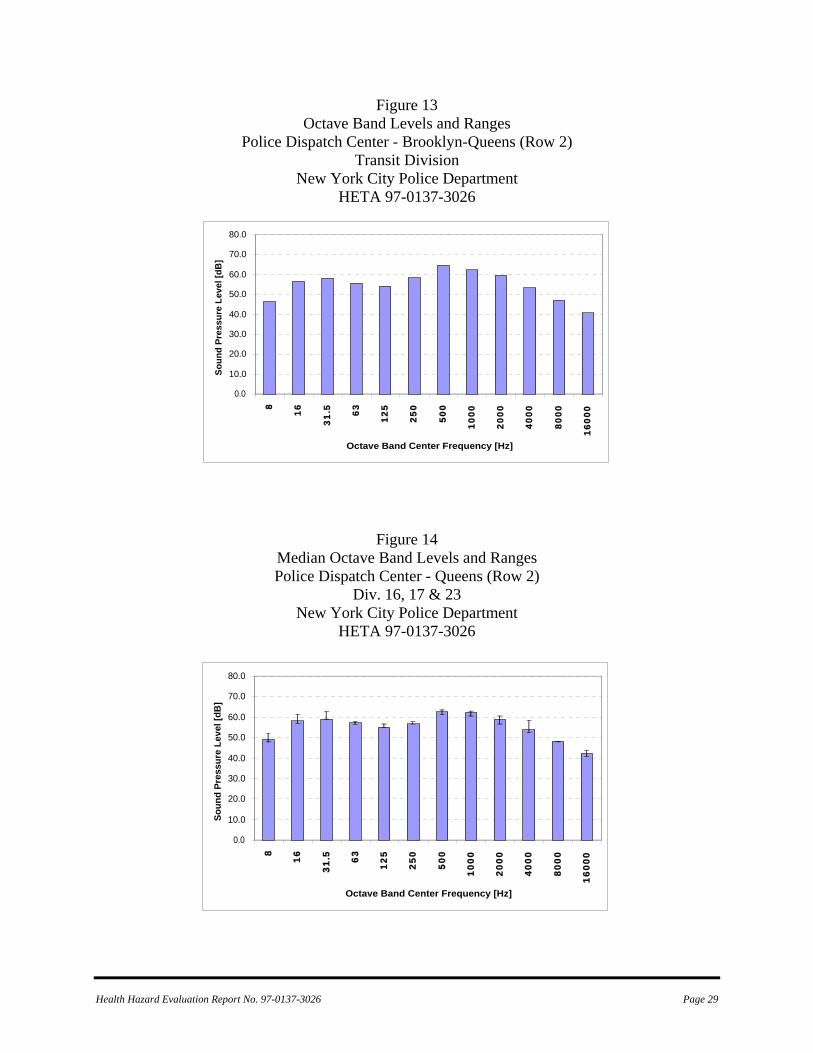
Figure 13 Octave Band Levels and Ranges
Police Dispatch Center - Brooklyn-Queens (Row 2) Transit Division
New York City Police Department HETA 97-0137-3026
0.0
10.0
20.0
30.0
40.0
50.0
60.0
70.0
80.0
8
16
31.5 63
125
250
500
1000
2000
4000
8000
1600
0
Octave Band Center Frequency [Hz]
Soun
d Pr
essu
re L
evel
[dB
]
Figure 14 Median Octave Band Levels and Ranges Police Dispatch Center - Queens (Row 2)
Div. 16, 17 & 23 New York City Police Department
HETA 97-0137-3026
0.0
10.0
20.0
30.0
40.0
50.0
60.0
70.0
80.0
8
16
31.5 63
125
250
500
1000
2000
4000
8000
1600
0
Octave Band Center Frequency [Hz]
Soun
d Pr
essu
re L
evel
[dB
]
Health Hazard Evaluation Report No. 97-0137-3026 Page 29
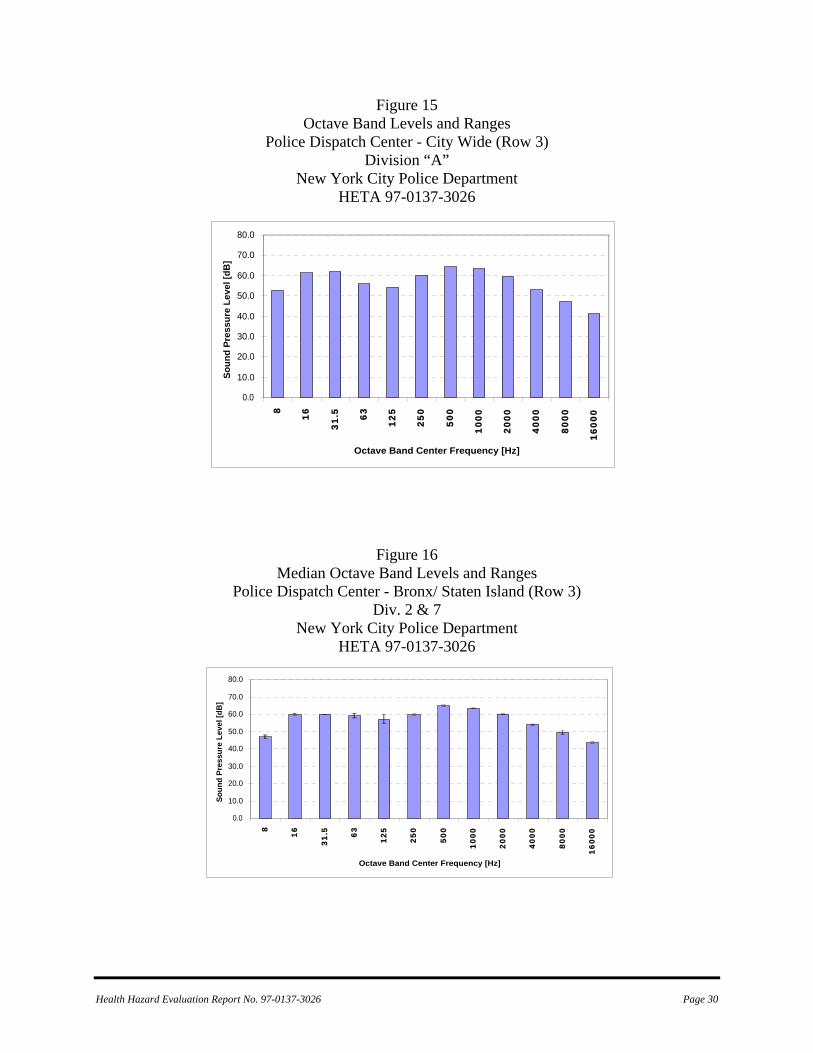
Figure 15 Octave Band Levels and Ranges
Police Dispatch Center - City Wide (Row 3) Division “A”
New York City Police Department HETA 97-0137-3026
0.0
10.0
20.0
30.0
40.0
50.0
60.0
70.0
80.0
8
16
31.5 63
125
250
500
1000
2000
4000
8000
1600
0
Octave Band Center Frequency [Hz]
Soun
d Pr
essu
re L
evel
[dB
]
Figure 16 Median Octave Band Levels and Ranges
Police Dispatch Center - Bronx/ Staten Island (Row 3) Div. 2 & 7
New York City Police Department HETA 97-0137-3026
0.0
10.0
20.0
30.0
40.0
50.0
60.0
70.0
80.0
8
16
31.5 63
125
250
500
1000
2000
4000
8000
1600
0
Octave Band Center Frequency [Hz]
Soun
d Pr
essu
re L
evel
[dB
]
Health Hazard Evaluation Report No. 97-0137-3026 Page 30
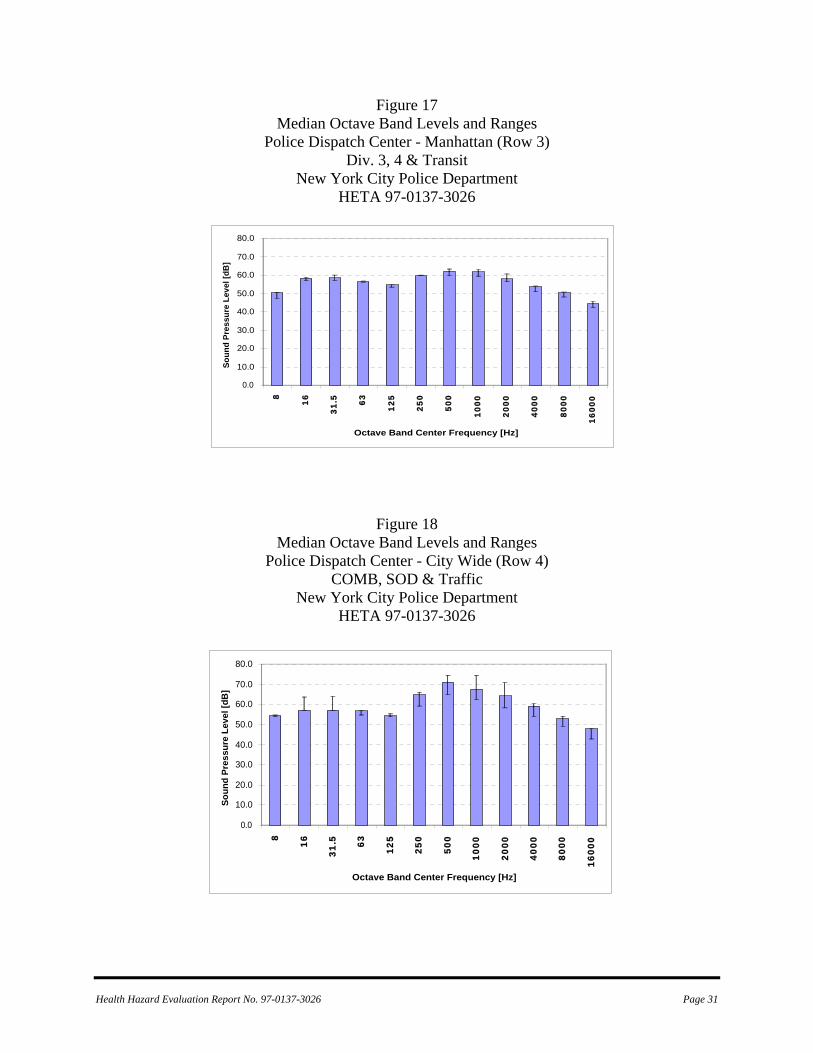
Figure 17 Median Octave Band Levels and Ranges
Police Dispatch Center - Manhattan (Row 3) Div. 3, 4 & Transit
New York City Police Department HETA 97-0137-3026
0.0
10.0
20.0
30.0
40.0
50.0
60.0
70.0
80.0
8
16
31.5 63
125
250
500
1000
2000
4000
8000
1600
0
Octave Band Center Frequency [Hz]
Soun
d Pr
essu
re L
evel
[dB
]
Figure 18
Median Octave Band Levels and Ranges Police Dispatch Center - City Wide (Row 4)
COMB, SOD & Traffic New York City Police Department
HETA 97-0137-3026
0.0
10.0
20.0
30.0
40.0
50.0
60.0
70.0
80.0
8
16
31.5 63
125
250
500
1000
2000
4000
8000
1600
0
Octave Band Center Frequency [Hz]
Soun
d Pr
essu
re L
evel
[dB
]
Health Hazard Evaluation Report No. 97-0137-3026 Page 31
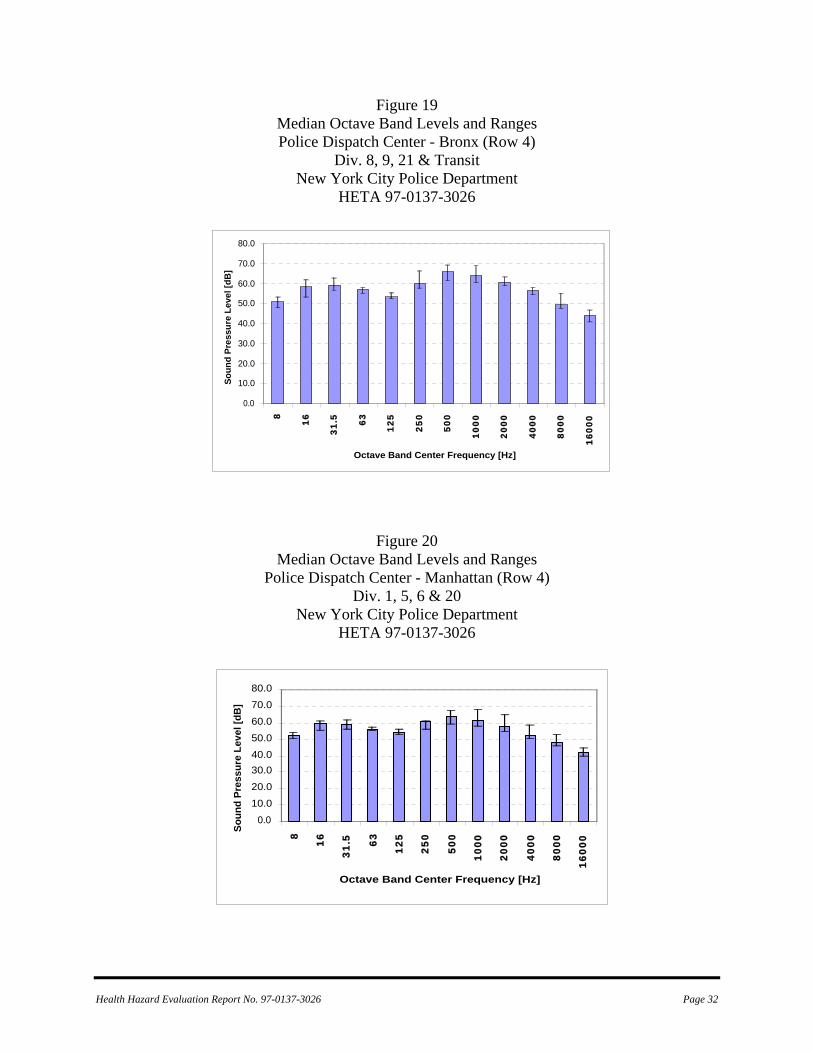
Figure 19 Median Octave Band Levels and Ranges Police Dispatch Center - Bronx (Row 4)
Div. 8, 9, 21 & Transit New York City Police Department
HETA 97-0137-3026
0.0
10.0
20.0
30.0
40.0
50.0
60.0
70.0
80.0
8
16
31.5 63
125
250
500
1000
2000
4000
8000
1600
0
Octave Band Center Frequency [Hz]
Soun
d Pr
essu
re L
evel
[dB
]
Figure 20
Median Octave Band Levels and Ranges Police Dispatch Center - Manhattan (Row 4)
Div. 1, 5, 6 & 20 New York City Police Department
HETA 97-0137-3026
0.010.020.030.040.050.060.070.080.0
8
16
31.5 63
125
250
500
1000
2000
4000
8000
1600
0
Octave Band Center Frequency [Hz]
Soun
d Pr
essu
re L
evel
[dB
]
Health Hazard Evaluation Report No. 97-0137-3026 Page 32
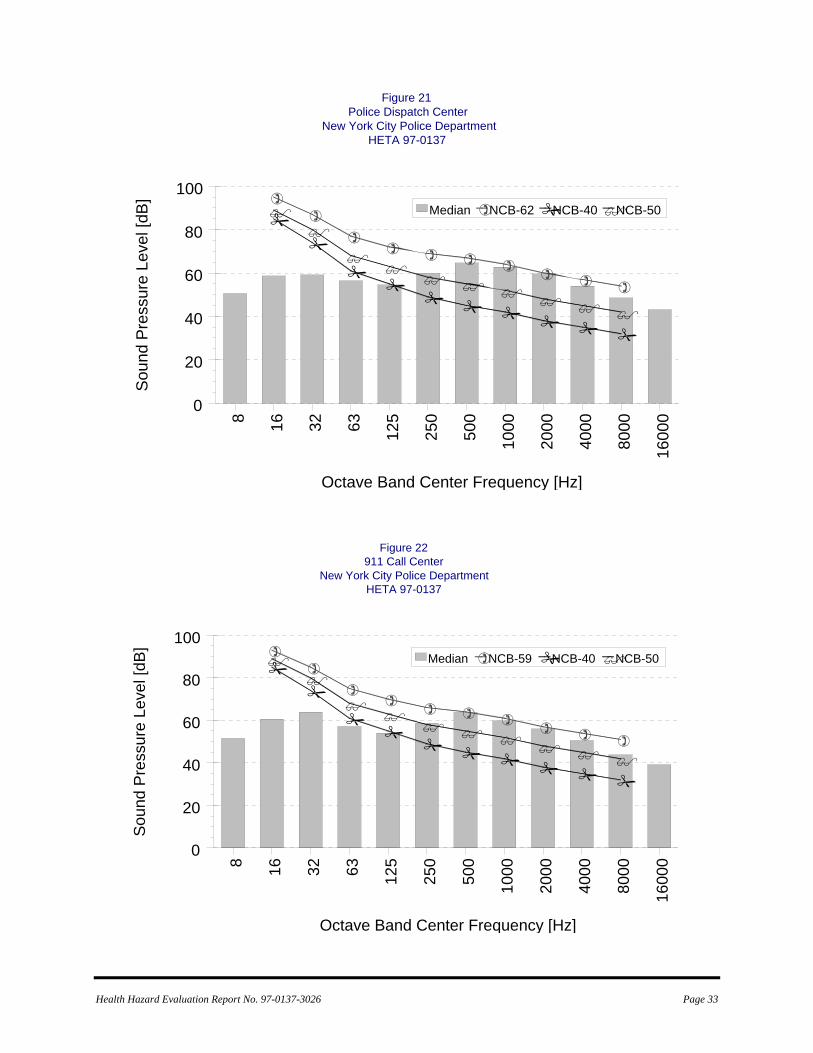
Health Hazard Evaluation Report No. 97-0137-3026 Page 33
8 16 32 63 125
250
500
1000
Octave Band Center Fre
2000
4000
8000
1600
0
quency [Hz]
0
20
40
60
80
100
Sou
nd P
ress
ure
Leve
l [dB
]
Median NCB-62 NCB-40 NCB-50
Figure 21Police Dispatch Center
New York City Police DepartmentHETA 97-0137
8 16 32 63 125
250
500
1000
Octave Band Center Fre
2000
4000
8000
1600
0
0
20
40
60
80
100
Sou
nd P
ress
ure
Leve
l [dB
]
Figure 22911 Call Center
New York City Police DepartmentHETA 97-0137
Median NCB-59 NCB-40 NCB-50
quency [Hz]
DEPARTMENT OF HEALTH AND HUMAN SERVICES Centers for Disease Control and Prevention National Institute for Occupational Safety and Health 4676 Columbia Parkway Cincinnati, OH 45226-1998 OFFICIAL BUSINESS Penalty for private use $300
Delivering on the Nation's promise: Safety and Health at work for all people
through research and prevention
To receive NIOSH documents or information about occupational Safety and Health topics
contact NIOSH at:
1-800-35-NIOSH (356-4674) Fax: 1-513-533-8573
E-mail: [email protected] visit the NIOSH web site at:
www.cdc.gov/niosh/homepage.html S A F E R • H E A L T H I E R • P E O P L E™