Embed Size (px)
Citation preview
Engineering Structures 150 (2017) 12–24
Contents lists available at ScienceDirect
Engineering Structures
journal homepage: www.elsevier .com/locate /engstruct
High-cycle fatigue life prediction of reinforced concrete deep beams
http://dx.doi.org/10.1016/j.engstruct.2017.07.0310141-0296/� 2017 Elsevier Ltd. All rights reserved.
⇑ Corresponding author at: M6J 1K1, 121 Wolseley st, Toronto, Ontario, Canada.E-mail address: [email protected] (B. Isojeh).
Benard Isojeh a,⇑, Maria El-Zeghayar b, Frank J. Vecchio a
aUniversity of Toronto, Civil Engineering Department, CanadabCivil Engineer in the Renewable Power Business Unit at Hatch Ltd, Canada
a r t i c l e i n f o
Article history:Received 14 October 2016Revised 18 June 2017Accepted 11 July 2017Available online 20 July 2017
Keywords:Strut and tieFatigueFracture mechanicsStrain-lifeHigh-cycleDamage
a b s t r a c t
Concrete elements deteriorate as a result of continuous application of compressive fatigue loads.Irreversible deformation accumulates; hence, the effect on embedded steel reinforcing bars capacityand concrete resistance should be accounted for in the fatigue analysis of concrete structures.Experimental investigations were conducted to study the fatigue behaviour of eight small-scale reinforcedconcrete deep beams with a shear span to effective depth ratio of 1.25. Percentages of the diagonal crack-ing load from monotonic tests were used as fatigue loads. The deformation evolution within the shearspans of the deep beams were obtained by estimating the average principal and shear strain evolutionsfrom the strain transformation analysis of LVDT (Linear Variable Displacement Transformer) data. Mid-span deflections and reinforcement strain evolutions with proximity to a major concrete crack locationwere obtained. In all beams, failure occurred with fracture of the longitudinal reinforcement at the inter-section with the major concrete crack. Maximum strain evolutions for shear reinforcement measured atregions around the bends were observed to be lower than the strain evolutions observed in the longitudi-nal reinforcement. This was attributed to the governing arch mechanism common with deep beams.The strut and tie method was modified to predict the fatigue life of the deep beams tested by modifying
the constitutive models and effectiveness factor of concrete with fatigue damage models. To achieve this,the irreversible compressive fatigue strain in concrete is considered as a pseudo-load. The crack initiationlife and the progressive crack growth of steel reinforcement are accounted for using strain-life models andlinear elastic fracture mechanics, respectively. Within the developed algorithm, failure will occur whenone of the evolving forces in either the concrete strut or steel reinforcement approaches the correspondingresidual resistance capacity.
� 2017 Elsevier Ltd. All rights reserved.
1. Introduction
Investigations of the behaviour of reinforced concrete elementssubjected to fatigue loading began in the twentieth century. Due tocomplex observations in the performances of the constituentmaterials, further interests in this field of study have evolved. Fromprevious studies [1–3], failure of reinforced concrete elements dueto the fracture of reinforcement at their intersection with concretecracks, crushing of concrete, and excessive evolutions of diagonaltension cracks have been reported as modes of fatigue failure.
1.1. Mechanism of fatigue failure
The failure mechanisms observed in previous tests conductedon reinforced concrete beams were reported to be significantly
influenced by the shear span to effective depth ratio (a/d), thestress ratio (ratio of the minimum stress to maximum stress), thereinforcement ratio, and the magnitude of fatigue load [4–6]. Frac-ture of the tensile reinforcement was observed to occur within theregion of maximum moment within beams when subjected tosmaller fatigue loads. On the other hand, shear failure due to diag-onal cracking occurred under high fatigue loads [7]. The use of dif-ferent reinforcement ratios have also been reported to influencethe failure mechanisms [8]. For example, while lower reinforce-ment ratios are governed by the fracture of the reinforcement,heavily reinforced concrete members may fail due to crushing ofconcrete or diagonal tension cracks.
Reports on fatigue tests conducted on beams with shear rein-forcement and having shear span to effective depth ratios greaterthan 2.0 showed increases in the shear reinforcement strains asdiagonal or inclined cracks emanated [1–3]. The fatigue load trans-fer was described to involve a truss mechanism in which shearforces were transmitted by the shear reinforcement from one
B. Isojeh et al. / Engineering Structures 150 (2017) 12–24 13
surface of an inclined compressive strut to an adjacent strut.Depending on the average induced strains or stresses in the rein-forcement intersecting the diagonal cracks, localised crack growthin the shear reinforcement and widening of concrete cracksoccurred. Fracture of the shear reinforcement typically occurredthereafter. However, beams with shear span to effective depthratios lower than 2.0 were governed by arch mechanism and didnot exhibit shear reinforcement fracture at failure [9].
Okamura et al. [1], Okamura and Ueda [2], and Ueda [3]reported that the increase in the shear reinforcement strain wasproportional to the logarithm of the number of cycles leading tofracture, especially at bends. As the shear reinforcement fractured,collapse of the beams occurred where the remaining stirrup legsintersecting the widened inclined cracks were insufficient to with-stand the applied maximum fatigue load. As such, the fatigue beha-viour of shear reinforcement in terms of its maximum strainevolution up to yield was considered as a fatigue limit state. Mod-els developed and reported by Okamura et al. [1], Hawkins [4],Higai [9], and Ruhnau [10] for estimating the strain within a shearspan at any given cycle up to failure are used in the literature andcodes of practice for this purpose.
Fatigue failure of deep beams with shear span to effective depthratios of 1.0 and 1.5 were observed to fail under fatigue loading bycrushing of concrete compressive struts, diagonal tension, or frac-ture of longitudinal reinforcement. No fracture of shear reinforce-ment was observed in any of the specimens [5,6]. In the testsconducted by Teng et al. [6], high-strength deformed steel barsand plain round steel bars were used as shear reinforcement ineach shear span per beam. Results and crack patterns on both shearspans revealed no substantial difference. It was also observed thatthe shear reinforcement in the deep beams did not yield at failure.
An illustration of the behaviour of shear reinforcement in deepbeams under fatigue loading can be observed from Higai’s report[9] on moving load tests. According to Higai [9], as the distancebetween the moving load and the support reduced, the observedshear strength increased remarkably. Local compressive concretestresses were also observed to develop in the vertical directionwithin the shear span; hence, decreasing the principal tensilestress in the concrete. In addition, it was reported that strains instirrups decreased as the distance between the support regionand loading point reduced. These observations are analogous toclamping or transverse compression stresses in deep beams understatic loads [11,12]. However, further investigation is still requiredin order to understand the fatigue deformation of deep beams.
1.2. Design for fatigue resistance
Deep beam can be designed appropriately and conservativelyunder static loads using the strut and tie model. Basically, therequired concrete section sizes and amount of reinforcement(dimensions of load transfer path) are obtained from the stressesestimated from the static loading conditions at failure (UltimateLimit State) [13]. Under fatigue loading, the stresses induced inthe load transfer paths are estimated from the proposed or givenfatigue load (usually lower than the expected monotonic load atfailure). The stresses in these paths are further normalised withthe material strengths in order to obtain stress levels needed infatigue models. As a means of fatigue damage resistance verifica-tion, the normalized stresses from fatigue loads are implementedinto their corresponding fatigue stress-life models in order toobtain the number of cycles that will result in local deformationby crushing (in case of concrete) or fracture (in case of steel). Foran appropriate design, the number of cycles leading to failureobtained is ensured to be more than the number of cycles expectedfor service life. To achieve this, the volumes of materials (section
size and amount of reinforcement) are generally increased, if needbe [13].
The use of S-N models do not account for damage evolution ofthe structural element [14,15]. The norm in fatigue design ofstructures using stress-life models neglects the influence of irre-versible strain accumulation in concrete which may be significantin fatigue life prediction. Further, knowledge of the deformationevolution within the shear spans of deep beams in terms of shearstrains, principal tensile strains, and principal compressive strainsunder fatigue loading are expedient in understanding the beha-viour of deep beams under fatigue loading, since their resistancecapacities may be governed by the behaviour within the shearspans.
In this paper, the influence of load level, stress ratio, and longi-tudinal reinforcement ratio on the fatigue behaviour of deep beamswith shear-span to effective depth ratio of 1.25 are investigatedexperimentally. An approach is developed using strut and tie anal-ysis for predicting the fatigue life of deep beams. The evolution ofirreversible strain accumulation, concrete strength and stiffnessdegradation, and reinforcement crack growth are accounted forin this approach.
2. Experimental program
2.1. Test specimens
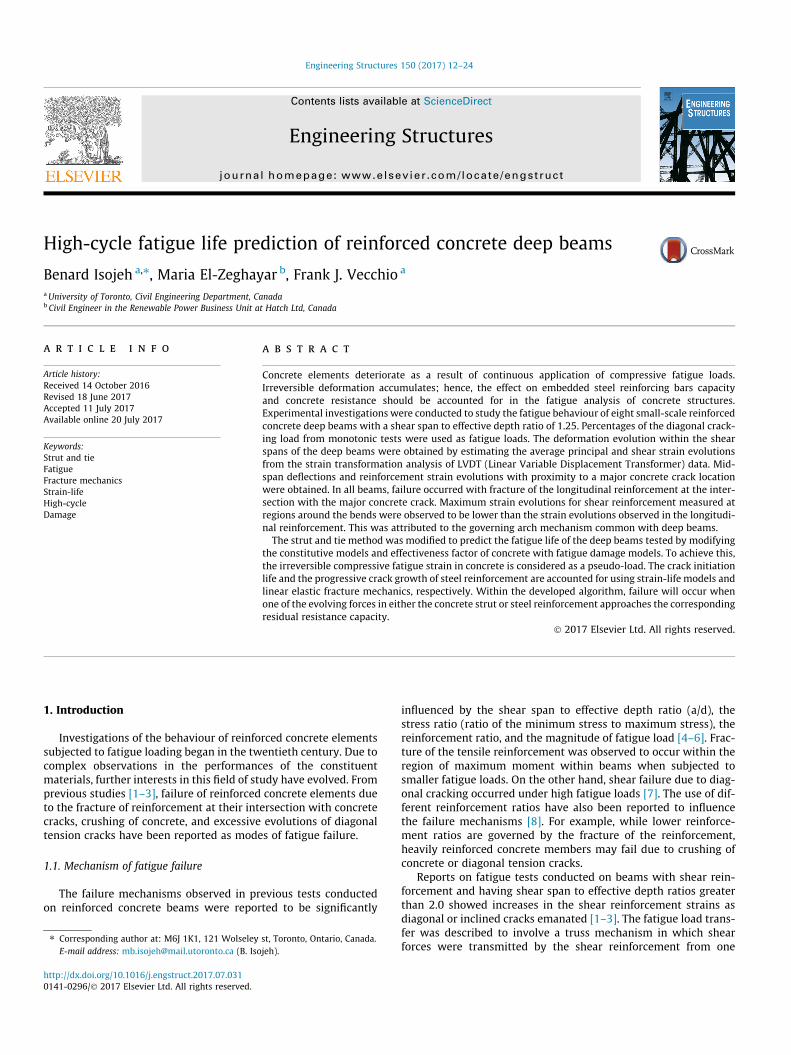
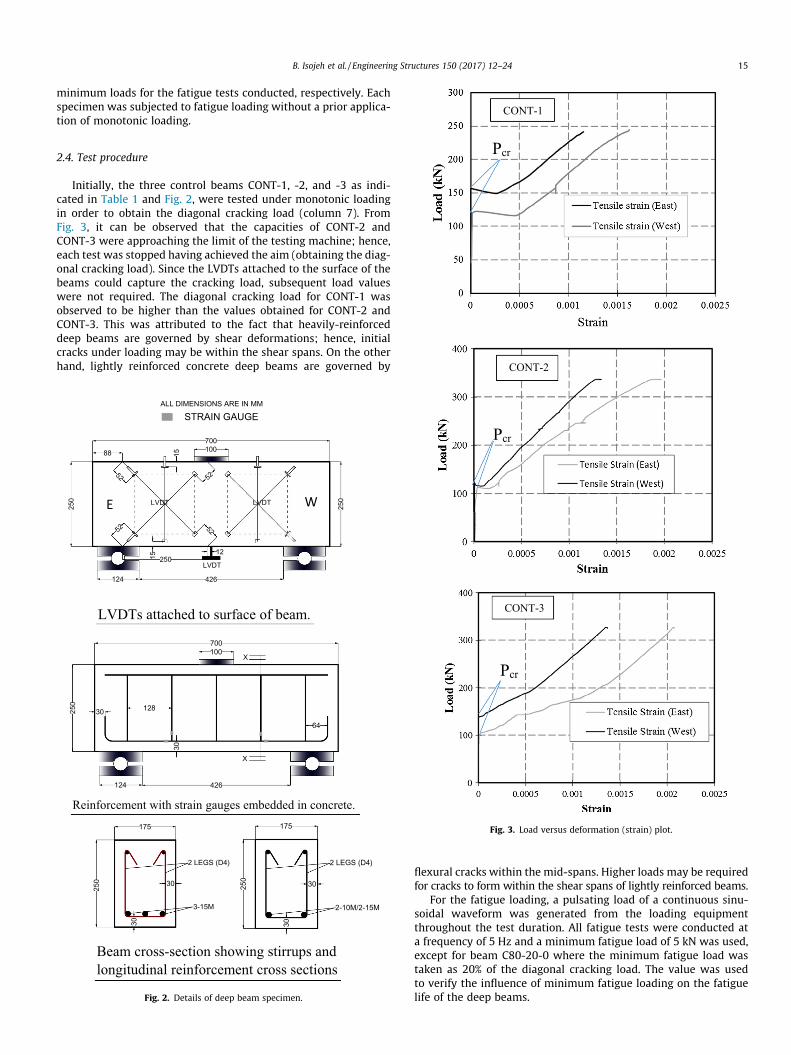
In this investigation, beams with dimensions of175 � 250 � 700 mm and an a/d value of 1.25 were used for fati-gue tests (Fig. 1). The properties of the beams tested are given inTable 1 (columns 1–7). The reinforcement provisions used for thebeams surpassed the minimum required in CSA A23.3-0411.2.8.1 and 11.2.8.2 for shear, 10.5.1.2 for flexure [16], EC-1-1(2004) 9.2.2 and 9.2.1.1 [17] for shear and flexure respectively,and ACI [18] Section R9.6.3.1 and R9.6.1.2 for shear and flexurerespectively.
Adequate anchorage was provided based on code requirementsin CSA- N12.13.1, N12.13.2 (shear reinforcement anchorage) [16],N12.5.2 (flexural reinforcement anchorage). The anchorage provi-sions also satisfied EC2-1-1 (2004) clause 8.5(1) and (2) for shearreinforcement and EC2-1-1 clause 8.4.1 (1) P for longitudinal rein-forcement [17]. ACI Table 25-3-1 and Table 25.3.2 [18] for longitu-dinal and shear reinforcement, respectively were also used asprovision benchmarks. Longitudinal reinforcement ratios of0.45%, 0.90%, and 1.40% were provided, while 0.2% was used asthe shear reinforcement ratio.
From Table 1, the first three beams (CONT-1 to -3) having lon-gitudinal reinforcement ratios of 0.45%, 0.90%, and 1.40%, respec-tively, were tested monotonically, in order to obtain the load,corresponding to the diagonal cracking load. Once the crackingload was attained (based on readings from the LVDTs in tension),results from further increases in loading were not required. Per-centages of the maximum diagonal cracking load were then usedto define the fatigue loads for other beams with similar longitudi-nal reinforcement ratios.
The names attached to each beam tested under fatigue loadingare indicative of the loading and reinforcement conditions; forexample, C80-20-0 is assigned to a beam reinforced with 2–10 M(10 M refers to Canadian standard hot-rolled reinforcing bar withcross-section area of 100 mm2) and subjected to fatigue maximumand minimum loads of 80% and 20% of diagonal cracking load. Thelast value zero signifies 0.45% longitudinal reinforcement ratio. Inthe cases of beams C75-0-1 and C75-0-2, C75-0 signifies maximumand minimum fatigue loads of 75% and approximately 0%, respec-tively. The last numeral (1 or 2) represents 0.9% or 1.40% longitudi-nal reinforcement ratio, respectively.
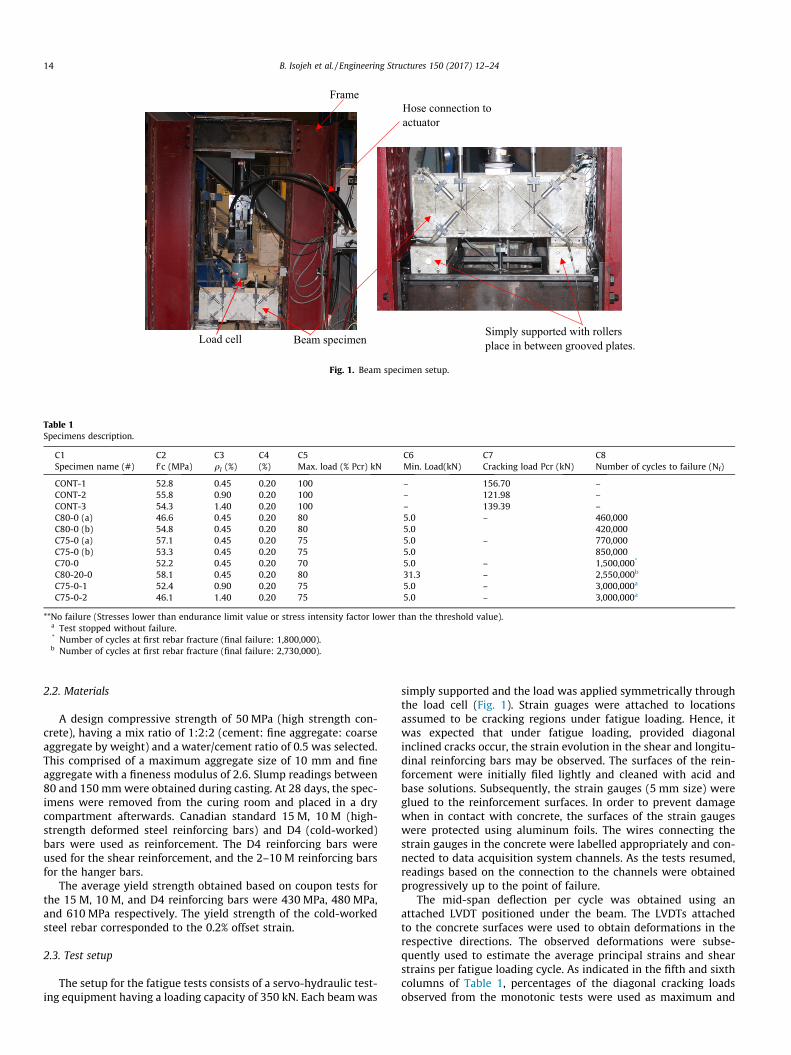
FrameHose connection to actuator
Beam specimenLoad cellSimply supported with rollers place in between grooved plates.
Fig. 1. Beam specimen setup.
Table 1Specimens description.
C1 C2 C3 C4 C5 C6 C7 C8Specimen name (#) f0c (MPa) ql (%) (%) Max. load (% Pcr) kN Min. Load(kN) Cracking load Pcr (kN) Number of cycles to failure (Nf)
CONT-1 52.8 0.45 0.20 100 – 156.70 –CONT-2 55.8 0.90 0.20 100 – 121.98 –CONT-3 54.3 1.40 0.20 100 – 139.39 –C80-0 (a) 46.6 0.45 0.20 80 5.0 – 460,000C80-0 (b) 54.8 0.45 0.20 80 5.0 420,000C75-0 (a) 57.1 0.45 0.20 75 5.0 – 770,000C75-0 (b) 53.3 0.45 0.20 75 5.0 850,000C70-0 52.2 0.45 0.20 70 5.0 – 1,500,000*
C80-20-0 58.1 0.45 0.20 80 31.3 – 2,550,000b
C75-0-1 52.4 0.90 0.20 75 5.0 – 3,000,000a
C75-0-2 46.1 1.40 0.20 75 5.0 – 3,000,000a
**No failure (Stresses lower than endurance limit value or stress intensity factor lower than the threshold value).a Test stopped without failure.* Number of cycles at first rebar fracture (final failure: 1,800,000).b Number of cycles at first rebar fracture (final failure: 2,730,000).
14 B. Isojeh et al. / Engineering Structures 150 (2017) 12–24
2.2. Materials
A design compressive strength of 50 MPa (high strength con-crete), having a mix ratio of 1:2:2 (cement: fine aggregate: coarseaggregate by weight) and a water/cement ratio of 0.5 was selected.This comprised of a maximum aggregate size of 10 mm and fineaggregate with a fineness modulus of 2.6. Slump readings between80 and 150 mmwere obtained during casting. At 28 days, the spec-imens were removed from the curing room and placed in a drycompartment afterwards. Canadian standard 15 M, 10 M (high-strength deformed steel reinforcing bars) and D4 (cold-worked)bars were used as reinforcement. The D4 reinforcing bars wereused for the shear reinforcement, and the 2–10 M reinforcing barsfor the hanger bars.
The average yield strength obtained based on coupon tests forthe 15 M, 10 M, and D4 reinforcing bars were 430 MPa, 480 MPa,and 610 MPa respectively. The yield strength of the cold-workedsteel rebar corresponded to the 0.2% offset strain.
2.3. Test setup
The setup for the fatigue tests consists of a servo-hydraulic test-ing equipment having a loading capacity of 350 kN. Each beam was
simply supported and the load was applied symmetrically throughthe load cell (Fig. 1). Strain guages were attached to locationsassumed to be cracking regions under fatigue loading. Hence, itwas expected that under fatigue loading, provided diagonalinclined cracks occur, the strain evolution in the shear and longitu-dinal reinforcing bars may be observed. The surfaces of the rein-forcement were initially filed lightly and cleaned with acid andbase solutions. Subsequently, the strain gauges (5 mm size) wereglued to the reinforcement surfaces. In order to prevent damagewhen in contact with concrete, the surfaces of the strain gaugeswere protected using aluminum foils. The wires connecting thestrain gauges in the concrete were labelled appropriately and con-nected to data acquisition system channels. As the tests resumed,readings based on the connection to the channels were obtainedprogressively up to the point of failure.
The mid-span deflection per cycle was obtained using anattached LVDT positioned under the beam. The LVDTs attachedto the concrete surfaces were used to obtain deformations in therespective directions. The observed deformations were subse-quently used to estimate the average principal strains and shearstrains per fatigue loading cycle. As indicated in the fifth and sixthcolumns of Table 1, percentages of the diagonal cracking loadsobserved from the monotonic tests were used as maximum and
CONT-1
B. Isojeh et al. / Engineering Structures 150 (2017) 12–24 15
minimum loads for the fatigue tests conducted, respectively. Eachspecimen was subjected to fatigue loading without a prior applica-tion of monotonic loading.
CONT-2
Pcr
2.4. Test procedureInitially, the three control beams CONT-1, -2, and -3 as indi-cated in Table 1 and Fig. 2, were tested under monotonic loadingin order to obtain the diagonal cracking load (column 7). FromFig. 3, it can be observed that the capacities of CONT-2 andCONT-3 were approaching the limit of the testing machine; hence,each test was stopped having achieved the aim (obtaining the diag-onal cracking load). Since the LVDTs attached to the surface of thebeams could capture the cracking load, subsequent load valueswere not required. The diagonal cracking load for CONT-1 wasobserved to be higher than the values obtained for CONT-2 andCONT-3. This was attributed to the fact that heavily-reinforceddeep beams are governed by shear deformations; hence, initialcracks under loading may be within the shear spans. On the otherhand, lightly reinforced concrete deep beams are governed by
LVDT
52
52
250
15
700100
250
124 426
250
88
12
52
15
52
LVDT
LVDT
ALL DIMENSIONS ARE IN MM
STRAIN GAUGE
E W
30
30
2 LEGS (D4)
2-10M/2-15M
175
250
X
X
700100
250
124
30
30
128
64
426
175
250 30
30
2 LEGS (D4)
3-15M
LVDTs attached to surface of beam.
Reinforcement with strain gauges embedded in concrete.
Beam cross-section showing stirrups and longitudinal reinforcement cross sections
Fig. 2. Details of deep beam specimen.
Pcr
CONT-3
Pcr
Fig. 3. Load versus deformation (strain) plot.
flexural cracks within the mid-spans. Higher loads may be requiredfor cracks to form within the shear spans of lightly reinforced beams.
For the fatigue loading, a pulsating load of a continuous sinu-soidal waveform was generated from the loading equipmentthroughout the test duration. All fatigue tests were conducted ata frequency of 5 Hz and a minimum fatigue load of 5 kN was used,except for beam C80-20-0 where the minimum fatigue load wastaken as 20% of the diagonal cracking load. The value was usedto verify the influence of minimum fatigue loading on the fatiguelife of the deep beams.
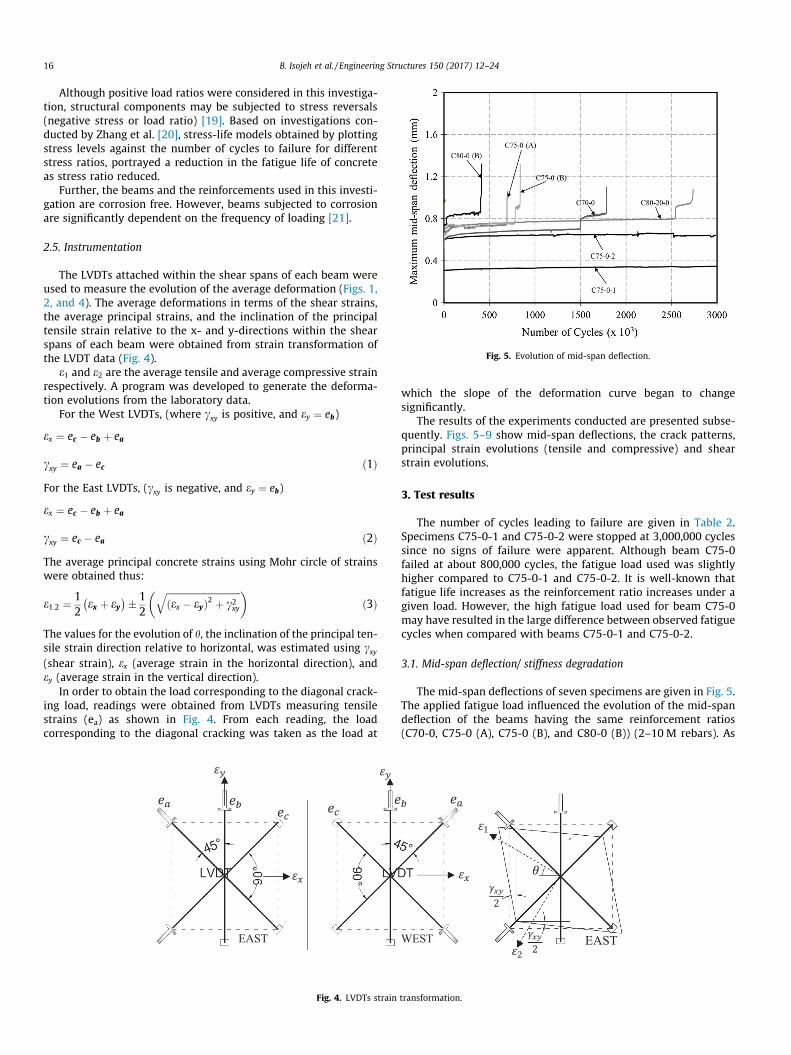
Fig. 5. Evolution of mid-span deflection.
16 B. Isojeh et al. / Engineering Structures 150 (2017) 12–24
Although positive load ratios were considered in this investiga-tion, structural components may be subjected to stress reversals(negative stress or load ratio) [19]. Based on investigations con-ducted by Zhang et al. [20], stress-life models obtained by plottingstress levels against the number of cycles to failure for differentstress ratios, portrayed a reduction in the fatigue life of concreteas stress ratio reduced.
Further, the beams and the reinforcements used in this investi-gation are corrosion free. However, beams subjected to corrosionare significantly dependent on the frequency of loading [21].
2.5. Instrumentation
The LVDTs attached within the shear spans of each beam wereused to measure the evolution of the average deformation (Figs. 1,2, and 4). The average deformations in terms of the shear strains,the average principal strains, and the inclination of the principaltensile strain relative to the x- and y-directions within the shearspans of each beam were obtained from strain transformation ofthe LVDT data (Fig. 4).
e1 and e2 are the average tensile and average compressive strainrespectively. A program was developed to generate the deforma-tion evolutions from the laboratory data.
For the West LVDTs, (where cxy is positive, and ey ¼ eb)
ex ¼ ec � eb þ ea
cxy ¼ ea � ec ð1ÞFor the East LVDTs, (cxy is negative, and ey ¼ eb)
ex ¼ ec � eb þ ea
cxy ¼ ec � ea ð2ÞThe average principal concrete strains using Mohr circle of strainswere obtained thus:
e1;2 ¼ 12ex þ ey� �� 1
2
ffiffiffiffiffiffiffiffiffiffiffiffiffiffiffiffiffiffiffiffiffiffiffiffiffiffiffiffiffiffiffiffiðex � eyÞ2 þ c2xy
q� �ð3Þ
The values for the evolution of h, the inclination of the principal ten-sile strain direction relative to horizontal, was estimated using cxy(shear strain), ex (average strain in the horizontal direction), andey (average strain in the vertical direction).
In order to obtain the load corresponding to the diagonal crack-ing load, readings were obtained from LVDTs measuring tensilestrains (ea) as shown in Fig. 4. From each reading, the loadcorresponding to the diagonal cracking was taken as the load at
EAST
Fig. 4. LVDTs strain
which the slope of the deformation curve began to changesignificantly.
The results of the experiments conducted are presented subse-quently. Figs. 5–9 show mid-span deflections, the crack patterns,principal strain evolutions (tensile and compressive) and shearstrain evolutions.
3. Test results
The number of cycles leading to failure are given in Table 2.Specimens C75-0-1 and C75-0-2 were stopped at 3,000,000 cyclessince no signs of failure were apparent. Although beam C75-0failed at about 800,000 cycles, the fatigue load used was slightlyhigher compared to C75-0-1 and C75-0-2. It is well-known thatfatigue life increases as the reinforcement ratio increases under agiven load. However, the high fatigue load used for beam C75-0may have resulted in the large difference between observed fatiguecycles when compared with beams C75-0-1 and C75-0-2.
3.1. Mid-span deflection/ stiffness degradation
The mid-span deflections of seven specimens are given in Fig. 5.The applied fatigue load influenced the evolution of the mid-spandeflection of the beams having the same reinforcement ratios(C70-0, C75-0 (A), C75-0 (B), and C80-0 (B)) (2–10 M rebars). As
WEST
1
2
2
2EAST
transformation.

Fig. 6. Crack pattern and shear-span fatigue degradation.
Fig. 7. Fatigue hysteresis loops.
B. Isojeh et al. / Engineering Structures 150 (2017) 12–24 17
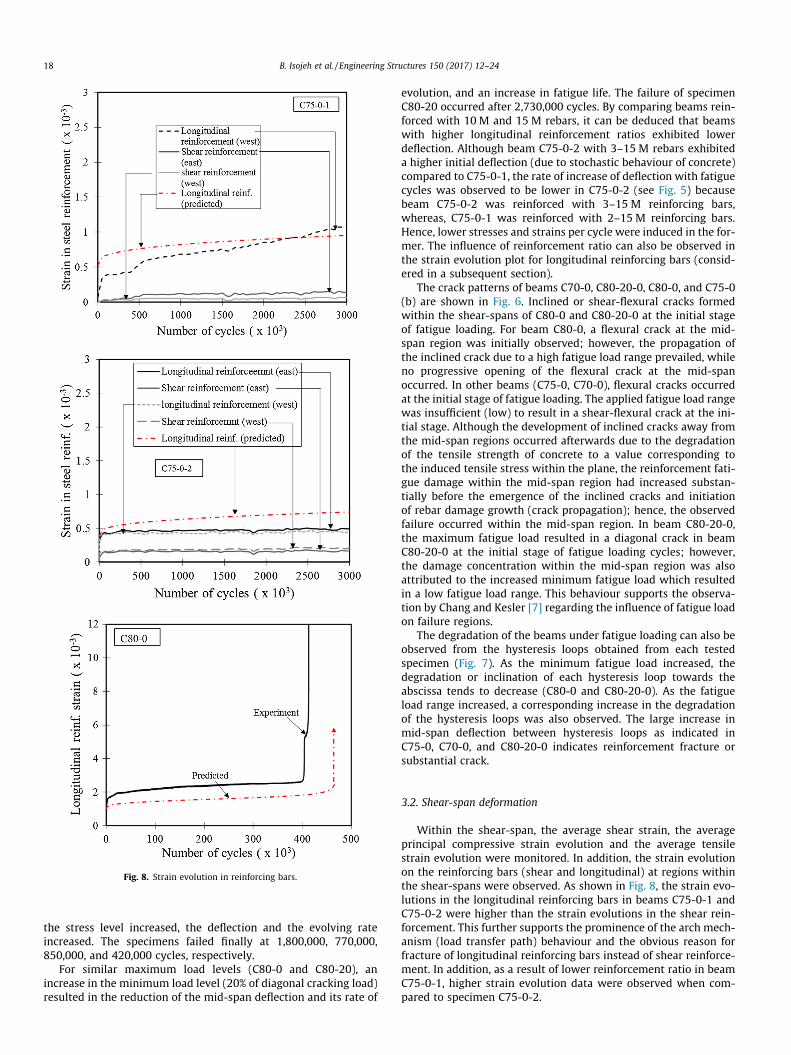
Fig. 8. Strain evolution in reinforcing bars.
18 B. Isojeh et al. / Engineering Structures 150 (2017) 12–24
the stress level increased, the deflection and the evolving rateincreased. The specimens failed finally at 1,800,000, 770,000,850,000, and 420,000 cycles, respectively.
For similar maximum load levels (C80-0 and C80-20), anincrease in the minimum load level (20% of diagonal cracking load)resulted in the reduction of the mid-span deflection and its rate of
evolution, and an increase in fatigue life. The failure of specimenC80-20 occurred after 2,730,000 cycles. By comparing beams rein-forced with 10 M and 15 M rebars, it can be deduced that beamswith higher longitudinal reinforcement ratios exhibited lowerdeflection. Although beam C75-0-2 with 3–15 M rebars exhibiteda higher initial deflection (due to stochastic behaviour of concrete)compared to C75-0-1, the rate of increase of deflection with fatiguecycles was observed to be lower in C75-0-2 (see Fig. 5) becausebeam C75-0-2 was reinforced with 3–15 M reinforcing bars,whereas, C75-0-1 was reinforced with 2–15 M reinforcing bars.Hence, lower stresses and strains per cycle were induced in the for-mer. The influence of reinforcement ratio can also be observed inthe strain evolution plot for longitudinal reinforcing bars (consid-ered in a subsequent section).
The crack patterns of beams C70-0, C80-20-0, C80-0, and C75-0(b) are shown in Fig. 6. Inclined or shear-flexural cracks formedwithin the shear-spans of C80-0 and C80-20-0 at the initial stageof fatigue loading. For beam C80-0, a flexural crack at the mid-span region was initially observed; however, the propagation ofthe inclined crack due to a high fatigue load range prevailed, whileno progressive opening of the flexural crack at the mid-spanoccurred. In other beams (C75-0, C70-0), flexural cracks occurredat the initial stage of fatigue loading. The applied fatigue load rangewas insufficient (low) to result in a shear-flexural crack at the ini-tial stage. Although the development of inclined cracks away fromthe mid-span regions occurred afterwards due to the degradationof the tensile strength of concrete to a value corresponding tothe induced tensile stress within the plane, the reinforcement fati-gue damage within the mid-span region had increased substan-tially before the emergence of the inclined cracks and initiationof rebar damage growth (crack propagation); hence, the observedfailure occurred within the mid-span region. In beam C80-20-0,the maximum fatigue load resulted in a diagonal crack in beamC80-20-0 at the initial stage of fatigue loading cycles; however,the damage concentration within the mid-span region was alsoattributed to the increased minimum fatigue load which resultedin a low fatigue load range. This behaviour supports the observa-tion by Chang and Kesler [7] regarding the influence of fatigue loadon failure regions.
The degradation of the beams under fatigue loading can also beobserved from the hysteresis loops obtained from each testedspecimen (Fig. 7). As the minimum fatigue load increased, thedegradation or inclination of each hysteresis loop towards theabscissa tends to decrease (C80-0 and C80-20-0). As the fatigueload range increased, a corresponding increase in the degradationof the hysteresis loops was also observed. The large increase inmid-span deflection between hysteresis loops as indicated inC75-0, C70-0, and C80-20-0 indicates reinforcement fracture orsubstantial crack.
3.2. Shear-span deformation
Within the shear-span, the average shear strain, the averageprincipal compressive strain evolution and the average tensilestrain evolution were monitored. In addition, the strain evolutionon the reinforcing bars (shear and longitudinal) at regions withinthe shear-spans were observed. As shown in Fig. 8, the strain evo-lutions in the longitudinal reinforcing bars in beams C75-0-1 andC75-0-2 were higher than the strain evolutions in the shear rein-forcement. This further supports the prominence of the arch mech-anism (load transfer path) behaviour and the obvious reason forfracture of longitudinal reinforcing bars instead of shear reinforce-ment. In addition, as a result of lower reinforcement ratio in beamC75-0-1, higher strain evolution data were observed when com-pared to specimen C75-0-2.
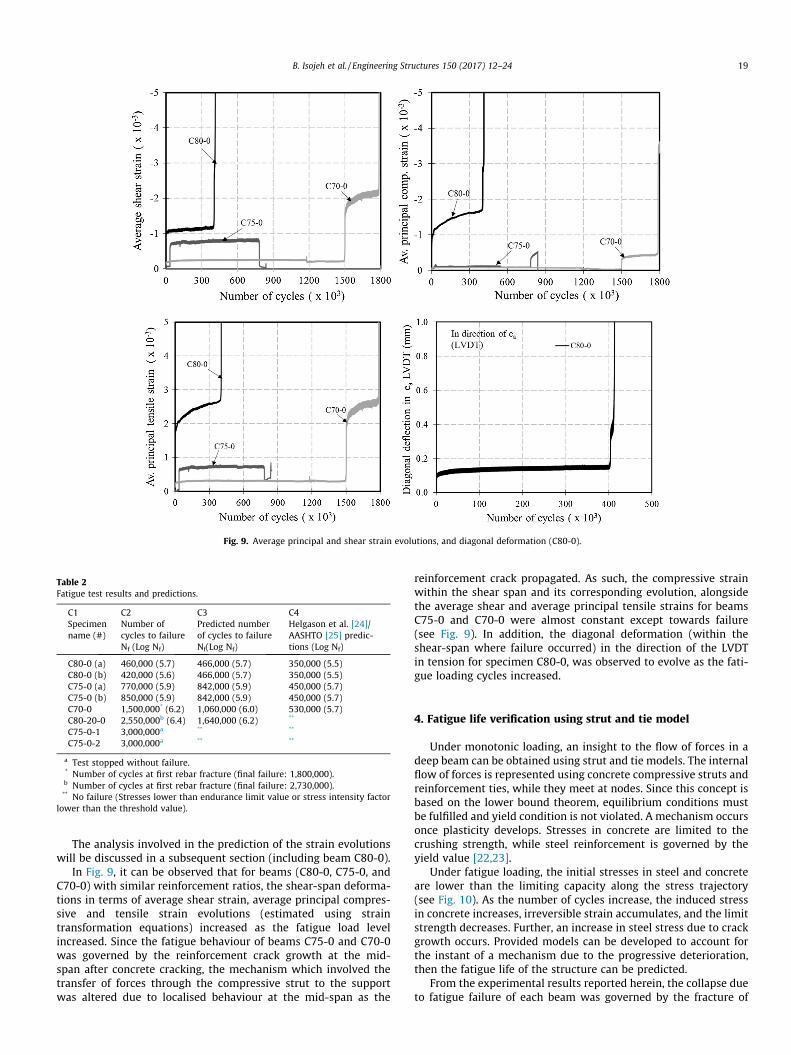
Fig. 9. Average principal and shear strain evolutions, and diagonal deformation (C80-0).
Table 2Fatigue test results and predictions.
C1 C2 C3 C4Specimenname (#)
Number ofcycles to failureNf (Log Nf)
Predicted numberof cycles to failureNf(Log Nf)
Helgason et al. [24]/AASHTO [25] predic-tions (Log Nf)
C80-0 (a) 460,000 (5.7) 466,000 (5.7) 350,000 (5.5)C80-0 (b) 420,000 (5.6) 466,000 (5.7) 350,000 (5.5)C75-0 (a) 770,000 (5.9) 842,000 (5.9) 450,000 (5.7)C75-0 (b) 850,000 (5.9) 842,000 (5.9) 450,000 (5.7)C70-0 1,500,000* (6.2) 1,060,000 (6.0) 530,000 (5.7)C80-20-0 2,550,000b (6.4) 1,640,000 (6.2) **
C75-0-1 3,000,000a ** **
C75-0-2 3,000,000a ** **
a Test stopped without failure.* Number of cycles at first rebar fracture (final failure: 1,800,000).b Number of cycles at first rebar fracture (final failure: 2,730,000).** No failure (Stresses lower than endurance limit value or stress intensity factor
lower than the threshold value).
B. Isojeh et al. / Engineering Structures 150 (2017) 12–24 19
The analysis involved in the prediction of the strain evolutionswill be discussed in a subsequent section (including beam C80-0).
In Fig. 9, it can be observed that for beams (C80-0, C75-0, andC70-0) with similar reinforcement ratios, the shear-span deforma-tions in terms of average shear strain, average principal compres-sive and tensile strain evolutions (estimated using straintransformation equations) increased as the fatigue load levelincreased. Since the fatigue behaviour of beams C75-0 and C70-0was governed by the reinforcement crack growth at the mid-span after concrete cracking, the mechanism which involved thetransfer of forces through the compressive strut to the supportwas altered due to localised behaviour at the mid-span as the
reinforcement crack propagated. As such, the compressive strainwithin the shear span and its corresponding evolution, alongsidethe average shear and average principal tensile strains for beamsC75-0 and C70-0 were almost constant except towards failure(see Fig. 9). In addition, the diagonal deformation (within theshear-span where failure occurred) in the direction of the LVDTin tension for specimen C80-0, was observed to evolve as the fati-gue loading cycles increased.
4. Fatigue life verification using strut and tie model
Under monotonic loading, an insight to the flow of forces in adeep beam can be obtained using strut and tie models. The internalflow of forces is represented using concrete compressive struts andreinforcement ties, while they meet at nodes. Since this concept isbased on the lower bound theorem, equilibrium conditions mustbe fulfilled and yield condition is not violated. A mechanism occursonce plasticity develops. Stresses in concrete are limited to thecrushing strength, while steel reinforcement is governed by theyield value [22,23].
Under fatigue loading, the initial stresses in steel and concreteare lower than the limiting capacity along the stress trajectory(see Fig. 10). As the number of cycles increase, the induced stressin concrete increases, irreversible strain accumulates, and the limitstrength decreases. Further, an increase in steel stress due to crackgrowth occurs. Provided models can be developed to account forthe instant of a mechanism due to the progressive deterioration,then the fatigue life of the structure can be predicted.
From the experimental results reported herein, the collapse dueto fatigue failure of each beam was governed by the fracture of

Fig. 10. Strut and tie model for a deep beam under fatigue loading.
20 B. Isojeh et al. / Engineering Structures 150 (2017) 12–24
longitudinal reinforcing bars under fatigue loading. It was postu-lated previously that this behaviour is attributed to the fact thatload is transferred to the support from the loading point througharch mechanism and not by truss action common with beams hav-ing shear-span to effective depth ratios greater than 2.0.
In the analysis of fatigue loading, the deterioration of materialproperties such as concrete strength, steel residual area after crackgrowth, and the irreversible compressive strain accumulation canbe accounted for in the constitutive, compatibility, and equilibriumequations of an analysis algorithm such as strut and tie. As such, areinforced concrete beam damaged due to fatigue may fail whenreloaded statically up to the same fatigue load after a given num-ber of cycles. At the point of failure, crushing of concrete strutsor fracture of reinforcing bars (shear or longitudinal, dependingon the a/d value) may govern when the acting force in either theconcrete or steel reinforcing bars becomes equal to the corre-sponding resistance capacity. The number of cycles at which thisoccurs is termed the fatigue life of the structural element.
To further illustrate this concept, the numbers of cycles leadingto failure for each beam tested in this investigation were predicted.The predicted numbers of cycles were compared with thoseobtained using Helgason et al. [24] (used by AASHTO [25]). Thefatigue load used for prediction was taken as the average load fromthe two curves for the CONT-1, CONT-2 and CONT-3 beams (Fig. 2).
4.1. Fatigue equilibrium equation
From Fig. 10,
Fo ¼ AðiÞEsex ð4Þ
To ¼ AvEsev ð5Þ
Di ¼ f c2wðpusinhþ dacoshÞ ð6ÞUnder fatigue loading, the irreversible strain (ed) is considered as apseudo-load. The value is assumed to be zero at the first cycle [26].For subsequent cycles,
Fed ¼ Ecfatedwðpusinhþ dacoshÞ ð7ÞIn Fig. 10 and Eqs. (4)–(7), Fo is the force in the longitudinal rein-forcement, A(i) is the residual longitudinal reinforcement area(function of reinforcement crack growth), Es is the elastic modulusof steel reinforcement, ex is the strain in the longitudinal reinforce-ment, To is the force in the shear reinforcement within the shearspan, Av is the area of shear reinforcement within the shear span,
ev is the assumed strain in the shear reinforcement, Di is the com-pressive force in the concrete strut, f c2 is the compressive stressin the concrete strut (function of concrete damage evolution), w isthe width of the beam, pu is taken as half of the loading plate length,h is the inclination of the compressive strut to the horizontal, da isthe depth of the nodal zone under the loading plate, Fed is thepseudo-load due to irreversible strain accumulation, Ecfat is theresidual stiffness of concrete strut, and ed is the irreversible fatiguestrain.
4.2. Fatigue constitutive models
The fatigue constitutive models used for concrete under com-pression fatigue loading and the corresponding irreversible strain(ed) model have been previously developed by the authors[27,28]. These models were used in this investigation for the fati-gue damage analysis of concrete. Eqs. (8) and (9) are constitutivemodels for normal strength concrete using Hognestad’s equation.Using Hognestad’s Equation [29] for concrete compressive stress–strain model, the stress in a fatigue-damaged strut is expressedas [28]:
ec2e�c
� �2
� 2ec2e�c
þ f c2f pð1� DfcÞ ¼ 0 ð8Þ
e�c ¼ ep 1þffiffiffiffiffiffiffiDfc
q� �� ed ð9Þ
f c2 is the principal compressive stress, f p is the peak concrete com-
pressive stress (equal to f 0c), ep is the compressive strain correspond-ing to f p, ec2 is the average net strain in the principal compressivedirection, and e�c is the strain corresponding to the peak stress ofthe degraded concrete strength. Models for Dfc and ed can beobtained from [27,28], respectively.
The total fatigue life of steel reinforcement can be assumed toconstitute the crack initiation life (controlled by localisedplasticity-crack nucleation) and the crack propagation life. For duc-tile materials, the crack initiation life is usually lower than thecrack propagation life. However, the reverse is true for brittlematerials. The strain-life approach which considers localised plas-ticity was used to obtain the crack initiation life, while fracturemechanics was used to estimate the crack propagation life froman initial crack length [30]. The localised stress and strain on thereinforcement at the intersection with concrete crack can beobtained using finite element analysis modelling or simply by Neu-ber’s rule (Eq. (10)). The Neuber’s rule is often used to extrapolate
B. Isojeh et al. / Engineering Structures 150 (2017) 12–24 21
elastic analysis so that stresses and strains associated with theeffects of local yielding can be obtained.
re ¼ ðKtSÞ2E
ð10Þ
Kt is the stress concentration factor, and S is the nominal stress. rand e are the localised stress and strain, respectively. The meanvalue of Kt (depending on the reinforcement geometries) wasobtained as 1.9 from a table and chart provided by Jhamb andMacGregor’s [31] on stress concentration factors for reinforcingbars. In order to express the material properties of steel in the formof a cyclic stress-strain and strain-life curve, Masing’s model andSmith-Watson-Topper (SWT) approach expressed in Eqs. (11) and(12) respectively, were used [32,33]. The SWT model is empiricallybased and accounts for the effect of mean stresses on fatigue beha-viour. The SWT model relates the product of the maximum stressand total strain amplitude (rmaxea) to the fatigue life. The totalstrain consist of the summation of elastic and plastic terms. Fromthe model, the product of the stress amplitude and strain amplitudefor a fully reversed test is equal to rmaxea for a mean stress test [34].The parameters (mean test values) in the model r0
f , b, c, e0f are fittingconstants which are essentially material properties.
ea ¼ ra
Eþ ra
H0
� � 1n0
ð11Þ
rmaxea ¼ðr0
f Þ2E
ð2Nf Þ2b þ r0f e
0f ð2Nf Þbþc ð12Þ
The approach for estimating rmax, emax (maximum stress and strainat notch), ra, ea (stress amplitude and corresponding strain) areillustrated in [33,35]. From Boller and Seeger [35], parameters inEqs. (11) and (12) common to the tests conducted in this investiga-tion (mean test values) are given as:
b ¼ �0:087; c ¼ �0:58; e0f ¼ 0:59; r0f ¼ 720 MPa;
n0 ¼ b=c ¼ 0:15; H0 ¼ r0f
e0n0
f
¼ 779:3 MPa:
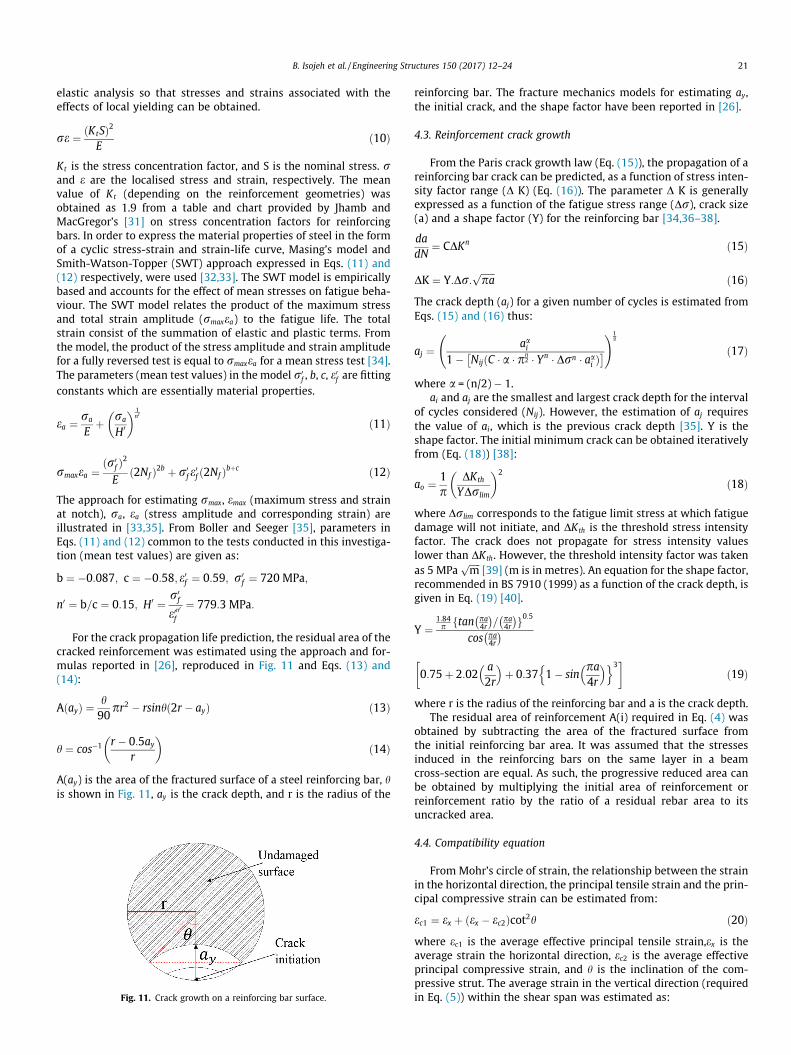
For the crack propagation life prediction, the residual area of thecracked reinforcement was estimated using the approach and for-mulas reported in [26], reproduced in Fig. 11 and Eqs. (13) and(14):
AðayÞ ¼ h90
pr2 � rsinhð2r � ayÞ ð13Þ
h ¼ cos�1 r � 0:5ayr
� �ð14Þ
A(ay) is the area of the fractured surface of a steel reinforcing bar, his shown in Fig. 11, ay is the crack depth, and r is the radius of the
Fig. 11. Crack growth on a reinforcing bar surface.
reinforcing bar. The fracture mechanics models for estimating ay,the initial crack, and the shape factor have been reported in [26].
4.3. Reinforcement crack growth
From the Paris crack growth law (Eq. (15)), the propagation of areinforcing bar crack can be predicted, as a function of stress inten-sity factor range (D K) (Eq. (16)). The parameter D K is generallyexpressed as a function of the fatigue stress range (Dr), crack size(a) and a shape factor (Y) for the reinforcing bar [34,36–38].
dadN
¼ CDKn ð15Þ
DK ¼ Y:Dr:ffiffiffiffiffiffipa
p ð16ÞThe crack depth (aj) for a given number of cycles is estimated fromEqs. (15) and (16) thus:
aj ¼ aai1� NijðC � a � pn
2 � Yn � Drn � aai Þ
!1a
ð17Þ
where a = (n/2) � 1.ai and aj are the smallest and largest crack depth for the interval
of cycles considered (Nij). However, the estimation of aj requiresthe value of ai, which is the previous crack depth [35]. Y is theshape factor. The initial minimum crack can be obtained iterativelyfrom (Eq. (18)) [38]:
ao ¼ 1p
DKth
YDrlim
� �2
ð18Þ
where Drlim corresponds to the fatigue limit stress at which fatiguedamage will not initiate, and DKth is the threshold stress intensityfactor. The crack does not propagate for stress intensity valueslower than DKth. However, the threshold intensity factor was takenas 5 MPa
ffiffiffiffiffim
p[39] (m is in metres). An equation for the shape factor,
recommended in BS 7910 (1999) as a function of the crack depth, isgiven in Eq. (19) [40].
Y ¼1:84p ftan pa
4r
� �= pa
4r
� �g0:5cos pa
4r
� �
0:75þ 2:02a2r
� �þ 0:37 1� sin
pa4r
� �n o3� �
ð19Þ
where r is the radius of the reinforcing bar and a is the crack depth.The residual area of reinforcement A(i) required in Eq. (4) was
obtained by subtracting the area of the fractured surface fromthe initial reinforcing bar area. It was assumed that the stressesinduced in the reinforcing bars on the same layer in a beamcross-section are equal. As such, the progressive reduced area canbe obtained by multiplying the initial area of reinforcement orreinforcement ratio by the ratio of a residual rebar area to itsuncracked area.
4.4. Compatibility equation
FromMohr’s circle of strain, the relationship between the strainin the horizontal direction, the principal tensile strain and the prin-cipal compressive strain can be estimated from:
ec1 ¼ ex þ ðex � ec2Þcot2h ð20Þwhere ec1 is the average effective principal tensile strain,ex is theaverage strain the horizontal direction, ec2 is the average effectiveprincipal compressive strain, and h is the inclination of the com-pressive strut. The average strain in the vertical direction (requiredin Eq. (5)) within the shear span was estimated as:
22 B. Isojeh et al. / Engineering Structures 150 (2017) 12–24
ev ¼ 0:5ec1ð1� cos2hÞ þ 0:5ec2ð1þ cos2hÞ ð21ÞSince appropriate anchorage was ensured based on design specifi-cation, perfect bond was assumed in this investigation. Hence, thehorizontal strain ex is taken as the strain in the longitudinal rein-forcement, while the vertical strain ev is the strain in the shear rein-forcement within the shear-span. In this approach, it was alsoassumed that cracks do not propagate on the shear reinforcement
Fig. 12. Algorithm for predicting th
0
20
40
60
80
100
120
0.001 0.1 10 1000
Forc
e (k
N)
Number of cycles ( x 103)
Experiments
Helgason et al., 1976.
Residual capacity (kN)
Induced force (kN)
C80-0
Fig. 13. Fatigue life prediction from
0
20
40
60
80
100
120
0.001 0.1 10 1000
Forc
e (k
N)
Number of cycles ( x 103)
Helgason et al., 1976.
Experiment
Residual capacity (kN)
Induced force (kN)
C70-0
Fig. 14. Fatigue life prediction from s
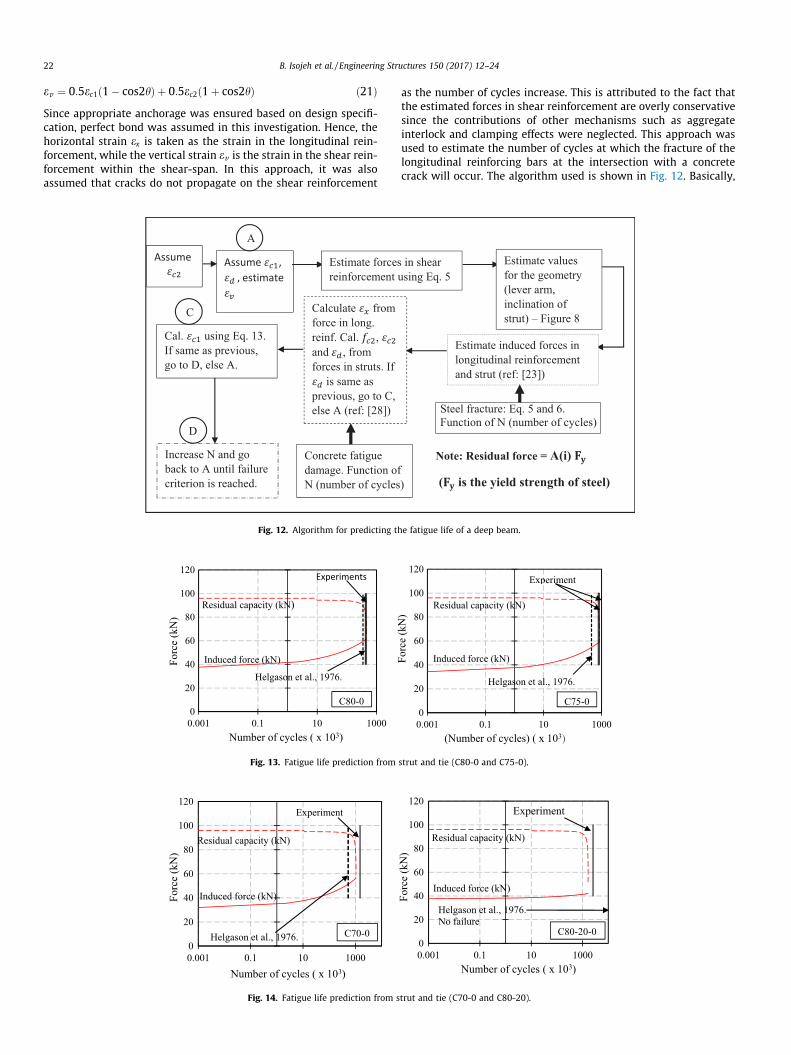
as the number of cycles increase. This is attributed to the fact thatthe estimated forces in shear reinforcement are overly conservativesince the contributions of other mechanisms such as aggregateinterlock and clamping effects were neglected. This approach wasused to estimate the number of cycles at which the fracture of thelongitudinal reinforcing bars at the intersection with a concretecrack will occur. The algorithm used is shown in Fig. 12. Basically,
e fatigue life of a deep beam.
0
20
40
60
80
100
120
0.001 0.1 10 1000
Forc
e (k
N)
(Number of cycles) ( x 103)
Experiment
Helgason et al., 1976.
Residual capacity (kN)
Induced force (kN)
C75-0
strut and tie (C80-0 and C75-0).
0
20
40
60
80
100
120
0.001 0.1 10 1000
Forc
e (k
N)
Number of cycles ( x 103)
Experiment
Helgason et al., 1976.No failure
Residual capacity (kN)
Induced force (kN)
C80-20-0
trut and tie (C70-0 and C80-20).
B. Isojeh et al. / Engineering Structures 150 (2017) 12–24 23
the equilibrium, compatibility, and constitutive equations are satis-fied for each cycle of fatigue loading considered while accountingfor the progressive damage and area reduction of the strut andtie, respectively, until the governing failure criterion is reached.
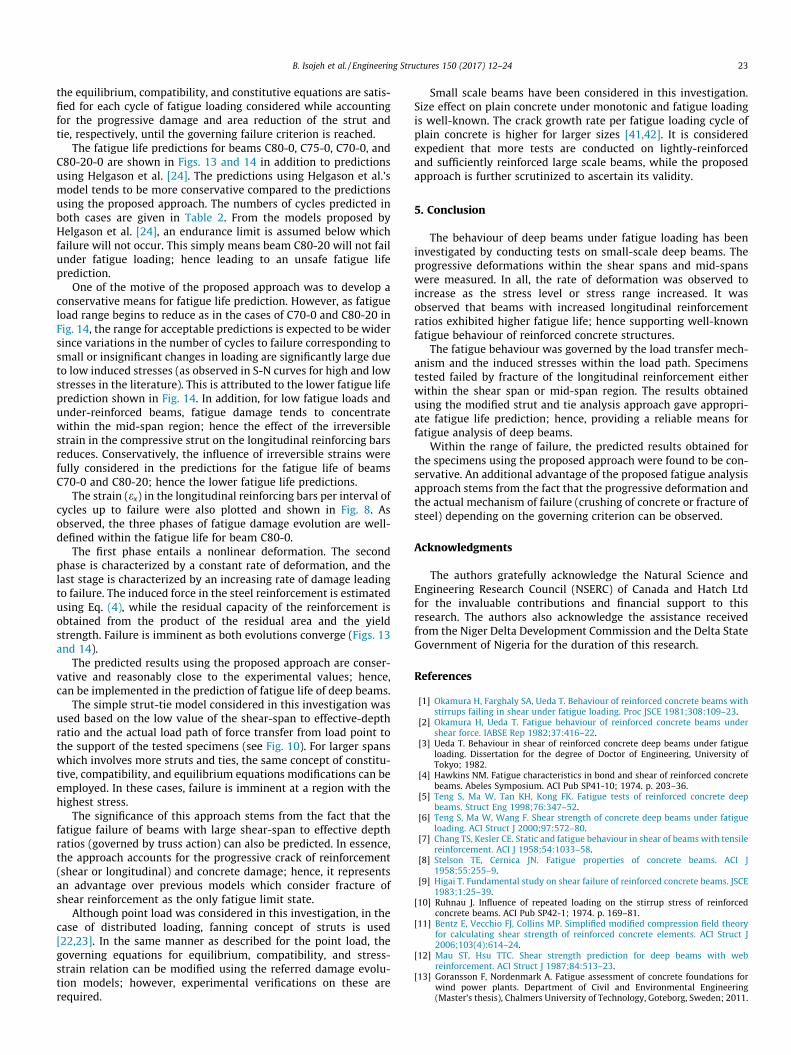
The fatigue life predictions for beams C80-0, C75-0, C70-0, andC80-20-0 are shown in Figs. 13 and 14 in addition to predictionsusing Helgason et al. [24]. The predictions using Helgason et al.’smodel tends to be more conservative compared to the predictionsusing the proposed approach. The numbers of cycles predicted inboth cases are given in Table 2. From the models proposed byHelgason et al. [24], an endurance limit is assumed below whichfailure will not occur. This simply means beam C80-20 will not failunder fatigue loading; hence leading to an unsafe fatigue lifeprediction.
One of the motive of the proposed approach was to develop aconservative means for fatigue life prediction. However, as fatigueload range begins to reduce as in the cases of C70-0 and C80-20 inFig. 14, the range for acceptable predictions is expected to be widersince variations in the number of cycles to failure corresponding tosmall or insignificant changes in loading are significantly large dueto low induced stresses (as observed in S-N curves for high and lowstresses in the literature). This is attributed to the lower fatigue lifeprediction shown in Fig. 14. In addition, for low fatigue loads andunder-reinforced beams, fatigue damage tends to concentratewithin the mid-span region; hence the effect of the irreversiblestrain in the compressive strut on the longitudinal reinforcing barsreduces. Conservatively, the influence of irreversible strains werefully considered in the predictions for the fatigue life of beamsC70-0 and C80-20; hence the lower fatigue life predictions.
The strain (ex) in the longitudinal reinforcing bars per interval ofcycles up to failure were also plotted and shown in Fig. 8. Asobserved, the three phases of fatigue damage evolution are well-defined within the fatigue life for beam C80-0.
The first phase entails a nonlinear deformation. The secondphase is characterized by a constant rate of deformation, and thelast stage is characterized by an increasing rate of damage leadingto failure. The induced force in the steel reinforcement is estimatedusing Eq. (4), while the residual capacity of the reinforcement isobtained from the product of the residual area and the yieldstrength. Failure is imminent as both evolutions converge (Figs. 13and 14).
The predicted results using the proposed approach are conser-vative and reasonably close to the experimental values; hence,can be implemented in the prediction of fatigue life of deep beams.
The simple strut-tie model considered in this investigation wasused based on the low value of the shear-span to effective-depthratio and the actual load path of force transfer from load point tothe support of the tested specimens (see Fig. 10). For larger spanswhich involves more struts and ties, the same concept of constitu-tive, compatibility, and equilibrium equations modifications can beemployed. In these cases, failure is imminent at a region with thehighest stress.
The significance of this approach stems from the fact that thefatigue failure of beams with large shear-span to effective depthratios (governed by truss action) can also be predicted. In essence,the approach accounts for the progressive crack of reinforcement(shear or longitudinal) and concrete damage; hence, it representsan advantage over previous models which consider fracture ofshear reinforcement as the only fatigue limit state.
Although point load was considered in this investigation, in thecase of distributed loading, fanning concept of struts is used[22,23]. In the same manner as described for the point load, thegoverning equations for equilibrium, compatibility, and stress-strain relation can be modified using the referred damage evolu-tion models; however, experimental verifications on these arerequired.
Small scale beams have been considered in this investigation.Size effect on plain concrete under monotonic and fatigue loadingis well-known. The crack growth rate per fatigue loading cycle ofplain concrete is higher for larger sizes [41,42]. It is consideredexpedient that more tests are conducted on lightly-reinforcedand sufficiently reinforced large scale beams, while the proposedapproach is further scrutinized to ascertain its validity.
5. Conclusion
The behaviour of deep beams under fatigue loading has beeninvestigated by conducting tests on small-scale deep beams. Theprogressive deformations within the shear spans and mid-spanswere measured. In all, the rate of deformation was observed toincrease as the stress level or stress range increased. It wasobserved that beams with increased longitudinal reinforcementratios exhibited higher fatigue life; hence supporting well-knownfatigue behaviour of reinforced concrete structures.
The fatigue behaviour was governed by the load transfer mech-anism and the induced stresses within the load path. Specimenstested failed by fracture of the longitudinal reinforcement eitherwithin the shear span or mid-span region. The results obtainedusing the modified strut and tie analysis approach gave appropri-ate fatigue life prediction; hence, providing a reliable means forfatigue analysis of deep beams.
Within the range of failure, the predicted results obtained forthe specimens using the proposed approach were found to be con-servative. An additional advantage of the proposed fatigue analysisapproach stems from the fact that the progressive deformation andthe actual mechanism of failure (crushing of concrete or fracture ofsteel) depending on the governing criterion can be observed.
Acknowledgments
The authors gratefully acknowledge the Natural Science andEngineering Research Council (NSERC) of Canada and Hatch Ltdfor the invaluable contributions and financial support to thisresearch. The authors also acknowledge the assistance receivedfrom the Niger Delta Development Commission and the Delta StateGovernment of Nigeria for the duration of this research.
References
[1] Okamura H, Farghaly SA, Ueda T. Behaviour of reinforced concrete beams withstirrups failing in shear under fatigue loading. Proc JSCE 1981;308:109–23.
[2] Okamura H, Ueda T. Fatigue behaviour of reinforced concrete beams undershear force. IABSE Rep 1982;37:416–22.
[3] Ueda T. Behaviour in shear of reinforced concrete deep beams under fatigueloading. Dissertation for the degree of Doctor of Engineering, University ofTokyo; 1982.
[4] Hawkins NM. Fatigue characteristics in bond and shear of reinforced concretebeams. Abeles Symposium. ACI Pub SP41-10; 1974. p. 203–36.
[5] Teng S, Ma W, Tan KH, Kong FK. Fatigue tests of reinforced concrete deepbeams. Struct Eng 1998;76:347–52.
[6] Teng S, Ma W, Wang F. Shear strength of concrete deep beams under fatigueloading. ACI Struct J 2000;97:572–80.
[7] Chang TS, Kesler CE. Static and fatigue behaviour in shear of beams with tensilereinforcement. ACI J 1958;54:1033–58.
[8] Stelson TE, Cernica JN. Fatigue properties of concrete beams. ACI J1958;55:255–9.
[9] Higai T. Fundamental study on shear failure of reinforced concrete beams. JSCE1983;1:25–39.
[10] Ruhnau J. Influence of repeated loading on the stirrup stress of reinforcedconcrete beams. ACI Pub SP42-1; 1974. p. 169–81.
[11] Bentz E, Vecchio FJ, Collins MP. Simplified modified compression field theoryfor calculating shear strength of reinforced concrete elements. ACI Struct J2006;103(4):614–24.
[12] Mau ST, Hsu TTC. Shear strength prediction for deep beams with webreinforcement. ACI Struct J 1987;84:513–23.
[13] Goransson F, Nordenmark A. Fatigue assessment of concrete foundations forwind power plants. Department of Civil and Environmental Engineering(Master’s thesis), Chalmers University of Technology, Goteborg, Sweden; 2011.
24 B. Isojeh et al. / Engineering Structures 150 (2017) 12–24
[14] Zanuy C, Fuente P, Albajar L. Effect of fatigue degradation of the compressionzone of concrete in reinforced concrete sections. Eng Struct 2007;29:2908–20.
[15] Tamulenas V, Gelazius V, Ramanauskas R. Calculation technique for stress-strain analysis of RC elements subjected to high-cycle compression, vol. 6(5).Mokslas: Lietuvos Ateitis; 2014. p. 468–73.
[16] Cement Association of Canada. Concrete design handbook. 3rd ed. Ottawa(Ontario): CAC; 2006.
[17] EC2. Eurocode 2: design of concrete structures-Part 1–1: General rules forbuildings. London, UK: British Standards Institution, BS EN 1992-1-1; 2004.
[18] ACI 318-14 to ACI 346-09. Manual of concrete practice: Part 3 of 7. AmericanConcrete Institute.
[19] Torrenti JM, Pijaudier-Cabot G, Reynouard J. Mechanical behaviour ofconcrete: cyclic and dynamic loading, fatigue of structural concrete. ISTE andWiley; 2010. p. 185–223.
[20] Zhang B et al. Effects of loading frequency and stress reversal on fatigue life ofplain concrete. Mag Concr Res 1996;48:361–75.
[21] Veeman R, Van Breugel K, koenders E. Effects of corrosion onn the fatigueservice-life on steel and reinforced concrete beams. In: Concrete-innovationand design, FIB symposium. Copenhagen; 2015.
[22] Muttoni A, Schwartz J, Thurlimann B. Design of concrete structures with stressfields. Birkhauser Basel Boston Berlin 1996.
[23] Collins MP, Mitchell D. Prestressed concrete structures. Canada: ResponsePublication; 1997.
[24] Helgason T, Hanson JM, Somes NF, Corley WG, Hognestad E. Fatigue strengthof high-yield reinforcing bars. Natl Cooper Highway Res Program Rep1976;161:1–90.
[25] AASHTO. AASHTO LRFD bridge design specifications, 2008 and 2009 Interim,American Association of State Highway and transportation Officials,Washington DC, 4th ed.; 2007.
[26] Isojeh MB, Vecchio FJ. Parametric damage of concrete under high-cycle fatigueloading in compression. In: Proc, 9th international conference on fracturemechanics of concrete and concrete structures. FraMCoS-9 2016; 10.21012/FC9.009.
[27] Isojeh B, El-Zeghayar M, Vecchio FJ. Concrete damage under fatigue loading inuniaxial compression. ACI Mater J 114(2): 225–35.
[28] Isojeh B, El-Zeghayar M, Vecchio FJ. Simplified constitutive model for fatiguebehaviour of concrete in compression. ASCE J Mater; 2017. doi:http://dx.doi.org/10.1061/(ASCE)MT.1943-5533.0001863.
[29] Hognestad E. Confirmation of inelastic stress distribution in concrete. ProcASCE 1954;83(2):1–17.
[30] Socie D, Dowling NE, Kurath P. Fatigue life estimation of notched members. In:Fracture mechanics: fifteenth symposium. ASTM STP 833; 1984. p. 284–99.
[31] Jhamb IC, MacGregor JG. Stress concentration caused by reinforcing bardeformations. ACI SP J 1974;41:169–82.
[32] Smith KN, Watson P, Topper TH. A stress-strain function for the fatigue ofmetals. J Mater 1970;5:767–78.
[33] Dowling NE, Thangjitham NE. An overview and discussion of basicmethodology for fatigue. Fatigue Fract Mech: ASTM STP 2000;1389(31):3–36.
[34] Lee Y, Pan J, Hathaway R, Barkey M. Fatigue testing and analysis: theory andpractice. Elsevier Butterworth-Heinemann; 2005.
[35] Boller C, Seeger T. Materials data for cyclic loading, vol. 5. Amsterdam: ElsevierScience Pubs; 1987.
[36] Paris P, Gomez MP, Anderson WE. A rational analytical theory of fatigue. TrendEng 1961;13:9–14.
[37] Rocha M, Bruhwiler E. Prediction of fatigue life of reinforced concrete bridges.In: Biondini, Frangopol, editors. Bridge maintenance, safety, management,resilience and sustainability; 2012. p. 3755–60.
[38] Herwig A, et al. Reinforced concrete bridges under increased railway trafficloads- fatigue behaviour and safety measures. PhD Thesis No. 4010, EcolePolytechnique Federale de Lausanne; 2008.
[39] Farahmand B, Nikbin K. Predicting fracture and fatigue crack growthproperties using tensile properties. Eng Fract Mech 2008;75:2144–55.
[40] British Standard. Guide to methods for assessing the acceptability of flaws inmetallic structures. BS 7510; 2005.
[41] Bazant Z, Xu K. Size effects in fatigue fracture of concrete. ACI Mater J 1991;88(4):390–9.
[42] Sain T, Chandra Kishen J. Prediction of fatigue strength in plain and reinforcedconcrete beams. ACI Mater J 2007;104(5):621–8.


![Fatigue of a Rectangular Reinforced Concrete CS - …...Fatigue of a Rectangular Reinforced Concrete CS Combination calculatoric forces and moments at ‚= 5.0m: LC Vy[kN] Vz[kN] My[kNm]](https://img.pdfslide.net/doc/110x75/5ec001511c97f46f10127c66/fatigue-of-a-rectangular-reinforced-concrete-cs-fatigue-of-a-rectangular-reinforced.jpg)