Embed Size (px)
Citation preview

This document was downloaded from the Penspen Integrity Virtual Library
For further information, contact Penspen Integrity:
Penspen Integrity Units 7-8
St. Peter's Wharf Newcastle upon Tyne
NE6 1TZ United Kingdom
Telephone: +44 (0)191 238 2200
Fax: +44 (0)191 275 9786 Email: [email protected]
Website: www.penspenintegrity.com
69Quarter 2, 2005
�����������
������������� � ��
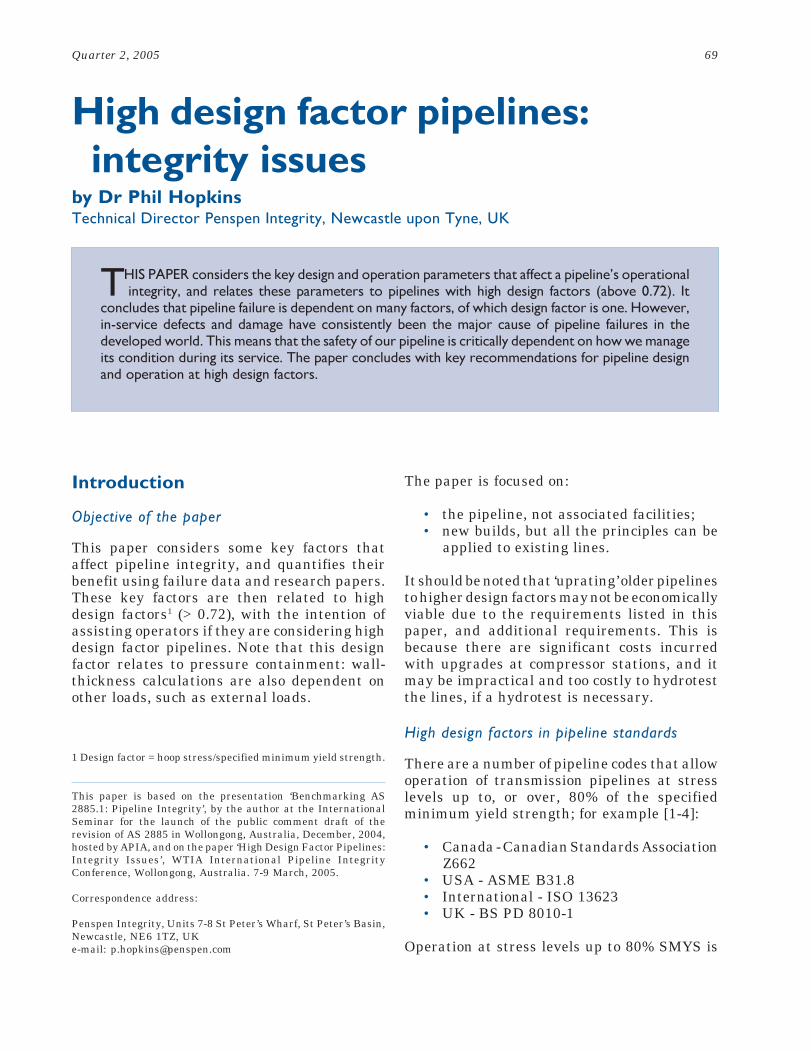
This paper considers some key factors thataffect pipeline integrity, and quantifies theirbenefit using failure data and research papers.These key factors are then related to highdesign factors1 (> 0.72), with the intention ofassisting operators if they are considering highdesign factor pipelines. Note that this designfactor relates to pressure containment: wall-thickness calculations are also dependent onother loads, such as external loads.
The paper is focused on:
• the pipeline, not associated facilities;• new builds, but all the principles can be
applied to existing lines.
It should be noted that ‘uprating’ older pipelinesto higher design factors may not be economicallyviable due to the requirements listed in thispaper, and additional requirements. This isbecause there are significant costs incurredwith upgrades at compressor stations, and itmay be impractical and too costly to hydrotestthe lines, if a hydrotest is necessary.
������������������ � ��������������
There are a number of pipeline codes that allowoperation of transmission pipelines at stresslevels up to, or over, 80% of the specifiedminimum yield strength; for example [1-4]:
• Canada - Canadian Standards AssociationZ662
• USA - ASME B31.8• International - ISO 13623• UK - BS PD 8010-1
Operation at stress levels up to 80% SMYS is
This paper is based on the presentation ‘Benchmarking AS2885.1: Pipeline Integrity’, by the author at the InternationalSeminar for the launch of the public comment draft of therevision of AS 2885 in Wollongong, Australia, December, 2004,hosted by APIA, and on the paper ‘High Design Factor Pipelines:Integrity Issues’, WTIA International Pipeline IntegrityConference, Wollongong, Australia. 7-9 March, 2005.
Correspondence address:
Penspen Integrity, Units 7-8 St Peter’s Wharf, St Peter’s Basin,Newcastle, NE6 1TZ, UKe-mail: [email protected]
������������� ������������� ���� ��������
�� �������������������������� ����������������������������� ��������
������������� ���������������� ������������ ��������������������������� ��� ���������� ��� ����� ���������������� ����������������� ��� ��� ����� ���� ������ ��� ������ ��� ��!"#$%"� ��
��&���������� ��� ����� �&��� ������������������������������ ����� �������� ����"���� ��� �'��� ��������� ������������� ���� ������������� ������(���&������ ��� ��� �� �&���� �� ����� ����������"�)� ��������������������������&��� ��� ��� ��� � ����������������������������� ����� � ���&� ��� ������ �"�)�����������&����� ���������������� ������� ��� ������ ����������� ������ ������ ��������"
1 Design factor = hoop stress/specified minimum yield strength.
70 The Journal of Pipeline Integrity
also being considered in the Australian StandardAS 2885-1, and these standards will be coveredin more detail below.
There is significant operating experience ofhigh design factor pipelines in the USA andCanada [5]:
• USA: 68,000 mile-yrs (108,900 km-yrs)with design factors from 0.73 to 0.87;
• Canada: over 146,750 mile-yrs (234,800km-yrs) with design factors from 0.73 to0.80.
�������������������������
The demand for oil and (in particular) gascontinues to be high, for which demand in both
the UK and the USA is driving moves to increasepipeline design factors to 0.80 [5, 6].
�� ������� � ������������������� �����
Oil and gas transmission pipelines are a safeform of energy transportation compared to rail,road, and sea: Table 1 compares the safety ofpipelines with these other transportation modes.For example, road trucks cause 87.3 times moredeaths than pipelines, and are 34.7 times morelikely to cause a fire or explosion. Pipelines alsohave a low impact on the environment, both interms of their presence and possible pollution:
• Replacing even a modest-sized pipeline,which might transport 150,000brl/d,would require 750 tanker truck loads per
Table 1 [7]. Comparison of modes of energy transportation.
0
1 0
2 0
3 0
4 0
5 0
6 0
O t he r E & PF a c i l i t i e s
P i pe l i ne s
N o n- ta n k v e s s e l sB a r ge s
T a n k e r s
%
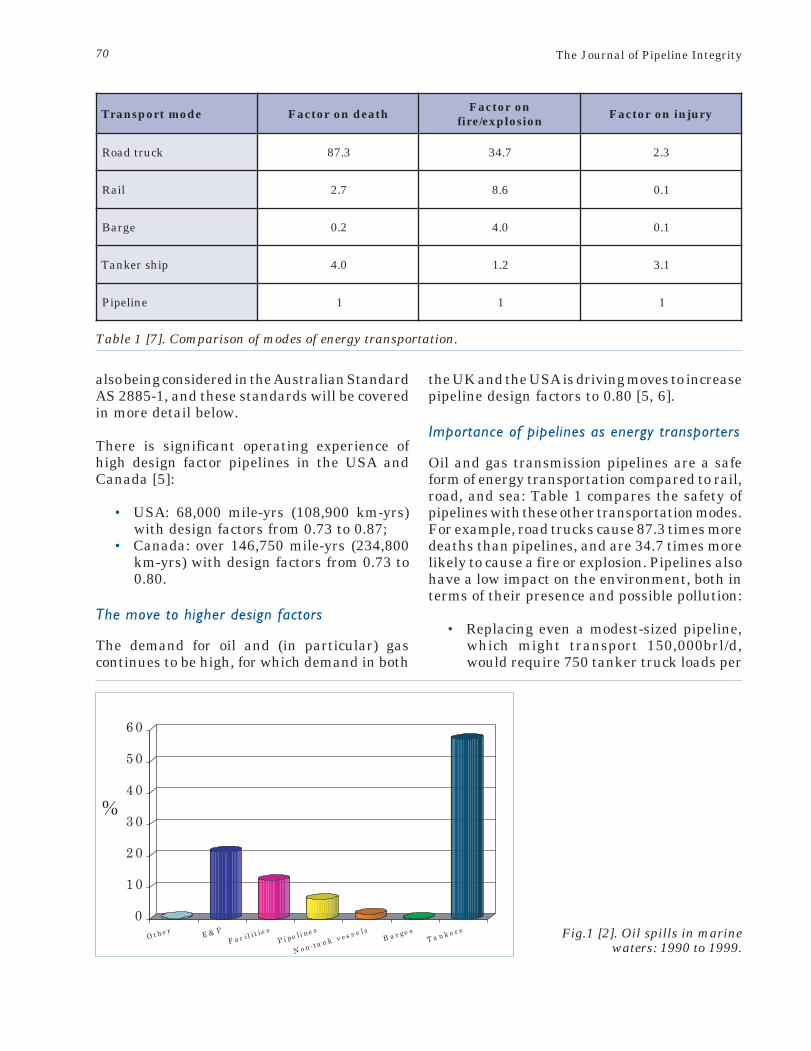
Fig.1 [2]. Oil spills in marinewaters: 1990 to 1999.
edomtropsnarT htaednorotcaF norotcaFnoisolpxe/erif yrujninorotcaF
kcurtdaoR 3.78 7.43 3.2
liaR 7.2 6.8 1.0
egraB 2.0 0.4 1.0
pihsreknaT 0.4 2.1 1.3
enilepiP 1 1 1
71Quarter 2, 2005
day [7]. That is a load delivered every twominutes around the clock. Replacing thesame pipeline with a railroad train oftank cars carrying 2,000brl each wouldrequire a 75-car train to arrive and beunloaded every day.
• Figure 1 [8] shows the amount of oil spilledin marine waters worldwide from 1990 to1999; the total amount was 943 milliongallons (2.9 million tons). Figure 1 showsthat pipeline spills amounted to 6% of thetotal spills. These amounts compare tothe Exxon Valdez which spilled 11 milliongallons (257,000brl); it was carrying 53million gallons.
Another attraction of pipelines is that theirsafety record is improving. Table 2 [9] is asummary of pipeline failure statistics for oiland gas pipelines in the USA and Europe. It canbe seen that recent years has seen a decrease inthe number of failures, despite the pipelineinfrastructure ageing.
Finally, it should be noted that operatingpipelines at higher design factors will increaseassociated failure risk slightly (see later), butthe alternative (to fulfill the demand for oil andgas) would be to use higher-risk modes of
transportation (Table 1), or additional pipelines(which have an associated risk).
�����������������������
Unfortunately, pipelines still fail, and theirfailures can have tragic consequences. Recentfailures in the USA [10] have resulted in the USDepartment of Transportation issuingregulations that require pipeline integrityvalidation (through inspection, testing, andanalysis) of pipelines that run through or nearhigh-consequence areas2 (HCAs). The codewriters have produced documents to helppipeline operators meet these new regulations[11, 12].
It is not only the USA that has experiencedserious pipeline failures: in August, 2004, a gaspipeline failed in Ghislenghien, Belgium with18 fatalities.
Consequently, we need to continually reviewour pipeline designs and operation to improveour pipeline safety, but we must never forget
doireP
mk0001/raeyrepstnedicnI
eporuE ASU
liO
9791-0791 67.0 82.1
1002-6891 03.0 55.0
1002-7991 12.0 55.0
saG
0891-1791 36.0 -
1002-6891 03.0 84.0
1002-7991 12.0 83.0
Table 2 [9]. Failure data for USA and European pipelines.
2 HCAs are defined for liquid lines as populated areas,commercially-navigable waterways, and areas that are unusuallysensitive to environmental damage. For gas lines they aretypically Class 3 and 4 locations as defined in ASME B31.8 [1].
72 The Journal of Pipeline Integrity
that we are dealing with a good, efficient, andsafe mode of energy transportation.
��������������������������������������
‘Pipeline integrity’ is ensuring a pipeline is safeand secure, and involves all aspects of apipeline’s design, inspection, management,operation, and maintenance. ‘Pipeline integritymanagement’ is the management of all theseaspects.
Any management scheme must have a plan ofaction. Reference 11 (API 1160) considers anintegrity-management program as one that:
• identifies and analyses all events thatcould lead to failure
• examines likelihood and consequences ofpotential pipeline incidents
• examines and compares all risks• provides a framework to select and
implement risk mitigation measures• establishes and tracks performance, with
the goal of improvement
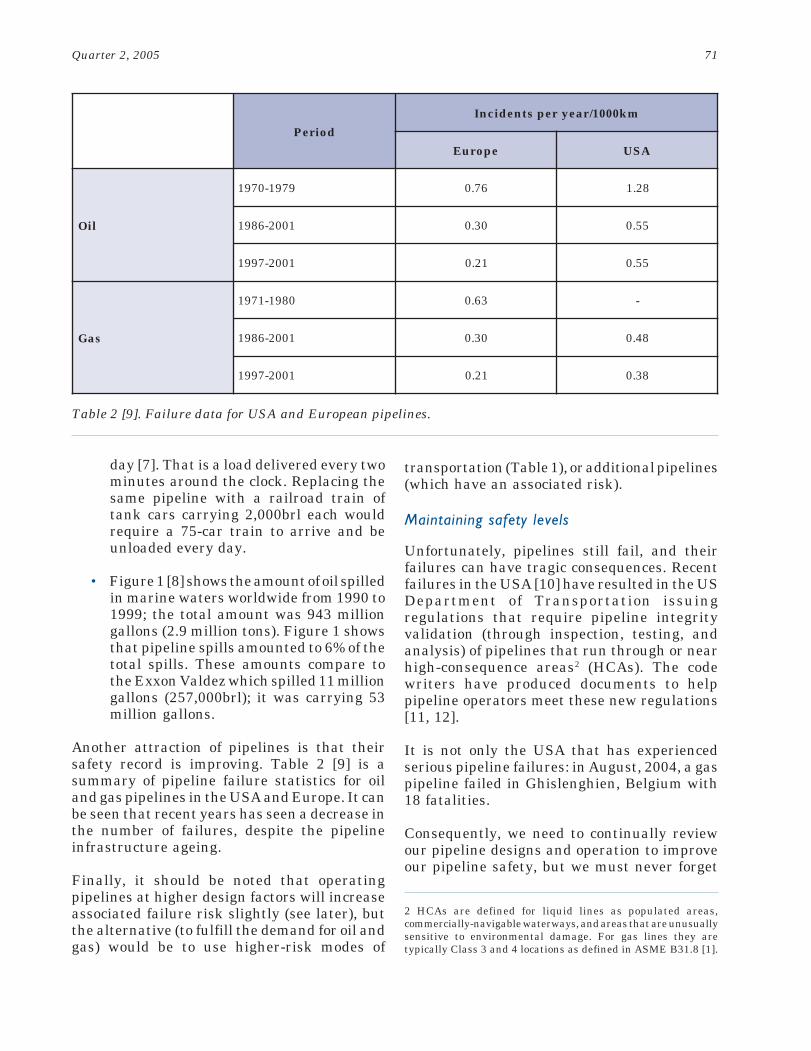
Reference 12 (ASME B31.8S) presents a simpleschematic of how a pipeline managementprogram is structured, Fig.2.
We are experiencing change in the pipelinebusiness: poor-quality materials and a lack ofunderstanding of major risk meant that, 30years ago and before, we needed standards thatensured we had good-quality pipe, carefulrouteing, etc. But now we know that in-servicedefects (damage and corrosion – see next section)fail pipelines and cause casualties [13] (see nextsection). Hence, a pipeline’s ‘integrity’ isdependent on its design, operation, andmanagement, and pipeline standards need tochange to accommodate more on monitoringintegrity during a pipeline’s life.
Identify potentialpipeline impact
by threat
Gathering, reviewing& integrating data
Risk assessment
Evaluate all threats
Integrity assessment
Response to integrityassessment & mitigation
In line inspect,
hydrotest ,direct
assessment,or ‘other’
Fig.2 [12]. Integrity management process flow diagram from ASME B31.8S.
73Quarter 2, 2005
�������������������
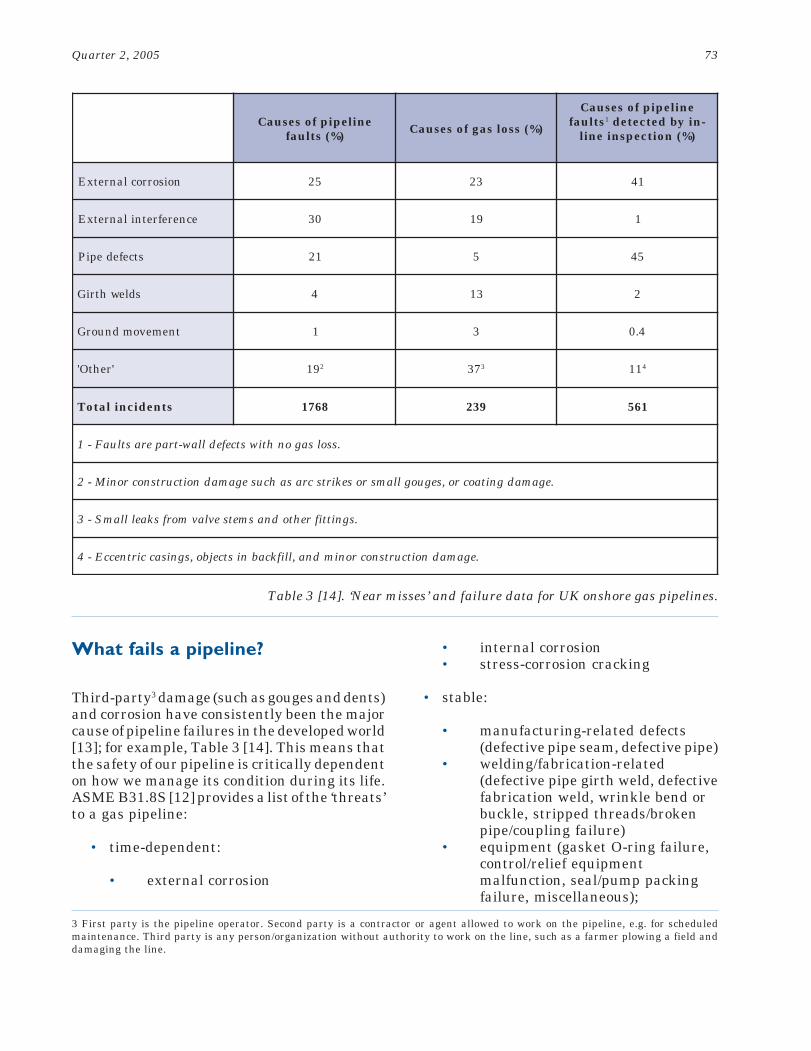
Third-party3 damage (such as gouges and dents)and corrosion have consistently been the majorcause of pipeline failures in the developed world[13]; for example, Table 3 [14]. This means thatthe safety of our pipeline is critically dependenton how we manage its condition during its life.ASME B31.8S [12] provides a list of the ‘threats’to a gas pipeline:
• time-dependent:
• external corrosion
• internal corrosion• stress-corrosion cracking
• stable:
• manufacturing-related defects(defective pipe seam, defective pipe)
• welding/fabrication-related(defective pipe girth weld, defectivefabrication weld, wrinkle bend orbuckle, stripped threads/brokenpipe/coupling failure)
• equipment (gasket O-ring failure,control/relief equipmentmalfunction, seal/pump packingfailure, miscellaneous);
enilepipfosesuaC)%(stluaf )%(ssolsagfosesuaC
enilepipfosesuaCstluaf 1 -niybdetceted
)%(noitcepsnienil
noisorroclanretxE 52 32 14
ecnerefretnilanretxE 03 91 1
stcefedepiP 12 5 54
sdlewhtriG 4 31 2
tnemevomdnuorG 1 3 4.0
'rehtO' 91 2 73 3 11 4
stnedicnilatoT 8671 932 165
.ssolsagonhtiwstcefedllaw-traperastluaF-1
.egamadgnitaocro,seguogllamsrosekirtscrasahcusegamadnoitcurtsnocroniM-2
.sgnittifrehtodnasmetsevlavmorfskaelllamS-3
.egamadnoitcurtsnocronimdna,llifkcabnistcejbo,sgnisaccirtneccE-4
Table 3 [14]. ‘Near misses’ and failure data for UK onshore gas pipelines.
3 First party is the pipeline operator. Second party is a contractor or agent allowed to work on the pipeline, e.g. for scheduledmaintenance. Third party is any person/organization without authority to work on the line, such as a farmer plowing a field anddamaging the line.
74 The Journal of Pipeline Integrity
• time-independent:
• third-party/mechanical damage(damage inflicted by first, second, orthird parties (instantaneous/immediate failure), previously-damaged pipe (delayed failuremode), vandalism)
• incorrect operations (incorrectoperational procedure)
• weather-related and outside force(cold weather, lightning, heavy rainsor floods, earth movements).
Historically, metallurgical fatigue has not beena significant issue for gas pipelines. However, ifoperational modes change and pipelinesegments operate with significant pressurefluctuations, fatigue should be considered bythe operator as an additional factor. Otherthreats may apply to other pipelines (such asliquid lines), and lines in other countries (forinstance, sabotage).
It is interesting to note that failure data (Table3, example) does not usually differentiatebetween high- and low-stress pipelines, and theabove list from ASME B31.8S similarly doesnot differentiate. Additionally, a defect-freepipeline is not considered a threat; consequently,a new pipeline is not considered a failure threat.The threats develop as a pipeline is operatedand ages.
Indeed, probability analyses have shown [15]that the failure (reaching the above yieldinglimit) probability of a defect-free pipe operatingat 72% SMYS is 10-16 per km-yr. This numberlooks impressive, but it is meaningless. Thetotal length of transmission oil and gas (offshoreand onshore) pipelines in the UK is about40,000km; the age of the universe is 2 x 10¹²
years, and therefore 10-16 corresponds to onepipeline failure in eight UK pipeline systemssince the universe began! However, it doesillustrate the low probability of defect-freelinepipe failing a pipeline.
����������������������������
�������
Pipeline operators are always investigatingways to reduce the cost of new pipelines, orincrease their efficiency, without affectingreliability. These cost reductions can be achievedby using high-grade linepipe, new weldingmethods, etc. Another method of increasingcost effectiveness is to operate pipelines athigher stresses. Most pipelines codes aroundthe world limit design stresses to 72% of thelinepipe’s specified minimum yield strength(SMYS). However, UK, US, and Canadianpipeline codes allow operation at hoop stressesup to 80% SMYS, although current regulationsin the USA limit the stress to 72% SMYS.
������������
Pipeline standards have wall-thicknessrequirements for pressure containment. In mostpipeline-design standards or recommendations,the basic wall-thickness design requirement isbased on limiting the pipe hoop stress due tointernal pressure to an allowable stress, whichequals the SMYS multiplied by a design factor.This is implemented using the familiar Barlowequation:
σ φ σhcode
codecode y
pDt
= ≤2 (1)
in which σh is the hoop stress, p is the internalpressure, σy is the specified minimum yieldstress, Dcode is the diameter, tcode is the wallthickness, and fcode is the design factor.
From Eqn 1 it can be seen that pipe diameter,wall thickness, and design factor are keyvariables in pipeline design. The subscript ‘code’in Eqn 1 denotes the parameters of a specificstandard.
�� ����������
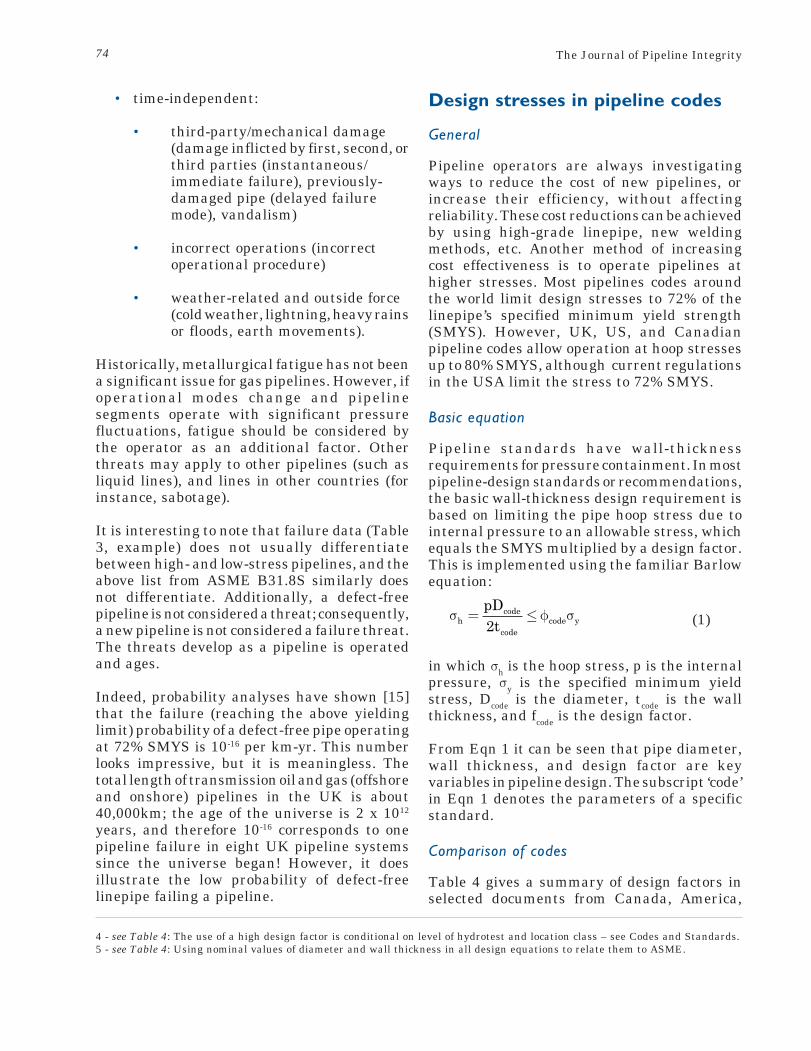
Table 4 gives a summary of design factors inselected documents from Canada, America,
4 - see Table 4: The use of a high design factor is conditional on level of hydrotest and location class – see Codes and Standards.5 - see Table 4: Using nominal values of diameter and wall thickness in all design equations to relate them to ASME.
75Quarter 2, 2005
Table 4 [16]. Maximum design factors in pipeline codes.
dradnatS ssalcnoitacoL rotcafngiseD 4 noitauqengiseD tnelaviuqE 5
rotcafngised a
266ZASC)adanaC( 1ssalC 08.0 08.0
8.13BEMSA)ASU( 1ssalC )1.viD(08.0
)2.viD(27.0)1.viD(08.0)2.viD(27.0
4.13BEMSA)ASU( 27.0 27.0
32631DCOSI b 1ssalC 38.0 87.0 c
1.5882SA)ailartsuA( )larurdaorb(1R 27.0 f 27.0
0563NEN)sdnalrehteN( b 1ssalC 27.0 76.0 c
1-0108DPSB)KU( 1ssalC 27.0 g 66.0 d
1/DT/EGI)KU( laruR
08.0 e 37.0 e
27.0 66.0 d
.8.13BEMSAfotamrofnoitauqengisedehtnodesaB-a
D-b gva D= mon t- nim
.%8-foecnarelotssenkcihtllawL5IPAehtdna56=t/DnodesaB-c
.%8-foecnarelotssenkcihtllawL5IPAehtnodesaB-d
sisisylanaytilibailerlarutcurtsadedivorpnoitarepo08.0swolla1/DT/EGIfo4noitidE1002ehT-e.sreenignEsaGfonoitutitsniehtsiEGI.noitarepoefaswohsotdetcudnoc
.08.0otrotcafngisedmumixamehtdesaercnisah1.5882SAfonoisivertfardehT-f
niylniam,deredisnocebnac27.0evobasrotcafngisedtahtsetats1-0108DPSBfonoitidE4002ehT-gyrotalugeRehthtiwdeergadna,tnemssessaksirllufaybdetroppusfi,)eratceh/snosrep5.2<(saera'1ssalC'
ehtsiSB.senilsaglarutannoecnadiugrehtrufrof1/DT/EGIotredaerehtstcerid0108DP.ytirohtuA.noitutitsnIsdradnatShsitirB
σhnom
pDt
=2
σhnom
pDt
=2
σhnom
pDt
=2
σhavgpD
t=
2 min
σhnom
pDt
=2
σhavgpD
t=
2 min
σh
pDt
=2 min
σh
pDt
=2 min
σh
pDt
=2 min
76 The Journal of Pipeline Integrity
Australia, Netherlands, and the UK; it alsoincludes the international ‘ISO’ standard. Forthe standards reviewed, the design equationsand design factors used in the least-developedareas (Class 1 in the USA) are summarized.While all design equations follow the format ofEqn 1, the definitions for diameter and wallthickness vary amongst different standards.The majority of the standards use the nominaloutside diameter, Dnom. The wall thickness isdefined as the nominal thickness, tnom, or theminimum thickness, tmin, where tmin is definedas the nominal thickness less the fabricationtolerance.
In order to compare the design factors fromvarious standards, the code-specific designfactor, fcode, was converted into an equivalentdesign factor, fequiv, which is associated with adesign equation that uses nominal dimensions,Dnom and tnom.
��������������� !�������"��������������
Table 4 shows that 0.72 and 0.80 are generallythe maximum design factors allowed in nationalcodes. The origins of the 72% and 80% SMYSlimits in the US and Canadian codes can betraced back many decades [17, 18, 19].
!"#$"#%&�'&�����(&)$��������� � ���������
The concept of basing design stress on apercentage of SMYS was the judgment ofmembers of the pressure piping committee ofthe American Standards Association (ASA) inthe 1950s. It was decided that a 1.25 safetyfactor applied to the (assumed) 90% SMYS milltest, would give an acceptable design factor of72% SMYS in ASA B31.1.8 in 1955.
!* $* %&�'&�����(&)$������������������
Since the mid-1950s, the pipeline industry inthe USA had been sponsoring pipeline researchunder the auspices of the Pipeline ResearchCommittee of the AGA [19]. In 1968, the AGA
published a research study [20] that indicated:
• it is inherently safer to base the maximumallowable operating pressure on the testpressure, which demonstrates the actualin-place yield strength of the pipeline,than to base it on SMYS alone;
• high-pressure hydrostatic testing is ableto remove defects that may fail in service;
• hydrostatic testing to actual yield, asdetermined with a pressure-volume plot,does not damage a pipeline.
The report specifically recommended thatallowable operating pressures be set as apercentage of the field test pressure. Inparticular, it recommended that the allowableoperating pressure be set at 80% of the testpressure, when the minimum test pressure is90% of SMYS or higher.
In 1966-67, a proposal was submitted to theASME B31.8 committee to allow the operationof pipelines above 72% SMYS. The same logicwas applied as in the case of 72% SMYS linesand the safety factor of 1.25 on the pipe milltest: pipelines hydrotested to 100% SMYS wouldbe able to operate at 80% SMYS. No progresswas made until the late 1970s and 1980s, whenthe ASME B31.8 committee again considered>72% SMYS pipelines, using the above studieson design, testing, and fracture control.
The above differences were resolved, and a1990 addendum to the 1989 ASME B31.8 Editionincluded provisions for the operation of pipelinesup to 80% SMYS.
!* $* %&�'&��������+##,
In 1972, the Canadian Standards AssociationTechnical Committee responsible for gaspipelines agreed to change the upper limit onmaximum allowable operating pressure to give80% SMYS, and this was incorporated in itspipeline code CSA Standard Z184-1973. Thischange was based on the documentationsubmitted to ASME in the late 1960s (see above).Both gas and liquid lines have been able tooperate at 0.8 in Canada.
77Quarter 2, 2005
)��� !"#$* %&�'&�����(-+./,
In the UK, the Pipelines Safety Regulations1996 (Statutory Instruments, 1996, No. 825)cover all transmission (of ‘hazardous fluids’)pipelines in the UK. The regulations are notprescriptive: they are explicitly ‘goal setting’.This means that operators of pipelines are notrestricted to prescriptive design codes, and canadditionally base design and operation on‘fitness-for-purpose’. Indeed, the guidance notesfor the regulations state that “A pipeline MAOP[maximum allowable operating pressure] mayneed to be raised above the original designpressure in some cases. If this is proposed, itwill probably have significant implications onthe pipeline integrity and risk which must befully evaluated.”
Consequently, UK pipeline operators workwithin a regulatory regime that supports theuse of risk-based design and structuralreliability methods, and risk-based design canbe used in the UK to design or uprate pipelinesto stress levels above 72% SMYS [4, 23].
National Grid Transco (formerly British Gas),has used structural reliability methods andrisk-based design to justify the uprating of keysections of its National Transmission System toabove 72% SMYS (24). The upratings wereneeded to meet forecasted increases in demandfor gas in the UK. The work conducted was thefirst practical application of ‘probabilistic limitstate design’ to an operating onshore pipeline[25]. Also, the Britannia gas line in the UKNorth Sea was designed, using these methods,to operate at 81% SMYS [26].
National Grid Transco has uprated (to above72% SMYS) nearly 20% of its 7000-km high-pressure gas National Transmission System,using the standard IGE/TD/1 as a design basis.Most of the uprated lines operate at a designfactor of 0.78, and are located in remote ruralareas in Scotland. The upratings have beenconducted over the past six years, and areconsidered by the UK regulator (the Health andSafety Executive) on a case-by-case basis. Theuprated pipelines have additional inspectionand maintenance requirements, such asadditional high-visibility markers, and
increased liaison with local contractors andlandowners. Additionally, lines operating at0.8 have overpressures limited to 6%.
Only gas lines have been uprated in the UK, inresponse to increased gas demand, particularlyfor power generation. There have been noreported problems with operating these higherdesign factor lines in the UK; the most recentoperating data are given in Table 5 [27].
0������������������������� � ������
The design factor (hoop stress over yield stress)is the inverse of ‘safety factor’. It allows for [13]:
• variability in materials• variability in construction practices• uncertainties in loading conditions• uncertainties in in-service conditions
The maximum design factor (0.80) in the pipelineindustry is high compared to other industries.When we cannot ‘prove’ the condition of a newstructure, we have a low design factor: forinstance, bridges and ships have a design factorof about 0.6. If the structure may buckle, we willreduce this to about 0.5. If we can ‘prove’ thestructure prior to service, or if we have high‘redundancy’ in the structure, we can toleratehigher design factors: as we can proof testpipelines, thus we have higher design factors.
It should be emphasized that the 0.72 and 0.80design factors are historical artefacts: they haveno structural significance.
#���������������������������������������������������������
This section will consider the effect of thefollowing pipeline design and operationparameters on the integrity of pipelines:
• pipe wall thickness• type of machine working near line• pipe diameter• pipeline design factor• depth of cover• protective measures
78 The Journal of Pipeline Integrity
• pipeline surveillance• pipeline one-call system• type of defect in pipeline• in-line inspection• crack propagation• stress -corrosion cracking• low temperatures• axial stresses• fatigue• overpressures: do we need to reduce them?• consequences of failure
The major threat to pipelines, in terms ofnumbers of failures and consequences of failure,
is third-party damage. This is covered in detailwhen each of the above parameters is reviewed.
It is acknowledged that the above parametersare interrelated (for instance, Eqn 2, below),and any appraisal of them in isolation requiresthis warning. Also, care needs to be exercisedwhen dealing with failure statistics: thestatistics are based on varying assumptionsand criteria, and differing countries havediffering pipeline geometries and environments.For example, Australia has extensive small-diameter, thin-walled pipelines, and this typeof pipeline geometry may not be covered inother countries’ statistics.
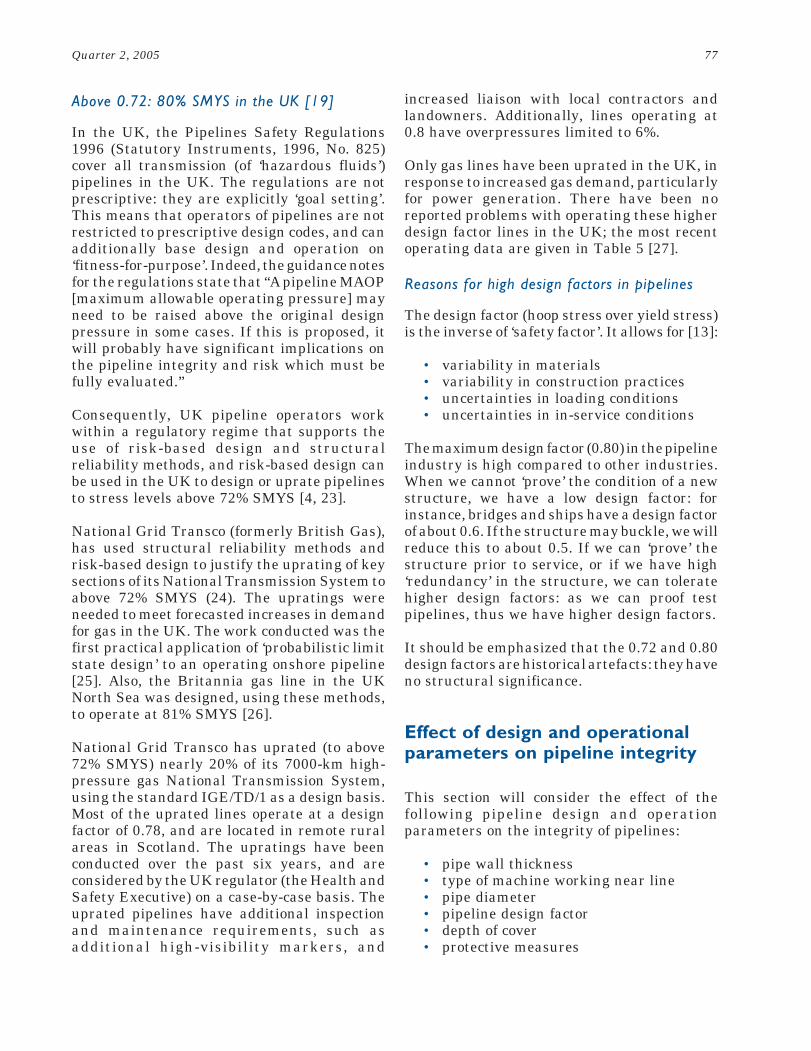
Table 5 [27]. Selected pipelinefailure data from UK pipelines.
6 Period of data collection.
7 Data for urban areas is limited.Rural = population density < 2.5 persons per hectare.Suburban (including semi-rural) = population density > 2.5 persons per hectare and which may be extensively developed withresidential properties.
retemaraP 01/ycneuqerF 4- raey.mk
egafotceffE.1 6 )sraey(
0991-1691 0.4
0002-0991 9.0
)ni(retemaidfotceffE.2
61-0 1.1
84-81 2.0
)mm(ssenkcihtllawfotceffE.3
01-0 0.2
01> 9.0
ssalcnoitacolfotceffE.4 7
laruR 5.0
nabrubuS 8.1
79Quarter 2, 2005
1� �2�������3����
Considerable work has been undertaken overthe past 20 years (see refs 29-31) to investigatethe resistance of pipelines to damage. Forexample, early work [29, 30] showed that only5% of the excavators which are likely to be usedin suburban areas have the capacity to penetratea 11.9-mm wall, but none have the capacity toproduce a hole of > 80mm diameter.
The European Pipeline Research Group hasbeen researching pipeline puncture resistancefor many years (see ref. 31), and has producedformulae that show the benefit of increasedwall thickness on puncture resistance. Forexample:
pipeline puncture resistance =[1.17 – 0.0029(D/t)].(l+w).(t.σu) (2)
where:
t = pipe wall thicknessD = pipe outside diameterl, w = length, width of digger toothσu = ultimate tensile strength
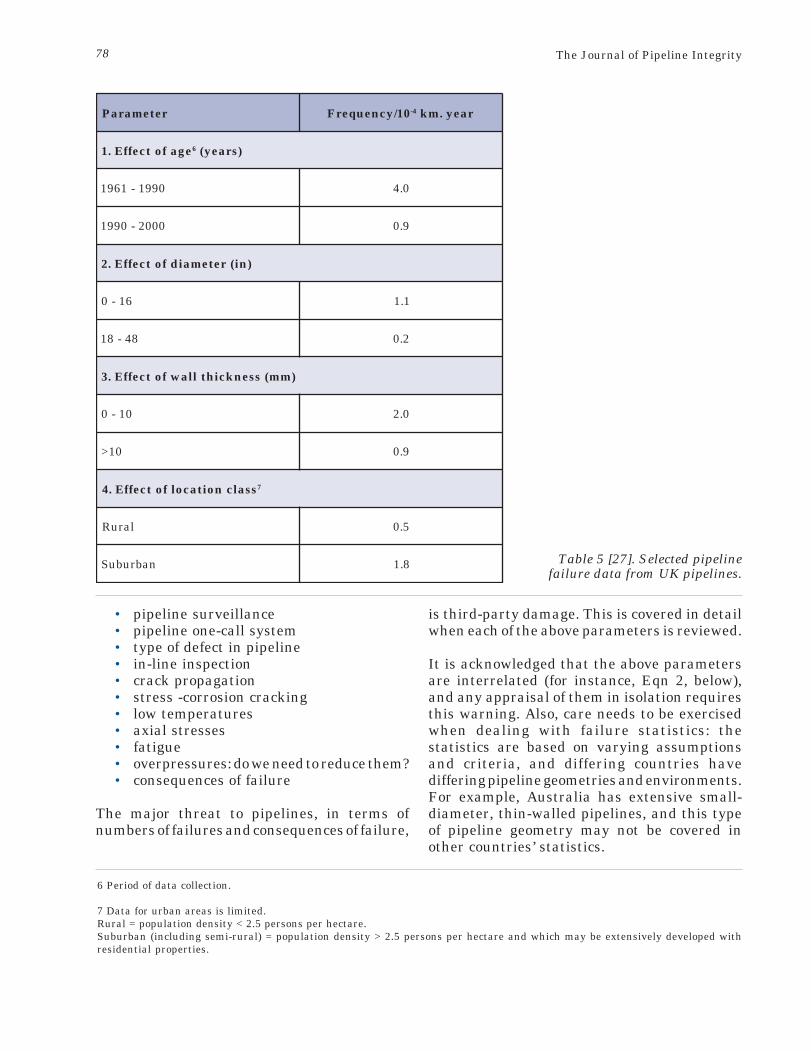
A review of UK pipeline failure data is shown inTable 6 [14], which shows that thicker-wallpipelines have a lower failure frequency thanthinner-walled lines. Another review of theeffect of wall thickness [32] using failure datafrom European onshore gas lines [33] is shownin Table 7. It is concluded that increasing wallthickness reduces failures from third-partydamage, and this is confirmed by Eqn 2.
�� ���������2�3������������
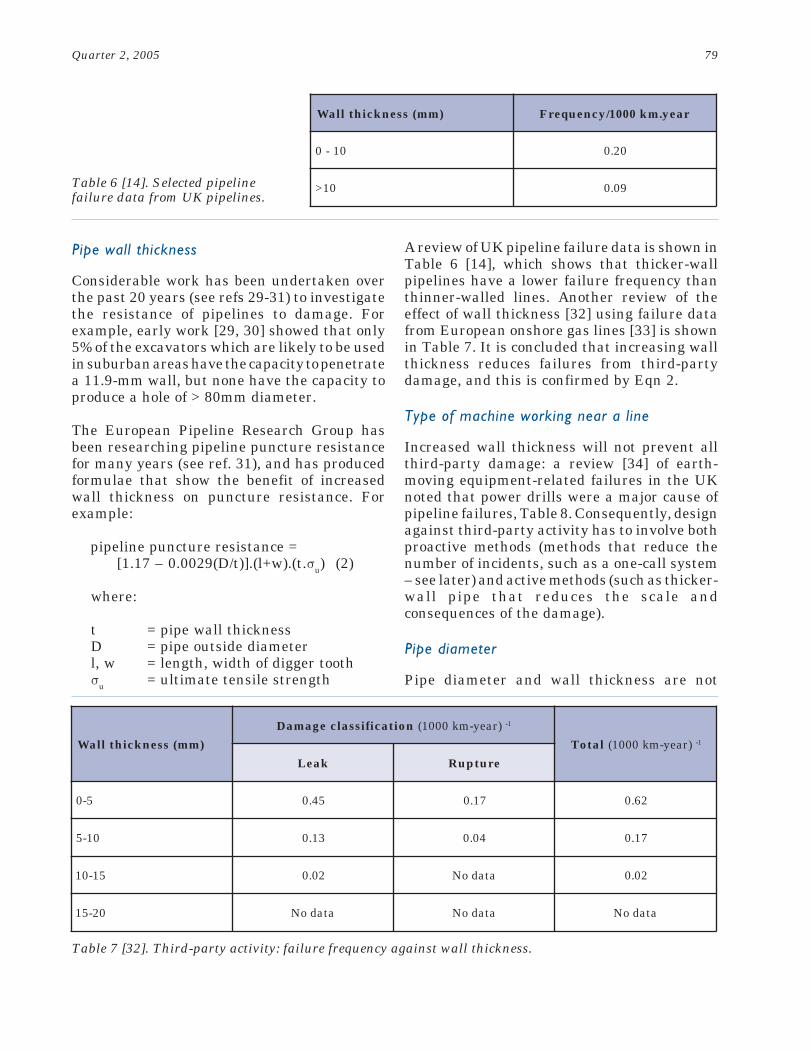
Increased wall thickness will not prevent allthird-party damage: a review [34] of earth-moving equipment-related failures in the UKnoted that power drills were a major cause ofpipeline failures, Table 8. Consequently, designagainst third-party activity has to involve bothproactive methods (methods that reduce thenumber of incidents, such as a one-call system– see later) and active methods (such as thicker-wall pipe that reduces the scale andconsequences of the damage).
1� ���������
Pipe diameter and wall thickness are not
)mm(ssenkcihtllaW raey.mk0001/ycneuqerF
01-0 02.0
01> 90.0
)mm(ssenkcihtllaW
noitacifissalcegamaD )raey-mk0001( 1-
latoT )raey-mk0001( 1-
kaeL erutpuR
5-0 54.0 71.0 26.0
01-5 31.0 40.0 71.0
51-01 20.0 atadoN 20.0
02-51 atadoN atadoN atadoN
Table 6 [14]. Selected pipelinefailure data from UK pipelines.
Table 7 [32]. Third-party activity: failure frequency against wall thickness.
80 The Journal of Pipeline Integrity
independent parameters in pipeline designs:larger-diameter pipelines usually have thickerwall thickness in onshore lines. Therefore,assessing the effect of diameter on failure datamay mask an additional effect of wall thickness(see Eqn 2).
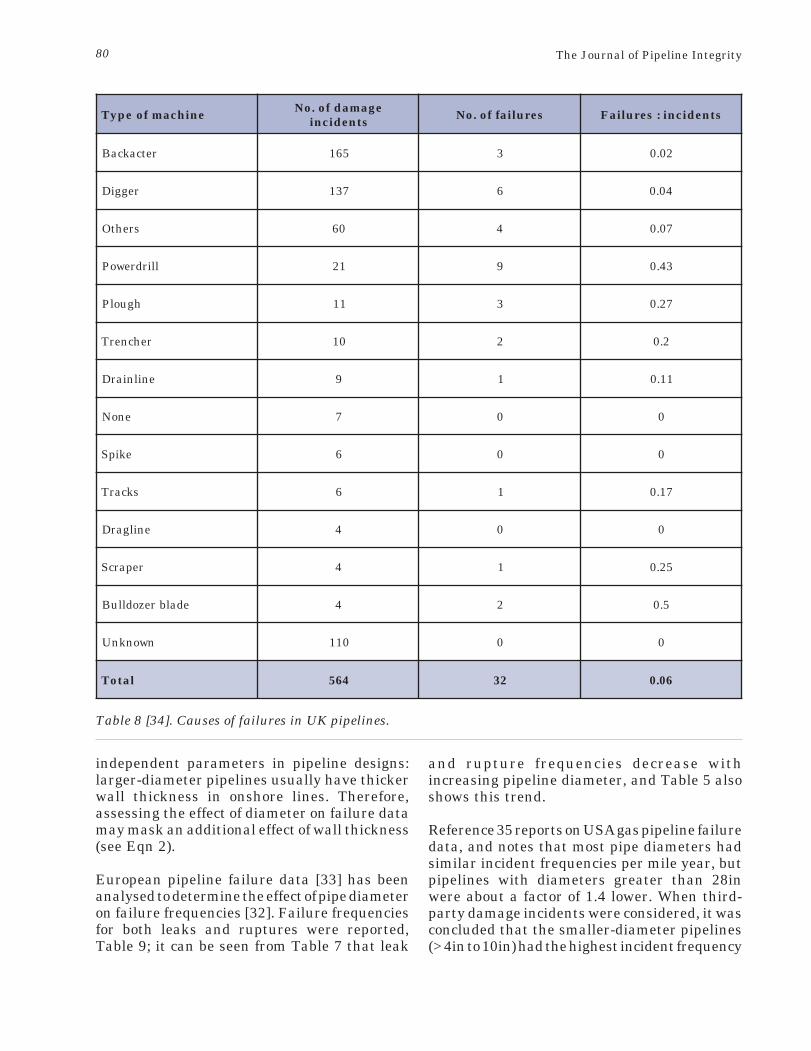
European pipeline failure data [33] has beenanalysed to determine the effect of pipe diameteron failure frequencies [32]. Failure frequenciesfor both leaks and ruptures were reported,Table 9; it can be seen from Table 7 that leak
and rupture frequencies decrease withincreasing pipeline diameter, and Table 5 alsoshows this trend.
Reference 35 reports on USA gas pipeline failuredata, and notes that most pipe diameters hadsimilar incident frequencies per mile year, butpipelines with diameters greater than 28inwere about a factor of 1.4 lower. When third-party damage incidents were considered, it wasconcluded that the smaller-diameter pipelines(> 4in to 10in) had the highest incident frequency
enihcamfoepyT egamadfo.oNstnedicni seruliaffo.oN stnedicni:seruliaF
retcakcaB 561 3 20.0
reggiD 731 6 40.0
srehtO 06 4 70.0
llirdrewoP 12 9 34.0
hguolP 11 3 72.0
rehcnerT 01 2 2.0
enilniarD 9 1 11.0
enoN 7 0 0
ekipS 6 0 0
skcarT 6 1 71.0
enilgarD 4 0 0
reparcS 4 1 52.0
edalbrezodlluB 4 2 5.0
nwonknU 011 0 0
latoT 465 23 60.0
Table 8 [34]. Causes of failures in UK pipelines.
81Quarter 2, 2005
(0.00008 incidents per mile year), with incidentsper mile year decreasing with increasing pipediameter (> 28in diameter had 0.00002 incidentsper mile year).
1� ����������������
A recent review [19] of high design factorpipelines found no evidence that a higher designfactor will lead to higher failure rates: this wasexpected, as the major causes of failure ofoperating pipelines in the Western World arecorrosion and external interference, the
incidencies of which are not dependent on designfactor.
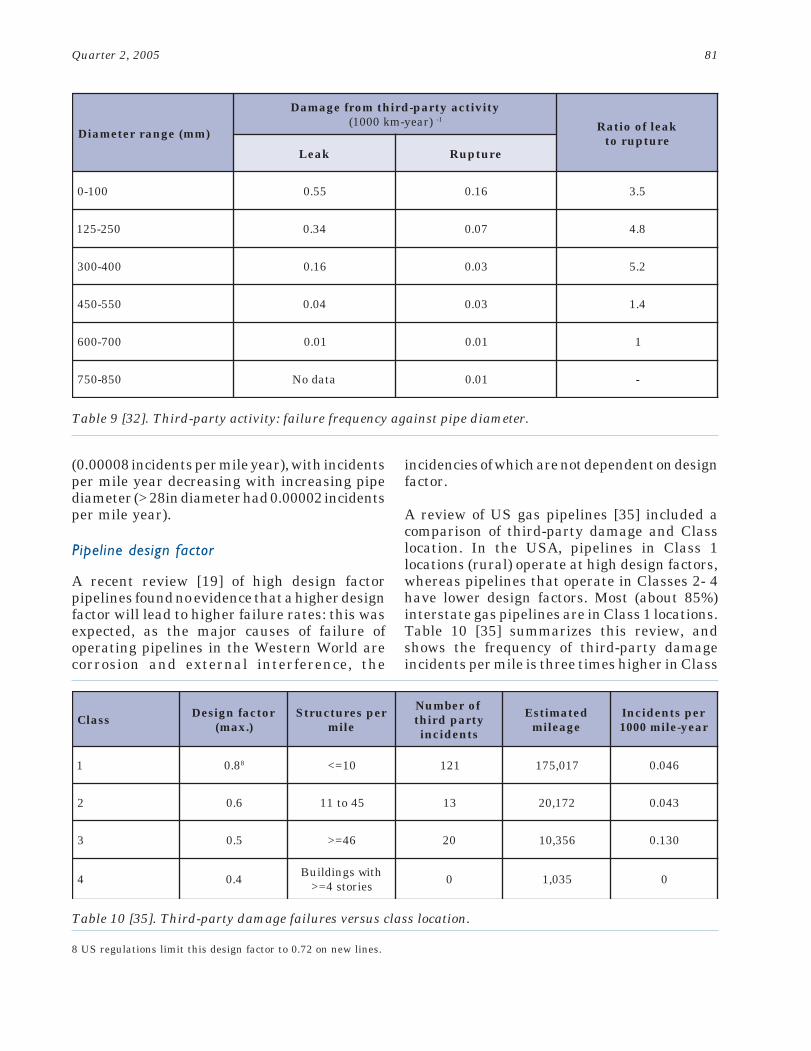
A review of US gas pipelines [35] included acomparison of third-party damage and Classlocation. In the USA, pipelines in Class 1locations (rural) operate at high design factors,whereas pipelines that operate in Classes 2- 4have lower design factors. Most (about 85%)interstate gas pipelines are in Class 1 locations.Table 10 [35] summarizes this review, andshows the frequency of third-party damageincidents per mile is three times higher in Class
)mm(egnarretemaiD
ytivitcaytrap-drihtmorfegamaD)raey-mk0001( 1-
kaelfooitaRerutpurot
kaeL erutpuR
001-0 55.0 61.0 5.3
052-521 43.0 70.0 8.4
004-003 61.0 30.0 2.5
055-054 40.0 30.0 4.1
007-006 10.0 10.0 1
058-057 atadoN 10.0 -
Table 9 [32]. Third-party activity: failure frequency against pipe diameter.
Table 10 [35]. Third-party damage failures versus class location.
8 US regulations limit this design factor to 0.72 on new lines.
ssalC rotcafngiseD).xam(
repserutcurtSelim
forebmuNytrapdriht
stnedicni
detamitsEegaelim
repstnedicnIraey-elim0001
1 8.0 8 01=< 121 710,571 640.0
2 6.0 54ot11 31 271,02 340.0
3 5.0 64=> 02 653,01 031.0
4 4.0 htiwsgnidliuBseirots4=> 0 530,1 0
82 The Journal of Pipeline Integrity
3 locations, which is similar to the UK data inTable 5. Class 3 locations are in higher-population areas that would be expected tohave higher third-party activities.
Reference 35 also reviewed the corrosionincidents in each Class location. The datashowed that Class 1 locations had the highestnumber of internal corrosion incidents per mileyear, and Class 3 locations had the highestincidence per mile year of external corrosion.The report says that these figures warrantedfurther investigation.
Reference 28 analyzed US pipeline failure datato answer the question “Are design factor andincident frequency related?” The authorsconcluded that incident frequency did notincrease with design factor; in fact, the trendwas the opposite. This can be partly explainedby the fact that many factors other than designfactor control the likelihood of a failure [28].These factors include [36]:
• wall thickness• linepipe and construction quality• depth of cover• protective measures• location class• surveillance of the pipeline• public awareness of pipeline presence• inspections of pipeline• corrosion control• pressure control• ground conditions• hydrotest
The design factor and failure data will bediscussed below.
4� �������
Increasing the depth of cover over a pipelinecan reduce the likelihood of external interferencedamage by reducing the proportion of excavationactivities reaching a depth which could interferewith the pipeline.
The effect of increasing the depth of cover can beevaluated by studying damage data on pipelinesystems. In the UK, the method used is to relatethe frequency of damage at any depth of coverto the pipeline length and exposure at thatdepth, so that comparisons can be made forvarious depths. Reference 37 gives thesecomparisons: in summary, the likelihood ofdamage is reduced by more than 10 times byincreasing the depth of cover from 1.1m to 2.2m.
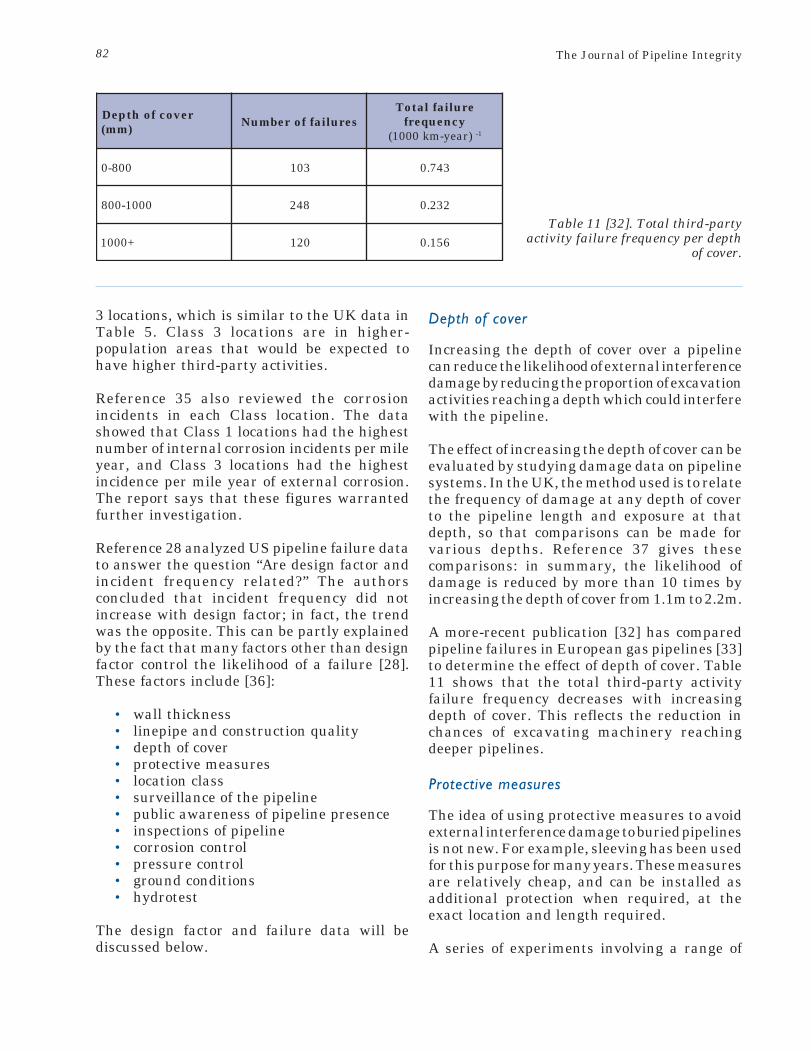
A more-recent publication [32] has comparedpipeline failures in European gas pipelines [33]to determine the effect of depth of cover. Table11 shows that the total third-party activityfailure frequency decreases with increasingdepth of cover. This reflects the reduction inchances of excavating machinery reachingdeeper pipelines.
1����������������
The idea of using protective measures to avoidexternal interference damage to buried pipelinesis not new. For example, sleeving has been usedfor this purpose for many years. These measuresare relatively cheap, and can be installed asadditional protection when required, at theexact location and length required.
A series of experiments involving a range of
revocfohtpeD)mm( seruliafforebmuN
eruliaflatoTycneuqerf
)raey-mk0001( 1-
008-0 301 347.0
0001-008 842 232.0
+0001 021 651.0
Table 11 [32]. Total third-partyactivity failure frequency per depth
of cover.
83Quarter 2, 2005
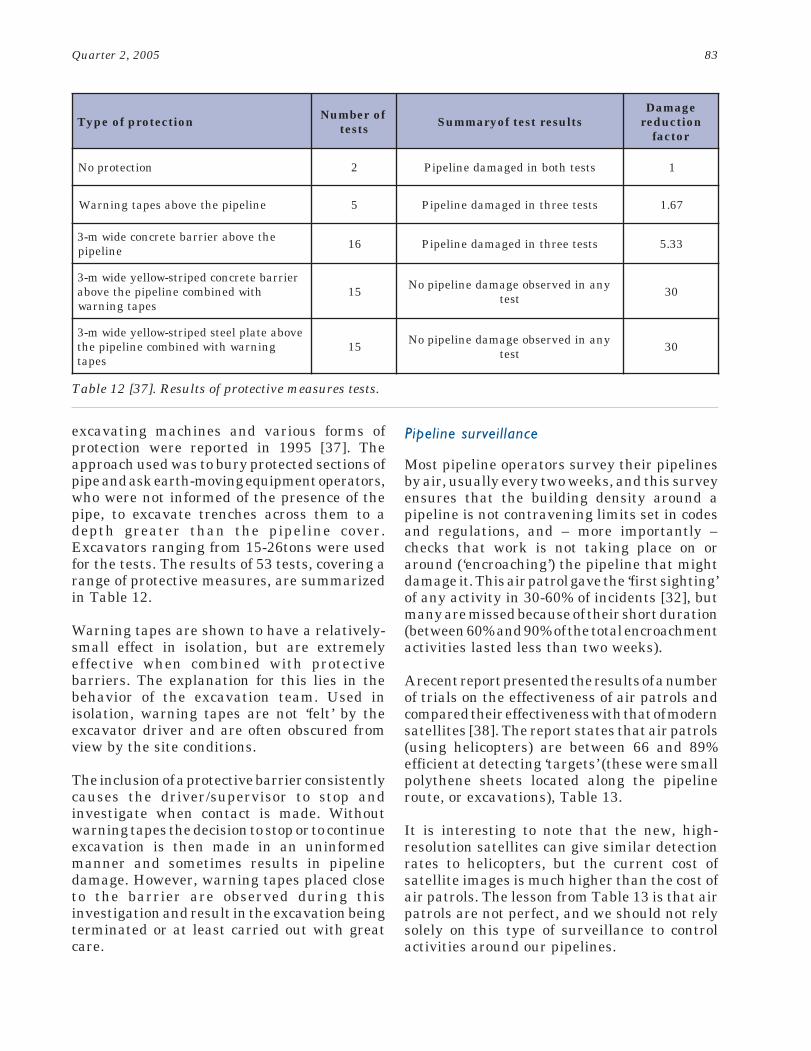
excavating machines and various forms ofprotection were reported in 1995 [37]. Theapproach used was to bury protected sections ofpipe and ask earth-moving equipment operators,who were not informed of the presence of thepipe, to excavate trenches across them to adepth greater than the pipeline cover.Excavators ranging from 15-26tons were usedfor the tests. The results of 53 tests, covering arange of protective measures, are summarizedin Table 12.
Warning tapes are shown to have a relatively-small effect in isolation, but are extremelyeffective when combined with protectivebarriers. The explanation for this lies in thebehavior of the excavation team. Used inisolation, warning tapes are not ‘felt’ by theexcavator driver and are often obscured fromview by the site conditions.
The inclusion of a protective barrier consistentlycauses the driver/supervisor to stop andinvestigate when contact is made. Withoutwarning tapes the decision to stop or to continueexcavation is then made in an uninformedmanner and sometimes results in pipelinedamage. However, warning tapes placed closeto the barrier are observed during thisinvestigation and result in the excavation beingterminated or at least carried out with greatcare.
����������������� �
Most pipeline operators survey their pipelinesby air, usually every two weeks, and this surveyensures that the building density around apipeline is not contravening limits set in codesand regulations, and – more importantly –checks that work is not taking place on oraround (‘encroaching’) the pipeline that mightdamage it. This air patrol gave the ‘first sighting’of any activity in 30-60% of incidents [32], butmany are missed because of their short duration(between 60% and 90% of the total encroachmentactivities lasted less than two weeks).
A recent report presented the results of a numberof trials on the effectiveness of air patrols andcompared their effectiveness with that of modernsatellites [38]. The report states that air patrols(using helicopters) are between 66 and 89%efficient at detecting ‘targets’ (these were smallpolythene sheets located along the pipelineroute, or excavations), Table 13.
It is interesting to note that the new, high-resolution satellites can give similar detectionrates to helicopters, but the current cost ofsatellite images is much higher than the cost ofair patrols. The lesson from Table 13 is that airpatrols are not perfect, and we should not relysolely on this type of surveillance to controlactivities around our pipelines.
Table 12 [37]. Results of protective measures tests.
noitcetorpfoepyT forebmuNstset stlusertsetfoyrammuS
egamaDnoitcuder
rotcaf
noitcetorpoN 2 stsethtobnidegamadenilepiP 1
enilepipehtevobasepatgninraW 5 stseteerhtnidegamadenilepiP 76.1
ehtevobareirrabetercnocediwm-3enilepip 61 stseteerhtnidegamadenilepiP 33.5
reirrabetercnocdepirts-wolleyediwm-3htiwdenibmocenilepipehtevoba
sepatgninraw51 ynanidevresboegamadenilepipoN
tset 03
evobaetalpleetsdepirts-wolleyediwm-3gninrawhtiwdenibmocenilepipeht
sepat51 ynanidevresboegamadenilepipoN
tset 03
84 The Journal of Pipeline Integrity
1� �������5�����������
A review [39] of liquid and gas lines in the USAcovered the effectiveness of one-call systems. Itconcluded that many failures occurred despitea one-call system being in place, and itrecommended a ‘strengthening’ of one-callsystems.
In the USA there were literally millions of one-call ‘tickets’ generated during the period of thereview (1985-1997). Reference 39 noted thatthere were 669 failures caused by third-partydamage during that period, and 51% occurred
when no one-call was made, and 49% occurredwhen a call was made. The most-effective one-call systems are those that are highly publicizedand enforced through the use of penalty fines. A‘best practice’ document for one-call systems[40] considered the most-critical component ofunderground facility damage prevention to becommunication between all stakeholders.
�� ���������� � �����
General
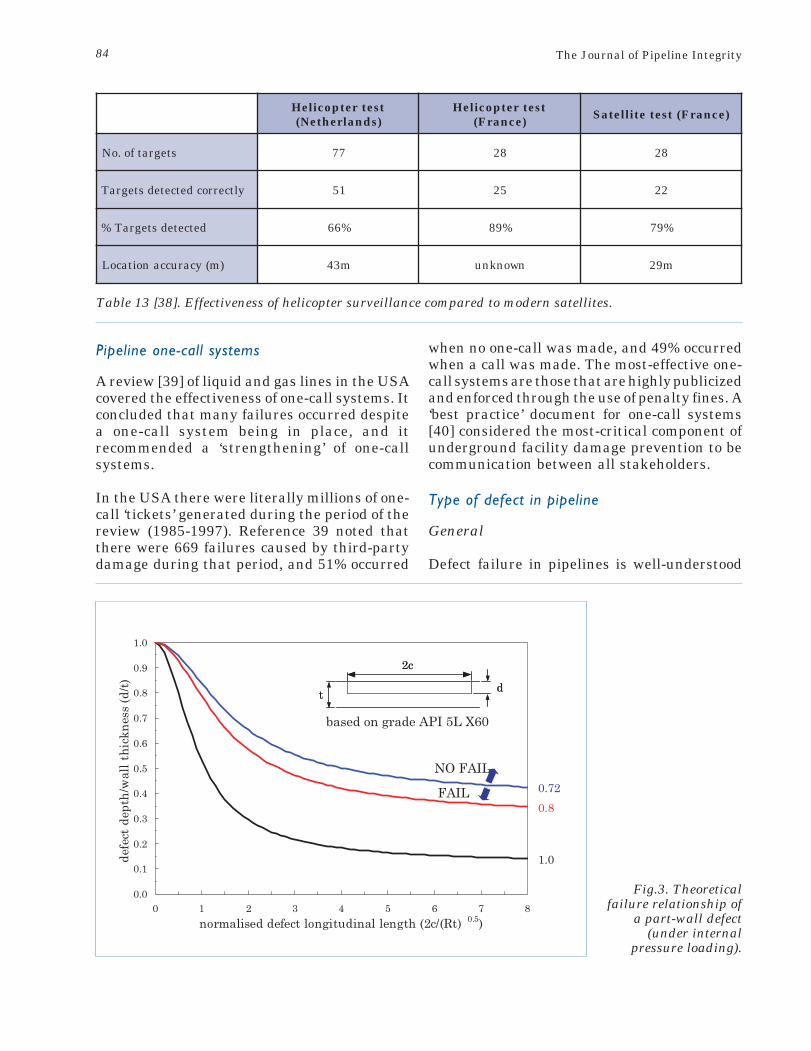
Defect failure in pipelines is well-understood
tsetretpocileH)sdnalrehteN(
tsetretpocileH)ecnarF( )ecnarF(tsetetilletaS
stegratfo.oN 77 82 82
yltcerrocdetcetedstegraT 15 52 22
detcetedstegraT% %66 %98 %97
)m(ycaruccanoitacoL m34 nwonknu m92
Table 13 [38]. Effectiveness of helicopter surveillance compared to modern satellites.
0.0
0.1
0.2
0.3
0.4
0.5
0.6
0.7
0.8
0.9
1.0
0 1 2 3 4 5 6 7 8normalised defect longitudinal length (2c/(Rt) 0.5)
defe
ct d
epth
/wal
l thi
ckne
ss (d
/t)
0.72 0.8
1.0
2c
t d
2c
t d
based on grade API 5L X60
NO FAIL
FAIL
Fig.3. Theoreticalfailure relationship of
a part-wall defect(under internal
pressure loading).
85Quarter 2, 2005
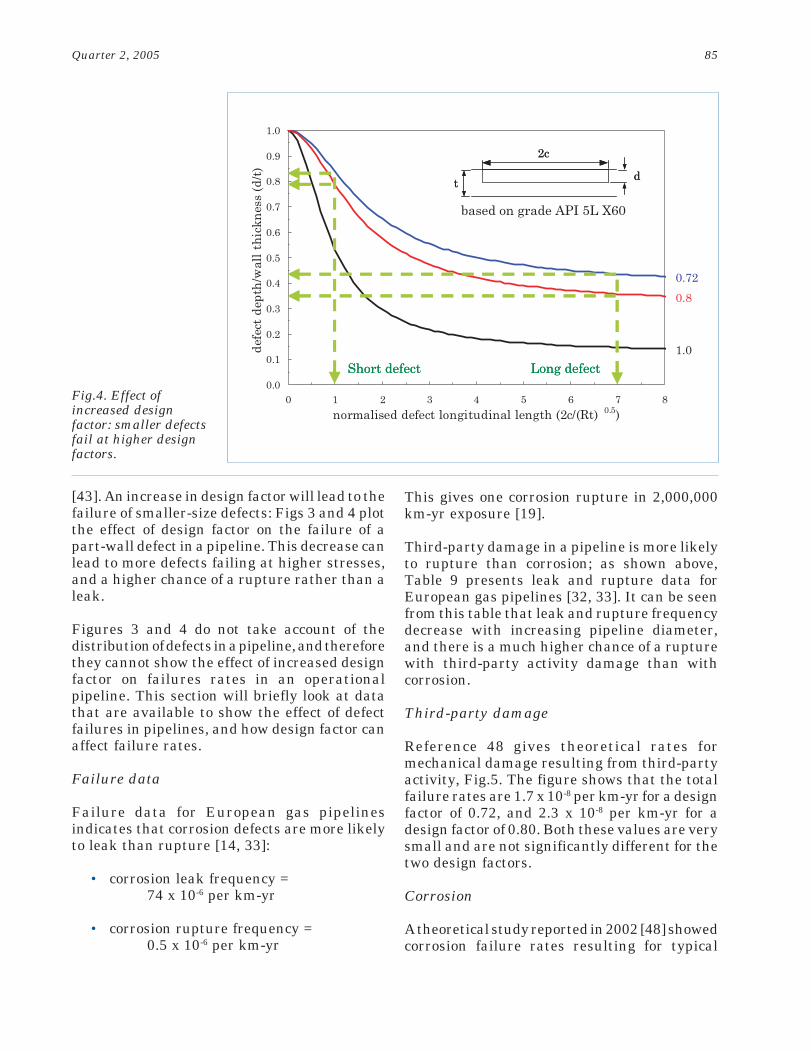
[43]. An increase in design factor will lead to thefailure of smaller-size defects: Figs 3 and 4 plotthe effect of design factor on the failure of apart-wall defect in a pipeline. This decrease canlead to more defects failing at higher stresses,and a higher chance of a rupture rather than aleak.
Figures 3 and 4 do not take account of thedistribution of defects in a pipeline, and thereforethey cannot show the effect of increased designfactor on failures rates in an operationalpipeline. This section will briefly look at datathat are available to show the effect of defectfailures in pipelines, and how design factor canaffect failure rates.
Failure data
Failure data for European gas pipelinesindicates that corrosion defects are more likelyto leak than rupture [14, 33]:
• corrosion leak frequency =74 x 10-6 per km-yr
• corrosion rupture frequency =0.5 x 10⁻⁶ per km-yr
This gives one corrosion rupture in 2,000,000km-yr exposure [19].
Third-party damage in a pipeline is more likelyto rupture than corrosion; as shown above,Table 9 presents leak and rupture data forEuropean gas pipelines [32, 33]. It can be seenfrom this table that leak and rupture frequencydecrease with increasing pipeline diameter,and there is a much higher chance of a rupturewith third-party activity damage than withcorrosion.
Third-party damage
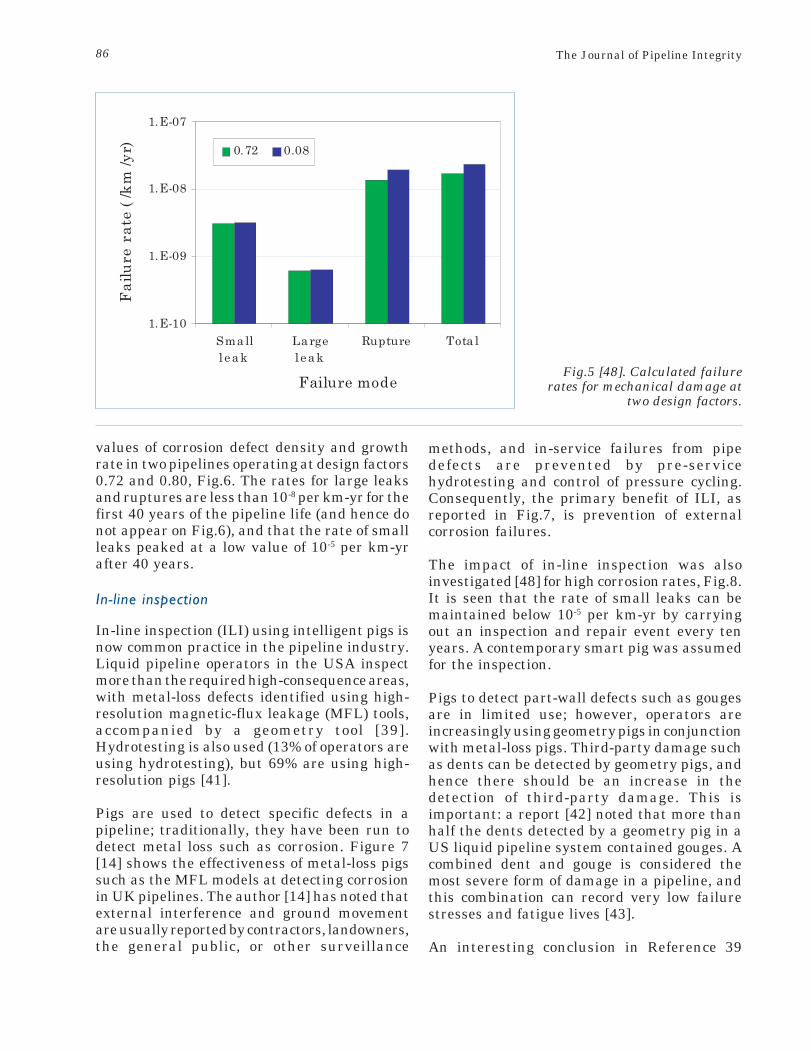
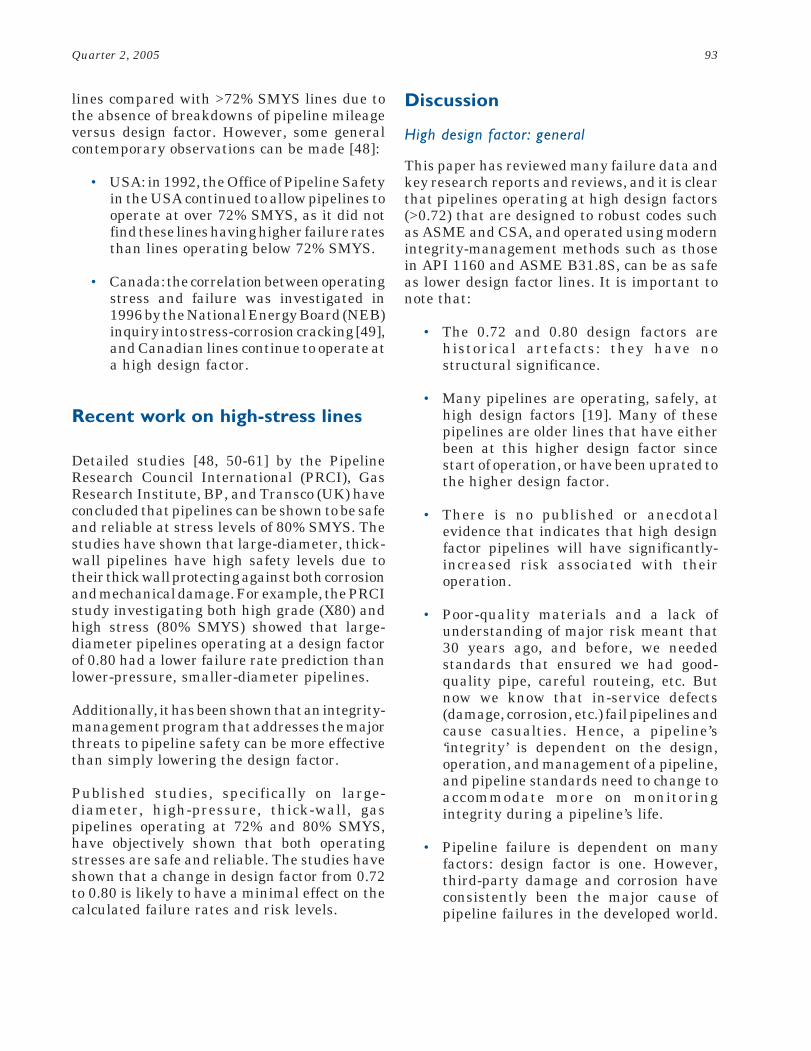
Reference 48 gives theoretical rates formechanical damage resulting from third-partyactivity, Fig.5. The figure shows that the totalfailure rates are 1.7 x 10⁻⁸ per km-yr for a designfactor of 0.72, and 2.3 x 10⁻⁸ per km-yr for adesign factor of 0.80. Both these values are verysmall and are not significantly different for thetwo design factors.
Corrosion
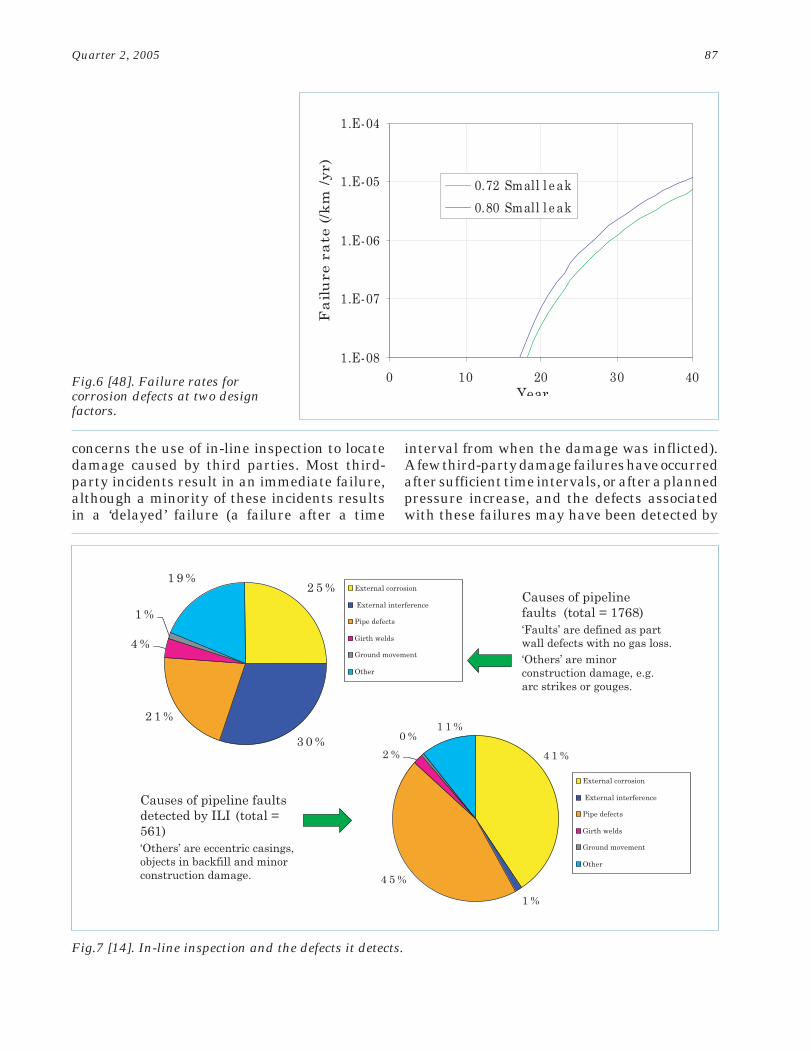
A theoretical study reported in 2002 [48] showedcorrosion failure rates resulting for typical
0.0
0.1
0.2
0.3
0.4
0.5
0.6
0.7
0.8
0.9
1.0
0 1 2 3 4 5 6 7 8normalised defect longitudinal length (2c/(Rt) 0.5)
defe
ct d
epth
/wal
l thi
ckne
ss (d
/t)
0.72 0.8
1.0
2c
t d
2c
t d
based on grade API 5L X60
Short defectShort defect Long defectLong defect
Fig.4. Effect ofincreased designfactor: smaller defectsfail at higher designfactors.
86 The Journal of Pipeline Integrity
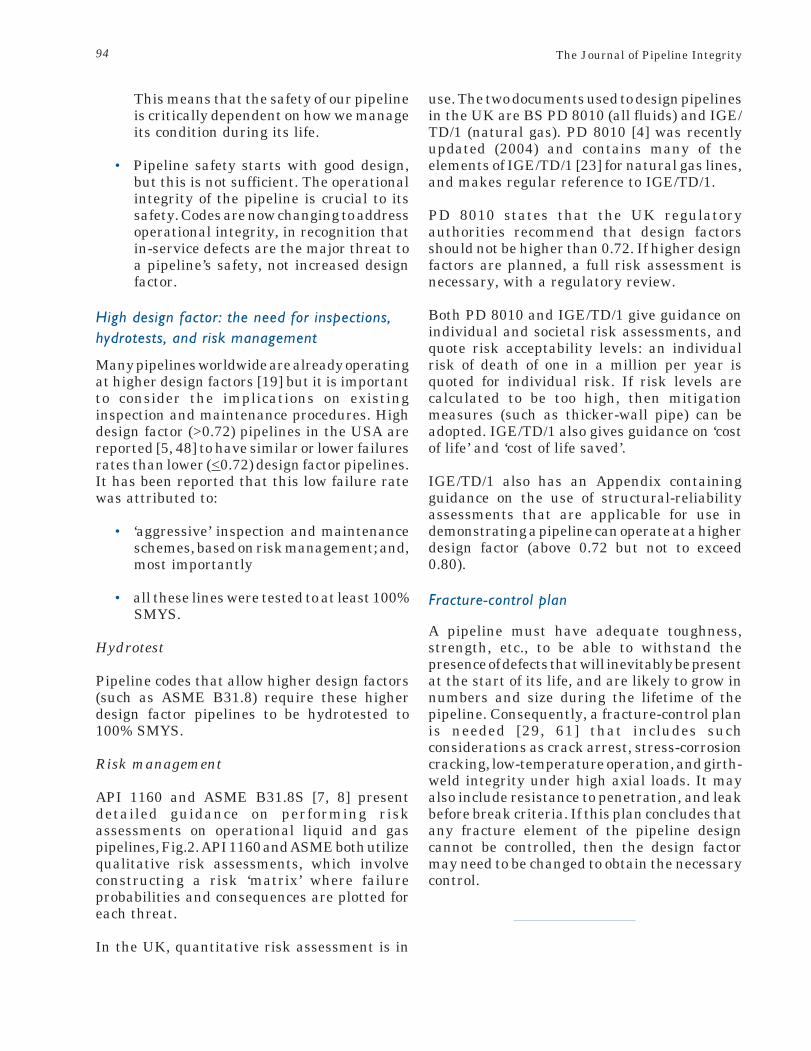
values of corrosion defect density and growthrate in two pipelines operating at design factors0.72 and 0.80, Fig.6. The rates for large leaksand ruptures are less than 10-8 per km-yr for thefirst 40 years of the pipeline life (and hence donot appear on Fig.6), and that the rate of smallleaks peaked at a low value of 10-5 per km-yrafter 40 years.
��5������� �����
In-line inspection (ILI) using intelligent pigs isnow common practice in the pipeline industry.Liquid pipeline operators in the USA inspectmore than the required high-consequence areas,with metal-loss defects identified using high-resolution magnetic-flux leakage (MFL) tools,accompanied by a geometry tool [39].Hydrotesting is also used (13% of operators areusing hydrotesting), but 69% are using high-resolution pigs [41].
Pigs are used to detect specific defects in apipeline; traditionally, they have been run todetect metal loss such as corrosion. Figure 7[14] shows the effectiveness of metal-loss pigssuch as the MFL models at detecting corrosionin UK pipelines. The author [14] has noted thatexternal interference and ground movementare usually reported by contractors, landowners,the general public, or other surveillance
methods, and in-service failures from pipedefects are prevented by pre-servicehydrotesting and control of pressure cycling.Consequently, the primary benefit of ILI, asreported in Fig.7, is prevention of externalcorrosion failures.
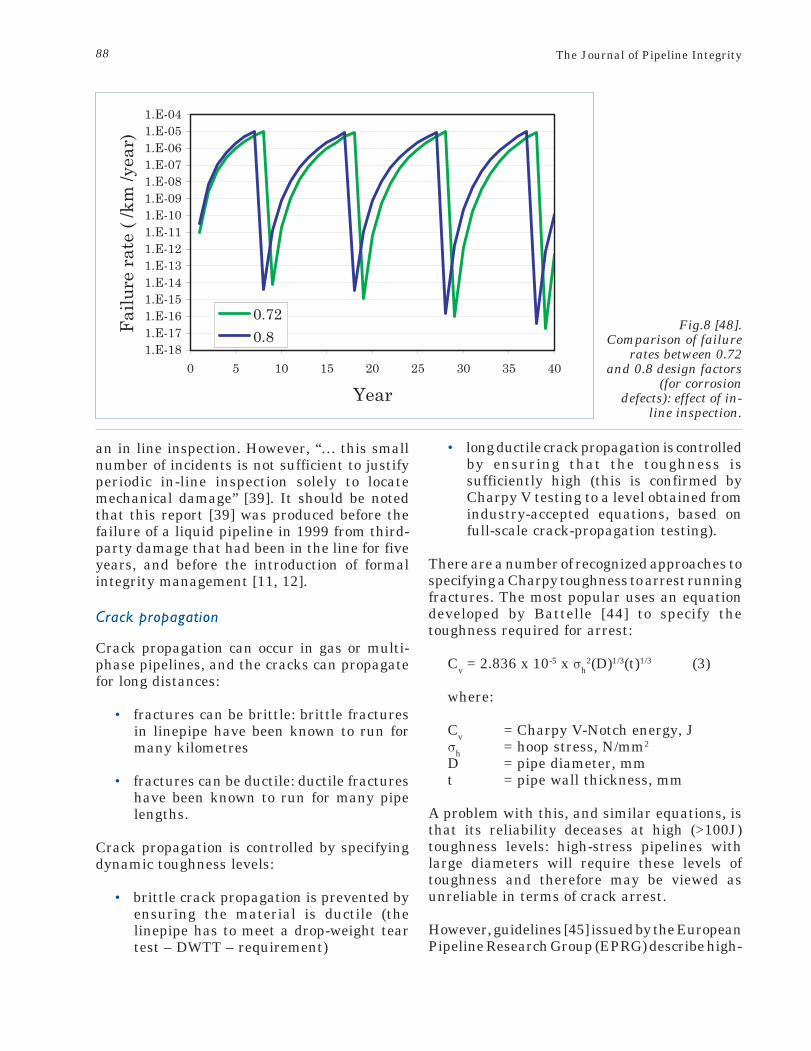
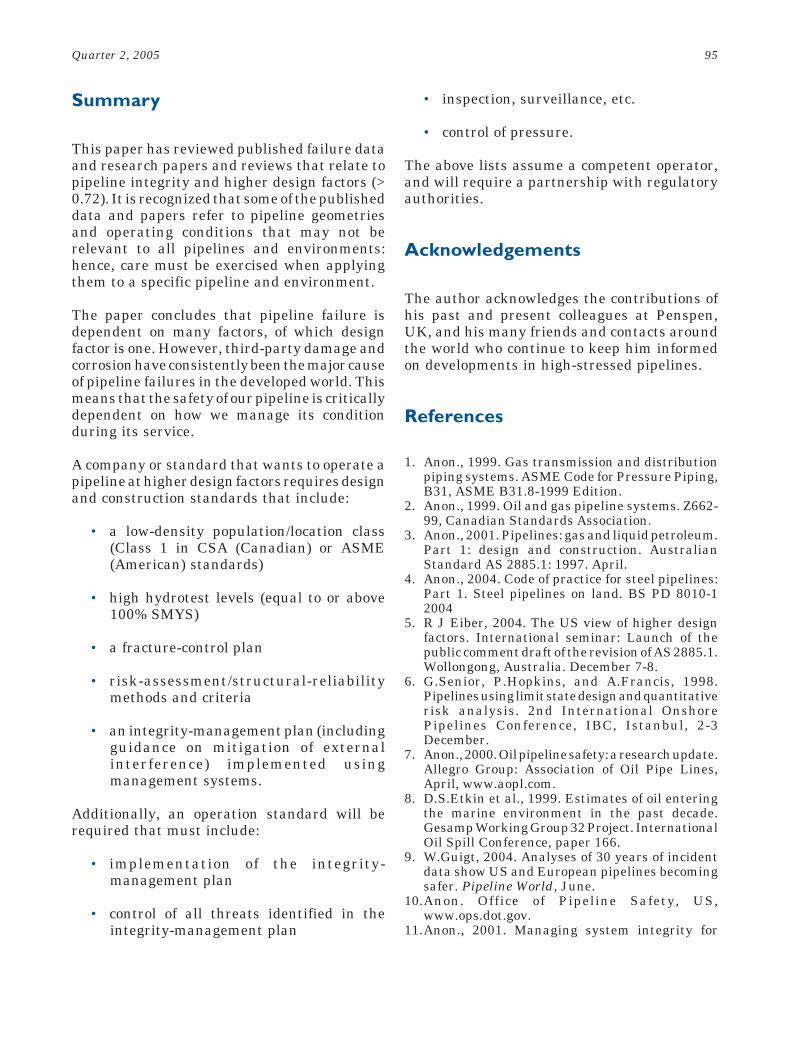
The impact of in-line inspection was alsoinvestigated [48] for high corrosion rates, Fig.8.It is seen that the rate of small leaks can bemaintained below 10-5 per km-yr by carryingout an inspection and repair event every tenyears. A contemporary smart pig was assumedfor the inspection.
Pigs to detect part-wall defects such as gougesare in limited use; however, operators areincreasingly using geometry pigs in conjunctionwith metal-loss pigs. Third-party damage suchas dents can be detected by geometry pigs, andhence there should be an increase in thedetection of third-party damage. This isimportant: a report [42] noted that more thanhalf the dents detected by a geometry pig in aUS liquid pipeline system contained gouges. Acombined dent and gouge is considered themost severe form of damage in a pipeline, andthis combination can record very low failurestresses and fatigue lives [43].
An interesting conclusion in Reference 39
1.E-10
1.E-09
1.E-08
1.E-07
Smalll eak
Largeleak
Rupture Tota l
Failure mode
Fai
lure
rat
e ( /
km /y
r) 0.72 0.08
Fig.5 [48]. Calculated failurerates for mechanical damage at
two design factors.
87Quarter 2, 2005
concerns the use of in-line inspection to locatedamage caused by third parties. Most third-party incidents result in an immediate failure,although a minority of these incidents resultsin a ‘delayed’ failure (a failure after a time
interval from when the damage was inflicted).A few third-party damage failures have occurredafter sufficient time intervals, or after a plannedpressure increase, and the defects associatedwith these failures may have been detected by
1.E-08
1.E-07
1.E-06
1.E-05
1.E-04
0 10 20 30 40Year
Fai
lure
rat
e (/k
m /y
r)
0.72 Small l e ak0.80 Small l e ak
Fig.6 [48]. Failure rates forcorrosion defects at two designfactors.
Fig.7 [14]. In-line inspection and the defects it detects.
2 5 %
3 0 %
2 1 %
4 %
1 %
1 9 %Causes of pipeline faults (total = 1768)‘Faults’ are defined as part wall defects with no gas loss.‘Others’ are minor construction damage, e.g. arc strikes or gouges.
Causes of pipeline faults detected by ILI (total = 561)‘Others’ are eccentric casings, objects in backfill and minor construction damage.
1 %
4 5 %
0 %1 1 %
4 1 %2 %
External corrosion
Pipe defects
Girth welds
Ground movement
Other
External interference
External corrosion
Pipe defects
Girth welds
Ground movement
Other
External interference
88 The Journal of Pipeline Integrity
an in line inspection. However, “… this smallnumber of incidents is not sufficient to justifyperiodic in-line inspection solely to locatemechanical damage” [39]. It should be notedthat this report [39] was produced before thefailure of a liquid pipeline in 1999 from third-party damage that had been in the line for fiveyears, and before the introduction of formalintegrity management [11, 12].
����3 � ������
Crack propagation can occur in gas or multi-phase pipelines, and the cracks can propagatefor long distances:
• fractures can be brittle: brittle fracturesin linepipe have been known to run formany kilometres
• fractures can be ductile: ductile fractureshave been known to run for many pipelengths.
Crack propagation is controlled by specifyingdynamic toughness levels:
• brittle crack propagation is prevented byensuring the material is ductile (thelinepipe has to meet a drop-weight teartest – DWTT – requirement)
• long ductile crack propagation is controlledby ensuring that the toughness issufficiently high (this is confirmed byCharpy V testing to a level obtained fromindustry-accepted equations, based onfull-scale crack-propagation testing).
There are a number of recognized approaches tospecifying a Charpy toughness to arrest runningfractures. The most popular uses an equationdeveloped by Battelle [44] to specify thetoughness required for arrest:
Cv = 2.836 x 10⁻⁵ x σh2(D)1/3(t)1/3 (3)
where:
Cv = Charpy V-Notch energy, Jσh = hoop stress, N/mm2
D = pipe diameter, mmt = pipe wall thickness, mm
A problem with this, and similar equations, isthat its reliability deceases at high (>100J)toughness levels: high-stress pipelines withlarge diameters will require these levels oftoughness and therefore may be viewed asunreliable in terms of crack arrest.
However, guidelines [45] issued by the EuropeanPipeline Research Group (EPRG) describe high-
1.E-181.E-171.E-161.E-151.E-141.E-131.E-121.E-111.E-101.E-091.E-081.E-071.E-061.E-051.E-04
0 5 10 15 20 25 30 35 40
Year
Failu
re r
ate
( /km
/yea
r)
0.720.8
Fig.8 [48].Comparison of failure
rates between 0.72and 0.8 design factors
(for corrosiondefects): effect of in-
line inspection.
89Quarter 2, 2005
stress tests on linepipe, and concluded that theabove Battelle formula was able to predict full-scale test behavior at 90% SMYS stress levels.The EPRG showed that a simple correction tothe Battelle formula [44], increasing therequired toughness by 30%, could accommodateboth high stresses and high-grade (X80) steel.Battelle [46] has also recognized the need for acorrection factor.
These corrections would be considered in thepipeline’s fracture-control plan (see later).
&�����5����������3���
Stress-corrosion cracking in pipelines has beenknown for many years, and the high-pH type ismanaged using recognized protocols. The typeof SCC (‘near neutral’) which has caused anumber of high-profile failures in Canada,occurred in lines operating at stresses (at thetime of failure) of between 46 and 77% SMYS,indicating no threshold between 72 and 80%SMYS [48, 49]. Since the threshold stress levelfor SCC is thought to be below 72% SMYS, apipeline that is susceptible to SCC at 80% willalso be susceptible at 72%.
It is important to note that the regulator (NEB)in Canada [49] does not consider reduction inpressure an effective way of dealing with SCC
[49]; SCC should be mitigated against at thedesign stage (by proven effective coatings, forexample), or during operation (by hydrotestingand applying effective inspection andmaintenance). Therefore, SCC should not be anissue with new, highly-stressed, pipelines.
62��� �������
Low-temperature operation is primarily amaterial problem. This is covered in the design(fracture-control plan), as in any pipeline designcase – see below.
)7���������
Axial stresses on pipelines are dealt with at thedesign stage. Additional axial stresses areroutinely covered in design, such as frost heave.
The additional axial stress imposed on a pipelineby increasing the hoop stress from 72% to 80%SMYS is small (21% to 23% SMYS for restrainedlines or 36 to 40% SMYS for unrestrained lines),but needs accounted for at the design stage.
8������
Fatigue failures in pipelines occur atmanufacturing defects or damage, but fatigueis not a major cause of failure:
0
0.2
0.4
0.6
0.8
1
1.2
1.4
Design Test Failure
0.720.8
0.8 Safety factor
Design factor
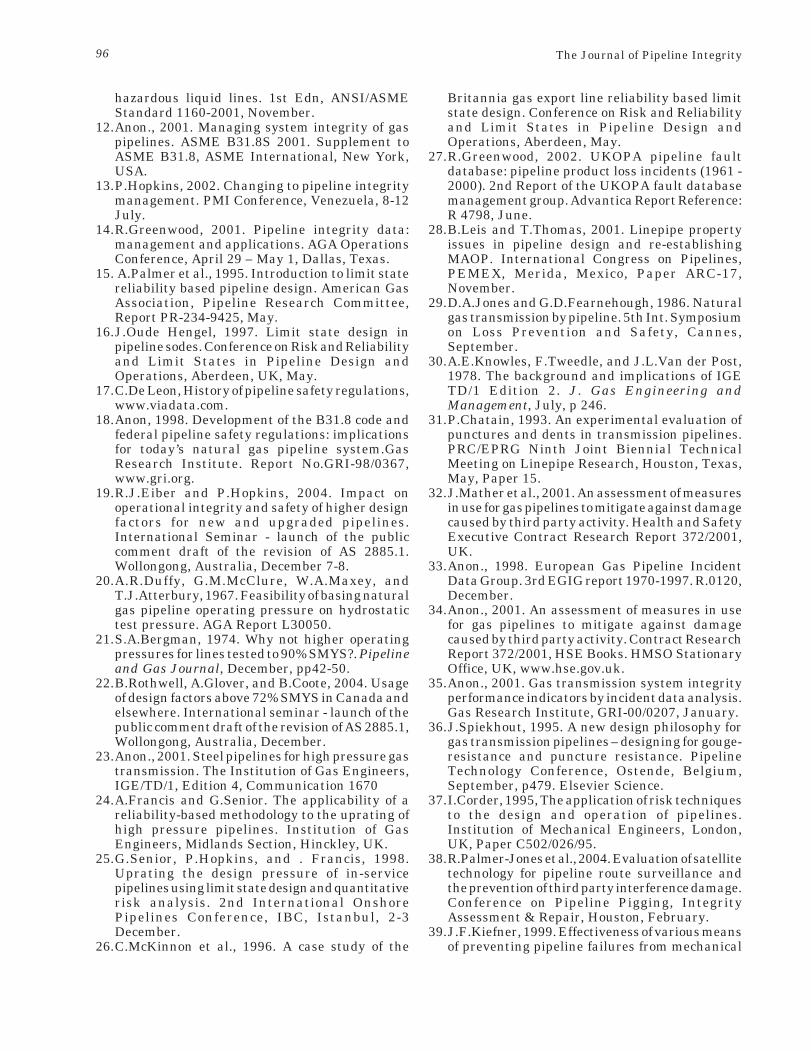
Fig.9. Reduction in safetyfactors with increasingdesign factor.
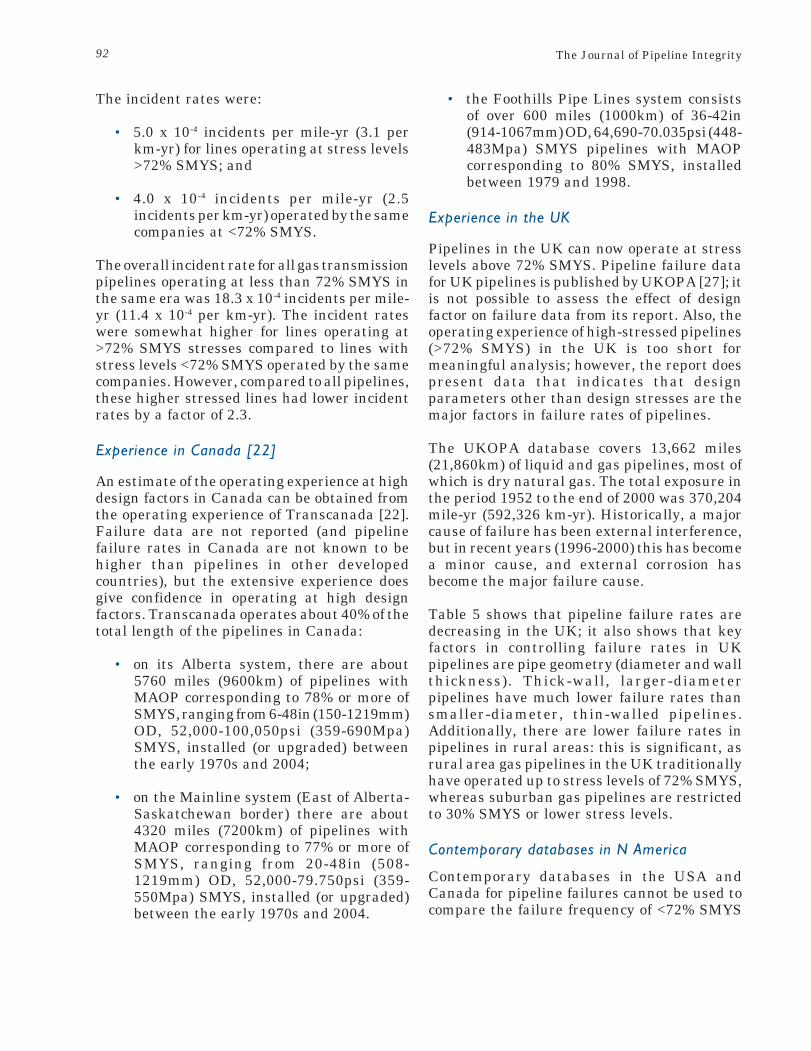
90 The Journal of Pipeline Integrity
• gas lines: there have been very few reportsof fatigue failures
• liquid lines: liquid lines are more heavilypressure cycled than gas lines and therehave been some failures reported frommanufacturing, construction, and in-service defects, such as dents
Fatigue failures occur at manufacturing defectsor damage/defects. This means fatigue life isdominated by propagation of a crack from anexisting defects, not initiation. It is well-known(and easily shown by fracture mechanics) thatfatigue propagation is primarily dependent onstress range, and the mean stress range and thedesign factor (maximum stress) are secondaryconsiderations.
���� ��������
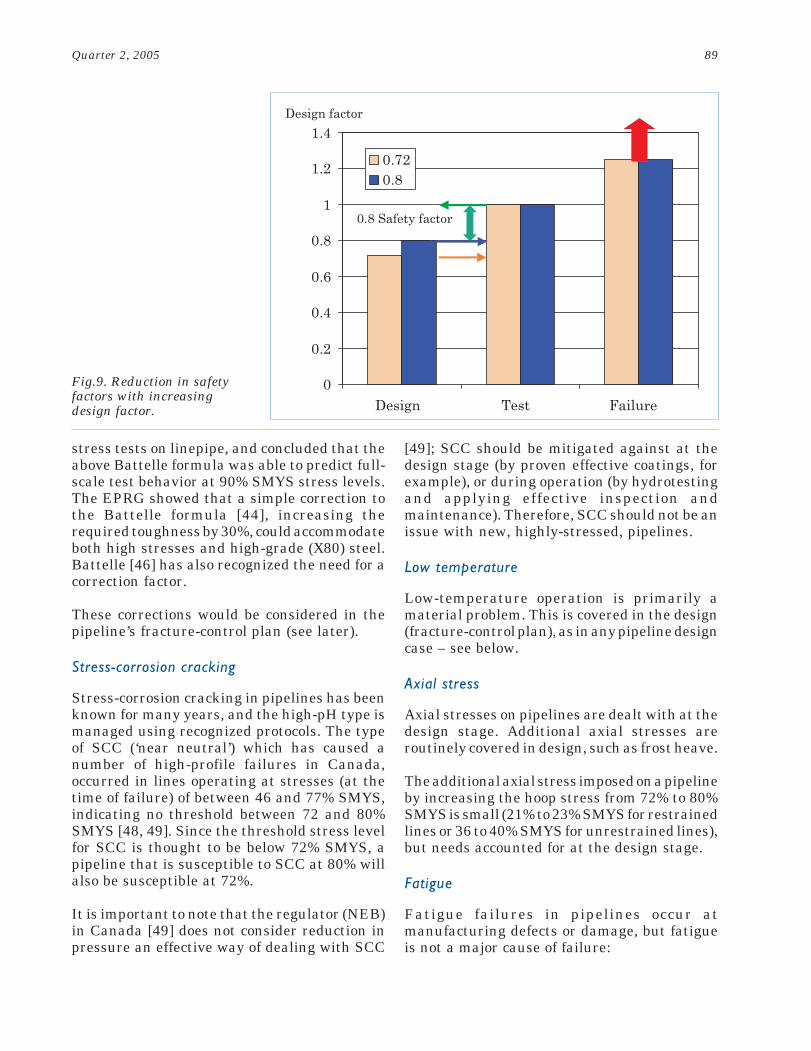
Pressures in pipelines are never constant:changes in flow, temperature, the sudden closureof a valve, etc., will cause pressure fluctuations.Pipeline design standards recognizeoverpressures (’incidental’ pressures) areinevitable, and they are accommodated in theallowances for ‘pressure surges’ or ‘incidentalpressures’: most codes allow 10% to 15%overpressures.
Figure 9 shows the safety margins on internalpressure inherent in a new pipeline: after a pre-service hydrotest the minimum safety margin
in the pipeline is the ratio hydrotest pressure :design pressure. The actual safety margin is amuch higher ratio of pipeline failure pressure :design pressure, but the failure pressure is anunknown.
Increasing the design factor (and retaining thesame hydrotest level of pressure) will take apipeline closer to the limits of its hydrotestsafety margin, and also closer to its failurepressure. Similarly, overpressures will take apipeline closer to the limits of its hydrotestsafety margin, and also closer to its failurepressure.
The American standard ASME B31.8 limitsoverpressures for high design factor pipelines:
• pipelines operating at 72% SMYS or beloware allowed overpressures of 10% on thedesign pressure
• pipelines operating over 72% SMYS haveoverpressures limited to 4% the designpressure
In the UK, high design factor pipelines alsohave their incidental pressures limited,currently to 6% for design factors of 0.72 orabove [47].
�������������������
Most of our operating experience of high design
1.E-09
1.E-08
1.E-07
1.E-06F
atal
ity
rate
( /k
m /y
r) 0.72 0.80
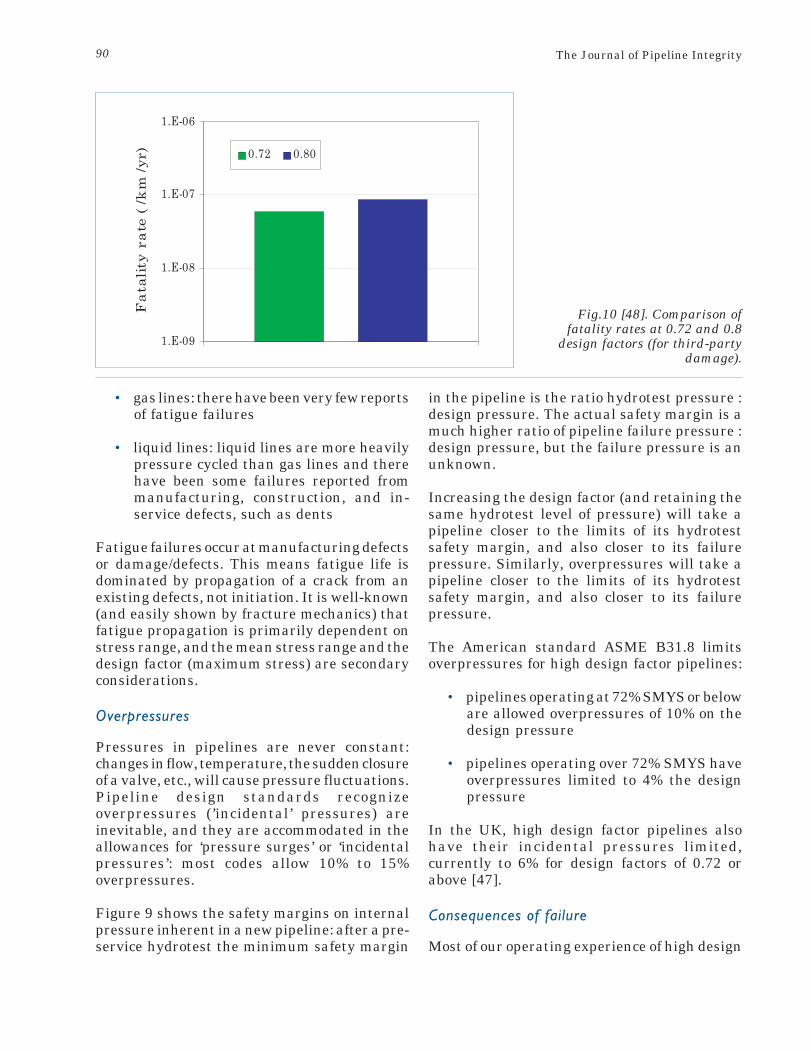
Fig.10 [48]. Comparison offatality rates at 0.72 and 0.8
design factors (for third-partydamage).
91Quarter 2, 2005
factor pipelines is in Class 1 areas – see Table10. This means that high design factor pipelineshave operated in areas with low population(and hence low third-party activities aroundthem) compared to higher classes. Consequently,we must be wary of extrapolating these types ofdata in Table 10, and the adoption of higherdesign factors, to higher location classes.
A key factor from these figures is that the actualrisk levels are low, but – more importantly – theincrease in probabilities of failure and risk canbe mitigated by improved protection orinspection. Indeed, improved inspections andprotective measures offer improvements wellabove those required.
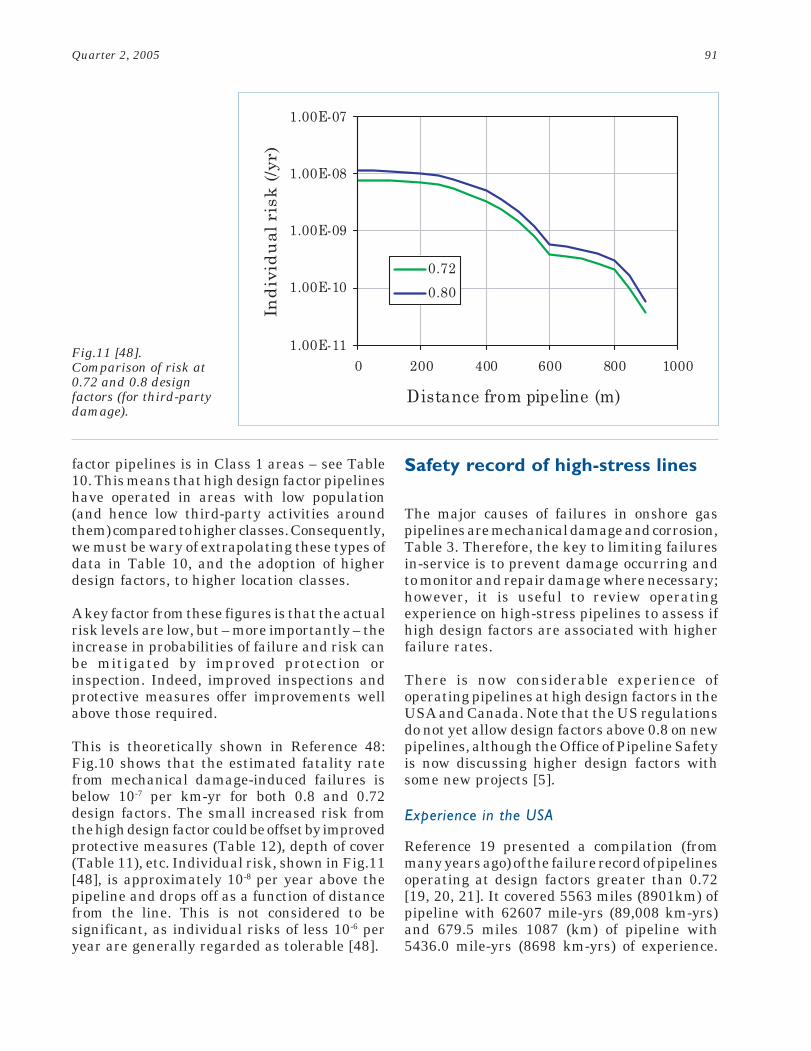
This is theoretically shown in Reference 48:Fig.10 shows that the estimated fatality ratefrom mechanical damage-induced failures isbelow 10-7 per km-yr for both 0.8 and 0.72design factors. The small increased risk fromthe high design factor could be offset by improvedprotective measures (Table 12), depth of cover(Table 11), etc. Individual risk, shown in Fig.11[48], is approximately 10-8 per year above thepipeline and drops off as a function of distancefrom the line. This is not considered to besignificant, as individual risks of less 10-6 peryear are generally regarded as tolerable [48].
$�������������������%�����������
The major causes of failures in onshore gaspipelines are mechanical damage and corrosion,Table 3. Therefore, the key to limiting failuresin-service is to prevent damage occurring andto monitor and repair damage where necessary;however, it is useful to review operatingexperience on high-stress pipelines to assess ifhigh design factors are associated with higherfailure rates.
There is now considerable experience ofoperating pipelines at high design factors in theUSA and Canada. Note that the US regulationsdo not yet allow design factors above 0.8 on newpipelines, although the Office of Pipeline Safetyis now discussing higher design factors withsome new projects [5].
97 ������������(&)
Reference 19 presented a compilation (frommany years ago) of the failure record of pipelinesoperating at design factors greater than 0.72[19, 20, 21]. It covered 5563 miles (8901km) ofpipeline with 62607 mile-yrs (89,008 km-yrs)and 679.5 miles 1087 (km) of pipeline with5436.0 mile-yrs (8698 km-yrs) of experience.
1.00E-11
1.00E-10
1.00E-09
1.00E-08
1.00E-07
0 200 400 600 800 1000
Distance from pipeline (m)
Indi
vidu
al r
isk
(/yr)
0.720.80
Fig.11 [48].Comparison of risk at0.72 and 0.8 designfactors (for third-partydamage).
92 The Journal of Pipeline Integrity
The incident rates were:
• 5.0 x 10⁻⁴ incidents per mile-yr (3.1 perkm-yr) for lines operating at stress levels>72% SMYS; and
• 4.0 x 10⁻⁴ incidents per mile-yr (2.5incidents per km-yr) operated by the samecompanies at <72% SMYS.
The overall incident rate for all gas transmissionpipelines operating at less than 72% SMYS inthe same era was 18.3 x 10⁻⁴ incidents per mile-yr (11.4 x 10⁻⁴ per km-yr). The incident rateswere somewhat higher for lines operating at>72% SMYS stresses compared to lines withstress levels <72% SMYS operated by the samecompanies. However, compared to all pipelines,these higher stressed lines had lower incidentrates by a factor of 2.3.
97 ���������������+##,
An estimate of the operating experience at highdesign factors in Canada can be obtained fromthe operating experience of Transcanada [22].Failure data are not reported (and pipelinefailure rates in Canada are not known to behigher than pipelines in other developedcountries), but the extensive experience doesgive confidence in operating at high designfactors. Transcanada operates about 40% of thetotal length of the pipelines in Canada:
• on its Alberta system, there are about5760 miles (9600km) of pipelines withMAOP corresponding to 78% or more ofSMYS, ranging from 6-48in (150-1219mm)OD, 52,000-100,050psi (359-690Mpa)SMYS, installed (or upgraded) betweenthe early 1970s and 2004;
• on the Mainline system (East of Alberta-Saskatchewan border) there are about4320 miles (7200km) of pipelines withMAOP corresponding to 77% or more ofSMYS, ranging from 20-48in (508-1219mm) OD, 52,000-79.750psi (359-550Mpa) SMYS, installed (or upgraded)between the early 1970s and 2004.
• the Foothills Pipe Lines system consistsof over 600 miles (1000km) of 36-42in(914-1067mm) OD, 64,690-70.035psi (448-483Mpa) SMYS pipelines with MAOPcorresponding to 80% SMYS, installedbetween 1979 and 1998.
97 ������������(-
Pipelines in the UK can now operate at stresslevels above 72% SMYS. Pipeline failure datafor UK pipelines is published by UKOPA [27]; itis not possible to assess the effect of designfactor on failure data from its report. Also, theoperating experience of high-stressed pipelines(>72% SMYS) in the UK is too short formeaningful analysis; however, the report doespresent data that indicates that designparameters other than design stresses are themajor factors in failure rates of pipelines.
The UKOPA database covers 13,662 miles(21,860km) of liquid and gas pipelines, most ofwhich is dry natural gas. The total exposure inthe period 1952 to the end of 2000 was 370,204mile-yr (592,326 km-yr). Historically, a majorcause of failure has been external interference,but in recent years (1996-2000) this has becomea minor cause, and external corrosion hasbecome the major failure cause.
Table 5 shows that pipeline failure rates aredecreasing in the UK; it also shows that keyfactors in controlling failure rates in UKpipelines are pipe geometry (diameter and wallthickness). Thick-wall, larger-diameterpipelines have much lower failure rates thansmaller-diameter, thin-walled pipelines.Additionally, there are lower failure rates inpipelines in rural areas: this is significant, asrural area gas pipelines in the UK traditionallyhave operated up to stress levels of 72% SMYS,whereas suburban gas pipelines are restrictedto 30% SMYS or lower stress levels.
����� ���������������:)������
Contemporary databases in the USA andCanada for pipeline failures cannot be used tocompare the failure frequency of <72% SMYS
93Quarter 2, 2005
lines compared with >72% SMYS lines due tothe absence of breakdowns of pipeline mileageversus design factor. However, some generalcontemporary observations can be made [48]:
• USA: in 1992, the Office of Pipeline Safetyin the USA continued to allow pipelines tooperate at over 72% SMYS, as it did notfind these lines having higher failure ratesthan lines operating below 72% SMYS.
• Canada: the correlation between operatingstress and failure was investigated in1996 by the National Energy Board (NEB)inquiry into stress-corrosion cracking [49],and Canadian lines continue to operate ata high design factor.
&������'����������%�����������
Detailed studies [48, 50-61] by the PipelineResearch Council International (PRCI), GasResearch Institute, BP, and Transco (UK) haveconcluded that pipelines can be shown to be safeand reliable at stress levels of 80% SMYS. Thestudies have shown that large-diameter, thick-wall pipelines have high safety levels due totheir thick wall protecting against both corrosionand mechanical damage. For example, the PRCIstudy investigating both high grade (X80) andhigh stress (80% SMYS) showed that large-diameter pipelines operating at a design factorof 0.80 had a lower failure rate prediction thanlower-pressure, smaller-diameter pipelines.
Additionally, it has been shown that an integrity-management program that addresses the majorthreats to pipeline safety can be more effectivethan simply lowering the design factor.
Published studies, specifically on large-diameter, high-pressure, thick-wall, gaspipelines operating at 72% and 80% SMYS,have objectively shown that both operatingstresses are safe and reliable. The studies haveshown that a change in design factor from 0.72to 0.80 is likely to have a minimal effect on thecalculated failure rates and risk levels.
�������
���������������$�������
This paper has reviewed many failure data andkey research reports and reviews, and it is clearthat pipelines operating at high design factors(>0.72) that are designed to robust codes suchas ASME and CSA, and operated using modernintegrity-management methods such as thosein API 1160 and ASME B31.8S, can be as safeas lower design factor lines. It is important tonote that:
• The 0.72 and 0.80 design factors arehistorical artefacts: they have nostructural significance.
• Many pipelines are operating, safely, athigh design factors [19]. Many of thesepipelines are older lines that have eitherbeen at this higher design factor sincestart of operation, or have been uprated tothe higher design factor.
• There is no published or anecdotalevidence that indicates that high designfactor pipelines will have significantly-increased risk associated with theiroperation.
• Poor-quality materials and a lack ofunderstanding of major risk meant that30 years ago, and before, we neededstandards that ensured we had good-quality pipe, careful routeing, etc. Butnow we know that in-service defects(damage, corrosion, etc.) fail pipelines andcause casualties. Hence, a pipeline’s‘integrity’ is dependent on the design,operation, and management of a pipeline,and pipeline standards need to change toaccommodate more on monitoringintegrity during a pipeline’s life.
• Pipeline failure is dependent on manyfactors: design factor is one. However,third-party damage and corrosion haveconsistently been the major cause ofpipeline failures in the developed world.
94 The Journal of Pipeline Integrity
This means that the safety of our pipelineis critically dependent on how we manageits condition during its life.
• Pipeline safety starts with good design,but this is not sufficient. The operationalintegrity of the pipeline is crucial to itssafety. Codes are now changing to addressoperational integrity, in recognition thatin-service defects are the major threat toa pipeline’s safety, not increased designfactor.
���������������$������������ ������;���������;������3����������
Many pipelines worldwide are already operatingat higher design factors [19] but it is importantto consider the implications on existinginspection and maintenance procedures. Highdesign factor (>0.72) pipelines in the USA arereported [5, 48] to have similar or lower failuresrates than lower (<0.72) design factor pipelines.It has been reported that this low failure ratewas attributed to:
• ‘aggressive’ inspection and maintenanceschemes, based on risk management; and,most importantly
• all these lines were tested to at least 100%SMYS.
Hydrotest
Pipeline codes that allow higher design factors(such as ASME B31.8) require these higherdesign factor pipelines to be hydrotested to100% SMYS.
Risk management
API 1160 and ASME B31.8S [7, 8] presentdetailed guidance on performing riskassessments on operational liquid and gaspipelines, Fig.2. API 1160 and ASME both utilizequalitative risk assessments, which involveconstructing a risk ‘matrix’ where failureprobabilities and consequences are plotted foreach threat.
In the UK, quantitative risk assessment is in
use. The two documents used to design pipelinesin the UK are BS PD 8010 (all fluids) and IGE/TD/1 (natural gas). PD 8010 [4] was recentlyupdated (2004) and contains many of theelements of IGE/TD/1 [23] for natural gas lines,and makes regular reference to IGE/TD/1.
PD 8010 states that the UK regulatoryauthorities recommend that design factorsshould not be higher than 0.72. If higher designfactors are planned, a full risk assessment isnecessary, with a regulatory review.
Both PD 8010 and IGE/TD/1 give guidance onindividual and societal risk assessments, andquote risk acceptability levels: an individualrisk of death of one in a million per year isquoted for individual risk. If risk levels arecalculated to be too high, then mitigationmeasures (such as thicker-wall pipe) can beadopted. IGE/TD/1 also gives guidance on ‘costof life’ and ‘cost of life saved’.
IGE/TD/1 also has an Appendix containingguidance on the use of structural-reliabilityassessments that are applicable for use indemonstrating a pipeline can operate at a higherdesign factor (above 0.72 but not to exceed0.80).
8�������5����� ���
A pipeline must have adequate toughness,strength, etc., to be able to withstand thepresence of defects that will inevitably be presentat the start of its life, and are likely to grow innumbers and size during the lifetime of thepipeline. Consequently, a fracture-control planis needed [29, 61] that includes suchconsiderations as crack arrest, stress-corrosioncracking, low-temperature operation, and girth-weld integrity under high axial loads. It mayalso include resistance to penetration, and leakbefore break criteria. If this plan concludes thatany fracture element of the pipeline designcannot be controlled, then the design factormay need to be changed to obtain the necessarycontrol.
95Quarter 2, 2005
$������
This paper has reviewed published failure dataand research papers and reviews that relate topipeline integrity and higher design factors (>0.72). It is recognized that some of the publisheddata and papers refer to pipeline geometriesand operating conditions that may not berelevant to all pipelines and environments:hence, care must be exercised when applyingthem to a specific pipeline and environment.
The paper concludes that pipeline failure isdependent on many factors, of which designfactor is one. However, third-party damage andcorrosion have consistently been the major causeof pipeline failures in the developed world. Thismeans that the safety of our pipeline is criticallydependent on how we manage its conditionduring its service.
A company or standard that wants to operate apipeline at higher design factors requires designand construction standards that include:
• a low-density population/location class(Class 1 in CSA (Canadian) or ASME(American) standards)
• high hydrotest levels (equal to or above100% SMYS)
• a fracture-control plan
• risk-assessment/structural-reliabilitymethods and criteria
• an integrity-management plan (includingguidance on mitigation of externalinterference) implemented usingmanagement systems.
Additionally, an operation standard will berequired that must include:
• implementation of the integrity-management plan
• control of all threats identified in theintegrity-management plan
• inspection, surveillance, etc.
• control of pressure.
The above lists assume a competent operator,and will require a partnership with regulatoryauthorities.
(����'����������
The author acknowledges the contributions ofhis past and present colleagues at Penspen,UK, and his many friends and contacts aroundthe world who continue to keep him informedon developments in high-stressed pipelines.
&���������
1. Anon., 1999. Gas transmission and distributionpiping systems. ASME Code for Pressure Piping,B31, ASME B31.8-1999 Edition.
2. Anon., 1999. Oil and gas pipeline systems. Z662-99, Canadian Standards Association.
3. Anon., 2001. Pipelines: gas and liquid petroleum.Part 1: design and construction. AustralianStandard AS 2885.1: 1997. April.
4. Anon., 2004. Code of practice for steel pipelines:Part 1. Steel pipelines on land. BS PD 8010-12004
5. R J Eiber, 2004. The US view of higher designfactors. International seminar: Launch of thepublic comment draft of the revision of AS 2885.1.Wollongong, Australia. December 7-8.
6. G.Senior, P.Hopkins, and A.Francis, 1998.Pipelines using limit state design and quantitativerisk analysis. 2nd International OnshorePipelines Conference, IBC, Istanbul, 2-3December.
7. Anon., 2000. Oil pipeline safety: a research update.Allegro Group: Association of Oil Pipe Lines,April, www.aopl.com.
8. D.S.Etkin et al., 1999. Estimates of oil enteringthe marine environment in the past decade.Gesamp Working Group 32 Project. InternationalOil Spill Conference, paper 166.
9. W.Guigt, 2004. Analyses of 30 years of incidentdata show US and European pipelines becomingsafer. Pipeline World, June.
10.Anon. Office of Pipeline Safety, US,www.ops.dot.gov.
11.Anon., 2001. Managing system integrity for
96 The Journal of Pipeline Integrity
hazardous liquid lines. 1st Edn, ANSI/ASMEStandard 1160-2001, November.
12.Anon., 2001. Managing system integrity of gaspipelines. ASME B31.8S 2001. Supplement toASME B31.8, ASME International, New York,USA.
13.P.Hopkins, 2002. Changing to pipeline integritymanagement. PMI Conference, Venezuela, 8-12July.
14.R.Greenwood, 2001. Pipeline integrity data:management and applications. AGA OperationsConference, April 29 – May 1, Dallas, Texas.
15. A.Palmer et al., 1995. Introduction to limit statereliability based pipeline design. American GasAssociation, Pipeline Research Committee,Report PR-234-9425, May.
16.J.Oude Hengel, 1997. Limit state design inpipeline sodes. Conference on Risk and Reliabilityand Limit States in Pipeline Design andOperations, Aberdeen, UK, May.
17.C.De Leon, History of pipeline safety regulations,www.viadata.com.
18.Anon, 1998. Development of the B31.8 code andfederal pipeline safety regulations: implicationsfor today’s natural gas pipeline system.GasResearch Institute. Report No.GRI-98/0367,www.gri.org.
19.R.J.Eiber and P.Hopkins, 2004. Impact onoperational integrity and safety of higher designfactors for new and upgraded pipelines.International Seminar - launch of the publiccomment draft of the revision of AS 2885.1.Wollongong, Australia, December 7-8.
20.A.R.Duffy, G.M.McClure, W.A.Maxey, andT.J.Atterbury, 1967. Feasibility of basing naturalgas pipeline operating pressure on hydrostatictest pressure. AGA Report L30050.
21.S.A.Bergman, 1974. Why not higher operatingpressures for lines tested to 90% SMYS?. Pipelineand Gas Journal, December, pp42-50.
22.B.Rothwell, A.Glover, and B.Coote, 2004. Usageof design factors above 72% SMYS in Canada andelsewhere. International seminar - launch of thepublic comment draft of the revision of AS 2885.1,Wollongong, Australia, December.
23.Anon., 2001. Steel pipelines for high pressure gastransmission. The Institution of Gas Engineers,IGE/TD/1, Edition 4, Communication 1670
24.A.Francis and G.Senior. The applicability of areliability-based methodology to the uprating ofhigh pressure pipelines. Institution of GasEngineers, Midlands Section, Hinckley, UK.
25.G.Senior, P.Hopkins, and . Francis, 1998.Uprating the design pressure of in-servicepipelines using limit state design and quantitativerisk analysis. 2nd International OnshorePipelines Conference, IBC, Istanbul, 2-3December.
26.C.McKinnon et al., 1996. A case study of the
Britannia gas export line reliability based limitstate design. Conference on Risk and Reliabilityand Limit States in Pipeline Design andOperations, Aberdeen, May.
27.R.Greenwood, 2002. UKOPA pipeline faultdatabase: pipeline product loss incidents (1961 -2000). 2nd Report of the UKOPA fault databasemanagement group. Advantica Report Reference:R 4798, June.
28.B.Leis and T.Thomas, 2001. Linepipe propertyissues in pipeline design and re-establishingMAOP. International Congress on Pipelines,PEMEX, Merida, Mexico, Paper ARC-17,November.
29.D.A.Jones and G.D.Fearnehough, 1986. Naturalgas transmission by pipeline. 5th Int. Symposiumon Loss Prevention and Safety, Cannes,September.
30.A.E.Knowles, F.Tweedle, and J.L.Van der Post,1978. The background and implications of IGETD/1 Edition 2. J. Gas Engineering andManagement, July, p 246.
31.P.Chatain, 1993. An experimental evaluation ofpunctures and dents in transmission pipelines.PRC/EPRG Ninth Joint Biennial TechnicalMeeting on Linepipe Research, Houston, Texas,May, Paper 15.
32.J.Mather et al., 2001. An assessment of measuresin use for gas pipelines to mitigate against damagecaused by third party activity. Health and SafetyExecutive Contract Research Report 372/2001,UK.
33.Anon., 1998. European Gas Pipeline IncidentData Group. 3rd EGIG report 1970-1997. R.0120,December.
34.Anon., 2001. An assessment of measures in usefor gas pipelines to mitigate against damagecaused by third party activity. Contract ResearchReport 372/2001, HSE Books. HMSO StationaryOffice, UK, www.hse.gov.uk.
35.Anon., 2001. Gas transmission system integrityperformance indicators by incident data analysis.Gas Research Institute, GRI-00/0207, January.
36.J.Spiekhout, 1995. A new design philosophy forgas transmission pipelines – designing for gouge-resistance and puncture resistance. PipelineTechnology Conference, Ostende, Belgium,September, p479. Elsevier Science.
37.I.Corder, 1995, The application of risk techniquesto the design and operation of pipelines.Institution of Mechanical Engineers, London,UK, Paper C502/026/95.
38.R.Palmer-Jones et al., 2004. Evaluation of satellitetechnology for pipeline route surveillance andthe prevention of third party interference damage.Conference on Pipeline Pigging, IntegrityAssessment & Repair, Houston, February.
39.J.F.Kiefner, 1999. Effectiveness of various meansof preventing pipeline failures from mechanical
97Quarter 2, 2005
damage. Gas Research Institute, GRI-99/0050,August.
40.Anon., 1999. Common ground: study of one-callsystems and damage prevention best practices.August. Sponsored by the US Office of PipelineSafety.
41.B.Hansen, J.Wiese, and R.Brown, 2004. Earlyexperience with integrity managementinspections for US hazardous liquid pipelineoperators. Proceedings of IPC 2004, InternationalPipeline Conference, October 4 - 8, Calgary,Alberta, Canada. IPC04-0120.
42.R.J.Eiber, 2003. Overview of integrityassessments for pipelines. Washington Cities andCounties Pipeline Safety Consortium, November.
43.A.Cosham and P.Hopkins, 2002. The pipelinedefect assessment manual. IPC 2002:International Pipeline Conference, Calgary,Alberta, Canada, October.
44.M.A.Maxey, J.F.Kiefner, and R.J.Eiber, 1975.Ductile fracture arrest in gas pipelines. December,Cat. No. L32176, PRC Report NG-18 No. 100.
45.G.Re, et al., 1995. EPRG recommendation forcrack arrest toughness for high strength line pipesteels. 3R International, 34.
46.B.N.Leis, 2000. Characterising dynamic crackresistance of pipelines using laboratory scalepractices. ASME IPC 2000, 1, pp295-306.
47.A.Thayne, 2004. Regulating pipeline safety inthe UK: gas transmission pipeline uprating.International seminar - launch of the publiccomment draft of the revision of AS 2885.1,Wollongong, Australia, December 7-8.
48.M.McLamb et al., 2002. A justification fordesigning and operating pipelines up to stressesof 80% SMYS. Proceedings of IPC 2002:International Pipeline Conference, October,Calgary, Alberta, Canada, Paper IPC02-27007.
49.National Energy Board, 1996. Public inquiryconcerning stress corrosion cracking on Canadianoil and gas pipelines. MH-2-95, November.
50.M.A.Nessim et al., 1999. Hydrotest requirementsfor high-strength, high-usage-factor pipelines.Presented at the Twelfth EPRG/PRCI JointMeeting, Groningen, Netherlands, May.
51.M.A.Nessim et al., 2001. Lifetime benefit of high-strength, high-design-factor pipelines. Presented
at the 13th Biennial EPRG/PRCI Joint TechnicalMeeting, April 30 - May 3, New Orleans.
52.G.Senior et al., 1998. Uprating the design pressureof in-service pipelines using limit state designand quantitative risk analysis. 2nd InternationalOnshore Pipelines Conference, IBC, Istanbul, 2-3 December.
53.M.Lamb et al., 1998. How do you assess theresults of a limit state based pipeline design?Conference on Risk-Based and Limit State Designand Operation of Pipelines, Aberdeen, UK,October.
54.R.Espiner and A.Edwards, 1998. An investigationof the effectiveness of hydrostatic testing inimproving pipeline reliability. Conference onRisk-Based and Limit State Design and Operationof Pipelines, Aberdeen, UK.
55.A.Francis and G.Senior, 1998. The applicabilityof a reliability-based methodology to the upratingof high pressure pipelines. Institution of GasEngineers, Midlands Section, Hinckley, UK.
56.A.Francis et al., 1998. Reliability based approachto the operation of gas transmission pipelines atdesign factors greater then 0.72. OMAE, Lisbon,July.
57.A.Francis and G.Senior, 1998. The use ofreliability based limit state methods in upratinghigh pressure pipelines. International PipelineConference, Calgary, June.
58.A.Francis et al., 1997. Uprating an in-servicepipeline using reliability-based limit statemethods. Conference on Risk-Based and LimitState Design and Operation of Pipelines,Aberdeen, UK, 21-22 May.
59.A.Francis et al., 1997. Probabilistic analysis toassess the safety and integrity of uprated highpressure gas transmission pipelines. Institutionof Gas Engineers Annual Conference,Birmingham, UK.
60.T.Zimmerman et al., 1998. Can limit state designbe used to design a pipeline above 80% SMYS?OMAE 1998, Lisbon, Portugal, July.
61.R.J.Eiber, P.Hopkins, M.McLamb, and J.Abes,2005. Operation of new design and/or conversionof existing pipelines to 80% SMYS operatingstress. Gas Research Institute, USA. Report GRI-04/0152. To be published.