Embed Size (px)
Citation preview

– more biocompatible and heparin saving –
Gustav-Kirchhoff-Straße 2
17033 Neubrandenburg
Tel +49(0)395 581 00 0
Fax +49(0)395 581 00 99
www.mtn-nb.de
Concentrate from
Neubrandenburg
High-Flux-Dialysis and
On-line Hemodiafiltration
with CITRASATE®
Content
1. What is Citrasate®? ............................................................................................................. 1
2. Why citrate is used in acid dialysis concentrate
instead of acetate and what benefits result? ....................................................... 1
3. Indications for dialysis with Citrasate® .................................................................... 2
4. What is the mechanism of Citrasate® inside the dialyser? ........................... 3
5. Clinical results of Citrasate® .......................................................................................... 4
5.1. High-Flux-Dialysis ................................................................................................................ 4
5.2. On-line Hemodiafiltration ...............................................................................................12
5.2.1. On-line Hemodiafiltration in predilution mode ....................................................12
5.2.2. On-line Hemodiafiltration in postdilution mode ................................................16
6. Citrasate® is applicable for most of all dialysis machines..........................20
7. Advantages of dialysis with Citrasate® for patients and users .................21
8. Literature ..................................................................................................................................22
Copyright All rights are reserved. No part of this publication may be reproduced or transmitted in any form or by any means, electonic or mechanical, including photocopy, recording or any information storage and retrieval system, without the permission in writing from MTN Neubrandenburg GmbH. ©MTN Neubrandenburg GmbH
1
1. What is Citrasate®?
Citrasate® is a new innovative dialysis acid concentrate, in which 3 mmol/l of acetic acid
have been replaced by 0.8 mmol/l of citric acid along with 0.3 mmol/l of acetate. The use
of a weak acid is necessary in acid dialysis concentrates in order to prevent precipitation of
calcium and magnesium carbonate.
2. Why citrate is used in dialysis acid concentrate instead
of acetate and what benefits result?
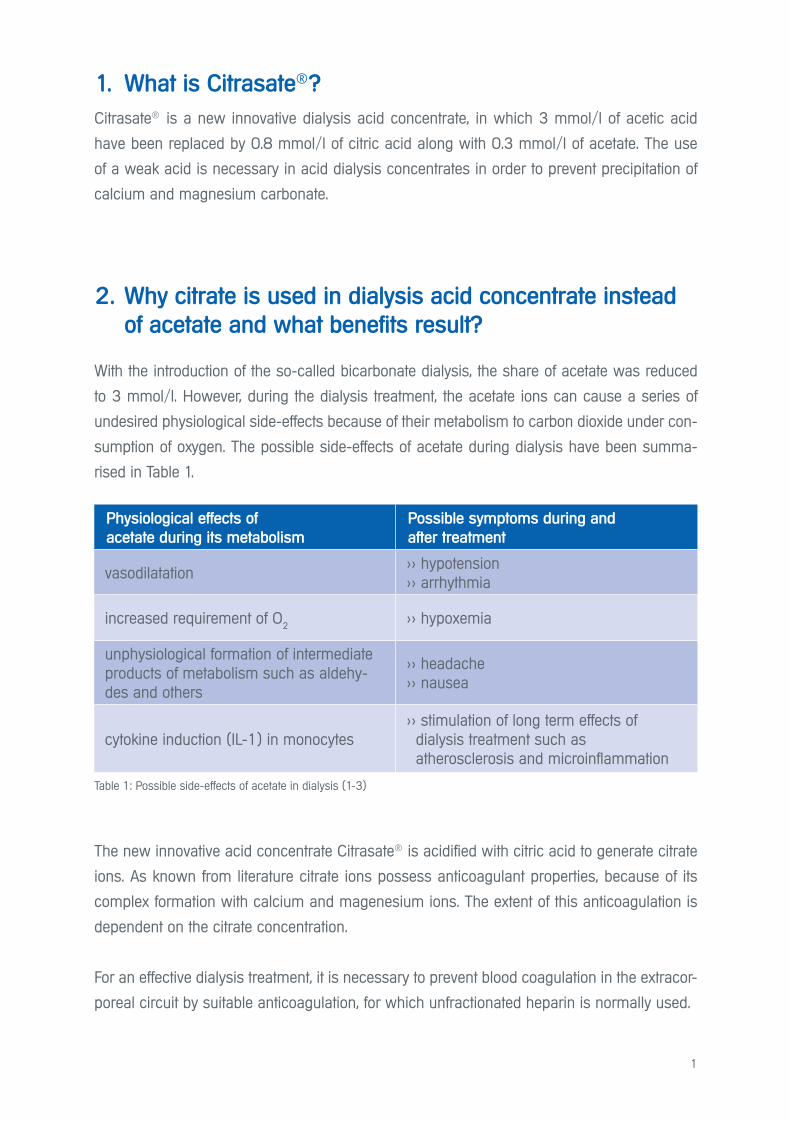
With the introduction of the so-called bicarbonate dialysis, the share of acetate was reduced
to 3 mmol/l. However, during the dialysis treatment, the acetate ions can cause a series of
undesired physiological side-effects because of their metabolism to carbon dioxide under con-
sumption of oxygen. The possible side-effects of acetate during dialysis have been summa-
rised in Table 1.
The new innovative acid concentrate Citrasate® is acidified with citric acid to generate citrate
ions. As known from literature citrate ions possess anticoagulant properties, because of its
complex formation with calcium and magenesium ions. The extent of this anticoagulation is
dependent on the citrate concentration.
For an effective dialysis treatment, it is necessary to prevent blood coagulation in the extracor-
poreal circuit by suitable anticoagulation, for which unfractionated heparin is normally used.
Table 1: Possible side-effects of acetate in dialysis (1-3)
Physiological effects of
acetate during its metabolism
Possible symptoms during and
after treatment
vasodilatation >> hypotension>> arrhythmia
increased requirement of O2 >> hypoxemia
unphysiological formation of intermediate products of metabolism such as aldehy-des and others
>> headache>> nausea
cytokine induction (IL-1) in monocytes >> stimulation of long term effects of dialysis treatment such as atherosclerosis and microinflammation
2
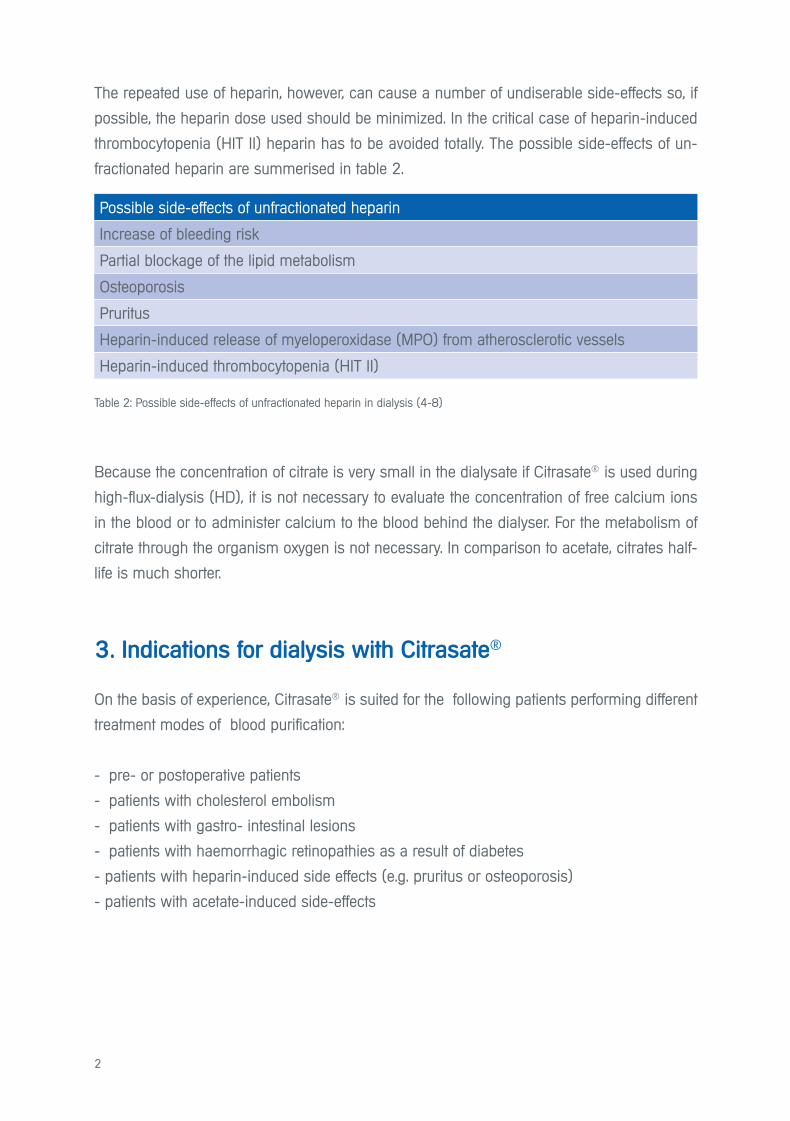
The repeated use of heparin, however, can cause a number of undiserable side-effects so, if
possible, the heparin dose used should be minimized. In the critical case of heparin-induced
thrombocytopenia (HIT II) heparin has to be avoided totally. The possible side-effects of un-
fractionated heparin are summerised in table 2.
Because the concentration of citrate is very small in the dialysate if Citrasate® is used during
high-flux-dialysis (HD), it is not necessary to evaluate the concentration of free calcium ions
in the blood or to administer calcium to the blood behind the dialyser. For the metabolism of
citrate through the organism oxygen is not necessary. In comparison to acetate, citrates half-
life is much shorter.
3. Indications for dialysis with Citrasate®
On the basis of experience, Citrasate® is suited for the following patients performing different
treatment modes of blood purification:
- pre- or postoperative patients
- patients with cholesterol embolism
- patients with gastro- intestinal lesions
- patients with haemorrhagic retinopathies as a result of diabetes
- patients with heparin-induced side effects (e.g. pruritus or osteoporosis)
- patients with acetate-induced side-effects
Possible side-effects of unfractionated heparin
Increase of bleeding risk
Partial blockage of the lipid metabolism
Osteoporosis
Pruritus
Heparin-induced release of myeloperoxidase (MPO) from atherosclerotic vessels
Heparin-induced thrombocytopenia (HIT II)
Table 2: Possible side-effects of unfractionated heparin in dialysis (4-8)

3
4. What is the mechanism of Citrasate®
inside the dialyser?
Step 1
At pH 1.9 of Citrasate® the calcium and citrate ions do not form a complex. The formation of
Ca-citrate-complex takes place during mixing of A-and B-component inside the dialysis ma-
chine producing the final dialysis fluid.
- As a result of the concentration gradients in the dialyser, free citrate ions diffuse into the
blood and bind free calcium ions there to form a Ca-citrate complex.
- At the same time, free calcium ions diffuse from the blood to the dialysate side, because the
ionised calcium has been reduced there as a result of the Ca-citrate complex formation.
Both transport processes lead to a reduction of concentration of the free calcium ions in the
blood and cause therefore a local anticoagulatory effect inside the dialyser.
Fig. 1: Transport processes in the dialyser
dialysate blood
CIT
Ca
Ca2+
CCCCCCCCCCCCCCCCCCCCIIIIIIITTTTTTTTTTTIITTTTTTTTTTTTTTTTTTTTTTTTTTTTCIT
aaaCCCCCCCCCCCCCCCCCCCCCCCCCCCCCCCaaaaaaaaaaCa
Ca2+
CIT - CIT 3- 3-CIT 3-

4
Step 2
The Calcium-citrate complex entering the blood circuit again dissociates into free Ca2+ and
citrate ions, with the result that the free calcium ions are again available for the blood pool. The
citrate ions are metabolised to bicarbonate in the KREBS-cycle. As citrate can also be metabo-
lised by muscle cells, Citrasate® can also be used for patients with liver insufficiency.
5. Clinical results with Citrasate®
5.1. High-Flux-Dialysis
Reduction of the heparin dose and bleeding time
Kossmann et al. (9) switched 31 patients from normal dialysate containing acetate (NCD)
to Citrasate® and gradually reduced the heparin dosage. Despite the reduction of heparin by
55%, all the treatments were successfully finished with Citrasate® without clotting problems.
Fig. 2: Removal of Calcium-citrate-complex in the blood and organism
The free Ca2+ again becomes
available for the blood pool.
Ca
CIT
2+
3-
HCO3- HCO3
-
The citrate is metabolised in the
KREBS-cycle, forming finally
bicarbonate
Patients and Methods
31 chronic patients were identified having post-dialysis bleeding times for >15 min.
After 2 months heparin dose was lowered 33%, after additional 2 months heparin dose was lowered another 33% (55% from initial dose)
No other change of their treatment parameters (duration of session, blood flow and dia-lysate flow, kind of dialyser). The bleeding time was measured and the dialysis dose was registrated as Kt/V (urea).

5
Heparin-Dose
Reduction of the heparin dose
Ahrenholz and Winkler (10) switched 7 patients from a standard dialysis fluid containing ace-
tate to Citrasate® and gradually reduced the heparin dose. Despite the heparin reduction by
50%, all the treatments with Citrasate® were successfully finished without clotting problems.
Fig. 3 Heparin dose Fig. 4 Pat. with bleeding times > 15 min.
Methods and patients
Patients treated with High-flux-dialysis
No other change of their treatment parameters(duration of session, blood flow and dialysate flow, kind of dialyser)
Weeks 1 + 2: Treatment with the standard dialysate now used and the quantity of Heparin used up to now (bolus + continuously) as baseline.
Weeks 3 – 6: Change to Citrasate® without any change of the other conditions
Weeks 7 – 10: Dialysis with Citrasate® and reduction of the amount of heparin in the bolus by 50%
Weeks 11 – 14: Dialysis with Citrasate® and reduction of the amount of heparin in the bolus by 50% and in the continuous dosage by 50%, resulting in a total reduction of 50%
6
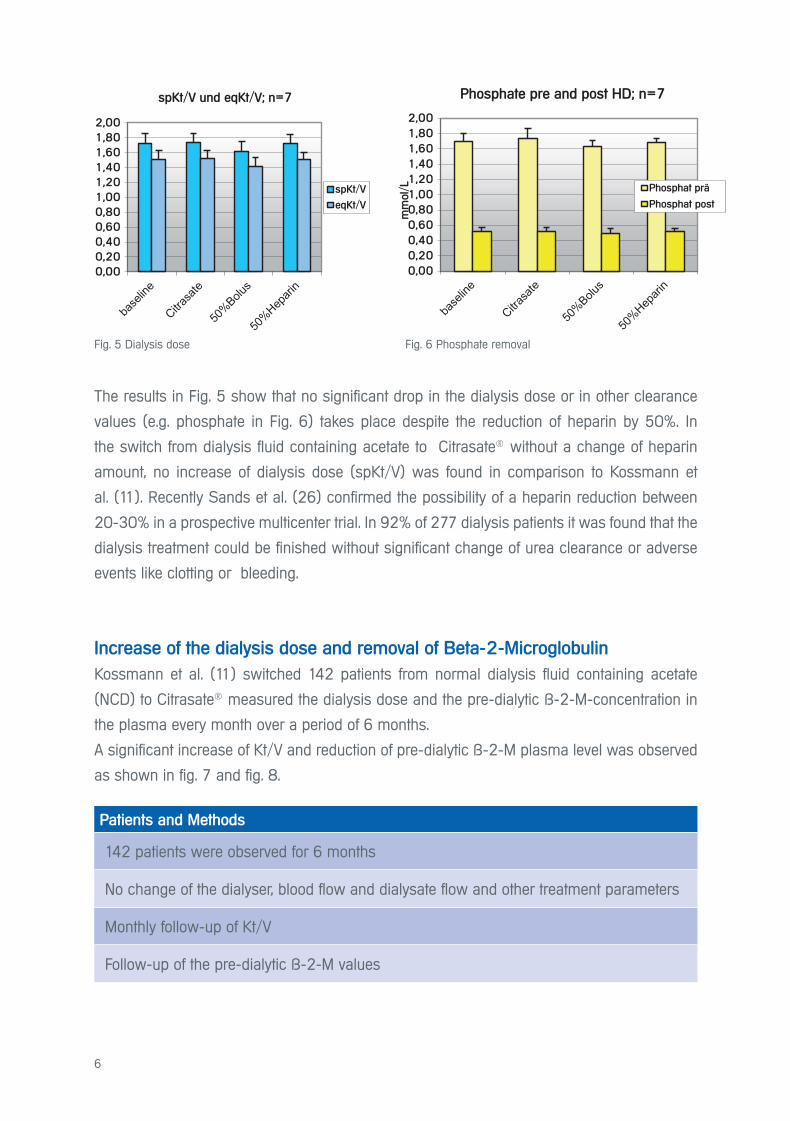
The results in Fig. 5 show that no significant drop in the dialysis dose or in other clearance
values (e.g. phosphate in Fig. 6) takes place despite the reduction of heparin by 50%. In
the switch from dialysis fluid containing acetate to Citrasate® without a change of heparin
amount, no increase of dialysis dose (spKt/V) was found in comparison to Kossmann et
al. (11). Recently Sands et al. (26) confirmed the possibility of a heparin reduction between
20-30% in a prospective multicenter trial. In 92% of 277 dialysis patients it was found that the
dialysis treatment could be finished without significant change of urea clearance or adverse
events like clotting or bleeding.
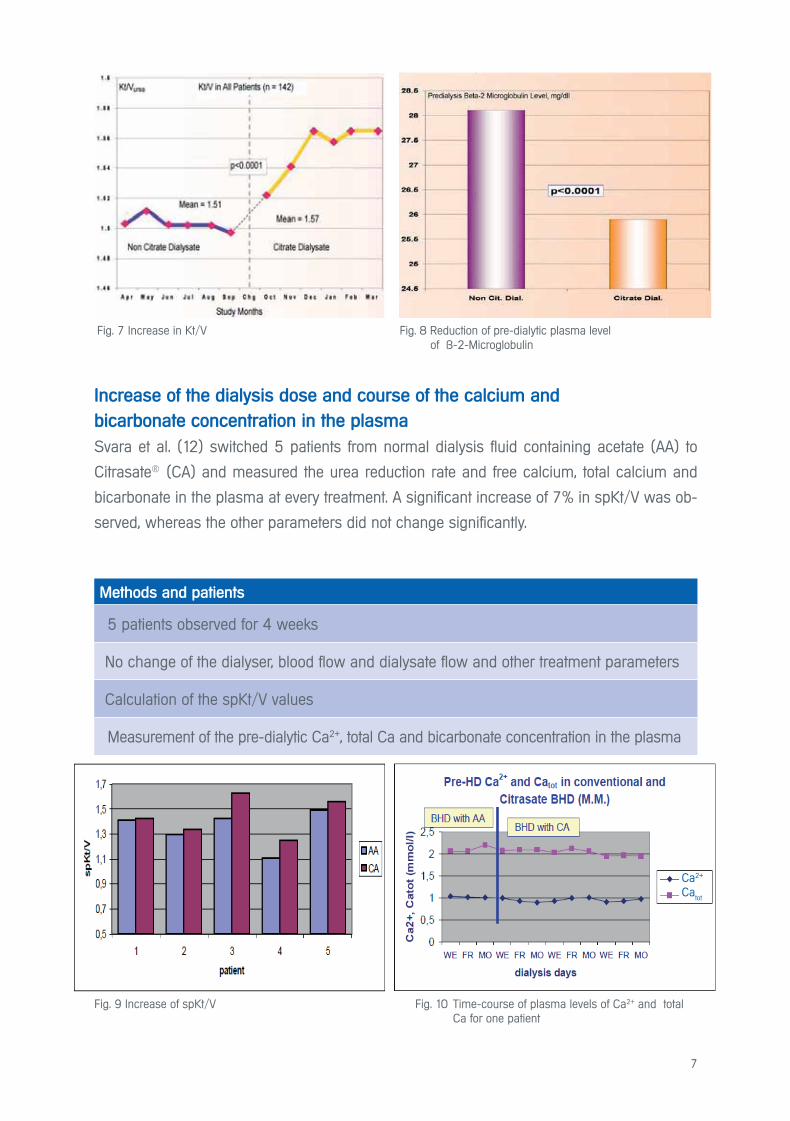
Increase of the dialysis dose and removal of Beta-2-Microglobulin
Kossmann et al. (11) switched 142 patients from normal dialysis fluid containing acetate
(NCD) to Citrasate® measured the dialysis dose and the pre-dialytic ß-2-M-concentration in
the plasma every month over a period of 6 months.
A significant increase of Kt/V and reduction of pre-dialytic ß-2-M plasma level was observed
as shown in fig. 7 and fig. 8.
0,00
0,20
0,40
0,60
0,80
1,00
1,20
1,40
1,60
1,80
2,00
mm
ol/
L
Phosphat vor und nach HD; n=7
Phosphat prä
Phosphat post
Fig. 6 Phosphate removalFig. 5 Dialysis dose
0,00
0,20
0,40
0,60
0,80
1,00
1,20
1,40
1,60
1,80
2,00
spKt/V und eqKt/V; n=7
spKt/V
eqKt/V
Patients and Methods
142 patients were observed for 6 months
No change of the dialyser, blood flow and dialysate flow and other treatment parameters
Monthly follow-up of Kt/V
Follow-up of the pre-dialytic ß-2-M values
Phosphate pre and post HD; n=7
7
Increase of the dialysis dose and course of the calcium and
bicarbonate concentration in the plasma
Svara et al. (12) switched 5 patients from normal dialysis fluid containing acetate (AA) to
Citrasate® (CA) and measured the urea reduction rate and free calcium, total calcium and
bicarbonate in the plasma at every treatment. A significant increase of 7% in spKt/V was ob-
served, whereas the other parameters did not change significantly.
Fig. 7 Increase in Kt/V Fig. 8 Reduction of pre-dialytic plasma level of ß-2-Microglobulin
Methods and patients
5 patients observed for 4 weeks
No change of the dialyser, blood flow and dialysate flow and other treatment parameters
Calculation of the spKt/V values
Measurement of the pre-dialytic Ca2+, total Ca and bicarbonate concentration in the plasma
Fig. 9 Increase of spKt/V Fig. 10 Time-course of plasma levels of Ca2+ and total Ca for one patient
Ca2+ Ca
tot
8
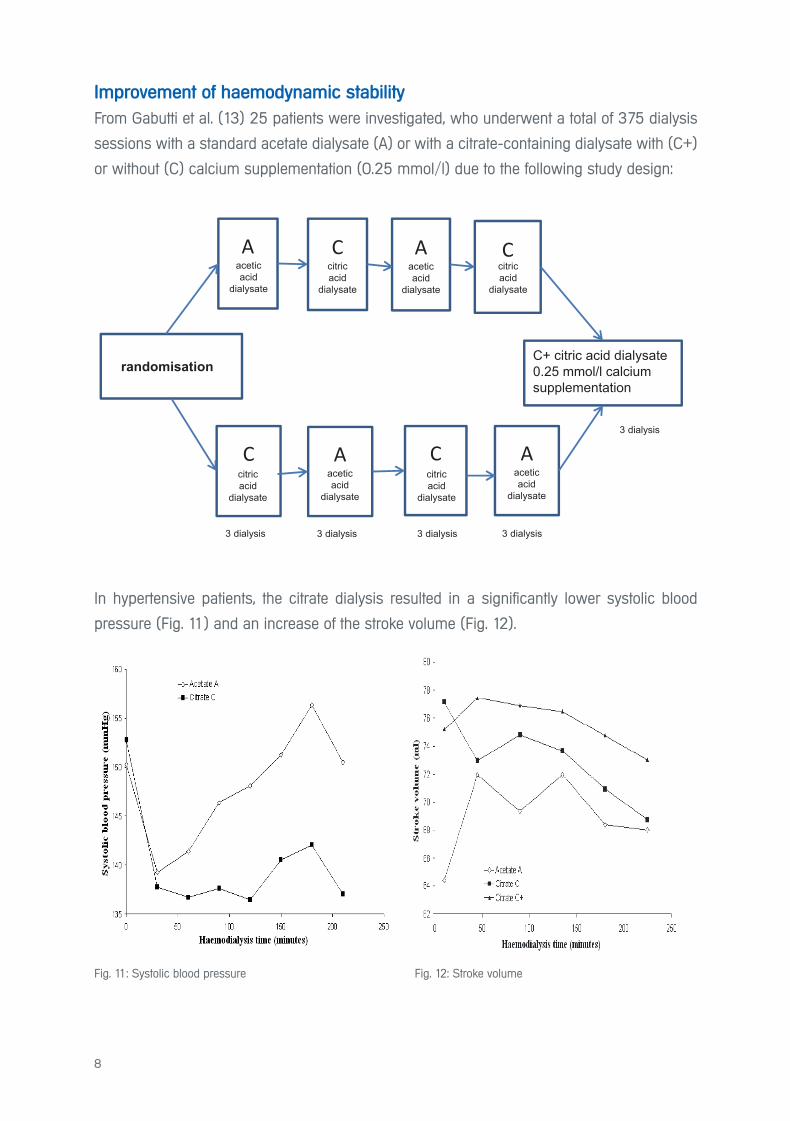
Improvement of haemodynamic stability
From Gabutti et al. (13) 25 patients were investigated, who underwent a total of 375 dialysis
sessions with a standard acetate dialysate (A) or with a citrate-containing dialysate with (C+)
or without (C) calcium supplementation (0.25 mmol/l) due to the following study design:
In hypertensive patients, the citrate dialysis resulted in a significantly lower systolic blood
pressure (Fig. 11) and an increase of the stroke volume (Fig. 12).
Aaceticacid
dialysate
Ccitricacid
dialysate
citricacid
dialysate
citricacid
dialysate
citricacid
dialysate
Aaceticacid
dialysate
Aaceticacid
dialysate
Aaceticacid
dialysate
C
C
C
randomisationC+ citric acid dialysate0 25 mmol/l calcium supplementation
3 dialysis 3 dialysis 3 dialysis 3 dialysis
3 dialysis
Fig. 11: Systolic blood pressure Fig. 12: Stroke volume
9
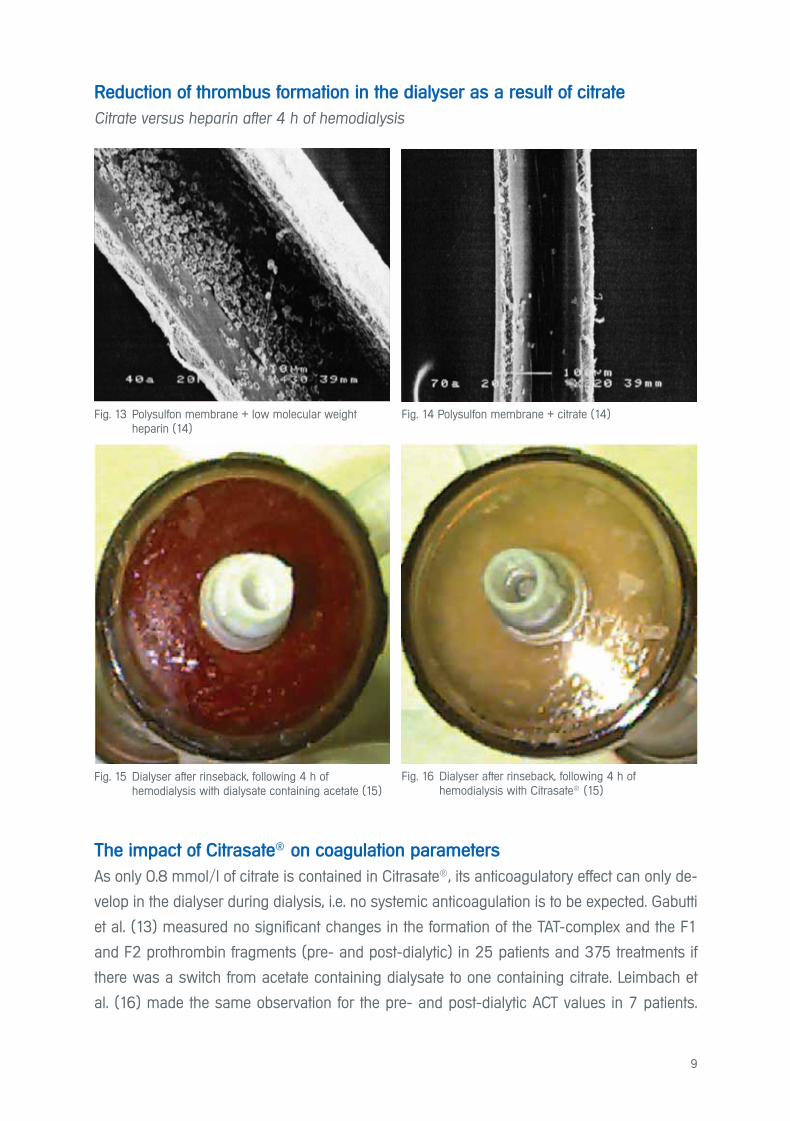
Reduction of thrombus formation in the dialyser as a result of citrate
Citrate versus heparin after 4 h of hemodialysis
The impact of Citrasate® on coagulation parameters
As only 0.8 mmol/l of citrate is contained in Citrasate®, its anticoagulatory effect can only de-
velop in the dialyser during dialysis, i.e. no systemic anticoagulation is to be expected. Gabutti
et al. (13) measured no significant changes in the formation of the TAT-complex and the F1
and F2 prothrombin fragments (pre- and post-dialytic) in 25 patients and 375 treatments if
there was a switch from acetate containing dialysate to one containing citrate. Leimbach et
al. (16) made the same observation for the pre- and post-dialytic ACT values in 7 patients.
Fig. 13 Polysulfon membrane + low molecular weight heparin (14)
Fig. 15 Dialyser after rinseback, following 4 h of hemodialysis with dialysate containing acetate (15)
Fig. 14 Polysulfon membrane + citrate (14)
Fig. 16 Dialyser after rinseback, following 4 h of hemodialysis with Citrasate® (15)
10
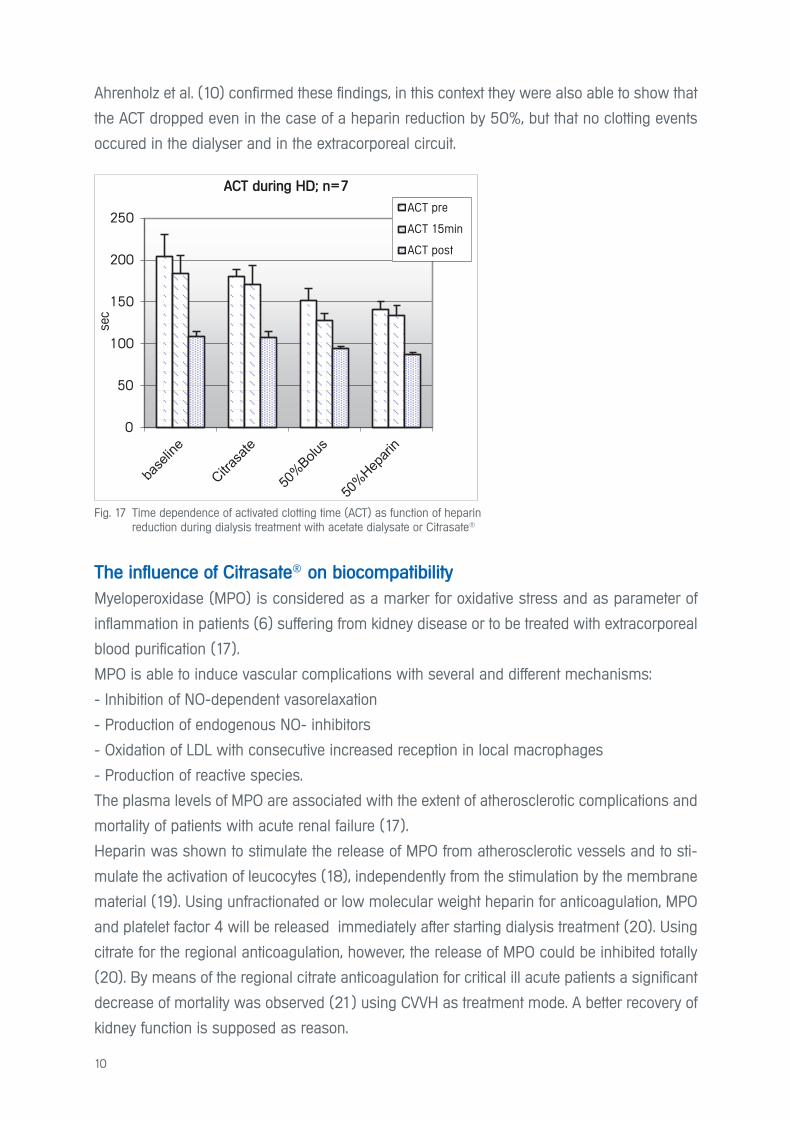
Ahrenholz et al. (10) confirmed these findings, in this context they were also able to show that
the ACT dropped even in the case of a heparin reduction by 50%, but that no clotting events
occured in the dialyser and in the extracorporeal circuit.
The influence of Citrasate® on biocompatibility
Myeloperoxidase (MPO) is considered as a marker for oxidative stress and as parameter of
inflammation in patients (6) suffering from kidney disease or to be treated with extracorporeal
blood purification (17).
MPO is able to induce vascular complications with several and different mechanisms:
- Inhibition of NO-dependent vasorelaxation
- Production of endogenous NO- inhibitors
- Oxidation of LDL with consecutive increased reception in local macrophages
- Production of reactive species.
The plasma levels of MPO are associated with the extent of atherosclerotic complications and
mortality of patients with acute renal failure (17).
Heparin was shown to stimulate the release of MPO from atherosclerotic vessels and to sti-
mulate the activation of leucocytes (18), independently from the stimulation by the membrane
material (19). Using unfractionated or low molecular weight heparin for anticoagulation, MPO
and platelet factor 4 will be released immediately after starting dialysis treatment (20). Using
citrate for the regional anticoagulation, however, the release of MPO could be inhibited totally
(20). By means of the regional citrate anticoagulation for critical ill acute patients a significant
decrease of mortality was observed (21) using CVVH as treatment mode. A better recovery of
kidney function is supposed as reason.
Fig. 17 Time dependence of activated clotting time (ACT) as function of heparin reduction during dialysis treatment with acetate dialysate or Citrasate®
0
50
100
150
200
250
sec
ACT während HD; n=7
ACT prä
ACT15min
ACT post
ACT during HD; n=7
ACT pre
ACT 15min
ACT post
11
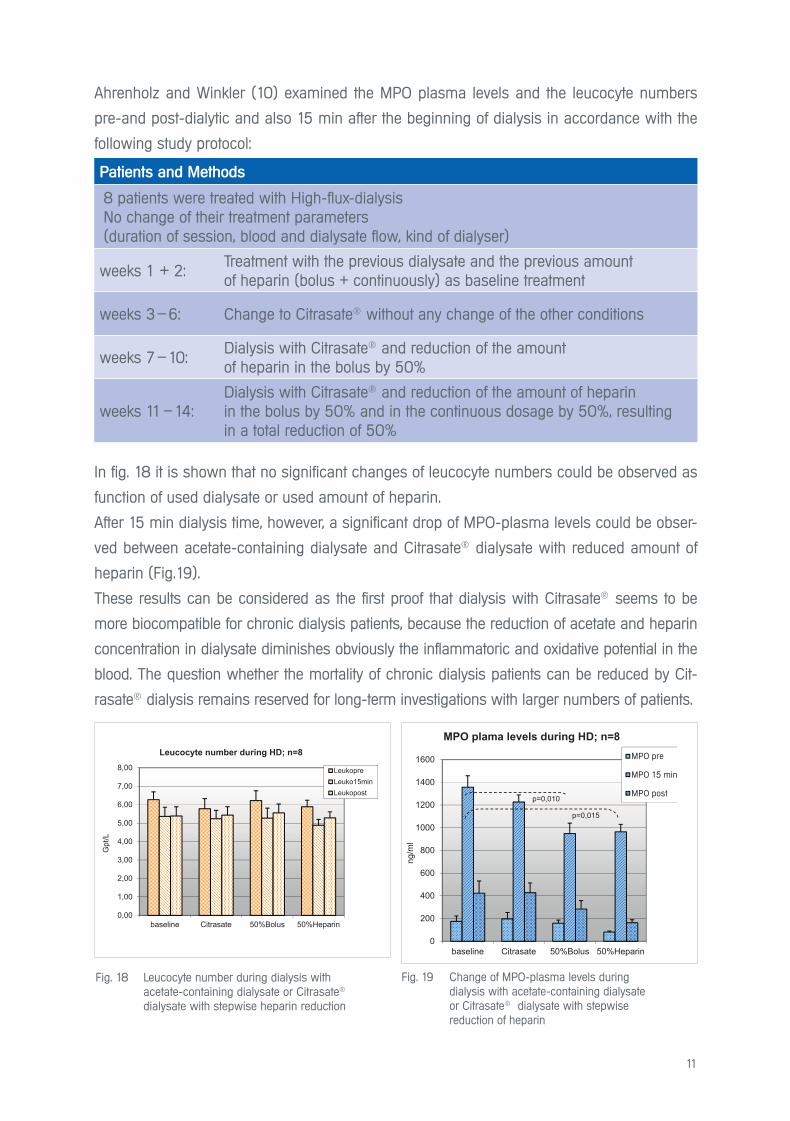
Ahrenholz and Winkler (10) examined the MPO plasma levels and the leucocyte numbers
pre-and post-dialytic and also 15 min after the beginning of dialysis in accordance with the
following study protocol:
In fig. 18 it is shown that no significant changes of leucocyte numbers could be observed as
function of used dialysate or used amount of heparin.
After 15 min dialysis time, however, a significant drop of MPO-plasma levels could be obser-
ved between acetate-containing dialysate and Citrasate® dialysate with reduced amount of
heparin (Fig.19).
These results can be considered as the first proof that dialysis with Citrasate® seems to be
more biocompatible for chronic dialysis patients, because the reduction of acetate and heparin
concentration in dialysate diminishes obviously the inflammatoric and oxidative potential in the
blood. The question whether the mortality of chronic dialysis patients can be reduced by Cit-
rasate® dialysis remains reserved for long-term investigations with larger numbers of patients.
0,00
1,00
2,00
3,00
4,00
5,00
6,00
7,00
8,00
baseline Citrasate 50%Bolus 50%Heparin
Gpt
/L
Leucocyte number during HD; n=8
LeukoprLeuko15minLeukopost
Fig. 18 Leucocyte number during dialysis with acetate-containing dialysate or Citrasate®
dialysate with stepwise heparin reduction
0
200
400
600
800
1000
1200
1400
1600
baseline Citrasate 50%Bolus 50%Heparin
ng/m
l
MPO plama levels during HD; n=8MPO prä
MPO 15 min
MPO postp=0,010
p=0,015
Fig. 19 Change of MPO-plasma levels during dialysis with acetate-containing dialysate or Citrasate® dialysate with stepwise reduction of heparin
Patients and Methods
8 patients were treated with High-flux-dialysisNo change of their treatment parameters(duration of session, blood and dialysate flow, kind of dialyser)
weeks 1 + 2: Treatment with the previous dialysate and the previous amount of heparin (bolus + continuously) as baseline treatment
weeks 3 – 6: Change to Citrasate® without any change of the other conditions
weeks 7 – 10: Dialysis with Citrasate® and reduction of the amount of heparin in the bolus by 50%
weeks 11 – 14: Dialysis with Citrasate® and reduction of the amount of heparin in the bolus by 50% and in the continuous dosage by 50%, resulting in a total reduction of 50%
MPO pre
MPO 15 min
MPO post
12
The sucsessful application of Citrasate® for the heparin free „ slow efficiency“ dialysis (SLED)
for acute treatment of critically ill patients with multiorgan failure or advanced liver failure has
been described by Ahmad and Tu (24)
5.2 On-line Hemodiafiltration
- The results, presented so far in this brochure, relate exclusively to High-flux-dialysis with Cit-
rasate®, for which most results are available.
- First results of application of Citrasate® in on-line hemodiafiltration (HDF) are available from
Polakovic et al. (22) for 2 patients in predilution mode and 1 patient in postdilution mode after
2 weeks of treatment.
However, no statistical relevant statements can be made on the basis of this low number of
patients and treatments.
The first more extensive investigation with on-line hemodialfiltration applying Citrasate® was
performed by Ahrenholz et al. (27) and Winkler et al. (28) with 8 patients. Since the infusate
for on-line HDF will be prepared directly from the dialysate, the use of Citrasate® dialysate
means the infusion of a considerable amount of citrate directly into the blood.
Using on-line HDF in predilution mode, the substitution fluid will be infused into the blood
before the dialyser, which means citrate will be included in the mass transfer processes of the
dialyser. During on-line HDF in postdilution mode, the infusion of citrate containing fluid takes
place behind the dialyser into the peripheral blood of patients. Since the effects of Citrasate®
on free calcium ion concentration and coagulation system cannot be precisely predicted,
Citrasate® was applied at first in the predilution mode of on-line HDF.
5.2.1. On-line Hemodiafiltration in predilution mode
The study was accomplished with 8 patients after the investigation with Citrasate® and 50%
heparin reduction in High-flux modus (27, 28) The following questions should be answered:
Is it possible, with a substitution rate of 150ml/min and otherwise unchanged treatment con-
ditions for on-line HDF predilution
a) to maintain the reduced heparin amount of 50%?
b) to improve the dialysis efficacy as a result of influence of Citrasate® on clotting proces-
ses inside the dialyser?
c) to reduce the activation of MPO similar to High-flux-dialysis?
d) that the plasma concentrations of calcium and phosphate will stay in the physiological
optimal range?
13
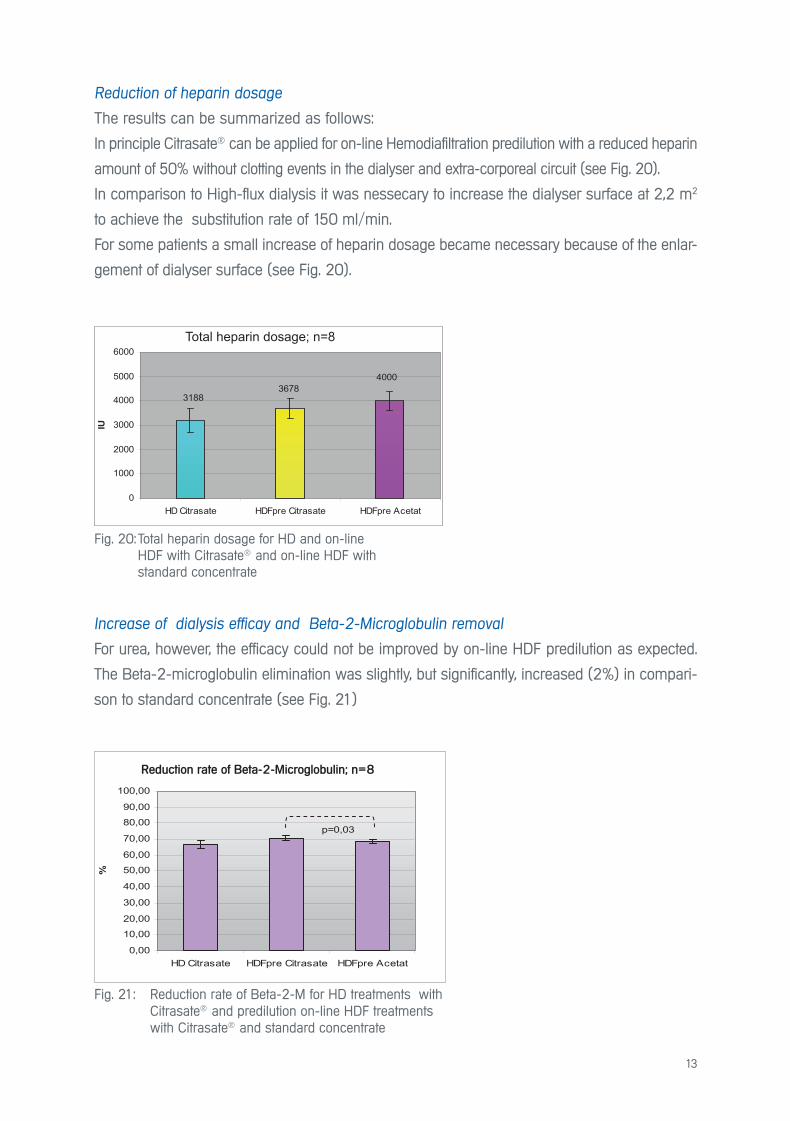
Reduction of heparin dosage
The results can be summarized as follows:
In principle Citrasate® can be applied for on-line Hemodiafiltration predilution with a reduced heparin
amount of 50% without clotting events in the dialyser and extra-corporeal circuit (see Fig. 20).
In comparison to High-flux dialysis it was nessecary to increase the dialyser surface at 2,2 m2
to achieve the substitution rate of 150 ml/min.
For some patients a small increase of heparin dosage became necessary because of the enlar-
gement of dialyser surface (see Fig. 20).
Fig. 21: Reduction rate of Beta-2-M for HD treatments with Citrasate® and predilution on-line HDF treatments with Citrasate® and standard concentrate
Reduction-Rate von Beta-2-MG; n = 8
0,00
10,00
20,00
30,00
40,00
50,00
60,00
70,00
80,00
90,00
100,00
HD Citrasate HDFpre Citrasate HDFpre Acetat
%
p=0,03
Reduktionsrate von Beta-2-Mikroglobulin ; n= 8Reduction rate of Beta-2-Microglobulin; n=8
Increase of dialysis efficay and Beta-2-Microglobulin removal
For urea, however, the efficacy could not be improved by on-line HDF predilution as expected.
The Beta-2-microglobulin elimination was slightly, but significantly, increased (2%) in compari-
son to standard concentrate (see Fig. 21)
Fig. 20: Total heparin dosage for HD and on-line HDF with Citrasate® and on-line HDF with standard concentrate
Heparin Gesamtdosis
40003678
3188
0
1000
2000
3000
4000
5000
6000
HD Citrasate HDFpre Citrasate HDFpre Acetat
IU
Total heparin dosage; n=8
14
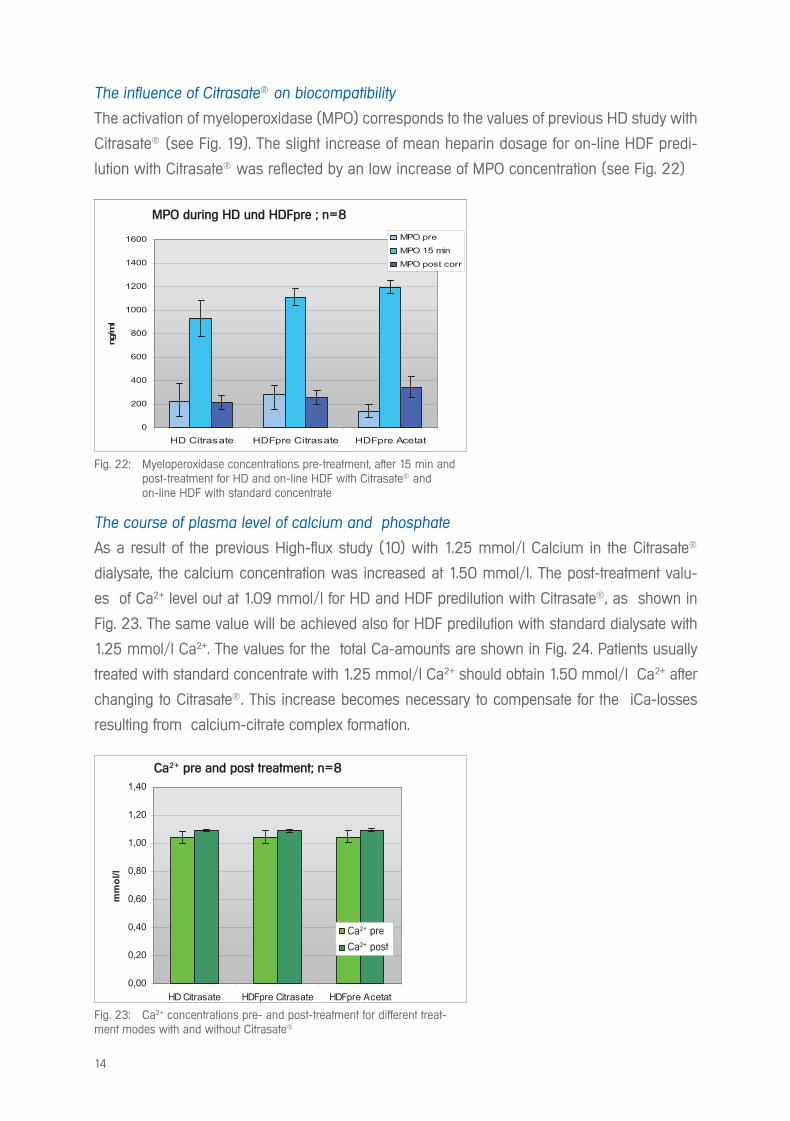
Fig. 22: Myeloperoxidase concentrations pre-treatment, after 15 min and post-treatment for HD and on-line HDF with Citrasate® and on-line HDF with standard concentrate
Fig. 23: Ca2+ concentrations pre- and post-treatment for different treat-ment modes with and without Citrasate®
The influence of Citrasate® on biocompatibility
The activation of myeloperoxidase (MPO) corresponds to the values of previous HD study with
Citrasate® (see Fig. 19). The slight increase of mean heparin dosage for on-line HDF predi-
lution with Citrasate® was reflected by an low increase of MPO concentration (see Fig. 22)
MPO während HD und HDFpre; n = 8
0
200
400
600
800
1000
1200
1400
1600
HD Citrasate HDFpre Citrasate HDFpre Acetat
ng/m
l
MPO pre
MPO 15 min
MPO post corr
MPO während HD und HDFprä ; n=8
Ca2+ vor und nach Behandlung; n = 8
0,00
0,20
0,40
0,60
0,80
1,00
1,20
1,40
HD Citrasate HDFpre Citrasate HDFpre Acetat
mm
ol/l
Ca2+ pr
Ca2+ post
MPO during HD und HDFpre ; n=8
Ca2+ pre and post treatment; n=8
The course of plasma level of calcium and phosphate
As a result of the previous High-flux study (10) with 1.25 mmol/l Calcium in the Citrasate®
dialysate, the calcium concentration was increased at 1.50 mmol/l. The post-treatment valu-
es of Ca2+ level out at 1.09 mmol/l for HD and HDF predilution with Citrasate®, as shown in
Fig. 23. The same value will be achieved also for HDF predilution with standard dialysate with
1.25 mmol/l Ca2+. The values for the total Ca-amounts are shown in Fig. 24. Patients usually
treated with standard concentrate with 1.25 mmol/l Ca2+ should obtain 1.50 mmol/l Ca2+ after
changing to Citrasate®. This increase becomes necessary to compensate for the iCa-losses
resulting from calcium-citrate complex formation.
Ca2+ pre
Ca2+ post

15
Fig. 24: Total Ca concentrations pre- and post-treatment for different treatment modes with and without Citrasate®
Gesamt-Ca vor und nach Behandlung; n = 8
0,00
0,50
1,00
1,50
2,00
2,50
HD Citrasate HDF pre Citrasate HDF pre Acetat
mm
ol/l
gesamt Ca prä
gesamt Ca post corr
-0,40
-0,30
-0,20
-0,10
0,00
0,10
0,20
HD Citrasate HDFpreCitrasate
HDFpre Acetat
%
The balance between changes of total Ca and ionized Ca (iCa) during treatments can be
expressed as so-called Ca-GAP due to the following equation from Gabutti el al. (13, 29):
Ca-GAP = (totalCa post – totalCa pre) – (iCa post – iCa pre)
If the metabolisation of citrate is quick, the Ca-GAP becomes smaller than 0.2 (13, 29). As the
results in Fig. 25 show, on average this condition was fulfilled.
Fig. 25: Ca-GAP for different treatment modes with and without Citrasate®
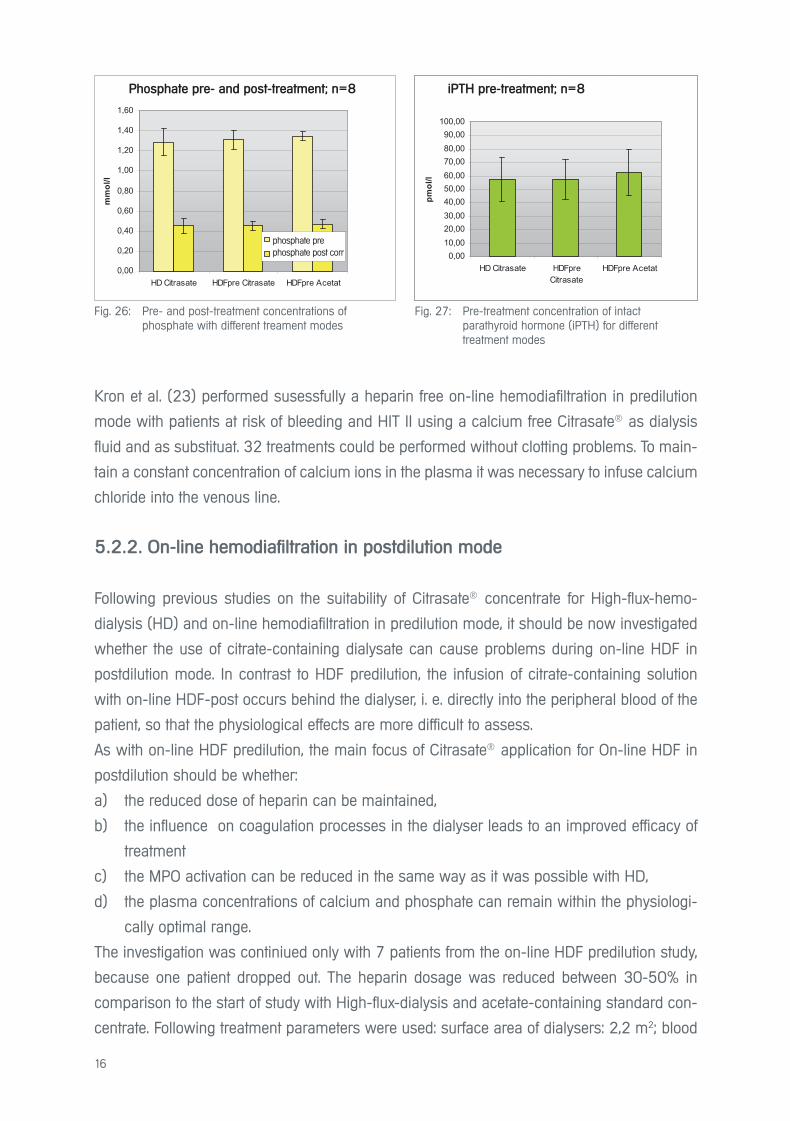
The calcium-phosphate balance is determined largely by parathyroid hormone. Disruptions
of the balance due to non-physiological treatment conditions would therefore be reflected in
the concentrations of Ca2+, phosphate and PTH As shown in Figures 26 and 27, however, no
significant differences between on-line HDF-post treatment values with Citrasate® and stan-
dard concentrate were observed.
Total Ca pre- and post-treatment; n = 8
Calcium-GAP; n = 8
total Ca pre
total Ca post
16
Kron et al. (23) performed susessfully a heparin free on-line hemodiafiltration in predilution
mode with patients at risk of bleeding and HIT II using a calcium free Citrasate® as dialysis
fluid and as substituat. 32 treatments could be performed without clotting problems. To main-
tain a constant concentration of calcium ions in the plasma it was necessary to infuse calcium
chloride into the venous line.
5.2.2. On-line hemodiafiltration in postdilution mode
Following previous studies on the suitability of Citrasate® concentrate for High-flux-hemo-
dialysis (HD) and on-line hemodiafiltration in predilution mode, it should be now investigated
whether the use of citrate-containing dialysate can cause problems during on-line HDF in
postdilution mode. In contrast to HDF predilution, the infusion of citrate-containing solution
with on-line HDF-post occurs behind the dialyser, i. e. directly into the peripheral blood of the
patient, so that the physiological effects are more difficult to assess.
As with on-line HDF predilution, the main focus of Citrasate® application for On-line HDF in
postdilution should be whether:
a) the reduced dose of heparin can be maintained,
b) the influence on coagulation processes in the dialyser leads to an improved efficacy of
treatment
c) the MPO activation can be reduced in the same way as it was possible with HD,
d) the plasma concentrations of calcium and phosphate can remain within the physiologi-
cally optimal range.
The investigation was continiued only with 7 patients from the on-line HDF predilution study,
because one patient dropped out. The heparin dosage was reduced between 30-50% in
comparison to the start of study with High-flux-dialysis and acetate-containing standard con-
centrate. Following treatment parameters were used: surface area of dialysers: 2,2 m2; blood
Fig. 26: Pre- and post-treatment concentrations of phosphate with different treament modes
Fig. 27: Pre-treatment concentration of intact parathyroid hormone (iPTH) for different treatment modes
Phosphat vor und nach Behandlung; n = 8
0,00
0,20
0,40
0,60
0,80
1,00
1,20
1,40
1,60
HD Citrasate HDFpre Citrasate HDFpre Acetat
mm
ol/l
Phosphat prä
Phosphat post corr
iPTH vor Behandlung; n = 8
0,0010,0020,0030,0040,0050,0060,0070,0080,0090,00
100,00
HD Citrasate HDFpreCitrasate
HDFpre Acetat
pmol
/l
Phosphate pre- and post-treatment; n=8 iPTH pre-treatment; n=8
phosphate prephosphate post corr
17
flow: 300ml/min; dialysate flow: 500 ml/min and substitution rate for postdilution: 60 ml/min.
The results can summarised as follows:
Reduction of the heparin dose
In principle Citrasate® can be used for on-line hemodiafiltration in postdilution with a reduced
amount of heparin up to 50% in comparison with standard dialysate.
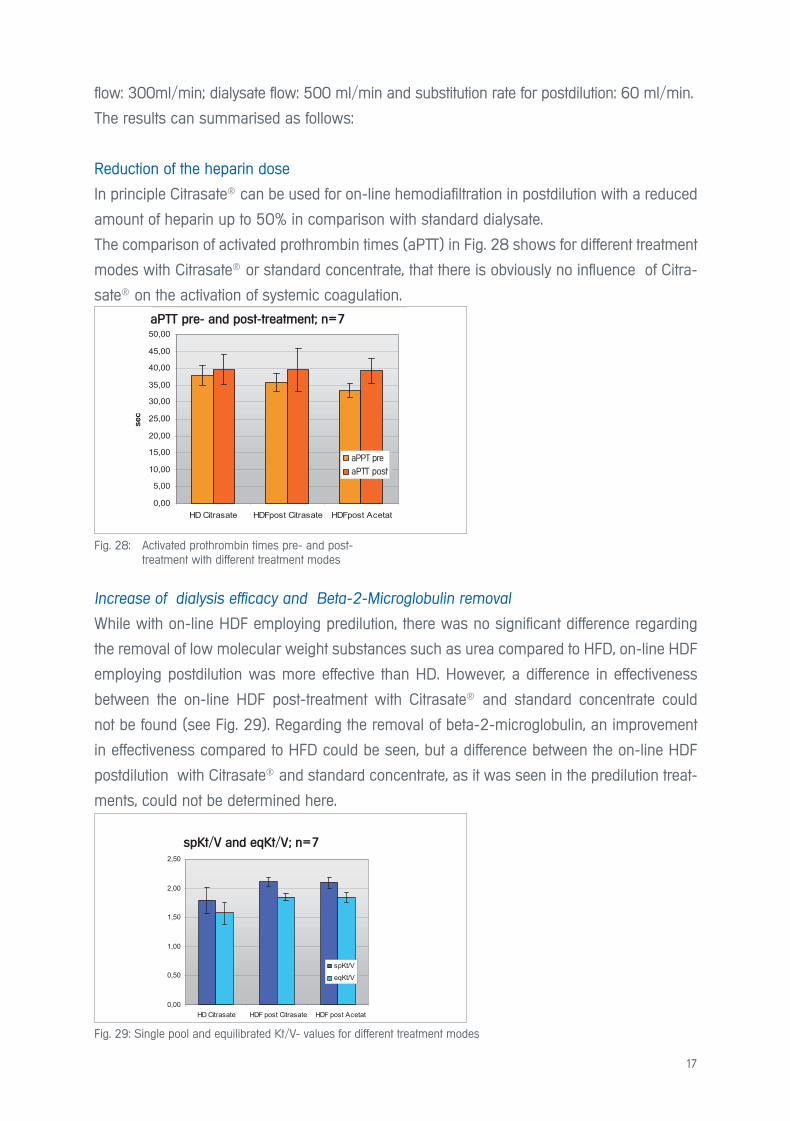
The comparison of activated prothrombin times (aPTT) in Fig. 28 shows for different treatment
modes with Citrasate® or standard concentrate, that there is obviously no influence of Citra-
sate® on the activation of systemic coagulation.
Fig. 28: Activated prothrombin times pre- and post- treatment with different treatment modes
Fig. 29: Single pool and equilibrated Kt/V- values for different treatment modes
apTT vor und nach Behandlung; n = 7
0,00
5,00
10,00
15,00
20,00
25,00
30,00
35,00
40,00
45,00
50,00
HD Citrasate HDFpost Citrasate HDFpost Acetat
sec
apTTprä
apTTpost
aPTT vor und nach der Behandlung ; n=7
spKt/V und eqKt/V; n = 7
0,00
0,50
1,00
1,50
2,00
2,50
HD Citrasate HDF post Citrasate HDF post Acetat
spKt/V
eqKt/V
Increase of dialysis efficacy and Beta-2-Microglobulin removal
While with on-line HDF employing predilution, there was no significant difference regarding
the removal of low molecular weight substances such as urea compared to HFD, on-line HDF
employing postdilution was more effective than HD. However, a difference in effectiveness
between the on-line HDF post-treatment with Citrasate® and standard concentrate could
not be found (see Fig. 29). Regarding the removal of beta-2-microglobulin, an improvement
in effectiveness compared to HFD could be seen, but a difference between the on-line HDF
postdilution with Citrasate® and standard concentrate, as it was seen in the predilution treat-
ments, could not be determined here.
aPTT pre- and post-treatment; n=7
spKt/V and eqKt/V; n=7
aPPT pre
aPTT post
18
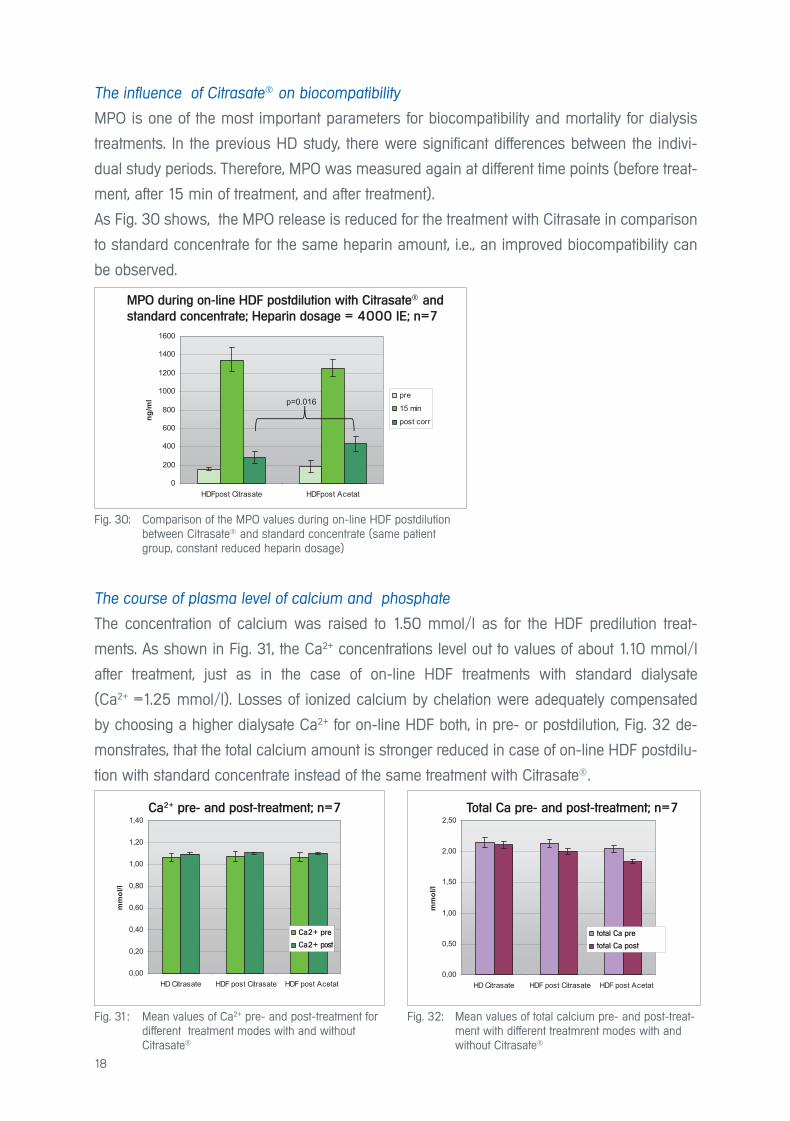
The influence of Citrasate® on biocompatibility
MPO is one of the most important parameters for biocompatibility and mortality for dialysis
treatments. In the previous HD study, there were significant differences between the indivi-
dual study periods. Therefore, MPO was measured again at different time points (before treat-
ment, after 15 min of treatment, and after treatment).
As Fig. 30 shows, the MPO release is reduced for the treatment with Citrasate in comparison
to standard concentrate for the same heparin amount, i.e., an improved biocompatibility can
be observed.
Fig. 30: Comparison of the MPO values during on-line HDF postdilution between Citrasate® and standard concentrate (same patient group, constant reduced heparin dosage)
Fig. 31: Mean values of Ca2+ pre- and post-treatment for different treatment modes with and without Citrasate®
Fig. 32: Mean values of total calcium pre- and post-treat- ment with different treatmrent modes with and without Citrasate®
MPO bei HDF-Post mit Citrasate und Normalkonzentrat; Heparindosis konstant (4000 IE); n = 7
0
200
400
600
800
1000
1200
1400
1600
HDFpost Citrasate HDFpost Acetat
ng/m
l pre
15 min
post corr
p=0.016
Ca2+ vor und nach Behandlung; n = 7
0,00
0,20
0,40
0,60
0,80
1,00
1,20
1,40
HD Citrasate HDF post Citrasate HDF post Acetat
mm
ol/l
Ca2+ prä
Ca2+ post
Gesamt-Ca vor und nach Behandlung; n = 7
0,00
0,50
1,00
1,50
2,00
2,50
HD Citrasate HDF post Citrasate HDF post Acetat
mm
ol/l
gesamt Ca prä
gesamt Ca post corr
The course of plasma level of calcium and phosphate
The concentration of calcium was raised to 1.50 mmol/l as for the HDF predilution treat-
ments. As shown in Fig. 31, the Ca2+ concentrations level out to values of about 1.10 mmol/l
after treatment, just as in the case of on-line HDF treatments with standard dialysate
(Ca2+ =1.25 mmol/l). Losses of ionized calcium by chelation were adequately compensated
by choosing a higher dialysate Ca2+ for on-line HDF both, in pre- or postdilution, Fig. 32 de-
monstrates, that the total calcium amount is stronger reduced in case of on-line HDF postdilu-
tion with standard concentrate instead of the same treatment with Citrasate®.
MPO during on-line HDF postdilution with Citrasate® and
standard concentrate; Heparin dosage = 4000 IE; n=7
Ca2+ pre- and post-treatment; n=7 Total Ca pre- and post-treatment; n=7
Ca2+ pre total Ca pre
Ca2+ post total Ca post
19
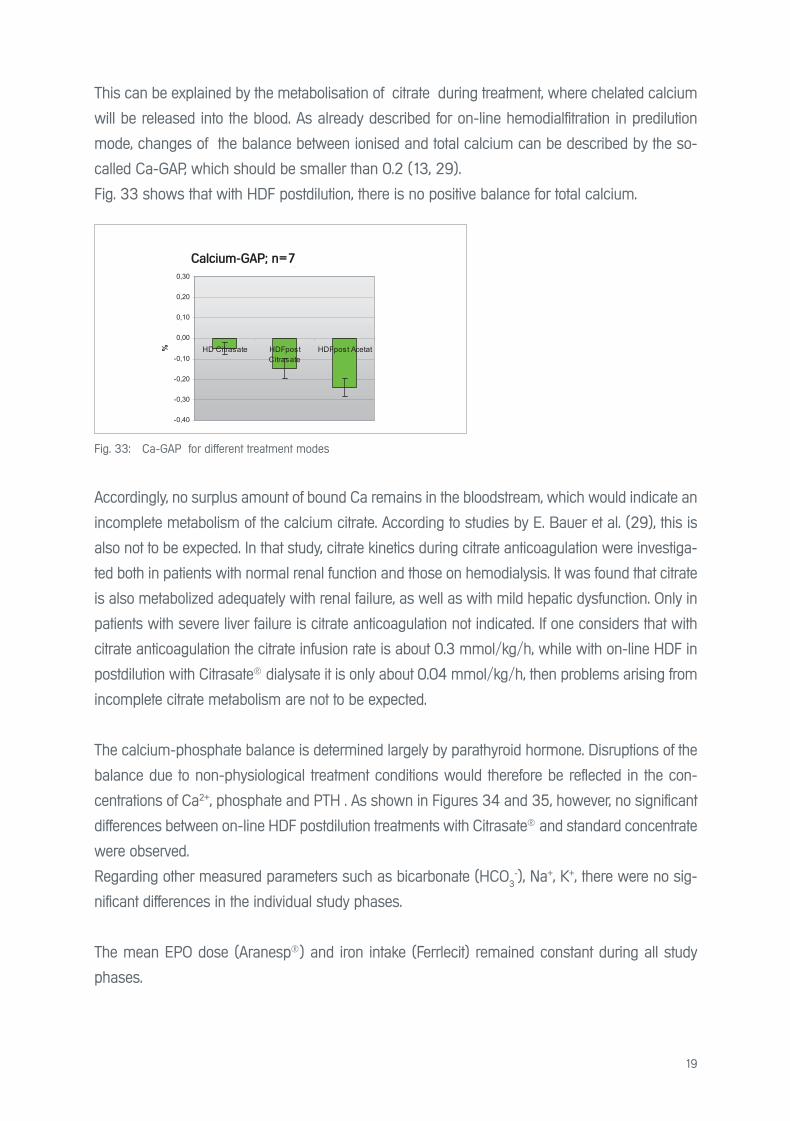
This can be explained by the metabolisation of citrate during treatment, where chelated calcium
will be released into the blood. As already described for on-line hemodialfitration in predilution
mode, changes of the balance between ionised and total calcium can be described by the so-
called Ca-GAP, which should be smaller than 0.2 (13, 29).
Fig. 33 shows that with HDF postdilution, there is no positive balance for total calcium.
Fig. 33: Ca-GAP for different treatment modes
Calcium-GAP; n = 7
-0,40
-0,30
-0,20
-0,10
0,00
0,10
0,20
0,30
HD Citrasate HDFpostCitrasate
HDFpost Acetat%
Accordingly, no surplus amount of bound Ca remains in the bloodstream, which would indicate an
incomplete metabolism of the calcium citrate. According to studies by E. Bauer et al. (29), this is
also not to be expected. In that study, citrate kinetics during citrate anticoagulation were investiga-
ted both in patients with normal renal function and those on hemodialysis. It was found that citrate
is also metabolized adequately with renal failure, as well as with mild hepatic dysfunction. Only in
patients with severe liver failure is citrate anticoagulation not indicated. If one considers that with
citrate anticoagulation the citrate infusion rate is about 0.3 mmol/kg/h, while with on-line HDF in
postdilution with Citrasate® dialysate it is only about 0.04 mmol/kg/h, then problems arising from
incomplete citrate metabolism are not to be expected.
The calcium-phosphate balance is determined largely by parathyroid hormone. Disruptions of the
balance due to non-physiological treatment conditions would therefore be reflected in the con-
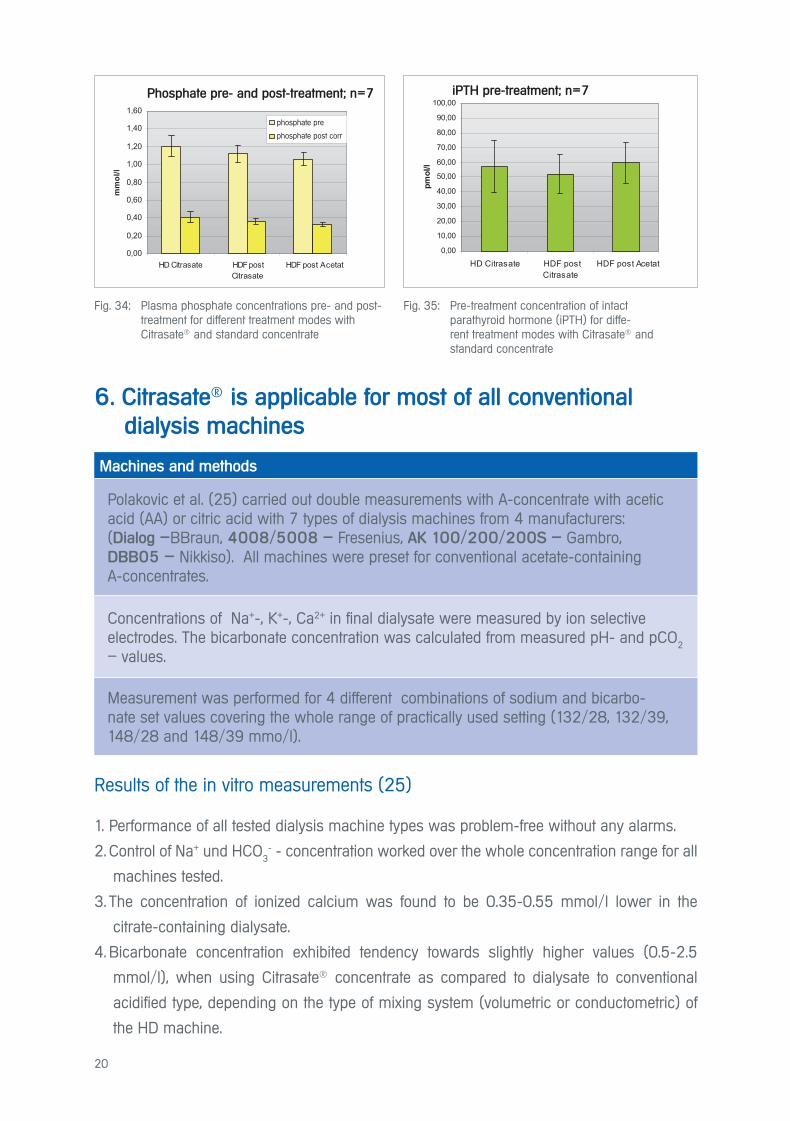
centrations of Ca2+, phosphate and PTH . As shown in Figures 34 and 35, however, no significant
differences between on-line HDF postdilution treatments with Citrasate® and standard concentrate
were observed.
Regarding other measured parameters such as bicarbonate (HCO3-), Na+, K+, there were no sig-
nificant differences in the individual study phases.
The mean EPO dose (Aranesp®) and iron intake (Ferrlecit) remained constant during all study
phases.
Calcium-GAP; n=7
20
6. Citrasate® is applicable for most of all conventional
dialysis machines
Results of the in vitro measurements (25)
1. Performance of all tested dialysis machine types was problem-free without any alarms.
2. Control of Na+ und HCO3
- - concentration worked over the whole concentration range for all
machines tested.
3. The concentration of ionized calcium was found to be 0.35-0.55 mmol/l lower in the
citrate-containing dialysate.
4. Bicarbonate concentration exhibited tendency towards slightly higher values (0.5-2.5
mmol/l), when using Citrasate® concentrate as compared to dialysate to conventional
acidified type, depending on the type of mixing system (volumetric or conductometric) of
the HD machine.
Machines and methods
Polakovic et al. (25) carried out double measurements with A-concentrate with acetic acid (AA) or citric acid with 7 types of dialysis machines from 4 manufacturers: (Dialog –BBraun, 4008/5008 – Fresenius, AK 100/200/200S – Gambro, DBB05 – Nikkiso). All machines were preset for conventional acetate-containing A-concentrates.
Concentrations of Na+-, K+-, Ca2+ in final dialysate were measured by ion selective electrodes. The bicarbonate concentration was calculated from measured pH- and pCO
2
– values.
Measurement was performed for 4 different combinations of sodium and bicarbo-nate set values covering the whole range of practically used setting (132/28, 132/39, 148/28 and 148/39 mmo/l).
Fig. 34: Plasma phosphate concentrations pre- and post- treatment for different treatment modes with Citrasate® and standard concentrate
Fig. 35: Pre-treatment concentration of intact parathyroid hormone (iPTH) for diffe- rent treatment modes with Citrasate® and standard concentrate
Phosphat vor und nach Behandlung; n = 7
0,00
0,20
0,40
0,60
0,80
1,00
1,20
1,40
1,60
HD Citrasate HDFpostCitrasate
HDF post Acetat
mm
ol/l
Phosphat prä
Phosphat post corr
iPTH vor Behandlung; n = 8
0,00
10,00
20,00
30,00
40,00
50,00
60,00
70,00
80,00
90,00
100,00
HD Citrasate HDF postCitrasate
HDF post Acetat
pmol
/l
Phosphate pre- and post-treatment; n=7 iPTH pre-treatment; n=7
phosphate pre
phosphate post corr
21
7. Advantages of dialysis with Citrasate® for
patients and users
• With Citrasate® the heparin dose for High-flux-dialysis and on-line Hemodiafiltration in pre-
or postdilution modus may be reduced up to 50% without clotting problems occuring in the
extracorporal circuit or dialyser and without reduction of dialysis dose prescribed.
• The plasma concentrations of calcium and phosphate stay in a physiologically optimal
range during application of Citrasate®.
• Long bleeding times can be reduced with the use of Citrasate® for patients with high blee-
ding risk.
• The use of Citrasate® increases the haemodynamic stability of hypertensive patients during
treatment with High-flux-dialysis.
• The treatment with Citrasate® was proven to be more biocompatible for chronic dialysis
patients, because the reduction of acetate and heparin dosage diminishes obviously the
inflammatoric and oxidative potential in the blood.
• The successful application of Citrasate® has been proven on the the following dialysis ma-
chines:
Dialog–BBraun, 4008/5008 – Fresenius, AK 100/ 200/200S – Gambro and
DBB05 – Nikkiso.
• The course of ionized Ca during HD and HDF pre- or postdilution with Citrasate® corres-
ponds to that of standard dialysate with 1.25 mmol/l Ca2+ after an increase of dialysate
calcium from 1.25 to 1.50 mmol/l.
• An economical benefit is achieved for the user by saving heparin.

22
8. Literature
1. Vinay P. Acetate metabolism during dialysis: metabolic considerations.
Am. J. Nephrol. 1987; 7:337-354
2. Bingel M et al. Enhancement of in vitro human Interleukin I production by sodium acetate.
The Lancet 1987; 329:14-16
3. Diamon S. et al. Comparison of acetate free citrate hemodialysis and bicarbonate he-
modialysis regarding effects of intradialytic hypotension and malaise.
Therapeutic Apheresis and Dialysis 2011;15: 460-465
4. Elisaf MS et al. Effects of conventional and low molecular weight heparin on lipid pro-
file in hemodialysis patients. Am J Nephrol 1997;17:153-157
5. Sela S. Oxidative stress during hemodialysis: Effect of heparin.
Kidney Int 2001;59:159-163
6. Malle et al. Myeloperoxidase in kidney disease. Kidney Int 2003; 64:1956-1967
7. Sackler JP et al. Heparin-induced osteoporosis. Brit J of Radiology 1973;46:548-550
8. Asmis LM et al. Heparin-induzierte Thrombozytopenie (HIT). Schweiz. Med. Forum
2004; 4:997-1002
9. Kossmann RJ et al. Fifty-five percent heparin reduction is safe with Citrasate dialysate
in chronic dialysis Patients. ASN Renal week Meeting, 2006, Abstract No. 708
10. Ahrenholz P et al. Heparin reduction and improved compatibility using citrate enriched
dialysate.
EDTA Congress , Paris 2012, Abstract and poster FP 434
11. Kossmann RJ et al. Increased efficiency of hemodialysis with citrate dialysate,
A prospective controlled study. CJASN 2009; 4:1459-1464
12. Svara F et al. Long term use of A-Concentrate Citrasate during Bicarbonate dialysis.
Kidney & Blood Pressure Research 2010; 33:318 (abstract)
13. Gabutti L et al. Citrate vs. Acetate-based dialysate in bicarbonate haemodialysis: conse-
quences on haemodynamics, coagulation, acid-base status and electrolytes.
BMC Nephrology 2009; 10:471-2369/10/7
14. Hofbauer R et al. Effect of anticoagulation on blood-membrane interaction during he-
modialysis. Kidney Int 1999;56:1578-1583
15. Advanced Renal Technologies Inc. USA 2008, personal information
16. Leimbach T et al. Heparin-Einsparung durch Verwendung von citrathaltigem Dialysat?
Kongress für Nephrologie 2011, Berlin, Poster 36
17. Hörl W Die Antikoagulation mit Zitrat reduziert die Mortalität und verbessert die Erho-
lung der Nierenfunktion bei Patienten mit akutem Nierenversagen.
Nephro-News 2008, Ausgabe 05/08
23
18. Lau D et al. MPO mediates neutrophil activation by association with CD11b/CD18
Integrins. Proc. Natl Acad Sci USA 2005; 102:431-36
19. Krieter DH et al. A new sythetic dialyzer with advanced permselectivity for enhanced
low molecular weight protein removal.
Artif Organs 2008; 32:547-554
20. Gritters M et al. Citrate anticoagulation abolishes degranulation of polymorphonuclear
cells and platelets and reduces oxidative stress during hemodialysis.
Nephrol Dial Transplant 2006;21:153-159
21. Oudemans-van Straaten HM et al. Citrate anticoagulation for continuous venovenous
hemofiltration.
Crit. Care Med 2009;37:545-552
22. Polakovic V et al. Bicarbonat hemodialysis and hemodialfiltration using citric-acid con-
taining A-concentrate. 9th International Nephrological Symposium: Metabolic changes
in chronic renal failure,
Aktuality v Nefrologii 2010; 16:13 (abstract)
23. Kron J et al. Regionale Antikoagulation durch Prädilutions Hämodiafiltration mit calci-
umfreien citrathaltigem Dialysat.
Kongress für Nephrologie 2011, Berlin, Poster 29
24. Ahmad S and Tu A Heparin Free Slow Efficience Dialysis (SLED) using Citrate dialy-
sate: Is safe and effective.
Blood Purif. 2007; 25: 191 (abstract)
25. Polakovic V et al. Citrasate® dialysis concentrate: In vitro tests and results of the citra-
sate use and in vivo bicarbonate haemodialysis and online haemodiafiltration,
Prague V/2008- I/2010.
26. Sands JJ et al. Effects of citrate acid (Citrasate) on Heparin N Requirements and he-
modialysis Adequacy: A multicenter, prospective noninferiority trial.
Blood. Purif. 2012;33:199-204
27. Ahrenholz P et al. Heparin-Reduzierung und verbesserte Hämokompatibilität durch
Citrasate-Konzentrat bei High-Flux-Hämodialyse und Hämodiafiltration.
Kongress für Nephrologie 2012, Hamburg, Abstract und Poster P115.
28. Winkler RE et al. Reduction of Heparin and Oxidative Potential by means of Citrasate® in
High-Flux Dialysis (HFD) and Online Hemodiafiltration (olHDF) in Pre- and Postdilution.
in „Hemodialysis“ ed. by Hiromichi Suzuki, 2012, Verlag InTech Rijeka (im Druck)
29. Bauer E et al. Citrate kinetics in patients receiving long-term hemodialysis therapy.
Am J Kidney Dis. 2005; 46(5):903-7
24
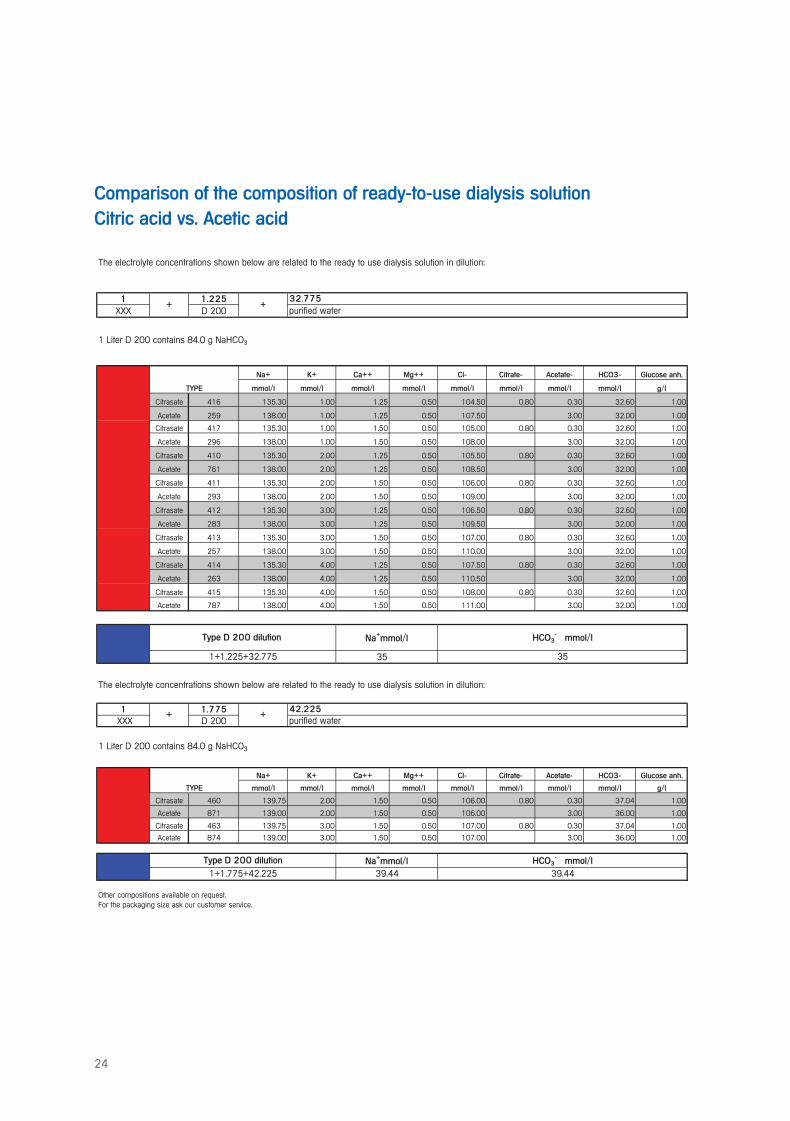
Comparison of the composition of ready-to-use dialysis solution
Citric acid vs. Acetic acid
The electrolyte concentrations shown below are related to the ready to use dialysis solution in dilution:
1 1.225
XXX D 200
1 Liter D 200 contains 84.0 g NaHCO3
Na+ K+ Ca++ Mg++ Cl- Citrate- Acetate- HCO3- Glucose anh.
mmol/l mmol/l mmol/l mmol/l mmol/l mmol/l mmol/l mmol/l g/l
Citrasate 416 135.30 1.00 1.25 0.50 104.50 0.80 0.30 32.60 1.00
Acetate 259 138.00 1.00 1.25 0.50 107.50 3.00 32.00 1.00
Citrasate 417 135.30 1.00 1.50 0.50 105.00 0.80 0.30 32.60 1.00
Acetate 296 138.00 1.00 1.50 0.50 108.00 3.00 32.00 1.00
Citrasate 410 135.30 2.00 1.25 0.50 105.50 0.80 0.30 32.60 1.00
Acetate 761 138.00 2.00 1.25 0.50 108.50 3.00 32.00 1.00
Citrasate 411 135.30 2.00 1.50 0.50 106.00 0.80 0.30 32.60 1.00
Acetate 293 138.00 2.00 1.50 0.50 109.00 3.00 32.00 1.00
Citrasate 412 135.30 3.00 1.25 0.50 106.50 0.80 0.30 32.60 1.00
Acetate 283 138.00 3.00 1.25 0.50 109.50 3.00 32.00 1.00
Citrasate 413 135.30 3.00 1.50 0.50 107.00 0.80 0.30 32.60 1.00
Acetate 257 138.00 3.00 1.50 0.50 110.00 3.00 32.00 1.00
Citrasate 414 135.30 4.00 1.25 0.50 107.50 0.80 0.30 32.60 1.00
Acetate 263 138.00 4.00 1.25 0.50 110.50 3.00 32.00 1.00
Citrasate 415 135.30 4.00 1.50 0.50 108.00 0.80 0.30 32.60 1.00
Acetate 787 138.00 4.00 1.50 0.50 111.00 3.00 32.00 1.00
35
The electrolyte concentrations shown below are related to the ready to use dialysis solution in dilution:
1 1.775
XXX D 200
1 Liter D 200 contains 84.0 g NaHCO3
Na+ K+ Ca++ Mg++ Cl- Citrate- Acetate- HCO3- Glucose anh.
mmol/l mmol/l mmol/l mmol/l mmol/l mmol/l mmol/l mmol/l g/l
Citrasate 460 139.75 2.00 1.50 0.50 106.00 0.80 0.30 37.04 1.00
Acetate 871 139.00 2.00 1.50 0.50 106.00 3.00 36.00 1.00
Citrasate 463 139.75 3.00 1.50 0.50 107.00 0.80 0.30 37.04 1.00
Acetate 874 139.00 3.00 1.50 0.50 107.00 3.00 36.00 1.00
Other compositions available on request.For the packaging size ask our customer service.
39.44
1+1.225+32.775
TYPE
TYPE
Type D 200 dilution
39.44
Na+mmol/l
Type D 200 dilution
42.225
purified water
HCO3- mmol/lNa
+mmol/l
HCO3- mmol/l
35
1+1.775+42.225
32.775+ +
purified water
+ +

Concentrate from
Neubrandenburg

© M
TN N
eubr
ande
nbur
g G
mbH
, 01
/201
3
MTN Neubrandenburg GmbH
Gustav-Kirchhoff-Straße 2 · 17033 Neubrandenburg
Tel +49(0)395 581 00 0 · Fax +49(0)395 581 00 99
[email protected] · www.mtn-nb.de


![[H. Kawanishi, A. C. Yamashita] Hemodiafiltration (BookFi.org)](https://img.pdfslide.net/doc/110x75/55cf94bf550346f57ba41c26/h-kawanishi-a-c-yamashita-hemodiafiltration-bookfiorg.jpg)