Embed Size (px)
DESCRIPTION
High Level Triggering. Fred Wickens. High Level Triggering (HLT). Introduction to triggering and HLT systems Why do we Trigger Why do we use Multi-Level Triggering Brief description of “typical” 3 level trigger Case study of ATLAS HLT (+ some comparisons with other experiments) Summary. - PowerPoint PPT Presentation
Citation preview
High Level Triggering
Fred Wickens
2
High Level Triggering (HLT)
• Introduction to triggering and HLT systems– Why do we Trigger– Why do we use Multi-Level Triggering – Brief description of “typical” 3 level trigger
• Case study of ATLAS HLT (+ some comparisons with other experiments)
• Summary
3
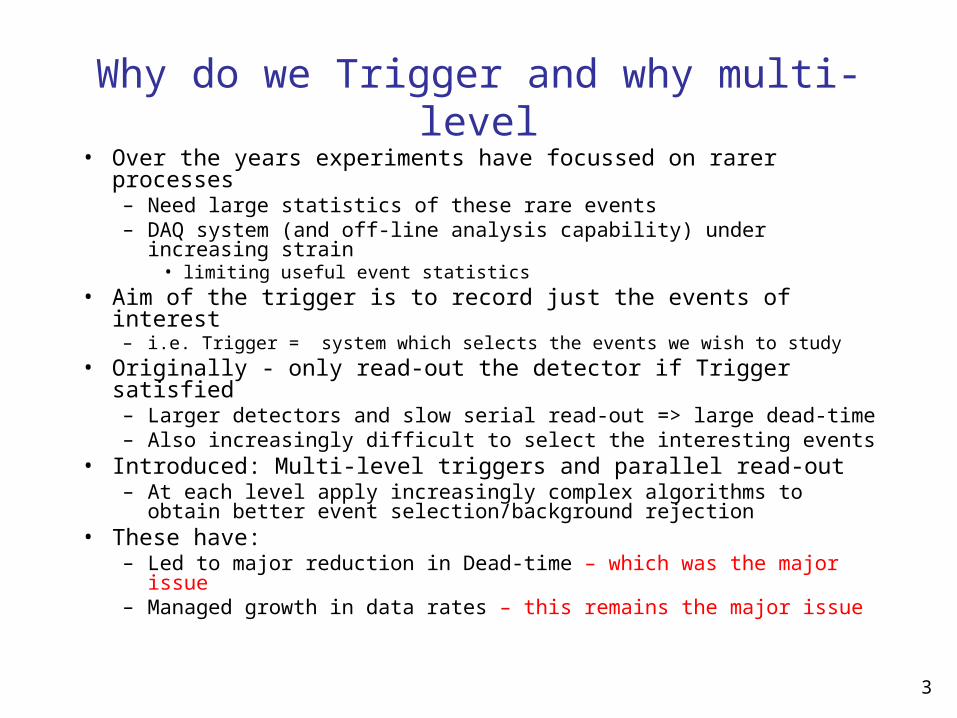
Why do we Trigger and why multi-level• Over the years experiments have focussed on rarer processes
– Need large statistics of these rare events– DAQ system (and off-line analysis capability) under increasing
strain• limiting useful event statistics
• Aim of the trigger is to record just the events of interest– i.e. Trigger = system which selects the events we wish to study
• Originally - only read-out the detector if Trigger satisfied– Larger detectors and slow serial read-out => large dead-time – Also increasingly difficult to select the interesting events
• Introduced: Multi-level triggers and parallel read-out– At each level apply increasingly complex algorithms to obtain better
event selection/background rejection• These have:
– Led to major reduction in Dead-time – which was the major issue– Managed growth in data rates – this remains the major issue
4
Summary of ATLAS Data Flow Rates
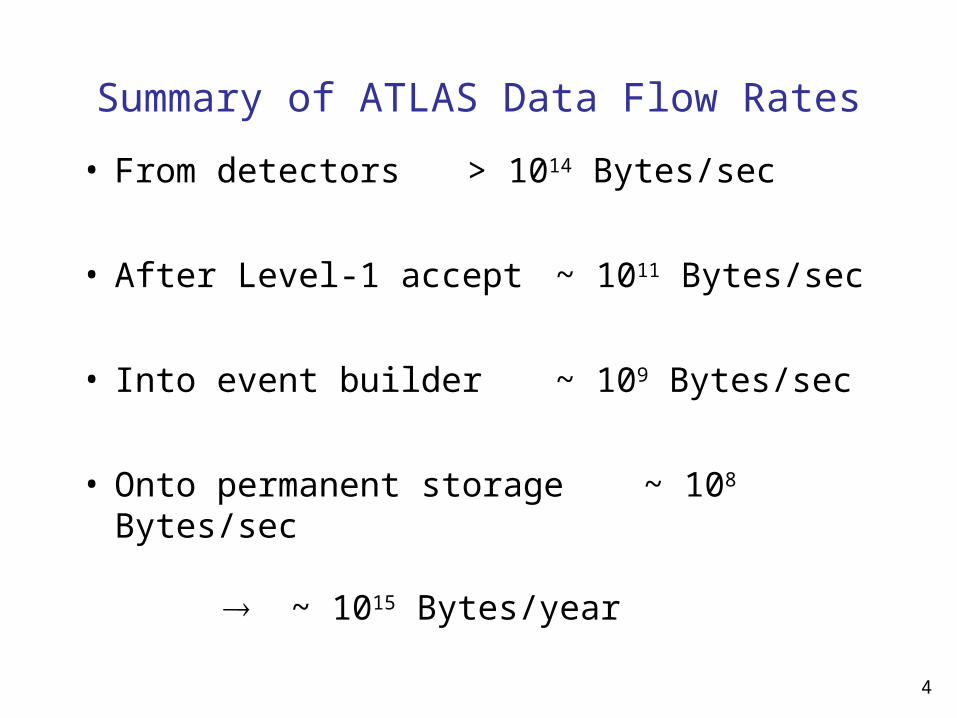
• From detectors > 1014 Bytes/sec
• After Level-1 accept ~ 1011 Bytes/sec
• Into event builder ~ 109 Bytes/sec
• Onto permanent storage ~ 108 Bytes/sec
~ 1015 Bytes/year
5
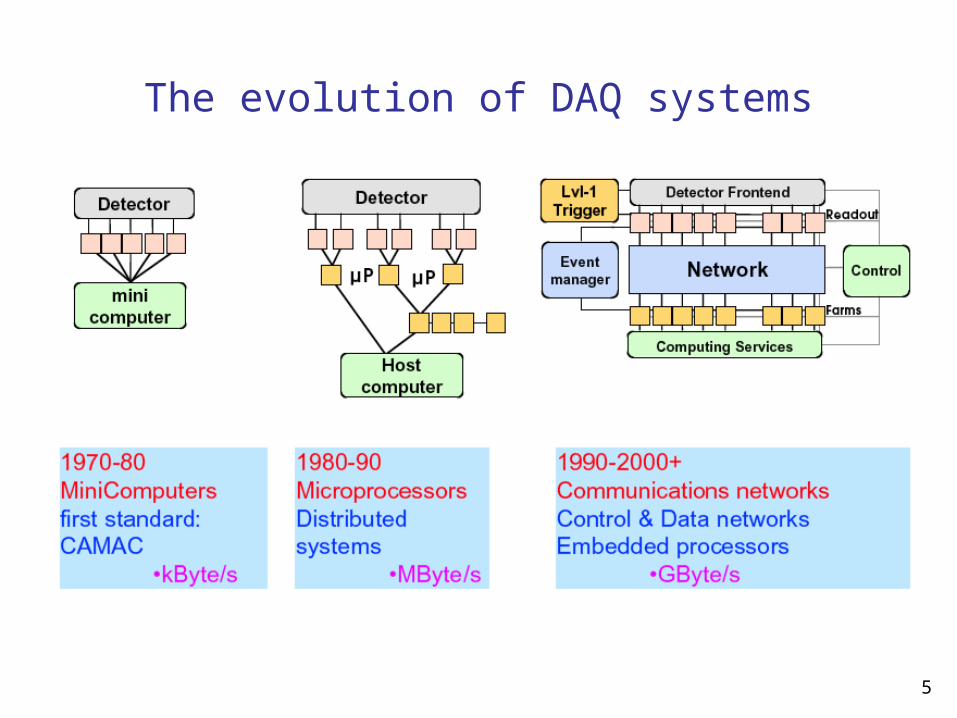
The evolution of DAQ systems
6
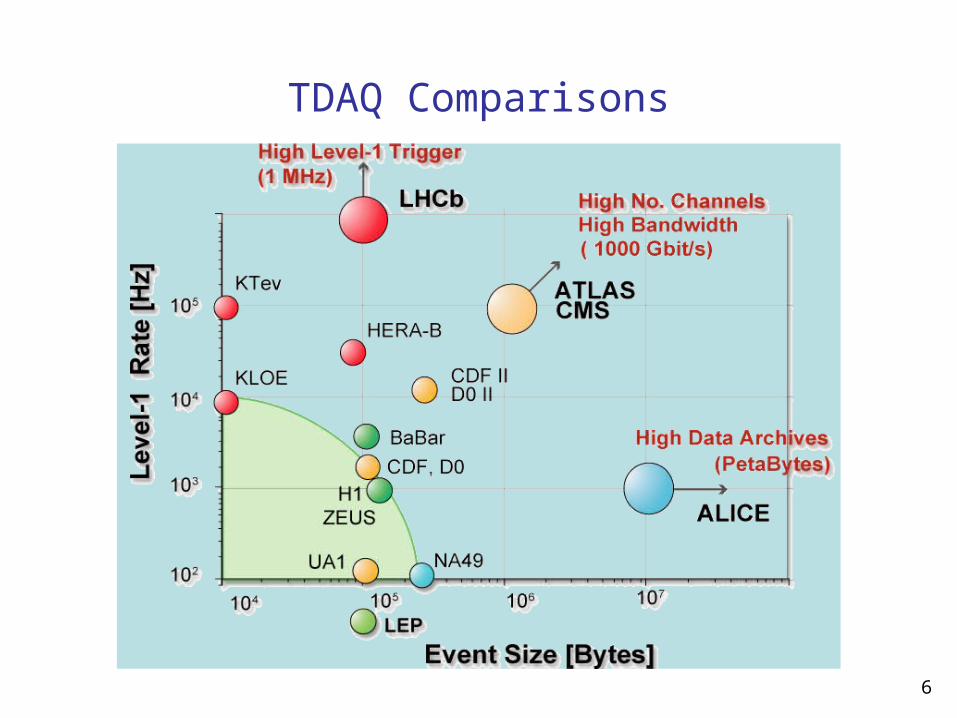
TDAQ Comparisons
7
Level 1
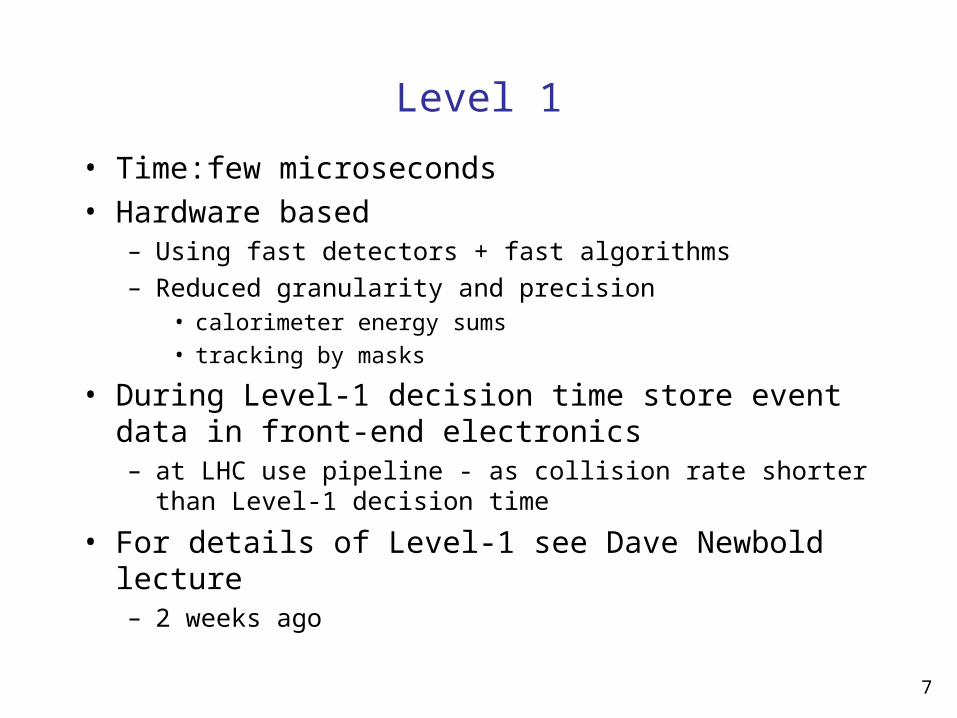
• Time: few microseconds• Hardware based
– Using fast detectors + fast algorithms – Reduced granularity and precision
• calorimeter energy sums
• tracking by masks
• During Level-1 decision time store event data in front-end electronics – at LHC use pipeline - as collision rate shorter than Level-1
decision time
• For details of Level-1 see Dave Newbold lecture– 2 weeks ago
8
Level 2
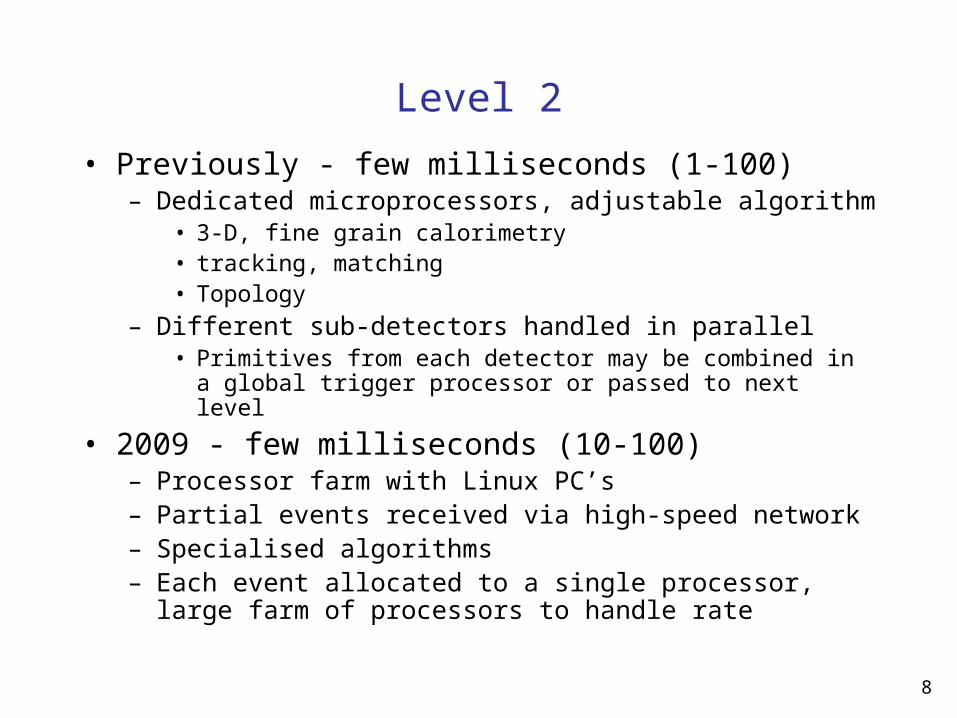
• Previously - few milliseconds (1-100)– Dedicated microprocessors, adjustable algorithm
• 3-D, fine grain calorimetry• tracking, matching• Topology
– Different sub-detectors handled in parallel• Primitives from each detector may be combined in a global
trigger processor or passed to next level
• 2009 - few milliseconds (10-100)– Processor farm with Linux PC’s– Partial events received via high-speed network– Specialised algorithms– Each event allocated to a single processor, large farm of
processors to handle rate
9
Level 3
• millisecs to seconds• processor farm
– Previously microprocessors/emulators– Now standard server PC’s
• full or partial event reconstruction– after event building (collection of all data from all
detectors)
• Each event allocated to a single processor, large farm of processors to handle rate
10
Summary of Introduction
• For many physics analyses, aim is to obtain as high statistics as possible for a given process– We cannot afford to handle or store all of the data a detector
can produce!• The Trigger
– selects the most interesting events from the myriad of events seen
• I.e. Obtain better use of limited output band-width• Throw away less interesting events• Keep all of the good events(or as many as possible)
– must get it right• any good events thrown away are lost for ever!
• High level Trigger allows:– More complex selection algorithms– Use of all detectors and full granularity full precision data
Case study of the ATLAS HLT system
Concentrate on issues relevant forATLAS (CMS very similar issues), but
try to address some more general points
12
Starting points for any HLT system
• physics programme for the experiment– what are you trying to measure
• accelerator parameters– what rates and structures
• detector and trigger performance– what data is available– what trigger resources do we have to use it
13
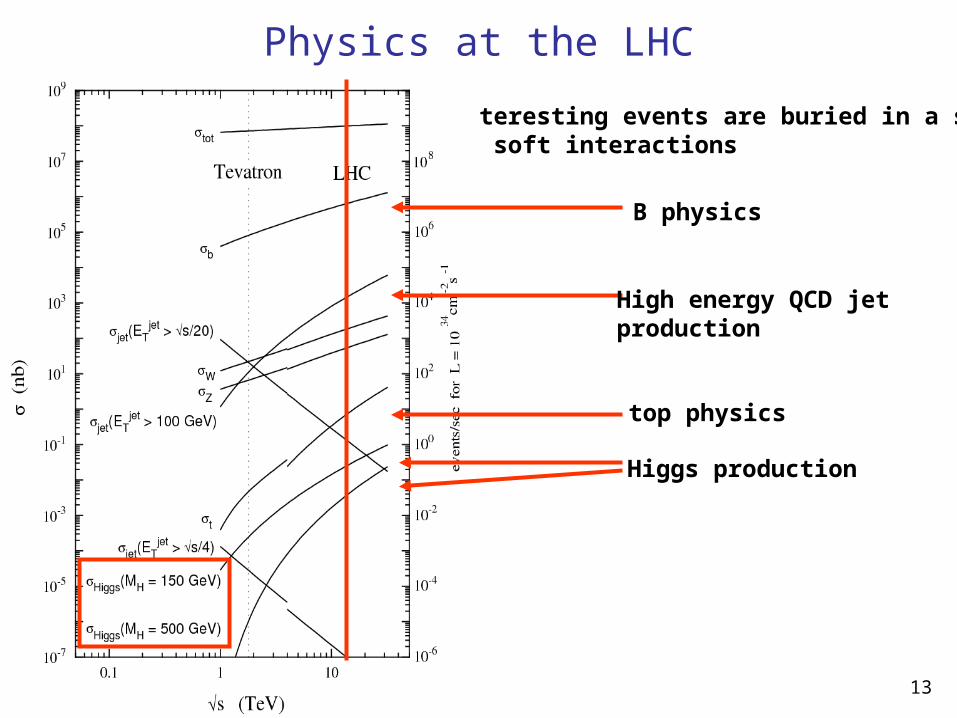
Interesting events are buried in a seaof soft interactions
Higgs production
High energy QCD jet production
Physics at the LHC
B physics
top physics
14
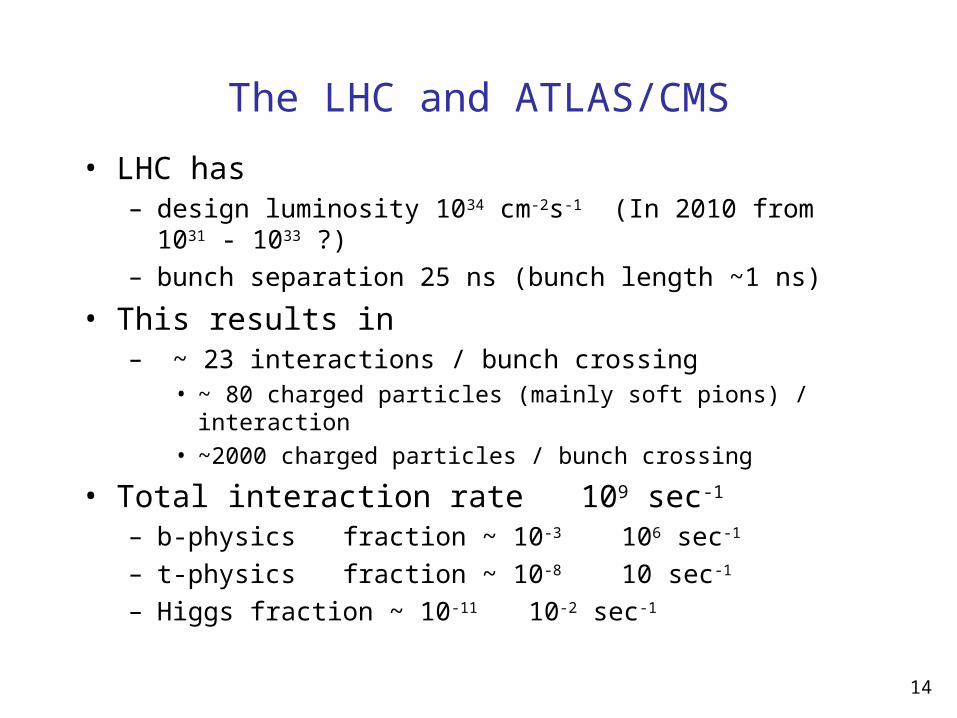
The LHC and ATLAS/CMS
• LHC has – design luminosity 1034 cm-2s-1 (In 2010 from 1031 - 1033 ?)– bunch separation 25 ns (bunch length ~1 ns)
• This results in– ~ 23 interactions / bunch crossing
• ~ 80 charged particles (mainly soft pions) / interaction
• ~2000 charged particles / bunch crossing
• Total interaction rate 109 sec-1
– b-physics fraction ~ 10-3 106 sec-1
– t-physics fraction ~ 10-8 10 sec-1
– Higgs fraction ~ 10-11 10-2 sec-1
15
Physics programme
• Higgs signal extraction important - but very difficult • There is lots of other interesting physics
– B physics and CP violation– quarks, gluons and QCD– top quarks– SUSY– ‘new’ physics
• Programme will evolve with: luminosity, HLT capacity and understanding of the detector– low luminosity (first ~2 years)
• high PT programme (Higgs etc.)• b-physics programme (CP measurements)
– high luminosity• high PT programme (Higgs etc.)• searches for new physics
16
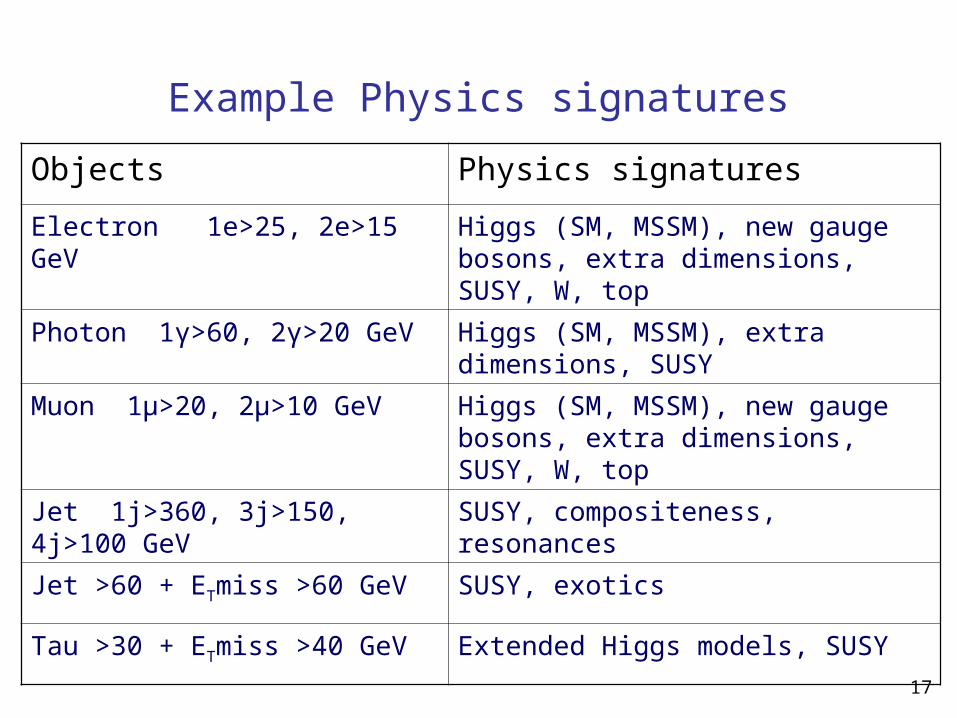
Trigger strategy at LHC
• To avoid being overwhelmed use signatures with small backgrounds– Leptons– High mass resonances– Heavy quarks
• The trigger selection looks for events with: – Isolated leptons and photons, -, central- and forward-jets – Events with high ET
– Events with missing ET
17
Objects Physics signaturesElectron 1e>25, 2e>15 GeV Higgs (SM, MSSM), new gauge
bosons, extra dimensions, SUSY, W, top
Photon 1γ>60, 2γ>20 GeV Higgs (SM, MSSM), extra dimensions, SUSY
Muon 1μ>20, 2μ>10 GeV Higgs (SM, MSSM), new gauge bosons, extra dimensions, SUSY, W, top
Jet 1j>360, 3j>150, 4j>100 GeV SUSY, compositeness, resonances
Jet >60 + ETmiss >60 GeV SUSY, exotics
Tau >30 + ETmiss >40 GeV Extended Higgs models, SUSY
Example Physics signatures
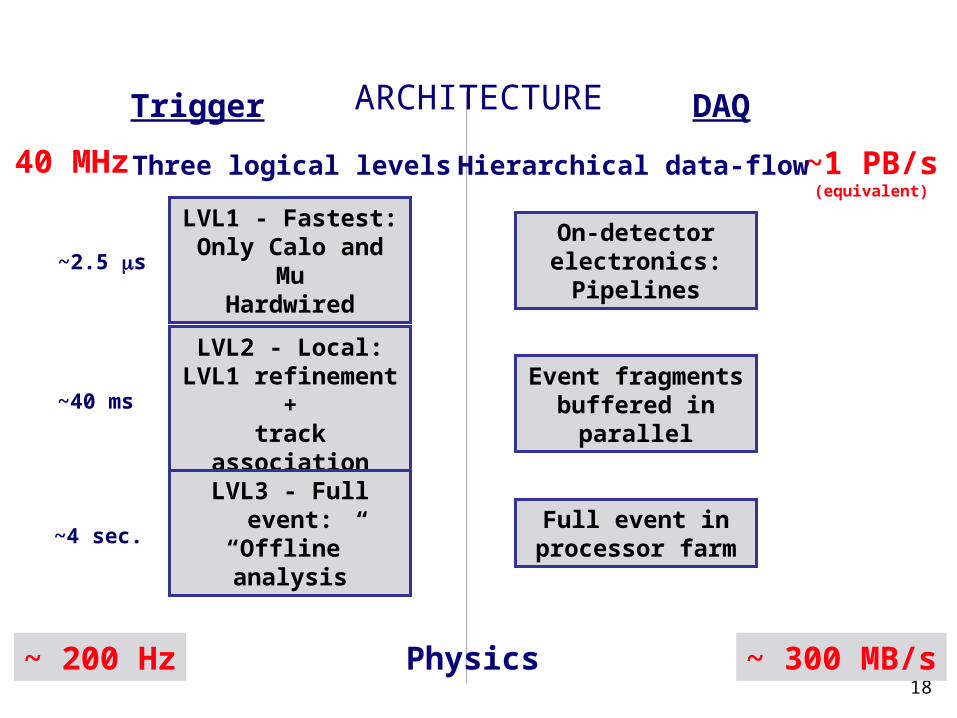
18
ARCHITECTURE
40 MHz
Trigger DAQ
~1 PB/s(equivalent)
~ 200 Hz ~ 300 MB/sPhysics
Three logical levels
LVL1 - Fastest:Only Calo and
MuHardwired
LVL2 - Local:LVL1
refinement +track
associationLVL3 - Full
event:“Offline” analysis
~2.5 s
~40 ms
~4 sec.
Hierarchical data-flow
On-detector electronics:
Pipelines
Event fragments buffered in
parallel
Full event in processor farm
19
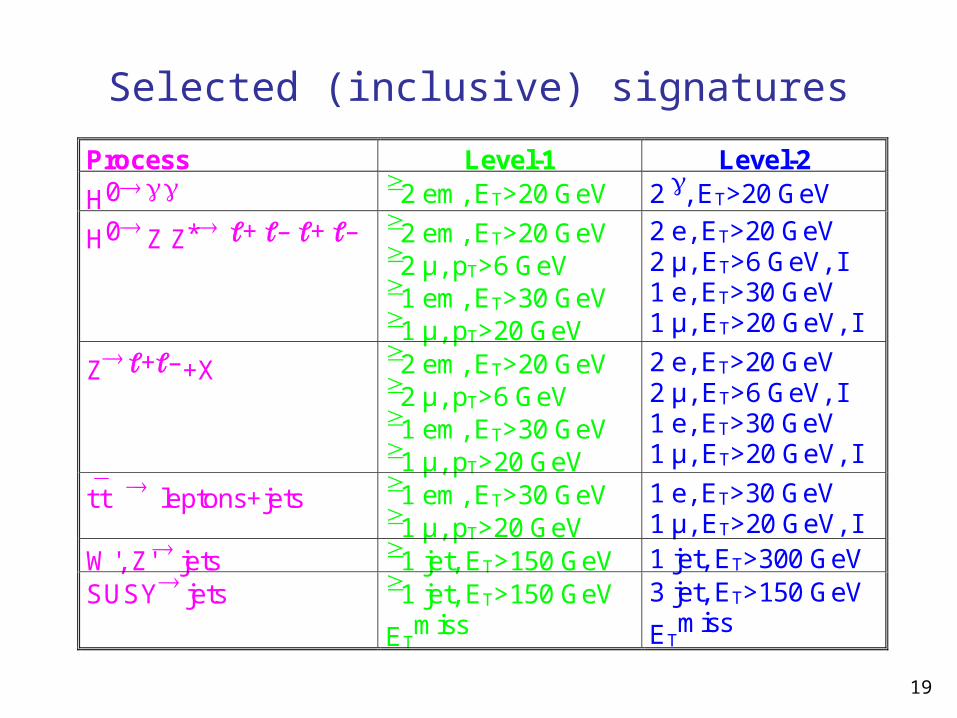
Selected (inclusive) signatures
Process Level-1 Level-2
H0 2 em, ET>20 GeV 2 , ET>20 GeV
H0 Z Z* + – + – 2 em, ET>20 GeV2 µ, pT>6 GeV1 em, ET>30 GeV1 µ, pT>20 GeV
2 e, ET>20 GeV2 µ, ET>6 GeV, I1 e, ET>30 GeV1 µ, ET>20 GeV, I
Z+–+X 2 em, ET>20 GeV2 µ, pT>6 GeV1 em, ET>30 GeV1 µ, pT>20 GeV
2 e, ET>20 GeV2 µ, ET>6 GeV, I1 e, ET>30 GeV1 µ, ET>20 GeV, I
t t leptons+jets 1 em, ET>30 GeV1 µ, pT>20 GeV
1 e, ET>30 GeV1 µ, ET>20 GeV, I
W', Z' jets 1 jet, ET>150 GeV 1 jet, ET>300 GeVSUSY jets 1 jet, ET>150 GeV
ETmiss
3 jet, ET>150 GeV
ETmiss
20
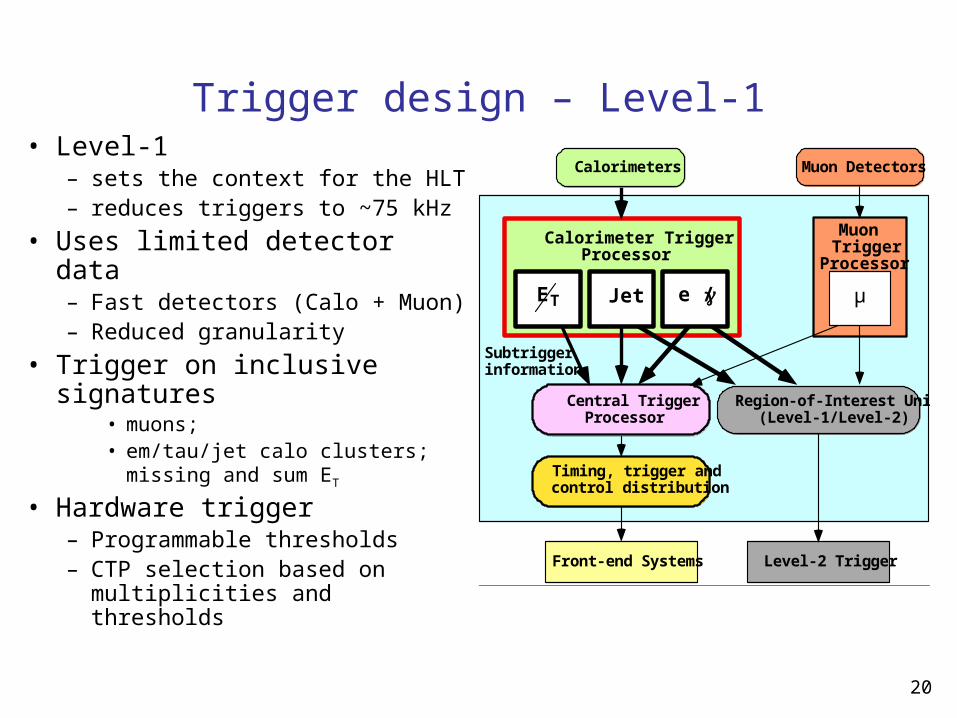
Central TriggerProcessor
Region-of-Interest Unit(Level-1/Level-2)
Level-2 TriggerFront-end Systems
Calorimeter TriggerProcessor
MuonTrigger
Processor
µ
Subtriggerinformation
Timing, trigger andcontrol distribution
JetET e /
Calorimeters Muon Detectors
Trigger design – Level-1• Level-1
– sets the context for the HLT– reduces triggers to ~75 kHz
• Uses limited detector data– Fast detectors (Calo + Muon)– Reduced granularity
• Trigger on inclusive signatures
• muons; • em/tau/jet calo clusters;
missing and sum ET
• Hardware trigger– Programmable thresholds– CTP selection based on
multiplicities and thresholds
21
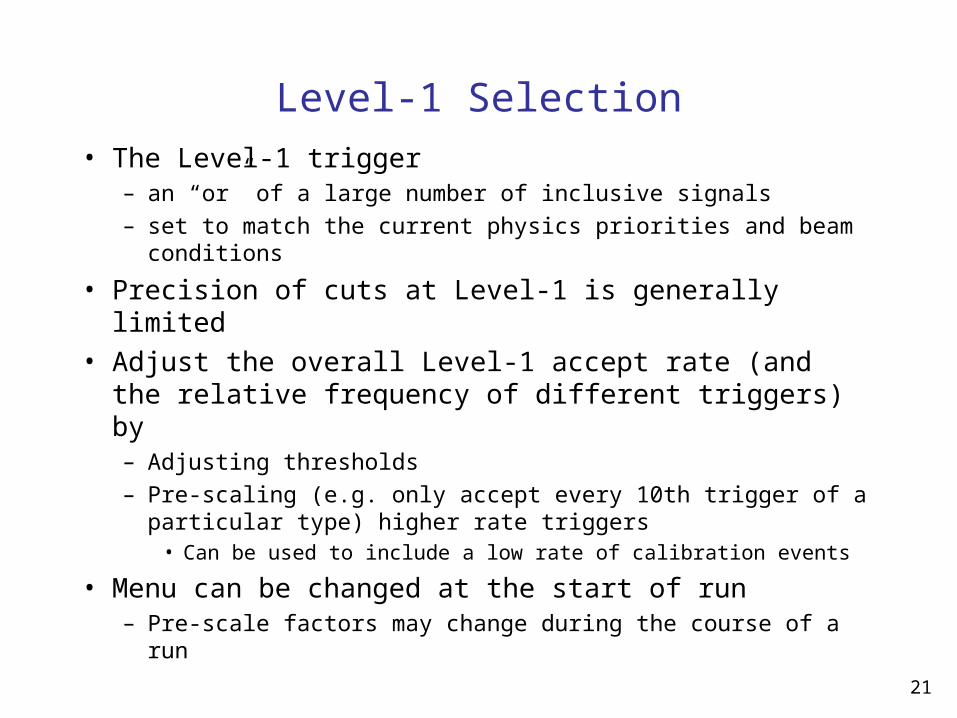
Level-1 Selection
• The Level-1 trigger– an “or” of a large number of inclusive signals – set to match the current physics priorities and beam
conditions
• Precision of cuts at Level-1 is generally limited• Adjust the overall Level-1 accept rate (and the
relative frequency of different triggers) by– Adjusting thresholds – Pre-scaling (e.g. only accept every 10th trigger of a
particular type) higher rate triggers• Can be used to include a low rate of calibration events
• Menu can be changed at the start of run – Pre-scale factors may change during the course of a run
22
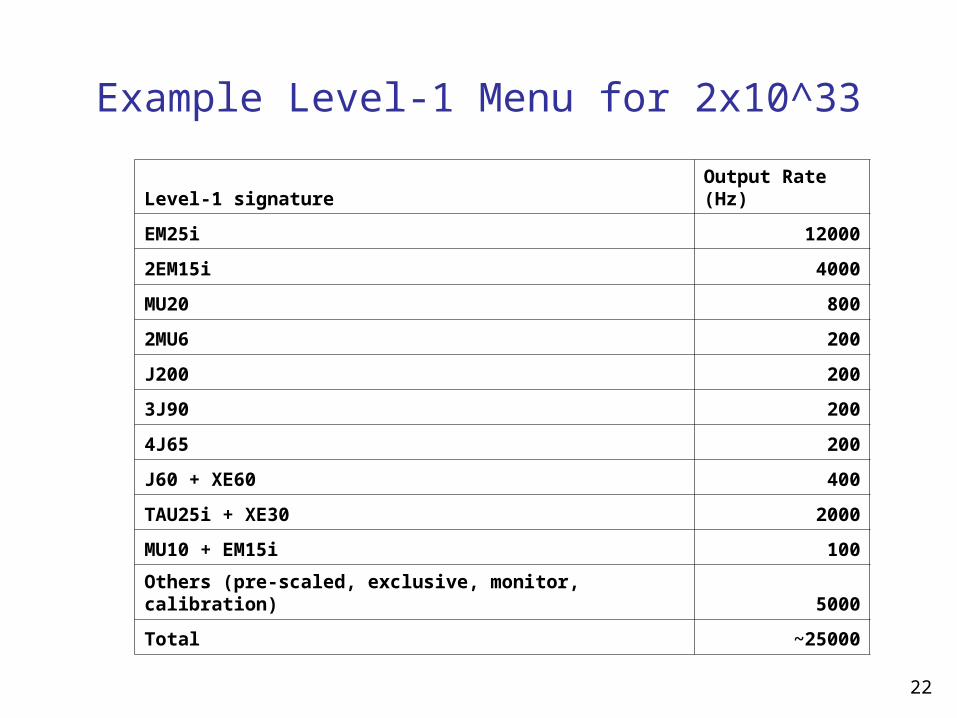
Example Level-1 Menu for 2x10^33
Level-1 signature Output Rate (Hz)
EM25i 12000
2EM15i 4000
MU20 800
2MU6 200
J200 200
3J90 200
4J65 200
J60 + XE60 400
TAU25i + XE30 2000
MU10 + EM15i 100
Others (pre-scaled, exclusive, monitor, calibration) 5000
Total ~25000
23
Trigger design - Level-2
• Level-2 reduce triggers to ~2 kHz– Note CMS does not have a physically separate Level-2 trigger, but
the HLT processors include a first stage of Level-2 algorithms
• Level-2 trigger has a short time budget – ATLAS ~40 milli-sec average
• Note for Level-1 the time budget is a hard limit for every event, for the High Level Trigger it is the average that matters, so OK for a small fraction of events to take times much longer than this average
• Full detector data available, but to minimise resources needed:– Limit the data accessed– Only unpack detector data when it is needed– Use information from Level-1 to guide the process– Analysis in steps with possibility to reject event after each step– Use custom algorithms
24
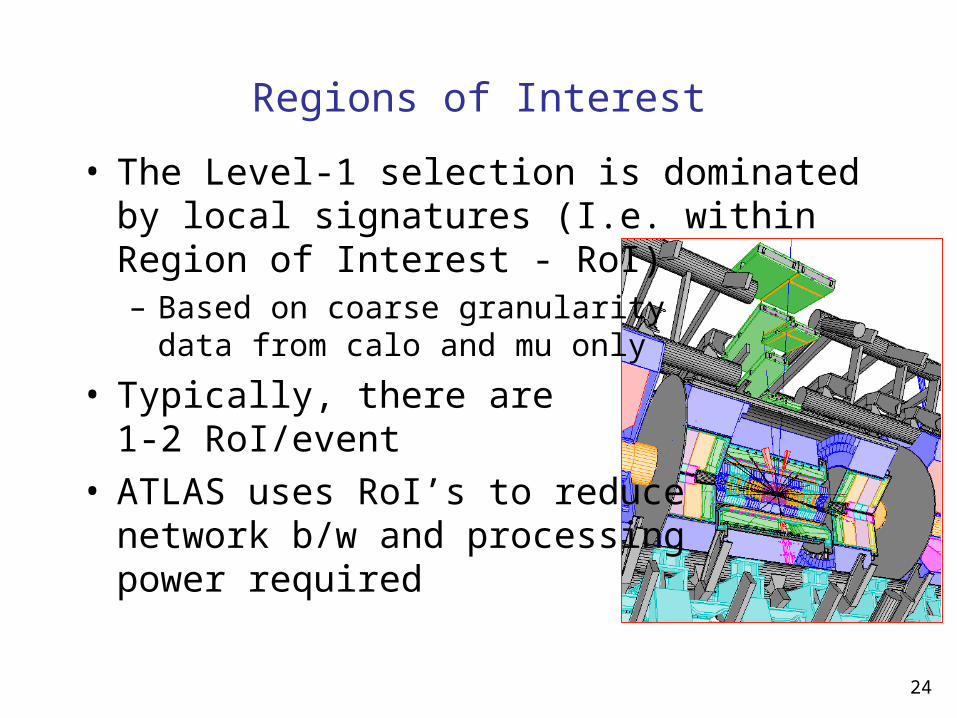
Regions of Interest
• The Level-1 selection is dominated by local signatures (I.e. within Region of Interest - RoI)– Based on coarse granularity
data from calo and mu only
• Typically, there are 1-2 RoI/event
• ATLAS uses RoI’s to reduce network b/w and processing power required
25
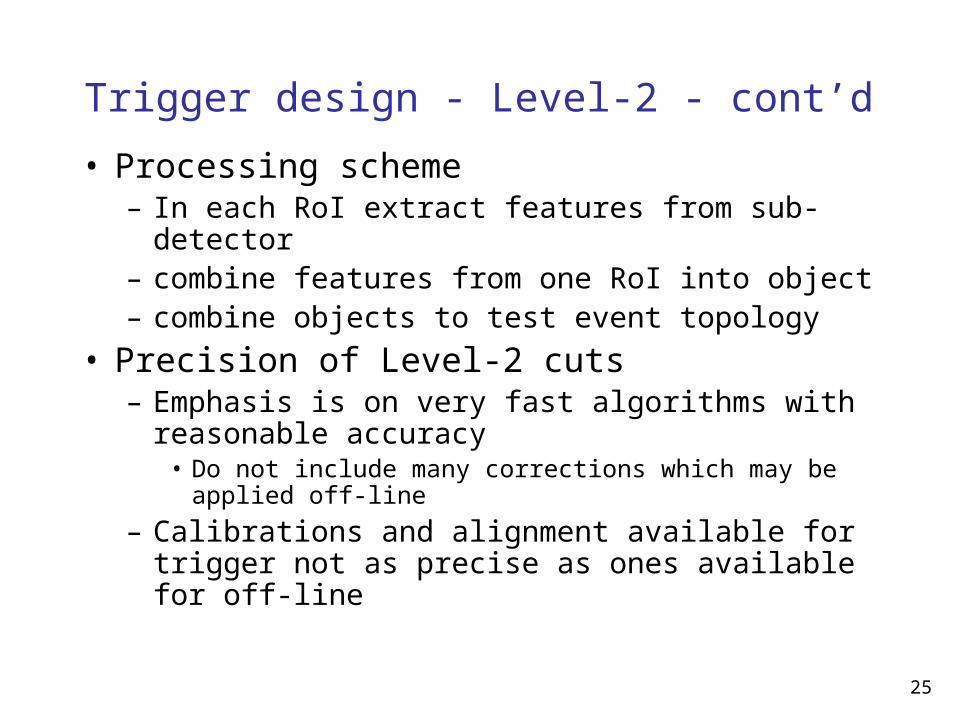
Trigger design - Level-2 - cont’d
• Processing scheme– In each RoI extract features from sub-detector – combine features from one RoI into object – combine objects to test event topology
• Precision of Level-2 cuts– Emphasis is on very fast algorithms with
reasonable accuracy• Do not include many corrections which may be applied
off-line
– Calibrations and alignment available for trigger not as precise as ones available for off-line
26
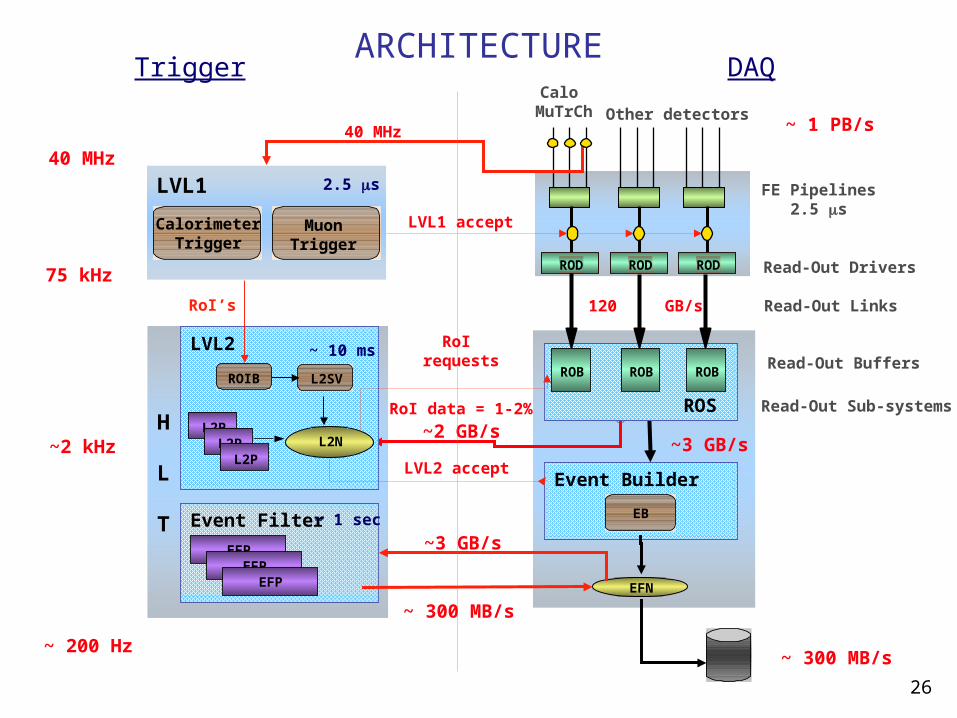
ARCHITECTURE
H
L
T
40 MHz
75 kHz
~2 kHz
~ 200 Hz
40 MHz
RoI data = 1-2%
~2 GB/s
FE Pipelines2.5 s
LVL1 accept
Read-Out DriversROD ROD ROD
LVL1 2.5 s
CalorimeterTrigger
MuonTrigger
Event Builder
EB
~3 GB/s
ROS Read-Out Sub-systems
Read-Out BuffersROB ROB ROB
120 GB/s Read-Out Links
Calo MuTrCh Other detectors
~ 1 PB/s
Event Filter
EFPEFP
EFP
~ 1 sec
EFN
~3 GB/s
~ 300 MB/s
~ 300 MB/s
Trigger DAQ
LVL2 ~ 10 ms
L2P
L2SV
L2NL2PL2P
ROIB
LVL2 accept
RoI requests
RoI’s
27
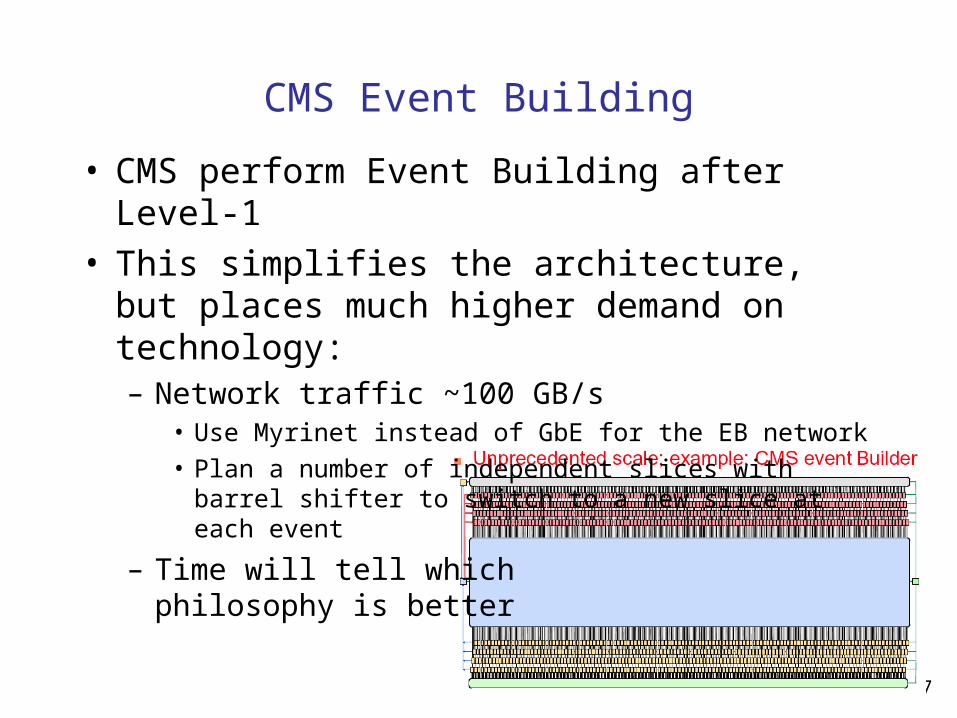
CMS Event Building
• CMS perform Event Building after Level-1• This simplifies the architecture, but places
much higher demand on technology:– Network traffic ~100 GB/s
• Use Myrinet instead of GbE for the EB network• Plan a number of independent slices with barrel shifter to
switch to a new slice at each event
– Time will tell whichphilosophy is better
28
t i m
e
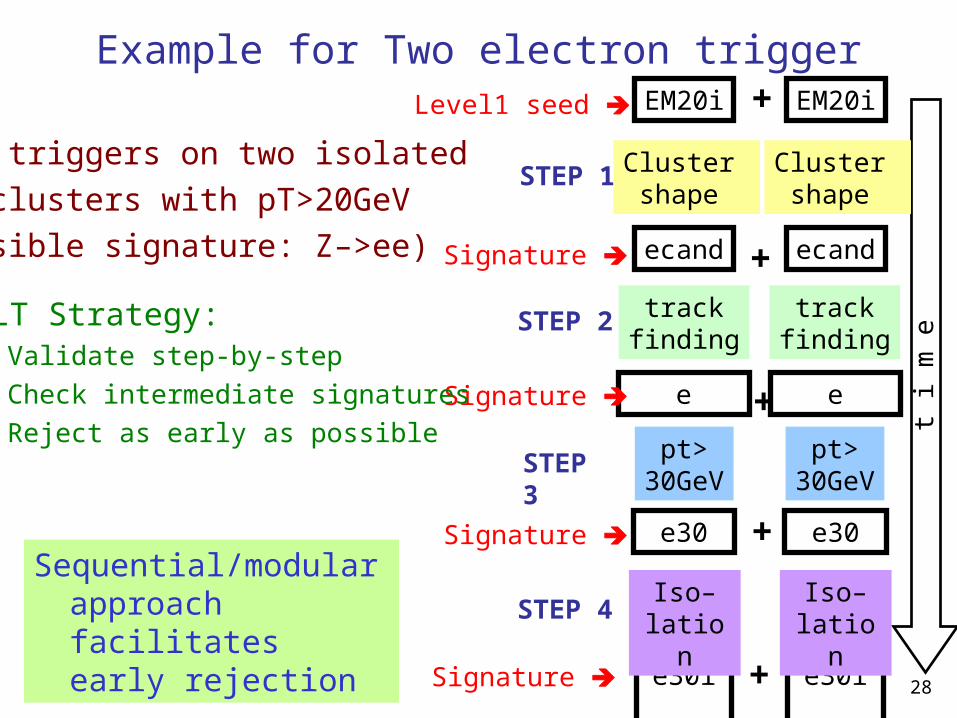
e30i e30i +Signature
ecand ecand+Signature
e e +Signature
e30 e30+Signature
EM20i EM20i+Level1 seed
Cluster shape
Cluster shape
STEP 1
Iso–lation
Iso–lationSTEP 4
pt>30GeV
pt>30GeV
STEP 3
trackfinding
trackfinding
STEP 2HLT Strategy: Validate step-by-step Check intermediate signatures Reject as early as possible
Sequential/modular approach facilitates early rejection
LVL1 triggers on two isolated e/m clusters with pT>20GeV(possible signature: Z–>ee)
Example for Two electron trigger
29
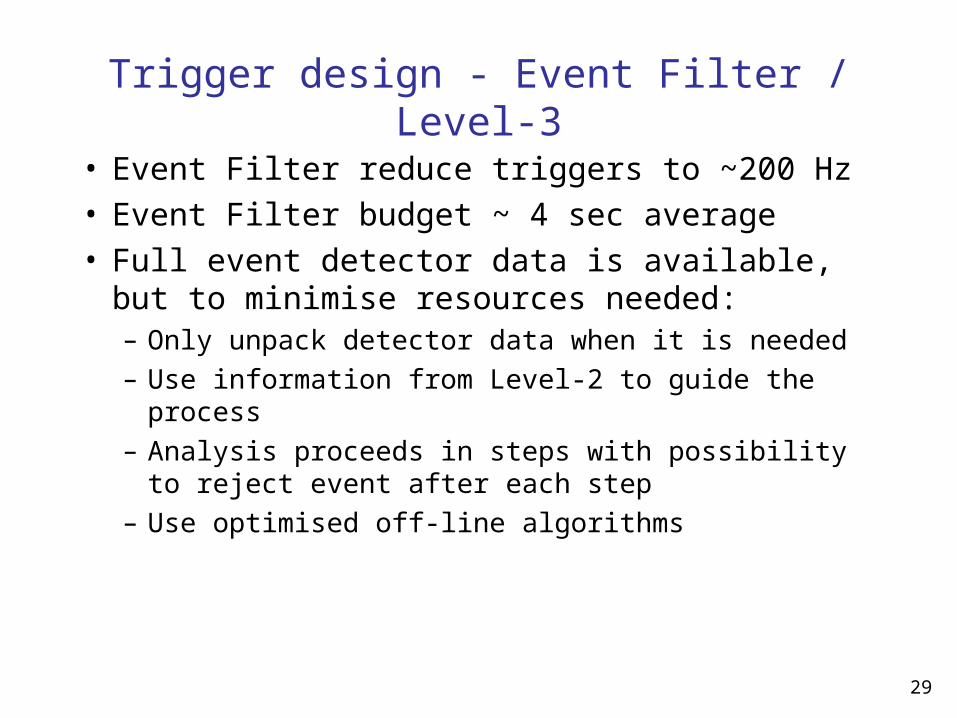
Trigger design - Event Filter / Level-3
• Event Filter reduce triggers to ~200 Hz• Event Filter budget ~ 4 sec average• Full event detector data is available, but to
minimise resources needed:– Only unpack detector data when it is needed– Use information from Level-2 to guide the process– Analysis proceeds in steps with possibility to reject
event after each step– Use optimised off-line algorithms
30
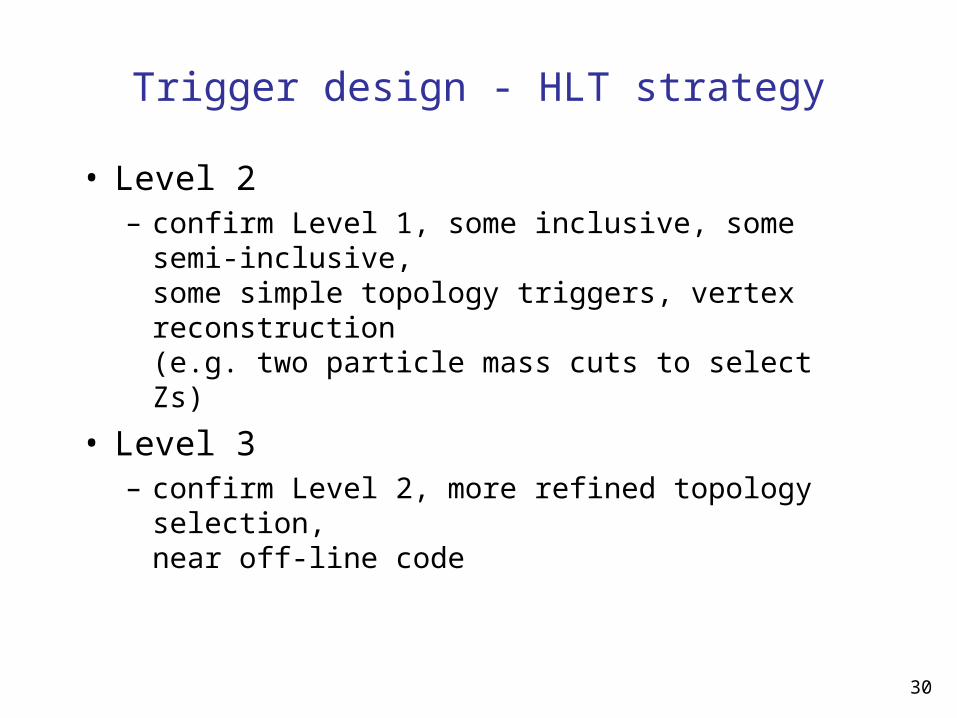
Trigger design - HLT strategy
• Level 2– confirm Level 1, some inclusive, some semi-
inclusive,some simple topology triggers, vertex reconstruction(e.g. two particle mass cuts to select Zs)
• Level 3– confirm Level 2, more refined topology selection,
near off-line code
31
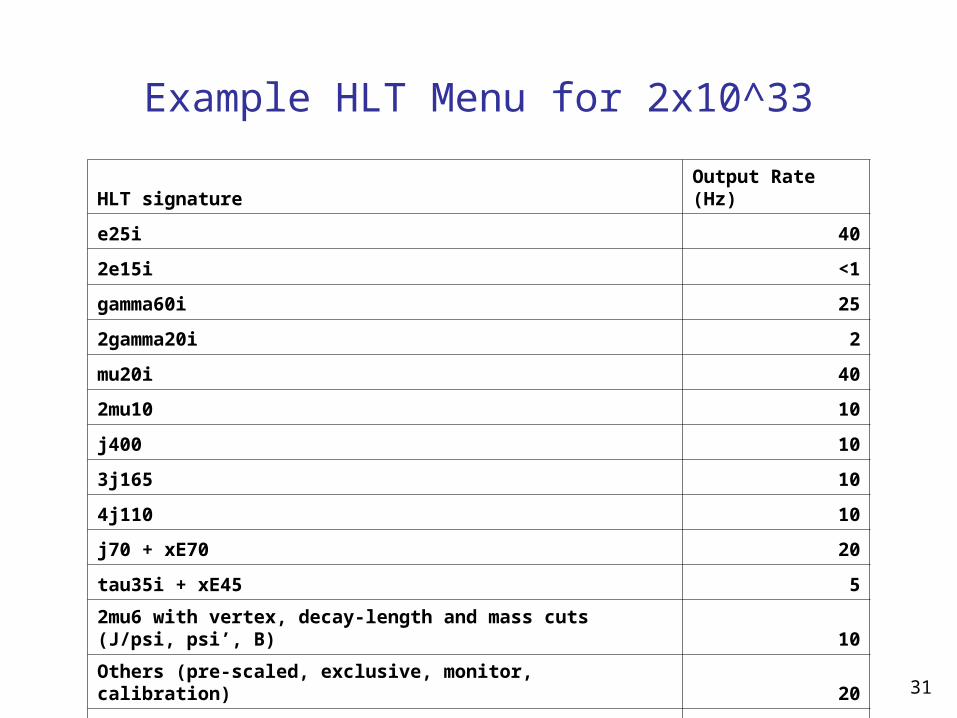
Example HLT Menu for 2x10^33
HLT signature Output Rate (Hz)
e25i 40
2e15i <1
gamma60i 25
2gamma20i 2
mu20i 40
2mu10 10
j400 10
3j165 10
4j110 10
j70 + xE70 20
tau35i + xE45 5
2mu6 with vertex, decay-length and mass cuts (J/psi, psi’, B) 10
Others (pre-scaled, exclusive, monitor, calibration) 20
Total ~200
32
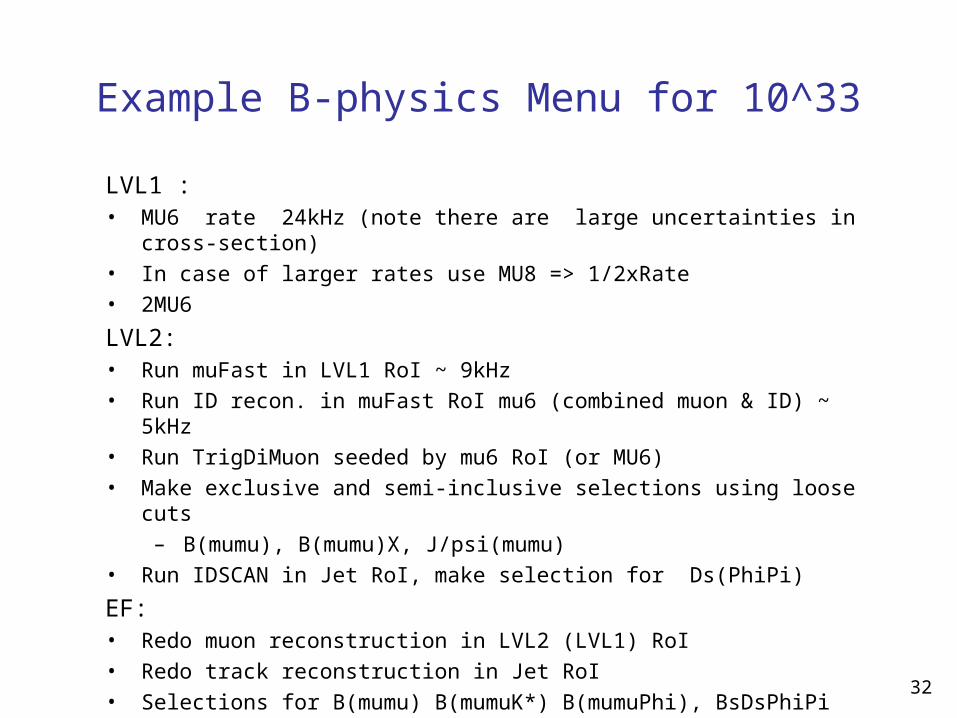
Example B-physics Menu for 10^33
LVL1 : • MU6 rate 24kHz (note there are large uncertainties in cross-section)• In case of larger rates use MU8 => 1/2xRate• 2MU6
LVL2: • Run muFast in LVL1 RoI ~ 9kHz• Run ID recon. in muFast RoI mu6 (combined muon & ID) ~ 5kHz • Run TrigDiMuon seeded by mu6 RoI (or MU6)• Make exclusive and semi-inclusive selections using loose cuts
– B(mumu), B(mumu)X, J/psi(mumu) • Run IDSCAN in Jet RoI, make selection for Ds(PhiPi)
EF:• Redo muon reconstruction in LVL2 (LVL1) RoI• Redo track reconstruction in Jet RoI• Selections for B(mumu) B(mumuK*) B(mumuPhi), BsDsPhiPi etc.
33
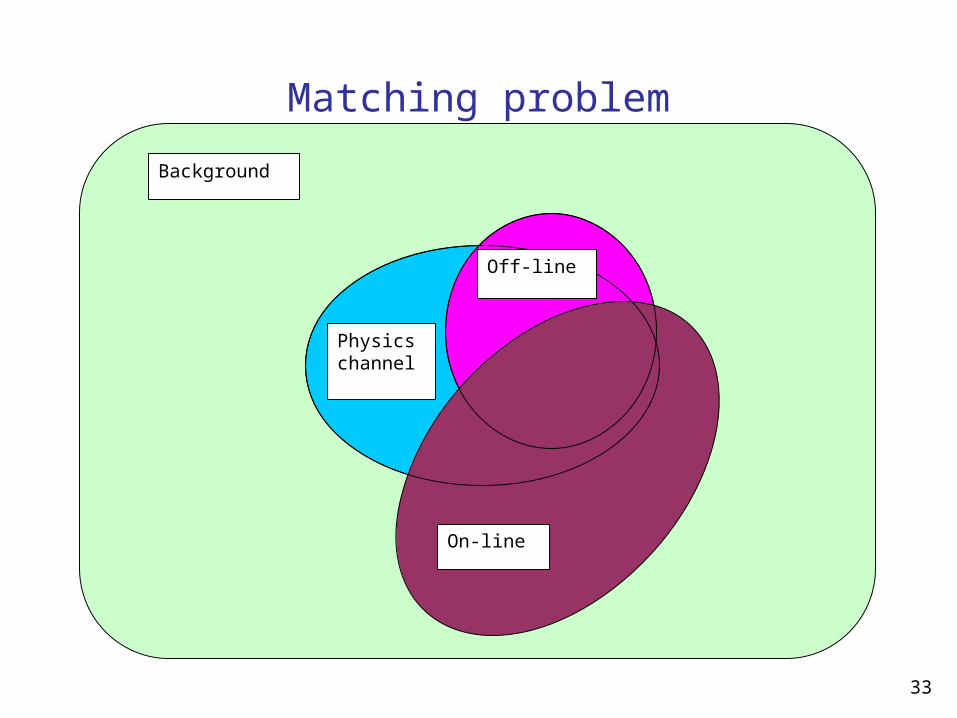
Matching problem
Background
Physics channel
Off-line
On-line
34
Matching problem (cont.)• ideally
– off-line algorithms select phase space which shrink-wraps the physics channel
– trigger algorithms shrink-wrap the off-line selection
• in practice, this doesn’t happen– need to match the off-line algorithm selection
• For this reason many trigger studies quote trigger efficiency wrt events which pass off-line selection
– BUT off-line can change algorithm, re-process and recalibrate at a later stage
• So, make sure on-line algorithm selection is well known, controlled and monitored
35
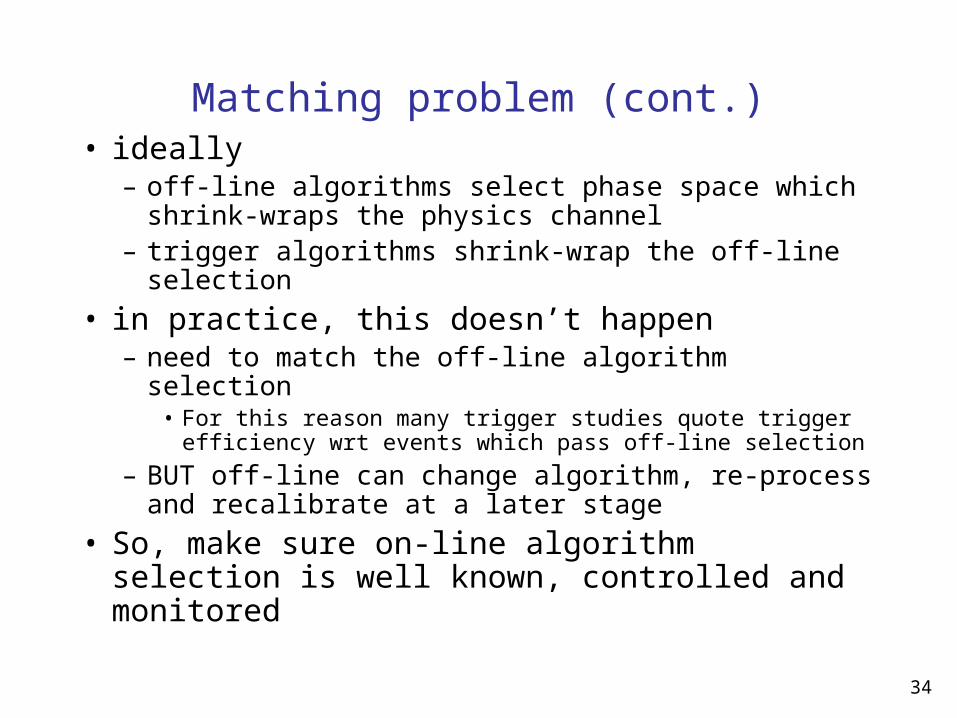
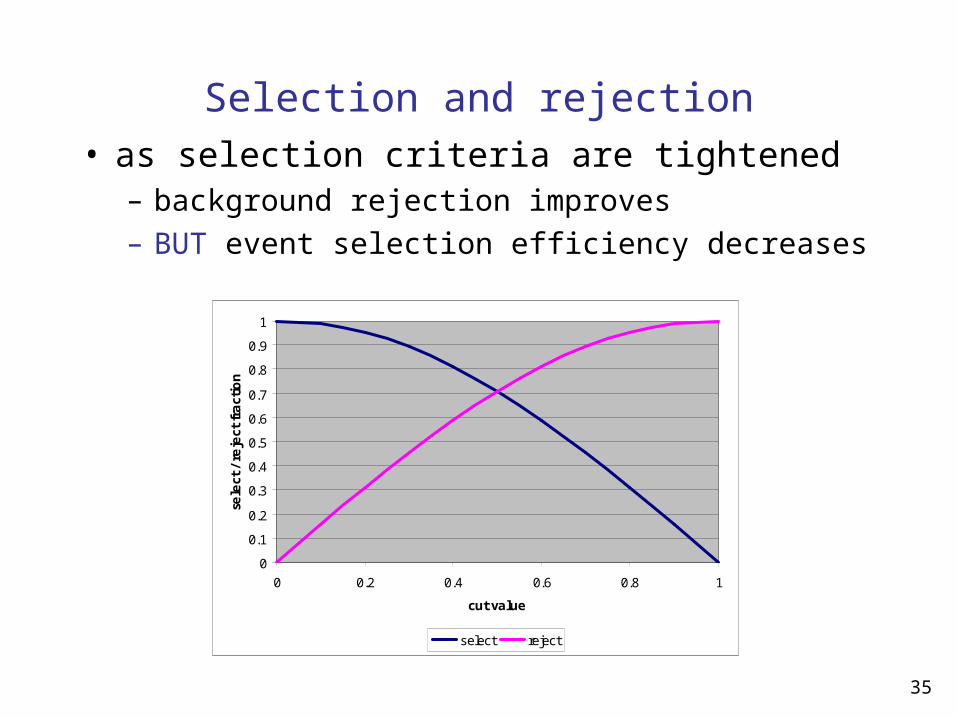
Selection and rejection
• as selection criteria are tightened– background rejection improves– BUT event selection efficiency decreases
0
0.1
0.2
0.3
0.4
0.5
0.6
0.7
0.8
0.9
1
0 0.2 0.4 0.6 0.8 1
cut value
sele
ct /
re
ject
fra
ctio
n
select reject
36
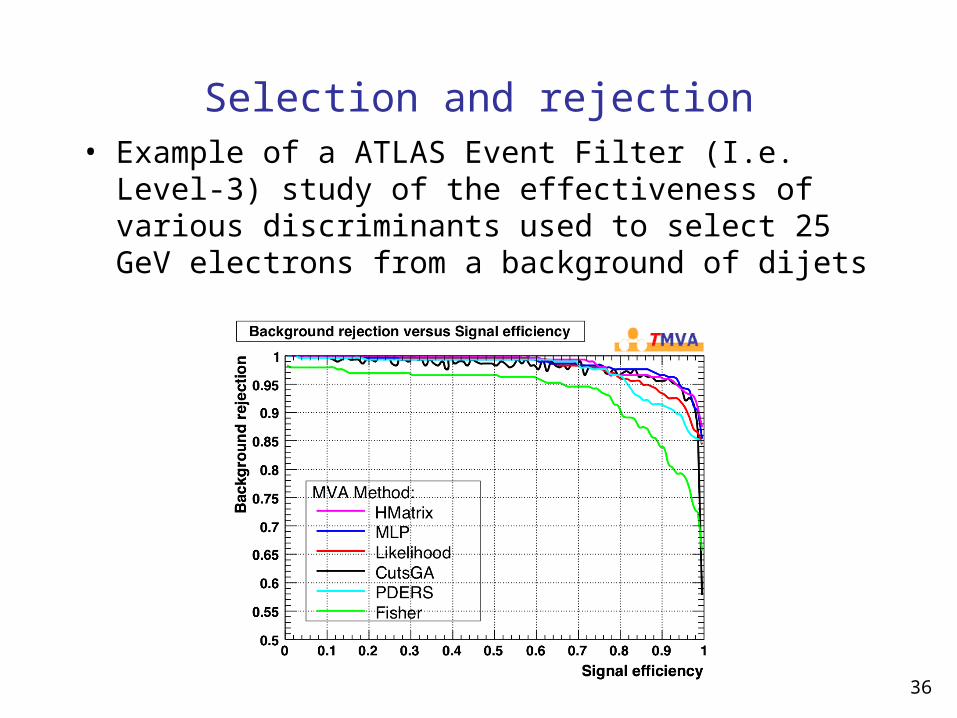
Selection and rejection• Example of a ATLAS Event Filter (I.e. Level-3) study
of the effectiveness of various discriminants used to select 25 GeV electrons from a background of dijets
37
Other issues for the Trigger
• Efficiency and Monitoring– In general need high trigger efficiency– For many analyses need a well known efficiency
• Monitor efficiency by various means– Overlapping triggers– Pre-scaled samples of triggers in tagging mode (pass-through)
– To assist with overall normalisation ATLAS divides each run into periods of a few minutes called a luminosity block.
• During each block the beam luminosity should be constant• Can also exclude any blocks where there is a known problem
• Final detector calibration and alignment constants not available immediately - keep as up-to-date as possible and allow for the lower precision in the trigger cuts when defining trigger menus and in subsequent analyses
• Code used in trigger needs to be very robust - low memory leaks, low crash rate, fast
38
Other issues for the Trigger – cont’d
• Beam conditions and HLT resources will evolve over several years (for both ATLAS and CMS)– In 2010 luminosity low, but also HLT capacity will be < 50% of full
system
• For details of the current ideas on ATLAS Menu evolution see– https://twiki.cern.ch/twiki/bin/view/Atlas/TriggerPhysicsMenu
• Gives details of menu for Startup (including single beam running), 10^31, 10^32, 10^33
• Description of current menu is very long !!
• Corresponding information for CMS is at– https://twiki.cern.ch/twiki/bin/view/CMS/TriggerMenuDevelopment
• The expected performance of ATLAS for different physics channels (including the effects of the trigger) is documented in http://arxiv.org/abs/0901.0512 (beware ~2000 pages)
39
Summary
• High-level triggers allow complex selection procedures to be applied as the data is taken– Thus allow large samples of rare events to be recorded
• The trigger stages - in the ATLAS example– Level 1 uses inclusive signatures
• muons; em/tau/jet; missing and sum ET
– Level 2 refines Level 1 selection, adds simple topology triggers, vertex reconstruction, etc
– Level 3 refines Level 2 adds more refined topology selection• Trigger menus need to be defined, taking into account:
– Physics priorities, beam conditions, HLT resources• Include items for monitoring trigger efficiency and calibration
• Try to match trigger cuts to off-line selection• Trigger efficiency should be as high as possible and well
monitored • Must get it right - events thrown away are lost for ever!• Triggering closely linked to physics analyses – so enjoy!
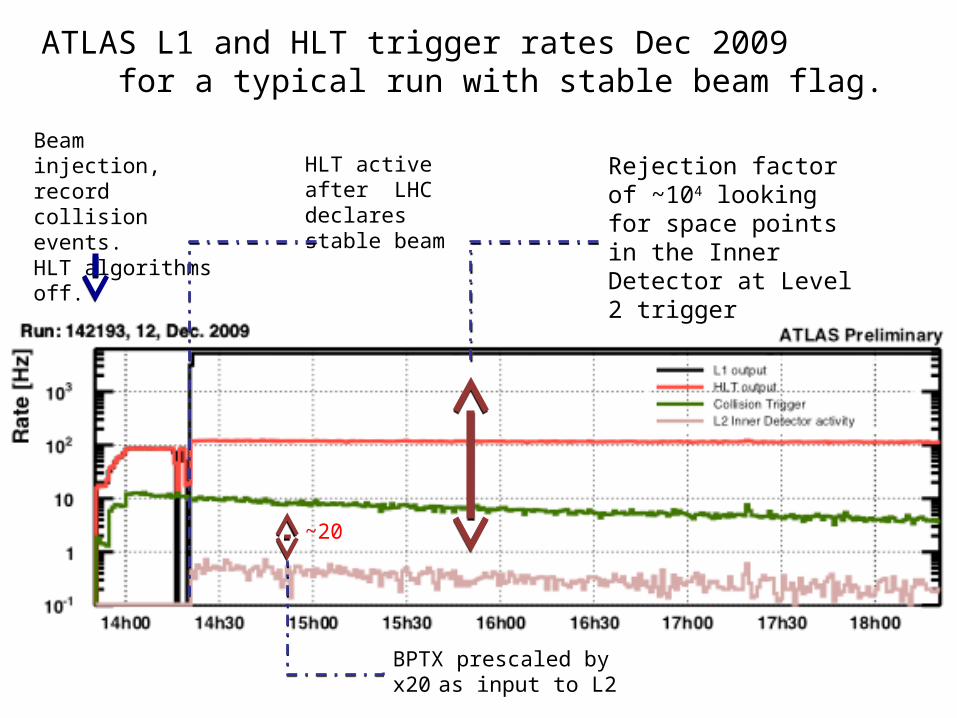
Rejection factor of ~104 looking for space points in the Inner Detector at Level 2 trigger
Beam injection, record collision events.HLT algorithms off.
HLT active after LHC declares stable beam
BPTX prescaled by x20
as input to L2
~20
ATLAS L1 and HLT trigger rates Dec 2009 for a typical run with stable beam flag.
Description of ATLAS L1 + HLT rate plot• L1 and HLT trigger rates for a typical run with stable beam flag.
– Also shown are a collision trigger at L1, requiring hits on both the A and the C side of the minimum bias scintillator counters and filled bunches for both beams.
• The line labled L2 Inner Detector activity represents a filtering algorithm at the L2 trigger, which accepts events based on space point counts in the Inner Detector. – This L2 algorithm receives 5% of all filled bunches as input from L1.
Assuming both the L1 collision trigger and the space point counting are highly efficient for collision events, the difference in the two lines should reflect this fraction, even though the acceptance of both triggers is different.
– The moment the L2 algorithm is enabled is clearly visible as the jump of output L1 rate, and the start of event rate on the L2 line.
– The dips in HLT and L1 output rates just before this moment are due to the short pause needed to change trigger setup.
– The HLT output rate (which represents the rate of events recorded to disk) does not visibly change, as it is dominated by a constant rate of monitor triggers.
42
Additional Foils
43
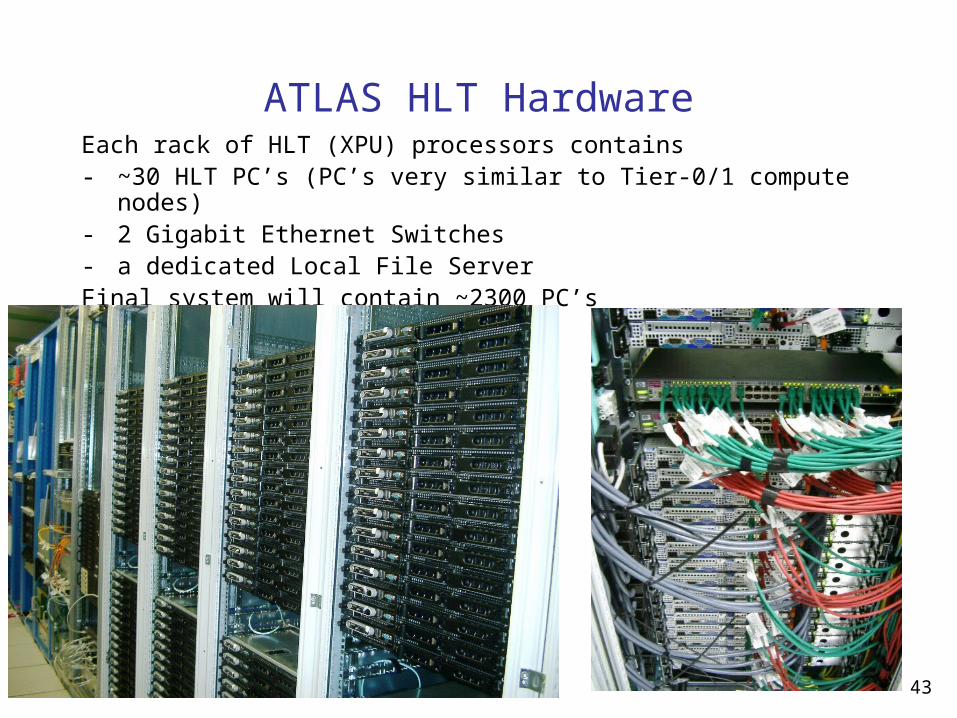
ATLAS HLT HardwareEach rack of HLT (XPU) processors contains- ~30 HLT PC’s (PC’s very similar to Tier-0/1 compute nodes)- 2 Gigabit Ethernet Switches- a dedicated Local File ServerFinal system will contain ~2300 PC’s
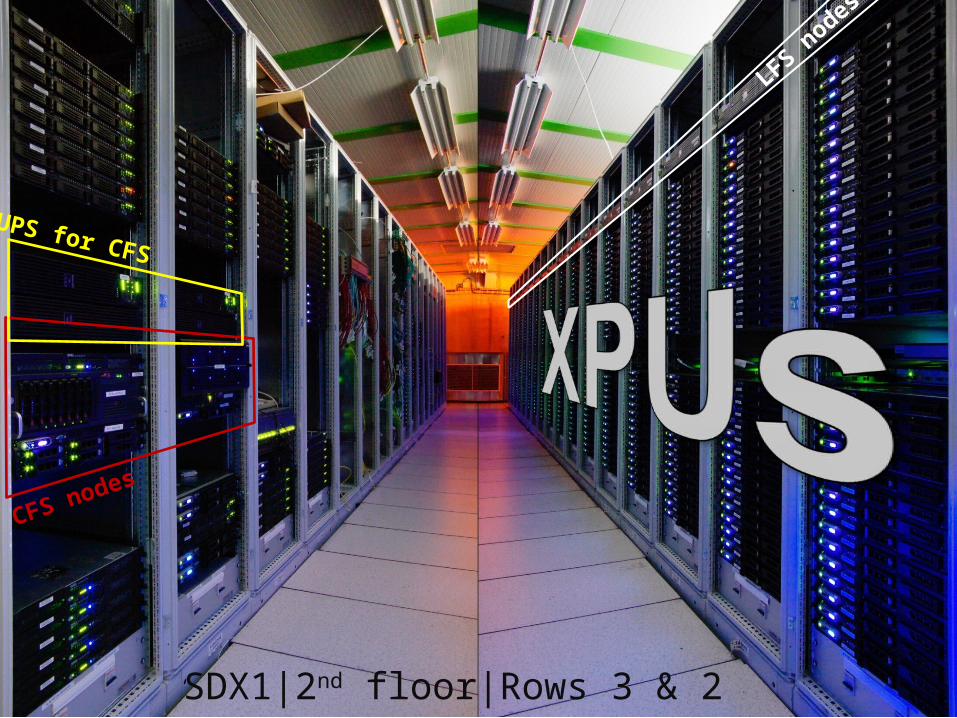
44SDX1|2nd floor|Rows 3 & 2
CFS nodes
UPS for CFS
LFS nodes
45
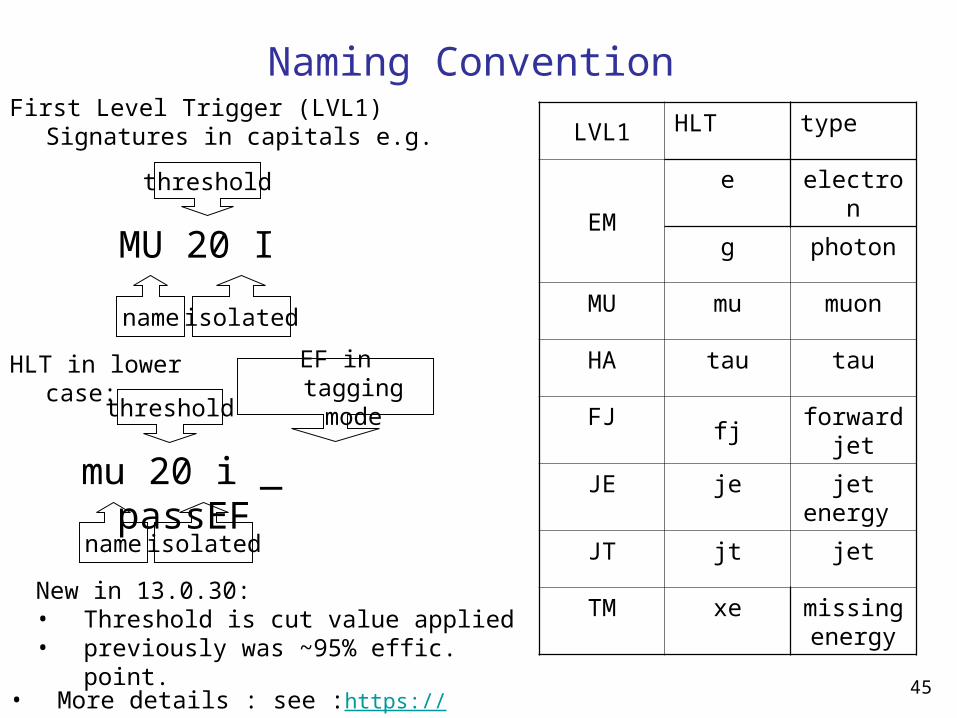
Naming ConventionFirst Level Trigger (LVL1) Signatures in
capitals e.g. LVL1 HLT type
EM
e electron
g photon
MU mu muon
HA tau tau
FJfj
forward jet
JE je jet energy
JT jt jet
TM xe missing energy
HLT in lower case:
name
threshold
isolated
mu 20 i _ passEF
EF in tagging mode
name
threshold
isolated
MU 20 I
New in 13.0.30: • Threshold is cut value applied• previously was ~95% effic. point.
• More details : see :https://twiki.cern.ch/twiki/bin/view/Atlas/TriggerPhysicsMenu
ATLAS Beam Pick-up detectors
-The ATLAS BPTX detectors are simple electrostatic beam pick-up detectors 175 m on either side of ATLAS. -The BPTX signals are fed into a discriminator and input into the CTP to provide “filled bunch triggers” (one CTP input per beam).-These “filled bunch trigger” can be used to indicate when there are particle bunches in the interaction region from each beam. -By requiring a coincidence between the filled bunch triggers from both beams, a filled bunch crossing trigger signal can be formed.-Optionally, these trigger signals can be used in combination with other triggers (e.g. the minimum bias trigger scintillators).
47
What is a minimum bias event ?
- event accepted with the only requirement being activity in the detector with minimal pT threshold [100 MeV] (zero bias events have no requirements) - e.g. Scintillators at L1 + (> 40 SCT S.P. or > 900 Pixel clusters) at L2
- a miminum bias event is most likely to be either: - a low pT (soft) non-diffractive event - a soft single-diffractive event - a soft double diffractive event(some people do not include the diffractive events in the definition !)
- it is characterised by: - having no high pT objects : jets; leptons; photons - being isotropic - see low pT tracks at all phi in a tracking detector - see uniform energy deposits in calorimeter as function of rapidity - these events occur in 99.999% of collisions. So if any given crossing has two interactions and one of them has been triggered due to a high pT component then the likelihood is that the accompanying event will be a dull minimum bias event.
ATLAS Mininum Bias Trigger Scintillators ?
-The Minimum Bias Trigger Scintillators (MBTS) were designed to function only during initial data-taking at low luminosities.
- After 3-4 months of higher luminosity operation the scintillators will yellow due to radiation damage.
-Sixteen scintillator counters are installed on the inner face of the end-cap calorimeter cryostats on each side of ATLAS-Each set of counters is segmented in phi (x8) and eta (x2). -They are located at |z| = 3560 mm
-the innermost set covers the region 2.82 < |eta| < 3.84 -the outermost set covers the region 2.09 < |eta| < 2.82.
-Signals from each scintillator are fed to NIM discriminators, the output of which goes into the CTP, which calculates a multiplicity for each side of ATLAS
-In the longer term other detectors will be used for MinBias trigger: Beam Condition Monitor (BCM), LUCID, ZDC
49
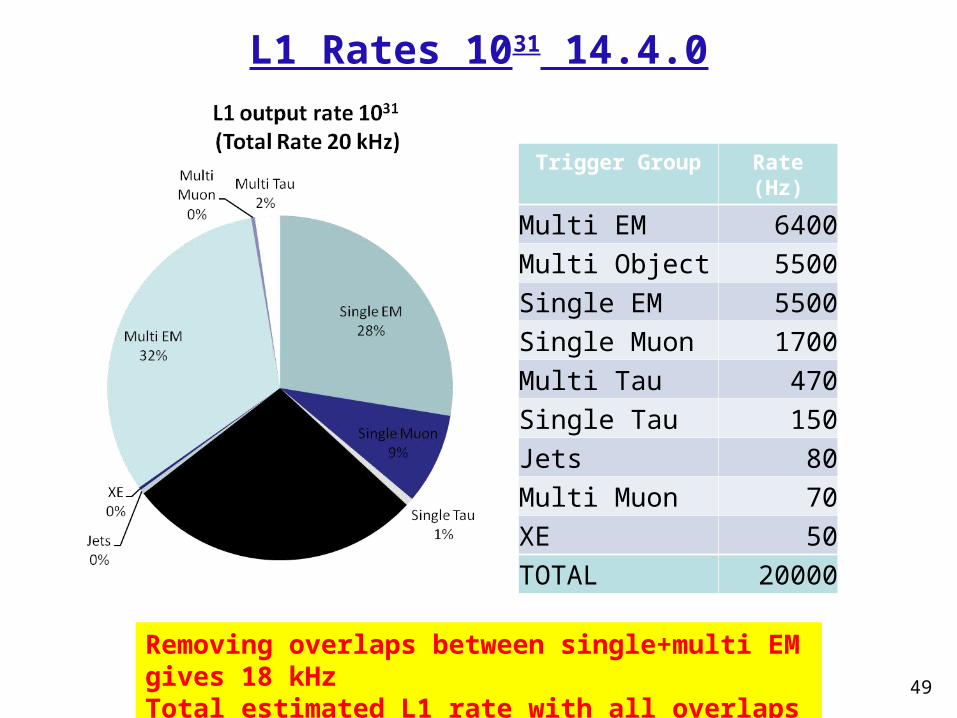
L1 Rates 1031 14.4.0
Removing overlaps between single+multi EM gives 18 kHzTotal estimated L1 rate with all overlaps removed is ~ 12 kHz
Trigger Group Rate (Hz)
Multi EM 6400
Multi Object 5500
Single EM 5500
Single Muon 1700
Multi Tau 470
Single Tau 150
Jets 80
Multi Muon 70
XE 50
TOTAL 20000
50
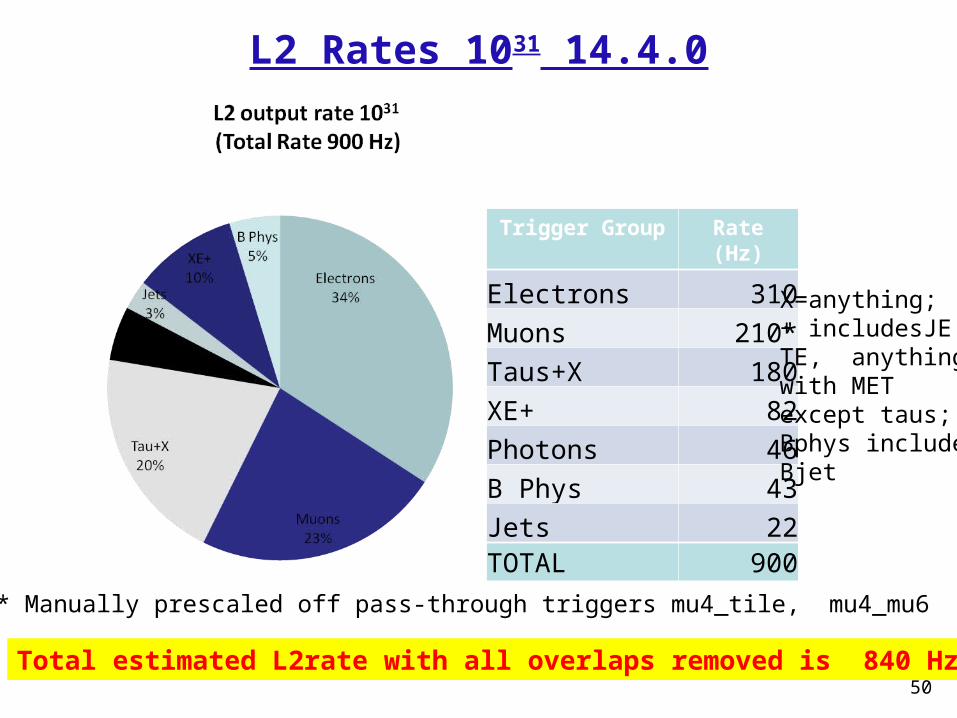
L2 Rates 1031 14.4.0
Total estimated L2rate with all overlaps removed is 840 Hz
Trigger Group Rate (Hz)
Electrons 310
Muons 210*
Taus+X 180
XE+ 82
Photons 46
B Phys 43
Jets 22TOTAL 900
* Manually prescaled off pass-through triggers mu4_tile, mu4_mu6
X=anything;+ includesJE,TE, anythingwith METexcept taus;Bphys includesBjet
51
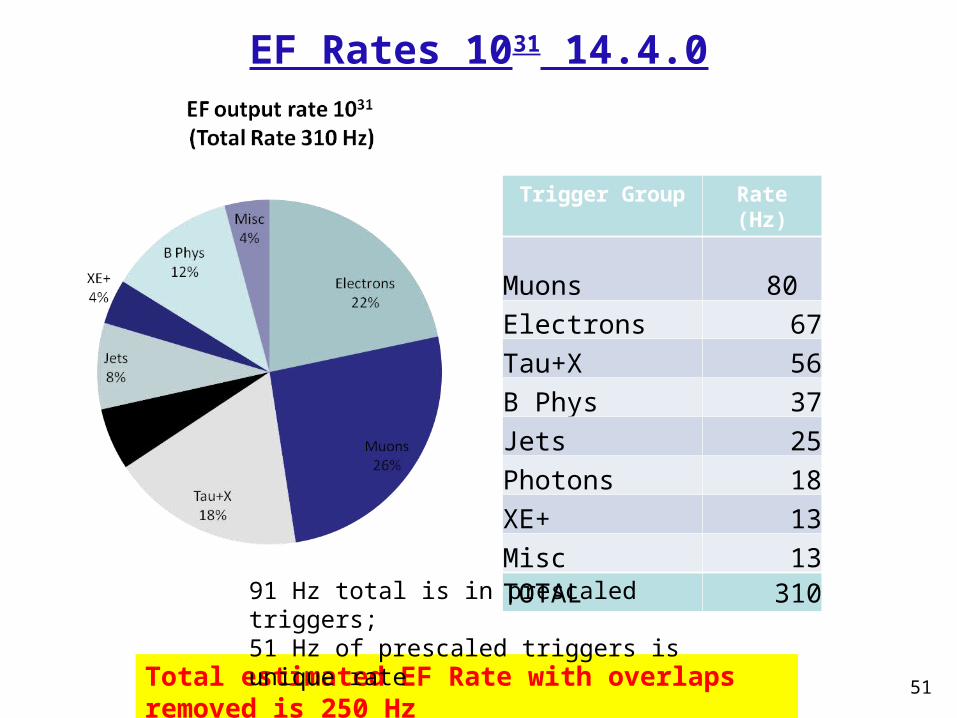
EF Rates 1031 14.4.0
Total estimated EF Rate with overlaps removed is 250 Hz
Trigger Group Rate (Hz)
Muons 80
Electrons 67
Tau+X 56
B Phys 37
Jets 25
Photons 18
XE+ 13
Misc 13TOTAL 310
91 Hz total is in prescaled triggers;51 Hz of prescaled triggers is unique rate
52
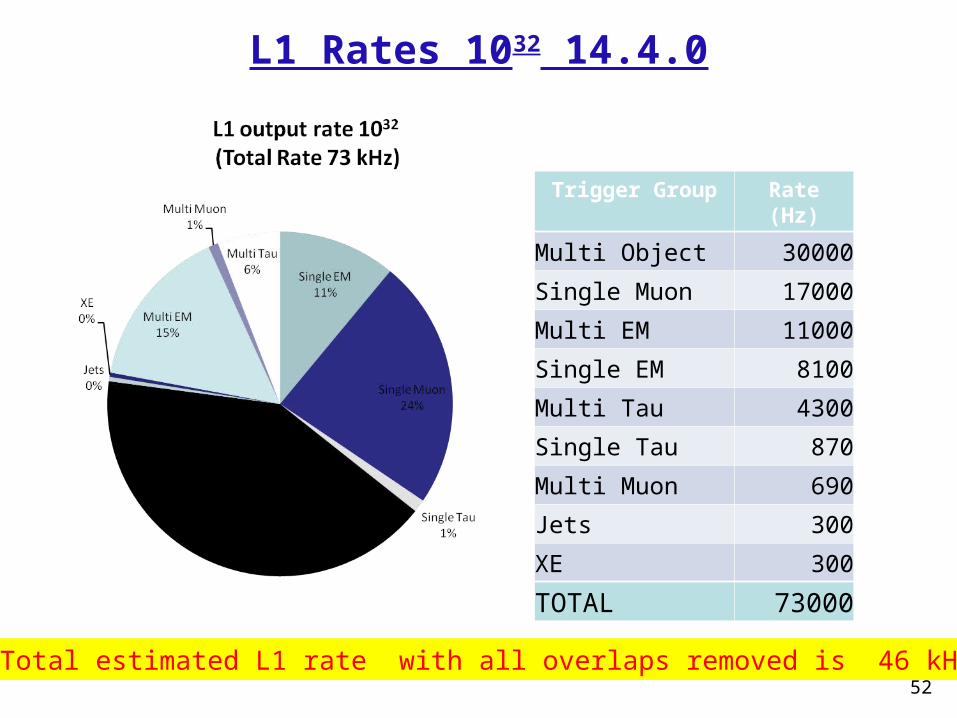
L1 Rates 1032 14.4.0
Total estimated L1 rate with all overlaps removed is 46 kHz
Trigger Group Rate (Hz)
Multi Object 30000
Single Muon 17000
Multi EM 11000
Single EM 8100
Multi Tau 4300
Single Tau 870
Multi Muon 690
Jets 300
XE 300
TOTAL 73000
53
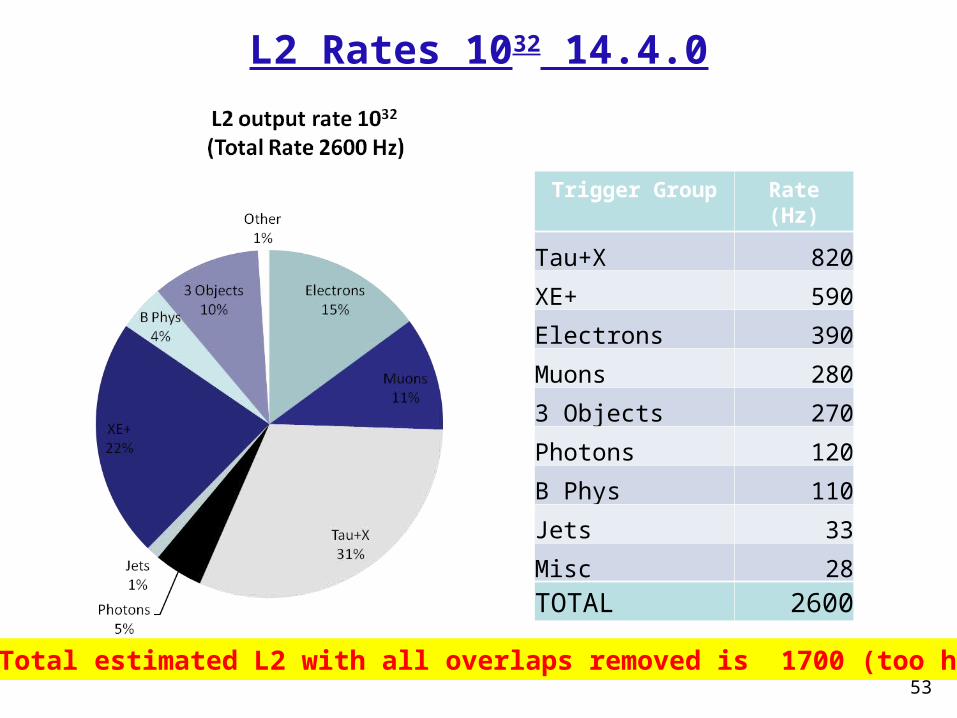
L2 Rates 1032 14.4.0
Total estimated L2 with all overlaps removed is 1700 (too high!)
Trigger Group Rate (Hz)
Tau+X 820
XE+ 590
Electrons 390
Muons 280
3 Objects 270
Photons 120
B Phys 110
Jets 33
Misc 28
TOTAL 2600
54
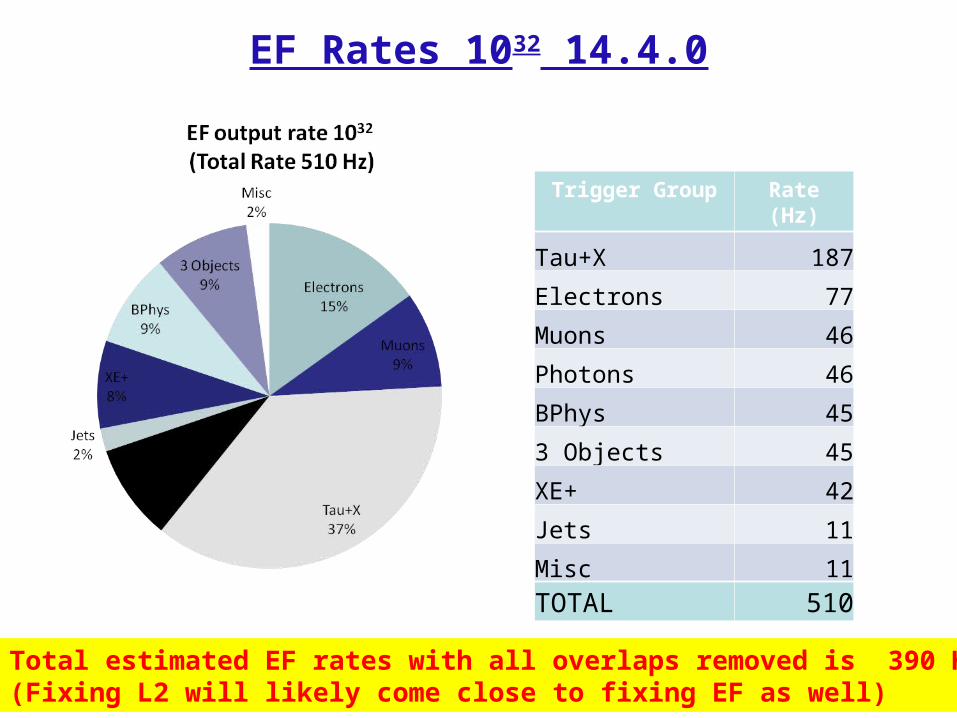
EF Rates 1032 14.4.0
Total estimated EF rates with all overlaps removed is 390 Hz(Fixing L2 will likely come close to fixing EF as well)
Trigger Group Rate (Hz)
Tau+X 187
Electrons 77
Muons 46
Photons 46
BPhys 45
3 Objects 45
XE+ 42
Jets 11
Misc 11
TOTAL 510