Embed Size (px)
Citation preview

High Poverty Hotspots 1 –Douglas County High poverty hotspots are geographic concentrations of poor residents. This report identifies the high poverty hotspots in Douglas County and provides a profile of residents using Census Bureau, DHS, and Oregon Employment Department (OED) data. DHS administrative data on SNAP clients were pulled for all clients known to be living in the hotspots in January 2015. SNAP information was used because SNAP is the single largest DHS/OHA program, it has a high participation rate among Oregon’s poor and low income residents, and it has reliable geographic information. Statewide, about 96 percent of SNAP clients have addresses that can be reliably located within a census tract. Once data on SNAP clients within the hotspot were pulled, information about them was assembled from the DHS Integrated Client Services (ICS) data warehouse. ICS contains information on clients from nearly all DHS/OHA programs from January 2000 to present. In addition, Oregon employment and earnings history for all clients has been provided by OED and incorporated into ICS. The purpose of this report is to identify high poverty areas and describe residents and SNAP clients living in them. Characteristics of the hotspot are compared with the county and Oregon. Data are presented in a series of tables that follow. Bullet points are provided when there is pertinent information not included in the tables. Data in this report should be considered a means to illustrate the lives of hotspot residents with respect to family structure, geographic mobility, employment history, and to identify potential barriers to self-sufficiency. Knowledge about local high poverty hotspots can be useful when designing and locating programs and services targeted to low income people. Poverty concentrations also pose a number of challenges for local public schools. Douglas County has 4 high poverty hotspots. According to Census Bureau and DHS data, 30 percent of Douglas County’s population, 42 percent of its poor, and 40 percent of its SNAP clients live in the areas described below.
1 Hotspot: The Census Bureau’s definition of a poverty area is a tract with a poverty rate of 20 percent or more. We define a high poverty hotspot as a census tract or contiguous group of tracts with poverty rates of 20 percent or more for two consecutive measurements. Poverty rates were measured in the Census Bureau’s 2009-2013 and 2008-2012 American Community Surveys (ACS).
Oregon DHS Office of Forecasting, Research, & Analysis May 2015

Figure 1: Poverty hotspot: West Douglas County
• West Douglas County (Census Tract 100, Figure 1) Location: A portion of coastal Douglas County and extending inland to the Coast Range crest. It includes the portion of Reedsport that lies north of Schofield Creek and the communities of Scottsburg and Gardiner. Boundaries: North: Lane County South: The Umpqua River, Oregon Highway 38, and Scholfield Creek East: Crest of the Coast Range West: The Pacific Ocean
Oregon DHS Office of Forecasting, Research, & Analysis May 2015

Figure 2: Poverty hotspot: East Roseburg
• East Roseburg (Census tracts 1200 and 1300, Figure 2) Location: Portion of Roseburg that lies east of I-5 and extending northeast to the North Umpqua River, south along the South Umpqua River, and east along Diamond Lake Boulevard (Oregon Highway 138) Boundaries: North: Roseburg airport, Newton and Dixon creeks, and the North Umpqua River South: Old Highway 99 and power intertie lines East: Sunshine Road West: I-5
Oregon DHS Office of Forecasting, Research, & Analysis May 2015
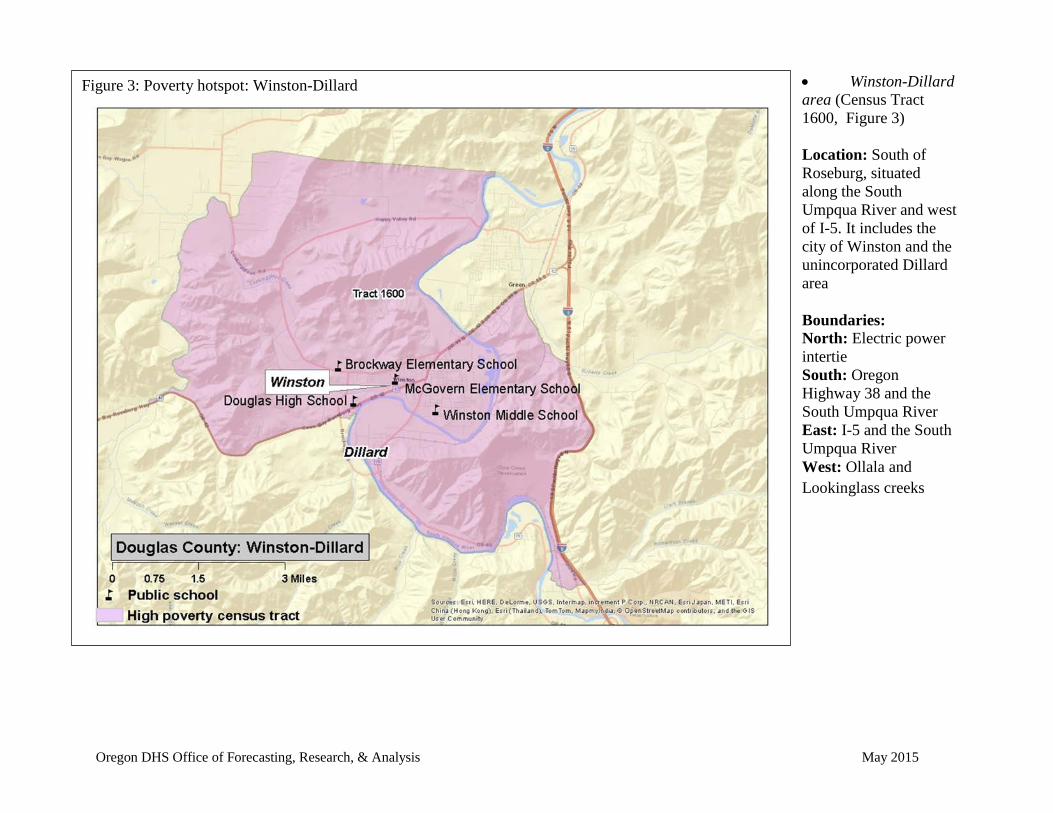
Figure 3: Poverty hotspot: Winston-Dillard
• Winston-Dillard area (Census Tract 1600, Figure 3) Location: South of Roseburg, situated along the South Umpqua River and west of I-5. It includes the city of Winston and the unincorporated Dillard area Boundaries: North: Electric power intertie South: Oregon Highway 38 and the South Umpqua River East: I-5 and the South Umpqua River West: Ollala and Lookinglass creeks
Oregon DHS Office of Forecasting, Research, & Analysis May 2015

Figure 4: Poverty hotspot: South Douglas County
• South Douglas County (Census tracts 1900 and 2000, Figure 4) Location: Southern Douglas County along I-5 and the South Umpqua River. It includes the cities of Riddle and Canyonville, a portion of the city of Myrtle Creek, and the unincorporated Tri-City area. Boundaries: North: Boomer Hill Road, Van Dine Creek and the South Umpqua River. Within Myrtle Creek the boundary is the railroad tracks, S Main Street, Riverside Drive, and Days Creek Cutoff Road South: West Fork of Canyon Creek, Ritchie Road, and BLM roads East: Bearpen Lane, North Oakley Road, West Fork of Canyon
Creek, and Ritchie Road West: BLM roads, Cow Creek and Doe Creek roads
Oregon DHS Office of Forecasting, Research, & Analysis May 2015

Table 1 Douglas County hotspots: neighborhood characteristics from the Census Bureau1
Census measures compared to the county and state (Table 1) • In the East Roseburg hotspot, the poverty rate was 23 percent in tract 1300 and 29 percent in tract 1200. • In the South County hotspot, the poverty rate was 26 percent in tract 2000 and 29 percent in tract 1900.
Oregon DHS Office of Forecasting, Research, & Analysis May 2015

Table 2 Douglas County hotspots: characteristics of SNAP clients
Characteristics of SNAP hotspot clients compared to county and state (Table 2) • Among all Oregon hotspots, clients in the East Roseburg area had the 9th highest rate of participation in mental health programs and the 19th highest participation rate in alcohol and drug programs. They also had the 11th highest rate of geographic mobility (Table 4). These factors resulted in the area’s index rank of 28.
Oregon DHS Office of Forecasting, Research, & Analysis May 2015

Table 3 Douglas County hotspots: employment history for adult SNAP clients1
Employment characteristics of adult SNAP hotspot clients compared to county and state (Table 3) • Client employment declined in the West and South areas. In the Roseburg and Winston areas, client employment increased, and most of the increase came from the administrative services sector. In 2014, more than half of clients employed in that sector were working in telemarketing bureaus or contact centers.
Oregon DHS Office of Forecasting, Research, & Analysis May 2015

Table 4 Douglas County hotspots: address history for SNAP clients1,2
Geographic mobility (Table 4) Measuring the number of moves registered by SNAP households is important because low income families often move as a response to job loss, a change in household composition, or eviction. Children who move frequently are more likely to experience academic and social challenges in school.2 The overwhelming majority of moves among SNAP clients are short-distance, but patterns vary in rural versus urban areas. Census tracts are larger in rural areas and distances are longer between urban areas in largely rural counties. Clients in rural areas are more likely to move within the same census tract or move to a different county than are clients in urban areas. Due to the smaller size of urban census tracts, clients in urban areas are more likely to move to a different tract within the same county than are rural clients.
• The migration pattern for movers in the Roseburg and Winston hotspots was urban, with two-thirds of movers relocating from another Douglas County tract and 12 percent relocating from another county. • The migration pattern for movers in the West and South hotspots was rural, with about half of movers relocating from another Douglas County tract, 30 percent relocating within the tract, and 18 percent relocating from another county.
• For those who relocated from another county, the most common counties of origin were Lane and Coos.
2 The negative effects on low income children associated with frequent moves and school changes are well documented in peer-reviewed literature.
Oregon DHS Office of Forecasting, Research, & Analysis May 2015