Embed Size (px)
Citation preview
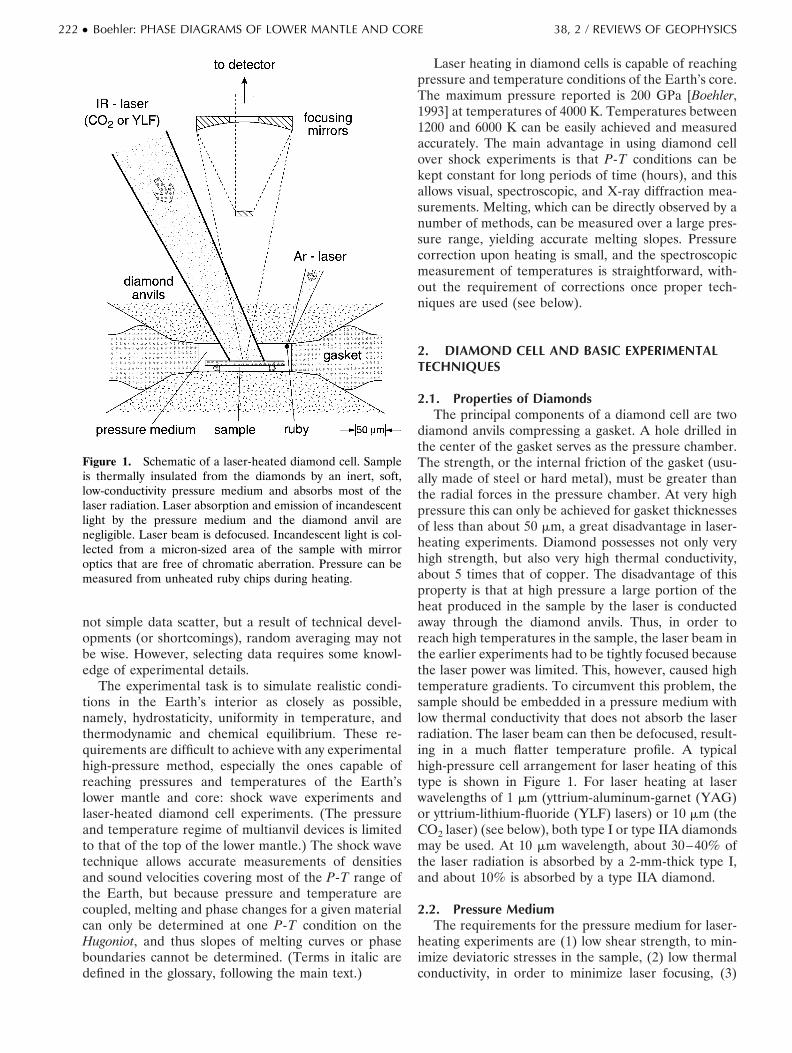
HIGH-PRESSURE EXPERIMENTS AND THE PHASE DIAGRAMOF LOWER MANTLE AND CORE MATERIALS
R. BoehlerHigh-Pressure Mineral PhysicsMax-Planck Institut fur ChemieMainz, Germany
Abstract. The interpretation of seismic data and com-puter modeling requires increased accuracy in relevantmaterial properties in order to improve our knowledgeof the structure and dynamics of the Earth’s deep inte-rior. To obtain such properties, a complementarymethod to classic shock compression experiments andtheoretical calculations is the use of laser-heated dia-mond cells, which are now producing accurate data onphase diagrams, equations of state, and melting. Data onone of the most important measurements, the meltingtemperatures of iron at very high pressure, are nowconverging. Two other issues linking core properties tothose of iron are investigated in the diamond cell: One isthe melting point depression of iron in the presence oflight elements, and the other is the structure of iron atthe conditions of the inner core. First measurements oneutectic systems indicate a significant decrease in themelting point depression with increasing pressure, whichis in contrast to previous predictions. X-ray diffractionmeasurements at simultaneously high pressure and hightemperature have improved significantly with the instal-
lation of high-pressure “beam lines” at synchrotron fa-cilities, and structural measurements on iron are inprogress. Considerable efforts have been made to de-velop new techniques to heat minerals at the conditionsof the deep mantle in the diamond cell and to measuretheir phase relations reliably. Even measurements of themelting behavior of realistic rock compositions at highpressure, previously considered to be impossible in thediamond cell, have been reported. The extrapolatedsolidus of the lower mantle intersects the geotherm atthe core-mantle boundary, which may explain the seis-mically observed ultra low velocity zone. The diamondcell has great potential for future development andbroad application, as new measurements on high-pres-sure geochemistry at deep mantle and core conditionshave opened a new field of research. There are, however,strict experimental requirements for obtaining reliabledata, which are summarized in the present paper. Re-sults from recent measurements of melting temperaturesand phase diagrams of lower mantle and core materialsat very high pressure are reviewed.
1. INTRODUCTION
The interpretation of seismic data that have gainedsignificantly in resolution and amount in the last fewyears poses a challenge in the fields of computer mod-eling, geochemistry, and experimental high-pressure re-search. A picture has evolved in which the Earth is muchmore heterogeneous in its internal structure than previ-ously thought [Kellogg et al., 1999], and the causes forthese heterogeneities are only poorly understood. Theobserved lateral and depth variations in seismic veloci-ties may have thermal, structural, dynamical, and/orchemical causes. A key element in the understanding ofthis complexity is the study of physical and chemicalproperties of the relevant Earth materials. However, atthe very high pressure and temperature conditions of theEarth’s deep interior the accurate measurement of phys-ical and chemical material properties becomes exceed-ingly difficult. The two techniques capable of generatingsuch high pressure and temperature conditions, shockcompression and laser heating in diamond cells, have
associated weaknesses. The primary drawback to shockcompression experiments is the short timescale, and forthe diamond cell the drawback is the small sample size.It is unfortunate but natural that the complexity in thesetechniques had initially led to very large discrepancies ingeophysically important results, in particular the meltingtemperatures of iron, which are key for estimating thetemperature in the Earth’s center. Without the improve-ment of these techniques in the last few years, the uncer-tainty in these estimates would still far exceed 1000 K.
The purpose of this paper is to summarize the mostimportant techniques to accurately characterize pres-sure, temperature, volume, and phase transitions in thelaser-heated diamond cell, because seemingly minor ex-perimental differences have been shown to cause verylarge discrepancies in the experimental results. Theseprevious data have been recently comprehensively de-scribed [Shen and Heinz, 1998] and will not be reviewedhere. Rather, an attempt is made to show where datahave converged and where the results are still unre-solved. Because discrepancies in data in most cases are
Copyright 2000 by the American Geophysical Union. Reviews of Geophysics, 38, 2 / May 2000pages 221–245
8755-1209/00/1998RG000053$15.00 Paper number 1998RG000053● 221 ●
not simple data scatter, but a result of technical devel-opments (or shortcomings), random averaging may notbe wise. However, selecting data requires some knowl-edge of experimental details.
The experimental task is to simulate realistic condi-tions in the Earth’s interior as closely as possible,namely, hydrostaticity, uniformity in temperature, andthermodynamic and chemical equilibrium. These re-quirements are difficult to achieve with any experimentalhigh-pressure method, especially the ones capable ofreaching pressures and temperatures of the Earth’slower mantle and core: shock wave experiments andlaser-heated diamond cell experiments. (The pressureand temperature regime of multianvil devices is limitedto that of the top of the lower mantle.) The shock wavetechnique allows accurate measurements of densitiesand sound velocities covering most of the P-T range ofthe Earth, but because pressure and temperature arecoupled, melting and phase changes for a given materialcan only be determined at one P-T condition on theHugoniot, and thus slopes of melting curves or phaseboundaries cannot be determined. (Terms in italic aredefined in the glossary, following the main text.)
Laser heating in diamond cells is capable of reachingpressure and temperature conditions of the Earth’s core.The maximum pressure reported is 200 GPa [Boehler,1993] at temperatures of 4000 K. Temperatures between1200 and 6000 K can be easily achieved and measuredaccurately. The main advantage in using diamond cellover shock experiments is that P-T conditions can bekept constant for long periods of time (hours), and thisallows visual, spectroscopic, and X-ray diffraction mea-surements. Melting, which can be directly observed by anumber of methods, can be measured over a large pres-sure range, yielding accurate melting slopes. Pressurecorrection upon heating is small, and the spectroscopicmeasurement of temperatures is straightforward, with-out the requirement of corrections once proper tech-niques are used (see below).
2. DIAMOND CELL AND BASIC EXPERIMENTALTECHNIQUES
2.1. Properties of DiamondsThe principal components of a diamond cell are two
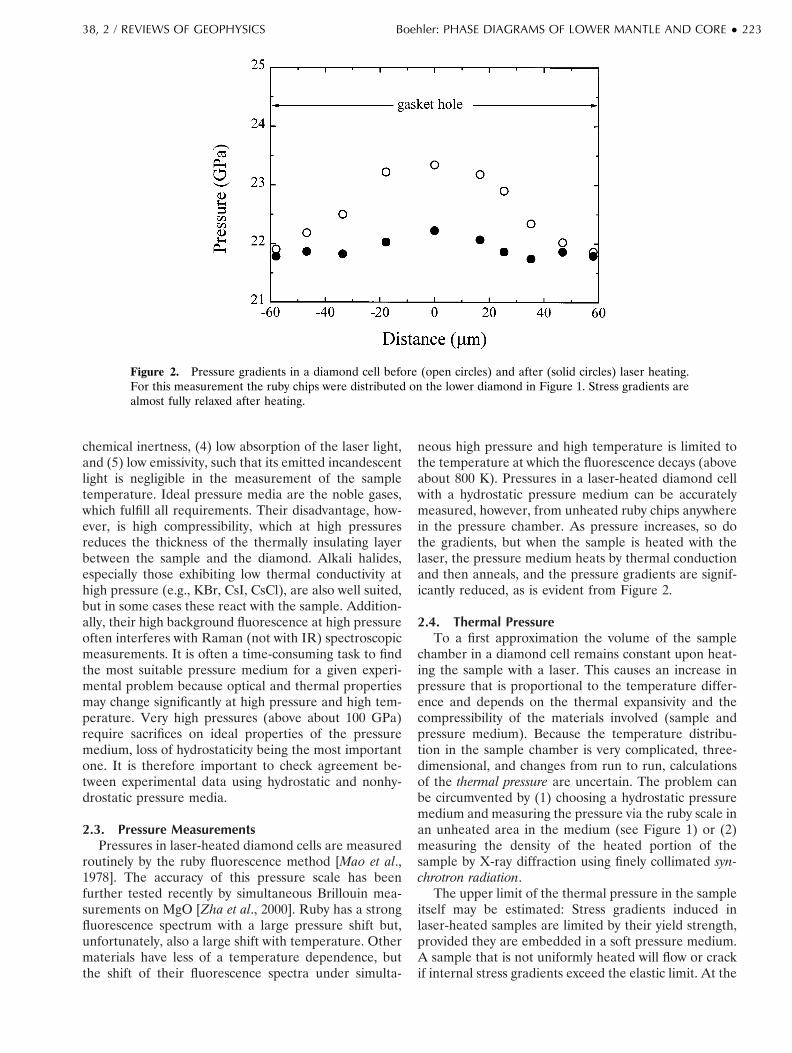
diamond anvils compressing a gasket. A hole drilled inthe center of the gasket serves as the pressure chamber.The strength, or the internal friction of the gasket (usu-ally made of steel or hard metal), must be greater thanthe radial forces in the pressure chamber. At very highpressure this can only be achieved for gasket thicknessesof less than about 50 mm, a great disadvantage in laser-heating experiments. Diamond possesses not only veryhigh strength, but also very high thermal conductivity,about 5 times that of copper. The disadvantage of thisproperty is that at high pressure a large portion of theheat produced in the sample by the laser is conductedaway through the diamond anvils. Thus, in order toreach high temperatures in the sample, the laser beam inthe earlier experiments had to be tightly focused becausethe laser power was limited. This, however, caused hightemperature gradients. To circumvent this problem, thesample should be embedded in a pressure medium withlow thermal conductivity that does not absorb the laserradiation. The laser beam can then be defocused, result-ing in a much flatter temperature profile. A typicalhigh-pressure cell arrangement for laser heating of thistype is shown in Figure 1. For laser heating at laserwavelengths of 1 mm (yttrium-aluminum-garnet (YAG)or yttrium-lithium-fluoride (YLF) lasers) or 10 mm (theCO2 laser) (see below), both type I or type IIA diamondsmay be used. At 10 mm wavelength, about 30–40% ofthe laser radiation is absorbed by a 2-mm-thick type I,and about 10% is absorbed by a type IIA diamond.
2.2. Pressure MediumThe requirements for the pressure medium for laser-
heating experiments are (1) low shear strength, to min-imize deviatoric stresses in the sample, (2) low thermalconductivity, in order to minimize laser focusing, (3)
Figure 1. Schematic of a laser-heated diamond cell. Sampleis thermally insulated from the diamonds by an inert, soft,low-conductivity pressure medium and absorbs most of thelaser radiation. Laser absorption and emission of incandescentlight by the pressure medium and the diamond anvil arenegligible. Laser beam is defocused. Incandescent light is col-lected from a micron-sized area of the sample with mirroroptics that are free of chromatic aberration. Pressure can bemeasured from unheated ruby chips during heating.
222 ● Boehler: PHASE DIAGRAMS OF LOWER MANTLE AND CORE 38, 2 / REVIEWS OF GEOPHYSICS
chemical inertness, (4) low absorption of the laser light,and (5) low emissivity, such that its emitted incandescentlight is negligible in the measurement of the sampletemperature. Ideal pressure media are the noble gases,which fulfill all requirements. Their disadvantage, how-ever, is high compressibility, which at high pressuresreduces the thickness of the thermally insulating layerbetween the sample and the diamond. Alkali halides,especially those exhibiting low thermal conductivity athigh pressure (e.g., KBr, CsI, CsCl), are also well suited,but in some cases these react with the sample. Addition-ally, their high background fluorescence at high pressureoften interferes with Raman (not with IR) spectroscopicmeasurements. It is often a time-consuming task to findthe most suitable pressure medium for a given experi-mental problem because optical and thermal propertiesmay change significantly at high pressure and high tem-perature. Very high pressures (above about 100 GPa)require sacrifices on ideal properties of the pressuremedium, loss of hydrostaticity being the most importantone. It is therefore important to check agreement be-tween experimental data using hydrostatic and nonhy-drostatic pressure media.
2.3. Pressure MeasurementsPressures in laser-heated diamond cells are measured
routinely by the ruby fluorescence method [Mao et al.,1978]. The accuracy of this pressure scale has beenfurther tested recently by simultaneous Brillouin mea-surements on MgO [Zha et al., 2000]. Ruby has a strongfluorescence spectrum with a large pressure shift but,unfortunately, also a large shift with temperature. Othermaterials have less of a temperature dependence, butthe shift of their fluorescence spectra under simulta-
neous high pressure and high temperature is limited tothe temperature at which the fluorescence decays (aboveabout 800 K). Pressures in a laser-heated diamond cellwith a hydrostatic pressure medium can be accuratelymeasured, however, from unheated ruby chips anywherein the pressure chamber. As pressure increases, so dothe gradients, but when the sample is heated with thelaser, the pressure medium heats by thermal conductionand then anneals, and the pressure gradients are signif-icantly reduced, as is evident from Figure 2.
2.4. Thermal PressureTo a first approximation the volume of the sample
chamber in a diamond cell remains constant upon heat-ing the sample with a laser. This causes an increase inpressure that is proportional to the temperature differ-ence and depends on the thermal expansivity and thecompressibility of the materials involved (sample andpressure medium). Because the temperature distribu-tion in the sample chamber is very complicated, three-dimensional, and changes from run to run, calculationsof the thermal pressure are uncertain. The problem canbe circumvented by (1) choosing a hydrostatic pressuremedium and measuring the pressure via the ruby scale inan unheated area in the medium (see Figure 1) or (2)measuring the density of the heated portion of thesample by X-ray diffraction using finely collimated syn-chrotron radiation.
The upper limit of the thermal pressure in the sampleitself may be estimated: Stress gradients induced inlaser-heated samples are limited by their yield strength,provided they are embedded in a soft pressure medium.A sample that is not uniformly heated will flow or crackif internal stress gradients exceed the elastic limit. At the
Figure 2. Pressure gradients in a diamond cell before (open circles) and after (solid circles) laser heating.For this measurement the ruby chips were distributed on the lower diamond in Figure 1. Stress gradients arealmost fully relaxed after heating.
38, 2 / REVIEWS OF GEOPHYSICS Boehler: PHASE DIAGRAMS OF LOWER MANTLE AND CORE ● 223
high temperatures of the laser-heated diamond cell theyield strength of most geological materials decreases towell below 1 GPa, thus limiting internal stress gradientsto insignificant levels. In a molten sample embedded ina hydrostatic pressure medium, stress gradients are zero.
A separate issue is the pressure increase in the pres-sure chamber due to the thermal pressure in both thesample and the pressure medium. This pressure increasecan be precisely measured when the cell geometry shownin Figure 1 is used. This thermal pressure increase isinsignificant if the volume of the sample is small withrespect to the volume of the pressure medium, as wasthe case in melting or phase transition measurements,where thermal pressures did not exceed 0.3 GPa[Boehler and Chopelas, 1991].
Conflicting results, however, have been reported re-cently [Fiquet et al., 1996] from X-ray measurements.Difficulties associated with X-ray diffraction will be de-scribed below. The main problems are the unknown P-Tequation of state of the sample, the large sample-to-pressure-medium ratio, and temperature gradients inthe X-rayed portion of the sample.
2.5. Laser HeatingThe principal requirements are high power, stability
in power and beam position, suitable wavelength forabsorption, and preferably a wavelength outside thespectral range in which the incandescent light from thesample is measured. Nd-doped yttrium-aluminum-gar-net (YAG) (l 5 1.06 mm) lasers, first used by Ming andBassett [1974], and CO2 lasers (l 5 10.6 mm) [Boehlerand Chopelas, 1991] have typical powers of 20 and 150W, respectively. However, intrinsic power instability ofthese lasers produced temperature fluctuations of sev-eral hundred degrees, a serious problem for accuratelymeasuring phase transitions. Nd-doped yttrium-lithium-fluoride lasers (YLF) (l 5 1.05 mm) provide signifi-cantly higher stability of both power and beam position.CO2 lasers can be stabilized with an electronic feedbackmechanism, which uses the incandescent light of thesample to regulate the laser power [Boehler and Chop-elas, 1991]. Both YLF and stabilized CO2 lasers providetemperature stability within about 10 K.
2.6. OpticsIn the early laser-heating experiments, microscopes
served for both focusing the laser beam and observingthe sample. This caused major problems: (1) The micro-scope objectives are designed for visible light, and thetransmission of laser light at 1-mm wavelength is signif-icantly reduced due to reflection. Additionally, beamsplitters (dichroic mirrors) have to be used to separatethe laser radiation from the incandescent light comingfrom the heated sample, and this further reduces thelaser power, resulting in a total loss in power of over50%. (2) The sample is located in the focal point of theobjective, and thus the laser beam is nearly focused,creating small hot spots with very large temperature
gradients. Moreover, microscopes are unsuitable for theuse of CO2 lasers because this radiation is fully absorbedby the glass lenses.
These problems are avoided by using separate lensesfor focusing the laser beam with suitable antireflectioncoatings, providing a throughput of over 95% of thelaser power. Yet a significant portion of the incidentlaser radiation is reflected from the diamond surfacesdue to the high refractive index of diamond. For the CO2laser the loss is about 30% at an incident angle of 208.
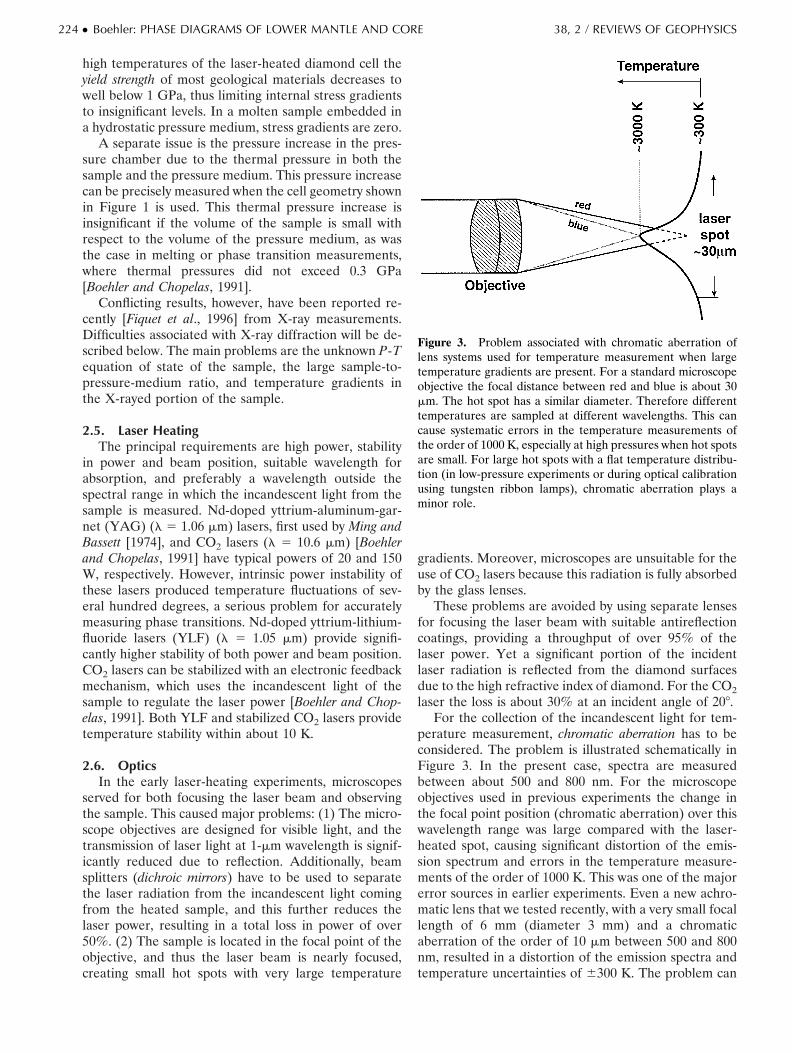
For the collection of the incandescent light for tem-perature measurement, chromatic aberration has to beconsidered. The problem is illustrated schematically inFigure 3. In the present case, spectra are measuredbetween about 500 and 800 nm. For the microscopeobjectives used in previous experiments the change inthe focal point position (chromatic aberration) over thiswavelength range was large compared with the laser-heated spot, causing significant distortion of the emis-sion spectrum and errors in the temperature measure-ments of the order of 1000 K. This was one of the majorerror sources in earlier experiments. Even a new achro-matic lens that we tested recently, with a very small focallength of 6 mm (diameter 3 mm) and a chromaticaberration of the order of 10 mm between 500 and 800nm, resulted in a distortion of the emission spectra andtemperature uncertainties of 6300 K. The problem can
Figure 3. Problem associated with chromatic aberration oflens systems used for temperature measurement when largetemperature gradients are present. For a standard microscopeobjective the focal distance between red and blue is about 30mm. The hot spot has a similar diameter. Therefore differenttemperatures are sampled at different wavelengths. This cancause systematic errors in the temperature measurements ofthe order of 1000 K, especially at high pressures when hot spotsare small. For large hot spots with a flat temperature distribu-tion (in low-pressure experiments or during optical calibrationusing tungsten ribbon lamps), chromatic aberration plays aminor role.
224 ● Boehler: PHASE DIAGRAMS OF LOWER MANTLE AND CORE 38, 2 / REVIEWS OF GEOPHYSICS
be circumvented by using mirror optics with zero chro-matic aberration (shown schematically in Figure 1). Ob-jectives with long focal lengths may be easily manufac-tured from aluminum-coated plano-convex and plano-concave lenses with radii ratios of about 2.62 [Kingslake,1978].
2.7. Temperature MeasurementsOnce temperature gradients are minimized and the
proper collecting optics are used, the measurement oftemperature is remarkably straightforward and accurate.The mirror objective shown in Figure 1 produces anenlarged image of the laser-heated spot at the entranceof a monochromator. If the commonly used entrance slitis replaced with a pinhole, very small areas (equivalentto 1–3 mm diameter) within this hot spot can be sampled,allowing accurate measurements of temperature gradi-ents. Sampling from such small areas is especially im-portant at very high pressures (above 100 GPa), wherethe dimensions of the pressure cell have to be reduced,leading to an increase in temperature gradients. In theearlier experiments this technique of point measurementwas not used, and therefore peak temperatures couldnot be measured directly [Heinz and Jeanloz, 1987; Wil-liams et al., 1987]. The final temperature estimate re-quired large corrections, and this may have been theother major source for systematic errors in those exper-iments.
The incandescent light is typically collected in a spec-tral range between 500 and 800 nm based on the sensi-tivity of the most commonly used Si array or charge-coupled device (CCD) detectors. The optical system is
calibrated with a light source (in general, a tungstenribbon lamp) with known intensity versus wavelengthdistribution.
The Planck radiation function
I~l! 5εc1l
25
ec2/lT 2 1 (1)
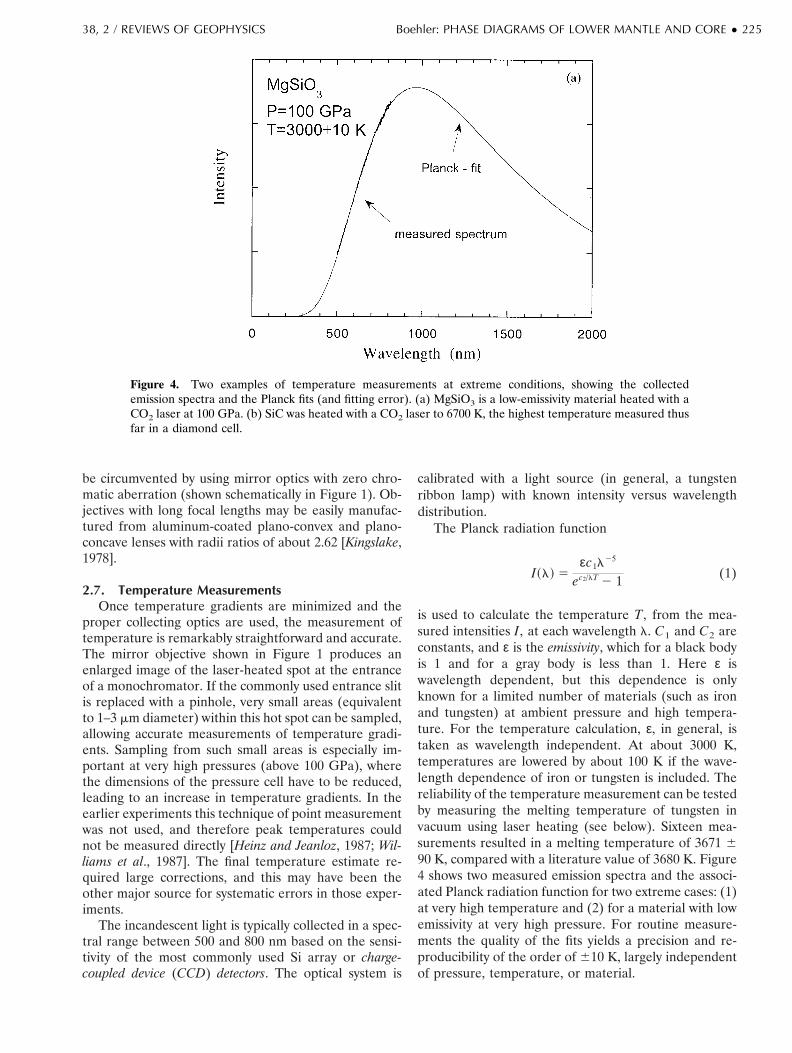
is used to calculate the temperature T, from the mea-sured intensities I, at each wavelength l. C1 and C2 areconstants, and ε is the emissivity, which for a black bodyis 1 and for a gray body is less than 1. Here ε iswavelength dependent, but this dependence is onlyknown for a limited number of materials (such as ironand tungsten) at ambient pressure and high tempera-ture. For the temperature calculation, ε, in general, istaken as wavelength independent. At about 3000 K,temperatures are lowered by about 100 K if the wave-length dependence of iron or tungsten is included. Thereliability of the temperature measurement can be testedby measuring the melting temperature of tungsten invacuum using laser heating (see below). Sixteen mea-surements resulted in a melting temperature of 3671 690 K, compared with a literature value of 3680 K. Figure4 shows two measured emission spectra and the associ-ated Planck radiation function for two extreme cases: (1)at very high temperature and (2) for a material with lowemissivity at very high pressure. For routine measure-ments the quality of the fits yields a precision and re-producibility of the order of 610 K, largely independentof pressure, temperature, or material.
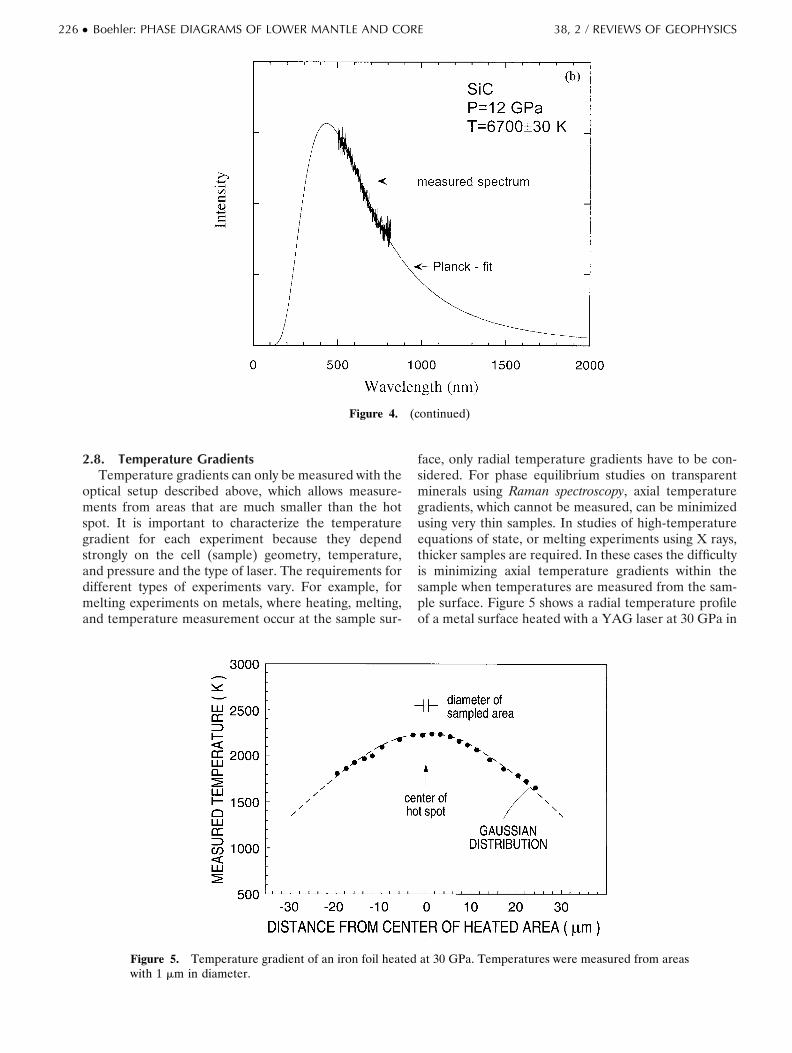
Figure 4. Two examples of temperature measurements at extreme conditions, showing the collectedemission spectra and the Planck fits (and fitting error). (a) MgSiO3 is a low-emissivity material heated with aCO2 laser at 100 GPa. (b) SiC was heated with a CO2 laser to 6700 K, the highest temperature measured thusfar in a diamond cell.
38, 2 / REVIEWS OF GEOPHYSICS Boehler: PHASE DIAGRAMS OF LOWER MANTLE AND CORE ● 225
2.8. Temperature GradientsTemperature gradients can only be measured with the
optical setup described above, which allows measure-ments from areas that are much smaller than the hotspot. It is important to characterize the temperaturegradient for each experiment because they dependstrongly on the cell (sample) geometry, temperature,and pressure and the type of laser. The requirements fordifferent types of experiments vary. For example, formelting experiments on metals, where heating, melting,and temperature measurement occur at the sample sur-
face, only radial temperature gradients have to be con-sidered. For phase equilibrium studies on transparentminerals using Raman spectroscopy, axial temperaturegradients, which cannot be measured, can be minimizedusing very thin samples. In studies of high-temperatureequations of state, or melting experiments using X rays,thicker samples are required. In these cases the difficultyis minimizing axial temperature gradients within thesample when temperatures are measured from the sam-ple surface. Figure 5 shows a radial temperature profileof a metal surface heated with a YAG laser at 30 GPa in
Figure 4. (continued)
Figure 5. Temperature gradient of an iron foil heated at 30 GPa. Temperatures were measured from areaswith 1 mm in diameter.
226 ● Boehler: PHASE DIAGRAMS OF LOWER MANTLE AND CORE 38, 2 / REVIEWS OF GEOPHYSICS
an argon pressure medium. Temperature profiles inmost experiments are less smooth, because surface tex-ture and absorption may change due to phase transi-tions, recrystallization, melting, or chemical diffusion.
3. DETECTION OF PHASE TRANSITIONSIN THE DIAMOND CELL
The diamond cell is a formidable tool for detectinghigh-pressure phase transitions using a variety of meth-ods. In many cases the transitions can be observed visu-ally by changes in color, texture, or shape, and refractiveindex. In the case of melting, motion is readily detect-able.
3.1. Solid-Solid Phase TransitionsFor minerals the most reliable detection of phase
transitions is by Raman and infrared spectroscopy. Ra-man is more advantageous because of higher spectralresolution and because measurements are possible onvery small samples or portions thereof due to the smalllaser beam diameter. The spectra can be obtained ontemperature-quenched samples while the sample is un-der pressure. Measurements at simultaneously highpressure and high temperature are possible but are very
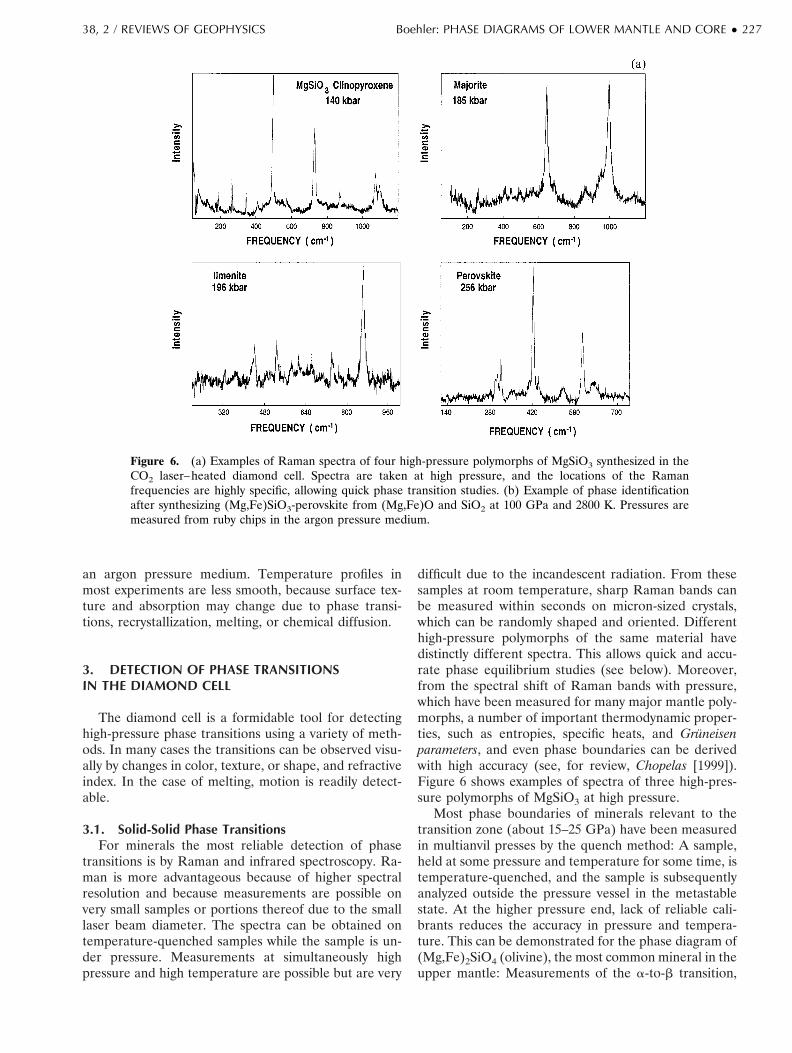
difficult due to the incandescent radiation. From thesesamples at room temperature, sharp Raman bands canbe measured within seconds on micron-sized crystals,which can be randomly shaped and oriented. Differenthigh-pressure polymorphs of the same material havedistinctly different spectra. This allows quick and accu-rate phase equilibrium studies (see below). Moreover,from the spectral shift of Raman bands with pressure,which have been measured for many major mantle poly-morphs, a number of important thermodynamic proper-ties, such as entropies, specific heats, and Gruneisenparameters, and even phase boundaries can be derivedwith high accuracy (see, for review, Chopelas [1999]).Figure 6 shows examples of spectra of three high-pres-sure polymorphs of MgSiO3 at high pressure.
Most phase boundaries of minerals relevant to thetransition zone (about 15–25 GPa) have been measuredin multianvil presses by the quench method: A sample,held at some pressure and temperature for some time, istemperature-quenched, and the sample is subsequentlyanalyzed outside the pressure vessel in the metastablestate. At the higher pressure end, lack of reliable cali-brants reduces the accuracy in pressure and tempera-ture. This can be demonstrated for the phase diagram of(Mg,Fe)2SiO4 (olivine), the most common mineral in theupper mantle: Measurements of the a-to-b transition,
Figure 6. (a) Examples of Raman spectra of four high-pressure polymorphs of MgSiO3 synthesized in theCO2 laser–heated diamond cell. Spectra are taken at high pressure, and the locations of the Ramanfrequencies are highly specific, allowing quick phase transition studies. (b) Example of phase identificationafter synthesizing (Mg,Fe)SiO3-perovskite from (Mg,Fe)O and SiO2 at 100 GPa and 2800 K. Pressures aremeasured from ruby chips in the argon pressure medium.
38, 2 / REVIEWS OF GEOPHYSICS Boehler: PHASE DIAGRAMS OF LOWER MANTLE AND CORE ● 227
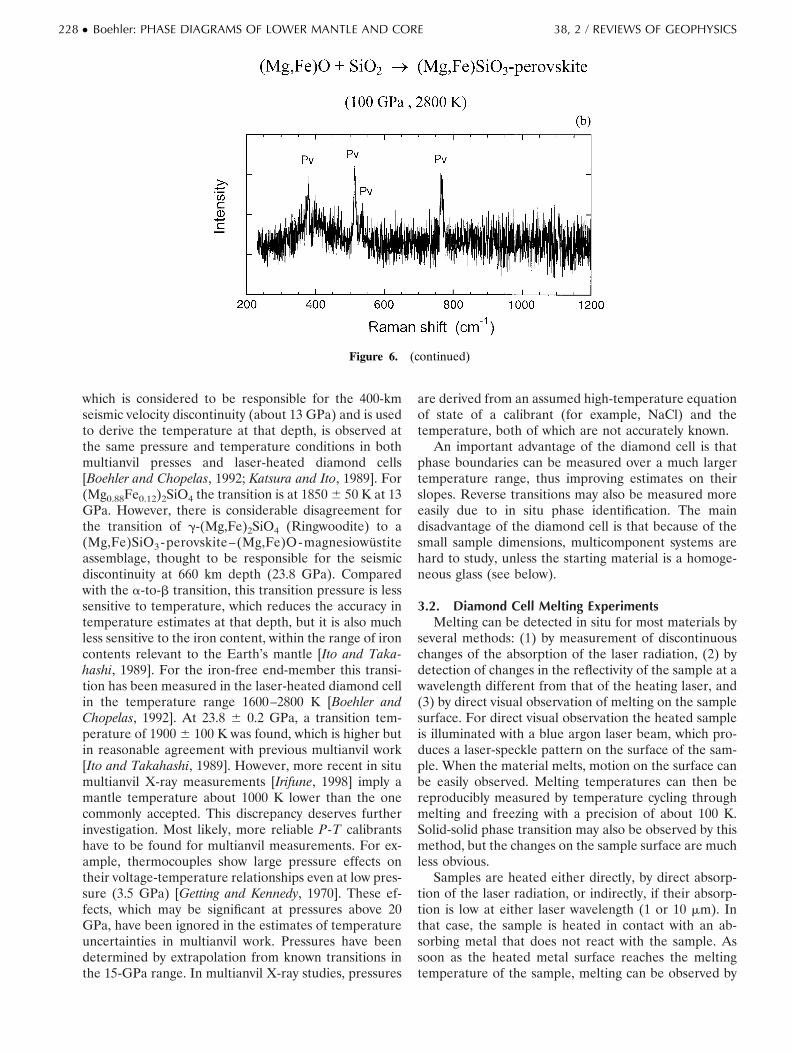
which is considered to be responsible for the 400-kmseismic velocity discontinuity (about 13 GPa) and is usedto derive the temperature at that depth, is observed atthe same pressure and temperature conditions in bothmultianvil presses and laser-heated diamond cells[Boehler and Chopelas, 1992; Katsura and Ito, 1989]. For(Mg0.88Fe0.12)2SiO4 the transition is at 1850 6 50 K at 13GPa. However, there is considerable disagreement forthe transition of g-(Mg,Fe)2SiO4 (Ringwoodite) to a(Mg,Fe)SiO3-perovskite–(Mg,Fe)O-magnesiowustiteassemblage, thought to be responsible for the seismicdiscontinuity at 660 km depth (23.8 GPa). Comparedwith the a-to-b transition, this transition pressure is lesssensitive to temperature, which reduces the accuracy intemperature estimates at that depth, but it is also muchless sensitive to the iron content, within the range of ironcontents relevant to the Earth’s mantle [Ito and Taka-hashi, 1989]. For the iron-free end-member this transi-tion has been measured in the laser-heated diamond cellin the temperature range 1600–2800 K [Boehler andChopelas, 1992]. At 23.8 6 0.2 GPa, a transition tem-perature of 1900 6 100 K was found, which is higher butin reasonable agreement with previous multianvil work[Ito and Takahashi, 1989]. However, more recent in situmultianvil X-ray measurements [Irifune, 1998] imply amantle temperature about 1000 K lower than the onecommonly accepted. This discrepancy deserves furtherinvestigation. Most likely, more reliable P-T calibrantshave to be found for multianvil measurements. For ex-ample, thermocouples show large pressure effects ontheir voltage-temperature relationships even at low pres-sure (3.5 GPa) [Getting and Kennedy, 1970]. These ef-fects, which may be significant at pressures above 20GPa, have been ignored in the estimates of temperatureuncertainties in multianvil work. Pressures have beendetermined by extrapolation from known transitions inthe 15-GPa range. In multianvil X-ray studies, pressures
are derived from an assumed high-temperature equationof state of a calibrant (for example, NaCl) and thetemperature, both of which are not accurately known.
An important advantage of the diamond cell is thatphase boundaries can be measured over a much largertemperature range, thus improving estimates on theirslopes. Reverse transitions may also be measured moreeasily due to in situ phase identification. The maindisadvantage of the diamond cell is that because of thesmall sample dimensions, multicomponent systems arehard to study, unless the starting material is a homoge-neous glass (see below).
3.2. Diamond Cell Melting ExperimentsMelting can be detected in situ for most materials by
several methods: (1) by measurement of discontinuouschanges of the absorption of the laser radiation, (2) bydetection of changes in the reflectivity of the sample at awavelength different from that of the heating laser, and(3) by direct visual observation of melting on the samplesurface. For direct visual observation the heated sampleis illuminated with a blue argon laser beam, which pro-duces a laser-speckle pattern on the surface of the sam-ple. When the material melts, motion on the surface canbe easily observed. Melting temperatures can then bereproducibly measured by temperature cycling throughmelting and freezing with a precision of about 100 K.Solid-solid phase transition may also be observed by thismethod, but the changes on the sample surface are muchless obvious.
Samples are heated either directly, by direct absorp-tion of the laser radiation, or indirectly, if their absorp-tion is low at either laser wavelength (1 or 10 mm). Inthat case, the sample is heated in contact with an ab-sorbing metal that does not react with the sample. Assoon as the heated metal surface reaches the meltingtemperature of the sample, melting can be observed by
Figure 6. (continued)
228 ● Boehler: PHASE DIAGRAMS OF LOWER MANTLE AND CORE 38, 2 / REVIEWS OF GEOPHYSICS
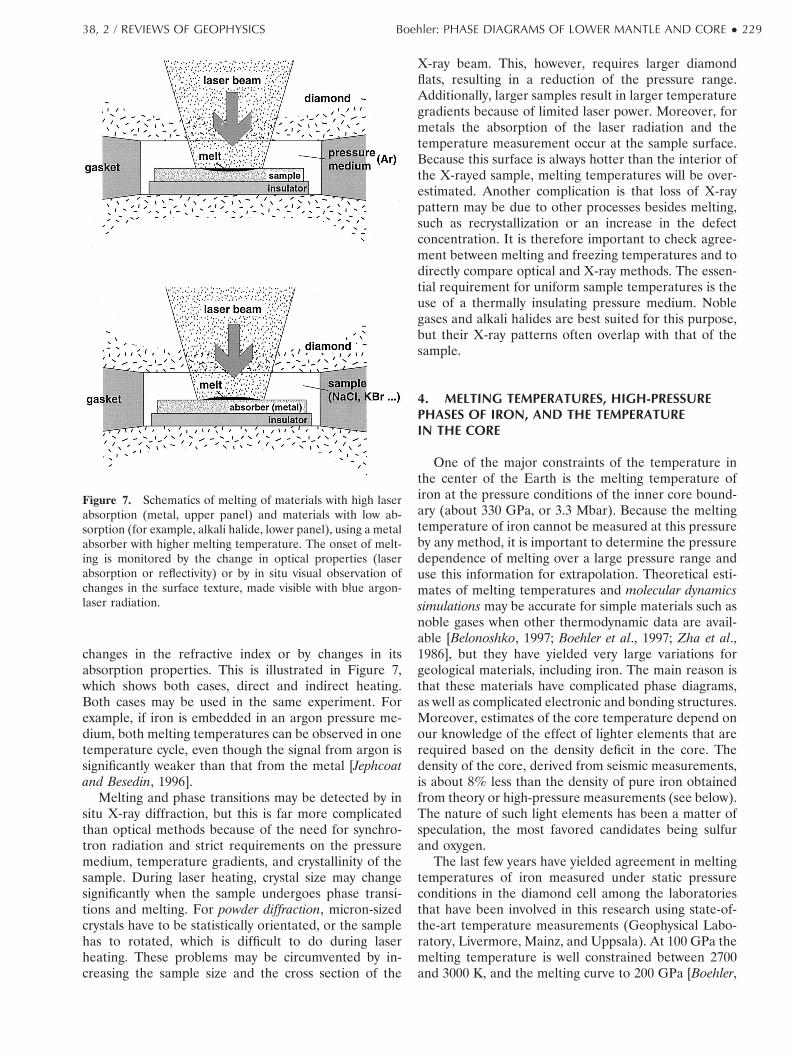
changes in the refractive index or by changes in itsabsorption properties. This is illustrated in Figure 7,which shows both cases, direct and indirect heating.Both cases may be used in the same experiment. Forexample, if iron is embedded in an argon pressure me-dium, both melting temperatures can be observed in onetemperature cycle, even though the signal from argon issignificantly weaker than that from the metal [Jephcoatand Besedin, 1996].
Melting and phase transitions may be detected by insitu X-ray diffraction, but this is far more complicatedthan optical methods because of the need for synchro-tron radiation and strict requirements on the pressuremedium, temperature gradients, and crystallinity of thesample. During laser heating, crystal size may changesignificantly when the sample undergoes phase transi-tions and melting. For powder diffraction, micron-sizedcrystals have to be statistically orientated, or the samplehas to rotated, which is difficult to do during laserheating. These problems may be circumvented by in-creasing the sample size and the cross section of the
X-ray beam. This, however, requires larger diamondflats, resulting in a reduction of the pressure range.Additionally, larger samples result in larger temperaturegradients because of limited laser power. Moreover, formetals the absorption of the laser radiation and thetemperature measurement occur at the sample surface.Because this surface is always hotter than the interior ofthe X-rayed sample, melting temperatures will be over-estimated. Another complication is that loss of X-raypattern may be due to other processes besides melting,such as recrystallization or an increase in the defectconcentration. It is therefore important to check agree-ment between melting and freezing temperatures and todirectly compare optical and X-ray methods. The essen-tial requirement for uniform sample temperatures is theuse of a thermally insulating pressure medium. Noblegases and alkali halides are best suited for this purpose,but their X-ray patterns often overlap with that of thesample.
4. MELTING TEMPERATURES, HIGH-PRESSUREPHASES OF IRON, AND THE TEMPERATUREIN THE CORE
One of the major constraints of the temperature inthe center of the Earth is the melting temperature ofiron at the pressure conditions of the inner core bound-ary (about 330 GPa, or 3.3 Mbar). Because the meltingtemperature of iron cannot be measured at this pressureby any method, it is important to determine the pressuredependence of melting over a large pressure range anduse this information for extrapolation. Theoretical esti-mates of melting temperatures and molecular dynamicssimulations may be accurate for simple materials such asnoble gases when other thermodynamic data are avail-able [Belonoshko, 1997; Boehler et al., 1997; Zha et al.,1986], but they have yielded very large variations forgeological materials, including iron. The main reason isthat these materials have complicated phase diagrams,as well as complicated electronic and bonding structures.Moreover, estimates of the core temperature depend onour knowledge of the effect of lighter elements that arerequired based on the density deficit in the core. Thedensity of the core, derived from seismic measurements,is about 8% less than the density of pure iron obtainedfrom theory or high-pressure measurements (see below).The nature of such light elements has been a matter ofspeculation, the most favored candidates being sulfurand oxygen.
The last few years have yielded agreement in meltingtemperatures of iron measured under static pressureconditions in the diamond cell among the laboratoriesthat have been involved in this research using state-of-the-art temperature measurements (Geophysical Labo-ratory, Livermore, Mainz, and Uppsala). At 100 GPa themelting temperature is well constrained between 2700and 3000 K, and the melting curve to 200 GPa [Boehler,
Figure 7. Schematics of melting of materials with high laserabsorption (metal, upper panel) and materials with low ab-sorption (for example, alkali halide, lower panel), using a metalabsorber with higher melting temperature. The onset of melt-ing is monitored by the change in optical properties (laserabsorption or reflectivity) or by in situ visual observation ofchanges in the surface texture, made visible with blue argon-laser radiation.
38, 2 / REVIEWS OF GEOPHYSICS Boehler: PHASE DIAGRAMS OF LOWER MANTLE AND CORE ● 229

1993] was measured using the same state-of-the-artmethods. A variety of detection methods have beenused: direct visual observation of motion during melting,change in sample reflectivity, discontinuity in the laserpower–temperature function, melt-related changes onthe sample surface, and loss of X-ray diffraction lines.Figure 8 shows the pressure and temperature range inwhich melting of iron has been measured in the diamondcell by these groups. The band in Figure 8 representingthe melting curve is taken from Boehler’s [1993] mea-surements to 200 GPa, which shows an uncertainty ofabout 6200 K at the highest pressures. This band coversall data from all other recent studies taken up to 150GPa [Saxena et al., 1994; Shen et al., 1998; Yoo et al.,1992, 1996]. The temperature uncertainties also includecorrections due to the wavelength dependence of theemissivity of the order of 200 K [Boehler, 1993; Saxena etal., 1994]. One single data point from recent X-raymeasurements to 75 GPa [Shen et al., 1998] falls 100–200K outside this band, but this could be easily explained bytemperature gradients, which cause an overestimate inthe melting temperature, as described earlier. Newshock sound velocity measurements on preheated ironyield a melting temperature at 71 GPa that is also inexcellent agreement with the static data [Ahrens et al.,2000].
Figure 8 also shows the solid phase diagram of iron.There is consensus below 50 GPa on the phase bound-
aries between a (bcc), g (fcc), d (bcc), and ε (hcp). Thereis, however, considerable variation in the maximum sta-bility pressure of g-iron and therefore the location of theg-ε-liquid triple point. Knowledge of its location is im-portant because it is the starting point of the mostimportant branch of the iron melting curve, used forextrapolation to inner core pressures. This triple pointhas been subject to much debate before intensive inves-tigation of the iron phase diagram placed it between 50and 100 GPa. For example, estimates on its location in1986 ranged from 75 GPa [Boehler, 1986] to 280 GPa[Anderson, 1986]. Recent X-ray studies [Shen et al., 1998]place this triple point near 60 GPa and 2700 K, but thenew shock data on preheated iron [Ahrens et al., 2000]reveal no evidence of this phase change up to 71 GPa.New X-ray diffraction work on the g-ε transition[Dubrovinsky et al., 1998] also suggests a higher pressureof this triple point than that reported by Shen et al.Placing this triple point somewhere between 70 and 100GPa is in agreement with the melting curve shown inFigure 8.
4.1. Is There a New High-Pressure Phase of Iron?Geophysical, theoretical, and experimental issues are
associated with this question. Knowledge of the struc-ture of solid iron in the inner core is required for theinterpretation of the seismically observed anisotropy andthe inner core transition zone [Song and Helmberger,
Figure 8. Phase diagram of iron from diamond cell experiments. The melting band (darker shading)contains data to 40 GPa [Yoo et al., 1992], 50 GPa [Yoo et al., 1996], 75 GPa [Shen et al., 1998] (except theirhighest-pressure data point), 150 GPa [Saxena et al., 1994], and 200 GPa [Boehler, 1993], including a new shockmelting point of preheated iron at 71 GPa (triangle) [Ahrens et al., 2000] and the latest measurements (dots)using modified techniques (see text). The location of the g-ε phase boundary (lighter shading) showssignificant uncertainty. The existence of a new high pressure (b) is still under debate.
230 ● Boehler: PHASE DIAGRAMS OF LOWER MANTLE AND CORE 38, 2 / REVIEWS OF GEOPHYSICS

1998], and in free energy calculations in order to esti-mate the energy release upon the freezing at the innercore boundary [Anderson, 1993]. The importance ofthese issues may be debated because anisotropy in thecore may have a number of reasons, and energy differ-ences of close-packed high-pressure phases of iron maybe insignificant, but knowledge of the structure is cer-tainly important in molecular dynamics simulations.
Whether or not there is another high-pressure phaseof iron is important, however, for the interpretation ofshock data. The termination of the g phase below 100GPa requires a new phase [Boehler, 1986] in order toreconcile the solid-solid transition observed at 200 GPaby shock-velocity measurements [Brown and McQueen,1986] (see below). Indeed, changes in the optical prop-erties of iron observed in laser-heated diamond cellexperiments suggested such a transition [Boehler, 1993;Saxena et al., 1993]. Further X-ray studies, however,were controversial, showing transformations from ε-iron(hcp) to an orthorhombic phase [Andrault et al., 1997],or to dhcp [Saxena et al., 1996a; Yoo et al., 1996], or, ina more recent study no transition, indicating that hcpiron is the stable phase [Shen et al., 1998]. The reason forthis discrepancy is not yet clear, but in addition todifferences in the heating techniques and X-ray detec-tion methods used in these studies, there may be anadditional error source: Both the observed distortionfrom hcp to orthorhombic and a change in stackingorder hcp 3 dhcp are only very minor structuralchanges. In all these experiments solid, high-strengthpressure media were used, and there is a strong possi-bility that the observed phase transitions are due tononhydrostatic stresses. In any case, it is important topoint out that both results, phase transition or not,present a serious problem in the interpretation of theshock transition found at 200 GPa, as explained in thenext section.
4.2. Shock Melting of IronShock wave experiments are the only way to achieve
the pressure and temperature conditions of the innercore boundary. These experiments yield accurate pres-sure-density relationships along a nearly isentropic pres-sure-temperature path (Hugoniot). The measurement ofmelting has several problems. First, Hugoniot tempera-tures rise more rapidly than the melting temperature:For iron, at present, it is not clear at exactly whatpressure the Hugoniot crosses the melting curve (seebelow). Indications for melting are (1) discontinuities inthe measured volumes (extremely small, but they havebeen reported [Anderson and Duba, 1997]), (2) discon-tinuities in temperatures [Williams et al., 1987; Yoo et al.,1993], or (3) discontinuities in sound velocities [Ahrens etal., 2000; Brown and McQueen, 1986; Nguyen andHolmes, 1998]. The estimate of the melting temperatureat 330 GPa then requires an extrapolation using a Lin-demann melting relation [Anderson and Duba, 1997] orother empirical melting relations, as, for example, a
linear extrapolation of the melting temperature versusvolume [Kraut and Kennedy, 1966]. The second difficultyin shock experiments is the determination of the tem-perature. Thermodynamic calculations [Boness andBrown, 1990; Brown and McQueen, 1986] depend onestimates on the specific heat and Gruneisen parameter,which for iron lead to uncertainties of the order of 6500K. Direct temperature measurements are subject tolarge uncertainties due to the small timescale and theunknown thermal and optical properties of the windowmaterial through which the iron surface is observed.Thermal conduction changes this surface temperature ina complicated time-dependent way [Gallagher et al.,1993; Yoo et al., 1993], resulting in temperature correc-tions of the order of 1000 K. Other issues are overshootof the melting temperature due to the small timescale inshock experiments and the exact estimate of the meltingpressure, both of which will be discussed below.
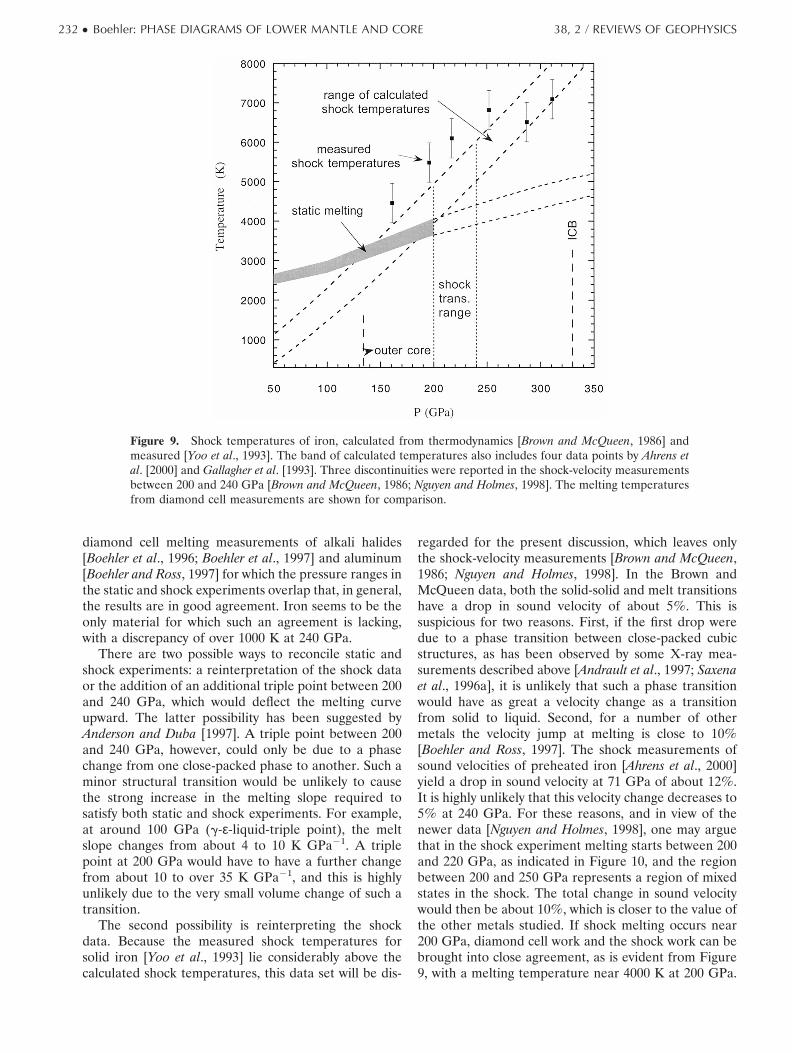
Five data sets exist on shock melting of iron [Ahrens etal., 2000; Brown and McQueen, 1986; Nguyen andHolmes, 1998; Williams et al., 1987; Yoo et al., 1993].Brown and McQueen [1986] measured sound velocitiesup to 400 GPa and observed two discontinuities, one at200 GPa, interpreted as the ε-g transition, and one at thetransition to liquid iron at 240 GPa. Hugoniot temper-atures were calculated, and the range of estimates isshown in Figure 9. Subsequent direct temperature mea-surements [Williams et al., 1987] have recently beencorrected downward in temperature, and the number ofdata points has been reduced to four [Ahrens et al., 2000;Gallagher et al., 1993], all of which lie on a straight linewithin the Hugoniot temperatures calculated by Brownand McQueen. These four data points give no indicationof any phase transition, and they are not plotted inFigure 9, for simplification. The second data set onmeasured shock temperatures [Yoo et al., 1993] showsdiscontinuous behavior above about 250 GPa, which hasbeen interpreted as being due to melting. However,below melting, the data lie over 1000 K above the cal-culated Hugoniot temperatures. Recently, new soundvelocity data of iron between about 190 and 320 GPahave been reported [Nguyen and Holmes, 1998]. Thesedata, in contrast to the Brown and McQueen data, showonly one drop in sound velocity (a total of about 12%from solid to liquid), starting at 220 GPa. No solid-solidtransition was observed. This difference is under debate,different sample purities being a possible cause. In sum-mary, the exact pressure temperature at which iron meltsduring shock compression is uncertain.
The role of overshoot of the melting curve in shockexperiments also is not clear: Although overshoot ofabout 1000 K has been observed in a number of exper-iments on silicates and alkali halides [Boness and Brown,1993; Lyzenga et al., 1983], recent shock measurementsof sound velocities of preheated iron [Ahrens et al., 2000]do not show such an overshoot, and the estimated melt-ing temperature at 71 GPa is in excellent agreement withthe static data. Moreover, it has been shown in recent
38, 2 / REVIEWS OF GEOPHYSICS Boehler: PHASE DIAGRAMS OF LOWER MANTLE AND CORE ● 231
diamond cell melting measurements of alkali halides[Boehler et al., 1996; Boehler et al., 1997] and aluminum[Boehler and Ross, 1997] for which the pressure ranges inthe static and shock experiments overlap that, in general,the results are in good agreement. Iron seems to be theonly material for which such an agreement is lacking,with a discrepancy of over 1000 K at 240 GPa.
There are two possible ways to reconcile static andshock experiments: a reinterpretation of the shock dataor the addition of an additional triple point between 200and 240 GPa, which would deflect the melting curveupward. The latter possibility has been suggested byAnderson and Duba [1997]. A triple point between 200and 240 GPa, however, could only be due to a phasechange from one close-packed phase to another. Such aminor structural transition would be unlikely to causethe strong increase in the melting slope required tosatisfy both static and shock experiments. For example,at around 100 GPa (g-ε-liquid-triple point), the meltslope changes from about 4 to 10 K GPa21. A triplepoint at 200 GPa would have to have a further changefrom about 10 to over 35 K GPa21, and this is highlyunlikely due to the very small volume change of such atransition.
The second possibility is reinterpreting the shockdata. Because the measured shock temperatures forsolid iron [Yoo et al., 1993] lie considerably above thecalculated shock temperatures, this data set will be dis-
regarded for the present discussion, which leaves onlythe shock-velocity measurements [Brown and McQueen,1986; Nguyen and Holmes, 1998]. In the Brown andMcQueen data, both the solid-solid and melt transitionshave a drop in sound velocity of about 5%. This issuspicious for two reasons. First, if the first drop weredue to a phase transition between close-packed cubicstructures, as has been observed by some X-ray mea-surements described above [Andrault et al., 1997; Saxenaet al., 1996a], it is unlikely that such a phase transitionwould have as great a velocity change as a transitionfrom solid to liquid. Second, for a number of othermetals the velocity jump at melting is close to 10%[Boehler and Ross, 1997]. The shock measurements ofsound velocities of preheated iron [Ahrens et al., 2000]yield a drop in sound velocity at 71 GPa of about 12%.It is highly unlikely that this velocity change decreases to5% at 240 GPa. For these reasons, and in view of thenewer data [Nguyen and Holmes, 1998], one may arguethat in the shock experiment melting starts between 200and 220 GPa, as indicated in Figure 10, and the regionbetween 200 and 250 GPa represents a region of mixedstates in the shock. The total change in sound velocitywould then be about 10%, which is closer to the value ofthe other metals studied. If shock melting occurs near200 GPa, diamond cell work and the shock work can bebrought into close agreement, as is evident from Figure9, with a melting temperature near 4000 K at 200 GPa.
Figure 9. Shock temperatures of iron, calculated from thermodynamics [Brown and McQueen, 1986] andmeasured [Yoo et al., 1993]. The band of calculated temperatures also includes four data points by Ahrens etal. [2000] and Gallagher et al. [1993]. Three discontinuities were reported in the shock-velocity measurementsbetween 200 and 240 GPa [Brown and McQueen, 1986; Nguyen and Holmes, 1998]. The melting temperaturesfrom diamond cell measurements are shown for comparison.
232 ● Boehler: PHASE DIAGRAMS OF LOWER MANTLE AND CORE 38, 2 / REVIEWS OF GEOPHYSICS

4.3. Temperature at the Inner Core Boundary (330GPa): Extrapolation of the Iron Melting Curve
There is a very good consensus in all recent ironmelting experiments [Ahrens et al., 2000; Boehler, 1993;Saxena et al., 1994; Shen et al., 1998; Yoo et al., 1992] thatthe upper bound of the melting temperature at 100 GPais 3000 K. Using this temperature as a starting pointyields significantly different melting temperatures at 330GPa if static or shock data are used. A case can be made,however, for the static data to 200 GPa [Boehler, 1993] ifone assumes that a Lindemann equation adequatelydescribes melting behavior at high pressure. This equa-tion can be expressed as
d ln Tm
d ln r5 2~g 2
13!, (2)
where Tm is the melting temperature, r is the density, and g isthe Gruneisen parameter. For many materials this equationhas been shown to well describe melting at high pressure,but it should still be applied with caution to pre- dict andextrapolate melting data because in many other cases it hasproved inadequate. Moreover, the value of g at the pres-sure and temperature conditions of the Earth’s interior isnot known well enough to derive melting temperatures.
As an approximation, the density dependence of gmay be written as
g
g05 Sr0
r Dq
, (3)
or gr 5 const, for q 5 1. Subscript zero is for zeropressure. Measurements of the pressure dependence ofg for a large class of materials have shown that q clusters
around 1 [Boehler and Ramakrishnan, 1980], with an un-certainty of about 30%. However, g is temperature depen-dent and changes across phase transitions [Ramakrishnanet al., 1979], and q seems to decrease with pressure [Boehlerand Young, 1984]. Using (3) with g0 5 2.44 for liquid iron[Stevenson, 1981] yields g 5 1.5 at 150 GPa (at about 40%compression). This agrees with a value of 1.6 6 0.3 ob-tained from new shock results on preheated iron at 71 GPa[Ahrens et al., 2000] and with the theoretical estimate of1.7 6 0.3 at 150 GPa by Stevenson [1981]. Thus values of gfor iron for core pressures most likely range between about1.4 and 1.7. The melting curve measured in the diamondcell between 100 and 200 GPa results in an average value ofg 5 1.45 6 0.3 using (2). In contrast, connecting amelting line between the well-accepted melting temper-ature at 100 GPa of 3000 K to Brown and McQueen’s[1986] 5500 K at 240 GPa yields a high value of g 5 2.2.
The static results between 100 and 200 GPa may alsobe extrapolated using an empirically derived linear rela-tionship between the melting temperature and the den-sity [Kraut and Kennedy, 1966]. Both relationships yield amelting temperature at 330 GPa of 4850 6 200 K[Boehler, 1993], about 1000 K lower than when usingBrown and McQueen’s [1986] shock data.
In summary, it is difficult to reconcile estimated melt-ing temperatures of iron at the inner core boundaryfrom static and shock melting experiments unless highvalues of the Gruneisen parameter or an additionaltriple point with a very large change in the melting slopeare assumed. The best solution to reconcile both datasets is to put the shock melting pressure at 200 instead of240 GPa with a melting temperature near 4000 K. Extrap-
Figure 10. Shock sound velocity data [Brown and McQueen, 1986] using explosives (solid symbols) and atwo-stage gas gun (open symbols). If the onset of melting is at 200 GPa instead of the reported 240 GPa, staticand shock melting of iron can be brought into agreement.
38, 2 / REVIEWS OF GEOPHYSICS Boehler: PHASE DIAGRAMS OF LOWER MANTLE AND CORE ● 233
olation of the melting curve between 100 and 200 GPa tothe inner core boundary pressure (330 GPa) using a linearpressure-melting temperature relationship, a Linde-mann or a Kraut-Kennedy relationship yields a meltingtemperature of pure iron in the vicinity of 5000 K.
4.4. Light Elements and the Density Deficitin the Core
A certain amount of light elements is needed in theouter core in order to match sound velocities or densitiesestimated for iron at outer core pressures with thosederived from seismic data. The effect of Ni on thedensity of iron is negligible [Mao et al., 1990]. The keyissues under debate are their nature, their amount, andtheir effect on the melting temperature of pure iron. Themain constraints on the nature of these elements arecosmochemical abundance and relative volatility, andthey have to be able to partition into iron during coreformation. It is possible that several light elements areinvolved, which complicates the problem. A largeamount of work on this subject has been published,providing cosmochemical constraints [e.g., Dreibus andPalme, 1996], experimental constraints on solubility ofcandidate light elements at low pressure [O’Neill et al.,1998] and high pressure [Hillgren and Boehler, 1998,2000], and constraints from the density deficit in the core
[Poirier, 1994; Stevenson, 1981]. The most likely candi-dates are oxygen, sulfur, silicon, carbon, and hydrogen,but there is still a large uncertainty in any prediction.
The exact amount and nature of light elements requiredare not known because of uncertainties in both the seismi-cally derived core density and the density of pure liquidiron at the pressure and temperature conditions of thecore. The density of iron can be derived from the roomtemperature compression data measured to 300 GPa [Maoet al., 1990] and the thermal expansion coefficient a. Thepressure dependence of a may be expressed as
a
a05 S V
V0D n
, (4)
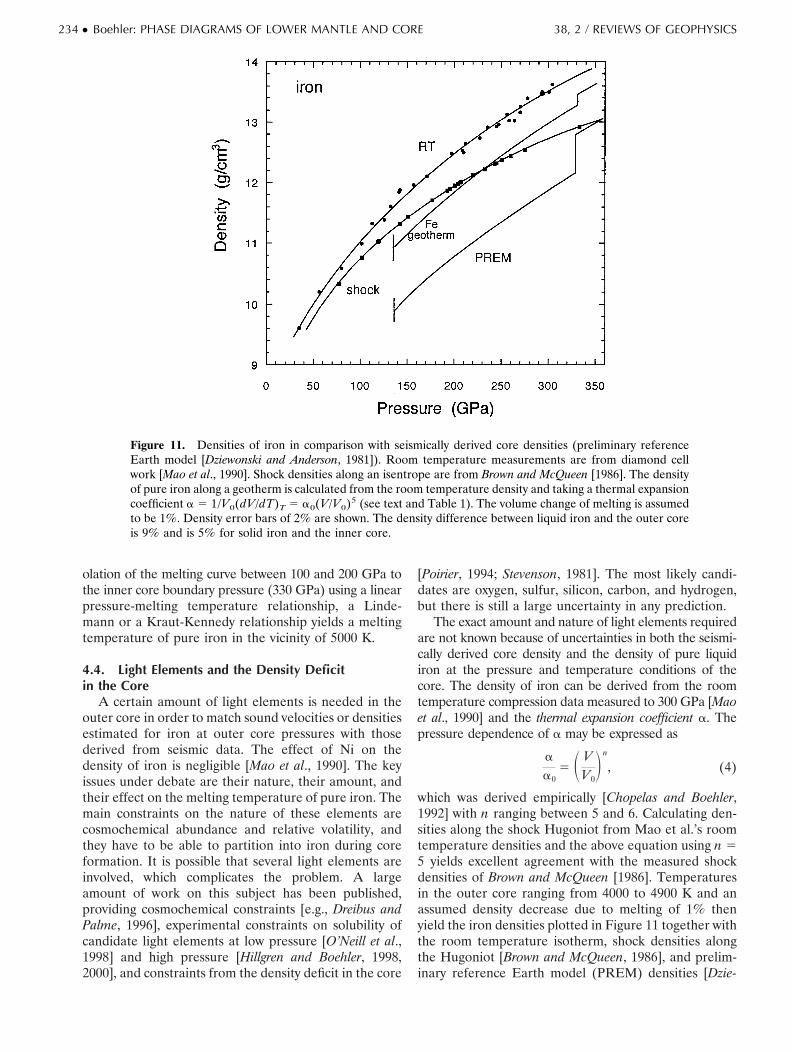
which was derived empirically [Chopelas and Boehler,1992] with n ranging between 5 and 6. Calculating den-sities along the shock Hugoniot from Mao et al.’s roomtemperature densities and the above equation using n 55 yields excellent agreement with the measured shockdensities of Brown and McQueen [1986]. Temperaturesin the outer core ranging from 4000 to 4900 K and anassumed density decrease due to melting of 1% thenyield the iron densities plotted in Figure 11 together withthe room temperature isotherm, shock densities alongthe Hugoniot [Brown and McQueen, 1986], and prelim-inary reference Earth model (PREM) densities [Dzie-
Figure 11. Densities of iron in comparison with seismically derived core densities (preliminary referenceEarth model [Dziewonski and Anderson, 1981]). Room temperature measurements are from diamond cellwork [Mao et al., 1990]. Shock densities along an isentrope are from Brown and McQueen [1986]. The densityof pure iron along a geotherm is calculated from the room temperature density and taking a thermal expansioncoefficient a 5 1/V0(dV/dT)T 5 a0(V/V0)5 (see text and Table 1). The volume change of melting is assumedto be 1%. Density error bars of 2% are shown. The density difference between liquid iron and the outer coreis 9% and is 5% for solid iron and the inner core.
234 ● Boehler: PHASE DIAGRAMS OF LOWER MANTLE AND CORE 38, 2 / REVIEWS OF GEOPHYSICS
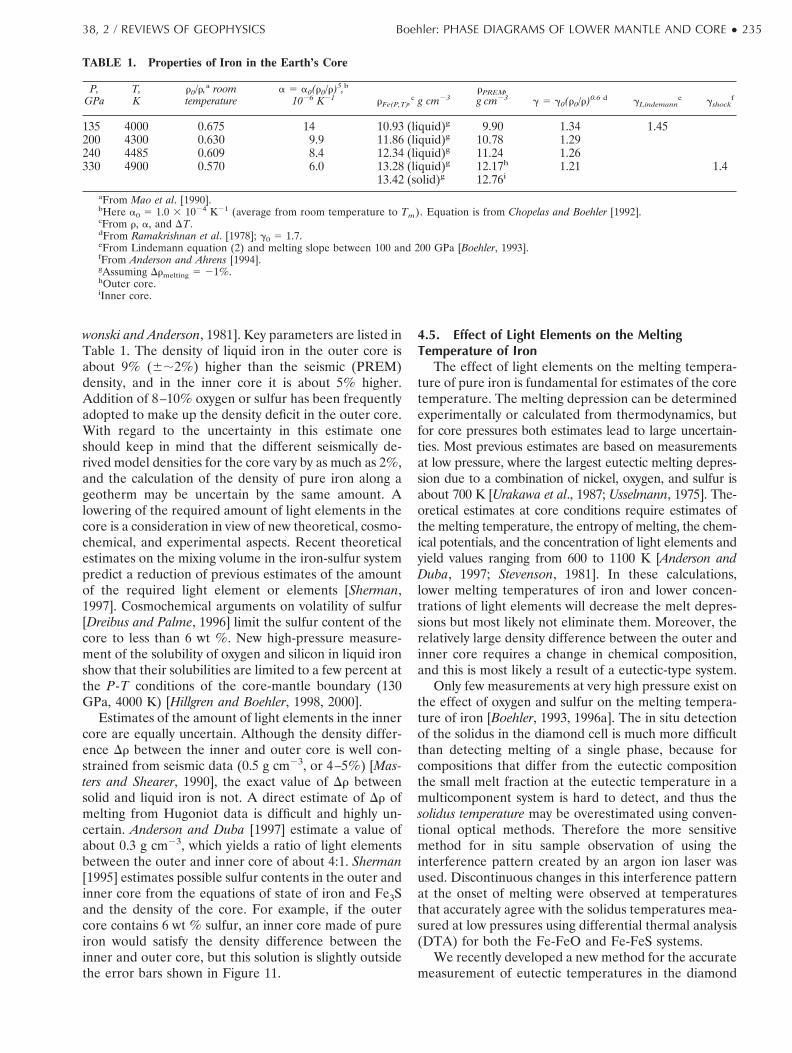
wonski and Anderson, 1981]. Key parameters are listed inTable 1. The density of liquid iron in the outer core isabout 9% (6;2%) higher than the seismic (PREM)density, and in the inner core it is about 5% higher.Addition of 8–10% oxygen or sulfur has been frequentlyadopted to make up the density deficit in the outer core.With regard to the uncertainty in this estimate oneshould keep in mind that the different seismically de-rived model densities for the core vary by as much as 2%,and the calculation of the density of pure iron along ageotherm may be uncertain by the same amount. Alowering of the required amount of light elements in thecore is a consideration in view of new theoretical, cosmo-chemical, and experimental aspects. Recent theoreticalestimates on the mixing volume in the iron-sulfur systempredict a reduction of previous estimates of the amountof the required light element or elements [Sherman,1997]. Cosmochemical arguments on volatility of sulfur[Dreibus and Palme, 1996] limit the sulfur content of thecore to less than 6 wt %. New high-pressure measure-ment of the solubility of oxygen and silicon in liquid ironshow that their solubilities are limited to a few percent atthe P-T conditions of the core-mantle boundary (130GPa, 4000 K) [Hillgren and Boehler, 1998, 2000].
Estimates of the amount of light elements in the innercore are equally uncertain. Although the density differ-ence Dr between the inner and outer core is well con-strained from seismic data (0.5 g cm23, or 4–5%) [Mas-ters and Shearer, 1990], the exact value of Dr betweensolid and liquid iron is not. A direct estimate of Dr ofmelting from Hugoniot data is difficult and highly un-certain. Anderson and Duba [1997] estimate a value ofabout 0.3 g cm23, which yields a ratio of light elementsbetween the outer and inner core of about 4:1. Sherman[1995] estimates possible sulfur contents in the outer andinner core from the equations of state of iron and Fe3Sand the density of the core. For example, if the outercore contains 6 wt % sulfur, an inner core made of pureiron would satisfy the density difference between theinner and outer core, but this solution is slightly outsidethe error bars shown in Figure 11.
4.5. Effect of Light Elements on the MeltingTemperature of Iron
The effect of light elements on the melting tempera-ture of pure iron is fundamental for estimates of the coretemperature. The melting depression can be determinedexperimentally or calculated from thermodynamics, butfor core pressures both estimates lead to large uncertain-ties. Most previous estimates are based on measurementsat low pressure, where the largest eutectic melting depres-sion due to a combination of nickel, oxygen, and sulfur isabout 700 K [Urakawa et al., 1987; Usselmann, 1975]. The-oretical estimates at core conditions require estimates ofthe melting temperature, the entropy of melting, the chem-ical potentials, and the concentration of light elements andyield values ranging from 600 to 1100 K [Anderson andDuba, 1997; Stevenson, 1981]. In these calculations,lower melting temperatures of iron and lower concen-trations of light elements will decrease the melt depres-sions but most likely not eliminate them. Moreover, therelatively large density difference between the outer andinner core requires a change in chemical composition,and this is most likely a result of a eutectic-type system.
Only few measurements at very high pressure exist onthe effect of oxygen and sulfur on the melting tempera-ture of iron [Boehler, 1993, 1996a]. The in situ detectionof the solidus in the diamond cell is much more difficultthan detecting melting of a single phase, because forcompositions that differ from the eutectic compositionthe small melt fraction at the eutectic temperature in amulticomponent system is hard to detect, and thus thesolidus temperature may be overestimated using conven-tional optical methods. Therefore the more sensitivemethod for in situ sample observation of using theinterference pattern created by an argon ion laser wasused. Discontinuous changes in this interference patternat the onset of melting were observed at temperaturesthat accurately agree with the solidus temperatures mea-sured at low pressures using differential thermal analysis(DTA) for both the Fe-FeO and Fe-FeS systems.
We recently developed a new method for the accuratemeasurement of eutectic temperatures in the diamond
TABLE 1. Properties of Iron in the Earth’s Core
P,GPa
T,K
r0/r,a roomtemperature
a 5 a0(r0/r)5,b
1026 K21 rFe(P,T),c g cm23
rPREM,g cm23 g 5 g0(r0/r)0.6 d gLindemann
e gshockf
135 4000 0.675 14 10.93 (liquid)g 9.90 1.34 1.45200 4300 0.630 9.9 11.86 (liquid)g 10.78 1.29240 4485 0.609 8.4 12.34 (liquid)g 11.24 1.26330 4900 0.570 6.0 13.28 (liquid)g 12.17h 1.21 1.4
13.42 (solid)g 12.76i
aFrom Mao et al. [1990].bHere a0 5 1.0 3 1024 K21 (average from room temperature to Tm). Equation is from Chopelas and Boehler [1992].cFrom r, a, and DT.dFrom Ramakrishnan et al. [1978]; g0 5 1.7.eFrom Lindemann equation (2) and melting slope between 100 and 200 GPa [Boehler, 1993].fFrom Anderson and Ahrens [1994].gAssuming Drmelting 5 21%.hOuter core.iInner core.
38, 2 / REVIEWS OF GEOPHYSICS Boehler: PHASE DIAGRAMS OF LOWER MANTLE AND CORE ● 235
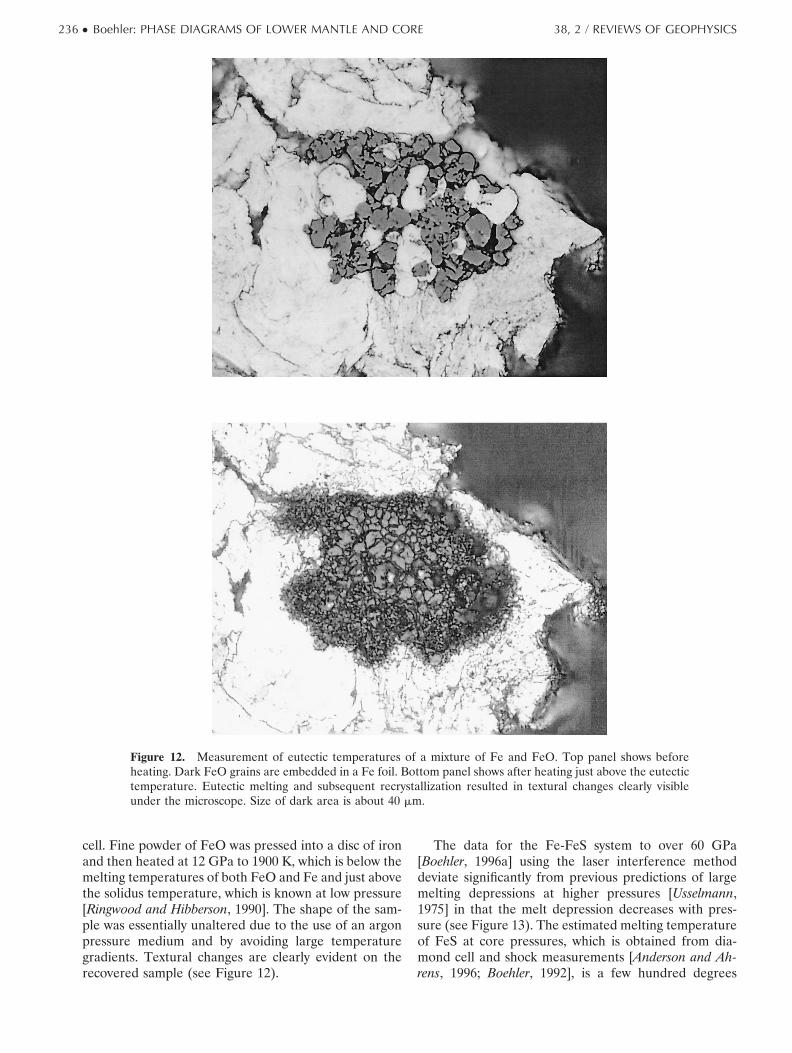
cell. Fine powder of FeO was pressed into a disc of ironand then heated at 12 GPa to 1900 K, which is below themelting temperatures of both FeO and Fe and just abovethe solidus temperature, which is known at low pressure[Ringwood and Hibberson, 1990]. The shape of the sam-ple was essentially unaltered due to the use of an argonpressure medium and by avoiding large temperaturegradients. Textural changes are clearly evident on therecovered sample (see Figure 12).
The data for the Fe-FeS system to over 60 GPa[Boehler, 1996a] using the laser interference methoddeviate significantly from previous predictions of largemelting depressions at higher pressures [Usselmann,1975] in that the melt depression decreases with pres-sure (see Figure 13). The estimated melting temperatureof FeS at core pressures, which is obtained from dia-mond cell and shock measurements [Anderson and Ah-rens, 1996; Boehler, 1992], is a few hundred degrees
Figure 12. Measurement of eutectic temperatures of a mixture of Fe and FeO. Top panel shows beforeheating. Dark FeO grains are embedded in a Fe foil. Bottom panel shows after heating just above the eutectictemperature. Eutectic melting and subsequent recrystallization resulted in textural changes clearly visibleunder the microscope. Size of dark area is about 40 mm.
236 ● Boehler: PHASE DIAGRAMS OF LOWER MANTLE AND CORE 38, 2 / REVIEWS OF GEOPHYSICS
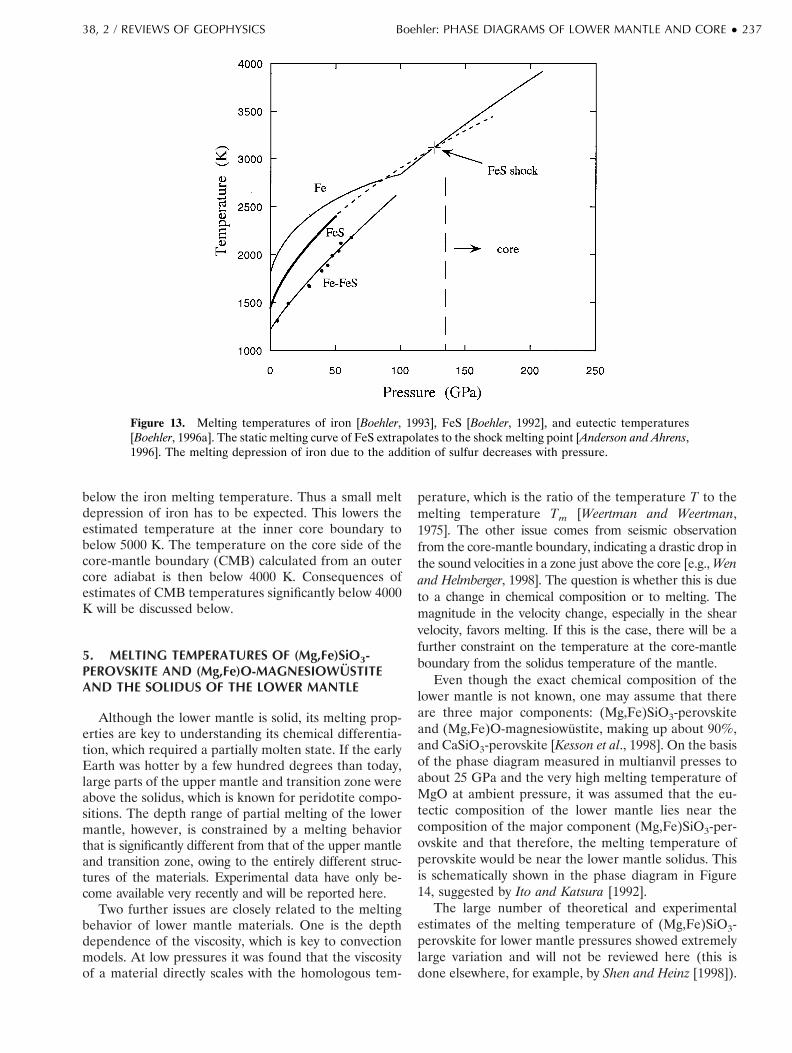
below the iron melting temperature. Thus a small meltdepression of iron has to be expected. This lowers theestimated temperature at the inner core boundary tobelow 5000 K. The temperature on the core side of thecore-mantle boundary (CMB) calculated from an outercore adiabat is then below 4000 K. Consequences ofestimates of CMB temperatures significantly below 4000K will be discussed below.
5. MELTING TEMPERATURES OF (Mg,Fe)SiO3-PEROVSKITE AND (Mg,Fe)O-MAGNESIOWUSTITEAND THE SOLIDUS OF THE LOWER MANTLE
Although the lower mantle is solid, its melting prop-erties are key to understanding its chemical differentia-tion, which required a partially molten state. If the earlyEarth was hotter by a few hundred degrees than today,large parts of the upper mantle and transition zone wereabove the solidus, which is known for peridotite compo-sitions. The depth range of partial melting of the lowermantle, however, is constrained by a melting behaviorthat is significantly different from that of the upper mantleand transition zone, owing to the entirely different struc-tures of the materials. Experimental data have only be-come available very recently and will be reported here.
Two further issues are closely related to the meltingbehavior of lower mantle materials. One is the depthdependence of the viscosity, which is key to convectionmodels. At low pressures it was found that the viscosityof a material directly scales with the homologous tem-
perature, which is the ratio of the temperature T to themelting temperature Tm [Weertman and Weertman,1975]. The other issue comes from seismic observationfrom the core-mantle boundary, indicating a drastic drop inthe sound velocities in a zone just above the core [e.g., Wenand Helmberger, 1998]. The question is whether this is dueto a change in chemical composition or to melting. Themagnitude in the velocity change, especially in the shearvelocity, favors melting. If this is the case, there will be afurther constraint on the temperature at the core-mantleboundary from the solidus temperature of the mantle.
Even though the exact chemical composition of thelower mantle is not known, one may assume that thereare three major components: (Mg,Fe)SiO3-perovskiteand (Mg,Fe)O-magnesiowustite, making up about 90%,and CaSiO3-perovskite [Kesson et al., 1998]. On the basisof the phase diagram measured in multianvil presses toabout 25 GPa and the very high melting temperature ofMgO at ambient pressure, it was assumed that the eu-tectic composition of the lower mantle lies near thecomposition of the major component (Mg,Fe)SiO3-per-ovskite and that therefore, the melting temperature ofperovskite would be near the lower mantle solidus. Thisis schematically shown in the phase diagram in Figure14, suggested by Ito and Katsura [1992].
The large number of theoretical and experimentalestimates of the melting temperature of (Mg,Fe)SiO3-perovskite for lower mantle pressures showed extremelylarge variation and will not be reviewed here (this isdone elsewhere, for example, by Shen and Heinz [1998]).
Figure 13. Melting temperatures of iron [Boehler, 1993], FeS [Boehler, 1992], and eutectic temperatures[Boehler, 1996a]. The static melting curve of FeS extrapolates to the shock melting point [Anderson and Ahrens,1996]. The melting depression of iron due to the addition of sulfur decreases with pressure.
38, 2 / REVIEWS OF GEOPHYSICS Boehler: PHASE DIAGRAMS OF LOWER MANTLE AND CORE ● 237
Theoretical estimates are complicated due to the com-plex interatomic bonds and the poorly known thermo-dynamic properties, and the early melting experimentsin the laser-heated diamond cells used unsuitable lasersand inadequate techniques for temperature measure-ment (see above).
New laser-heating techniques for the direct heating ofminerals were developed with three major new features,all of which are key to producing uniform temperatures:(1) the use of CO2 lasers with about 10 times higherpower and a wavelength of about 10 mm, at which
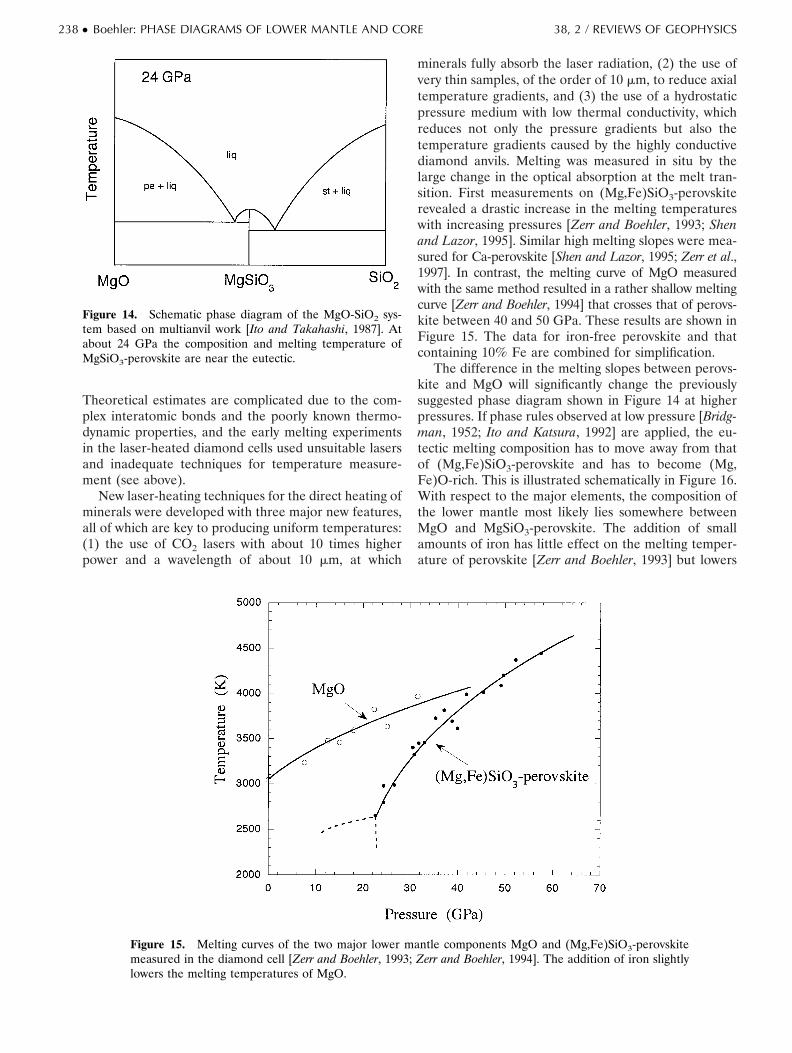
minerals fully absorb the laser radiation, (2) the use ofvery thin samples, of the order of 10 mm, to reduce axialtemperature gradients, and (3) the use of a hydrostaticpressure medium with low thermal conductivity, whichreduces not only the pressure gradients but also thetemperature gradients caused by the highly conductivediamond anvils. Melting was measured in situ by thelarge change in the optical absorption at the melt tran-sition. First measurements on (Mg,Fe)SiO3-perovskiterevealed a drastic increase in the melting temperatureswith increasing pressures [Zerr and Boehler, 1993; Shenand Lazor, 1995]. Similar high melting slopes were mea-sured for Ca-perovskite [Shen and Lazor, 1995; Zerr et al.,1997]. In contrast, the melting curve of MgO measuredwith the same method resulted in a rather shallow meltingcurve [Zerr and Boehler, 1994] that crosses that of perovs-kite between 40 and 50 GPa. These results are shown inFigure 15. The data for iron-free perovskite and thatcontaining 10% Fe are combined for simplification.
The difference in the melting slopes between perovs-kite and MgO will significantly change the previouslysuggested phase diagram shown in Figure 14 at higherpressures. If phase rules observed at low pressure [Bridg-man, 1952; Ito and Katsura, 1992] are applied, the eu-tectic melting composition has to move away from thatof (Mg,Fe)SiO3-perovskite and has to become (Mg,Fe)O-rich. This is illustrated schematically in Figure 16.With respect to the major elements, the composition ofthe lower mantle most likely lies somewhere betweenMgO and MgSiO3-perovskite. The addition of smallamounts of iron has little effect on the melting temper-ature of perovskite [Zerr and Boehler, 1993] but lowers
Figure 14. Schematic phase diagram of the MgO-SiO2 sys-tem based on multianvil work [Ito and Takahashi, 1987]. Atabout 24 GPa the composition and melting temperature ofMgSiO3-perovskite are near the eutectic.
Figure 15. Melting curves of the two major lower mantle components MgO and (Mg,Fe)SiO3-perovskitemeasured in the diamond cell [Zerr and Boehler, 1993; Zerr and Boehler, 1994]. The addition of iron slightlylowers the melting temperatures of MgO.
238 ● Boehler: PHASE DIAGRAMS OF LOWER MANTLE AND CORE 38, 2 / REVIEWS OF GEOPHYSICS
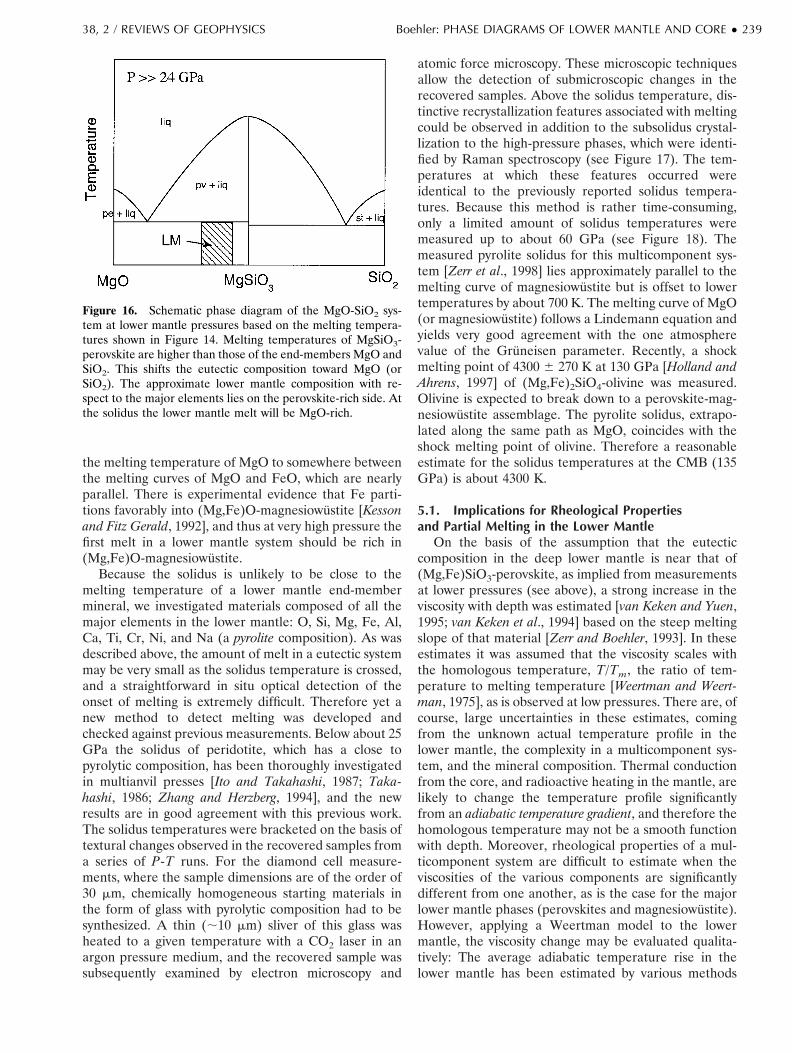
the melting temperature of MgO to somewhere betweenthe melting curves of MgO and FeO, which are nearlyparallel. There is experimental evidence that Fe parti-tions favorably into (Mg,Fe)O-magnesiowustite [Kessonand Fitz Gerald, 1992], and thus at very high pressure thefirst melt in a lower mantle system should be rich in(Mg,Fe)O-magnesiowustite.
Because the solidus is unlikely to be close to themelting temperature of a lower mantle end-membermineral, we investigated materials composed of all themajor elements in the lower mantle: O, Si, Mg, Fe, Al,Ca, Ti, Cr, Ni, and Na (a pyrolite composition). As wasdescribed above, the amount of melt in a eutectic systemmay be very small as the solidus temperature is crossed,and a straightforward in situ optical detection of theonset of melting is extremely difficult. Therefore yet anew method to detect melting was developed andchecked against previous measurements. Below about 25GPa the solidus of peridotite, which has a close topyrolytic composition, has been thoroughly investigatedin multianvil presses [Ito and Takahashi, 1987; Taka-hashi, 1986; Zhang and Herzberg, 1994], and the newresults are in good agreement with this previous work.The solidus temperatures were bracketed on the basis oftextural changes observed in the recovered samples froma series of P-T runs. For the diamond cell measure-ments, where the sample dimensions are of the order of30 mm, chemically homogeneous starting materials inthe form of glass with pyrolytic composition had to besynthesized. A thin (;10 mm) sliver of this glass washeated to a given temperature with a CO2 laser in anargon pressure medium, and the recovered sample wassubsequently examined by electron microscopy and
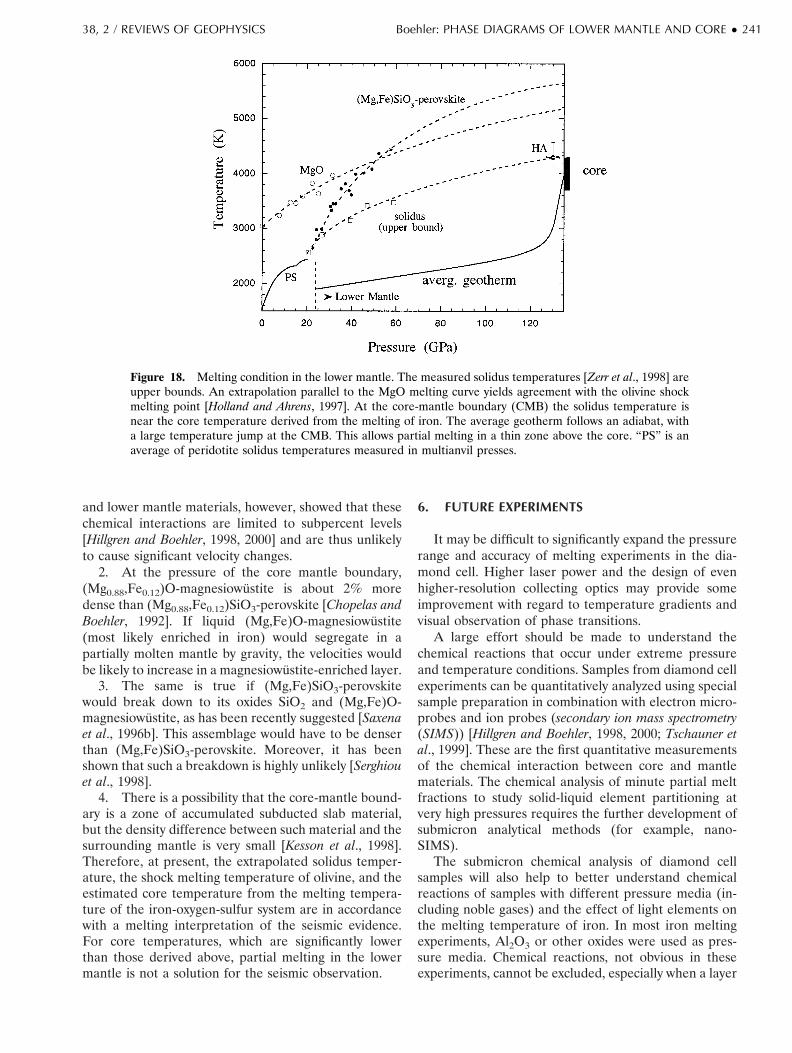
atomic force microscopy. These microscopic techniquesallow the detection of submicroscopic changes in therecovered samples. Above the solidus temperature, dis-tinctive recrystallization features associated with meltingcould be observed in addition to the subsolidus crystal-lization to the high-pressure phases, which were identi-fied by Raman spectroscopy (see Figure 17). The tem-peratures at which these features occurred wereidentical to the previously reported solidus tempera-tures. Because this method is rather time-consuming,only a limited amount of solidus temperatures weremeasured up to about 60 GPa (see Figure 18). Themeasured pyrolite solidus for this multicomponent sys-tem [Zerr et al., 1998] lies approximately parallel to themelting curve of magnesiowustite but is offset to lowertemperatures by about 700 K. The melting curve of MgO(or magnesiowustite) follows a Lindemann equation andyields very good agreement with the one atmospherevalue of the Gruneisen parameter. Recently, a shockmelting point of 4300 6 270 K at 130 GPa [Holland andAhrens, 1997] of (Mg,Fe)2SiO4-olivine was measured.Olivine is expected to break down to a perovskite-mag-nesiowustite assemblage. The pyrolite solidus, extrapo-lated along the same path as MgO, coincides with theshock melting point of olivine. Therefore a reasonableestimate for the solidus temperatures at the CMB (135GPa) is about 4300 K.
5.1. Implications for Rheological Propertiesand Partial Melting in the Lower Mantle
On the basis of the assumption that the eutecticcomposition in the deep lower mantle is near that of(Mg,Fe)SiO3-perovskite, as implied from measurementsat lower pressures (see above), a strong increase in theviscosity with depth was estimated [van Keken and Yuen,1995; van Keken et al., 1994] based on the steep meltingslope of that material [Zerr and Boehler, 1993]. In theseestimates it was assumed that the viscosity scales withthe homologous temperature, T/Tm, the ratio of tem-perature to melting temperature [Weertman and Weert-man, 1975], as is observed at low pressures. There are, ofcourse, large uncertainties in these estimates, comingfrom the unknown actual temperature profile in thelower mantle, the complexity in a multicomponent sys-tem, and the mineral composition. Thermal conductionfrom the core, and radioactive heating in the mantle, arelikely to change the temperature profile significantlyfrom an adiabatic temperature gradient, and therefore thehomologous temperature may not be a smooth functionwith depth. Moreover, rheological properties of a mul-ticomponent system are difficult to estimate when theviscosities of the various components are significantlydifferent from one another, as is the case for the majorlower mantle phases (perovskites and magnesiowustite).However, applying a Weertman model to the lowermantle, the viscosity change may be evaluated qualita-tively: The average adiabatic temperature rise in thelower mantle has been estimated by various methods
Figure 16. Schematic phase diagram of the MgO-SiO2 sys-tem at lower mantle pressures based on the melting tempera-tures shown in Figure 14. Melting temperatures of MgSiO3-perovskite are higher than those of the end-members MgO andSiO2. This shifts the eutectic composition toward MgO (orSiO2). The approximate lower mantle composition with re-spect to the major elements lies on the perovskite-rich side. Atthe solidus the lower mantle melt will be MgO-rich.
38, 2 / REVIEWS OF GEOPHYSICS Boehler: PHASE DIAGRAMS OF LOWER MANTLE AND CORE ● 239

[Boehler, 1982; Brown and Shankland, 1981; Jeanloz andRichter, 1979; Stacey, 1977] and lies between 0.258 and0.38 km21. Even if strong curvature is applied for theextrapolation of the melting curve of (Mg,Fe)SiO3-per-ovskite, the major component of the lower mantle, theaverage melting slope is still at least 3 times higher (seeFigure 18). If the pyrolite solidus temperatures are ex-trapolated to the shock melting point of olivine, theaverage slope of the lower mantle solidus is between 0.58and 0.68 km21, or still about twice the average adiabaticgradient. Thus, because both melting temperatures ofend-member components and eutectic temperatures rel-evant to the lower mantle change more rapidly than theaverage mantle temperature (decrease of the homolo-gous temperature), an increase in the average viscosityin the lower mantle may be expected.
5.2. Partial Melting in the Lower MantleOur solidus temperatures are between 900 and 1600
K above the average lower mantle adiabat (see Figure18). This fact excludes large-scale melting of the lowermantle, except for the case of large impacts. If the Earthcooled in a steady state manner, only a thin layer at thebottom of the lower mantle could have been partiallymolten. In the absence of a thermal boundary layer be-tween upper and lower mantle, the temperature at thetop of the lower mantle, at a depth of 660 km, is 1900 6100 K, obtained from laboratory measurements of the
phase boundary of (Mg,Fe)SiO3-perovskite (see above).At that depth the solidus temperature is 2800 K. At theCMB the extrapolated solidus temperature is about 4300K. This is near the temperature of the outer core at theCMB, as deduced from melting temperature measure-ments on the Fe-O-S system (4000 6 200 K) [Boehler,1996b]. Thus it is possible to have partial melting of themantle at the core-mantle boundary.
Seismic measurements reveal a drastic decrease in theseismic velocities in a thin zone at the CMB (ultra lowvelocity zone) [e.g., Garnero et al., 1993; Revenough andMeyer, 1997; Wen and Helmberger, 1998], especially inthe region of hot spots [Helmberger et al., 1998; Russel etal., 1998]. The magnitude of this velocity change isdifficult to explain other than being due to partial melt-ing. This is a plausible explanation because the temper-ature at the very bottom of the mantle in direct contactwith the core reaches the core temperature of 4000 6200 K, which is close to the mantle solidus. Changes inthe chemical and/or mineral composition, listed below,may also occur at the CMB, but these are unlikely tocause the large drop in the sound velocities that areobserved.
1. It has been suggested that the core mantle bound-ary may be a zone of intensive chemical reaction andthat the lower mantle material may become enriched iniron [Knittle and Jeanloz, 1991]. More recent measure-ments on the chemical interaction between molten iron
Figure 17. Glass sample with a pyrolytic composition heated with a CO2 laser in an argon pressure mediumto 2550 K at 21 GPa (backscattering electron topographic image) [Zerr et al., 1998]. Owing to the temperaturegradient, the outer portion of the sample remains glass. At higher temperatures, toward the center of theheated area, this glass transforms to the high-pressure polymorphs, and at the highest temperatures the samplepartially melts, as is evident from a different type of recrystallization.
240 ● Boehler: PHASE DIAGRAMS OF LOWER MANTLE AND CORE 38, 2 / REVIEWS OF GEOPHYSICS
and lower mantle materials, however, showed that thesechemical interactions are limited to subpercent levels[Hillgren and Boehler, 1998, 2000] and are thus unlikelyto cause significant velocity changes.
2. At the pressure of the core mantle boundary,(Mg0.88,Fe0.12)O-magnesiowustite is about 2% moredense than (Mg0.88,Fe0.12)SiO3-perovskite [Chopelas andBoehler, 1992]. If liquid (Mg,Fe)O-magnesiowustite(most likely enriched in iron) would segregate in apartially molten mantle by gravity, the velocities wouldbe likely to increase in a magnesiowustite-enriched layer.
3. The same is true if (Mg,Fe)SiO3-perovskitewould break down to its oxides SiO2 and (Mg,Fe)O-magnesiowustite, as has been recently suggested [Saxenaet al., 1996b]. This assemblage would have to be denserthan (Mg,Fe)SiO3-perovskite. Moreover, it has beenshown that such a breakdown is highly unlikely [Serghiouet al., 1998].
4. There is a possibility that the core-mantle bound-ary is a zone of accumulated subducted slab material,but the density difference between such material and thesurrounding mantle is very small [Kesson et al., 1998].Therefore, at present, the extrapolated solidus temper-ature, the shock melting temperature of olivine, and theestimated core temperature from the melting tempera-ture of the iron-oxygen-sulfur system are in accordancewith a melting interpretation of the seismic evidence.For core temperatures, which are significantly lowerthan those derived above, partial melting in the lowermantle is not a solution for the seismic observation.
6. FUTURE EXPERIMENTS
It may be difficult to significantly expand the pressurerange and accuracy of melting experiments in the dia-mond cell. Higher laser power and the design of evenhigher-resolution collecting optics may provide someimprovement with regard to temperature gradients andvisual observation of phase transitions.
A large effort should be made to understand thechemical reactions that occur under extreme pressureand temperature conditions. Samples from diamond cellexperiments can be quantitatively analyzed using specialsample preparation in combination with electron micro-probes and ion probes (secondary ion mass spectrometry(SIMS)) [Hillgren and Boehler, 1998, 2000; Tschauner etal., 1999]. These are the first quantitative measurementsof the chemical interaction between core and mantlematerials. The chemical analysis of minute partial meltfractions to study solid-liquid element partitioning atvery high pressures requires the further development ofsubmicron analytical methods (for example, nano-SIMS).
The submicron chemical analysis of diamond cellsamples will also help to better understand chemicalreactions of samples with different pressure media (in-cluding noble gases) and the effect of light elements onthe melting temperature of iron. In most iron meltingexperiments, Al2O3 or other oxides were used as pres-sure media. Chemical reactions, not obvious in theseexperiments, cannot be excluded, especially when a layer
Figure 18. Melting condition in the lower mantle. The measured solidus temperatures [Zerr et al., 1998] areupper bounds. An extrapolation parallel to the MgO melting curve yields agreement with the olivine shockmelting point [Holland and Ahrens, 1997]. At the core-mantle boundary (CMB) the solidus temperature isnear the core temperature derived from the melting of iron. The average geotherm follows an adiabat, witha large temperature jump at the CMB. This allows partial melting in a thin zone above the core. “PS” is anaverage of peridotite solidus temperatures measured in multianvil presses.
38, 2 / REVIEWS OF GEOPHYSICS Boehler: PHASE DIAGRAMS OF LOWER MANTLE AND CORE ● 241

only a few nanometers thick is involved in the meltingprocess at very high pressure. Although melting temper-atures measured in an argon pressure medium agreewith those measured in Al2O3 to pressures of 35 GPa[Boehler et al., 1990], iron samples recovered from pres-sures in the 100-GPa range have to be routinely ana-lyzed.
Shock sound velocity measurements should be con-tinued in order to solve the present uncertainty in theonset of melting of iron. Further shock experiments onpreheated iron would be very useful to check the meltingtemperature and the phase diagram at lower pressures.X-ray measurements on laser-heated iron using modernsynchrotron techniques must be performed in an inert,hydrostatic pressure medium and by minimizing temper-ature gradients in order to solve the present disagree-ment of results.
GLOSSARY
Adiabatic temperature gradient: Temperaturevariation with depth due only to the compression of thematerial. In a convecting system like the Earth’s mantle,assuming constant viscosity and without internal heating,the temperature-depth profile lies along an adiabat[McKenzie et al., 1974] (see Gruneisen parameter).
Charge-coupled device (CCD) detector: A two-di-mensional array of silicon diodes.
Chromatic aberration: Difference in focal length ofa lens at different wavelengths (see Figure 3).
dhcp: Double hexagonally close-packed, similar tohcp with different stacking order.
Dichroic mirrors: Mirrors that reflect only in aspecific wavelength range, for example, are transmissiblefor laser radiation at 1 mm wavelength but reflect visiblelight.
Emissivity: Ratio of the emissive powers of a real(gray) body and an ideal (black) body.
Gruneisen parameter: Frequently used in geophys-ics, shock physics, and theoretical high-temperatureequations of state. Parameter is related to the adiabaticgradient by g 5 KS/T(dT/dP)S 5 aKT/cPr 5 aKT/cVr,where KS and KT are the adiabatic and isothermal bulkmoduli KS,T 5 2V(dP/dV)S,T; a is the thermal expan-sion coefficient a 5 1/V(dV/dT)V; cp and cV are thespecific heats at constant pressure and volume, respec-tively; and r is the density.
hcp: Hexagonally close-packed.Hugoniot: Pressure-volume-temperature relation-
ship during shock compression, material specific (usuallypressure-volume plot).
Lindemann melting relation: Not a melting theorybut relates melting to the amplitude of atomic vibration(see Poirier [1991] for a review).
Molecular dynamics simulation: Computer simula-tions of a large number of interacting particles; yieldsstructural, thermodynamic, and transport properties.
Powder diffraction: X-ray diffraction method usingpolycrystalline samples; yields lattice constants.
Pyrolite: Fictitious model rock with a chemicalcomposition of mainly olivine and orthopyroxene, somecalcic clinopyroxene, and an aluminous phase (e.g., gar-net).
Raman spectroscopy: Scattering of monochromaticlaser light, which produces a spectrum based on thechange in polarizability during atomic vibrations. Thisyields information about the vibrational frequencies in asolid.
Seismic anisotropy: Directional variation of seis-mic velocity.
Secondary ion mass spectrometry (SIMS): Chemi-cal analytical method with high spatial resolution.
Solidus temperature: Temperature at which thefirst melt is produced in a multicomponent system.
Synchrotron radiation: Electromagnetic radiationemitted by electrons or positrons orbiting in a storagering. This radiation results from the centripetal acceler-ation of the electrons by the magnetic fields in the ring.The spectrum contains high-energy X rays with highintensity, useful for X-ray diffraction on very small sam-ples.
Yield strength: Stress above which a material de-forms plastically (elastic limit).
Thermal boundary layer: Layer in which the ther-mal gradient deviates from an adiabat due to thermalconduction. Heat transfer through the boundary layercontrols the cooling of the Earth.
Thermal expansion coefficient: a 5 1/V(dV/dT)P.In the Earth, values range from 1 to 5 3 1025 K21.
Thermal pressure: Pressure increase due to heatingat constant volume: PTH 5 aKTDT.
Ultra-low-velocity zone: A thin (5–40 km thick)layer above the core-mantle boundary (at a depth of2900 km), where a reduction of the seismic velocities of10% and more has been observed.
ACKNOWLEDGMENTS. I thank Anne Hofmeister forher constructive review. The paper was improved by a criticalreading by Valerie Hillgren.
Tilman Spohn was the Editor responsible for this paper. Hethanks Anne Hofmeister and Tom Ahrens for technical re-views and an anonymous cross-disciplinary reviewer.
REFERENCES
Ahrens, T. J., G. Q. Chen, and K. G. Holland, Phase diagramof iron, revised-core temperatures, Geophys. Res. Lett., inpress, 2000.
Anderson, O. L., Properties of iron at the Earth’s core condi-tions, Geophys. J. R. Astron. Soc., 84, 561–579, 1986.
Anderson, O. L., The phase diagram of iron and the temper-ature of the inner core, J. Geomagn. Geoelectr., 45, 1235–1248, 1993.
Anderson, W. W., and T. J. Ahrens, An equation of state forliquid iron and implications for the Earth’s core, J. Geophys.Res., 99, 4273–4284, 1994.
242 ● Boehler: PHASE DIAGRAMS OF LOWER MANTLE AND CORE 38, 2 / REVIEWS OF GEOPHYSICS
Anderson, W. W., and T. Ahrens, Shock temperature andmelting in iron sulfides at core pressures, J. Geophys. Res.,101, 5627–5642, 1996.
Anderson, O. L., and A. Duba, Experimental melting curve ofiron revisited, J. Geophys. Res., 102, 22,659–22,669, 1997.
Andrault, D., G. Fiquet, M. Kunz, F. Visocekas, and D.Hausermann, The orthorhombic structure of iron: An insitu study at high temperature and high pressure, Science,278, 831–834, 1997.
Belonoshko, A. B., Atomistic simulation of shock wave–in-duced melting in argon, Science, 275, 955–957, 1997.
Boehler, R., Measurement of the adiabats of quartz, forsterite,and magnesium oxide at high pressures and high tempera-tures and adiabatic gradients in the mantle of the Earth,Phys. Earth Planet. Inter., 29, 105–107, 1982.
Boehler, R., The phase diagram of iron to 430 kbar, Geophys.Res. Lett., 13, 1153–1156, 1986.
Boehler, R., Melting of the Fe-FeO and the Fe-FeS systems athigh pressure: Constraints on core temperatures, EarthPlanet. Sci. Lett., 111, 217–227, 1992.
Boehler, R., Temperatures in the Earth’s core from melting-point measurements of iron at high static pressures, Nature,363, 534–536, 1993.
Boehler, R., Fe-FeS eutectic temperatures to 620 kbar, Phys.Earth Planet. Inter., 96, 181–186, 1996a.
Boehler, R., Melting temperature of the Earth’s mantle andcore: Earth’s thermal structure, Annu. Rev. Earth Planet.Sci., 24, 15–40, 1996b.
Boehler, R., and A. Chopelas, A new approach to laser heatingin high-pressure mineral physics, Geophys. Res. Lett., 18,1147–1150, 1991.
Boehler, R., and A. Chopelas, Phase transitions in a 500kbar–3000 K gas apparatus, in High-Pressure Research: Ap-plication to Earth and Planetary Sciences, edited by Y. Syonoand M. H. Manghnani, pp. 55–60, Terra Sci., Tokyo, 1992.
Boehler, R., and J. Ramakrishnan, Experimental results on thepressure dependence of the Gruneisen parameter: A re-view, J. Geophys. Res., 85, 6996–7002, 1980.
Boehler, R., and M. Ross, Melting curve of aluminum in adiamond cell to 0.8 Mbar: Implications for iron, EarthPlanet. Sci. Lett., 153, 223–227, 1997.
Boehler, R., and D. A. Young, Melting and adiabats of thealkali metals at high compressions, J. Non Cryst. Solids, 61,141–146, 1984.
Boehler, R., N. von Bargen, and A. Chopelas, Melting, thermalexpansion, and phase transitions of iron at high pressures, J.Geophys. Res., 95, 21,731–21,736, 1990.
Boehler, R., M. Ross, and D. B. Boercker, High pressuremelting curves of alkali halides, Phys. Rev. B, 53, 556–563,1996.
Boehler, R., M. Ross, and D. B. Boercker, Melting of LiF andNaCl to 1 Mbar: Systematics of ionic solids at extremeconditions, Phys. Rev. Lett., 78, 4589–4592, 1997.
Boness, D. A., and J. M. Brown, The electronic band structuresof iron, sulfur, and oxygen at high pressures and the Earth’score, J. Geophys. Res., 95, 21,721–21,730, 1990.
Boness, D. A., and J. M. Brown, Bulk superheating of solidKBr and CsBr with shock waves, Phys. Rev. Lett., 71, 2931–2934, 1993.
Bridgman, P. W., The Physics of High Pressure, p. 220, G. Bell,London, 1952.
Brown, J. M., and R. G. McQueen, Phase transitions, Grunei-sen parameter, and elasticity for shocked iron between 77GPa and 400 GPa, J. Geophys. Res., 91, 7485–7494, 1986.
Brown, J. M., and T. S. Shankland, Thermodynamic parame-ters in the Earth as determined from seismic profiles, Geo-phys. J. R. Astron. Soc., 66, 579–596, 1981.
Chopelas, A., Estimates of mantle relevant Clapeyron slopes in
the MgSiO3 system from high pressure spectroscopic data,Am. Mineral., 84, 233–244, 1999.
Chopelas, A., and R. Boehler, Thermal expansivity in the lowermantle, Geophys. Res. Lett., 19, 1983–1986, 1992.
Dreibus, G., and H. Palme, Cosmochemical constraints on thesulfur content in the Earth’s core, Geochim. Cosmochim.Acta, 60, 1125–1130, 1996.
Dubrovinsky, L. S., S. K. Saxena, and P. Lazor, High-pressureand high temperature in situ X-ray diffraction study of ironand corundum to 68 GPa using an internally heated dia-mond anvil cell, Phys. Chem. Miner., 25, 434–441, 1998.
Dziewonski, A. M., and D. L. Anderson, Preliminary referenceEarth model, Phys. Earth Planet. Inter., 25, 297–356, 1981.
Fiquet, G., D. Andrault, J. P. Itie, P. Gillet, and P. Richet,X-ray diffraction of periclase in a laser-heated diamond-anvil cell, Phys. Earth Planet. Inter., 95, 1–17, 1996.
Gallagher, K. G., J. D. Bass, T. J. Ahrens, M. Fitzner, and J. R.Abelson, Shock temperature of stainless steel and a highpressure–high temperature constraint on thermal diffusiv-ity of Al2O3, in High-Pressure Science and Technology, ed-ited by S. C. Schmidt et al., pp. 963–966, Am. Inst. of Phys.,College Park, Md., 1993.
Garnero, E. J., S. P. Grand, and D. V. Helmberger, Lowp-wave velocity at the base of the mantle, Geophys. Res.Lett., 20, 1843–1846, 1993.
Getting, I. C., and G. C. Kennedy, Effect of pressure on theemf of chromel-alumel and platinum-platinum 10% rhod-ium thermocouples, J. Appl. Phys., 41, 4552–4562, 1970.
Heinz, D. L., and R. Jeanloz, Temperature measurements inthe laser-heated diamond cell, in High-Pressure Research inMineral Physics, Geophys. Monogr. Ser., vol. 39, edited byM. H. Manghnani and Y. Syono, pp. 113–128, AGU, Wash-ington, D. C., 1987.
Helmberger, D. V., L. Wen, and X. Ding, Seismic evidencethat the source of the Iceland hotspot lies at the core-mantle boundary, Nature, 396, 251–255, 1998.
Hillgren, V. J., and R. Boehler, High pressure reactions be-tween metals and silicates: Implications for the light ele-ment in the core and core-mantle interactions (abstract),Mineral. Mag., 62A, 624–625, 1998.
Hillgren, V. J., and R. Boehler, High pressure geochemistry inthe diamond cell to 100 GPa and 330 K, High Pressure Sci.Technol., Proc. AIRAPT Int. Conf., in press, 2000.
Holland, K. G., and T. J. Ahrens, Melting of (Mg,Fe)2SiO4 atthe core-mantle boundary of the Earth, Science, 275, 1623–1625, 1997.
Irifune, T. E. A., The postspinel phase boundary in Mg2SiO4determined by in situ X-ray diffraction, Science, 279, 1698–1700, 1998.
Ito, E., and T. Katsura, Melting of ferromagnesian silicatesunder the lower mantle conditions, in High-Pressure Re-search: Application to Earth and Planetary Sciences, editedby Y. Syono and M. H. Manghnani, pp. 315–322, Terra Sci.,Tokyo, 1992.
Ito, E., and E. Takahashi, Melting of peridotite at uppermostlower-mantle conditions, Nature, 328, 514–517, 1987.
Ito, E., and E. Takahashi, Postspinel transformations in thesystem Mg2SiO4-Fe2SiO4 and some geophysical implica-tions, J. Geophys. Res., 94, 10,637–10,646, 1989.
Jeanloz, R., and F. M. Richter, Convection, composition, andthe thermal state of the lower mantle, J. Geophys. Res., 84,5497–5504, 1979.
Jephcoat, A. P., and S. P. Besedin, Temperature measurementand melting determination in the laser-heated diamond-anvil cell, in Philosophical Transactions: Development inHigh-Pressure, High-Temperature Research and the Study ofthe Earth’s Deep Interior, vol. 354, edited by A. P. Jephcoat,R. J. Angel, and R. K. O’Nions, pp. 1333–1360, R. Soc. ofLondon, London, 1996.
38, 2 / REVIEWS OF GEOPHYSICS Boehler: PHASE DIAGRAMS OF LOWER MANTLE AND CORE ● 243
Katsura, T., and E. Ito, The system Mg2SiO4-Fe2SiO4 at highpressures and temperatures: Precise determination of sta-bilities of olivine, modified spinel, and spinel, J. Geophys.Res., 94, 15,663–15,670, 1989.
Kellogg, L. H., B. H. Hager, and R. D. van der Hilst, Compo-sitional stratification in the deep mantle, Science, 283, 1881–1884, 1999.
Kesson, S. E., and J. Fitz Gerald, Partitioning of MgO, FeO,NiO, MnO, and Cr2O3 between magnesium silicate perovs-kite and magnesiowustite: Implications for the origin ofinclusions in diamond and the composition of the lowermantle, Earth Planet. Sci. Lett., 111, 229–240, 1992.
Kesson, S. E., J. D. Fitz Gerald, and J. M. Shelly, Mineralogyand dynamics of a pyrolite lower mantle, Nature, 393, 253–255, 1998.
Kingslake, R., Lens Design Fundamentals, p. 331, HarcourtBrace, Orlando, Fla., 1978.
Knittle, E., and R. Jeanloz, Earth’s core-mantle boundary:Results of experiments at high pressures and temperatures,Science, 251, 1438–1443, 1991.
Kraut, E. A., and G. C. Kennedy, New melting law at highpressures, Phys. Rev. Lett., 16, 608–609, 1966.
Lyzenga, G. A., T. J. Ahrens, and A. C. Mitchell, Shocktemperatures of SiO2 and their geophysical implications, J.Geophys. Res., 88, 2431–2444, 1983.
Mao, H. K., P. M. Bell, J. W. Shaner, and D. J. Steinberg,Specific volume measurements of Cu, Mo, Pd, and Ag andcalibration of the ruby R1 fluorescence pressure gauge from0.06 to 1 Mbar, J. Appl. Phys., 49, 3276–3283, 1978.
Mao, H. K., Y. Wu, L. C. Chen, J. F. Shu, and A. P. Jephcoat,Static compression of iron to 300 GPa and Fe0.8Ni0.2 alloyto 260 GPa: Implications for composition of the core, J.Geophys. Res., 95, 21,737–21,742, 1990.
Masters, T. G., and P. M. Shearer, Summary of seismologicalconstraints on the structure of the Earth’s core, J. Geophys.Res., 95, 21,691–21,695, 1990.
McKenzie, D. P., J. M. Roberts, and N. O. Weii, Convection inthe Earth’s mantle: Toward a numerical simulation, J. FluidMech., 62, 465–538, 1974.
Ming, L. C., and W. A. Bassett, Laser heating in the diamondanvil press up to 20008C sustained and 30008C pulsed atpressures up to 260 kilobars, Rev. Sci. Instrum., 9, 1115–1118, 1974.
Nguyen, J. H., and N. C. Holmes, Iron sound velocities inshock wave experiments up to 400 GPa (abstract), EosTrans. AGU, 79(45), Fall Meet. Suppl., F846, 1998.
O’Neill, H. S. C., D. Canil, and D. C. Rubie, Oxide-metalequilibria to 25008C and 25 GPa: Implications for coreformation and the light component in the Earth’s core, J.Geophys. Res., 103, 12,239–12,260, 1998.
Poirier, J. P., Introduction to the Physics of the Earth’s Interior,edited by A. Putnis and R. C. Liebermann, CambridgeUniv. Press, New York, 1991.
Poirier, J. P., Light elements in the Earth’s outer core: Acritical review, Phys. Earth Planet. Inter., 85, 310–337, 1994.
Ramakrishnan, J., R. Boehler, G. H. Higgins, and G. C.Kennedy, Behavior of Gruneisen’s parameter of some met-als at high pressures, J. Geophys. Res., 83, 3535–3538, 1978.
Ramakrishnan, J., R. J. Hardy, and G. C. Kennedy, TheGruneisen parameter g of KBr, RbCl and Bi through highpressure phase transitions, J. Phys. Chem. Solids, 40, 297–303, 1979.
Revenough, J. S., and R. Meyer, Seismic evidence of partialmelt within a possible ubiquitous low velocity layer at thebase of the mantle, Science, 277, 670–673, 1997.
Ringwood, A. E., and W. Hibberson, The system Fe-FeOrevisited, Phys. Chem. Miner., 17, 313–319, 1990.
Russel, S. A., T. Lay, and E. J. Garnero, Seismic evidence for
small-scale dynamics in the lowermost mantle at the root ofthe Hawaiian hotspot, Nature, 396, 255–258, 1998.
Saxena, S. K., G. Shen, and P. Lazor, Experimental evidencefor a new iron phase and implications for the Earth’s core,Science, 260, 1312–1314, 1993.
Saxena, S. K., G. Shen, and P. Lazor, Temperatures in Earth’score based on melting and phase transformation experi-ments on iron, Science, 264, 405–407, 1994.
Saxena, S. K., L. S. Dubrovinsky, and P. Haggkvist, X-rayevidence for the new phase b-iron at high temperature andhigh pressure, Geophys. Res. Lett., 23, 2441–2444, 1996a.
Saxena, S. K., L. S. Dubrovinsky, P. Lazor, Y. Cerenius, P.Haggkvist, M. Hanfland, and J. Hu, Stability of perovskite(MgSiO3) in the Earth’s mantle, Science, 274, 1357–1359,1996b.
Serghiou, G., A. Zerr, and R. Boehler, (Mg,Fe)SiO3–perovs-kite stability under lower mantle conditions, Science, 280,2093–2095, 1998.
Shen, G., and D. L. Heinz, High-pressure melting of deepmantle and core materials, in Ultra-High-Pressure Mineral-ogy: Physics and Chemistry of the Earth’s Deep Interior, vol.37, edited by R. J. Hemley, pp. 369–396, Mineral. Soc. ofAm., Washington, D. C., 1998.
Shen, G., and P. Lazor, Measurement of melting temperaturesof some minerals under lower mantle pressures, J. Geophys.Res., 100, 17,699–17,713, 1995.
Shen, G., H. K. Mao, R. J. Hemley, T. S. Duffy, and M. L.Rivers, Melting and crystal structure of iron at high pres-sures and temperatures, Geophys. Res. Lett., 25, 373–376,1998.
Sherman, D. M., Stability of possible Fe-FeS and Fe-FeO alloyphases at high pressure, Earth Planet. Sci. Lett., 132, 87–98,1995.
Sherman, D., The composition of the Earth’s core: New con-straints on S and Si versus temperature, Earth Planet. Sci.Lett., 153, 149–155, 1997.
Song, X., and D. V. Helmberger, Seismic evidence for an innercore transition zone, Science, 282, 924–927, 1998.
Stacey, F. D., A thermal model of the Earth, Phys. Earth Planet.Inter., 15, 341–348, 1977.
Stevenson, D. J., Models of the Earth’s core, Science, 214,611–619, 1981.
Takahashi, E., Melting of a dry peridotite KLB-1 up to 14 GPa:Implications on the origin of peridotitic upper mantle, J.Geophys. Res., 91, 9367–9382, 1986.
Tschauner, O., A. Zerr, S. Specht, A. Rocholl, R. Boehler, andH. Palme, Partitioning of nickel and cobalt between metaland silicate perovskite up to 80 GPa, Nature, 398, 604–607,1999.
Urakawa, S., M. Kato, and M. Kumazawa, Experimental studyof the phase relation in the system Fe-Ni-O-S up to 15 GPa,in High-Pressure Research in Mineral Physics, edited byM. H. Manghnani and Y. Syono, pp. 95–111, Terra Sci.,Tokyo, 1987.
Usselmann, T. M., Experimental approach to the state of thecore, part I, The liquidus relations of the Fe-rich portion ofthe Fe-Ni-S system from 30 to 100 kb, Am. J. Sci., 275,278–290, 1975.
van Keken, P. E., and D. A. Yuen, Dynamical influences ofhigh viscosity in the lower mantle induced by the steepmelting curve of perovskite: Effects of curvature and timedependence, J. Geophys. Res., 100, 15,233–15,248, 1995.
van Keken, P. E., D. A. Yuen, and A. P. van den Berg,Implications for mantle dynamics from the high meltingtemperatures of perovskite, Science, 264, 1437–1439, 1994.
Weertman, J., and J. R. Weertman, High temperature creep ofrock and mantle viscosity, Annu. Rev. Geophys., 3, 293–315,1975.
Wen, L., and D. V. Helmberger, Ultra-low velocity zones near
244 ● Boehler: PHASE DIAGRAMS OF LOWER MANTLE AND CORE 38, 2 / REVIEWS OF GEOPHYSICS
the core-mantle boundary from broadband PKP precursors,Science, 279, 1701–1703, 1998.
Williams, Q., R. Jeanloz, J. Bass, B. Svendsen, and T. J.Ahrens, The melting curve of iron to 2.5 Mbar: A constrainton the temperature of the Earth’s core, Science, 236, 181–182, 1987.
Yoo, C. S., J. Akella, and C. Ruddle, Melting studies of ironand uranium by DAC Laser heating experiments (abstract),Eos Trans. AGU, 73(43), Fall Meet. Suppl., 64, 1992.
Yoo, C. S., N. C. Holmes, M. Ross, D. J. Webb, and C. Pike,Shock temperatures and melting of iron at Earth coreconditions, Phys. Rev. Lett., 70, 3931–3934, 1993.
Yoo, C. S., P. Soderlind, J. A. Moriarty, and A. J. Campbell,dhcp as a possible new ε9 phase of iron at high pressuresand temperatures, Phys. Lett. A, 214, 65–70, 1996.
Zerr, A., and R. Boehler, Melting of (Mg,Fe)SiO3-perovskiteto 625 kbar: Indication of a high melting temperature in thelower mantle, Science, 262, 553–555, 1993.
Zerr, A., and R. Boehler, Constraints on the melting temper-ature of the lower mantle from high pressure experimentson MgO and magnesiowustite, Nature, 371, 506–508, 1994.
Zerr, A., G. Serghiou, and R. Boehler, Melting of CaSiO3-
perovskite to 430 kbar and first in situ measurements oflower mantle eutectic temperatures, Geophys. Res. Lett., 24,909–912, 1997.
Zerr, A., A. Diegeler, and R. Boehler, Solidus of the Earth’sdeep mantle, Science, 281, 243–245, 1998.
Zha, C. S., R. Boehler, D. A. Young, and M. Ross, The argonmelting curve to very high pressures, J. Chem. Phys., 85,1034–1036, 1986.
Zha, C. S., H. K. Mao, and R. J. Hemley, A primary pressurescale to 55 GPa from new measurements of equation ofstate and elasticity for MgO, High Pressure Sci. Technol.,Proc. AIRAPT Int. Conf., in press, 2000.
Zhang, J., and C. Herzberg, Melting experiments on anhydrousperidotite KLB-1 from 5.0 to 22.5 GPa, J. Geophys. Res., 99,17,729–17,742, 1994.
R. Boehler, Hochdruck-Mineralphysik, Max-Planck Institutfur Chemie, Postfach 3060, 55020 Mainz, Germany.([email protected])
38, 2 / REVIEWS OF GEOPHYSICS Boehler: PHASE DIAGRAMS OF LOWER MANTLE AND CORE ● 245

● 246 ●