Embed Size (px)
Citation preview
Campton et al. BMC Cancer (2015) 15:360 DOI 10.1186/s12885-015-1383-x
TECHNICAL ADVANCE Open Access
High-recovery visual identification and single-cellretrieval of circulating tumor cells for genomicanalysis using a dual-technology platformintegrated with automated immunofluorescencestainingDaniel E Campton1†, Arturo B Ramirez1†, Joshua J Nordberg1, Nick Drovetto1, Alisa C Clein6, Paulina Varshavskaya1,Barry H Friemel1, Steve Quarre1, Amy Breman2, Michael Dorschner3, Sibel Blau4, C Anthony Blau5, Daniel E Sabath6,Jackie L Stilwell1 and Eric P Kaldjian1*
Abstract
Background: Circulating tumor cells (CTCs) are malignant cells that have migrated from solid cancers into theblood, where they are typically present in rare numbers. There is great interest in using CTCs to monitor responseto therapies, to identify clinically actionable biomarkers, and to provide a non-invasive window on the molecularstate of a tumor. Here we characterize the performance of the AccuCyte® – CyteFinder® system, a comprehensive,reproducible and highly sensitive platform for collecting, identifying and retrieving individual CTCs from microscopicslides for molecular analysis after automated immunofluorescence staining for epithelial markers.
Methods: All experiments employed a density-based cell separation apparatus (AccuCyte) to separate nucleatedcells from the blood and transfer them to microscopic slides. After staining, the slides were imaged using a digitalscanning microscope (CyteFinder). Precisely counted model CTCs (mCTCs) from four cancer cell lines were spikedinto whole blood to determine recovery rates. Individual mCTCs were removed from slides using a single-cellretrieval device (CytePicker™) for whole genome amplification and subsequent analysis by PCR and Sangersequencing, whole exome sequencing, or array-based comparative genomic hybridization. Clinical CTCs wereevaluated in blood samples from patients with different cancers in comparison with the CellSearch® system.
Results: AccuCyte – CyteFinder presented high-resolution images that allowed identification of mCTCs bymorphologic and phenotypic features. Spike-in mCTC recoveries were between 90 and 91%. More than 80% ofsingle-digit spike-in mCTCs were identified and even a single cell in 7.5 mL could be found. Analysis of single SKBR3mCTCs identified presence of a known TP53 mutation by both PCR and whole exome sequencing, and confirmedthe reported karyotype of this cell line. Patient sample CTC counts matched or exceeded CellSearch CTC counts ina small feasibility cohort.
Conclusion: The AccuCyte – CyteFinder system is a comprehensive and sensitive platform for identification andcharacterization of CTCs that has been applied to the assessment of CTCs in cancer patient samples as well as theisolation of single cells for genomic analysis. It thus enables accurate non-invasive monitoring of CTCs and evolvingcancer biology for personalized, molecularly-guided cancer treatment.
* Correspondence: [email protected]†Equal contributors1RareCyte, Inc, Seattle, WA, USAFull list of author information is available at the end of the article
© 2015 Campton et al.; licensee BioMed CentCommons Attribution License (http://creativecreproduction in any medium, provided the orDedication waiver (http://creativecommons.orunless otherwise stated.
ral. This is an Open Access article distributed under the terms of the Creativeommons.org/licenses/by/4.0), which permits unrestricted use, distribution, andiginal work is properly credited. The Creative Commons Public Domaing/publicdomain/zero/1.0/) applies to the data made available in this article,
Campton et al. BMC Cancer (2015) 15:360 Page 2 of 13
BackgroundCancer metastasis accounts for 90% of cancer deaths [1].Circulating tumor cells (CTC) are malignant cells thatmigrate from a cancer into the bloodstream; most CTCsdie, but some exit the circulation to develop into metas-tases [2]. High numbers of CTC are associated withshorter overall and progression free survival [3-5]. CTCs,however, are rare – it is typical for one CTC to bepresent for every million white blood cells or more – andthus detecting and measuring CTC requires highly sensi-tive technology.Platforms for CTC identification have been developed
based on size, protein expression, or other physical char-acteristics (reviewed in [6]). Currently, the only FDA-cleared platform for CTC enumeration is the CellSearch®system (Veridex, Raritan, NJ, USA), and is used for moni-toring CTC in patients with colorectal, breast, and prostatecancer. This system is based on automated immuno-magnetic capture of EpCAM expressing cells, followed bystaining for DNA and cytokeratin to verify that capturedcells are nucleated and epithelial in origin. An exclusionarystain for CD45 is included to prevent false positive identifi-cation of white blood cells that may be non-specificallycaptured. False negatives are an acknowledged weakness ofimmuno-magnetic capture, which will not identify CTCsthat express low levels of the capture antigen. Other tech-nologies for CTC analysis currently under development in-clude other immunomagnetic positive or negative selectionmethods, microfluidic chips, filters, isolation based on celldeformability or cell density, and dielectrophoretic separ-ation. Although there are advantages to each technology,there are also limitations. Microfluidic chips and filters thatfractionate by size will not capture small CTCs. Most tech-nologies do not provide high-resolution visualization ofcells. Often sensitive technologies are not specific, and viceversa. Some require red blood cell lysis, which may damagecells. Finally, the ability to robustly retrieve individuallyidentified cells within a practical workflow remains elusive.The use of information from CTCs for therapeutic
decision-making is in its infancy. There is great interestin exploiting CTCs as a window on the molecular stateof a tumor, since understanding the evolutionary path ofa cancer may predict resistance before overt clinicalprogression, potentially allowing for the pre-emptive se-lection of a more effective therapy. An ideal CTC ana-lysis platform would provide unambiguous morphologyfor definitive CTC identification, comprehensive CTCenumeration for monitoring a patient’s response to ther-apy, flexible characterization of biomarkers (includingdrug targets), and also enable isolation of CTCs for mo-lecular analyses.We characterize here the performance of the Accu-
Cyte® – CyteFinder® system: a comprehensive, reprodu-cible and highly sensitive dual-technology platform for
collecting, identifying and analyzing CTCs, that employstwo complementary technologies that surround a stain-ing step using an automated immunohistochemistry in-strument. The AccuCyte system – “front end” – is basedfundamentally on the density of CTCs, which is withinthe range of the buffy coat. However, it is differentiatedfrom existing density-based methods that separate thebuffy coat from red blood cells and plasma by use of aunique separation tube and collector device, which al-lows virtually complete harvesting of the buffy coat intoa small volume for application to a microscopic slide with-out cell lysis or wash steps, a potential source of CTC loss.The CyteFinder system – “back end” – is an automatedscanning digital microscope and image analysis systemthat presents high-resolution images of candidate cellsstained with well-characterized markers before definitiveclassification as a CTC. CyteFinder includes an integrateddevice (CytePicker™) for CTC retrieval that is mechanic-ally precise and compatible with recently developed ad-vanced genomic analysis methods for single CTCs.
MethodsBlood sample collection for spike-in experimentsBlood samples were collected from healthy volunteers atRainier Clinical Research Center according to a protocolapproved by Quorum Review institutional review board(IRB, Seattle, WA, USA). Approximately 40 mL was col-lected from healthy volunteers into anticoagulant EDTAVacutainer® tubes (Becton-Dickinson) with a proprietarypreservative (RareCyte, Seattle, WA, USA) and 20 mLwas collected from cancer patients into CellSave® tubes(Veridex, Raritan, NJ, USA).
Tissue culture cells and model CTC (mCTC) spike-inexperimentsLNCaP and PC3 (Prostate), A549 (lung), and MCF7 andSKBR3 (breast) cancer cell lines used as model CTCs(mCTC) were all obtained from American Type CultureCollection (ATCC, Manassas, VA, USA). LNCaP, PC3,SKBR3, and A549 cell lines were maintained in RPMI 1650medium and MCF7 cell lines were maintained in DMEMmedium. Media were supplemented with 10% FBS.For percent recovery determination, nuclei or mito-
chondria of live mCTCs were fluorescently labeled withHoechst 33342 or Mitotracker Red (Life Technologies),respectively, and drawn into a glass capillary tube (Vitro-Tube, Mountain Lakes, NJ, USA). The cells within theVitroTube were then scanned and counted using aDeltaVision fluorescent microscope (GE, Issaquah, WA,Additional file 1: Figure S1). Cells were expelled into7.5 mL of blood by flushing the VitroTube with PBS andthen rescanning the tube for cells that were not expelledto obtain the net precise count of the cells added to theblood. On the order of 100 cells (range ~70 – 200) from
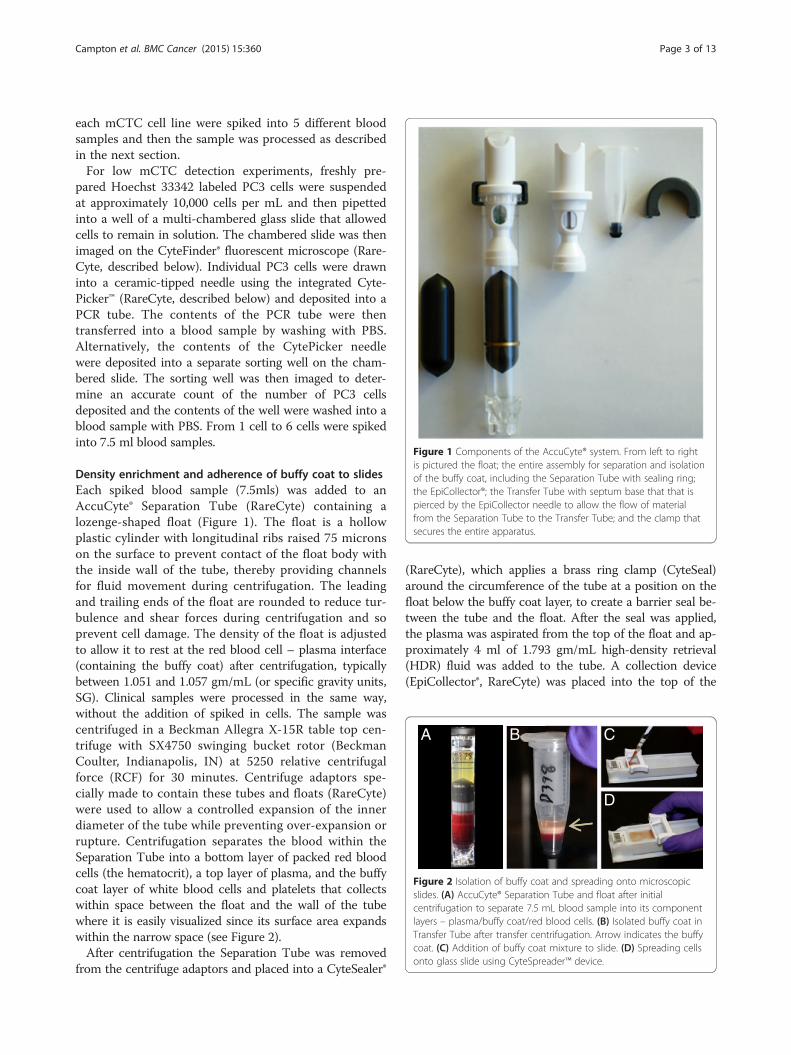
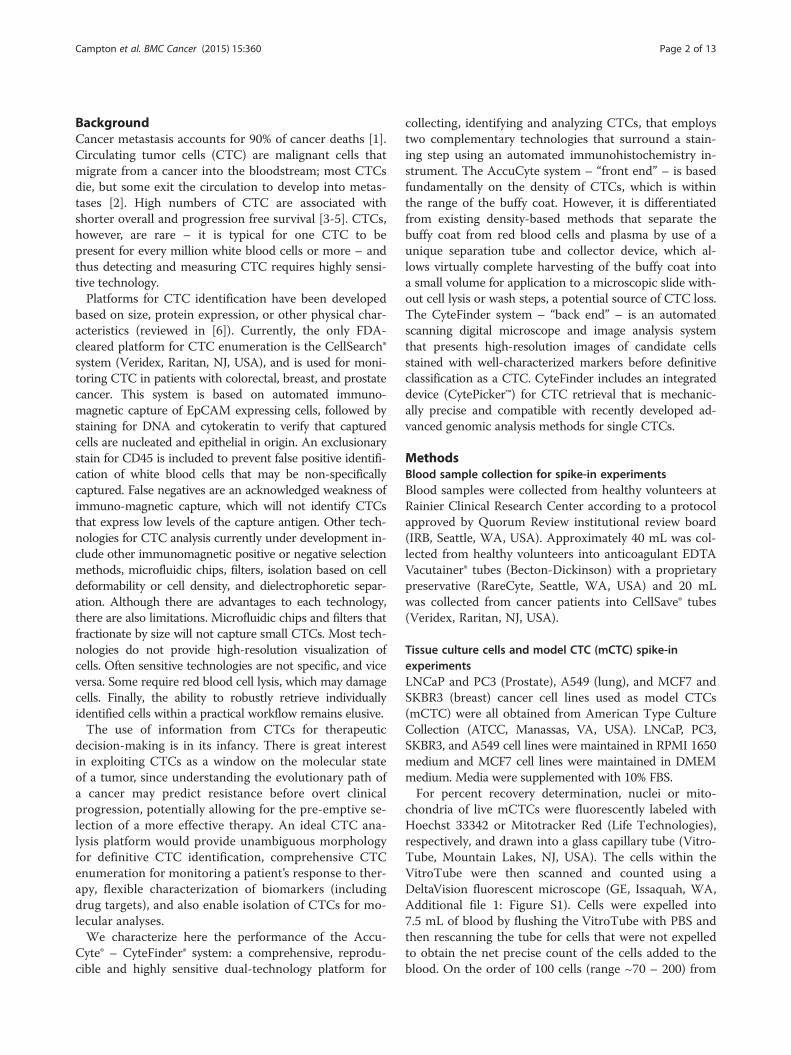
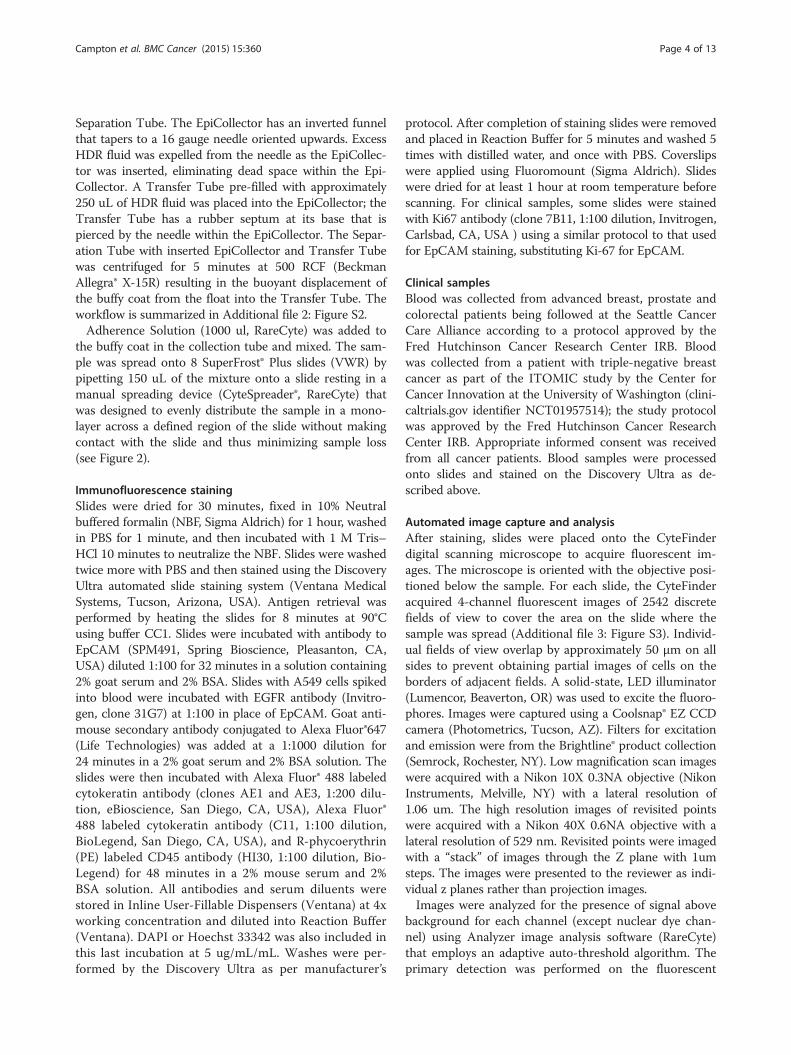
Figure 1 Components of the AccuCyte® system. From left to rightis pictured the float; the entire assembly for separation and isolationof the buffy coat, including the Separation Tube with sealing ring;the EpiCollector®; the Transfer Tube with septum base that that ispierced by the EpiCollector needle to allow the flow of materialfrom the Separation Tube to the Transfer Tube; and the clamp thatsecures the entire apparatus.
A B
D
C
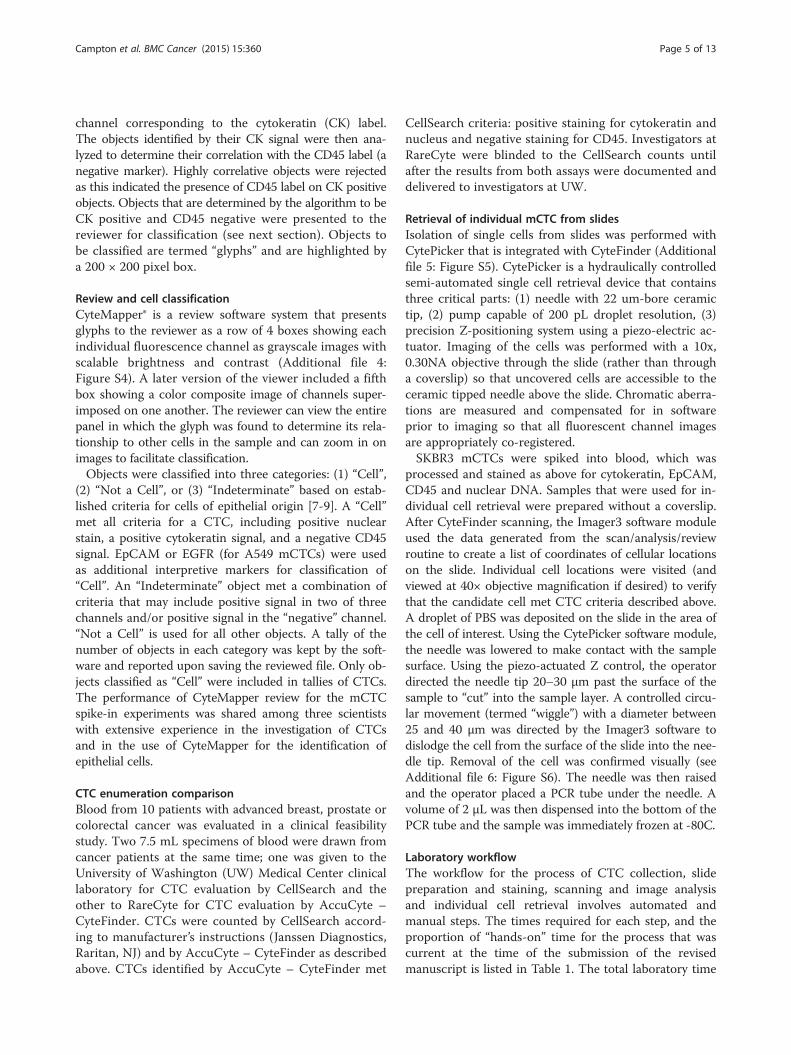
Figure 2 Isolation of buffy coat and spreading onto microscopicslides. (A) AccuCyte® Separation Tube and float after initialcentrifugation to separate 7.5 mL blood sample into its componentlayers – plasma/buffy coat/red blood cells. (B) Isolated buffy coat inTransfer Tube after transfer centrifugation. Arrow indicates the buffycoat. (C) Addition of buffy coat mixture to slide. (D) Spreading cellsonto glass slide using CyteSpreader™ device.
Campton et al. BMC Cancer (2015) 15:360 Page 3 of 13
each mCTC cell line were spiked into 5 different bloodsamples and then the sample was processed as describedin the next section.For low mCTC detection experiments, freshly pre-
pared Hoechst 33342 labeled PC3 cells were suspendedat approximately 10,000 cells per mL and then pipettedinto a well of a multi-chambered glass slide that allowedcells to remain in solution. The chambered slide was thenimaged on the CyteFinder® fluorescent microscope (Rare-Cyte, described below). Individual PC3 cells were drawninto a ceramic-tipped needle using the integrated Cyte-Picker™ (RareCyte, described below) and deposited into aPCR tube. The contents of the PCR tube were thentransferred into a blood sample by washing with PBS.Alternatively, the contents of the CytePicker needlewere deposited into a separate sorting well on the cham-bered slide. The sorting well was then imaged to deter-mine an accurate count of the number of PC3 cellsdeposited and the contents of the well were washed into ablood sample with PBS. From 1 cell to 6 cells were spikedinto 7.5 ml blood samples.
Density enrichment and adherence of buffy coat to slidesEach spiked blood sample (7.5mls) was added to anAccuCyte® Separation Tube (RareCyte) containing alozenge-shaped float (Figure 1). The float is a hollowplastic cylinder with longitudinal ribs raised 75 micronson the surface to prevent contact of the float body withthe inside wall of the tube, thereby providing channelsfor fluid movement during centrifugation. The leadingand trailing ends of the float are rounded to reduce tur-bulence and shear forces during centrifugation and soprevent cell damage. The density of the float is adjustedto allow it to rest at the red blood cell – plasma interface(containing the buffy coat) after centrifugation, typicallybetween 1.051 and 1.057 gm/mL (or specific gravity units,SG). Clinical samples were processed in the same way,without the addition of spiked in cells. The sample wascentrifuged in a Beckman Allegra X-15R table top cen-trifuge with SX4750 swinging bucket rotor (BeckmanCoulter, Indianapolis, IN) at 5250 relative centrifugalforce (RCF) for 30 minutes. Centrifuge adaptors spe-cially made to contain these tubes and floats (RareCyte)were used to allow a controlled expansion of the innerdiameter of the tube while preventing over-expansion orrupture. Centrifugation separates the blood within theSeparation Tube into a bottom layer of packed red bloodcells (the hematocrit), a top layer of plasma, and the buffycoat layer of white blood cells and platelets that collectswithin space between the float and the wall of the tubewhere it is easily visualized since its surface area expandswithin the narrow space (see Figure 2).After centrifugation the Separation Tube was removed
from the centrifuge adaptors and placed into a CyteSealer®
(RareCyte), which applies a brass ring clamp (CyteSeal)around the circumference of the tube at a position on thefloat below the buffy coat layer, to create a barrier seal be-tween the tube and the float. After the seal was applied,the plasma was aspirated from the top of the float and ap-proximately 4 ml of 1.793 gm/mL high-density retrieval(HDR) fluid was added to the tube. A collection device(EpiCollector®, RareCyte) was placed into the top of the
Campton et al. BMC Cancer (2015) 15:360 Page 4 of 13
Separation Tube. The EpiCollector has an inverted funnelthat tapers to a 16 gauge needle oriented upwards. ExcessHDR fluid was expelled from the needle as the EpiCollec-tor was inserted, eliminating dead space within the Epi-Collector. A Transfer Tube pre-filled with approximately250 uL of HDR fluid was placed into the EpiCollector; theTransfer Tube has a rubber septum at its base that ispierced by the needle within the EpiCollector. The Separ-ation Tube with inserted EpiCollector and Transfer Tubewas centrifuged for 5 minutes at 500 RCF (BeckmanAllegra® X-15R) resulting in the buoyant displacement ofthe buffy coat from the float into the Transfer Tube. Theworkflow is summarized in Additional file 2: Figure S2.Adherence Solution (1000 ul, RareCyte) was added to
the buffy coat in the collection tube and mixed. The sam-ple was spread onto 8 SuperFrost® Plus slides (VWR) bypipetting 150 uL of the mixture onto a slide resting in amanual spreading device (CyteSpreader®, RareCyte) thatwas designed to evenly distribute the sample in a mono-layer across a defined region of the slide without makingcontact with the slide and thus minimizing sample loss(see Figure 2).
Immunofluorescence stainingSlides were dried for 30 minutes, fixed in 10% Neutralbuffered formalin (NBF, Sigma Aldrich) for 1 hour, washedin PBS for 1 minute, and then incubated with 1 M Tris–HCl 10 minutes to neutralize the NBF. Slides were washedtwice more with PBS and then stained using the DiscoveryUltra automated slide staining system (Ventana MedicalSystems, Tucson, Arizona, USA). Antigen retrieval wasperformed by heating the slides for 8 minutes at 90°Cusing buffer CC1. Slides were incubated with antibody toEpCAM (SPM491, Spring Bioscience, Pleasanton, CA,USA) diluted 1:100 for 32 minutes in a solution containing2% goat serum and 2% BSA. Slides with A549 cells spikedinto blood were incubated with EGFR antibody (Invitro-gen, clone 31G7) at 1:100 in place of EpCAM. Goat anti-mouse secondary antibody conjugated to Alexa Fluor®647(Life Technologies) was added at a 1:1000 dilution for24 minutes in a 2% goat serum and 2% BSA solution. Theslides were then incubated with Alexa Fluor® 488 labeledcytokeratin antibody (clones AE1 and AE3, 1:200 dilu-tion, eBioscience, San Diego, CA, USA), Alexa Fluor®488 labeled cytokeratin antibody (C11, 1:100 dilution,BioLegend, San Diego, CA, USA), and R-phycoerythrin(PE) labeled CD45 antibody (HI30, 1:100 dilution, Bio-Legend) for 48 minutes in a 2% mouse serum and 2%BSA solution. All antibodies and serum diluents werestored in Inline User-Fillable Dispensers (Ventana) at 4xworking concentration and diluted into Reaction Buffer(Ventana). DAPI or Hoechst 33342 was also included inthis last incubation at 5 ug/mL/mL. Washes were per-formed by the Discovery Ultra as per manufacturer’s
protocol. After completion of staining slides were removedand placed in Reaction Buffer for 5 minutes and washed 5times with distilled water, and once with PBS. Coverslipswere applied using Fluoromount (Sigma Aldrich). Slideswere dried for at least 1 hour at room temperature beforescanning. For clinical samples, some slides were stainedwith Ki67 antibody (clone 7B11, 1:100 dilution, Invitrogen,Carlsbad, CA, USA ) using a similar protocol to that usedfor EpCAM staining, substituting Ki-67 for EpCAM.
Clinical samplesBlood was collected from advanced breast, prostate andcolorectal patients being followed at the Seattle CancerCare Alliance according to a protocol approved by theFred Hutchinson Cancer Research Center IRB. Bloodwas collected from a patient with triple-negative breastcancer as part of the ITOMIC study by the Center forCancer Innovation at the University of Washington (clini-caltrials.gov identifier NCT01957514); the study protocolwas approved by the Fred Hutchinson Cancer ResearchCenter IRB. Appropriate informed consent was receivedfrom all cancer patients. Blood samples were processedonto slides and stained on the Discovery Ultra as de-scribed above.
Automated image capture and analysisAfter staining, slides were placed onto the CyteFinderdigital scanning microscope to acquire fluorescent im-ages. The microscope is oriented with the objective posi-tioned below the sample. For each slide, the CyteFinderacquired 4-channel fluorescent images of 2542 discretefields of view to cover the area on the slide where thesample was spread (Additional file 3: Figure S3). Individ-ual fields of view overlap by approximately 50 μm on allsides to prevent obtaining partial images of cells on theborders of adjacent fields. A solid-state, LED illuminator(Lumencor, Beaverton, OR) was used to excite the fluoro-phores. Images were captured using a Coolsnap® EZ CCDcamera (Photometrics, Tucson, AZ). Filters for excitationand emission were from the Brightline® product collection(Semrock, Rochester, NY). Low magnification scan imageswere acquired with a Nikon 10X 0.3NA objective (NikonInstruments, Melville, NY) with a lateral resolution of1.06 um. The high resolution images of revisited pointswere acquired with a Nikon 40X 0.6NA objective with alateral resolution of 529 nm. Revisited points were imagedwith a “stack” of images through the Z plane with 1umsteps. The images were presented to the reviewer as indi-vidual z planes rather than projection images.Images were analyzed for the presence of signal above
background for each channel (except nuclear dye chan-nel) using Analyzer image analysis software (RareCyte)that employs an adaptive auto-threshold algorithm. Theprimary detection was performed on the fluorescent
Campton et al. BMC Cancer (2015) 15:360 Page 5 of 13
channel corresponding to the cytokeratin (CK) label.The objects identified by their CK signal were then ana-lyzed to determine their correlation with the CD45 label (anegative marker). Highly correlative objects were rejectedas this indicated the presence of CD45 label on CK positiveobjects. Objects that are determined by the algorithm to beCK positive and CD45 negative were presented to thereviewer for classification (see next section). Objects tobe classified are termed “glyphs” and are highlighted bya 200 × 200 pixel box.
Review and cell classificationCyteMapper® is a review software system that presentsglyphs to the reviewer as a row of 4 boxes showing eachindividual fluorescence channel as grayscale images withscalable brightness and contrast (Additional file 4:Figure S4). A later version of the viewer included a fifthbox showing a color composite image of channels super-imposed on one another. The reviewer can view the entirepanel in which the glyph was found to determine its rela-tionship to other cells in the sample and can zoom in onimages to facilitate classification.Objects were classified into three categories: (1) “Cell”,
(2) “Not a Cell”, or (3) “Indeterminate” based on estab-lished criteria for cells of epithelial origin [7-9]. A “Cell”met all criteria for a CTC, including positive nuclearstain, a positive cytokeratin signal, and a negative CD45signal. EpCAM or EGFR (for A549 mCTCs) were usedas additional interpretive markers for classification of“Cell”. An “Indeterminate” object met a combination ofcriteria that may include positive signal in two of threechannels and/or positive signal in the “negative” channel.“Not a Cell” is used for all other objects. A tally of thenumber of objects in each category was kept by the soft-ware and reported upon saving the reviewed file. Only ob-jects classified as “Cell” were included in tallies of CTCs.The performance of CyteMapper review for the mCTCspike-in experiments was shared among three scientistswith extensive experience in the investigation of CTCsand in the use of CyteMapper for the identification ofepithelial cells.
CTC enumeration comparisonBlood from 10 patients with advanced breast, prostate orcolorectal cancer was evaluated in a clinical feasibilitystudy. Two 7.5 mL specimens of blood were drawn fromcancer patients at the same time; one was given to theUniversity of Washington (UW) Medical Center clinicallaboratory for CTC evaluation by CellSearch and theother to RareCyte for CTC evaluation by AccuCyte –CyteFinder. CTCs were counted by CellSearch accord-ing to manufacturer’s instructions (Janssen Diagnostics,Raritan, NJ) and by AccuCyte – CyteFinder as describedabove. CTCs identified by AccuCyte – CyteFinder met
CellSearch criteria: positive staining for cytokeratin andnucleus and negative staining for CD45. Investigators atRareCyte were blinded to the CellSearch counts untilafter the results from both assays were documented anddelivered to investigators at UW.
Retrieval of individual mCTC from slidesIsolation of single cells from slides was performed withCytePicker that is integrated with CyteFinder (Additionalfile 5: Figure S5). CytePicker is a hydraulically controlledsemi-automated single cell retrieval device that containsthree critical parts: (1) needle with 22 um-bore ceramictip, (2) pump capable of 200 pL droplet resolution, (3)precision Z-positioning system using a piezo-electric ac-tuator. Imaging of the cells was performed with a 10x,0.30NA objective through the slide (rather than througha coverslip) so that uncovered cells are accessible to theceramic tipped needle above the slide. Chromatic aberra-tions are measured and compensated for in softwareprior to imaging so that all fluorescent channel imagesare appropriately co-registered.SKBR3 mCTCs were spiked into blood, which was
processed and stained as above for cytokeratin, EpCAM,CD45 and nuclear DNA. Samples that were used for in-dividual cell retrieval were prepared without a coverslip.After CyteFinder scanning, the Imager3 software moduleused the data generated from the scan/analysis/reviewroutine to create a list of coordinates of cellular locationson the slide. Individual cell locations were visited (andviewed at 40× objective magnification if desired) to verifythat the candidate cell met CTC criteria described above.A droplet of PBS was deposited on the slide in the area ofthe cell of interest. Using the CytePicker software module,the needle was lowered to make contact with the samplesurface. Using the piezo-actuated Z control, the operatordirected the needle tip 20–30 μm past the surface of thesample to “cut” into the sample layer. A controlled circu-lar movement (termed “wiggle”) with a diameter between25 and 40 μm was directed by the Imager3 software todislodge the cell from the surface of the slide into the nee-dle tip. Removal of the cell was confirmed visually (seeAdditional file 6: Figure S6). The needle was then raisedand the operator placed a PCR tube under the needle. Avolume of 2 μL was then dispensed into the bottom of thePCR tube and the sample was immediately frozen at -80C.
Laboratory workflowThe workflow for the process of CTC collection, slidepreparation and staining, scanning and image analysisand individual cell retrieval involves automated andmanual steps. The times required for each step, and theproportion of “hands-on” time for the process that wascurrent at the time of the submission of the revisedmanuscript is listed in Table 1. The total laboratory time
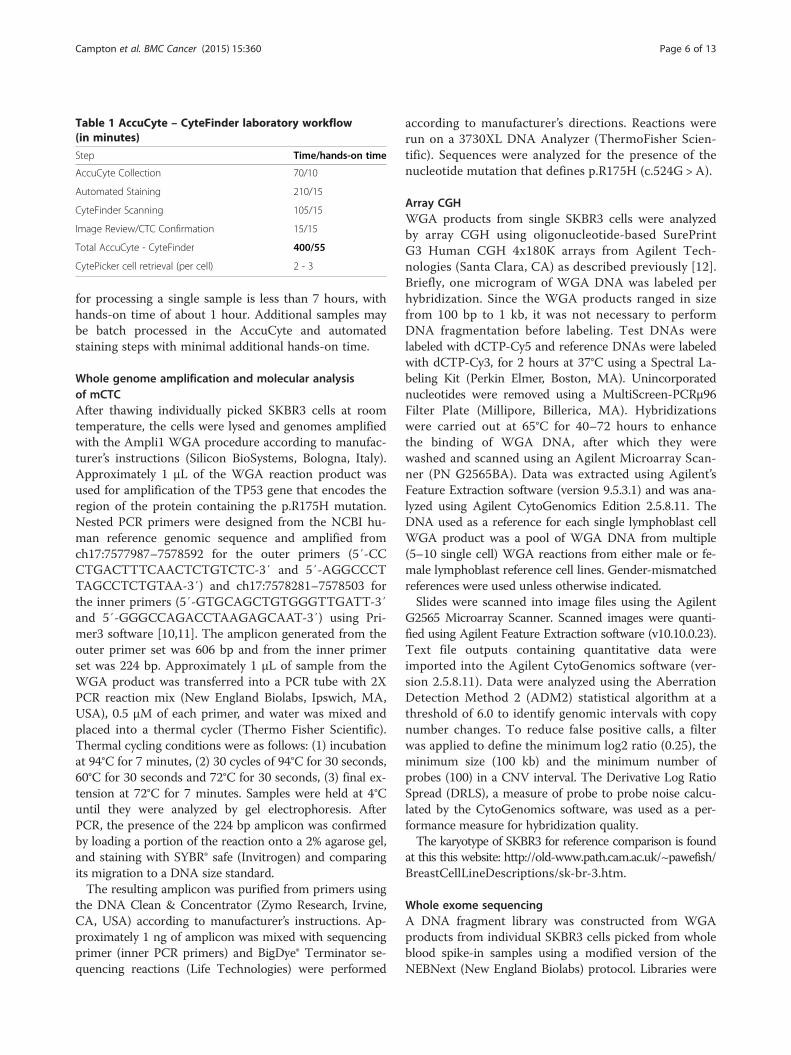
Table 1 AccuCyte – CyteFinder laboratory workflow(in minutes)
Step Time/hands-on time
AccuCyte Collection 70/10
Automated Staining 210/15
CyteFinder Scanning 105/15
Image Review/CTC Confirmation 15/15
Total AccuCyte - CyteFinder 400/55
CytePicker cell retrieval (per cell) 2 - 3
Campton et al. BMC Cancer (2015) 15:360 Page 6 of 13
for processing a single sample is less than 7 hours, withhands-on time of about 1 hour. Additional samples maybe batch processed in the AccuCyte and automatedstaining steps with minimal additional hands-on time.
Whole genome amplification and molecular analysisof mCTCAfter thawing individually picked SKBR3 cells at roomtemperature, the cells were lysed and genomes amplifiedwith the Ampli1 WGA procedure according to manufac-turer’s instructions (Silicon BioSystems, Bologna, Italy).Approximately 1 μL of the WGA reaction product wasused for amplification of the TP53 gene that encodes theregion of the protein containing the p.R175H mutation.Nested PCR primers were designed from the NCBI hu-man reference genomic sequence and amplified fromch17:7577987–7578592 for the outer primers (5′-CCCTGACTTTCAACTCTGTCTC-3′ and 5′-AGGCCCTTAGCCTCTGTAA-3′) and ch17:7578281–7578503 forthe inner primers (5′-GTGCAGCTGTGGGTTGATT-3′and 5′-GGGCCAGACCTAAGAGCAAT-3′) using Pri-mer3 software [10,11]. The amplicon generated from theouter primer set was 606 bp and from the inner primerset was 224 bp. Approximately 1 μL of sample from theWGA product was transferred into a PCR tube with 2XPCR reaction mix (New England Biolabs, Ipswich, MA,USA), 0.5 μM of each primer, and water was mixed andplaced into a thermal cycler (Thermo Fisher Scientific).Thermal cycling conditions were as follows: (1) incubationat 94°C for 7 minutes, (2) 30 cycles of 94°C for 30 seconds,60°C for 30 seconds and 72°C for 30 seconds, (3) final ex-tension at 72°C for 7 minutes. Samples were held at 4°Cuntil they were analyzed by gel electrophoresis. AfterPCR, the presence of the 224 bp amplicon was confirmedby loading a portion of the reaction onto a 2% agarose gel,and staining with SYBR® safe (Invitrogen) and comparingits migration to a DNA size standard.The resulting amplicon was purified from primers using
the DNA Clean & Concentrator (Zymo Research, Irvine,CA, USA) according to manufacturer’s instructions. Ap-proximately 1 ng of amplicon was mixed with sequencingprimer (inner PCR primers) and BigDye® Terminator se-quencing reactions (Life Technologies) were performed
according to manufacturer’s directions. Reactions wererun on a 3730XL DNA Analyzer (ThermoFisher Scien-tific). Sequences were analyzed for the presence of thenucleotide mutation that defines p.R175H (c.524G > A).
Array CGHWGA products from single SKBR3 cells were analyzedby array CGH using oligonucleotide-based SurePrintG3 Human CGH 4x180K arrays from Agilent Tech-nologies (Santa Clara, CA) as described previously [12].Briefly, one microgram of WGA DNA was labeled perhybridization. Since the WGA products ranged in sizefrom 100 bp to 1 kb, it was not necessary to performDNA fragmentation before labeling. Test DNAs werelabeled with dCTP-Cy5 and reference DNAs were labeledwith dCTP-Cy3, for 2 hours at 37°C using a Spectral La-beling Kit (Perkin Elmer, Boston, MA). Unincorporatednucleotides were removed using a MultiScreen-PCRμ96Filter Plate (Millipore, Billerica, MA). Hybridizationswere carried out at 65°C for 40–72 hours to enhancethe binding of WGA DNA, after which they werewashed and scanned using an Agilent Microarray Scan-ner (PN G2565BA). Data was extracted using Agilent’sFeature Extraction software (version 9.5.3.1) and was ana-lyzed using Agilent CytoGenomics Edition 2.5.8.11. TheDNA used as a reference for each single lymphoblast cellWGA product was a pool of WGA DNA from multiple(5–10 single cell) WGA reactions from either male or fe-male lymphoblast reference cell lines. Gender-mismatchedreferences were used unless otherwise indicated.Slides were scanned into image files using the Agilent
G2565 Microarray Scanner. Scanned images were quanti-fied using Agilent Feature Extraction software (v10.10.0.23).Text file outputs containing quantitative data wereimported into the Agilent CytoGenomics software (ver-sion 2.5.8.11). Data were analyzed using the AberrationDetection Method 2 (ADM2) statistical algorithm at athreshold of 6.0 to identify genomic intervals with copynumber changes. To reduce false positive calls, a filterwas applied to define the minimum log2 ratio (0.25), theminimum size (100 kb) and the minimum number ofprobes (100) in a CNV interval. The Derivative Log RatioSpread (DRLS), a measure of probe to probe noise calcu-lated by the CytoGenomics software, was used as a per-formance measure for hybridization quality.The karyotype of SKBR3 for reference comparison is found
at this this website: http://old-www.path.cam.ac.uk/~pawefish/BreastCellLineDescriptions/sk-br-3.htm.
Whole exome sequencingA DNA fragment library was constructed from WGAproducts from individual SKBR3 cells picked from wholeblood spike-in samples using a modified version of theNEBNext (New England Biolabs) protocol. Libraries were
Campton et al. BMC Cancer (2015) 15:360 Page 7 of 13
enriched using the SeqCap EZ Exome v3 capture system(Roche NimbleGen) for the coding portion of the genome.The target includes all coding content from the CCDS,RefSeq and miRBase databases. Paired-end (100 base pair)sequencing of enriched libraries was performed using aHiSeq 2500 system with TruSeq v3 chemistry (Illumina)with a read depth of 15 – 30x. The resulting reads werealigned to the genome human reference (hg19) usingBWA (Burrows-Wheeler Aligner) [13] and variants calledwith GATK (Genome Analysis Toolkit) [14,15].
ResultsRecovery of spiked-in mCTC from whole bloodFour cancer cell lines representing breast, prostate andlung cancer were used for mCTC recovery experiments.Approximately one hundred tumor cells (range 70 – 210)were precisely counted in capillary tubes and then spikedinto 7.5 mL of whole blood. After cells were spiked intoblood, the sample was centrifuged in the AccuCyte Separ-ation Tube resulting in separation of the blood into itscomponent layers – plasma, buffy coat and red blood cells(Figure 2A). The buffy coat was collected as described inMethods by centrifugation into the Eppendorf TransferTube (Figure 2B). Cells collected in the Transfer Tubewere spread onto a glass slide with the CyteSpreader(Figure 2 C and D), and stained on the Discovery Ultraautomated staining system, using antibodies to the epi-thelial antigens cytokeratin and EpCAM (EGFR in thecase of A549), the leukocyte antigen CD45, and a DNAdye (Hoechst 33342 or DAPI). Epithelial staining of themCTC distinguished them from cells normally withinthe blood (Figure 3). Slides were imaged on CyteFinder.After scanning, the images were analyzed by CyteMap-per software, designed to identify cells by user-definedcriteria including signal intensity, object size and cellu-lar morphology. A blinded reviewer, different from theperson who performed the spike-in, reviewed candidatecells by examining for positive epithelial antigen staining,
A B
Figure 3 Fluorescently stained model circulating tumor cellscollected and imaged using the AccuCyte® – CyteFinder® system.(A) A549 mCTC stained with antibody to EGFR (red), cytokeratin(green), and nuclear dye (blue). (B) Cluster of LnCAP mCTCs stainedwith antibody to EpCAM (red), cytokeratin (green), and nuclear dye(blue). Cells imaged at scanning 10X objective magnification.
presence of a nucleus, morphology consistent with atumor cell, and absence of staining for CD45. Cells thatmet these criteria were counted as mCTC. Objects couldbe viewed in greater detail within the software if desired.Representative images of A549 and LNCaP mCTC areshown in Figure 3.Tumor cell recovery counts were compared to the
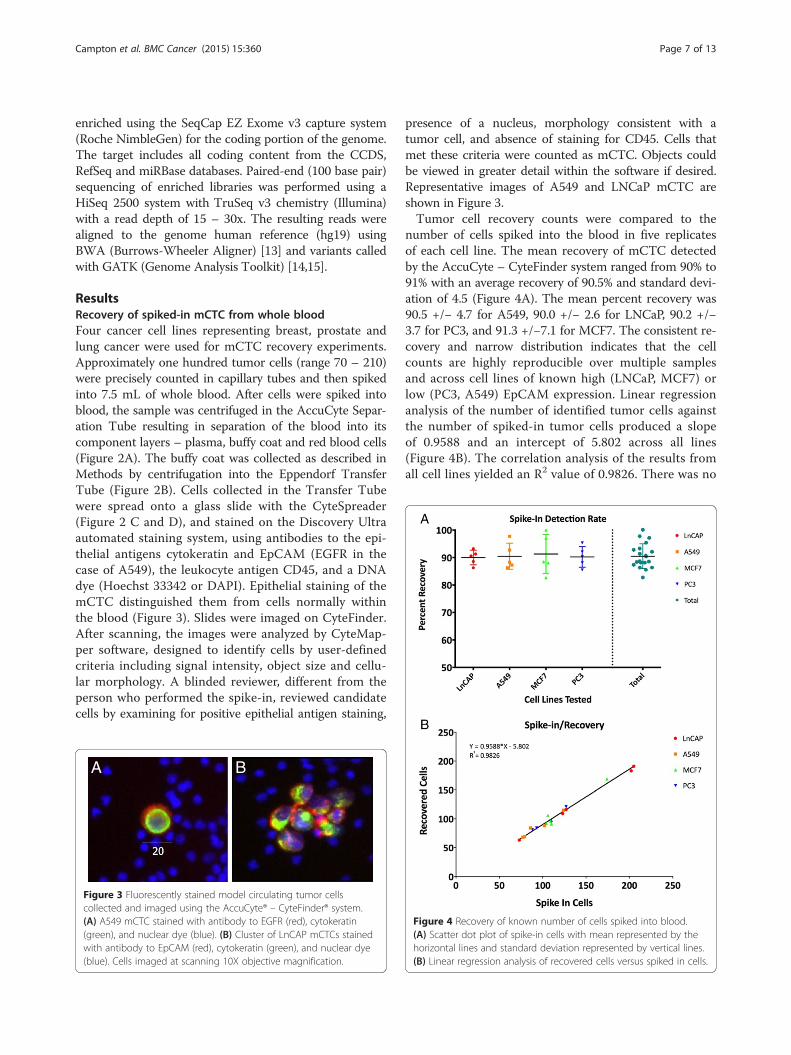
number of cells spiked into the blood in five replicatesof each cell line. The mean recovery of mCTC detectedby the AccuCyte – CyteFinder system ranged from 90% to91% with an average recovery of 90.5% and standard devi-ation of 4.5 (Figure 4A). The mean percent recovery was90.5 +/− 4.7 for A549, 90.0 +/− 2.6 for LNCaP, 90.2 +/−3.7 for PC3, and 91.3 +/−7.1 for MCF7. The consistent re-covery and narrow distribution indicates that the cellcounts are highly reproducible over multiple samplesand across cell lines of known high (LNCaP, MCF7) orlow (PC3, A549) EpCAM expression. Linear regressionanalysis of the number of identified tumor cells againstthe number of spiked-in tumor cells produced a slopeof 0.9588 and an intercept of 5.802 across all lines(Figure 4B). The correlation analysis of the results fromall cell lines yielded an R2 value of 0.9826. There was no
Figure 4 Recovery of known number of cells spiked into blood.(A) Scatter dot plot of spike-in cells with mean represented by thehorizontal lines and standard deviation represented by vertical lines.(B) Linear regression analysis of recovered cells versus spiked in cells.
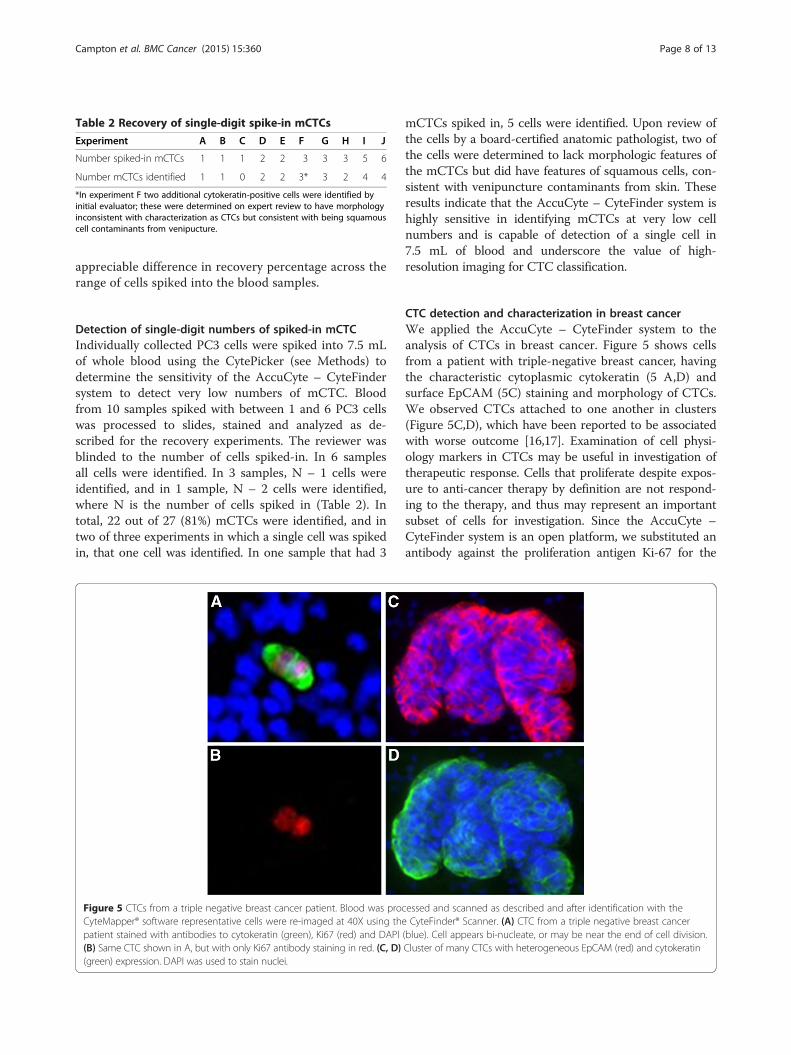
Table 2 Recovery of single-digit spike-in mCTCs
Experiment A B C D E F G H I J
Number spiked-in mCTCs 1 1 1 2 2 3 3 3 5 6
Number mCTCs identified 1 1 0 2 2 3* 3 2 4 4
*In experiment F two additional cytokeratin-positive cells were identified byinitial evaluator; these were determined on expert review to have morphologyinconsistent with characterization as CTCs but consistent with being squamouscell contaminants from venipucture.
Campton et al. BMC Cancer (2015) 15:360 Page 8 of 13
appreciable difference in recovery percentage across therange of cells spiked into the blood samples.
Detection of single-digit numbers of spiked-in mCTCIndividually collected PC3 cells were spiked into 7.5 mLof whole blood using the CytePicker (see Methods) todetermine the sensitivity of the AccuCyte – CyteFindersystem to detect very low numbers of mCTC. Bloodfrom 10 samples spiked with between 1 and 6 PC3 cellswas processed to slides, stained and analyzed as de-scribed for the recovery experiments. The reviewer wasblinded to the number of cells spiked-in. In 6 samplesall cells were identified. In 3 samples, N – 1 cells wereidentified, and in 1 sample, N – 2 cells were identified,where N is the number of cells spiked in (Table 2). Intotal, 22 out of 27 (81%) mCTCs were identified, and intwo of three experiments in which a single cell was spikedin, that one cell was identified. In one sample that had 3
Figure 5 CTCs from a triple negative breast cancer patient. Blood was proCyteMapper® software representative cells were re-imaged at 40X using thepatient stained with antibodies to cytokeratin (green), Ki67 (red) and DAPI(B) Same CTC shown in A, but with only Ki67 antibody staining in red. (C, D)(green) expression. DAPI was used to stain nuclei.
mCTCs spiked in, 5 cells were identified. Upon review ofthe cells by a board-certified anatomic pathologist, two ofthe cells were determined to lack morphologic features ofthe mCTCs but did have features of squamous cells, con-sistent with venipuncture contaminants from skin. Theseresults indicate that the AccuCyte – CyteFinder system ishighly sensitive in identifying mCTCs at very low cellnumbers and is capable of detection of a single cell in7.5 mL of blood and underscore the value of high-resolution imaging for CTC classification.
CTC detection and characterization in breast cancerWe applied the AccuCyte – CyteFinder system to theanalysis of CTCs in breast cancer. Figure 5 shows cellsfrom a patient with triple-negative breast cancer, havingthe characteristic cytoplasmic cytokeratin (5 A,D) andsurface EpCAM (5C) staining and morphology of CTCs.We observed CTCs attached to one another in clusters(Figure 5C,D), which have been reported to be associatedwith worse outcome [16,17]. Examination of cell physi-ology markers in CTCs may be useful in investigation oftherapeutic response. Cells that proliferate despite expos-ure to anti-cancer therapy by definition are not respond-ing to the therapy, and thus may represent an importantsubset of cells for investigation. Since the AccuCyte –CyteFinder system is an open platform, we substituted anantibody against the proliferation antigen Ki-67 for the
cessed and scanned as described and after identification with theCyteFinder® Scanner. (A) CTC from a triple negative breast cancer
(blue). Cell appears bi-nucleate, or may be near the end of cell division.Cluster of many CTCs with heterogeneous EpCAM (red) and cytokeratin
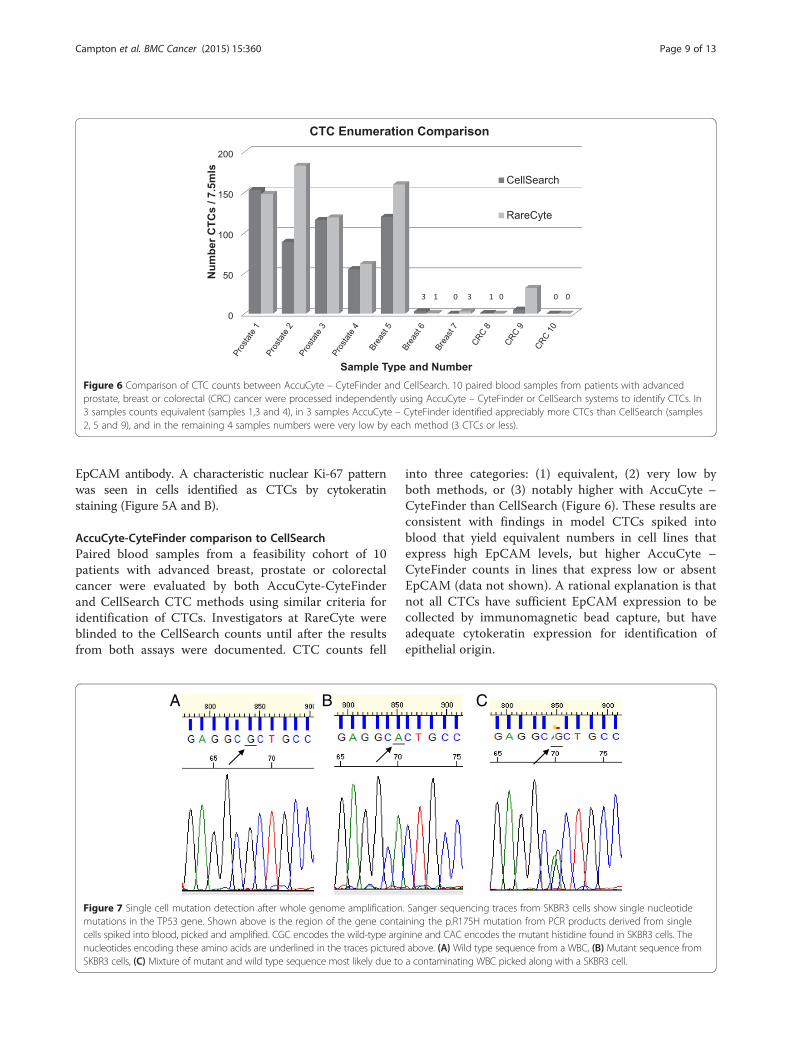
Figure 6 Comparison of CTC counts between AccuCyte – CyteFinder and CellSearch. 10 paired blood samples from patients with advancedprostate, breast or colorectal (CRC) cancer were processed independently using AccuCyte – CyteFinder or CellSearch systems to identify CTCs. In3 samples counts equivalent (samples 1,3 and 4), in 3 samples AccuCyte – CyteFinder identified appreciably more CTCs than CellSearch (samples2, 5 and 9), and in the remaining 4 samples numbers were very low by each method (3 CTCs or less).
Campton et al. BMC Cancer (2015) 15:360 Page 9 of 13
EpCAM antibody. A characteristic nuclear Ki-67 patternwas seen in cells identified as CTCs by cytokeratinstaining (Figure 5A and B).
AccuCyte-CyteFinder comparison to CellSearchPaired blood samples from a feasibility cohort of 10patients with advanced breast, prostate or colorectalcancer were evaluated by both AccuCyte-CyteFinderand CellSearch CTC methods using similar criteria foridentification of CTCs. Investigators at RareCyte wereblinded to the CellSearch counts until after the resultsfrom both assays were documented. CTC counts fell
A B
Figure 7 Single cell mutation detection after whole genome amplificationmutations in the TP53 gene. Shown above is the region of the gene contacells spiked into blood, picked and amplified. CGC encodes the wild-type argnucleotides encoding these amino acids are underlined in the traces picturedSKBR3 cells, (C) Mixture of mutant and wild type sequence most likely due to
into three categories: (1) equivalent, (2) very low byboth methods, or (3) notably higher with AccuCyte –CyteFinder than CellSearch (Figure 6). These results areconsistent with findings in model CTCs spiked intoblood that yield equivalent numbers in cell lines thatexpress high EpCAM levels, but higher AccuCyte –CyteFinder counts in lines that express low or absentEpCAM (data not shown). A rational explanation is thatnot all CTCs have sufficient EpCAM expression to becollected by immunomagnetic bead capture, but haveadequate cytokeratin expression for identification ofepithelial origin.
C
. Sanger sequencing traces from SKBR3 cells show single nucleotideining the p.R175H mutation from PCR products derived from singleinine and CAC encodes the mutant histidine found in SKBR3 cells. Theabove. (A) Wild type sequence from a WBC, (B) Mutant sequence froma contaminating WBC picked along with a SKBR3 cell.
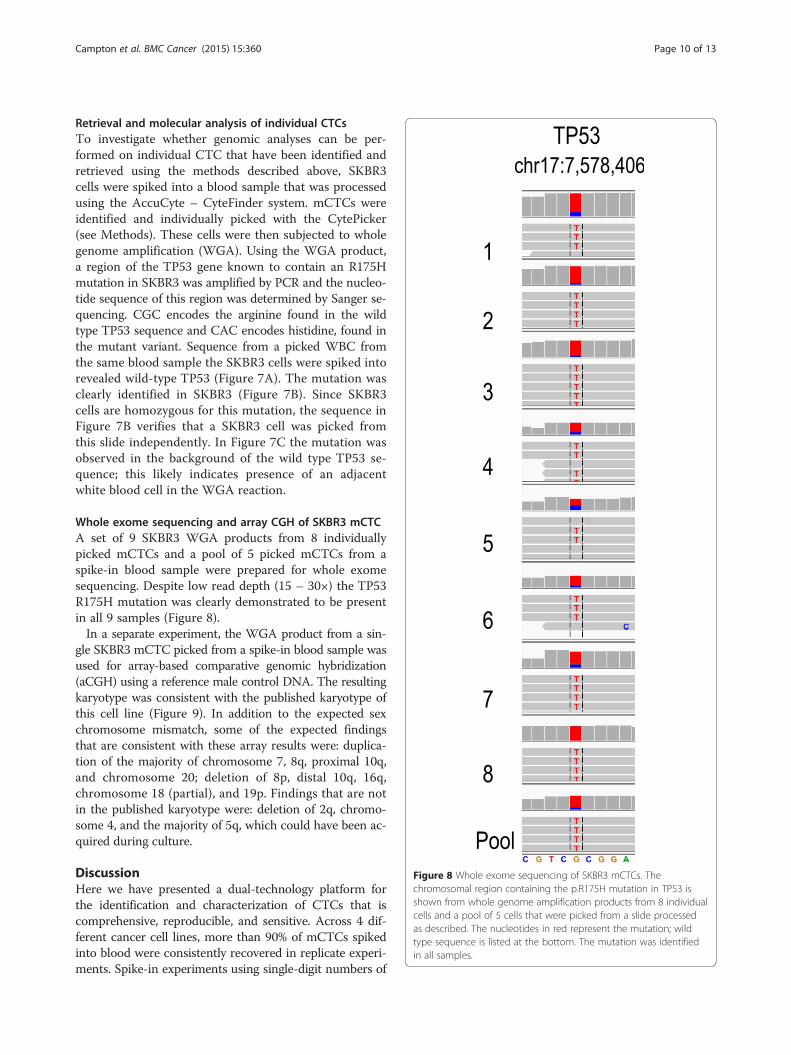
Figure 8 Whole exome sequencing of SKBR3 mCTCs. Thechromosomal region containing the p.R175H mutation in TP53 isshown from whole genome amplification products from 8 individualcells and a pool of 5 cells that were picked from a slide processedas described. The nucleotides in red represent the mutation; wildtype sequence is listed at the bottom. The mutation was identifiedin all samples.
Campton et al. BMC Cancer (2015) 15:360 Page 10 of 13
Retrieval and molecular analysis of individual CTCsTo investigate whether genomic analyses can be per-formed on individual CTC that have been identified andretrieved using the methods described above, SKBR3cells were spiked into a blood sample that was processedusing the AccuCyte – CyteFinder system. mCTCs wereidentified and individually picked with the CytePicker(see Methods). These cells were then subjected to wholegenome amplification (WGA). Using the WGA product,a region of the TP53 gene known to contain an R175Hmutation in SKBR3 was amplified by PCR and the nucleo-tide sequence of this region was determined by Sanger se-quencing. CGC encodes the arginine found in the wildtype TP53 sequence and CAC encodes histidine, found inthe mutant variant. Sequence from a picked WBC fromthe same blood sample the SKBR3 cells were spiked intorevealed wild-type TP53 (Figure 7A). The mutation wasclearly identified in SKBR3 (Figure 7B). Since SKBR3cells are homozygous for this mutation, the sequence inFigure 7B verifies that a SKBR3 cell was picked fromthis slide independently. In Figure 7C the mutation wasobserved in the background of the wild type TP53 se-quence; this likely indicates presence of an adjacentwhite blood cell in the WGA reaction.
Whole exome sequencing and array CGH of SKBR3 mCTCA set of 9 SKBR3 WGA products from 8 individuallypicked mCTCs and a pool of 5 picked mCTCs from aspike-in blood sample were prepared for whole exomesequencing. Despite low read depth (15 – 30×) the TP53R175H mutation was clearly demonstrated to be presentin all 9 samples (Figure 8).In a separate experiment, the WGA product from a sin-
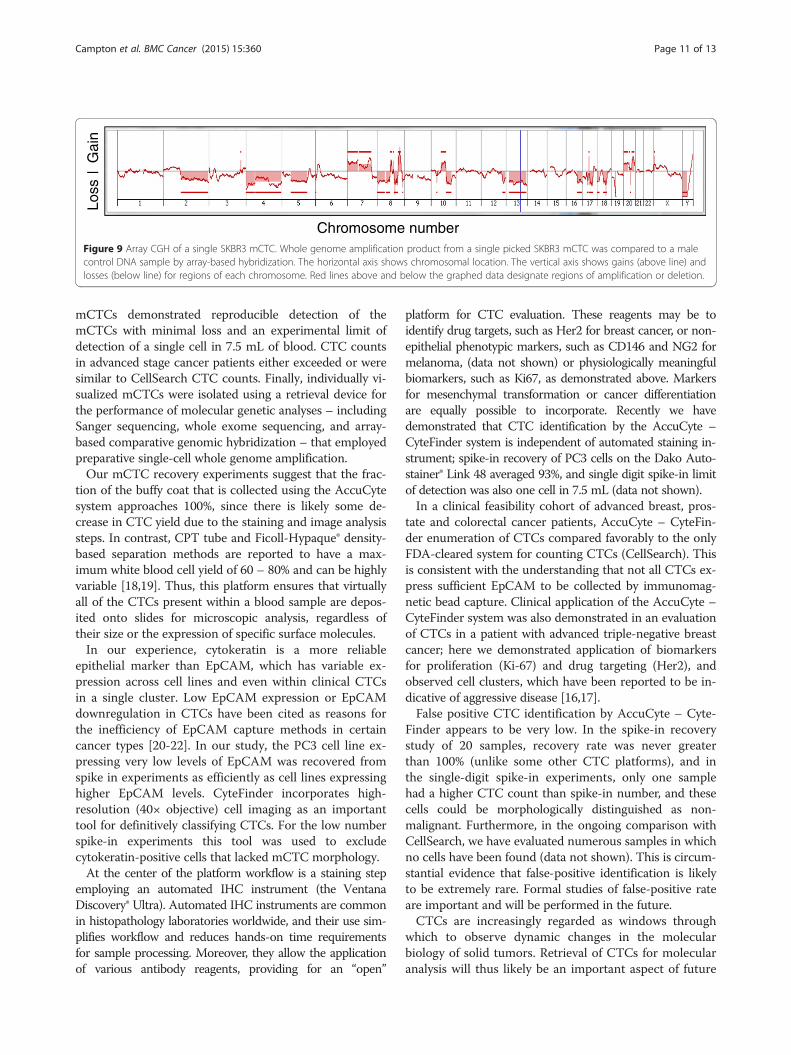
gle SKBR3 mCTC picked from a spike-in blood sample wasused for array-based comparative genomic hybridization(aCGH) using a reference male control DNA. The resultingkaryotype was consistent with the published karyotype ofthis cell line (Figure 9). In addition to the expected sexchromosome mismatch, some of the expected findingsthat are consistent with these array results were: duplica-tion of the majority of chromosome 7, 8q, proximal 10q,and chromosome 20; deletion of 8p, distal 10q, 16q,chromosome 18 (partial), and 19p. Findings that are notin the published karyotype were: deletion of 2q, chromo-some 4, and the majority of 5q, which could have been ac-quired during culture.
DiscussionHere we have presented a dual-technology platform forthe identification and characterization of CTCs that iscomprehensive, reproducible, and sensitive. Across 4 dif-ferent cancer cell lines, more than 90% of mCTCs spikedinto blood were consistently recovered in replicate experi-ments. Spike-in experiments using single-digit numbers of
Loss
|G
ain
Chromosome numberFigure 9 Array CGH of a single SKBR3 mCTC. Whole genome amplification product from a single picked SKBR3 mCTC was compared to a malecontrol DNA sample by array-based hybridization. The horizontal axis shows chromosomal location. The vertical axis shows gains (above line) andlosses (below line) for regions of each chromosome. Red lines above and below the graphed data designate regions of amplification or deletion.
Campton et al. BMC Cancer (2015) 15:360 Page 11 of 13
mCTCs demonstrated reproducible detection of themCTCs with minimal loss and an experimental limit ofdetection of a single cell in 7.5 mL of blood. CTC countsin advanced stage cancer patients either exceeded or weresimilar to CellSearch CTC counts. Finally, individually vi-sualized mCTCs were isolated using a retrieval device forthe performance of molecular genetic analyses – includingSanger sequencing, whole exome sequencing, and array-based comparative genomic hybridization – that employedpreparative single-cell whole genome amplification.Our mCTC recovery experiments suggest that the frac-
tion of the buffy coat that is collected using the AccuCytesystem approaches 100%, since there is likely some de-crease in CTC yield due to the staining and image analysissteps. In contrast, CPT tube and Ficoll-Hypaque® density-based separation methods are reported to have a max-imum white blood cell yield of 60 – 80% and can be highlyvariable [18,19]. Thus, this platform ensures that virtuallyall of the CTCs present within a blood sample are depos-ited onto slides for microscopic analysis, regardless oftheir size or the expression of specific surface molecules.In our experience, cytokeratin is a more reliable
epithelial marker than EpCAM, which has variable ex-pression across cell lines and even within clinical CTCsin a single cluster. Low EpCAM expression or EpCAMdownregulation in CTCs have been cited as reasons forthe inefficiency of EpCAM capture methods in certaincancer types [20-22]. In our study, the PC3 cell line ex-pressing very low levels of EpCAM was recovered fromspike in experiments as efficiently as cell lines expressinghigher EpCAM levels. CyteFinder incorporates high-resolution (40× objective) cell imaging as an importanttool for definitively classifying CTCs. For the low numberspike-in experiments this tool was used to excludecytokeratin-positive cells that lacked mCTC morphology.At the center of the platform workflow is a staining step
employing an automated IHC instrument (the VentanaDiscovery® Ultra). Automated IHC instruments are commonin histopathology laboratories worldwide, and their use sim-plifies workflow and reduces hands-on time requirementsfor sample processing. Moreover, they allow the applicationof various antibody reagents, providing for an “open”
platform for CTC evaluation. These reagents may be toidentify drug targets, such as Her2 for breast cancer, or non-epithelial phenotypic markers, such as CD146 and NG2 formelanoma, (data not shown) or physiologically meaningfulbiomarkers, such as Ki67, as demonstrated above. Markersfor mesenchymal transformation or cancer differentiationare equally possible to incorporate. Recently we havedemonstrated that CTC identification by the AccuCyte –CyteFinder system is independent of automated staining in-strument; spike-in recovery of PC3 cells on the Dako Auto-stainer® Link 48 averaged 93%, and single digit spike-in limitof detection was also one cell in 7.5 mL (data not shown).In a clinical feasibility cohort of advanced breast, pros-
tate and colorectal cancer patients, AccuCyte – CyteFin-der enumeration of CTCs compared favorably to the onlyFDA-cleared system for counting CTCs (CellSearch). Thisis consistent with the understanding that not all CTCs ex-press sufficient EpCAM to be collected by immunomag-netic bead capture. Clinical application of the AccuCyte –CyteFinder system was also demonstrated in an evaluationof CTCs in a patient with advanced triple-negative breastcancer; here we demonstrated application of biomarkersfor proliferation (Ki-67) and drug targeting (Her2), andobserved cell clusters, which have been reported to be in-dicative of aggressive disease [16,17].False positive CTC identification by AccuCyte – Cyte-
Finder appears to be very low. In the spike-in recoverystudy of 20 samples, recovery rate was never greaterthan 100% (unlike some other CTC platforms), and inthe single-digit spike-in experiments, only one samplehad a higher CTC count than spike-in number, and thesecells could be morphologically distinguished as non-malignant. Furthermore, in the ongoing comparison withCellSearch, we have evaluated numerous samples in whichno cells have been found (data not shown). This is circum-stantial evidence that false-positive identification is likelyto be extremely rare. Formal studies of false-positive rateare important and will be performed in the future.CTCs are increasingly regarded as windows through
which to observe dynamic changes in the molecularbiology of solid tumors. Retrieval of CTCs for molecularanalysis will thus likely be an important aspect of future
Campton et al. BMC Cancer (2015) 15:360 Page 12 of 13
CTC technologies. We have demonstrated the use of anintegrated single cell retrieval device, the CytePicker, thatcan routinely collect individual cells that are adherent tomicroscopic slides after identification with CyteFinder. Theprocess is compatible with whole genome amplification ofsingle cells, which then can be followed by various molecu-lar genetic analysis methods. Here we have shown thatboth nested PCR followed by Sanger sequencing and wholeexome sequencing identifed a known TP53 mutation inSKBR3 mCTCs, and that array-based comparative genomichybridization confirmed the reported SKBR3 karyotype.Similar investigations are currently being undertaken insingle CTCs from cancer patient samples.
ConclusionWe have developed a comprehensive and sensitivedual-technology platform for flexible identification andcharacterization of CTCs on microscopic slides usingestablished histopathology staining instruments. Theplatform has been successfully applied to longitudinalinvestigation of a patient with breast cancer on a clinicaltrial protocol and it can readily isolate single cells for se-quencing and other genomic analyses. It thus permitsthe non-invasive and repeated accurate monitoring oftherapeutic response and evolving cancer biology to en-able personalized, molecularly-guided cancer treatment.
Additional files
Additional file 1: Figure S1. Live cells were freshly prepared as asuspension and the nuclei were fluorescently pre-labeled before beingdrawn into a capillary tube (VitroTube®). The VitroTube was then scannedand cells were counted on a fluorescent microscope. Cells were expelledinto blood sample by flushing with PBS and the VitroTube was rescannedand counted to obtain the net count of the cells added to the blood.(A) Fluorescent scan of Hoechst-stained cells in VitroTube (transmittedlight overlay). (B) VitroTube on slide for scanning.
Additional file 2: Figure S2. Workflow for obtaining buffy coat usingthe AccuCyte® density-based separation system. A Add blood intoAccuCyte Separation Tube containing float. B Centrifuge sample toseparate constituent layers (top to bottom: plasma, buffy coat, red bloodcells). C Apply sealing ring (arrow-head). D. Aspirate plasma (left); addhigh-density retrieval (HDR) fluid (right). E Insert EpiCollector™. F. InsertTransfer Tube pre-loaded with HDR fluid into EpiCollector. G. Duringsecond centrifugation, the HDR fluid displaces buffy coat cells which floatto the top of the HDR fluid inside the Transfer Tube. H. Remove TransferTube containing buffy coat (Note: small amount of residual plasmaremaining on float is collected, as well as small amount of red blood cells,due to placement of the sealing ring just below buffy coat – red bloodcell interface).
Additional file 3: Figure S3. (A). Buffy coat spread onto slide preparedfor automated staining. (B) Scan of slide after immunofluoresencestaining comprised of 2419 individual 10x image panels. (C) The singlepanel (arrow in panel B) shows one such 10x image identified by theCyteMapper® software as containing a candidate CTC in box. (D) Cytokeratinpositive CTC. Stains: DAPI (blue), CD45 (orange) and cytokeratin (green).
Additional file 4: Figure S4. CyteMapper® review software display ofobjects of interest from whole-slide scans. Candidate CTCs are identifiedby the analysis software using criteria such as signal intensity, object sizeand cellular morphology. Images are presented for characterization and
enumeration of CTCs. Each channel can be viewed independently or inany combination and objects can be shown in greater detail to resolvesubcellular details. The top row represents a fluorescent object found bythe software that was rejected by the reviewer since morphology andstaining are not consistent with classification CTC. The bottom rowrepresents a candidate cell classified as a mCTC that is positive in allchannels except for the channel containing CD45.
Additional file 5: Figure S5. CytePicker® single cell retrieval device.Candidate CTCs that are identified after CyteFinder® imaging can bepicked using a software module that positions the needle tip over thecell of interest.
Additional file 6: Figure S6. Visual confirmation of cell removal withthe CytePicker®. (A) 10X objective magnification image from CyteFinderof a model CTC (PC3 cell) stained with anti-cytokeratin antibody (green)in a background of white blood cells (blue nuclei) immediately beforepicking using the CytePicker module. (B) Image of the same region ofthe slide immediately after picking the model CTC. [Note: these imageswere made using the most recent version of the CyteFinder withCytePicker module].
Competing interestsACC, AB, MD, SB, CAB, and DES declare that they have no competinginterests. DEC, ABR, JJN, ND, PV, BHF, SQ, JLS and EPK are employees ofRareCyte, Inc.
Authors’ contributionsDEK performed spike-in study, contributed to protocol development, andcontributed to AccuCyte - CyteFinder design. ABR generated images fromclinical samples, contributed to protocol development, and preparedindividual cells for next generation sequencing. JJN contributed to CyteFinderdesign and protocol development. ND generated the CTC counts from clinicalsamples. ACC coordinated patient accrual and consent. PV developed the celldetection algorithm and software. BHF developed the image acquisitionalgorithm and software. SQ designed the AccuCyte components andCyteFinder and CytePicker hardware. AB performed the single cell arrayCGH. MD performed the next generation sequencing and analysis on singlecells. SB and CAB recruited patients and participated in study design. DASparticipated in study design, data analysis, and supervised cell enumerationby CellSearch. JLS performed PCR and Sanger sequencing and participatedin study design and manuscript preparation. EPK approved the studydesign, performed data analysis, coordinated study efforts and manuscriptpreparation. All authors read and approved the final manuscript.
AcknowledgementsThe authors gratefully recognize Elizabeth Mahen and Kimberly Burton forsupport in the breast cancer clinical study, and Drs. David Parkinson andJohn Rasko for critical reading of the manuscript.
Author details1RareCyte, Inc, Seattle, WA, USA. 2Medical Genetics Laboratories, BaylorCollege of Medicine, Houston, USA. 3Department of Pathology, University ofWashington, Washington, USA. 4Rainier Hematology-Oncology, NorthwestMedical Specialties, Washington, USA. 5Center for Cancer Innovation,University of Washington, Washington, USA. 6Departments of LaboratoryMedicine and Medicine, University of Washington, Washington, USA.
Received: 1 October 2014 Accepted: 28 April 2015
References1. Wittekind C, Neid M. Cancer invasion and metastasis. Oncology. 2005;69
Suppl 1:14–6.2. Kim MY, Oskarsson T, Acharyya S, Nguyen DX, Zhang XH, Norton L, et al.
Tumor self-seeding by circulating cancer cells. Cell. 2009;139(7):1315–26.3. Cristofanilli M, Budd GT, Ellis MJ, Stopeck A, Matera J, Miller MC, et al.
Circulating tumor cells, disease progression, and survival in metastaticbreast cancer. N Engl J Med. 2004;351(8):781–91.
4. de Bono JS, Scher HI, Montgomery RB, Parker C, Miller MC, Tissing H, et al.Circulating tumor cells predict survival benefit from treatment in metastaticcastration-resistant prostate cancer. Clin Cancer Res. 2008;14(19):6302–9.
Campton et al. BMC Cancer (2015) 15:360 Page 13 of 13
5. Cohen SJ, Punt CJ, Iannotti N, Saidman BH, Sabbath KD, Gabrail NY, et al.Relationship of circulating tumor cells to tumor response, progression-freesurvival, and overall survival in patients with metastatic colorectal cancer.J Clin Oncol. 2008;26(19):3213–21.
6. Parkinson DR, Dracopoli N, Petty BG, Compton C, Cristofanilli M, DeisserothA, et al. Considerations in the development of circulating tumor celltechnology for clinical use. J Transl Med. 2012;10:138.
7. Meng S, Tripathy D, Frenkel EP, Shete S, Naftalis EZ, Huth JF, et al.Circulating tumor cells in patients with breast cancer dormancy. Clin CancerRes. 2004;10(24):8152–62.
8. Allard WJ, Matera J, Miller MC, Repollet M, Connelly MC, Rao C, et al. Tumorcells circulate in the peripheral blood of all major carcinomas but not inhealthy subjects or patients with nonmalignant diseases. Clin Cancer Res.2004;10(20):6897–904.
9. Riethdorf S, Fritsche H, Muller V, Rau T, Schindlbeck C, Rack B, et al.Detection of circulating tumor cells in peripheral blood of patients withmetastatic breast cancer: a validation study of the Cell Search system. ClinCancer Res. 2007;13(3):920–8.
10. Koressaar T, Remm M. Enhancements and modifications of primer designprogram Primer3. Bioinformatics. 2007;23(10):1289–91.
11. Untergasser A, Cutcutache I, Koressaar T, Ye J, Faircloth BC, Remm M, et al.Primer3–new capabilities and interfaces. Nucleic Acids Res. 2012;40(15):e115.
12. Bi W, Borgan C, Pursley AN, Hixson P, Shaw CA, Bacino CA, et al.Comparison of chromosome analysis and chromosomal microarray analysis:what is the value of chromosome analysis in today’s genomic array era?Genet Med. 2013;15(6):450–7.
13. Li H, Durbin R. Fast and accurate short read alignment with Burrows-Wheeler transform. Bioinformatics. 2009;25(14):1754–60.
14. McKenna A, Hanna M, Banks E, Sivachenko A, Cibulskis K, Kernytsky A, et al.The genome analysis toolkit: a MapReduce framework for analyzingnext-generation DNA sequencing data. Genome Res. 2010;20(9):1297–303.
15. DePristo MA, Banks E, Poplin R, Garimella KV, Maguire JR, Hartl C, et al. Aframework for variation discovery and genotyping using next-generationDNA sequencing data. Nat Genet. 2011;43(5):491–8.
16. Hou JM, Krebs MG, Lancashire L, Sloane R, Backen A, Swain RK, et al. Clinicalsignificance and molecular characteristics of circulating tumor cells andcirculating tumor microemboli in patients with small-cell lung cancer.J Clinical Oncol. 2012;30(5):525–32.
17. Divella R, Daniele A, Abbate I, Bellizzi A, Savino E, Simone G, et al. Thepresence of clustered circulating tumor cells (CTCs) and circulatingcytokines define an aggressive phenotype in metastatic colorectal cancer.Cancer causes & control : CCC. 2014. doi:10.1007/s10552-014-0457-4.PubMed PMID: 25135616.
18. Schlenke P, Kluter H, Muller-Steinhardt M, Hammers HJ, Borchert K, Bein G.Evaluation of a novel mononuclear cell isolation procedure for serologicalHLA typing. Clin Diagn Lab Immunol. 1998;5(6):808–13.
19. Nilsson C, Aboud S, Karlen K, Hejdeman B, Urassa W, Biberfeld G. Optimalblood mononuclear cell isolation procedures for gamma interferonenzyme-linked immunospot testing of healthy Swedish and Tanzaniansubjects. Clin Vaccine Immunol. 2008;15(4):585–9.
20. Rao CG, Chianese D, Doyle GV, Miller MC, Russell T, Sanders Jr RA, et al.Expression of epithelial cell adhesion molecule in carcinoma cells present inblood and primary and metastatic tumors. Int J Oncol. 2005;27(1):49–57.
21. Krebs MG, Sloane R, Priest L, Lancashire L, Hou JM, Greystoke A, et al.Evaluation and prognostic significance of circulating tumor cells in patientswith non-small-cell lung cancer. J Clinical Oncol. 2011;29(12):1556–63.
22. Thurm H, Ebel S, Kentenich C, Hemsen A, Riethdorf S, Coith C, et al. Rareexpression of epithelial cell adhesion molecule on residual micrometastaticbreast cancer cells after adjuvant chemotherapy. Clin Cancer Res.2003;9(7):2598–604.
Submit your next manuscript to BioMed Centraland take full advantage of:
• Convenient online submission
• Thorough peer review
• No space constraints or color figure charges
• Immediate publication on acceptance
• Inclusion in PubMed, CAS, Scopus and Google Scholar
• Research which is freely available for redistribution
Submit your manuscript at www.biomedcentral.com/submit