Embed Size (px)
Citation preview
High Resolution 3-D FluorescenceMicroscopy: A Comparison of
Confocal Laser Scanning Microscopyand a wide-Field Deconvolution
TechniqueScanalytics, Inc.*
AbstractAdvances in the biological sciences have given rise for the need to
visualize microscopic structures of interest. As the requirement to seespecific structure and sub-resolution details arise, investigators have turnedto fluorescent probes to label and observe these details, which are oftenundetectable using conventional methods in light microscopy. Fluorescencemicroscopy offers many advantages for visualizing specific structure andsub-resolution details, which are often undetectable using transmitted lightmicroscopy. Recent advances in fluorescent probe and microscope design,as well as imaging instrumentation designed for fluorescence applications,are now permitting life-science researchers to view details in regions ofinterest with increasing precision, accuracy, and resolution. Wide fieldepifluorescence microscopy is presently the easiest and least expensivemethod for visualizing virtually any fluorescently labeled structure. However,it can be less than optimal for visualizing three-dimensional image volumes,samples heavily labeled with fluorescent dye, or samples that possess fine orweakly labeled detail obscured by interference from signal above and belowthe image plane of interest, The techniques used to perform high-resolution3D fluorescence microscopy vary, but emerging as two popular methods arethose of confocal laser scanning microscopy and deconvolution of widefieldimages. Much attention has been given to these approaches over recentyears. The goal of this article is to familiarize the reader with both tech-niques, and allow for an understanding of the application areas in which onemay be preferable over the other.
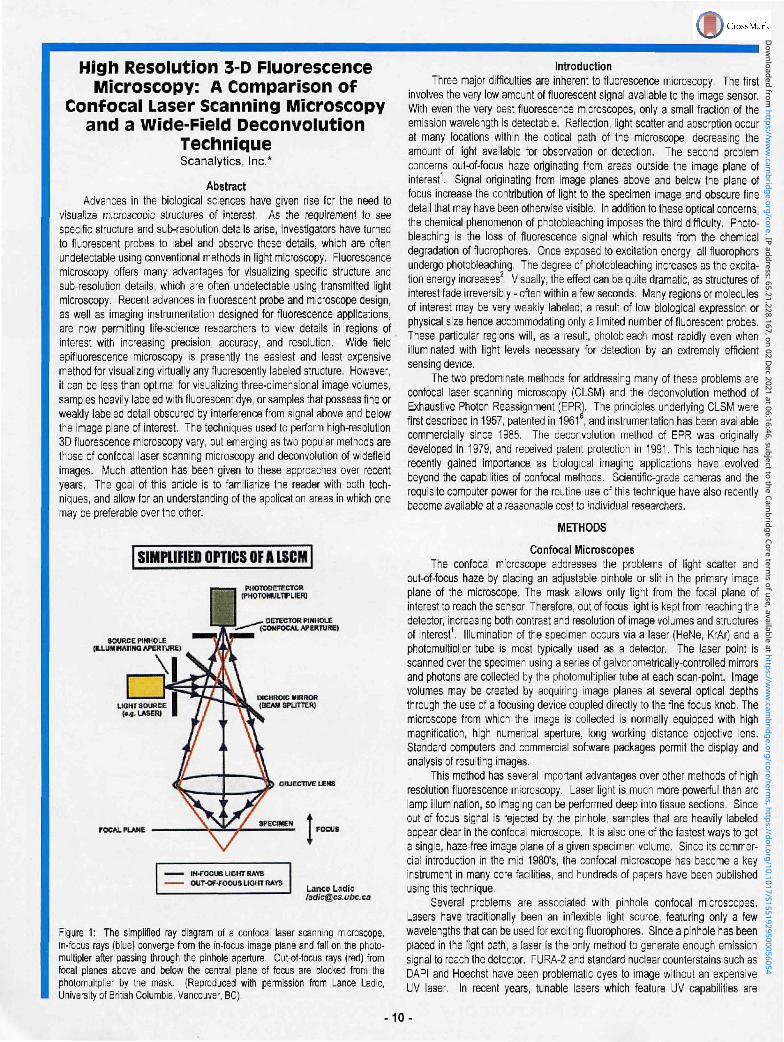
I SIMPLIFIED OPTICS OF flLSCM |
DETECTOR PIKHOLE[CONFOCAL « ' E «rune i
W t l W E PINHOLE(IU.UM IKAIINC AFERIUREI
OBJECTIVE LENS
fOCAL PLANE
IN rocus ucm n.wsOUT-Of -FOCUS UQHT RAYS
Lance La [email protected]
Figure 1: The simplified ray diagram of a confocal laser scanning microscope.In-focjs rays (blue) converge from the in-focjs image plane and fell on the photo-multipler after passing through the pinhole aperture. Out-of-focus rays (red) fromfocal planes above and below the central plane of focus are blocked from thephotomultplier by the mask. (Reproduced with permission from Lance Ladic,University of British Columbia, Vancouver, BC).
IntroductionThree major difficulties are inherent to fluorescence microscopy. The first
involves the very low amount of fluorescent signal available to the image sensor.With even the very best fluorescence microscopes, only a small fraction of theemission wavelength is detectable. Reflection, light scatter and absorption occurat many locations within the optical path of the microscope, decreasing theamount of light available for observation or detection. The second problemconcerns out-of-focus haze originating from areas outside the image plane ofinterest1. Signal originating from image planes above and below the plane offocus increase the contribution of light to the specimen image and obscure finedetail that may have been otherwise visible, In addition to these optical concerns,the chemical phenomenon of photo bleach ing imposes the third difficulty. Photo-bleaching is the loss of fluorescence signal which results from the chemicaldegradation of fluorophores. Once exposed to excitation energy, all fluorophorsundergo photo bleach ing, The degree of photobleaching increases as the excita-tion energy increases2. Visually, the effect can be quite dramatic, as structures ofinterest fade irreversibly - often within a few seconds. Many regions or moleculesof interest may be very weakly labeled; a result of low biological expression orphysical size hence accommodating only a limited number of fluorescent probes.These particular regions will, as a result, photobleach most rapidly even whenilluminated with light levels necessary for detection by an extremely efficientsensing device.
The two predominate methods for addressing many of these problems areconfocal laser scanning microscopy (CLSM) and the deconvolution method ofExhaustive Photon Reassignment (EPRJ. The principles underlying CLSM werefirst described in 1957, patented in 1961 , and instrumentation has been availablecommercially since 1965, The deconvolution method of EPR was originallydeveloped in 1979, and received patent protection in 1991. This technique hasrecently gained importance as biological imaging applications have evolvedbeyond the capabilities of confocal methods. Scientific-grade cameras and therequisite computer power for the routine use of this technique have also recentlybecome available at a reasonable cost to individual researchers.
METHODS
Confocal MicroscopesThe confocal microscope addresses the problems of light scatter and
out-of-focus haze by placing an adjustable pinhole or slit in the primary imageplane of the microscope. The mask allows only light from the focal plane ofinterest to reach the sensor, Therefore, out of focus light is kept from reaching thedetector, increasing both contrast and resolution of image volumes and structuresof interest1. Illumination of the specimen occurs via a laser (HeNe. KrAr) and aphotomultiplier tube is most typically used as a detector. The laser point isscanned over the specimen using a series of gafvonometricalIy-controlIed mirrorsand photons are collected by the photomultiplier tube at each scan-point. Imagevolumes may be created by acquiring image planes at several optical depthsthrough the use of a focusing device coupled directly to the fine focus knob. Themicroscope from which the image is collected is normally equipped with highmagnification, high numerical aperture, long working distance objective lens.Standard computers and commercial software packages permit the display andanalysis of resulting images.
This method has several important advantages over other methods of highresolution fluorescence microscopy. Laser light is much more powerful than arclamp illumination, so imaging can be performed deep into tissue sections. Sinceout of focus signal is rejected by the pinhole, samples that are heavily labeledappear clear in the confocal microscope. It is also one of the fastest ways to geta single, haze-free image plane of a given specimen volume. Since its commer-cial introduction in the mid 1980's, the confocal microscope has become a keyinstrument in many core facilities, and hundreds of papers have been publishedusing this technique.
Several problems are associated with pinhole confocal microscopes.Lasers have traditionally been an inflexible light source, featuring only a fewwavelengths that can be used for exciting fluorophores, Since a pinhole has beenplaced in the light path, a laser is the only method to generate enough emissionsignal to reach the detector, FURA-2 and standard nuclear counterstains such asDAPI and Hoechst have been problematic dyes to image without an expensiveUV laser, In recent years, tunable lasers which feature UV capabilities are
-10.
Dow
nloaded from https://w
ww
.cambridge.org/core . IP address: 65.21.228.167 , on 02 D
ec 2021 at 06:16:46 , subject to the Cambridge Core term
s of use, available at https://ww
w.cam
bridge.org/core/terms . https://doi.org/10.1017/S1551929500056054
corning down in price, but are still prohibitively expensive in many cases. Lasershave other drawbacks, such as causing severe photodamage and decreasing thetime it takes for a specimen to photobleach.
Photon efficiency for CLSM system has been reported to be less than1%3. Pinhole confocal microscopes, therefore, usually have scan times of 240seconds, depending on the desired quality of final image. Short scan times oftenresult in images that are poorly resolved, while movement of the specimen duringa longer scan time poses problems for imaging dynamic events over time. Inaddition, living specimens often react poorly to continued illumination with laserlight.
Quantitation of intensity values presents many challenges for confocalmicroscopy, but experimental methods have been devised to permit their use insome quantitative studies'1. The photomultiplier tube is non-linear in its detectionof photons. This situation is exacerbated by the photobleaching caused by thelaser.
Confocal microscopes typically require management by a sophisticated,knowledgeable user, Many confocal manufacturers have addressed these con-cerns in recent years, and they have automated many of the settings. While thisincreases the ease of use for most researchers, these instruments still require agreat deal of maintenance, and a dedicated professional is usually charged withday-to-day operation of the instrument.
One method of increasing the amount of signal detected is to decrease theamount of signal rejected. The use of a slit in the primary image plane, ratherthan a pinhole allows a swath of light to be scanned over the specimen, andhence a greater volume of light is allowed to reach the detector. This has severaladvantages over a pinhole confocal microscope, First, it increases the detectionof faint or rapidly photobleaching signals, since more light is allowed to pass tothe detector. Second, scan times are greatly reduced, so living specimens aremore easily imaged with this type of confocal. Slit confocal microscopes alsorequire lasers, so they continue to have problems with photobleaching andphotodamage. Finally, since a slit confocal microscope allows more light to passto the specimen and to the detector, resolution is sacrificed due to an increase inout-of-focus light remaining in the images.
De con volutionDeconvolution describes many image and signal processing algorithms with
applications in fields as diverse as astronomy, seismology and life scienceimaging. Discussed here is a rigorous and patented method of deconvolutionknown as Exhaustive Photon Reassignment (or EPR) developed and optimized toproduce quantitatively correct, high contrast, high resolution images from vol-umes acquired through wide-field fluorescence microscopes". This algorithmcharacterizes the optical properties of fluorescence microscopes, then applies
this characterization to reverse the optical properties. The effect of theprocess is to reassign out-of-focus light back to its original locations within (oroutside of) the image volume and to reverse many of the aberrations intro-duced by the optics.
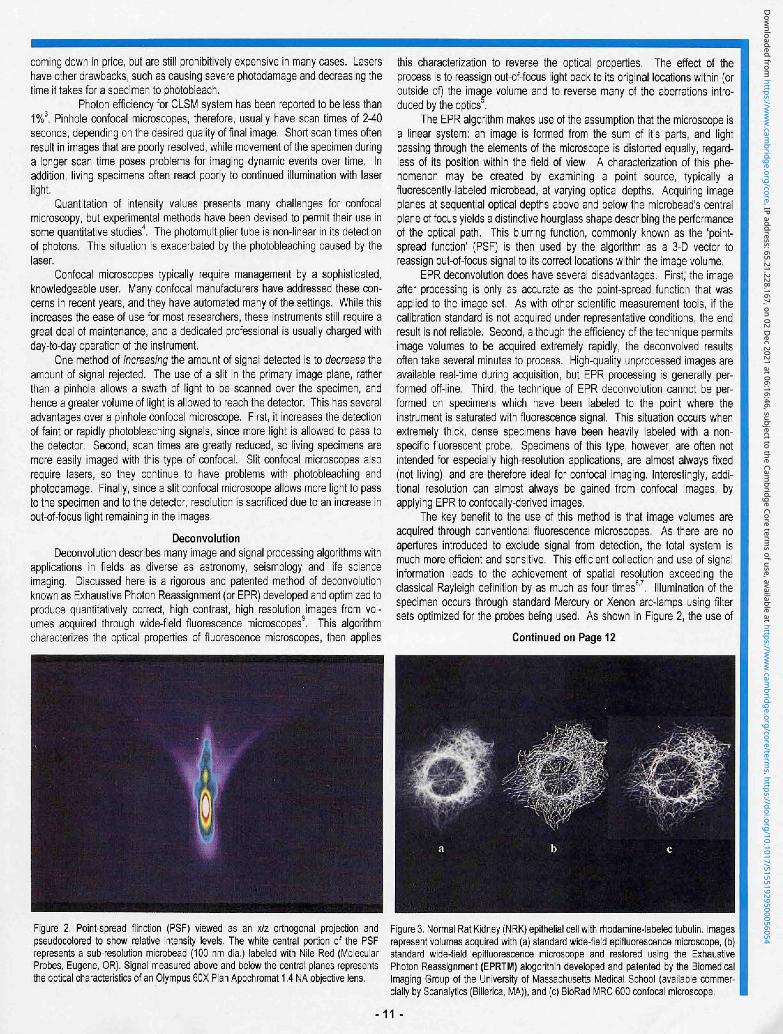
The EPR algorithm makes use of the assumption that the microscope isa linear system: an image is formed from the sum of it's parts, and lightpassing through the elements of the microscope is distorted equally, regard-less of its position within the field of view, A characterization of this phe-nomenon may be created by examining a point source, typically afluorescently-iabeled rrticrobead, at varying optical depths. Acquiring imageplanes at sequential optical depths above and below the microbead's centralplane of focus yields a distinctive hourglass shape describing the performanceof the optical path, This blurring function, commonly known as the 'point-spread function' (PSF) is then used by the algorithm as a 3-D vector toreassign out-of-focus signal to its correct locations within the image volume.
EPR deconvolution does have several disadvantages. First, the imageafter processing is only as accurate as the point-spread function that wasapplied to the image set, As with other scientific measurement tools, if thecalibration standard is not acquired under representative conditions, the endresult is not reliable. Second, although the efficiency of the technique permitsimage volumes to be acquired extremely rapidly, the deconvolved resultsoften take several minutes to process. High-quality unprocessed images areavailable real-time during acquisition, but EPR processing is generally per-formed off-line. Third, the technique of EPR deconvolution cannot be per-formed on specimens which have been labeled to the point where theinstrument is saturated with fluorescence signal. This situation occurs whenextremely thick, dense specimens have been heavily labeled with a non-specific fluorescent probe. Specimens of this type, however, are often notintended for especially high-resolution applications, are almost always fixed(not living), and are therefore idea! for confocal imaging. Interestingly, addi-tional resolution can almost always be gained from confocal images, byapplying EPR to confocal ly-derived images.
The key benefit to the use of this method is that image volumes areacquired through conventional fluorescence microscopes. As there are noapertures introduced to exclude signal from detection, the total system ismuch more efficient and sensitive, This efficient collection and use of signalinformation leads to the achievement of spatial resolution exceeding theclassical Rayleigh definition by as much as four times6'7. Illumination of thespecimen occurs through standard Mercury or Xenon arc-lamps using filtersets optimized for the probes being used. As shown in Figure 2, the use of
Continued on Page 12
Figure 2. Point-spread flinction (PSF) viewed as an x/z orthogonal projection andpseudocolored to show relative intensity levels. The white central portion of the PSFrepresents a sub-resolution micrabead {100 nm dia.) labeled with Nile Red (MolecularProbes, Eugene, OR). Signal measured above and below the central planes representsthe optical characteristics of an Olympus 60X Plan Apochromat 1.4 NA objective lens.
Figure 3. Normal Rat Kidney (NRK} epithelial cell with rhodamine-labeled tibulin. Imagesrepresent volumes acquired with (a) standard wide-field epifluorescenee microscope, (b}standard wide-fielct epifluorescence microscope and restored using the ExhaustivePhoton Reassignment (EPRTM) alogorithin developed and patented by the BiomedicalImaging Group of the University of Massachusetts Medical School (available commer-cially by Scanatytics (Billerica, MA)), and (c) BioRad MRC 600 confocal microscope.
-11 -
Dow
nloaded from https://w
ww
.cambridge.org/core . IP address: 65.21.228.167 , on 02 D
ec 2021 at 06:16:46 , subject to the Cambridge Core term
s of use, available at https://ww
w.cam
bridge.org/core/terms . https://doi.org/10.1017/S1551929500056054
High Resolution 3-D Fluorescence Microscopy...Cont inued f rom Page 11
such broad spectrum illumination allows researchers to excite virtually any
fluorophore, High magnification, high numerical aperture objective lenses
are used to acquire image volumes. Fluorescent signal is detected with
commerciaily available charge-coupled device (CCD) cameras, selected for
their linearity, dynamic range, high quantum efficiency, and perfect geometric
accuracy1'. Image volumes may be created by acquiring image planes at
varying optical depths. Images are typically acquired, displayed, and ana-
lyzed on a variety of standard computer platforms. Processing of images
using the EPR algorithm requires the use of a high-end computer (e.g.,
PentiumPro®) or optimized mathematical accelerator for high throughput of
very large image sets,
Discussion
A great deal of discussion has come about in recent times concerning
the absolute advantage of one technique over the other. While each
technique attempts to address the problems inherent to performing high-
resolution fluorescence microscopy, they do so by very different methods.
Each method derives from a distinct set of research needs and therefore
emphasizes a different paradigm of the problem. The chief source of
confusion between the two techniques is that both methods result in thin
optical sections of fluorescently-labeled microscopic specimens. The similar-
ity, however, ends there. Confocal microscopy is built on the premise that
out-of-focus signal reduces spatial resolution and therefore must be physi-
cally rejected from the optical system. Confocal systems, therefore, are
designed to occlude signal from all but a thin focal plane. Imaging of dim and
bleaching fluorescent specimens, therefore, can be performed only slowly
and briefly. EPR deconvolution is built on the premise that out-of-focus
signal contains valuable information. This information can be, with the
assistance of a powerful computer, sorted out and placed back to where it
originated. EPR-based systems, therefore, are designed to optimize the
collection of signal from the specimen volume, resulting in a method which is
extremely sensitive, gentle, and fast, Depending on one's specific imaging
challenges, one method may be preferred over the other as shown in the
table below.
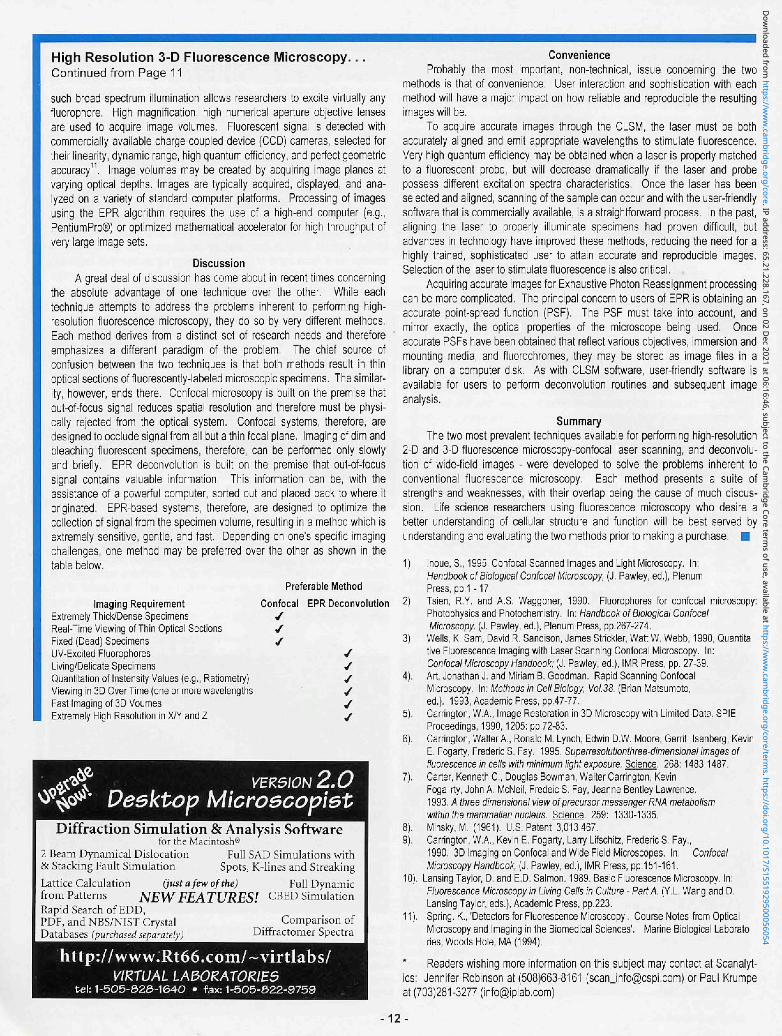
Imaging RequirementExtremely Thick/Dense SpecimensReal-Time Viewing of Thin Optical SectionsFixed (Dead) SpecimensUV-Excited FluorophoresLiving/Delicate SpecimensQuantitation of Instensity Values (e.g., Ratiometry)Viewing in 3D Over Time (one or more wavelengthsFast Imaging of 3D VoumesExtremely High Resolution in X/Y and Z
Preferable Method
Confocal EPR Deconvolution
••
••
VERSION 2.O
Desktop Microecopi&tDiffraction Simulation & Analysis Software
for the Macintosh®2 Beam Dynam i cal Disl oca t io n F ull S A D Si m u lati on 5 wi th& Stacking Fault Simulation Spots, K-lines and StreakingLattice Calculation (just a few of the) Full Dynamicfrom Patterns NEW FEATURES! CBRD SimulationRapid Search of EDD,PDF, and NBS/NIST Crystal . Comparison ofDatabases (purchased separately) Diffractomer Spectra
http://www.Rt66.com/~virtlabs/VIRTUAL LABORATORIES
tel:1-505-&2&-1640 • fax: 1-505-322-9759
ConvenienceProbably the most important, non-technical, issue concerning the two
methods is that of convenience. User interaction and sophistication with each
method will have a major impact on how reliable and reproducible the resulting
images will be.
To acquire accurate images through the CLSM, the laser must be both
accurately aligned and emit appropriate wavelengths to stimulate fluorescence,
Very high quantum efficiency may be obtained when a laser is properly matched
to a fluorescent probe, but will decrease dramatically if the laser and probe
possess different excitation spectra characteristics. Once the laser has been
selected and aligned, scanning of the sample can occur and with the user-friendly
software that is commercially available, is a straightforward process. In the past,
aligning the laser to properly illuminate specimens had proven difficult, but
advances in technology have improved these methods, reducing the need for a
highly trained, sophisticated user to attain accurate and reproducible images.
Selection of the laser to stimulate fluorescence is also critical.
Acquiring accurate images for Exhaustive Photon Reassignment processing
can be more complicated, The principal concern to users of EPR is obtaining an
accurate poini-spread function (PSF). The PSF must take into account, and
mirror exactly, the optical properties of the microscope being used. Once
accurate PSFs have been obtained that reflect various objectives, immersion and
mounting media, and fluorochromes, they may be stored as image files in a
library on a computer disk. As with CLSM software, user-friendly software is
available for users to perform deconvolution routines and subsequent image
analysis
Summary
The two most prevalent techniques available for performing high-resolution
2-D and 3-D fluorescence microscopy-confocal laser scanning, and deconvolu-
tion of wide-field images - were developed to solve the problems inherent to
conventional fluorescence microscopy. Each method presents a suite of
strengths and weaknesses, with their overlap being the cause of much discus-
sion. Life science researchers using fluorescence microscopy who desire a
better understanding of cellular structure and function will be best served by
understanding and evaluating the two methods prior to making a purchase. •
1) Inoue. S., 1995. Confocal Scanned Images and Light Microscopy. In:Handbook of Biological Confocal Microscopy, (J. Pawley, ed.), PlenumPress, pp.1 -17.
2) Tsien, R.Y. and A,S, Waggoner, 1990. Fluorophores for confocal microscopy:Photophysics and Photochemistry, in: Handbook o! Biological ConfocalMicroscopy. (J. Pawfey, ed.}. Plenum Press, pp.267-274.
3] Weiis, K. Sam. David R. Sandison, James Stickler, Watt W. Webb. 1990, Quantityfive Fluorescence Imaging with Laser Scanning Confocal Microscopy. In:Confocal Microscopy Handbook; (J. Pawley, ed.), IMR Press, pp. 27-39.
4). Art, Jonathan J. and Miriam B. Goodman. Rapid Scanning ConfocalMicroscopy. In: Methods in Celt Biology, Voi.38. (Brian Matsumoto,ed.). 1993, Academic Press, pp.47-77.
5). Carrington, W.A., (mage Restoration in 3D Microscopy with Limited Data. SPIEProceedings, 1990,1205: pp.72-83.
6). Carrington. Walter A., Ronald M. Lynch, Edwin D.W. Moore, Gerrit Isenberg, KevinE. Fogarty, Frederic S. Fay. 1995. Superresolutionthtee-dimensional images offluorescence in cells with minimum liQht exposure. Science. 268:1483-1487.
7). Carter, Kenneth C, Douglas Bowman, Walter Carrington, KevinFoga rty, John A, McNeil, Fredeic S. Fay, Jeanne Bentley Lawrence.1993. A three dimensional view of precursor messenger RNA metabolismwithin the mammalian nucleus. Science. 259: 1330-1335.
8). Minsky, M. (1961). U.S. Patent 3,013,467.9). Carrington, W.A., Kevin E. Fogarty, Larry Lifschitz, Frederics. Fay.,
1990. 3D Imaging on Confocal and Wide Field Microscopes. In: ConfocalMicroscopy Handbook, (J. Pawley, ed.), IMR Press, pp.151-161.
10), Lansing Taylor, D. and E.D. Salmon. 1989. Basic Fluorescence Microscopy. In:Fluorescence Microscopy in Living Cells in Culture - Part A. (Y.L. Wang and D.Lansing Taylor, eds.), Academic Press, pp.223.
11). Spring. K,. 'Detectors for Fluorescence Microscopy'. Course Notes from OpticalMicroscopy and Imaging in the Biomedical Sciences'. Marine Biological Laboratories, Woods Hole, MA (1994).
* Readers wishing more information on this subject may contact at Scanalyt-
ics: Jennifer Robinson at (508)663-8161 ([email protected]) or Paul Krumpe
at (703)281-3277 ([email protected])
- 1 2 -
Dow
nloaded from https://w
ww
.cambridge.org/core . IP address: 65.21.228.167 , on 02 D
ec 2021 at 06:16:46 , subject to the Cambridge Core term
s of use, available at https://ww
w.cam
bridge.org/core/terms . https://doi.org/10.1017/S1551929500056054

-..
SUPPLIES
File Edit Uiem Go Bookmarks Options Directory Help
Netscape: Structure Probe, Inc.
Forward Home Re-load linage; Open Print Find Stop
WhatVNew? [ What's Cool? j Handbook j N<?t Search j Net DirectorLJ | Newsgroups j
•
Discover The SourceBook Online
http://www.2spi.comUp-To-The-Minute InformationFor All Your Microscopy Needs
SPI Supplies Division of STRUCTURE PROBE, Inc.P.O. Box 656 - W e s t Chester, PA 19381-0656 USA
Ph.: 1-610-436-5400 • 1-800-2424-SPi (U.S. only) • FAX: 1-610-436-5755 • E-mail: [email protected]/97 wee
Dow
nloaded from https://w
ww
.cambridge.org/core . IP address: 65.21.228.167 , on 02 D
ec 2021 at 06:16:46 , subject to the Cambridge Core term
s of use, available at https://ww
w.cam
bridge.org/core/terms . https://doi.org/10.1017/S1551929500056054