Embed Size (px)
Citation preview
High Resolution Seismic Reflection Surveyat Mud Mountain Dam
near Enumclaw, Washington
Final report submitted toU.S. Army Corps of Engineers
Seattle Engineers DistrictSeattle, Washington
Kansas Geological SurveyUniversity of Kansas
Lawrence, Kansas
Open-file Report No. 95-8
March 1, 1995
High Resolution Seismic Reflection Surveyat Mud Mountain Dam
near Enumclaw, Washington
by
Richard D. MillerJoe M. AndersonDavid R. LaflenBrett C. BennettChoon B. Park
of theKansas Geological Survey
University of KansasLawrence, Kansas
final report submitted toU.S. Army Corps of Engineers
Seattle Engineers DistrictSeattle, Washington
Open-file Report No. 95-8
March 1, 1995
Summary
The high resolution seismic survey consisted of two approximately 1200 ft
intersecting lines, designed primarily to image the bedrock surface at between 300
and 600 ft beneath the ground surface and any acoustically significant features on or
within a sequence of lake bed deposit approximately 100 ft beneath the ground
surface. Consistent with the goal of the survey, the two 24-fold stacked sections
possess interpretable reflections tentatively identified as an interface within the
Vashon Outwash, the top of Vashon Lake Bed sequences, a cut and fill feature near
the top of the Vashon Lake Bed sequence, an apparent inter-Lake Bed surface, the
contact between the Lake Beds and the Mud Mountain Complex, possible contact
between Hadden Creek Till, the Lake Bed, and the bedrock surface. Interpreted
erosional features near the top of the lake bed sequence represent potential short
path channels. The reflections have an average dominant frequency of approxi-
mately 80 Hz and an apparent NMO velocity ranging from 1600 to 3800 ft/sec. The
field recording parameters and quality control were based on the reflection inter-
preted during walkaway tests to be from reflectors between 50 and 400 ft deep.
The primary long path bedrock channel (Big Springs Channel) may be
expressed on stacked sections as a gentle westward bedrock dip near the end of line 2
and subtle undulations in the bedrock surface across most of the lines. Time-to-
depth conversion suggests subtle undulation on the order of 10 to 20 ft across most
of the sections with an apparent ridge possessing about 40 ft of elevation change
between about CDP 260 and CDP 300 on line 2. At least three cut and fill channel
looking features are present in the top of the lake bed sequence. The infill material
at all three locations is relatively uniform with a lower apparent velocity than the
surrounding sediments, producing an apparent pull-down in the reflection
interpreted to be from near the top of the lake bed. Gravel and boulders mapped in
surface exposures north and west of the lines are consistent in depth and horizontal
expanse with the two larger erosional channels interpreted on the northwest end of
line 1 and the east end of line 2. Extrapolating beyond what can be justified with this
data set, it is possible to suggest that the feature on line 1 could be horizontally
consistent with an exposure of gravel and boulders on the opposite side of Mud
Mountain in the White River Valley walls.
2
Introduction
Mud Mountain Dam was originally designed in the 1930s for flood control on
the White River which heads at Carbon Glacier on the flanks of Mt. Rainier.
Springs, seeps, and increased material saturations were observed during periods of
elevated pool levels. Considered changes to pool storage and use would require
elevated pool levels more frequently and sustained for longer periods of time. The
potential of a seepage-induced failure of the reservoir rim similar to the 1918
landslide at Masonry Pool on the Cedar River prompted concern for the integrity of
the Mud Mountain Dam.
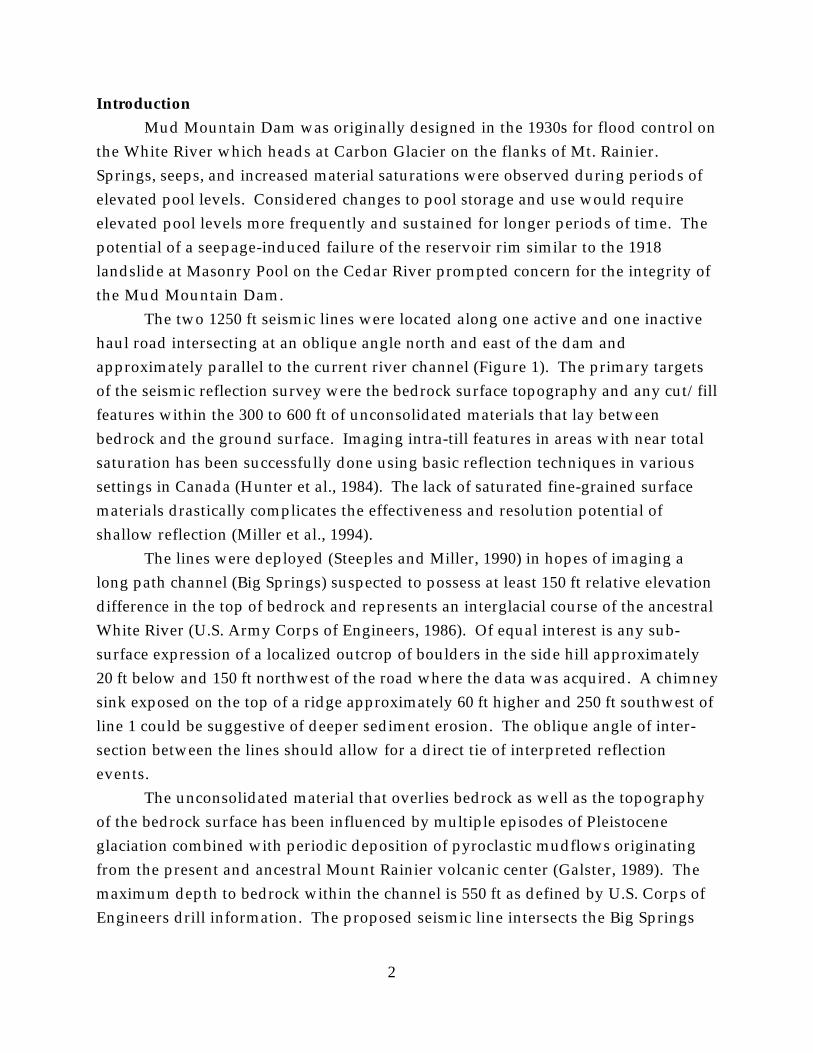
The two 1250 ft seismic lines were located along one active and one inactive
haul road intersecting at an oblique angle north and east of the dam and
approximately parallel to the current river channel (Figure 1). The primary targets
of the seismic reflection survey were the bedrock surface topography and any cut/fill
features within the 300 to 600 ft of unconsolidated materials that lay between
bedrock and the ground surface. Imaging intra-till features in areas with near total
saturation has been successfully done using basic reflection techniques in various
settings in Canada (Hunter et al., 1984). The lack of saturated fine-grained surface
materials drastically complicates the effectiveness and resolution potential of
shallow reflection (Miller et al., 1994).
The lines were deployed (Steeples and Miller, 1990) in hopes of imaging a
long path channel (Big Springs) suspected to possess at least 150 ft relative elevation
difference in the top of bedrock and represents an interglacial course of the ancestral
White River (U.S. Army Corps of Engineers, 1986). Of equal interest is any sub-
surface expression of a localized outcrop of boulders in the side hill approximately
20 ft below and 150 ft northwest of the road where the data was acquired. A chimney
sink exposed on the top of a ridge approximately 60 ft higher and 250 ft southwest of
line 1 could be suggestive of deeper sediment erosion. The oblique angle of inter-
section between the lines should allow for a direct tie of interpreted reflection
events.
The unconsolidated material that overlies bedrock as well as the topography
of the bedrock surface has been influenced by multiple episodes of Pleistocene
glaciation combined with periodic deposition of pyroclastic mudflows originating
from the present and ancestral Mount Rainier volcanic center (Galster, 1989). The
maximum depth to bedrock within the channel is 550 ft as defined by U.S. Corps of
Engineers drill information. The proposed seismic line intersects the Big Springs
3
channel at an oblique angle. The primary short path channel is suggested to be
within the Vashon outwash overlying the drill confirmed 200 ft deep and 100 ft
thick Vashon lake bed and deltaic deposits. The shallow seismic reflection data
possess the necessary resolution and penetration at this site to image the bedrock
surface at 350 to 550 ft and resolve cut and fill features on the order of 20 ft wide and
10 ft deep.
The seismic reflection survey was conducted between August 29 and 31, 1994.
The project consisted of several walkaway noise tests and two nominal 170 shot-
point, 24-fold P-wave CDP lines. Line 1 was acquired in the road ditch of a fre-
quently used logging road that possessed very unsorted till ranging from clay size
particles to large boulders. Line 2 was along an unused logging road with a very
hard, gravelly surface. The surface conditions were consistent for each line. No
shots were recorded while background noise levels were greater than 0.2 mV peak-
to-peak. A gradual surface slope resulted in about 30 ft of relative elevation change
across the survey area. The field recording parameters and quality control were
based on the reflection interpreted during walkaway tests on the north end of line 1
to be from reflectors about 100 and 400 ft deep. Future borehole logging, both
geologic and geophysical, as well as VSPs based on the surface seismic data, should
greatly enhance the quality and quantity of the seismic interpretation.
Data Acquisition
Data for this study were acquired on a 48-channel EG&G Geometrics 2401x
seismograph. The seismograph amplifies, filters (analog), digitizes the analog signal
into a 15-bit word, and stores the digital information in a demultiplexed format.
Analog filters have an 18 dB/octave rolloff from the selected -3 dB points. The
1/2 ms sampling interval resulted in a record length of 500 msec and a 1000 Hz
Nyquist frequency. A 500 Hz high-cut filter with a 24 dB/octave rolloff acted as an
anti-alias filter and to reduce wind noise. This floating point seismograph possesses
a dynamic range that was more than adequate to record high-quality reflection infor-
mation in the presence of source-generated and cultural noise at this site.
The walkaway noise tests were conducted on the northeast end of line 1. The
source (8-gauge auger gun) (Healey et al., 1991) and receivers (three Mark Products
L28E 40 Hz) were selected based on field conditions and previous experience. On-
site testing concentrated on source/receiver geometries and recording parameters.
Test data were recorded with analog low-cut filters out, 50 Hz, 100 Hz, and 200 Hz
4
and source-to-receiver offsets ranging from 8 to 376 ft with adjacent stations
separated by 8 ft. The analog filters effectively attenuate ground roll while increas-
ing the dominant frequency of the reflection wavelets. The data quality was
sufficient to allow selection of optimum parameters and geometries for acquisition
of data at this site targeting reflectors between 50 and 400 ft deep.
Based on the walkaway data and the dynamic range of the recording instru-
ment, the source-receiver geometry was split-spread with a source-to-nearest-
receiver spacing of 20 ft and a furthest offset of 204 ft. The recording parameters
included an analog low-cut filter of 50 Hz and a sampling interval of 0.5 msec.
Identification of various unique arrivals on the walkaway data allowed for confi-
dent selection of parameters and geometries used for the CDP portion of the survey.
The production portion of the survey took just under 2 days and included
approximately 330 shotpoints along the two lines. The 8-gauge auger gun allowed
detonation of a 400 grain black powder load 2 to 3 ft below the ground surface in a
water saturated, tightly stemmed 2" hole. The terrain, near-surface boulders and
cobbles, as well as the trail conditions made the auger gun an acceptable source for
the conditions and the required data quality. The three geophones were placed in a
3 ft in-line array to help attenuate source-generated air-coupled waves. The source
was detonated in and the receivers were planted into competent material. The
seismograph was configured to focus on reflections within the upper 250 msec with
average velocities from 1200 to 6000 ft/sec. The pre-digital conversion spectrum was
shaped with 50 Hz analog low-cut filters in an attempt to enhance the higher fre-
quency components of the recorded energy. This emphasis on pushing the high
side of the spectra was necessary if any chance was to be given to separating
reflections from within the lake bed sequence and any layers that might produce a
coherent reflection between the base of the lake beds and the bedrock surface.
Data Processing
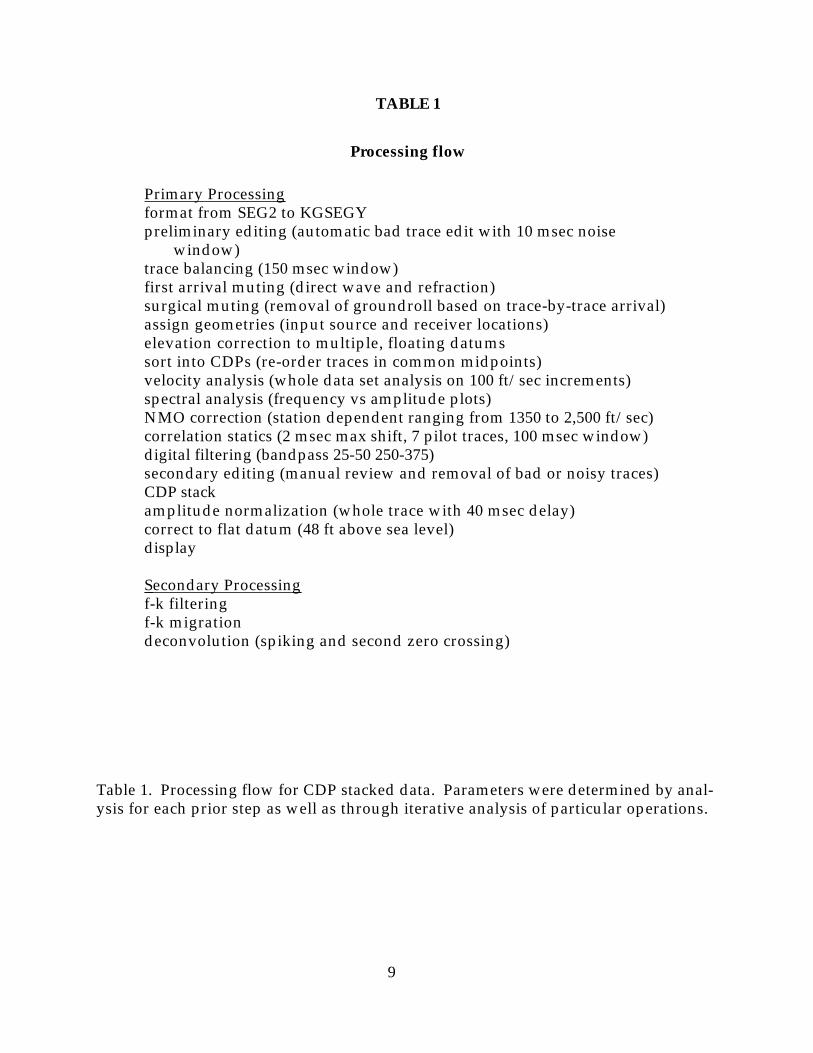
Data processing was done on an Intel 80486-based microcomputer using
Eavesdropper, a set of commercially available algorithms. The processing flow was
similar to those used in petroleum exploration (Table 1). The main distinctions
relate to the conservative use and application of correlation statics, precision
required during velocity and spectral analysis, and extra care during muting opera-
tions. A very low percentage allowable NMO stretch (< 20%) was extremely critical
in avoiding wide-angle reflections, maximizing resolution potential, and avoiding
5
distortion in the stacked wavelets (Miller, 1992). Many processing techniques that
have not routinely been effective on shallow data sets (including f-k migration,
deconvolution, and f-k filtering) were tested to evaluate their potential on this data
set.
For most basic shallow high-resolution seismic reflection data the processing
steps/operations are a simple scaling down of established petroleum-based process-
ing techniques and methods. However, processes such as deconvolution have basic
assumptions (Yilmaz, 1987) that are violated by most shallow data sets, this data set
being no exception. Migration is another operation that, due to non-conventional
scaling (vertical and/or horizontal), many times may appear to be necessary when in
actuality geometric distortion may be simple scale exaggeration (Black et al., 1994).
Processing/processes used on data for this report has/have been carefully executed
with no a priori assumptions and with care not to create anything through
processing, but to simply enhance and correct what can be interpreted on unstacked
data.
Results
Unequivocal identification of reflection energy on field files is essential for
accurate interpretation of CDP stacked sections. Raw field files acquired during the
production portion of the survey from each line have identifiable reflection events
between 50 and 250 msec (Figure 2). The reflections have an average dominant
frequency of approximately 80 Hz and an apparent NMO velocity ranging from 1350
to 3300 ft/sec. These would result in an approximate depth to the reflector of
between 40 and 400 ft. The signal-to-noise ratio on the raw field files is very good
and allows confident identification of reflections on most of the raw field files.
Analysis of processed field files improves confidence in interpretation of CDP
stacked sections. Digital filtering, first-arrival muting, appropriate trace balancing,
bad-trace editing, and conservative application of correlation statics were key
processes in improving the pre-stack appearance of coherent events interpretable on
raw field files (Figure 2). The coherent events identifiable on filtered and scaled files
possesses an arrival pattern consistent with the classic hyperbolic moveout of a
reflection. These interpreted reflection arrivals allow significant confidence in
interpreting the CDP stacked section. It is still prudent to practice care and a con-
servative approach to interpretations of coherent energy on stacked data.
6
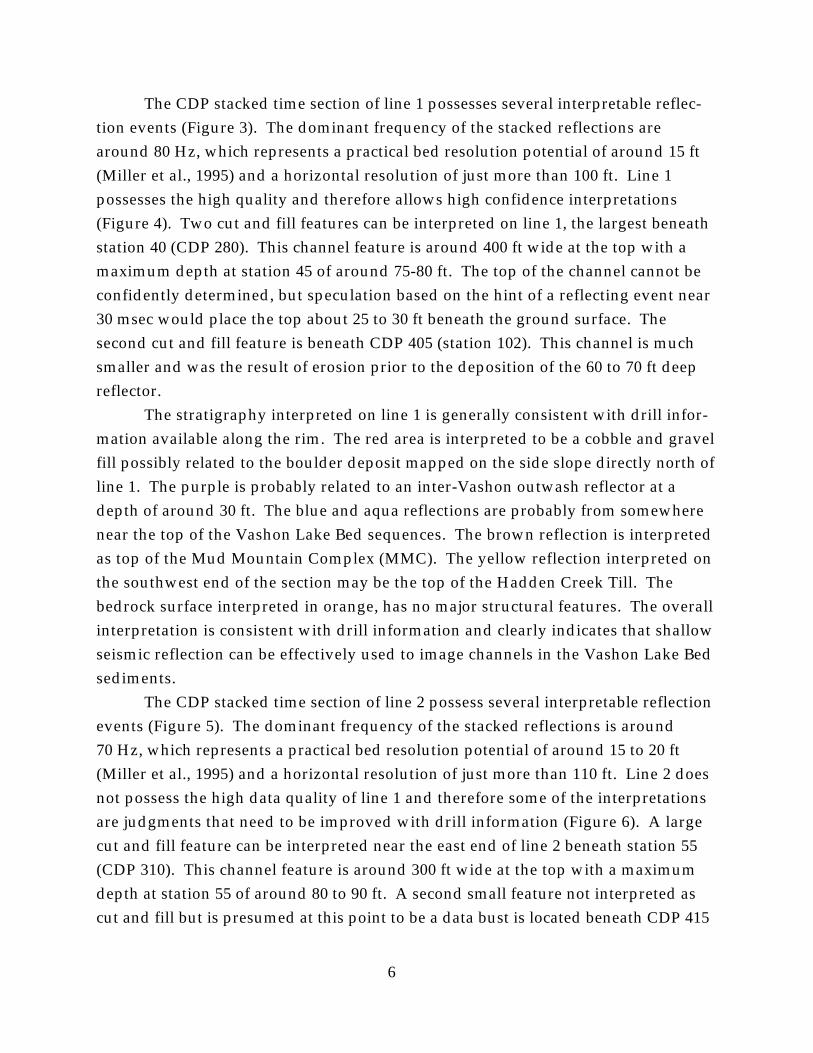
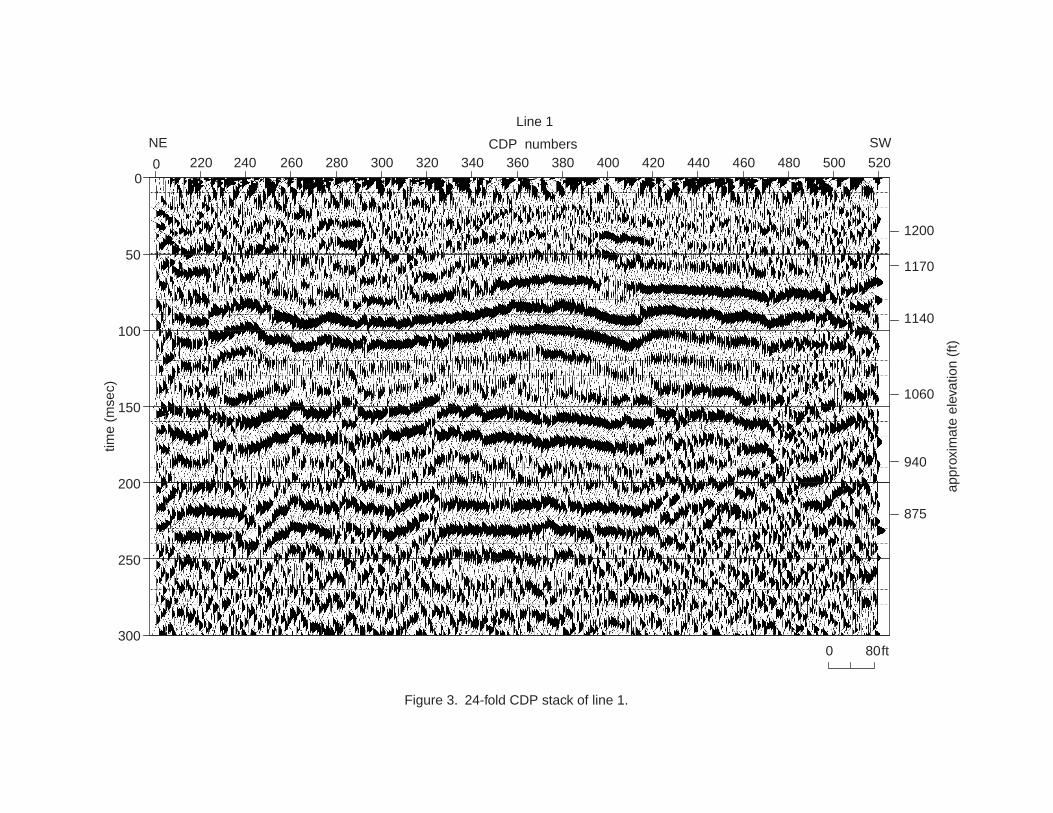
The CDP stacked time section of line 1 possesses several interpretable reflec-
tion events (Figure 3). The dominant frequency of the stacked reflections are
around 80 Hz, which represents a practical bed resolution potential of around 15 ft
(Miller et al., 1995) and a horizontal resolution of just more than 100 ft. Line 1
possesses the high quality and therefore allows high confidence interpretations
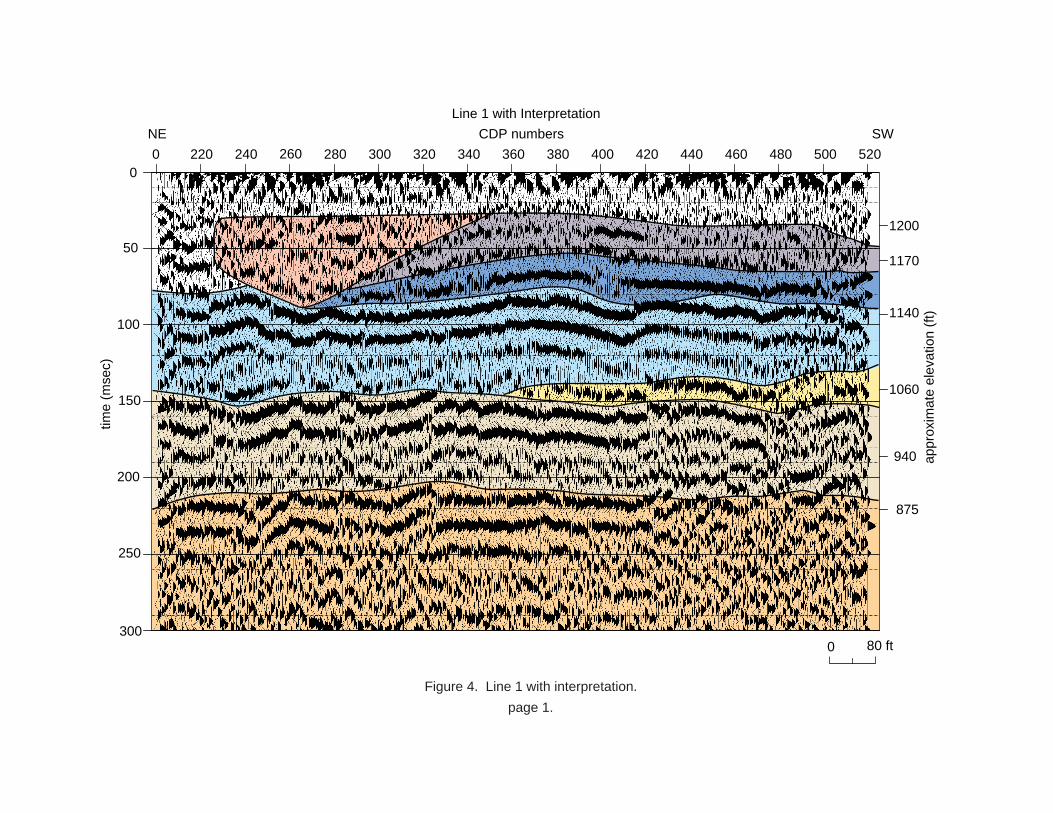
(Figure 4). Two cut and fill features can be interpreted on line 1, the largest beneath
station 40 (CDP 280). This channel feature is around 400 ft wide at the top with a
maximum depth at station 45 of around 75-80 ft. The top of the channel cannot be
confidently determined, but speculation based on the hint of a reflecting event near
30 msec would place the top about 25 to 30 ft beneath the ground surface. The
second cut and fill feature is beneath CDP 405 (station 102). This channel is much
smaller and was the result of erosion prior to the deposition of the 60 to 70 ft deep
reflector.
The stratigraphy interpreted on line 1 is generally consistent with drill infor-
mation available along the rim. The red area is interpreted to be a cobble and gravel
fill possibly related to the boulder deposit mapped on the side slope directly north of
line 1. The purple is probably related to an inter-Vashon outwash reflector at a
depth of around 30 ft. The blue and aqua reflections are probably from somewhere
near the top of the Vashon Lake Bed sequences. The brown reflection is interpreted
as top of the Mud Mountain Complex (MMC). The yellow reflection interpreted on
the southwest end of the section may be the top of the Hadden Creek Till. The
bedrock surface interpreted in orange, has no major structural features. The overall
interpretation is consistent with drill information and clearly indicates that shallow
seismic reflection can be effectively used to image channels in the Vashon Lake Bed
sediments.
The CDP stacked time section of line 2 possess several interpretable reflection
events (Figure 5). The dominant frequency of the stacked reflections is around
70 Hz, which represents a practical bed resolution potential of around 15 to 20 ft
(Miller et al., 1995) and a horizontal resolution of just more than 110 ft. Line 2 does
not possess the high data quality of line 1 and therefore some of the interpretations
are judgments that need to be improved with drill information (Figure 6). A large
cut and fill feature can be interpreted near the east end of line 2 beneath station 55
(CDP 310). This channel feature is around 300 ft wide at the top with a maximum
depth at station 55 of around 80 to 90 ft. A second small feature not interpreted as
cut and fill but is presumed at this point to be a data bust is located beneath CDP 415
7
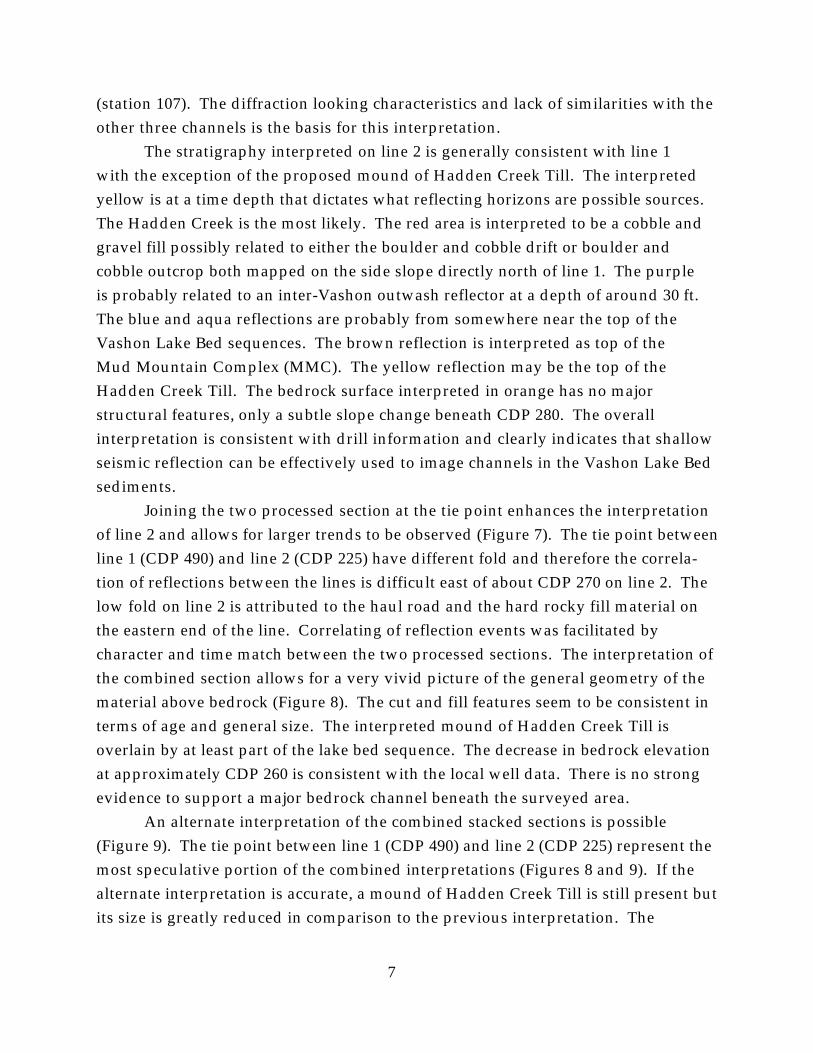
(station 107). The diffraction looking characteristics and lack of similarities with the
other three channels is the basis for this interpretation.
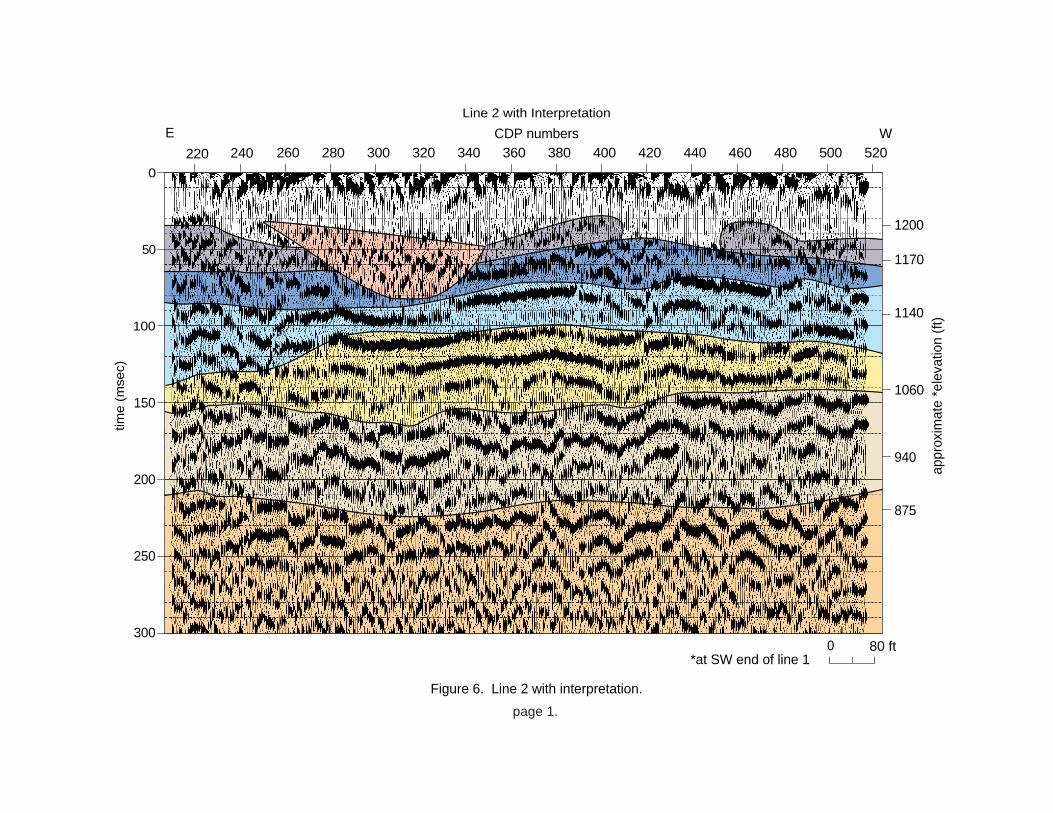
The stratigraphy interpreted on line 2 is generally consistent with line 1
with the exception of the proposed mound of Hadden Creek Till. The interpreted
yellow is at a time depth that dictates what reflecting horizons are possible sources.
The Hadden Creek is the most likely. The red area is interpreted to be a cobble and
gravel fill possibly related to either the boulder and cobble drift or boulder and
cobble outcrop both mapped on the side slope directly north of line 1. The purple
is probably related to an inter-Vashon outwash reflector at a depth of around 30 ft.
The blue and aqua reflections are probably from somewhere near the top of the
Vashon Lake Bed sequences. The brown reflection is interpreted as top of the
Mud Mountain Complex (MMC). The yellow reflection may be the top of the
Hadden Creek Till. The bedrock surface interpreted in orange has no major
structural features, only a subtle slope change beneath CDP 280. The overall
interpretation is consistent with drill information and clearly indicates that shallow
seismic reflection can be effectively used to image channels in the Vashon Lake Bed
sediments.
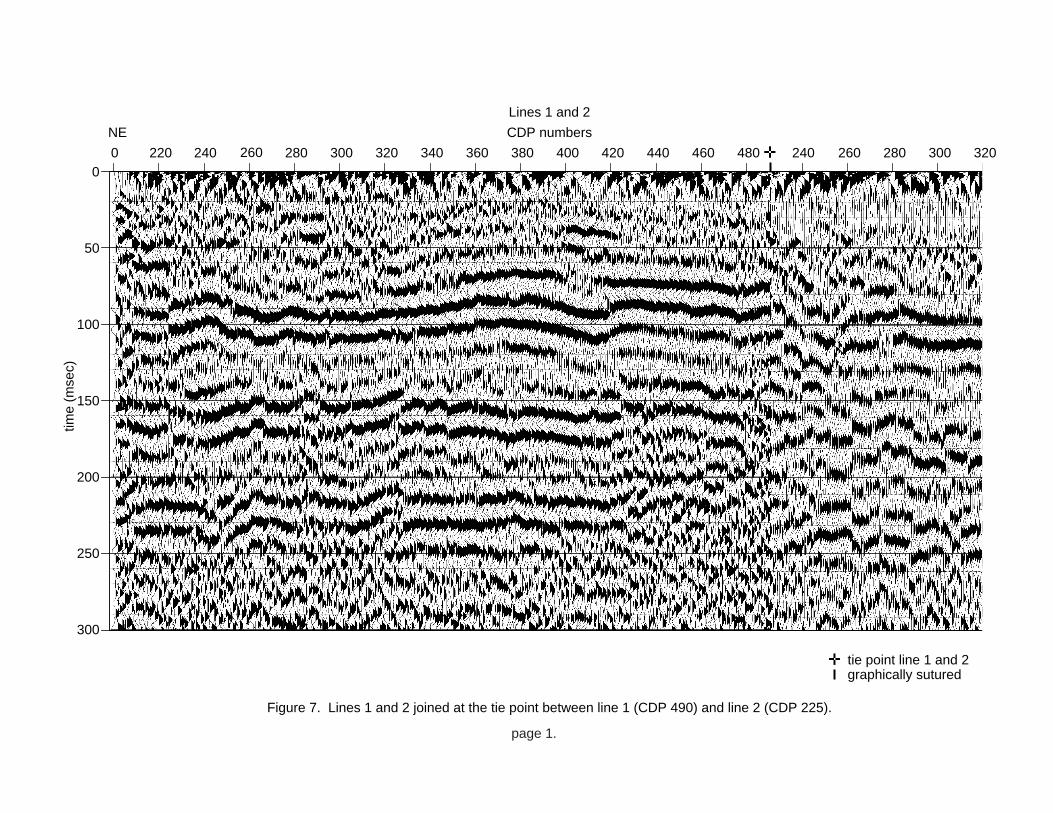
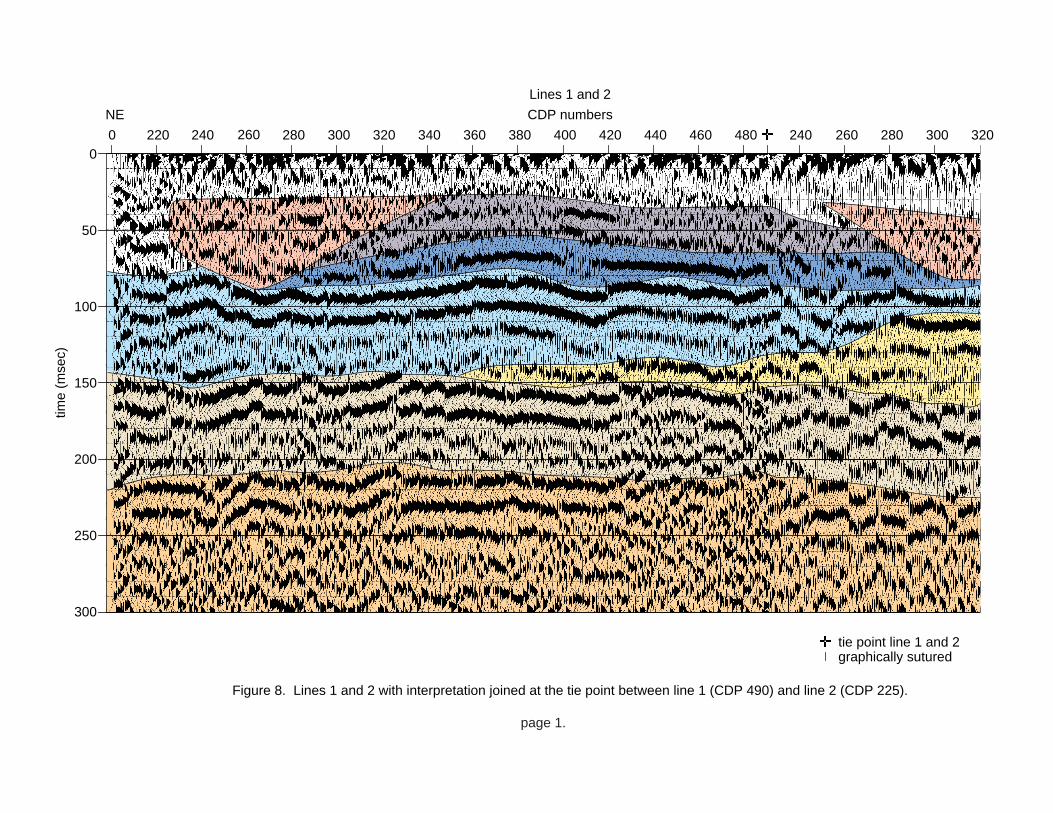
Joining the two processed section at the tie point enhances the interpretation
of line 2 and allows for larger trends to be observed (Figure 7). The tie point between
line 1 (CDP 490) and line 2 (CDP 225) have different fold and therefore the correla-
tion of reflections between the lines is difficult east of about CDP 270 on line 2. The
low fold on line 2 is attributed to the haul road and the hard rocky fill material on
the eastern end of the line. Correlating of reflection events was facilitated by
character and time match between the two processed sections. The interpretation of
the combined section allows for a very vivid picture of the general geometry of the
material above bedrock (Figure 8). The cut and fill features seem to be consistent in
terms of age and general size. The interpreted mound of Hadden Creek Till is
overlain by at least part of the lake bed sequence. The decrease in bedrock elevation
at approximately CDP 260 is consistent with the local well data. There is no strong
evidence to support a major bedrock channel beneath the surveyed area.
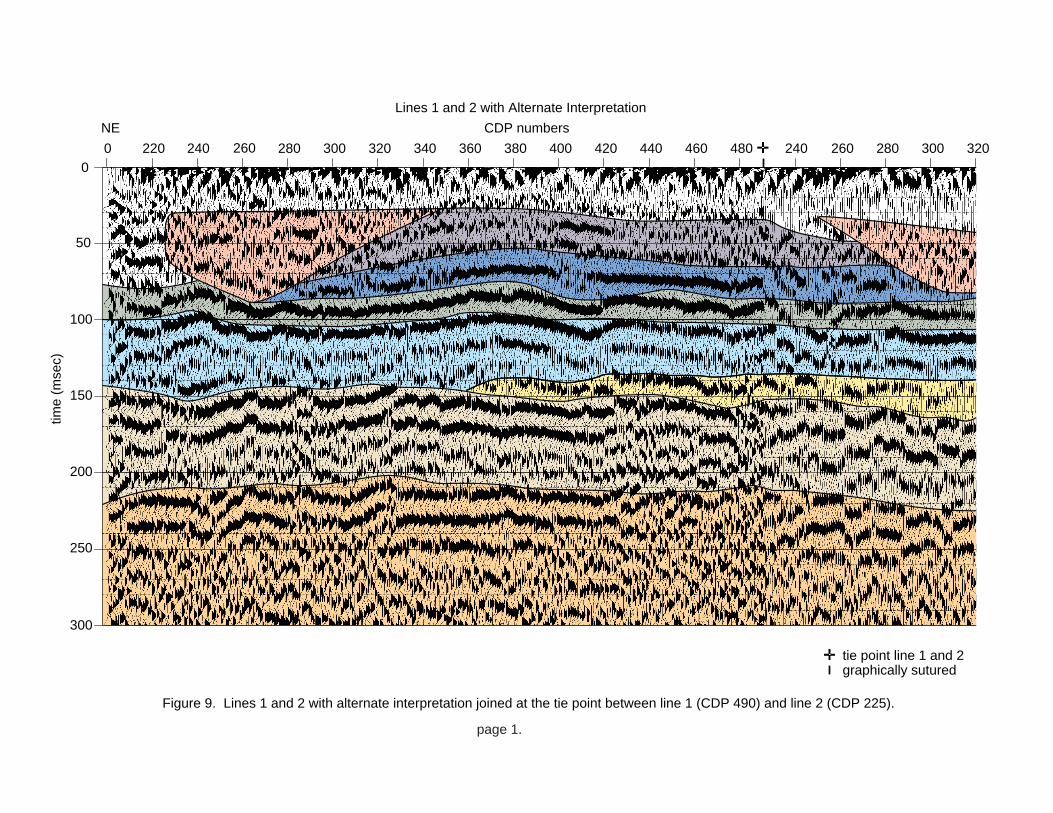
An alternate interpretation of the combined stacked sections is possible
(Figure 9). The tie point between line 1 (CDP 490) and line 2 (CDP 225) represent the
most speculative portion of the combined interpretations (Figures 8 and 9). If the
alternate interpretation is accurate, a mound of Hadden Creek Till is still present but
its size is greatly reduced in comparison to the previous interpretation. The
8
alternate interpretation suggests a third acoustic contrast within the lake bed
sequence. The nonunique appearance of the middle lake bed layer is probably a
result of thinning and insufficient data resolution, therefore the apparent tuning
with shallower thin sequences. The alternate interpretation suggests a slightly
thinner lake bed sequence (maybe 20 ft) on the west than observed on the northeast.
Other than the third distinct lake bed layer and the reduced size of the Hadden Creek
Till mound, the two interpretations are identical and consistent with interpretations
of surface exposures and drill holes.
Suggestions
Time-to-depth information is a very critical piece of the geophysical picture
that is missing here. Attempts to acquire uphole information from borehole 23 was
not successful. It would be very helpful to have a walkaway VSP to confirm inter-
pretations presented here that are based on stacking velocities only. To determine if
any commonality exists between the boulder outcrop on the north slope to the one
on the south slope of Mud Mountain, another seismic line or two would be
necessary to map the subsurface meander of the channel feature. If subtle bedrock
features are important, a slightly higher-energy non-invasive source would probably
produce slightly better penetration possibly at the expense of the higher frequencies.
ReferencesBlack, R.A., D.W. Steeples, and R.D. Miller, 1994, Migration of shallow seismic reflection data: Geophysics, v.
59, p. 402-410.Galster, Richard W., Mud Mountain Dam: in R.W. Galster, ed., Engineering Geology in Washington, Volume I:
Washington Division of Geology and Earth Resources, Bulletin 78, Olympia, WA, p. 241-248.Healey, J., J. Anderson, R.D. Miller, D. Keiswetter, D.W. Steeples, and B. Bennett, 1991, Improved shallow
seismic-reflection source: Building a better Buffalo [Exp. Abs.]: Soc. Explor. Geophys. v. 1, p. 588-591.Hunter, J.A., S.E. Pullan, R.A. Burns, R.M. Gagne, and R.S. Good, 1984, Shallow seismic-reflection mapping of
the overburden-bedrock interface with the engineering seismograph—Some simple techniques: Geophysics, v.49, p. 1381-1385.
Miller, R.D., N.L. Anderson, H.R. Feldman, and E.K. Franseen, 1995, Vertical resolution of a seismic survey instratigraphic sequences less than 100 m deep in Southeastern Kansas: Geophysics, v. 60, in press.
Miller, R.D. S.E. Pullan, D.W. Steeples, and, J.A. Hunter, 1994, Field comparison of shallow P-Wave seismicsources near Houston, Texas: Geophysics, v. 59, p. 1713-1728.
Miller, R.D., 1992, Normal moveout stretch mute on shallow-reflection data: Geophysics, v. 57, p. 1502-1507.Steeples, D.W., and R.D. Miller, 1990, Seismic-reflection methods applied to engineering, environmental, and
ground-water problems: Soc. Explor. Geophys. Investigations in Geophysics, Investigations in Geophysics no.5, Stan Ward, ed., Volume 1: Review and Tutorial, p. 1-30.
U.S. Army Corps of Engineers, 1986, Mud Mountain Dam, Dam Safety Assurance Program, General DesignMemorandum No. 26, Supplement No. 1, Core of Dam, Seepage Control Measures: U.S. Army Corps ofEngineers, Seattle District, Seattle, CA, 269 p., 16 plates.
Yilmaz, O., 1987, Seismic data processing; S.M. Doherty, Ed.; in Series: Investigations in Geophysics, no. 2,Edwin B. Neitzel, Series Ed.: Soc. of Explor. Geophys., Tulsa, Oklahoma.
9
TABLE 1
Processing flow
Primary Processing format from SEG2 to KGSEGYpreliminary editing (automatic bad trace edit with 10 msec noise
window)trace balancing (150 msec window)first arrival muting (direct wave and refraction)surgical muting (removal of groundroll based on trace-by-trace arrival)assign geometries (input source and receiver locations)elevation correction to multiple, floating datumssort into CDPs (re-order traces in common midpoints)velocity analysis (whole data set analysis on 100 ft/sec increments)spectral analysis (frequency vs amplitude plots)NMO correction (station dependent ranging from 1350 to 2,500 ft/sec)correlation statics (2 msec max shift, 7 pilot traces, 100 msec window)digital filtering (bandpass 25-50 250-375)secondary editing (manual review and removal of bad or noisy traces)CDP stackamplitude normalization (whole trace with 40 msec delay)correct to flat datum (48 ft above sea level)display
Secondary Processing f-k filteringf-k migrationdeconvolution (spiking and second zero crossing)
Table 1. Processing flow for CDP stacked data. Parameters were determined by anal-ysis for each prior step as well as through iterative analysis of particular operations.
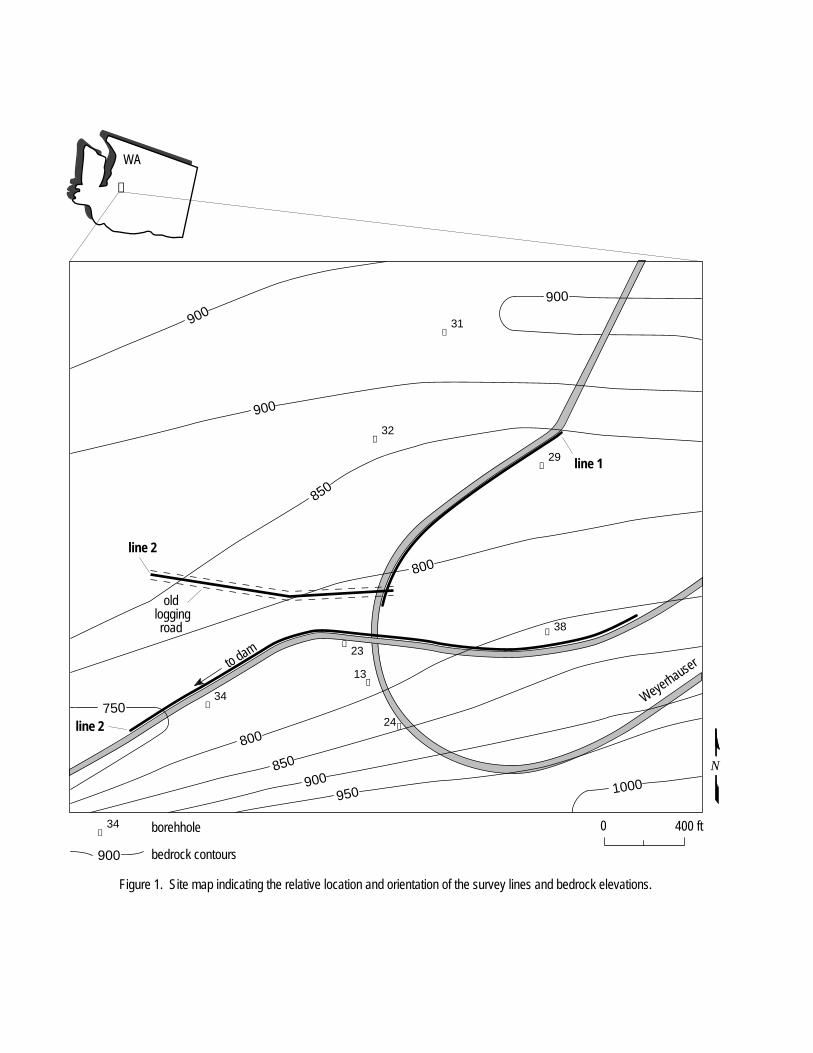
Figure 1. Site map indicating the relative location and orientation of the survey lines and bedrock elevations.
l 24
0 400 ft
N
n
WA
line 2
line 2
l 31
l 29
l 38
l 32
l 34
l 34
l 13
l 23
borehhole
bedrock contours
old logging road
to dam
Weyerhause
r
900
900
850
900
800
850
900 950
800
900
1000
750
line 1
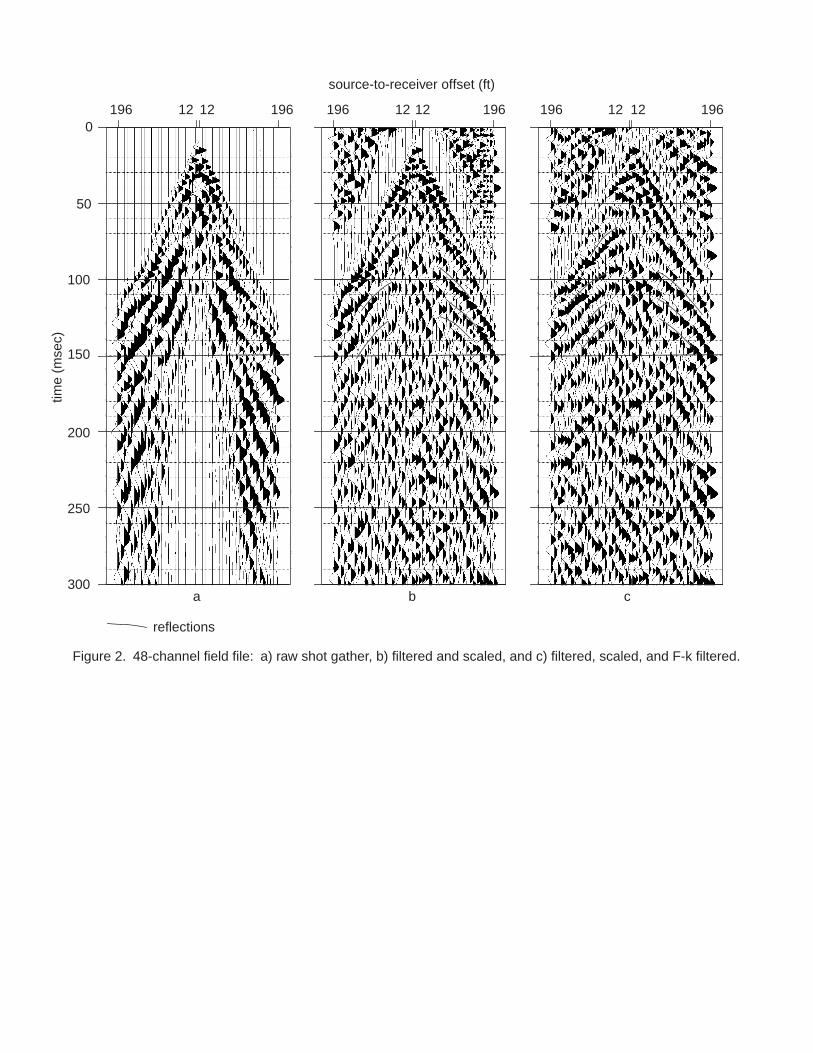
Figure 2. 48-channel field file: a) raw shot gather, b) filtered and scaled, and c) filtered, scaled, and F-k filtered.
100
0
50
150
source-to-receiver offset (ft)
300
200
250
196 196 196 196
ba c
1212196 196 1212 1212
reflections
time
(mse
c)
1140
940
875
1060
1170
1200
NE
3000 220 240 280 380 400 420 440
SW
2600
150
100
320 340 360 460 480 500 520
200
250
50
80 ft0300
Figure 3. 24-fold CDP stack of line 1.
CDP numbers
Line 1
appr
oxim
ate
elev
atio
n (f
t)
time
(mse
c)
1140
940
875
1060
1170
1200
SWNE
time
(mse
c)
0
150
100
200
250
50
80 ft0300
appr
oxim
ate
elev
atio
n (f
t)
Line 1 with Interpretation
CDP numbers
3000 220 240 280 380 400 420 440260 320 340 360 460 480 500 520
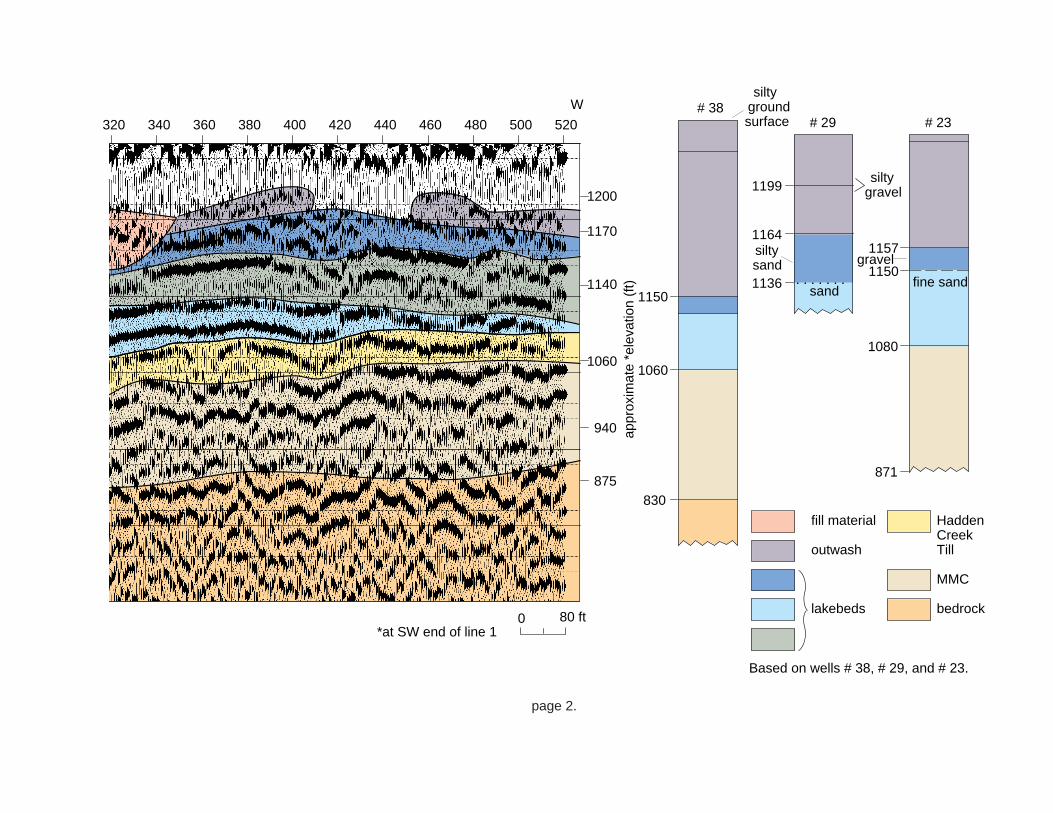
Figure 4. Line 1 with interpretation.
page 1.

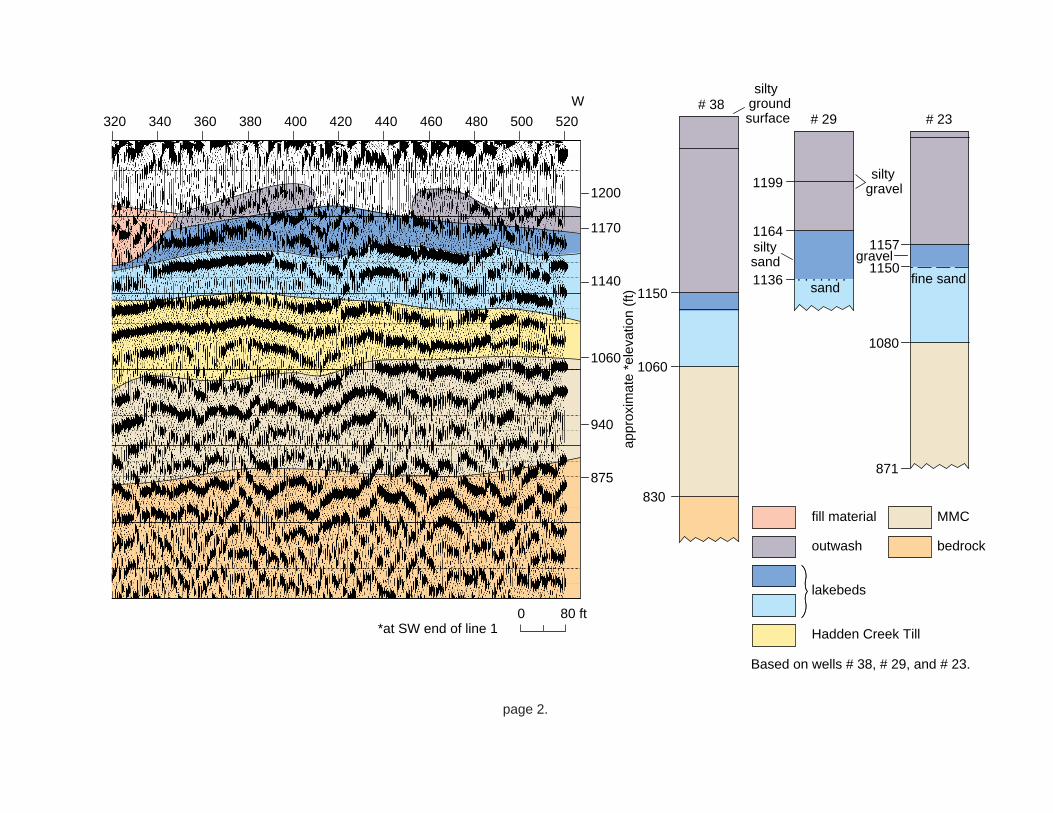
. . . . . . .1136
# 38# 29
830
1060
1150
1199
1164
1080
# 23
1157
1150
871
silty groundsurface
sandfine sand
fill material
outwash
lakebeds
Hadden Creek Till
MMC
bedrock
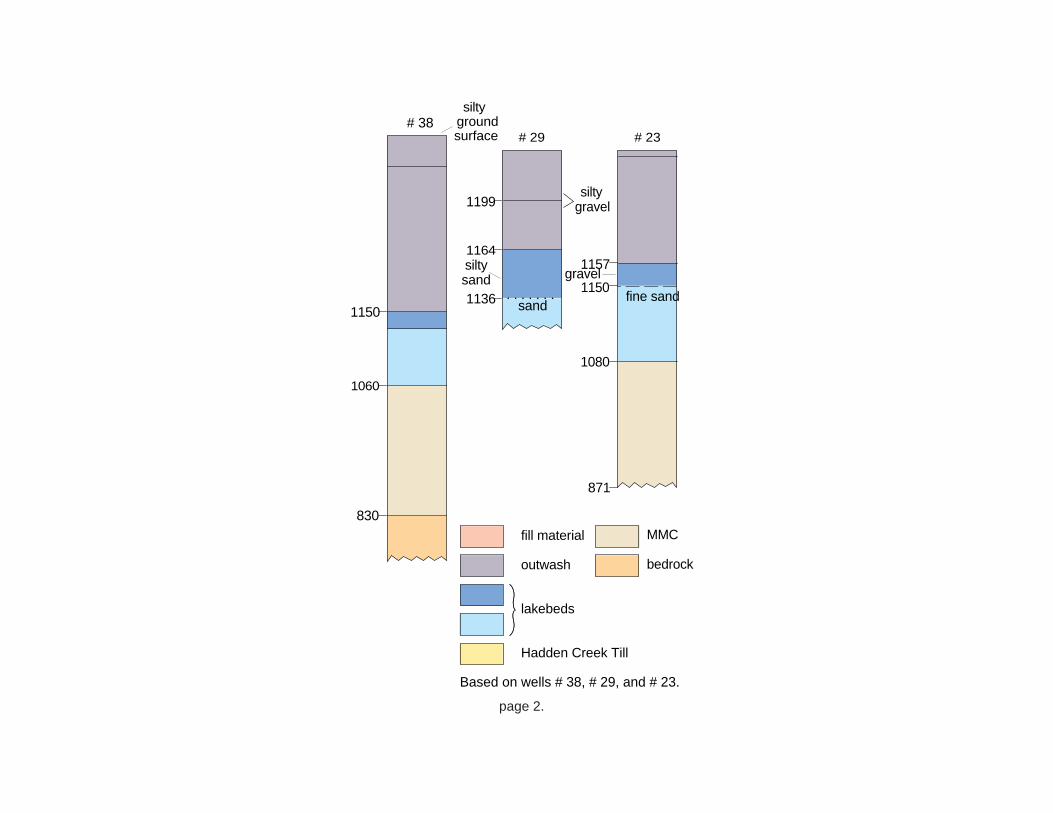
Based on wells # 38, # 29, and # 23.
gravel
siltygravel
siltysand
page 2.
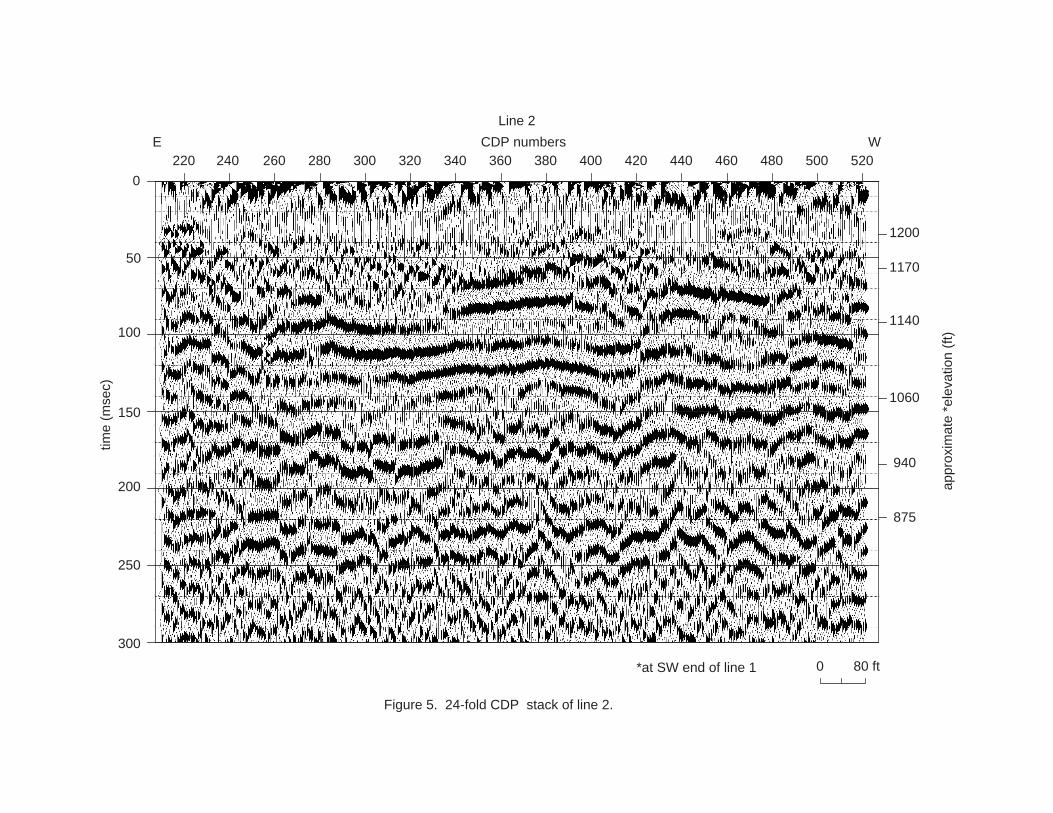
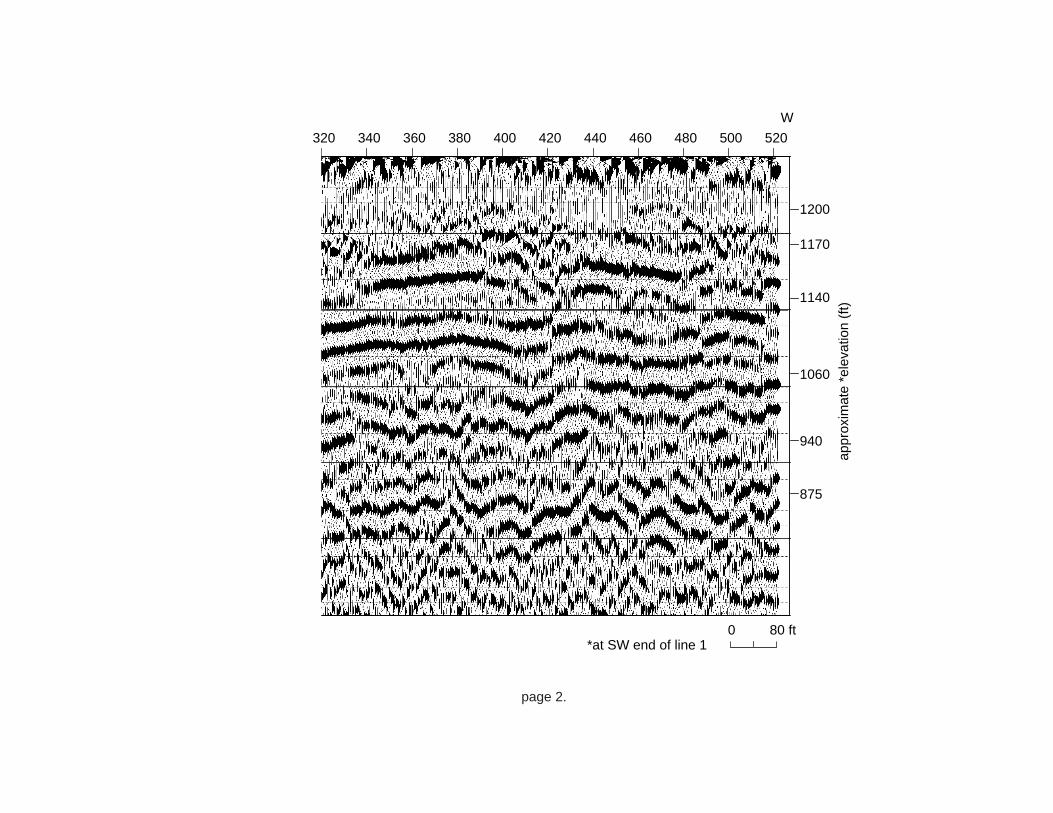
Figure 5. 24-fold CDP stack of line 2.
Line 2
E300220 240 280 380 400 420 440
W260
CDP numbers
time
(mse
c)
0
150
100
320 340 360 460 480 500 520
200
250
50
80 ft
0
300
1140
940
875
1060
1170
1200
appr
oxim
ate
*ele
vatio
n (f
t)
*at SW end of line 1
Line 2 with Interpretation
E300220 240 280 380 400 420 440
W260
CDP numberstim
e (
mse
c)
0
150
100
320 340 360 460 480 500 520
200
250
50
80 ft0300
1140
940
875
1060
1170
1200
appr
oxim
ate
*ele
vatio
n (f
t)
Figure 6. Line 2 with interpretation.
*at SW end of line 1
page 1.
gravel
. . . . . . .1136
# 38# 29
830
1060
1150
1199
1164
1080
# 23
1157
1150
871
silty groundsurface
sandfine sand
fill material
outwash
lakebeds
Hadden Creek Till
MMC
bedrock
Based on wells # 38, # 29, and # 23.
siltygravel
siltysand
page 2.
300240 280 380 400 420 440
W
260 340 360 460 480 500 520
80 ft0
1140
940
875
1060
1170
1200
NE
3000 220 240 280 380 400 420 440260
time
(mse
c)
0
150
100
320 340 360 460 480
200
250
50
300
Lines 1 and 2
CDP numbers
Figure 7. Lines 1 and 2 joined at the tie point between line 1 (CDP 490) and line 2 (CDP 225).
appr
oxim
ate
*ele
vatio
n (f
t)
*at SW end of line 1tie point line 1 and 2graphically sutured
page 1.
320
300240 280 380 400 420 440
W
260 340 360 460 480 500 520
80 ft0
1140
940
875
1060
1170
1200
NE
3000 220 240 280 380 400 420 440260
time
(mse
c)
0
150
100
320 340 360 460 480
200
250
50
300
appr
oxim
ate
*ele
vatio
n (f
t)
*at SW end of line 1
320
page 2.
gravel
300240 280 380 400 420 440
W
260 340 360 460 480 500 520
80 ft0
. . . . . . .1140
940
875
1060
1170
1200
1136
# 38# 29
830
1060
1150
1199
1164
1080
# 23
1157
1150
871
silty groundsurface
sandfine sand
fill material
outwash
lakebeds
Hadden Creek Till
MMC
bedrock
Based on wells # 38, # 29, and # 23.
siltygravel
siltysand
NE
3000 220 240 280 380 400 420 440260
appr
oxim
ate
*ele
vatio
n (f
t)
time
(mse
c)
0
150
100
320 340 360 460 480
200
250
50
300
*at SW end of line 1tie point line 1 and 2graphically sutured
CDP numbers
Figure 8. Lines 1 and 2 with interpretation joined at the tie point between line 1 (CDP 490) and line 2 (CDP 225).
Lines 1 and 2
page 1.
320
gravel
300240 280 380 400 420 440
W
260 340 360 460 480 500 520
80 ft0
. . . . . . .1140
940
875
1060
1170
1200
1136
# 38# 29
830
1060
1150
1199
1164
1080
# 23
1157
1150
871
silty groundsurface
sandfine sand
fill material
outwash
lakebeds
Hadden Creek Till
MMC
bedrock
Based on wells # 38, # 29, and # 23.
siltygravel
siltysand
NE
3000 220 240 280 380 400 420 440260
appr
oxim
ate
*ele
vatio
n (f
t)
time
(mse
c)
0
150
100
320 340 360 460 480
200
250
50
300
*at SW end of line 1tie point line 1 and 2graphically sutured
CDP numbers
Figure 8. Lines 1 and 2 with interpretation joined at the tie point between line 1 (CDP 490) and line 2 (CDP 225).
Lines 1 and 2
page 2.
320
Lines 1 and 2 with Alternate Interpretation
gravel
300240 280 380 400 420 440
W
260
CDP numbers
340 360 460 480 500 520
80 ft0
. . . . . . .1140
940
875
1060
1170
1200
1136
# 38# 29
830
1060
1150
1199
1164
1080
# 23
1157
1150
871
silty groundsurface
sandfine sand
siltygravel
siltysand
appr
oxim
ate
*ele
vatio
n (f
t)
NE
3000 220 240 280 380 400 420 440260
time
(mse
c)
0
150
100
320 340 360 460 480
200
250
50
300
*at SW end of line 1tie point line 1 and 2graphically sutured
Figure 9. Lines 1 and 2 with alternate interpretation joined at the tie point between line 1 (CDP 490) and line 2 (CDP 225).
fill material
outwash
lakebeds
HaddenCreekTill
MMC
bedrock
Based on wells # 38, # 29, and # 23.
page 1.
320
Lines 1 and 2 with Alternate Interpretation
gravel
300240 280 380 400 420 440
W
260
CDP numbers
340 360 460 480 500 520
80 ft0
. . . . . . .1140
940
875
1060
1170
1200
1136
# 38# 29
830
1060
1150
1199
1164
1080
# 23
1157
1150
871
silty groundsurface
sandfine sand
siltygravel
siltysand
appr
oxim
ate
*ele
vatio
n (f
t)
NE
3000 220 240 280 380 400 420 440260
time
(mse
c)
0
150
100
320 340 360 460 480
200
250
50
300
*at SW end of line 1tie point line 1 and 2graphically sutured
Figure 9. Lines 1 and 2 with alternate interpretation joined at the tie point between line 1 (CDP 490) and line 2 (CDP 225).
fill material
outwash
lakebeds
HaddenCreekTill
MMC
bedrock
Based on wells # 38, # 29, and # 23.
page 2.
320