Embed Size (px)
Citation preview
High-Resolution XRD – 2
Reciprocal Lattice Mapping
Superlattices

(00l)
(hkl)
Symmetricalw - 2q scan
Asymmetricalw - 2q scan
Sample Surface
2q scan
Scan directions
w scanw scan
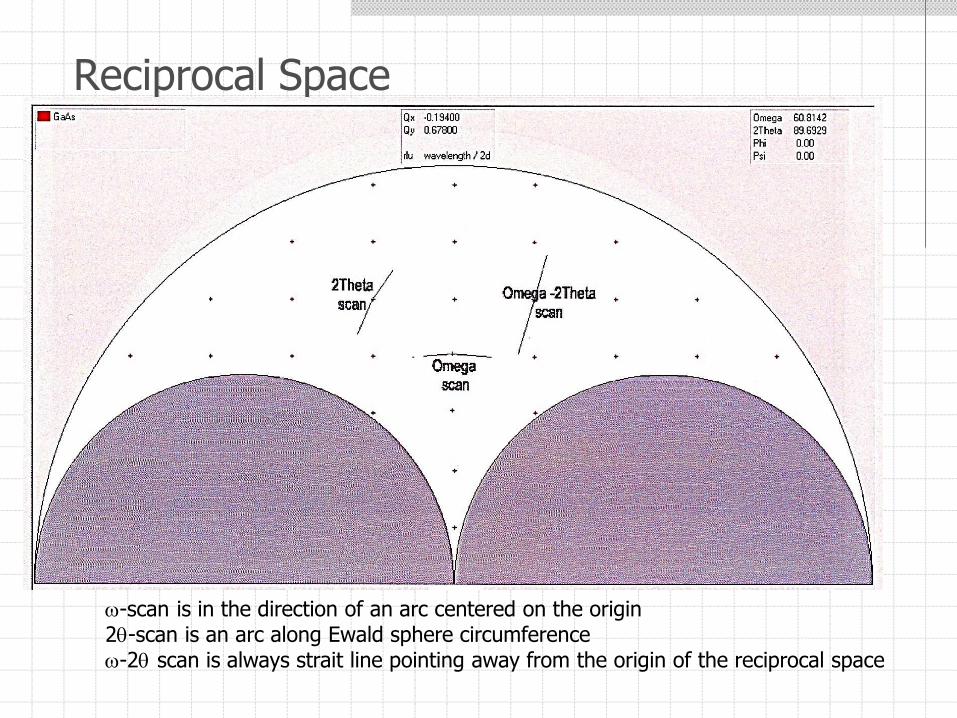
Reciprocal Space
w-scan is in the direction of an arc centered on the origin2q-scan is an arc along Ewald sphere circumferencew-2q scan is always strait line pointing away from the origin of the reciprocal space
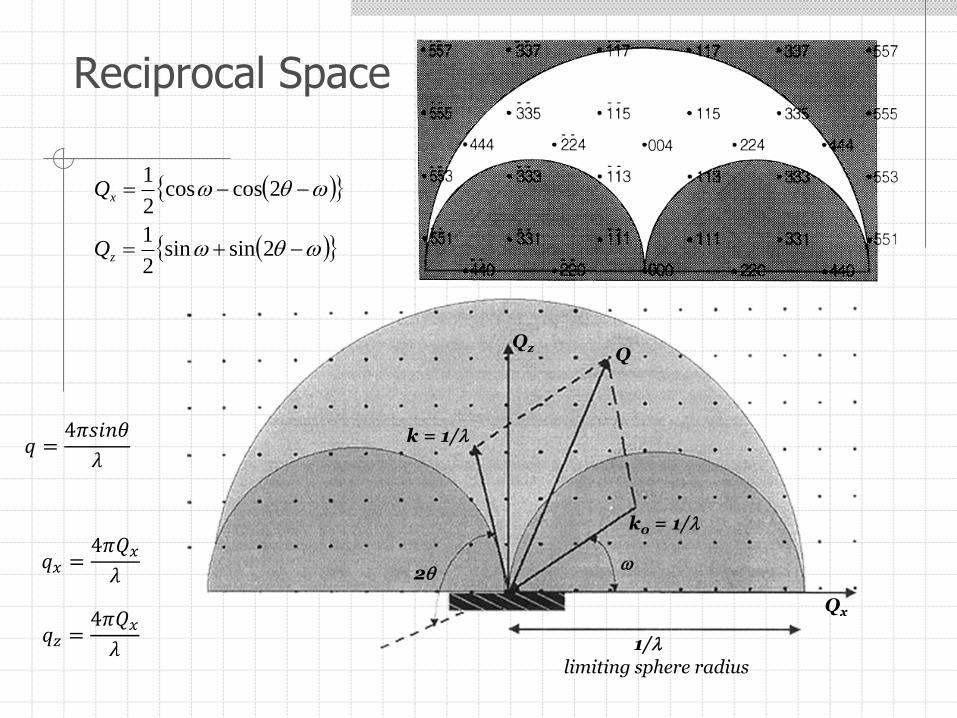
Reciprocal Space
wqw
wqw
2sinsin2
1
2coscos2
1
z
x
Q
Q
Qz
Qx
Q
k = 1/
k0 = 1/
2qw
1/
limiting sphere radius
𝑞𝑥 =4𝜋𝑄𝑥𝜆
𝑞𝑧 =4𝜋𝑄𝑥𝜆
𝑞 =4𝜋𝑠𝑖𝑛𝜃
𝜆
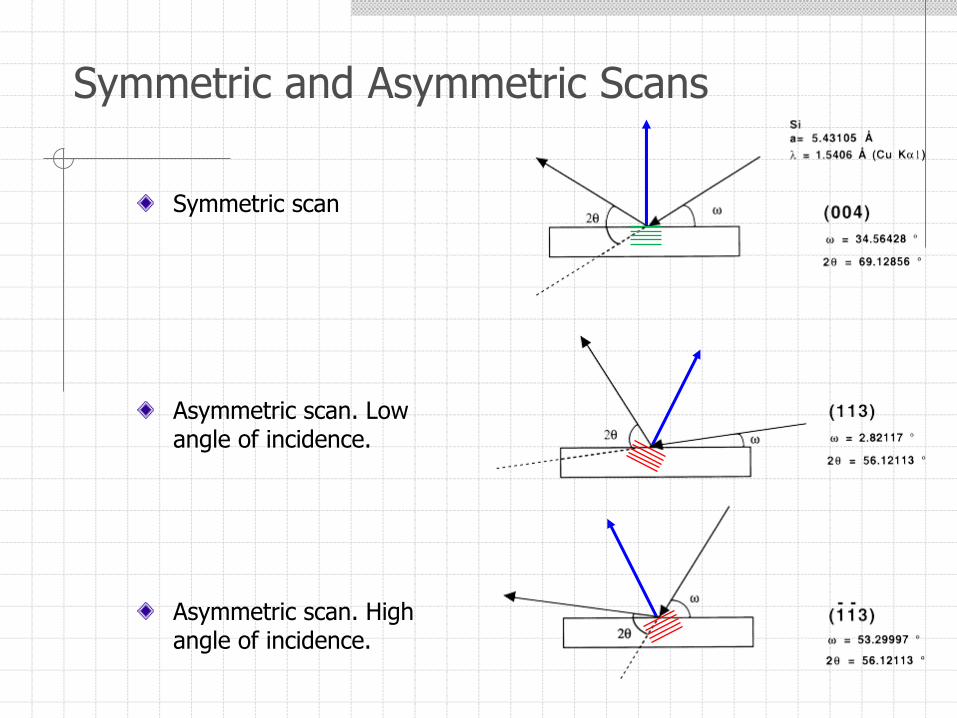
Symmetric and Asymmetric Scans
Symmetric scan
Asymmetric scan. Low angle of incidence.
Asymmetric scan. High angle of incidence.
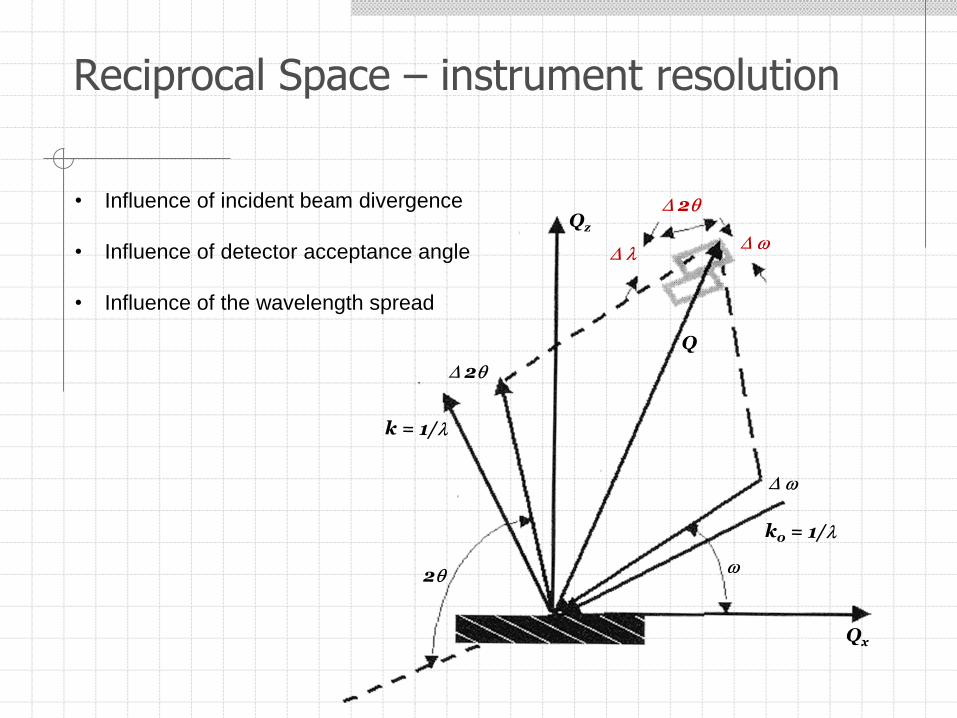
Reciprocal Space – instrument resolution
• Influence of incident beam divergence
• Influence of detector acceptance angle
• Influence of the wavelength spread
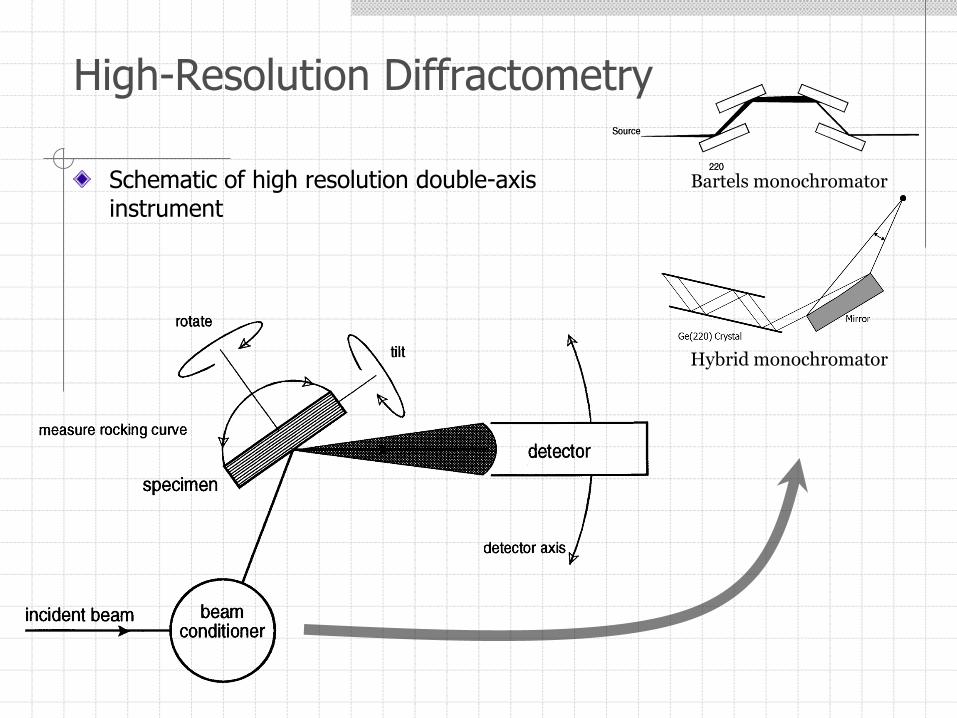
High-Resolution Diffractometry
Schematic of high resolution double-axis instrument
Bartels monochromator
Hybrid monochromator
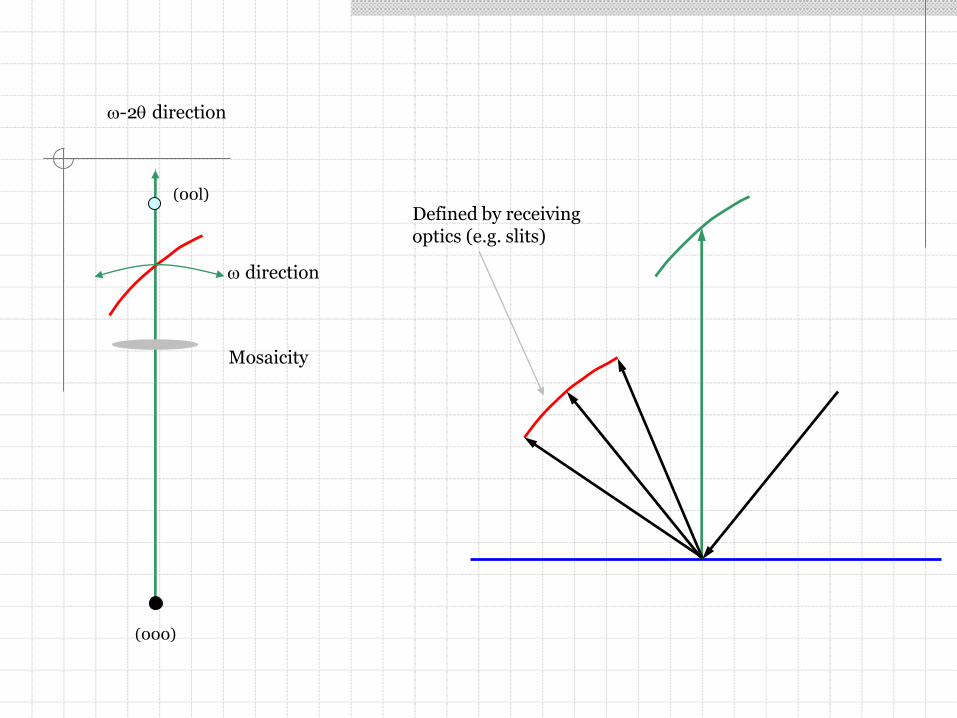
(000)
(00l)
w direction
w-2q direction
Defined by receiving optics (e.g. slits)
Mosaicity

(000)
(00l)
w direction
w-2q direction
Symmetrical Scan
Open detector
Triple axis
mosaicity
Open detector
Triple axis
d-spacing variation
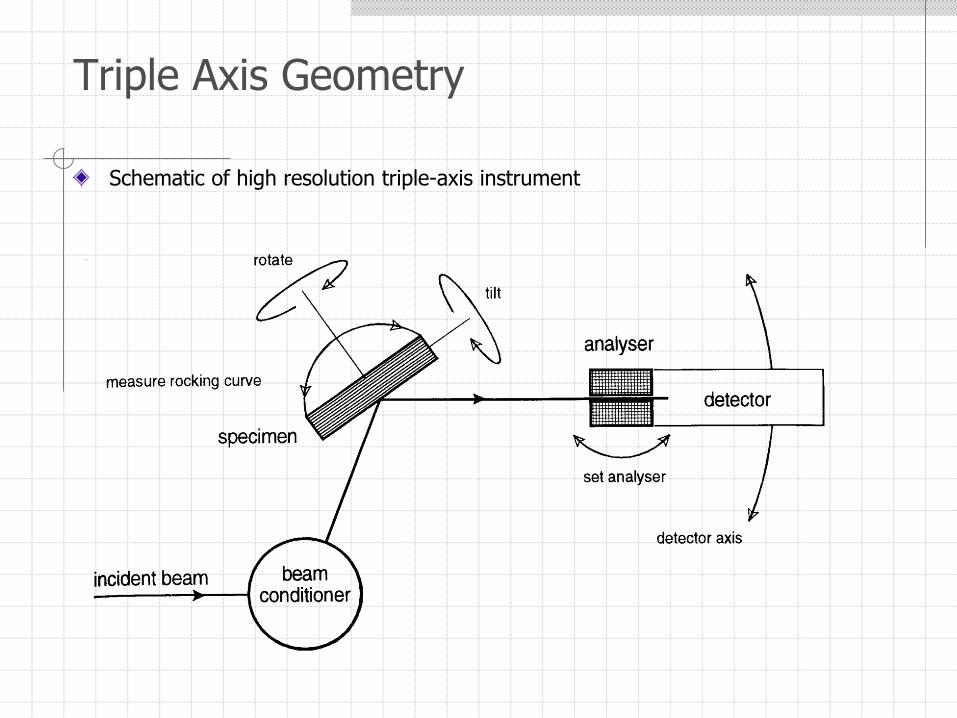
Triple Axis Geometry
Schematic of high resolution triple-axis instrument
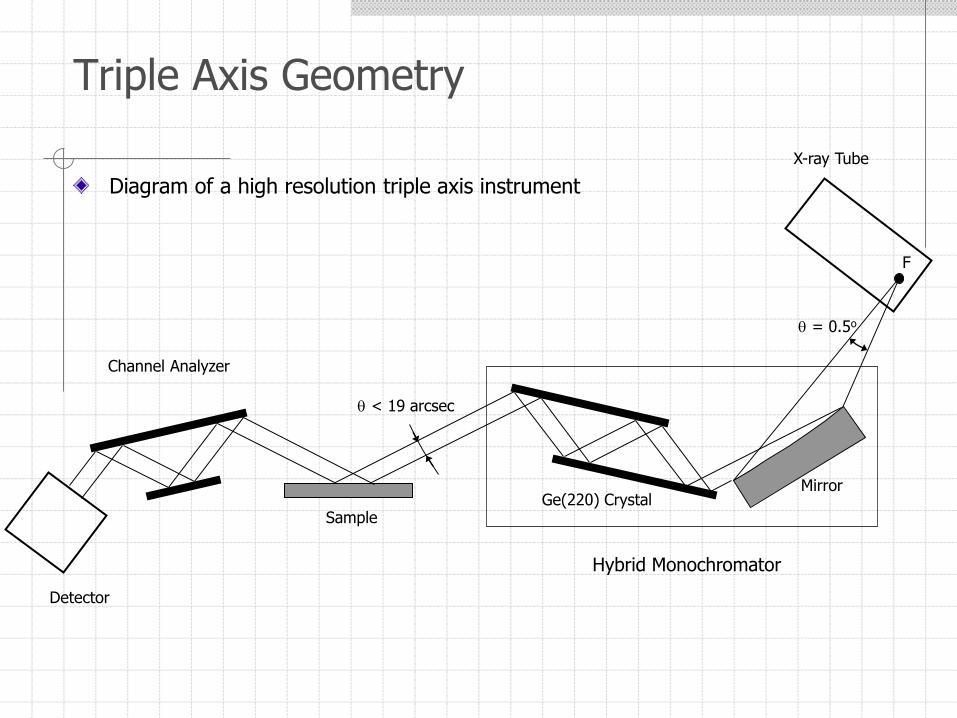
Triple Axis Geometry
Diagram of a high resolution triple axis instrument
Mirror
Sample
F
q = 0.5o
q < 19 arcsec
Ge(220) Crystal
X-ray Tube
Channel Analyzer
Detector
Hybrid Monochromator
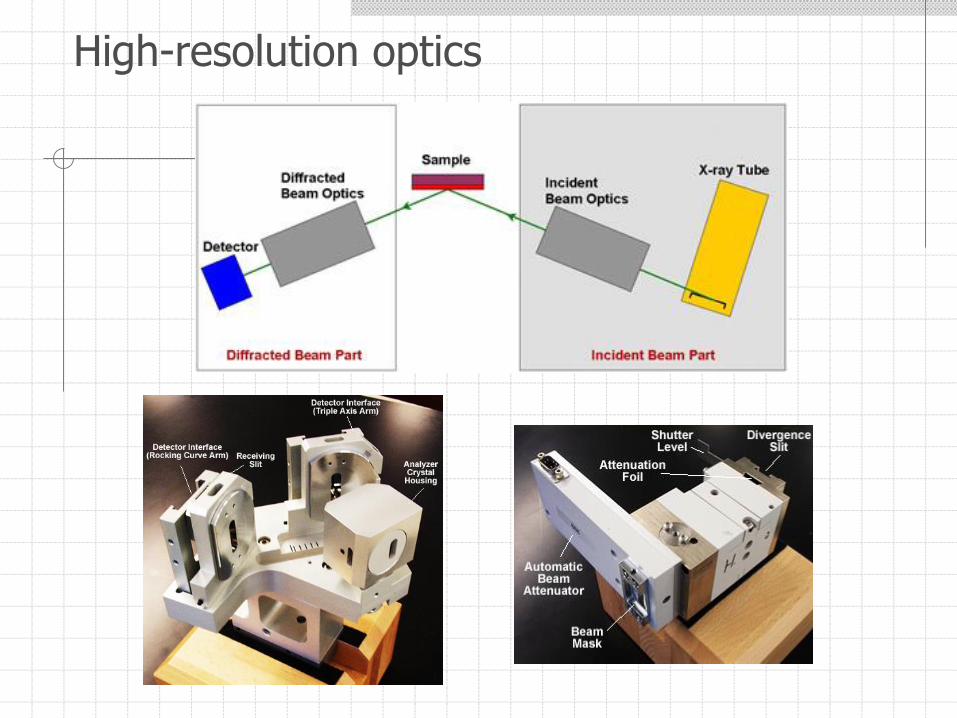
High-resolution optics
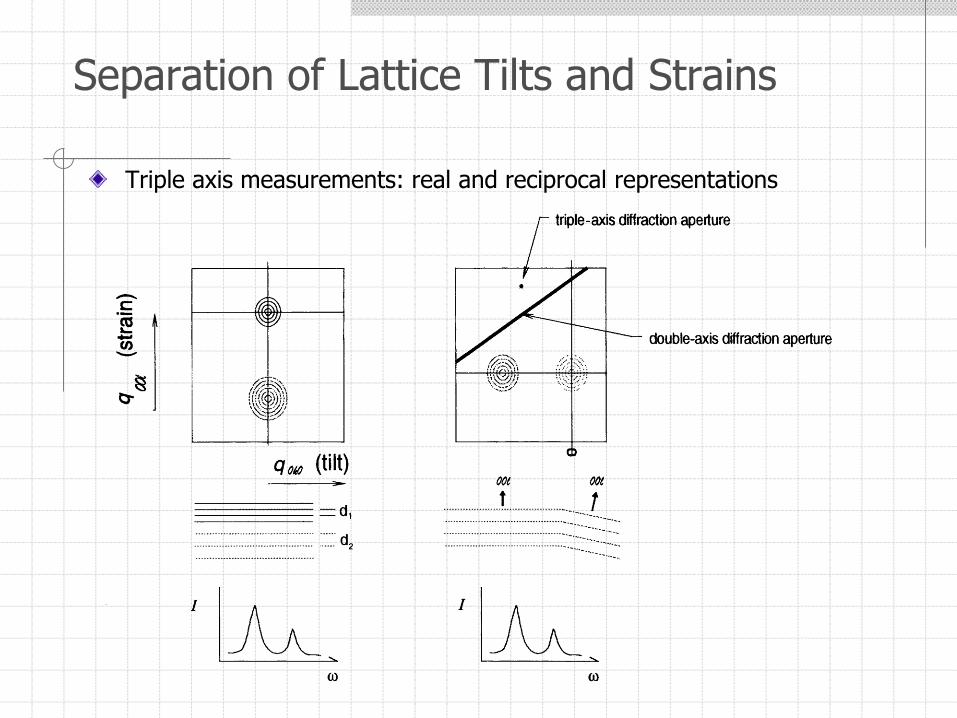
Separation of Lattice Tilts and Strains
Triple axis measurements: real and reciprocal representations
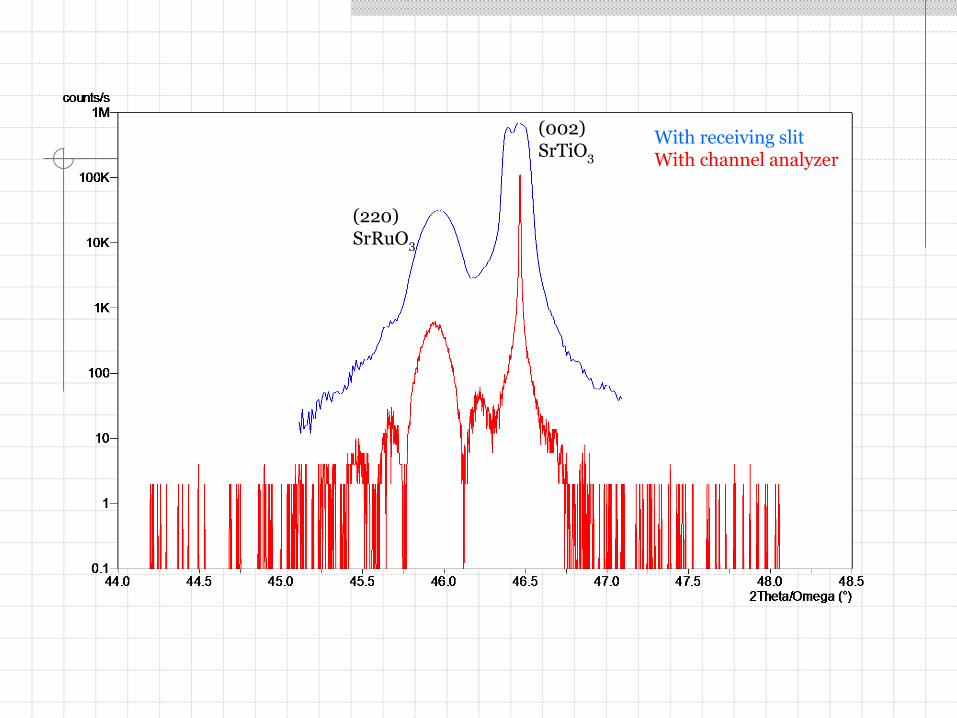
With receiving slitWith channel analyzer
(002)SrTiO3
(220)SrRuO3
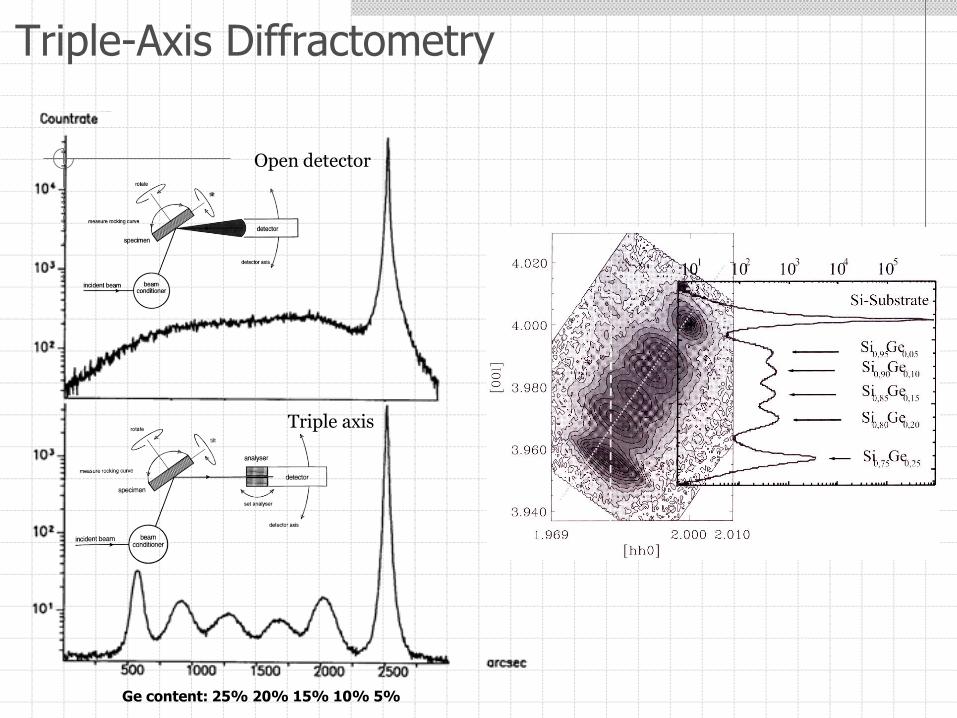
Ge content: 25% 20% 15% 10% 5%
Open detector
Triple axis
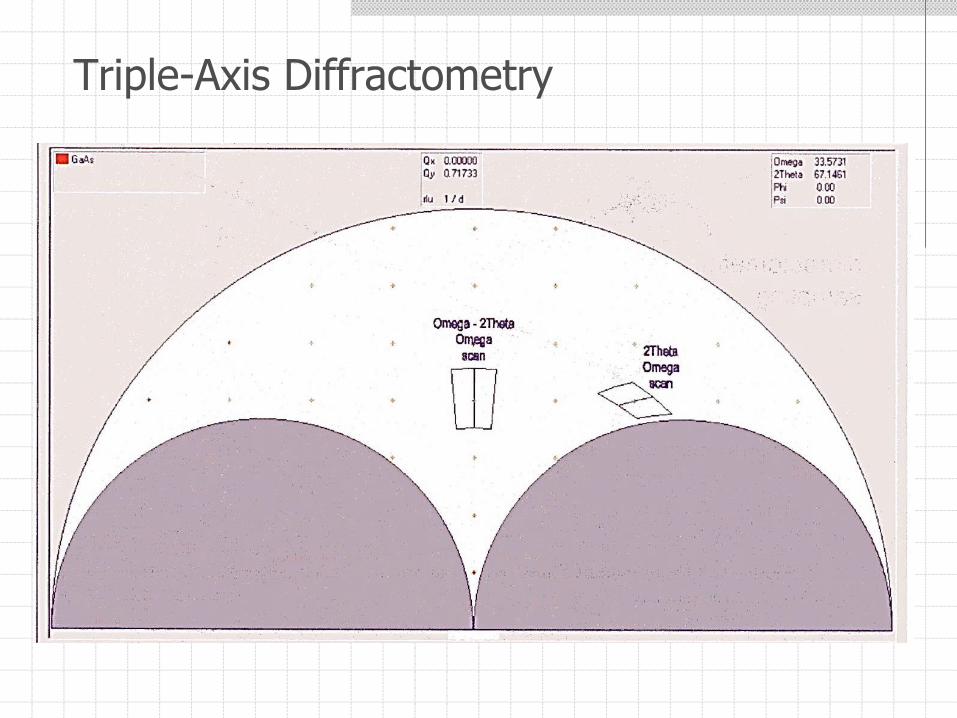
Triple-Axis Diffractometry
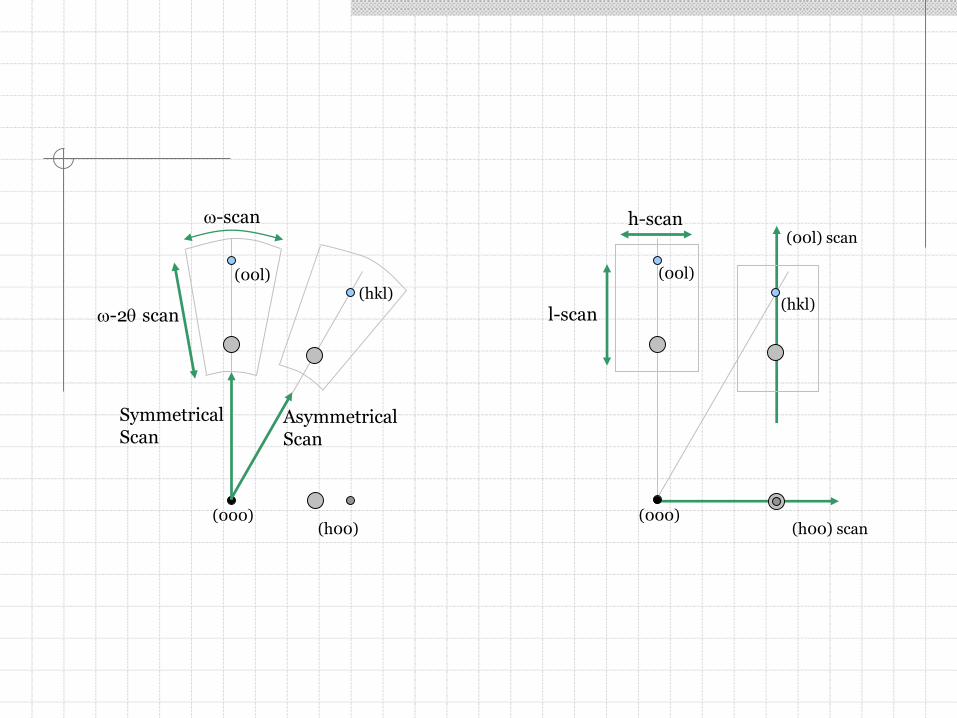
(hkl)(00l)
(000)
SymmetricalScan
AsymmetricalScan
(h00)
w-scan
w-2q scan(hkl)
(00l)
(000)
(00l) scan
(h00) scan
h-scan
l-scan
Triple-Axis Diffractometry
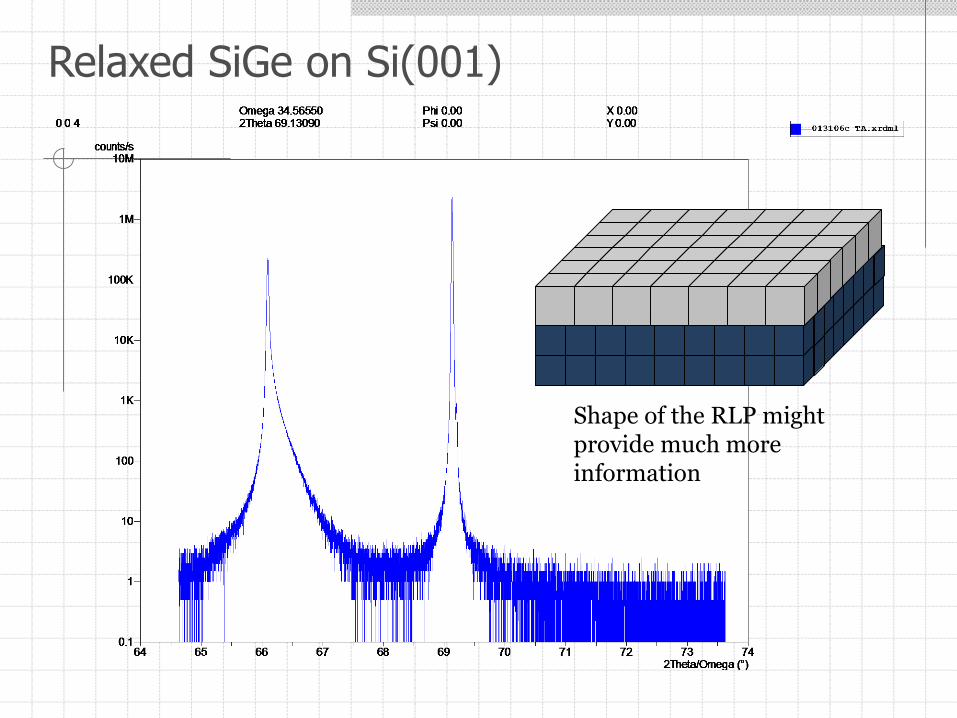
Relaxed SiGe on Si(001)
Shape of the RLP might provide much more information

Relaxed SiGe on Si(001)(oo4) RLM
Si(004)
SiGe(004)
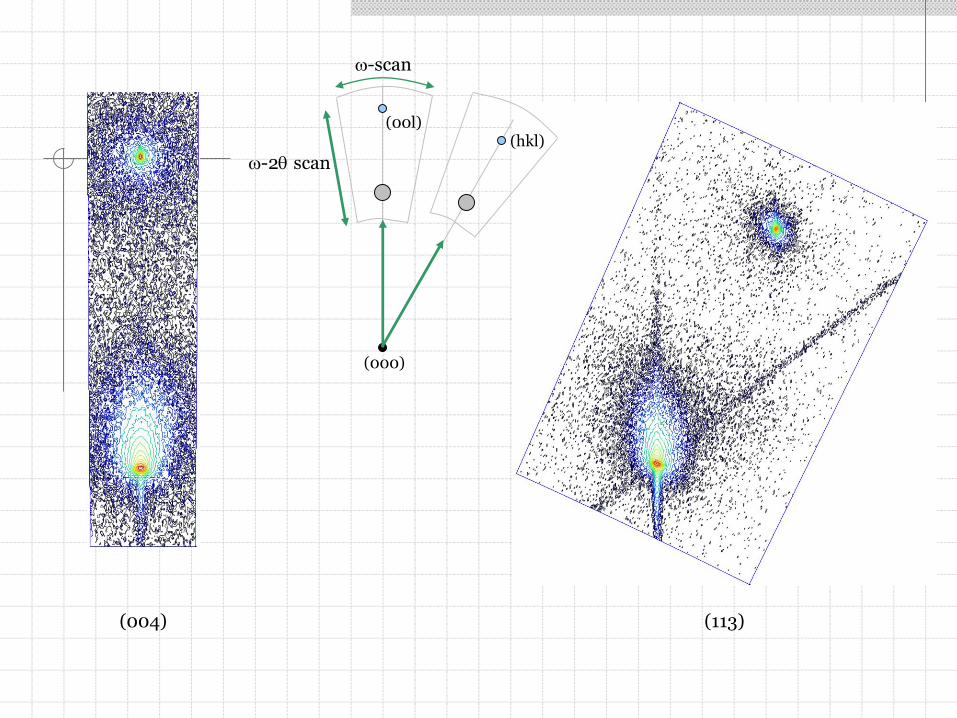
(004) (113)
(hkl)(00l)
(000)
w-scan
w-2q scan
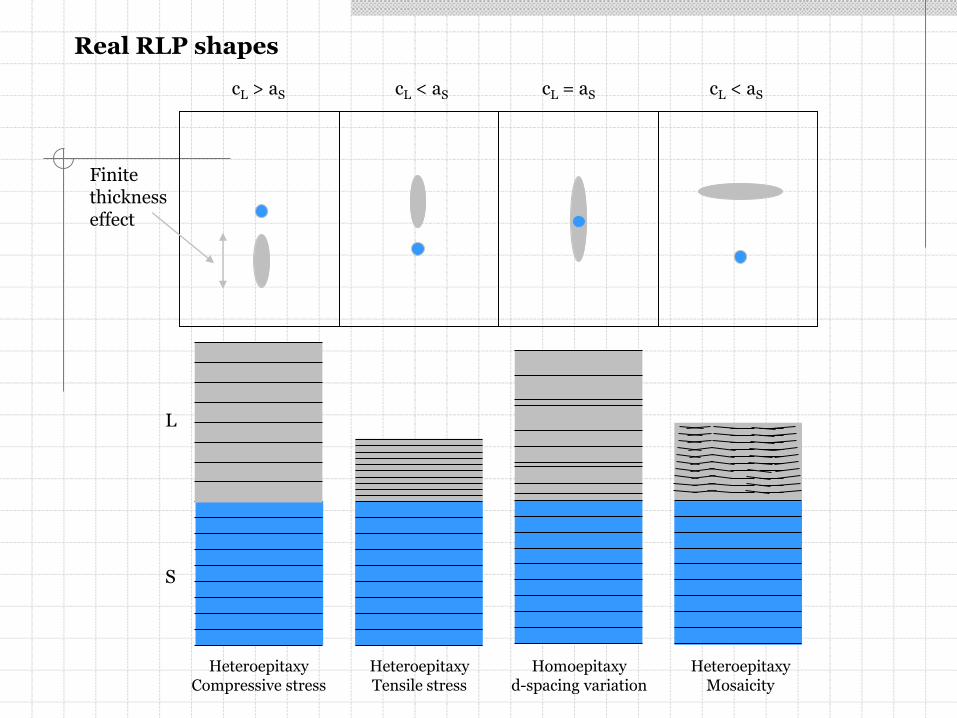
Real RLP shapes
HeteroepitaxyCompressive stress
L
S
HeteroepitaxyTensile stress
Homoepitaxyd-spacing variation
HeteroepitaxyMosaicity
Finite thickness effect
cL < aScL > aS cL = aS cL < aS
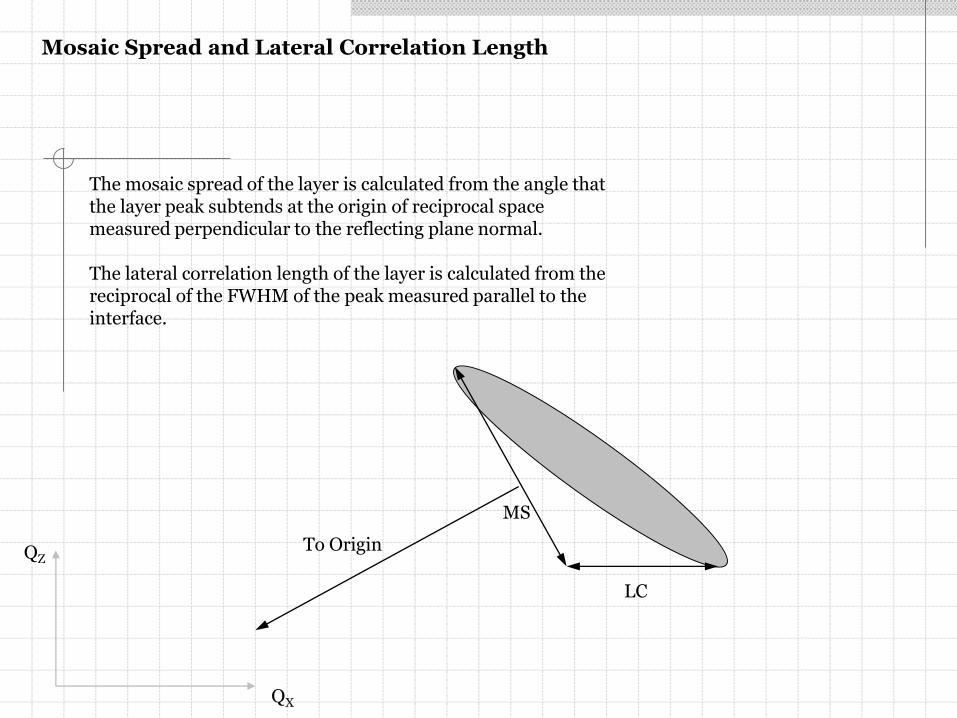
The mosaic spread of the layer is calculated from the angle that the layer peak subtends at the origin of reciprocal space measured perpendicular to the reflecting plane normal.
The lateral correlation length of the layer is calculated from the reciprocal of the FWHM of the peak measured parallel to the interface.
Mosaic Spread and Lateral Correlation Length
LC
MS
To OriginQZ
QX
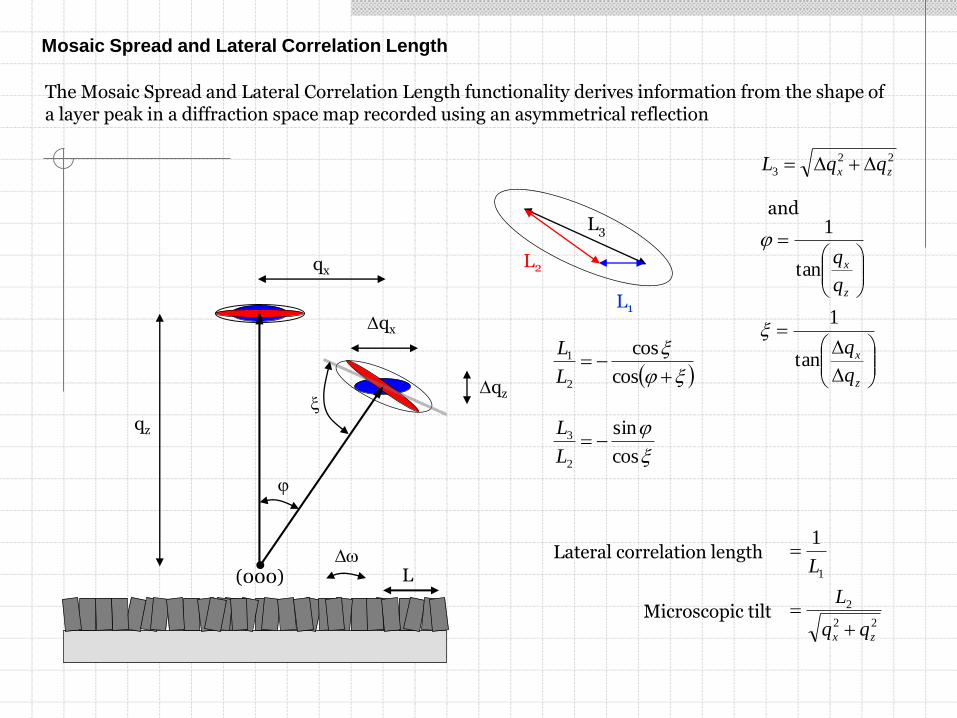
The Mosaic Spread and Lateral Correlation Length functionality derives information from the shape of a layer peak in a diffraction space map recorded using an asymmetrical reflection
L
qz
L3
L2
L1
Dqx
Dqzx
j
xj
x
cos
cos
2
1
L
L
x
j
cos
sin
2
3 L
L
D
D
DD
z
x
z
x
zx
q
q
q
q
qqL
tan
1
tan
1
22
3
x
j
and
Lateral correlation length
22
2
1
1
zx qq
L
L
Microscopic tilt
qx
(000)
Mosaic Spread and Lateral Correlation Length
Dw
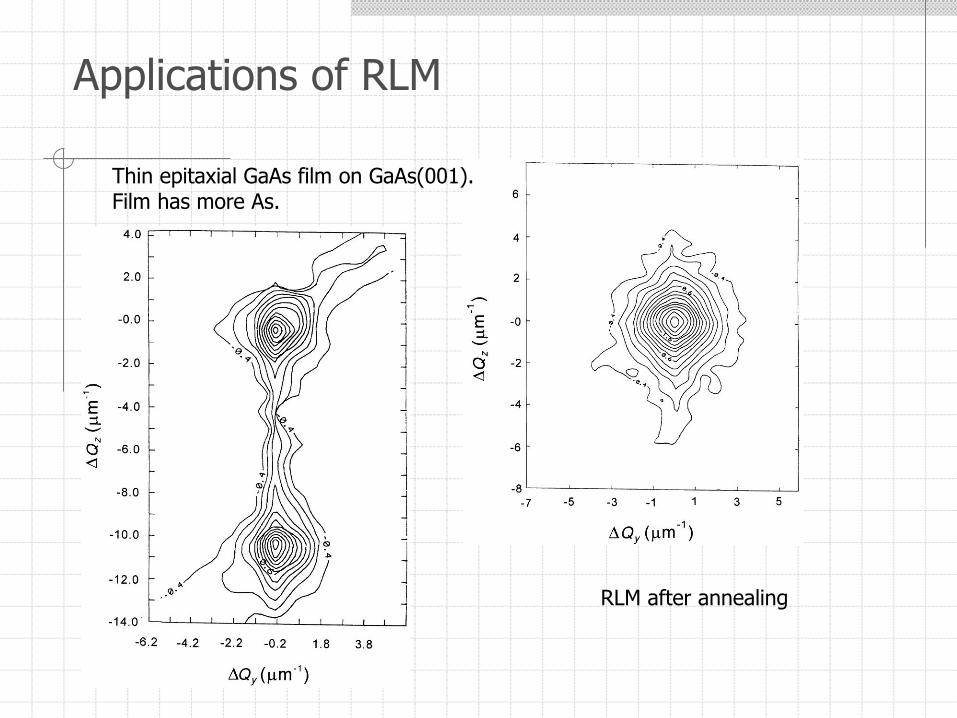
Applications of RLM
Thin epitaxial GaAs film on GaAs(001).Film has more As.
RLM after annealing
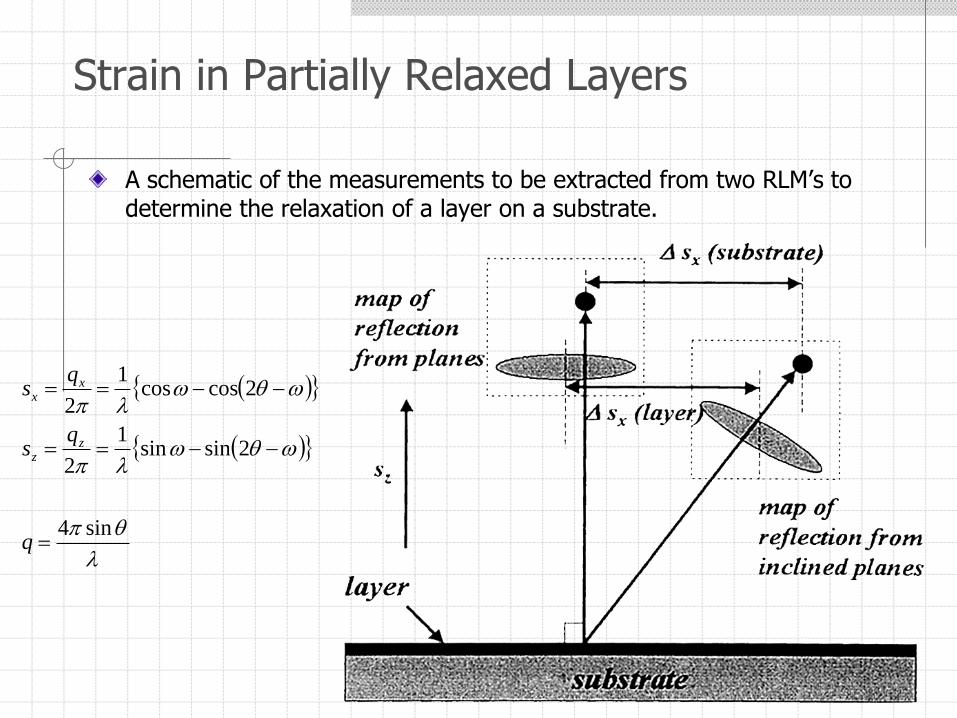
Strain in Partially Relaxed Layers
A schematic of the measurements to be extracted from two RLM’s to determine the relaxation of a layer on a substrate.
q
wqw
wqw
sin4
2sinsin1
2
2coscos1
2
q
qs
qs
zz
xx
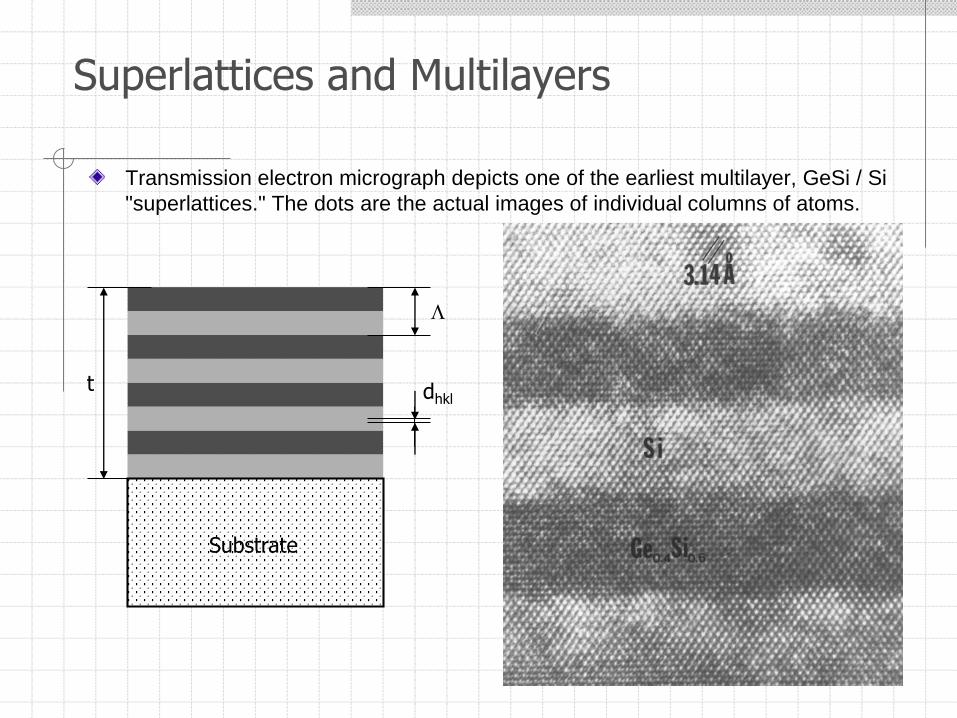
Superlattices and Multilayers
Transmission electron micrograph depicts one of the earliest multilayer, GeSi / Si
"superlattices." The dots are the actual images of individual columns of atoms.
Substrate
L
t dhkl
Superlattices and Multilayers
General characteristics of large repeat superlattices
The spatial period of the structure
The thickness of the repeating unit
The composition of the layers
The dispersion in the repeating period
The interface roughness
The interface grading
Superlattices and Multilayers
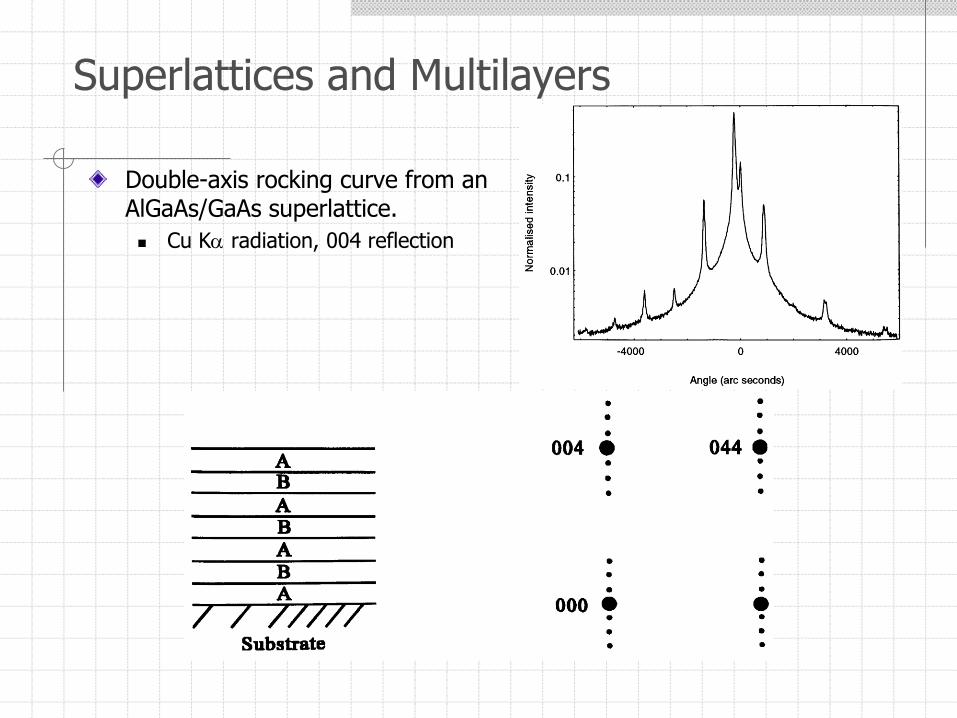
Double-axis rocking curve from an AlGaAs/GaAs superlattice.
Cu Ka radiation, 004 reflection
Superlattices and Multilayers
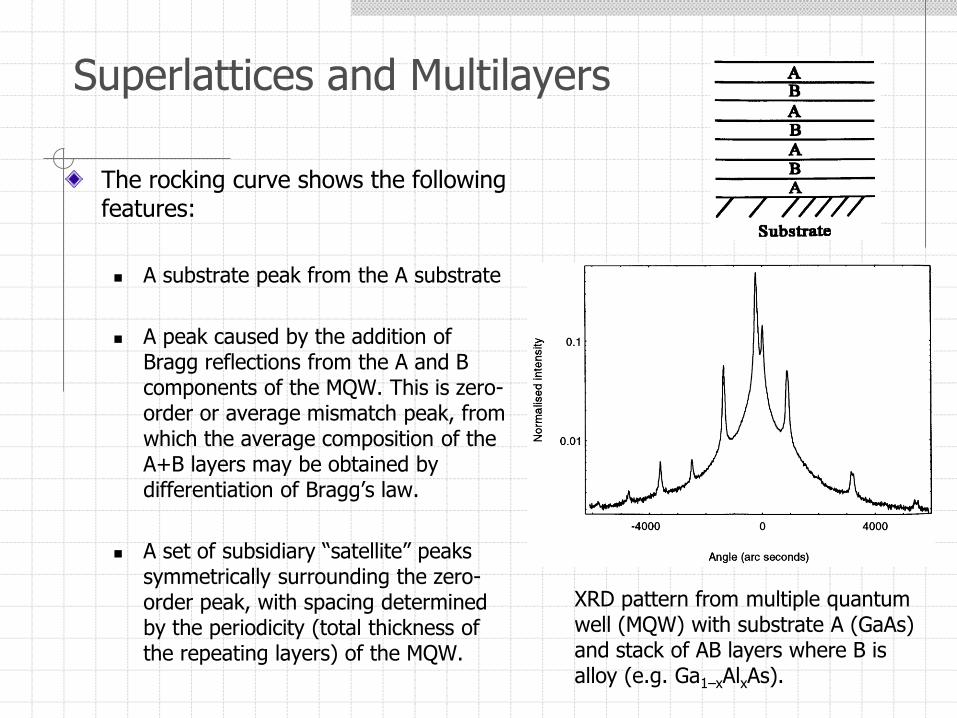
The rocking curve shows the following features:
A substrate peak from the A substrate
A peak caused by the addition of Bragg reflections from the A and B components of the MQW. This is zero-order or average mismatch peak, from which the average composition of the A+B layers may be obtained by differentiation of Bragg’s law.
A set of subsidiary “satellite” peaks symmetrically surrounding the zero-order peak, with spacing determined by the periodicity (total thickness of the repeating layers) of the MQW.
XRD pattern from multiple quantum well (MQW) with substrate A (GaAs) and stack of AB layers where B is alloy (e.g. Ga1–xAlxAs).
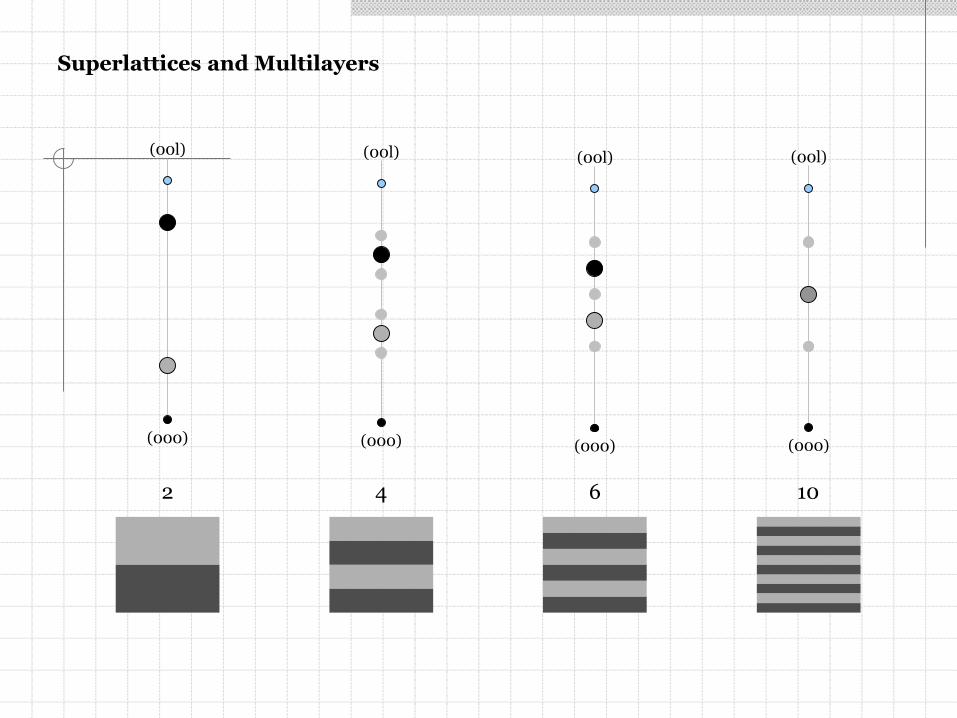
Superlattices and Multilayers
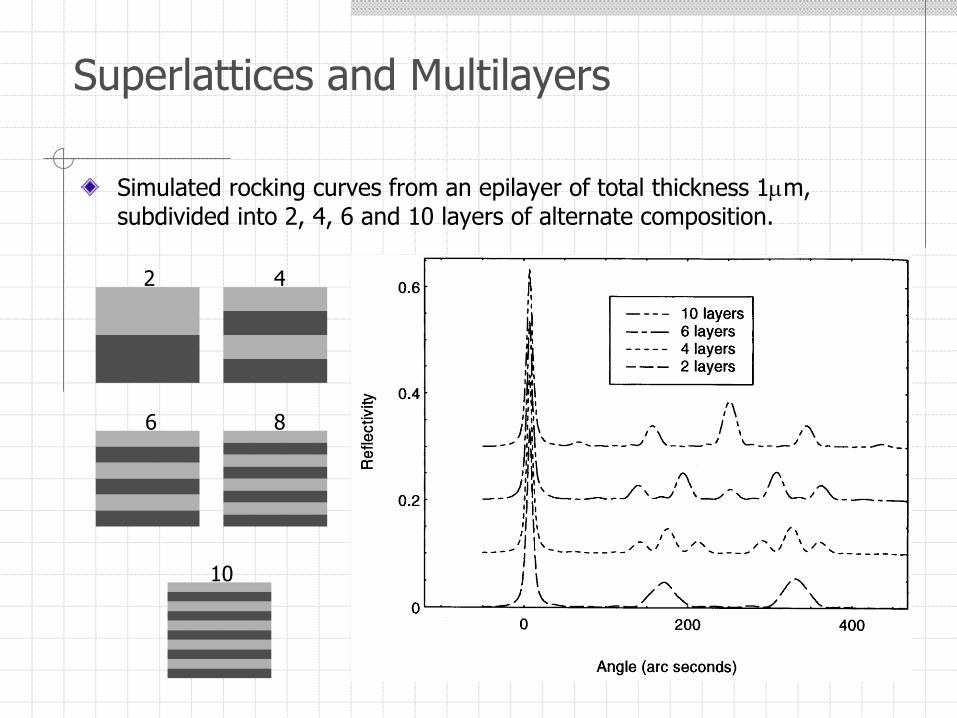
Simulated rocking curves from an epilayer of total thickness 1mm, subdivided into 2, 4, 6 and 10 layers of alternate composition.
2 4
6 8
10
6
(000)
(00l)
10
(000)
(00l)
2
(000)
(00l)
4
(000)
(00l)
Superlattices and Multilayers
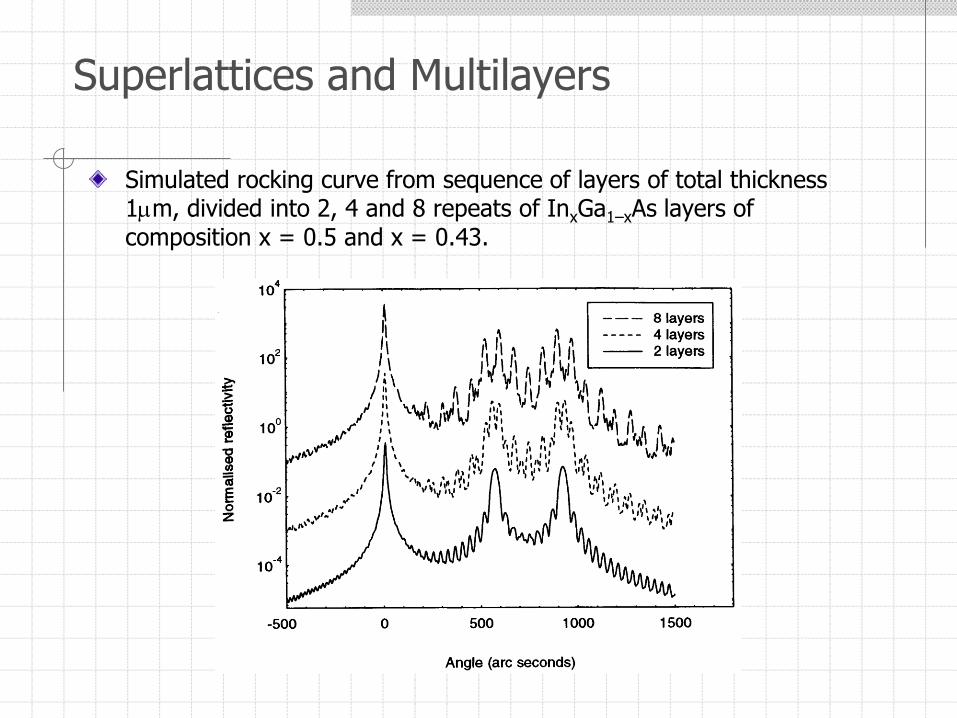
Superlattices and Multilayers
Simulated rocking curve from sequence of layers of total thickness 1mm, divided into 2, 4 and 8 repeats of InxGa1–xAs layers of composition x = 0.5 and x = 0.43.
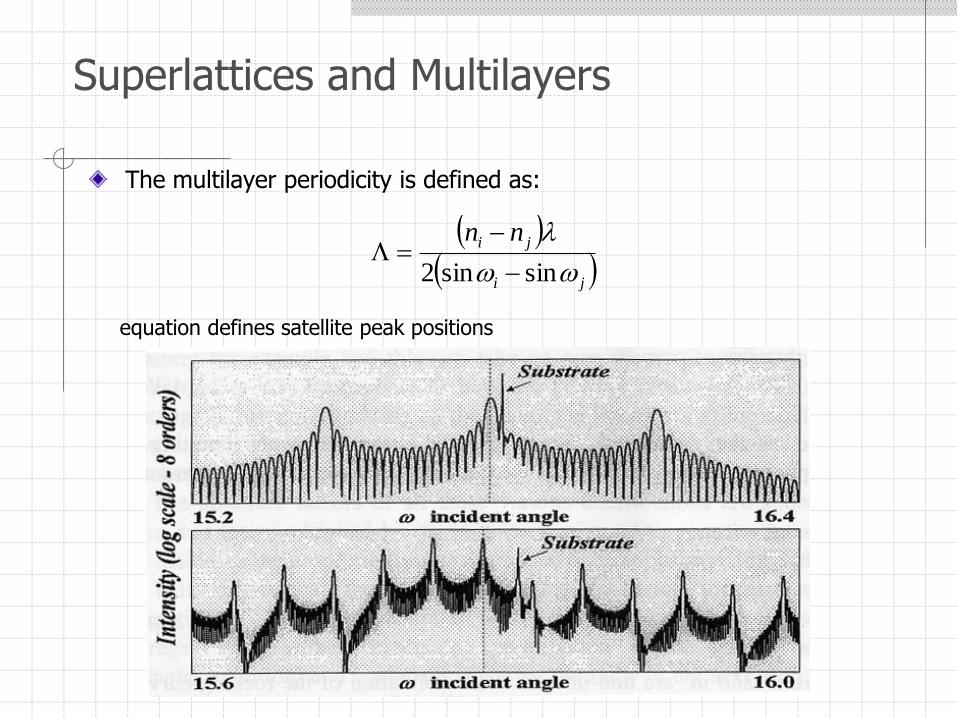
Superlattices and Multilayers
The multilayer periodicity is defined as:
ji
ji nn
ww
sinsin2
L
equation defines satellite peak positions
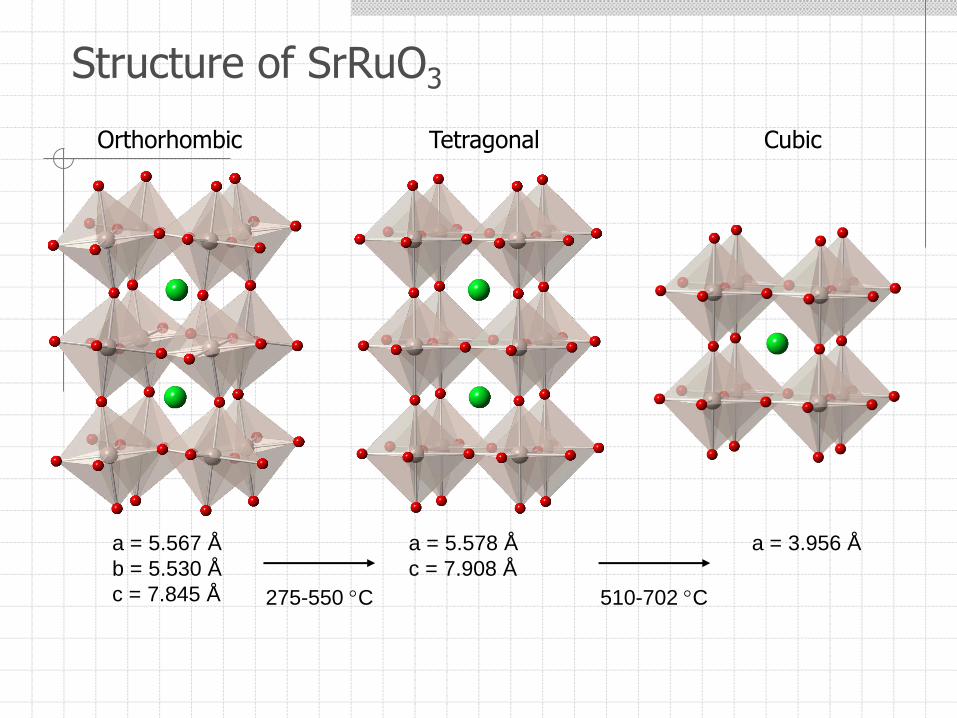
Structure of SrRuO3
a = 5.567 Å
b = 5.530 Å
c = 7.845 Å
a = 5.578 Å
c = 7.908 Å
a = 3.956 Å
275-550 C 510-702 C
Orthorhombic Tetragonal Cubic
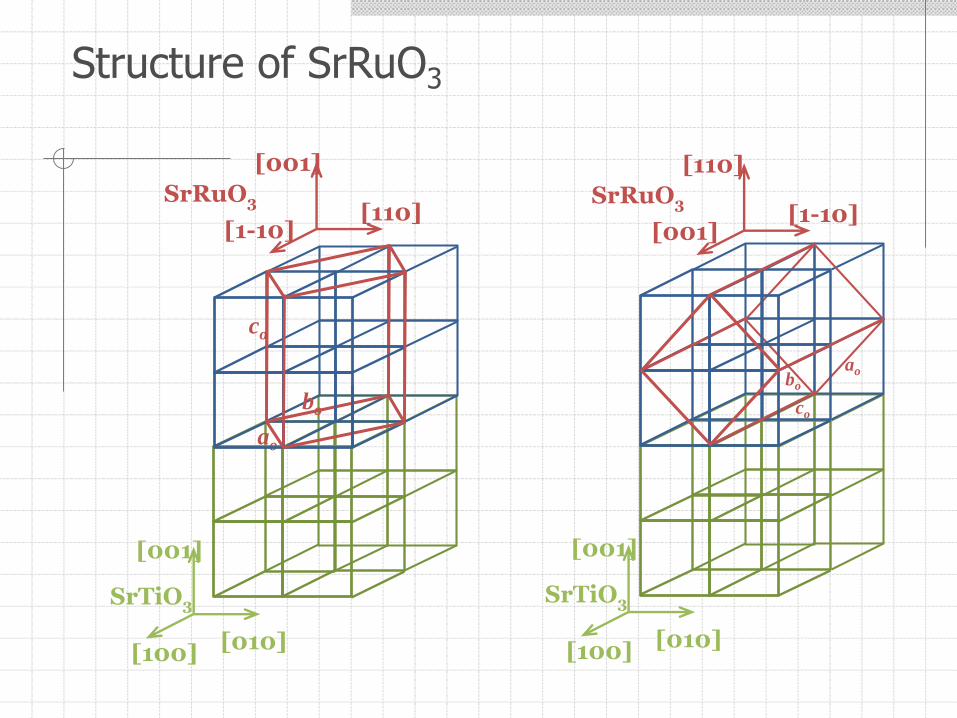
Structure of SrRuO3
SrRuO3
SrTiO3
aobo
co
ao
bo
co
[100]
[001]
[010]
[1-10]
[001]
[110]
SrTiO3
[100]
[001]
[010]
SrRuO3
[001]
[110]
[1-10]
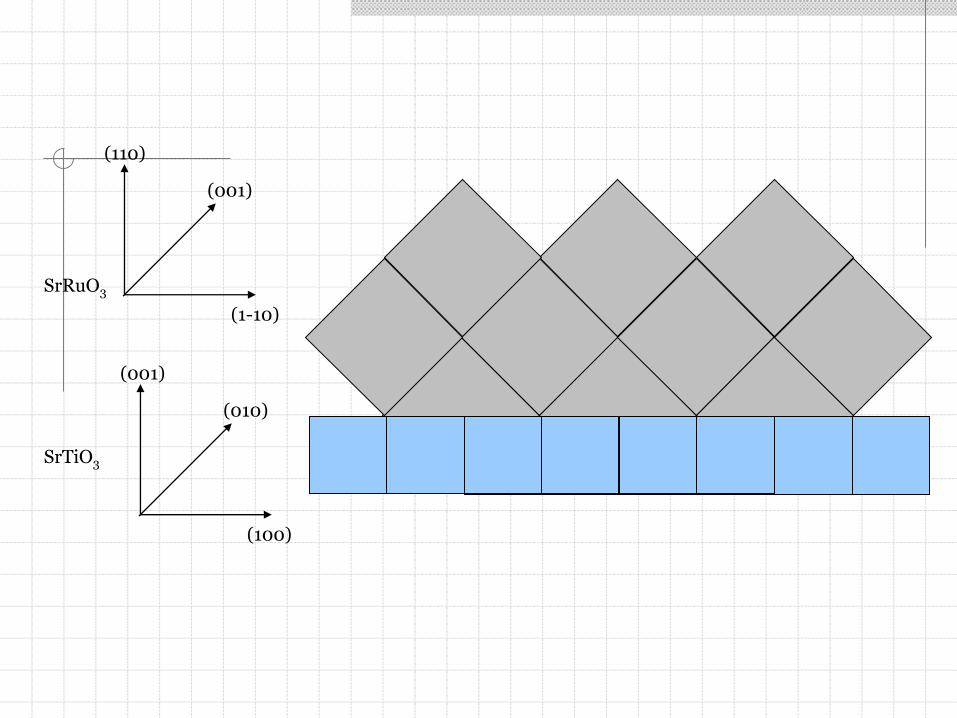
SrRuO3
SrTiO3
(110)
(001)
(1-10)
(001)
(010)
(100)
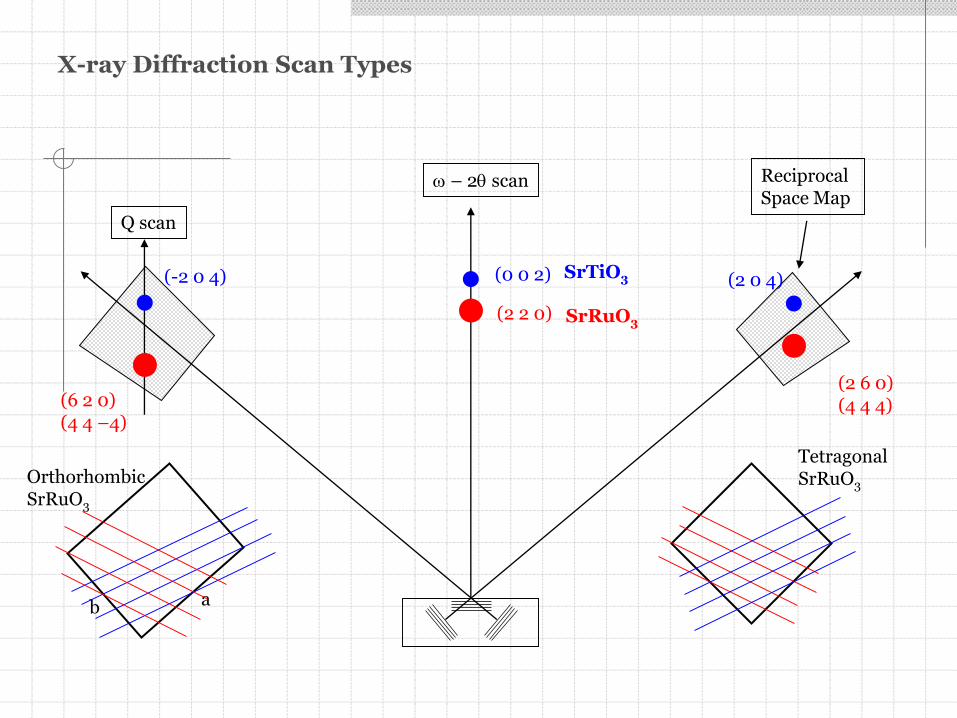
(2 6 0)(4 4 4)(6 2 0)
(4 4 –4)
(2 2 0)
(0 0 2)(-2 0 4) (2 0 4)
w – 2q scan Reciprocal Space Map
Q scan
SrTiO3
SrRuO3
ab
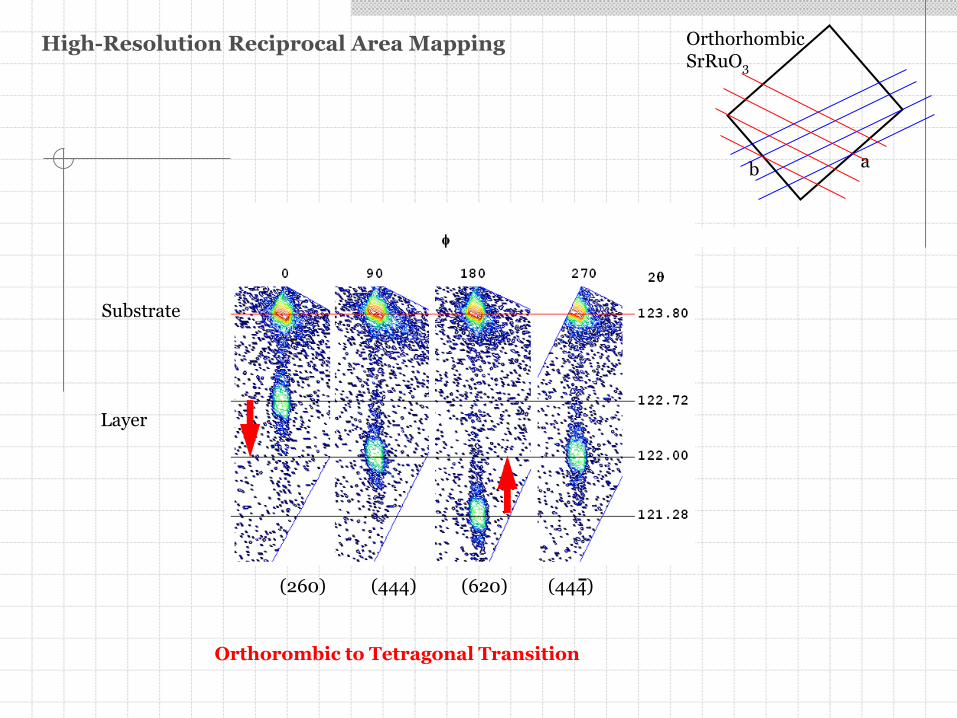
OrthorhombicSrRuO3
TetragonalSrRuO3
X-ray Diffraction Scan Types
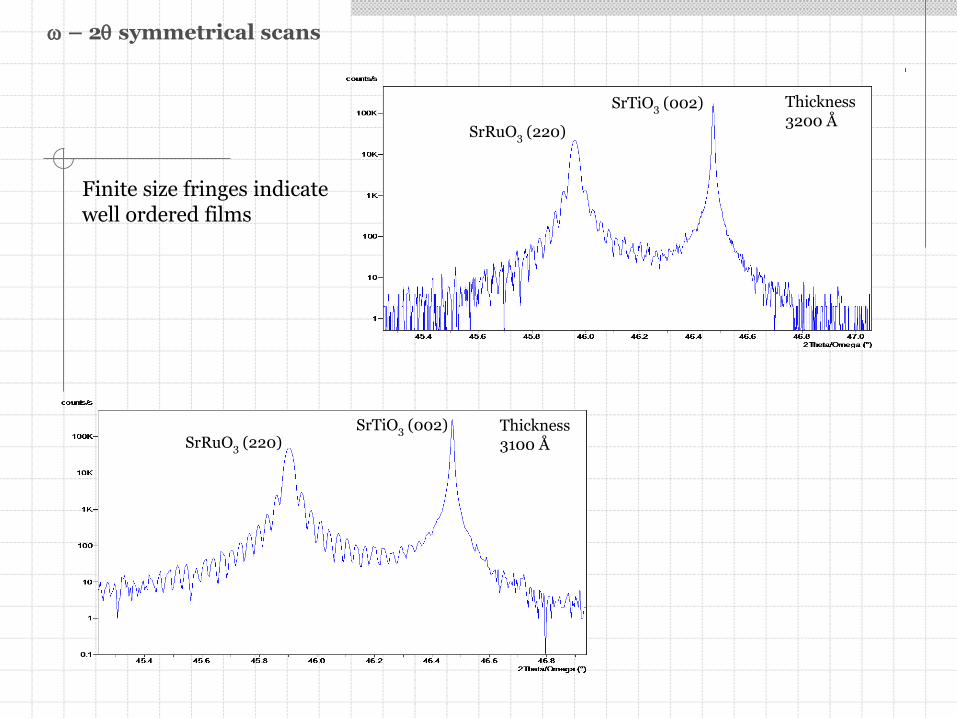
Thickness3100 Å
SrTiO3 (002)
SrRuO3 (220)
SrTiO3 (002)SrRuO3 (220)
Thickness3200 Å
Finite size fringes indicate well ordered films
w – 2q symmetrical scans
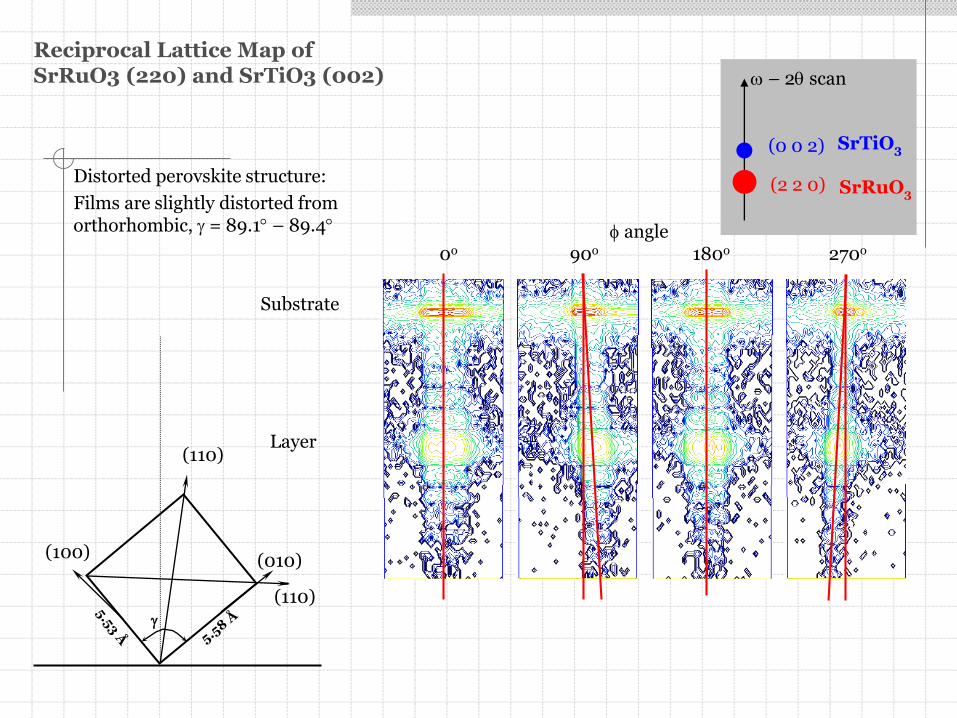
f angle0o 90o 180o 270o
(2 2 0)
(0 0 2)
w – 2q scan
SrTiO3
SrRuO3
Reciprocal Lattice Map ofSrRuO3 (220) and SrTiO3 (002)
Substrate
Layer
Distorted perovskite structure:
Films are slightly distorted from orthorhombic, g = 89.1 – 89.4
g
(110)
(110)
(100) (010)
ab
OrthorhombicSrRuO3
(260) (444) (620) (444)
High-Resolution Reciprocal Area Mapping
Substrate
Layer
Orthorombic to Tetragonal Transition
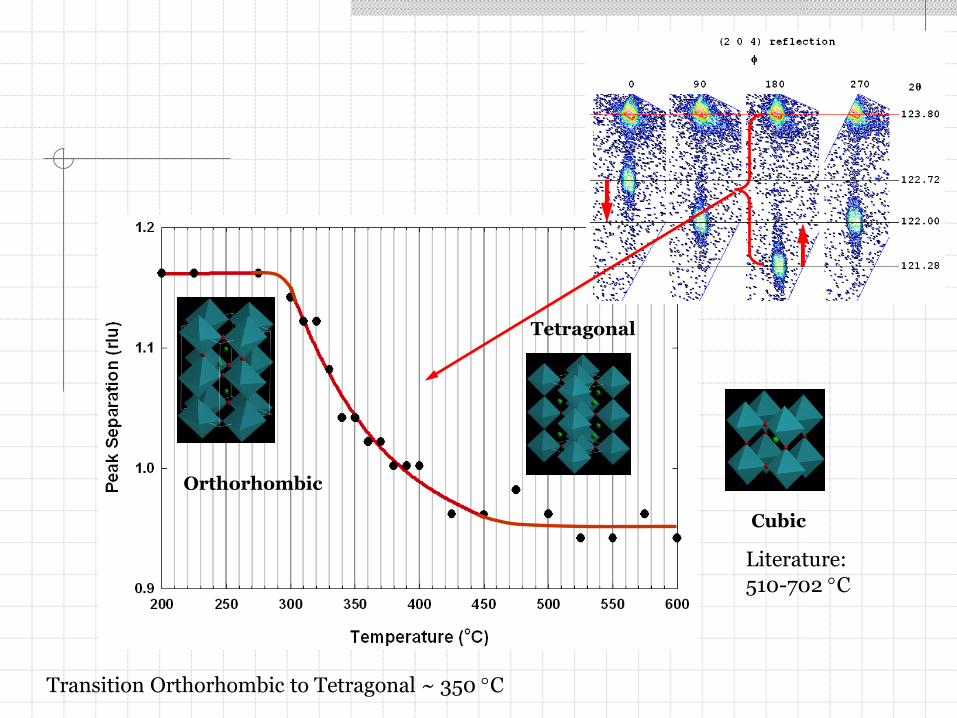
Orthorhombic
Tetragonal
Cubic
Literature: 510-702 C
Transition Orthorhombic to Tetragonal ~ 350 C
Temperature ( oC)
150 200 250 300 350 400
Inte
nsity (
arb
un
its)
0.0
0.2
0.4
0.6
0.8
1.0
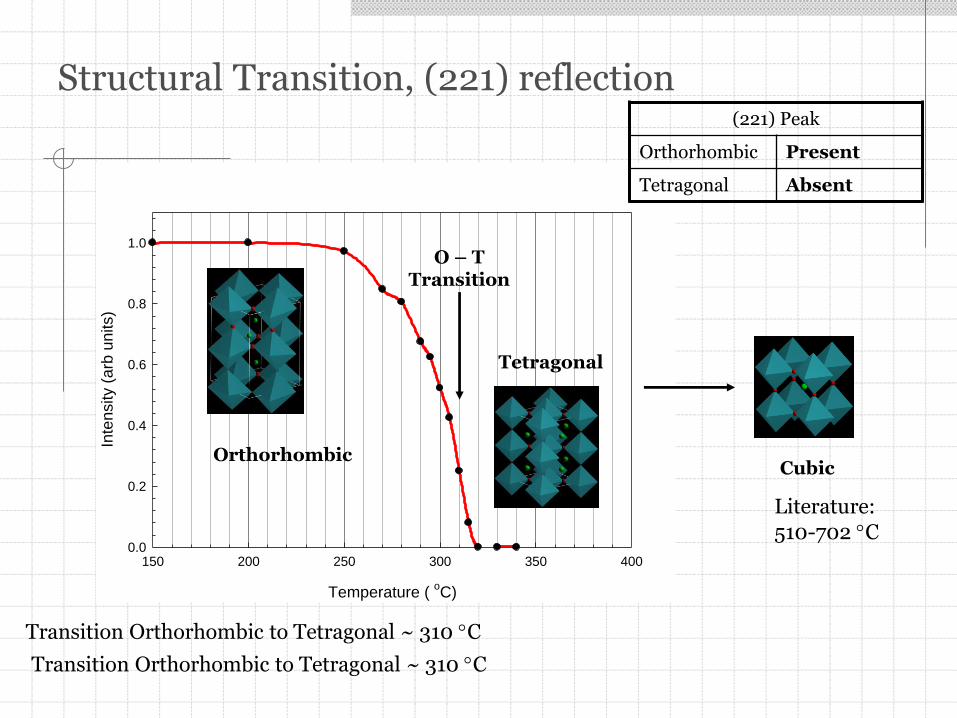
Structural Transition, (221) reflection
Orthorhombic
Tetragonal
Cubic
Literature: 510-702 C
Transition Orthorhombic to Tetragonal ~ 310 C
O – TTransition
(221) Peak
Orthorhombic Present
Tetragonal Absent
Transition Orthorhombic to Tetragonal ~ 310 C

a
Rotation Angle (deg)
0 2 4 6 8 10 12 14 16
Ca
lcu
late
d In
ten
sity (
arb
un
its)
0
10000
20000
30000
40000
50000
60000
(211) peak is absent in cubic SrRuO3
Structural Transition, (211) reflection
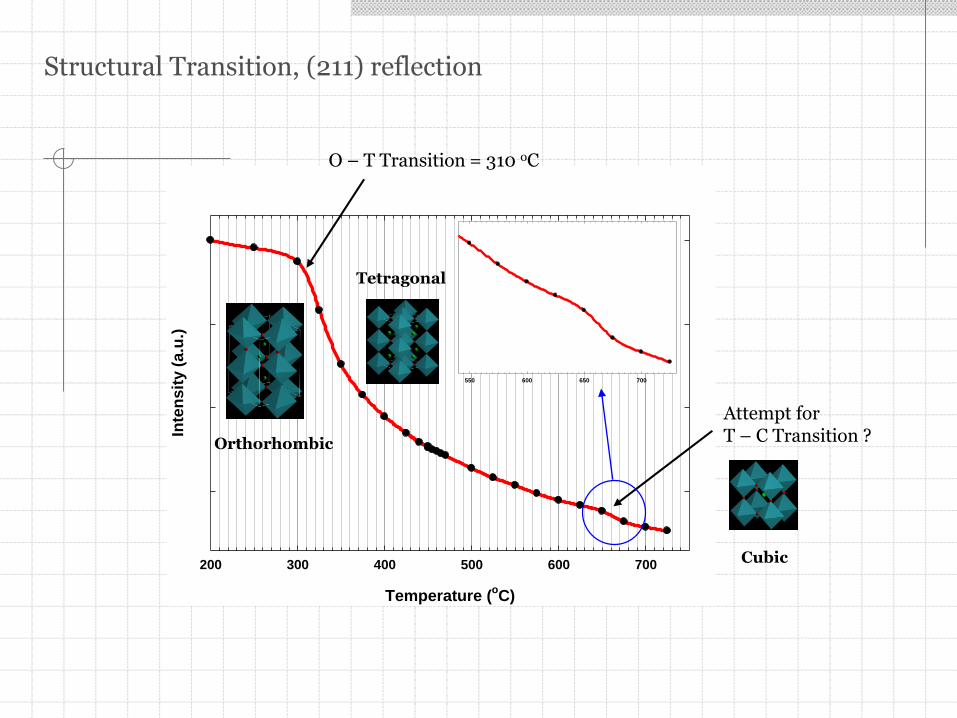
Temperature (oC)
200 300 400 500 600 700
Inte
nsit
y (
a.u
.)
550 600 650 700
Orthorhombic
Tetragonal
Cubic
Attempt forT – C Transition ?
O – T Transition = 310 oC
Structural Transition, (211) reflection
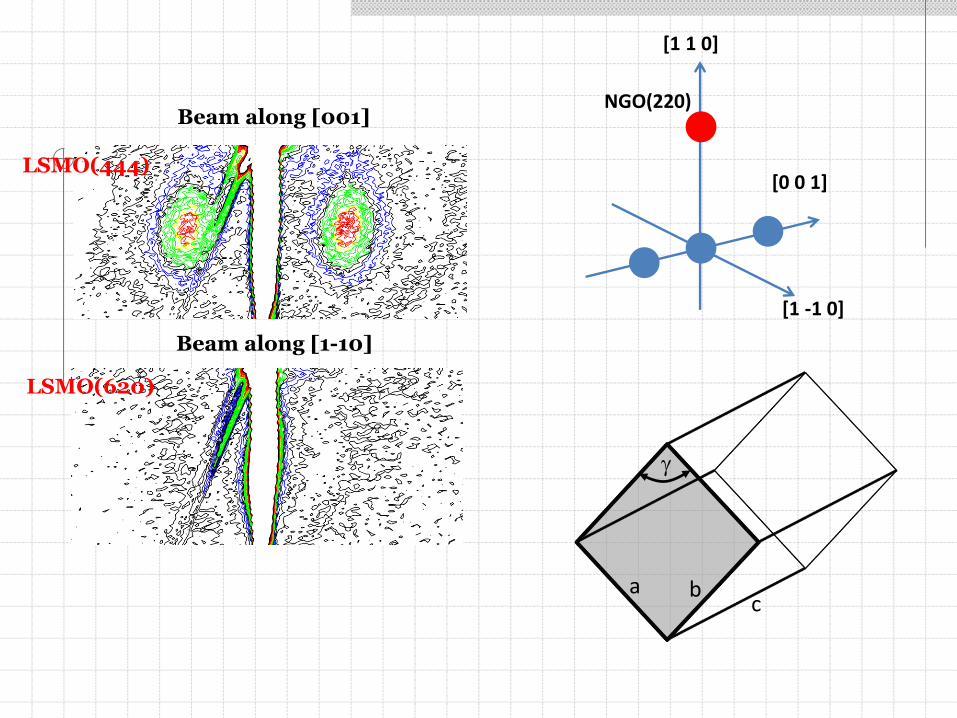
[0 0 1]
[1 -1 0]
[1 1 0]
NGO(220)
Beam along [1-10]
Beam along [001]
a bc
g
LSMO(444)
LSMO(620)
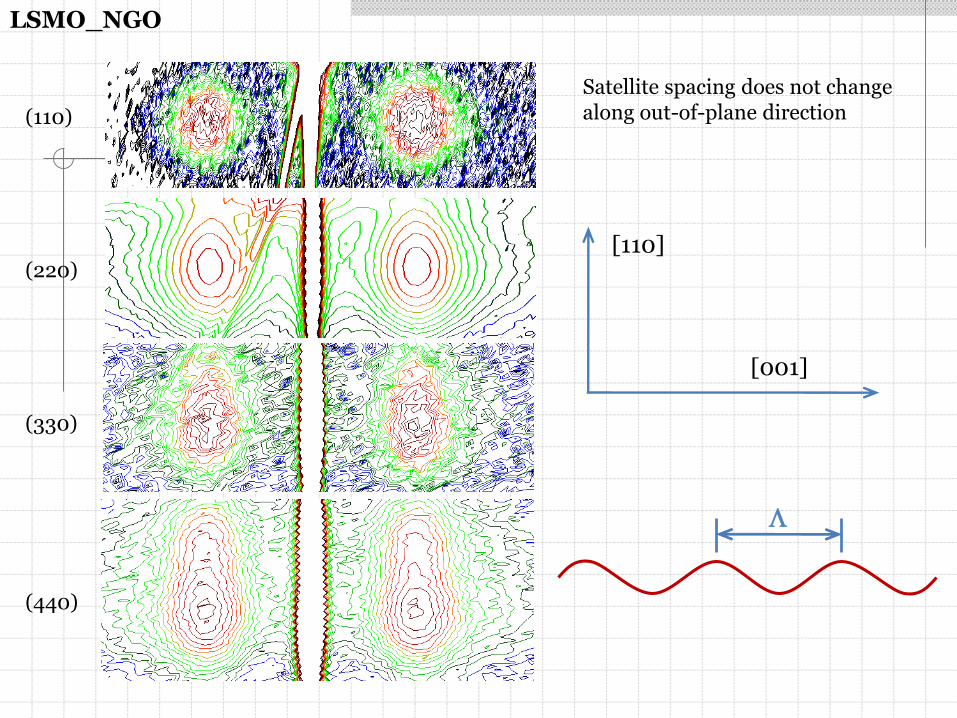
(110)
(220)
(330)
(440)
Satellite spacing does not change along out-of-plane direction
[001]
LSMO_NGO
[110]
L
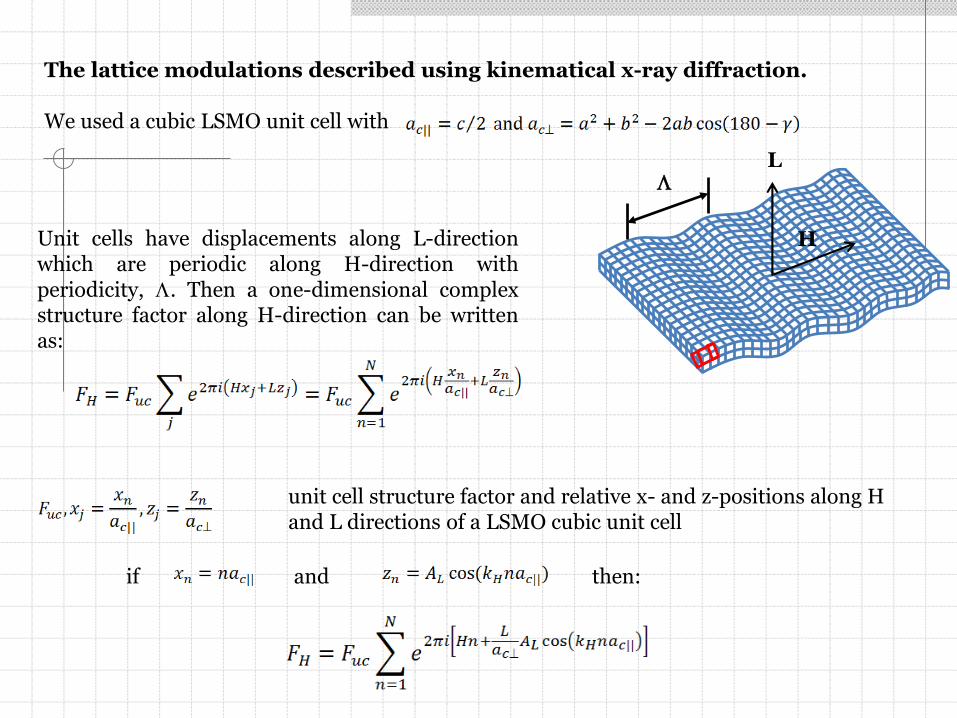
The lattice modulations described using kinematical x-ray diffraction.
We used a cubic LSMO unit cell with
LL
HUnit cells have displacements along L-directionwhich are periodic along H-direction withperiodicity, L. Then a one-dimensional complexstructure factor along H-direction can be writtenas:
unit cell structure factor and relative x- and z-positions along H and L directions of a LSMO cubic unit cell
if and then:
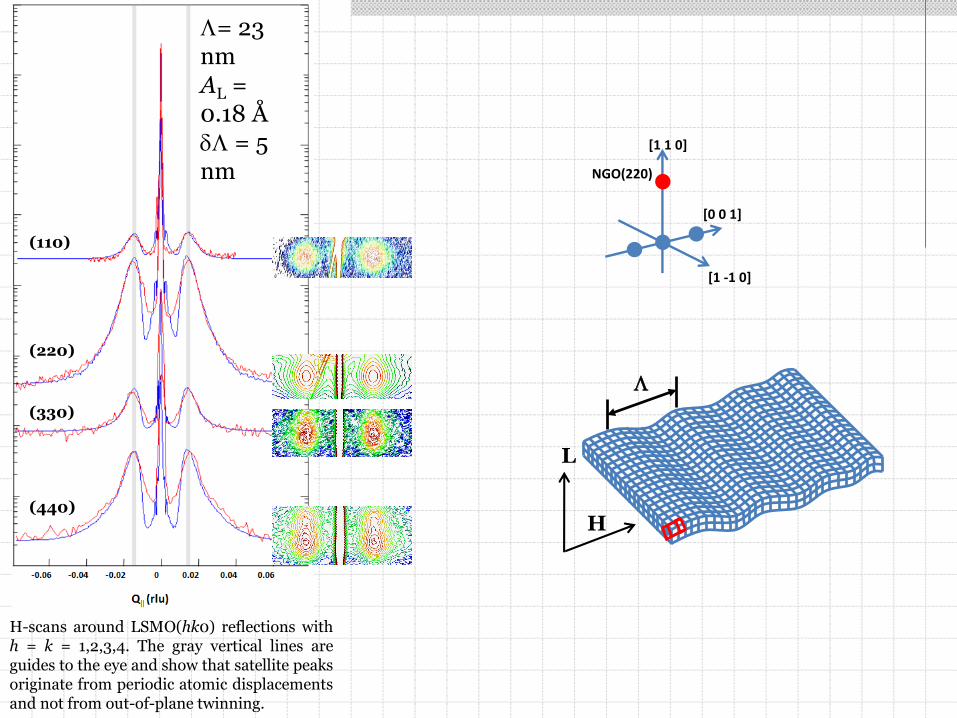
H-scans around LSMO(hk0) reflections withh = k = 1,2,3,4. The gray vertical lines areguides to the eye and show that satellite peaksoriginate from periodic atomic displacementsand not from out-of-plane twinning.
L
L
H
(110)
(220)
(330)
(440)
[0 0 1]
[1 -1 0]
[1 1 0]
NGO(220)
L= 23 nmAL = 0.18 ÅL = 5 nm
Reciprocal space for epitaxial thin films is very rich.
Shape and positions of reciprocal lattice points with respect to the substrate reveal information about:
• Mismatch• Strain state• Relaxation• Mosaicity• Composition• Thickness ….
Diffractometer instrumental resolution has to be understood before measurements are performed.
Fun in reciprocal space. © The New Yorker Collection, 1991. John O’Brien, fromwww.cartoonbank.com. All rights reserved.
Things can look very different in reciprocal space than in real space…