Embed Size (px)
Citation preview

High Temperature Zr Cladding Oxidation, Hydriding and
Embrittlement
Presented by Mikhail S. VESHCHUNOV
Nuclear Safety Institute (IBRAE)Russian Academy of Sciences
Workshop on Fuel Safety, Safety Criteria and Changes in Fuel Design Characteristics During Operation
Islamabad, Pakistan16‐20 December 2013
Nuclear Safety InstituteRussian Academy of Science

IAEA
Outline: Introduction: Mechanistic Code SFPR for Modelling
Single Fuel Rod Performance under Various Regimes ofLWR Operation, including Design‐Basis and SevereAccidents
High Temperature Zr Cladding Oxidation High Temperature Zr Cladding Hydriding High Temperature Zr Cladding Embrittlement Zr Cladding Embrittlement under LOCA Conditions SFPR Code: Development Plan
2

IAEA
Introduction:
Mechanistic Code SFPR for Modelling
Single Fuel Rod Performance under
Various Regimes of LWR Operation,
including Design‐Basis and Severe
Accidents
3

IAEA
4
SVECHA code• Mechanistic modeling thermo-
mechanical and physico-chemical behavior of a singleLWR fuel rod
• Initially designed for SAregimes, extended to normaloperation conditions
• Collaboration of IBRAE with IRSN (France), FZK (Germany) JRC/IE, US NRC.
MFPR code• Mechanistic modeling fission
product release fromirradiated UO2 fuel
• Various regimes of reactoroperation, including severeaccidents (SA), and highburnups
• Collaboration of IBRAE withIRSN (France).
SFPR codeSingle Fuel Rod ↔ Performance
4

IAEA
5
Single-Rod Code SVECHADevelopment and Assessment
Objectives advanced mechanistic models for oxidation, hydriding andchemical interactions of LWR fuel rod materials and thermo-mechanical deformations of cladding and pellet, tightly coupledwithin the code initially designed for modeling single-rod tests
Development IBRAE with support of FZK, IRSN and JRC/IE in the framework of European projects: 4th FP (COBE & CIT Projects), 5th FP (COLOSS); ISTC Projects #1648 & #2936, bi-lateral projects
Validation QUENCH Rig (FZK: COBE & CIT), BOX Rig (FZK: COLOSS), AEKIRod Degradation (COLOSS), QUENCH Bundle (FZK: ISTC),Phebus FPT0 and FPT1 interpretation (JRC/IE: SARNET)
Applications after verification and subsequent simplification, specific separate-effect models were implemented in integral codes: ICARE2 (collaboration IRSN), SCDAP/RELAP (collaboration US NRC), SOCRAT (collaboration ATOMENERGOPROECT and ROSATOM)

IAEA
6
Single Rod Code SVECHA
Coolant flow:H2O(l), H2O(g), O2, Ar, H2
Vertical Mesh
PelletGap
Zr Cladding
α-Zr(O)
ZrO2
Important features:• Mechanistic simulation of
clad multi-layered structure +core degradation (eutecticinteractions, molten poolformation, oxidation andrelocation, etc.)
• Initially designed for SA, thecode inherited themechanistic approach inapplication to normaloperation conditions

IAEA
High Temperature
Zr Cladding
Oxidation
7

IAEACladding Oxidation Kinetics
8ANL oxidation tests train assembly (from Yan et al., JNM, 2009)

IAEACladding Oxidation Kinetics
9
Oxidation of Zry‐4 alloy at temperatures of 700‐950C:a) 700 C; b) 800 C; c) 900 C; d) 950 C

IAEACladding Oxidation Kinetics
10
Oxidation of Zry‐4 alloy at temperatures of 1000‐1200C:a) 1000 C; b) 1050 C; c) 1100 C; d) 1200 C
Post‐transition

IAEACladding Oxidation Kinetics
11
Appearance of E110 alloy after steam oxidation for:a) 5s at 1000 C; b) 290s at 950 C; c) 400s at 1000 C
Post‐transition oxidation (break‐away effect)

IAEACladding Oxidation Kinetics
ntKG /1
Oxidation rate exponent of Zr alloys with temperature (Baek eta., KAERI, JNM 335 (2004) 443)
12

IAEACladding Oxidation Kinetics
Parabolic ZrO2 scale growth according to literature sources
2/1tKL oxox
13

IAEACladding Oxidation Kinetics
Comparison of mass gain rates
2/1tKG Tox
14
IAEACladding Oxidation Kinetics
Parabolic correlations
RTQAK exp2/1tKG Tox
15
IAEA
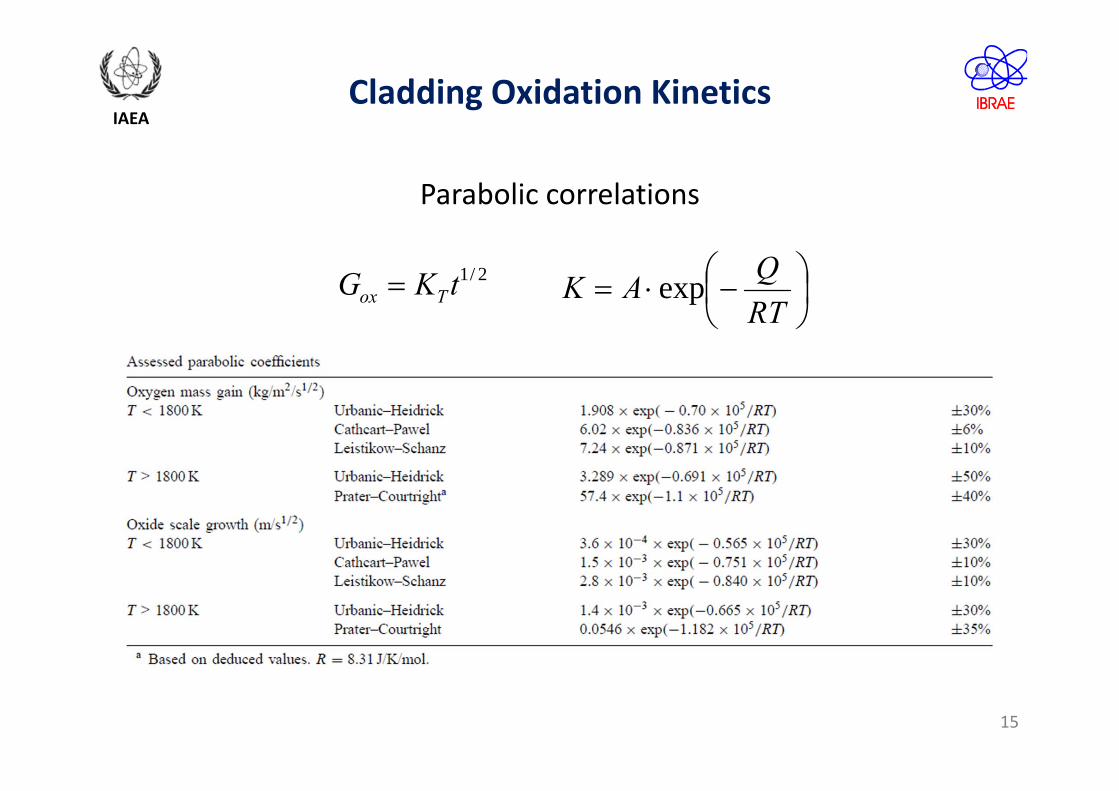
• Simulates kinetics of fuel cladding oxidation and physico‐chemical interactions with fuel pellet (UO2/Zr/steam)
• Based on numerical treatment of oxygen diffusion throughmulti‐layered structure of the interaction system up to 7layers
• Best‐estimate diffusion coefficients for ZrO2, ‐Zr(O) and ‐Zr for Zry‐4 and Zr1%Nb (E110)
• Tightly coupled with cladding thermo‐mechanical module
Cladding Oxidation Model
16

IAEACladding Oxidation Model
rctrrD
rrrctrv
tc
ii
ii
i),(1),(
)2(1
)2(1
)1()1(i11
)2(1
)1( )(
iiii
rri
rr
ii
iii vcvc
rcD
rcD
dtdrcc
ii
)2(11
)1(1)( iiii
iii vv
dtdr
Diffusion equation
Flux matches
17r r r
OXIDE ALPHA BETA
C
C/
C
C Cg
r
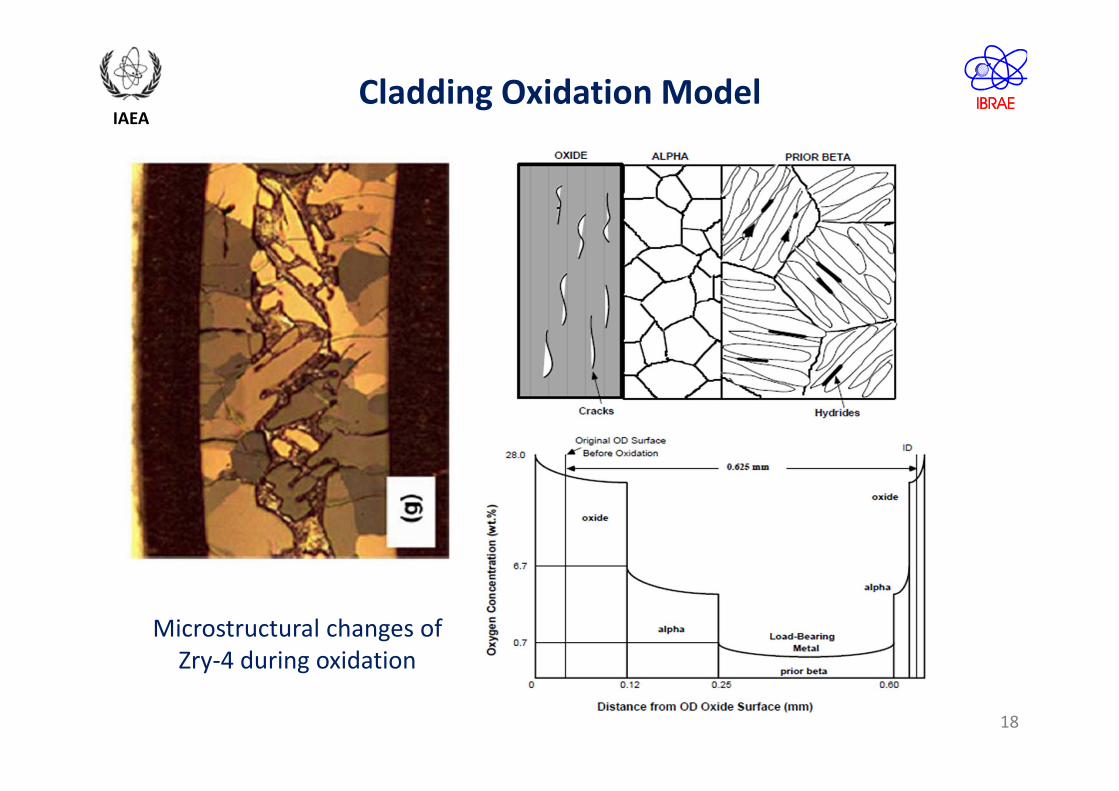
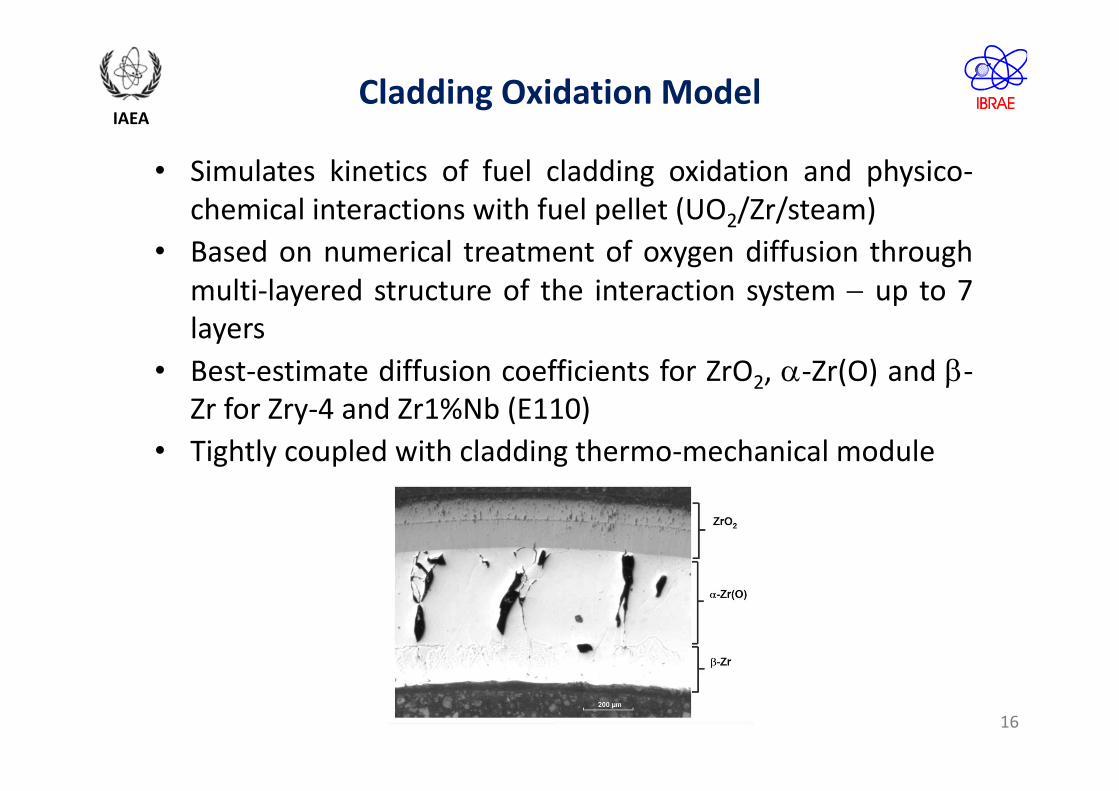
IAEACladding Oxidation Model
Microstructural changes of Zry‐4 during oxidation
18

IAEACladding Oxidation Model
Boundary conditions
Binary phase diagram Zr‐O, assessed in (Abriate et al., 1986)
19

IAEACladding Oxidation Model
Calculated oxygen diffusion coefficients in ZrO2 for Zr1%Nb и Zircaloy‐4
Oxygen diffusion coefficient in oxideT,C
104/T, [K-1]
Df,c
m2 /s
1500 1400 1300 1200 1100 1000
1e-6
1e-5
1e-4
5,4 5,8 6,2 6,6 7,0 7,4 7,8 8,2
- Zry-4 calc. from [6] - Zry-4 calc. from [7] by metallography - Zry-4 calc. from [7] by weight gain - Zr-1%Nb present work
20

IAEACladding Oxidation Model
Calculated oxygen diffusion coefficients in ‐Zr for Zr1%Nb и Zircaloy‐4
Oxygen diffusion coefficient in alpha phaseT,C
104/T, [K-1]
Da,c
m2 /s
1500 1400 1300 1200 1100 1000
1e-8
1e-7
1e-6
5,4 5,8 6,2 6,6 7,0 7,4 7,8 8,2
- Zry-4 calc. from [6] - Zry-4 calc. from [7] by metallography - Zry-4 calc. from [7] by weight gain - Zr-1%Nb present work
21
IAEA
1 10 100Time (min)
10
100
1000Zr
O2 t
hick
ness
(mm
)Temperature :
1273 K1373 K1473 K1573 K1673 K1773 K1823 K1873 K
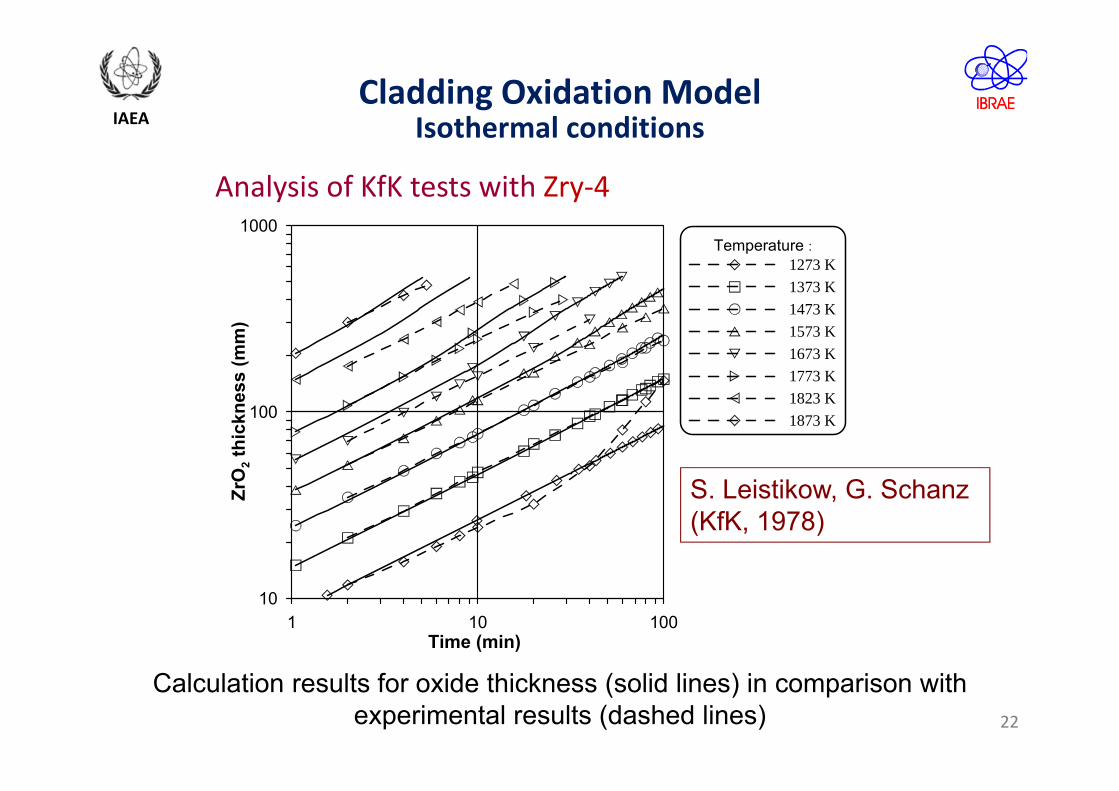
Calculation results for oxide thickness (solid lines) in comparison with experimental results (dashed lines)
S. Leistikow, G. Schanz (KfK, 1978)
22
Cladding Oxidation ModelIsothermal conditions
Analysis of KfK tests with Zry‐4

IAEA
23
0 500 1000 1500 2000 25000
20
40
60
80
100
120
140
1600 500 1000 1500 2000 2500
T=1000o C
- -Zr(O), calc.
- -Zr(O), exper.
- ZrO2, calc.
- ZrO2, exper.
Thic
knes
s of
laye
rs,
m
Time, s0 500 1000 1500 2000 2500 3000 3500 4000
0
20
40
60
80
100
120
140
160
180
200
220
240
0 500 1000 1500 2000 2500 3000 3500 4000
T=1100o C
- -Zr(O), calc.
- -Zr(O), exper.
- ZrO2, calc.
- ZrO2, exper.Thic
knes
s of
laye
rs,
mTime, s
Simulation of the ‐Zr and ZrO2 layers growth kinetics in the RIAR isothermal tests on Zr‐1%Nb cladding oxidation in steam at 1000 and 1100ºC
Analysis of RIAR tests with Zr‐1%Nb
Cladding Oxidation ModelIsothermal conditions
IAEA
24
0 500 1000 1500 2000 2500 3000 3500 40000
100
200
3000 500 1000 1500 2000 2500 3000 3500 4000
T=1200o C
- -Zr(O), calc.
- -Zr(O), exper.
- ZrO2, calc.
- ZrO2, exper.Thic
knes
s of
laye
rs,
m
Time, s0 500 1000 1500 2000 2500 3000 3500 4000
0
5
10
15
20
25
30
35
400 500 1000 1500 2000 2500 3000 3500 4000
0
5
10
15
20
25
30
35
40
T=1200o C
- Wt., calc.
- Wt., exper.
Wei
ght g
ain,
mg/
cm2
Time, s
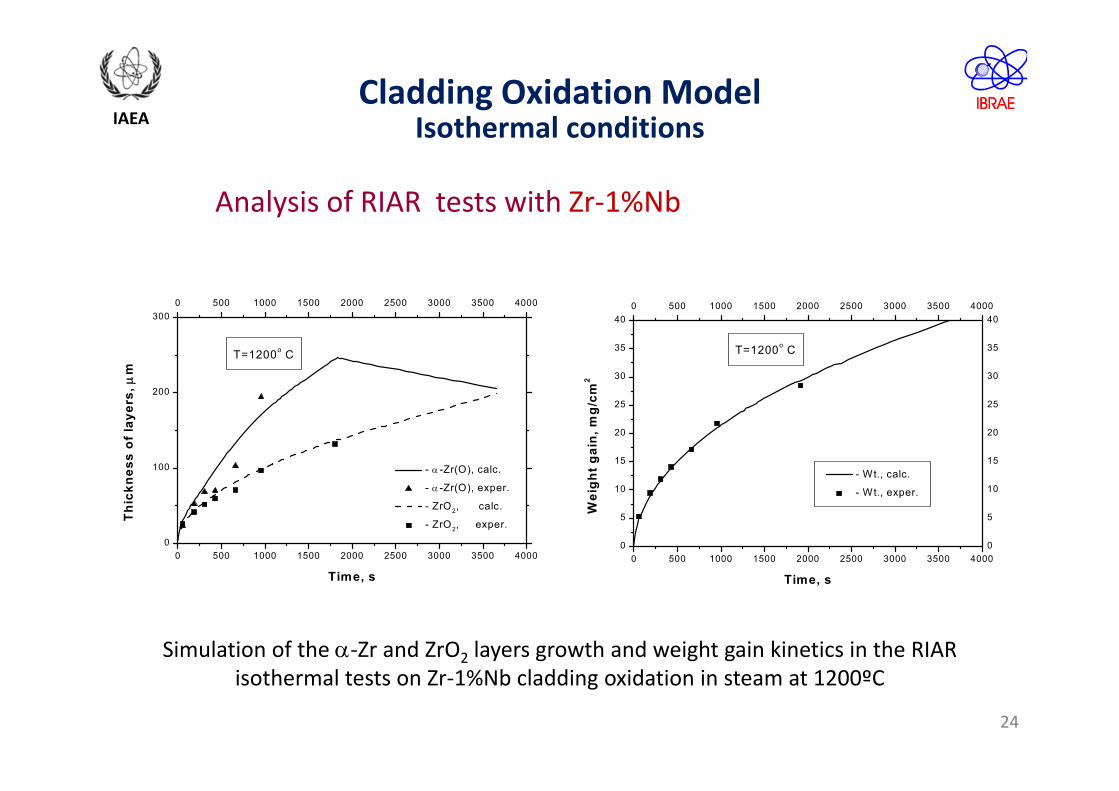
Simulation of the ‐Zr and ZrO2 layers growth and weight gain kinetics in the RIAR isothermal tests on Zr‐1%Nb cladding oxidation in steam at 1200ºC
Cladding Oxidation ModelIsothermal conditions
Analysis of RIAR tests with Zr‐1%Nb

IAEA
0,00E+00
5,00E-05
1,00E-04
1,50E-04
2,00E-04
2,50E-04
0 100 200 300 400 500
Time (s)
Oxi
de th
ickn
ess
(m)
modifiedstandardexp
0
500
1000
1500
2000
2500
0 100 200 300 400 500
Time, s
Tem
pera
ture
, K
1200 1400 1600 1800 2000 2200
Temperature, K
1
10
100
1000
Thic
knes
s, m
icro
met
er
Temp. rate
0.25 K/s
1 K/s
5 K/s
10 K/s
FZK tests (P. Hofmann)
Conclusion: being developed on the base of steady-state isothermal oxidationtests, the model demonstrates good agreement with transient tests data owing to:• mechanistic approach (diffusion equations, D(T(t)) );• coupling with Mechanical Deformation model (influence of oxide microcracking)
Validation of Oxidation Modelagainst transient oxidation tests
25
IAEAOxidation kinetics under steam
starved conditions
ZrO2
-Zr
-Zr
0 200 400 600 800 1000TIME
0
2E+019
4E+019
6E+019
8E+019
1E+020
OXY
GEN
FLU
X
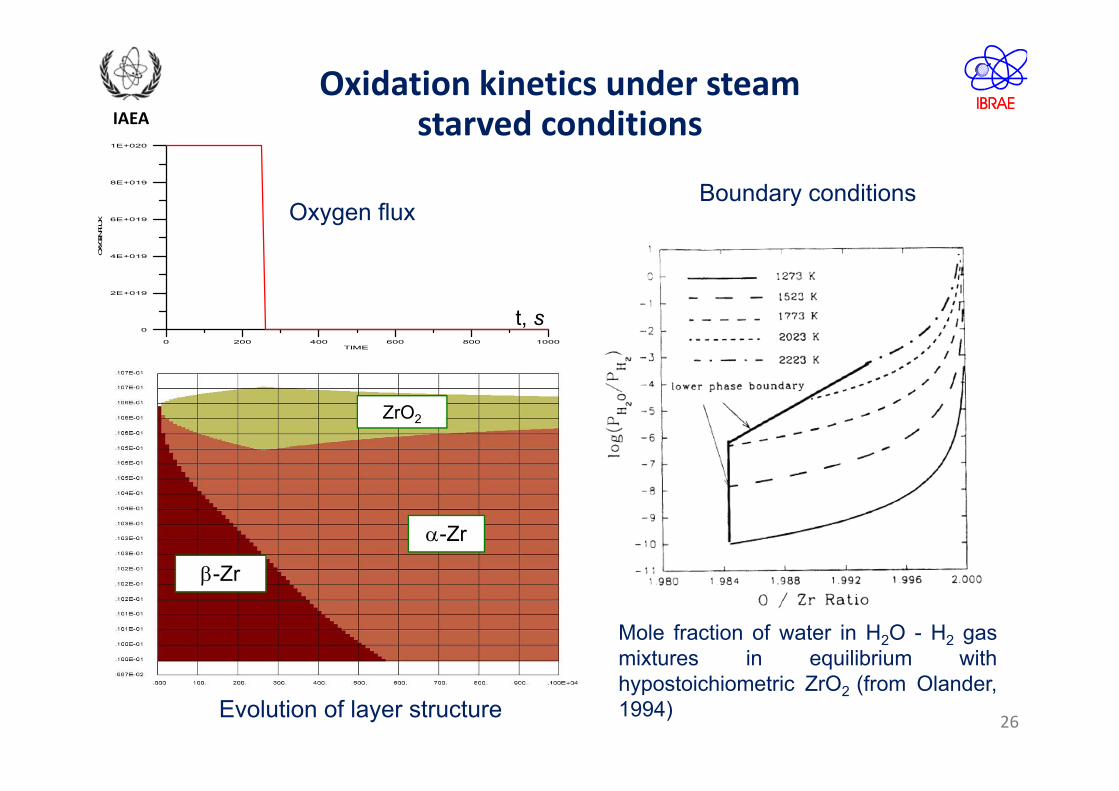
Evolution of layer structure
Oxygen flux
Mole fraction of water in H2O - H2 gasmixtures in equilibrium withhypostoichiometric ZrO2 (from Olander,1994)
t, s
Boundary conditions
26

IAEA
High Temperature
Zr Cladding
Hydriding
27

IAEA
Zr‐HEquilibrium Phase Diagram
28

IAEAHydrogen solubility in Zr
‐ Sieverts law
‐ Sieverts constant
29

IAEA
Hydrogen solubility in ZrExperimental studies
M. Steinbrueck (FZK, 2004)
30

IAEA
Gaseous Hydriding Model Zr‐H2 interaction kinetics
• Dissolution of hydrogen in Zr metal as neutral atoms:
H2(g) = 2Hab(m)
• Sieverts law:
Zr
H2
sPKsC HSH2/1
2
• Hydrogen transport:
tot
Htot
S
HH
HHH
PsPP
rCD
sPbPk
2
2222
• Thin Zr layer: exp2 tDL HD
2
2
2
2
2 S
HH
HH
KCbP
RTk
dtdCL
Zr (metal) H2 (gas)
t = 0
PH2(b)
PH2(s)
PH2
r
31

IAEA
FZK tests on hydrogen uptake by Zry-4 cladding in H2 atmosphere (M. Steinbrueck, 2004)
Model Verification
0 5000 10000 15000 20000 25000 300000
5
10
15
20
25
- exper.
- calcul.
Mas
s ga
in, m
g
Time, s
0 5000 10000 15000 20000 25000 30000
0
200
400
600
800
1000
1200
1400
H2 o
ffH
2 on
Temp
Tem
pera
ture
, o C
0 5000 10000 15000 20000 25000 300000
5
10
15
20
25
0.6 bar
Temp.
- exp.
- calc.
Mas
s ga
in, m
g
T ime, s
0 5000 10000 15000 20000 25000 30000
0
200
400
600
800
1000
1200
1400
0.2 bar
0.6 bar
0.2 bar
Tem
pera
ture
, o C
PH2 = 0/0.5 bar PH2 = 0.2/0.6 bar
ttbPKtC
HSH 2exp12exp12/1
2
t
CtC H
H1
0,
1
Uptake: Release:
32

IAEA
33
Hydrogen solubility in ZrO2Experimental studies
Park and Olander, 1991: gaseous H2 hydriding of ZrO2
Conditions: T=1300-1600C, PH2 10 bar Interpretation: H2(g) = 2H(ox) [H] PH2
1/2
Sieverts law (in agreement with observations)Results: H solubility: [H] 10-5,
H mobility: 0 (strong trapping)Conclusion: ZrO2 is impermeable for neutral H
Wagner, 1968: H2O dissolution in Yt-stabilized ZrO2
Conditions: T=900, 1000C, PH2O 10-2 bar Interpretation: H2O(g)+VO
2+= 2Hi+(ox) + O(ox)
[Hi+] PH2O
1/2; (in agreement with observations)Results: H solubility: [Hi
+]10-5, (PH2 10-8 PH2(Park & Olander) !)H mobility: DH
+10-6 cm2/s.Conclusion: ZrO2 is permeable for protons H+
ZrO2
H2
ZrO2
H2O
Fundamentally different dissolution mechanisms (neutral H / protons H+)

IAEA
34
Hydrogen uptake model (1/2)
• Dissociation of water molecules in the gas phase:2H2O(g) = O2(g) + 2H2(g) (1)
• Dissolution of oxygen in oxide:O2(g) + 2VO
2+ + 4e-(ox/g) = 2OO(ox) (2) • Dissolution of hydrogen in oxide as neutral atoms:
H2(g) = 2Hab(ox) (3)• Dissolution of hydrogen in oxide as protons:
H2(g) = 2Hab+(ox) + 2e-(ox/g) (4)
Eq. (3) corresponds to Park & Olander’s mechanism:• gaseous H2 hydriding of ZrO2 : H2(g) = 2Hab(ox)
Superposition of (1), (2) and (4) corresponds to Wagner’s mechanism:• dissolution of water molecules in oxide: H2O(g) + VO
+2+ = 2Had+ + OO(ox)
Wagner’s mechanism of water molecules dissolution in ZrO2 might be responsible for high hydrogen uptake during Zr oxidation in steam
O2(s)
H2O(g)
ZrO2 gas
H2(s)
O2-(ox)
H+
H2(g)H
e-
VO2+

IAEA
35
In steam atmosphere hydrogen is dissolved (and transported) in ZrO2 mainlyin the form of protons (with high mobility)
PH2 /PH2O
CH+
CH
C
Hydrogen uptake model (2/2)
Mass action laws
PH2O(s)2 = k PH2(s)2PO2(s)PO2(s)Cv
2 Ce4 =
γPH2(s) =CH+2Ce
2
CH = KS PH2(s)1/2
Charge neutrality condition
2Cv + CH+ = Ce
Solution
2(k1/2β1/2/γ)CH+3/PH2O(s) + CH+
2 – γ1/2 PH2(s)1/2 =0
if PH2 << PH2O CH+ PH2(s)1/4 >> CH PH2(s)1/2
IAEA
36
Hydrogen transfer in oxide phase
CH (s)CH (b)
CH+(b)CH+(s)
CH ()
CH ()
-Zr ZrO2-Zr
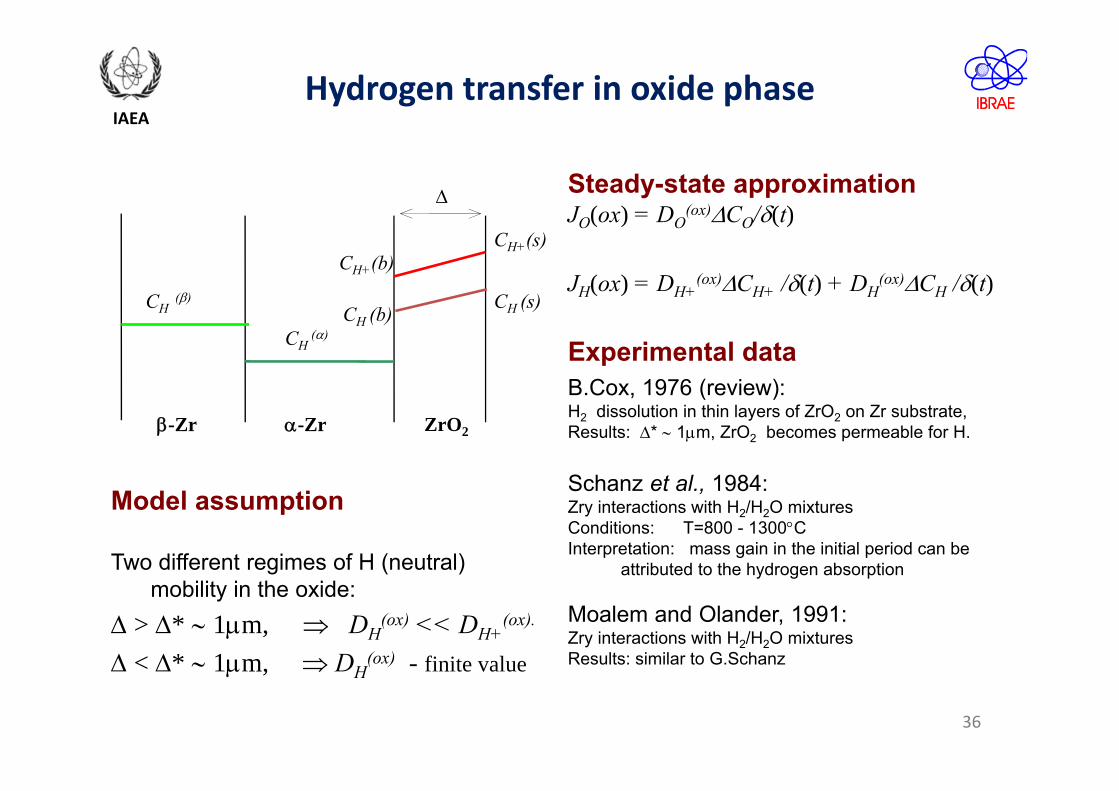
Steady-state approximationJO(ox) = DO
(ox)CO/(t)
JH(ox) = DH+(ox)CH+ /(t) + DH
(ox)CH /(t)
Experimental dataB.Cox, 1976 (review):H2 dissolution in thin layers of ZrO2 on Zr substrate,Results: * 1m, ZrO2 becomes permeable for H.
Schanz et al., 1984:Zry interactions with H2/H2O mixturesConditions: T=800 - 1300CInterpretation: mass gain in the initial period can be
attributed to the hydrogen absorption
Moalem and Olander, 1991:Zry interactions with H2/H2O mixturesResults: similar to G.Schanz
Model assumption
Two different regimes of H (neutral) mobility in the oxide:
> * 1m, DH(ox) << DH+
(ox).
< * 1m, DH(ox) - finite value

IAEA
KIT Tests on Hydrogen Uptakeby Neutron Radography (M. Grosse et al.)
Scheme of INRRO furnace

IAEA
KIT Tests on Hydrogen Uptakeby Neutron Radography (M. Grosse et al.)

IAEA
39
KIT tests on hydrogen uptake by Zry-4 cladding during isothermal oxidation in steam (50 l/h Ar + 50 g/h H2O )
Tests simulations
0 0.5 1 1.5 2Time (h)
0
2
4
6
8
H2 C
once
ntra
tion
(vol
. %)
ExperimentCalculation
0 4000 8000 12000 16000 20000Time (s)
0
1
2
3
H/Z
r ato
mic
ratio
(%)
ExperimentAxial position 1Axial position 2Axial position 3
0 4000 8000 12000 16000Time (s)
0
1
2
3
4
5
H/Z
r ato
mic
ratio
(%)
ExperimentAxial position 1Axial position 2Axial position 3
0 2000 4000 6000 8000Time (s)
0
2
4
6
8
H/Z
r ato
mic
ratio
(%)
ExperimentAxial position 1Axial position 2Axial position 3
T=1373 K
T=1473 K
T=1373 K
T=1673 K

IAEA KIT tests on hydrogen uptake by Zry-4 cladding during isothermal oxidation in steam (30 l/h Ar + 30 g/h H2O at 1473 K)
Tests simulations
0 2000 4000 6000 8000 10000Time (s)
0
2
4
6
8H
/Zr a
tom
ic ra
tio (%
)Experimentbottommiddletop

IAEA
41
.
Hydrogen Uptake under normal operation conditions
2/18/316/9 tttM H
Coupling of 2 models:
• Hydrogen absorption mechanism;
• Mass transfer through 2-phase zone (hydrides in metal Zr)
Predictions:
• Non-uniform distribution of hydrides (owing to oxygen concentration profile);
• Close to parabolic hydriding kinetics:
Metallographic cut of the rod cladding

IAEA
High Temperature
Zr Cladding
Embrittlement
42

IAEA
Cladding EmbrittlementCriteria
Criterion 17%‐ECR (and T<1204C)
43

IAEA
Cladding EmbrittlementCriteria
Criterion 17%‐ECR (and T<1204C)
44
Chung and Kassner(ANL, 1980)

IAEA
45
Chung-Kassner advanced criterion• Capability to withstand the different loading modes depends on
thickness of and oxygen distribution in -Zr layer:
1. Capability to withstand thermalshock during LOCA reflooding:calculated thickness of thecladding with 0.9 wt % oxygenshould be greater than 0.1 mm.
2. Capability to withstand fuelhandling, transport and storage:calculated thickness of thecladding with 0.7 wt % oxygenshould be greater than 0.3 mm. 4.6 4.7 4.8 4.9 5.0 5.1 5.2
Radial direction, mm
0.3
0.5
0.7
0.9
1.1
1.3
1.5
1.7
Oxygen, wt.%
100 mcm,1400C130 mcm,1400C
135 mcm,1400C
200 mcm,1400C
100 mcm,1600C
Cladding EmbrittlementCriteria
Low hydrogen content < 700 w. p.p.m. !!

IAEA
46
In the case of solid contact between pellet and cladding, Zry reduces UO2 toform oxygen stabilized -Zr(O) (internal) and (U,Zr)-alloy.
The external cladding interaction with oxygen or steam results in the formation of-Zr(O) (external) and ZrO2.
The internal and external -Zr(O) layers of the cladding grow with the samerates. Initially the reaction-layer growth obeys a parabolic rate law. After thedisappearance of -phase, the cladding tube is completely embrittled and nomore mechanically stable.
Double‐side oxidation (interactions with UO2 pellet)

IAEA
0 5 10 15 20 25 30 35 40 45 50Время, с0.5
0
250
500
750
1000
Расстоя
ние от
UO
2, мкм
ZrO2
(U,Zr)O2(U,Zr)O(U,Zr)
-Zr-Zr
расчет
экспериментExper.
Calc.
Time, s1/2
T=1700 K
47
Diffusion Model for Double‐Side Oxidation

IAEA
48
Cladding Embrittlementdue to “Fuel Bonding”
• Formation of Zr(O) layer at the inner surface of the cladding as a result ofUO2/Zr chemical interaction (“bonding”) can lead to cladding embrittlementeven in the absence of oxidation atmosphere at the outer cladding surface.
3.8 4 4.2 4.4 4.6Distance, mm
0
10
20
30O
xyge
n co
nten
t, w
t %1400°C
outer oxidationUO2/Zr interaction
Maximum extent of oxidation and fuel‐pellet interaction to remain intact under thermal shock.

IAEA
Effect of hydrogen uptake
Cladding EmbrittlementCriteria
49
700 w.p.p.m.

IAEA
Combined effect of oxygen and hydrogen uptake
Cladding EmbrittlementCriteria
50

IAEA
Zr Cladding
Embrittlement
under LOCA Conditions
51

IAEA
52
Observations in KIT Tests (Stuckert et al., 2012)
Temperature escalation at different elevations and appearance of ballooned zones

IAEA
53
External and internal cladding oxidation
Ballooning zone
Non-deformed zone
Observations in KIT Tests (Stuckert et al., 2012)

IAEA
54
Secondary hydriding of cladding
Increased microhardness at positions ofhydrogen rich bands
Observations in KIT Tests (Stuckert et al., 2012)

IAEA
55
Observations in ANL Tests (M. Billone et al., 2008)
Temperature and pressure histories
Post-test appearance

IAEA
56
Observations in ANL Tests (M. Billone et al., 2008)
Axial distribution of oxygen and hydrogen content for:
OCL#22 sample held at 1204ºC for 1 s (left) ;
OCL#17 sample held at 1204ºC for 120 s (right) .

IAEA
57
Observations in JAERI Tests (Uetsuka et al., 1981)

IAEA
58
Modification of Gas Kinetics Module
k = N
k = 0
k= 1
)( kiI
)( kiJ
Ar
H2O, H2
Processes:o Oxidation of clad outer surface
and transport of gas mixture (H2O-H2-Ar) in channel
o Oxidation/hydriding of clad inner surface and transport of gas mixture in gap
o Flux matching at breach position
H2O, H2
H2O, H2
H2O
H2
Ar
H2O

IAEA
59
Modification of Gas Kinetics Module
tzQunzz
nDtn
iii
ii ,2
2
Transport in gap:
Oxidation (i = 1); hydriding (i = 2)
)(
0
000 extiiiii
x
iii nnnu
dxdnDQ
tzqtzQ OHOH ,,22
- H2O sink (calculated by oxidation kinetics module with consideration of steam starvation)
tzu ,
tzni , - concentrations of gas components (1 = H2O, 2 = H2, 3 = Ar, 4 =…)
,i
inn ,tkTtntP
,,,,222
tzqtzqtzQ HOHH - H2 sink (calculated by hydriding kinetics module)
- gas net velocity, induced by: 1) pressure drop between inner and outer after breaching ( 38s);2) gas thermal expansion (during temperature escalation);3) gas advection due to H2 uptake by cladding (Stefan flow)
- flux matching at breach position
,),(
),(1
,
ki ik
ik TPD
xTPD1
i i
i
i
ii
nnx
,dVSDK
cl
dii 50K - best fit
tzqH ,2
where
Veshchunov & Shestak, Proceedings QW 18&19, KIT (2012&2013)

IAEA
60
Simulation of QL0 Test (1/6)Temperature distribution
Temperature evolution at the burst position
Cladding temperature axial distribution at the calculation time
moments 40 s, 60 s and 80 s
0 20 40 60 80600
800
1000
1200
1400
LowerMiddleUpper
Pressure equilibration

IAEA
61
Simulation of QL0 Test (2/6)Burst geometry
Axial distribution of rod dimensions at bundle elevations from 1150 to 850 mm
0 50 100 150 200 250 3000.004
0.005
0.006
0.007
0.008PelletInner Clad.Outer Clad.

IAEA
62
Simulation of QL0 Test (3/6)Gas partial pressures in gap
Gap gas components partial pressures axial distribution at the time moments 40 s, 60 s and 75 s
Axial coordinate (mm)
0
4
4
4
4
4

IAEA
63
Simulation of QL0 Test (4/6)Internal oxidation
Specimen inner surface oxidation layers thicknesses axial distribution at the time moments 40 s, 60 s and 75 s
Axial coordinate (mm)
2
2
2
IAEA
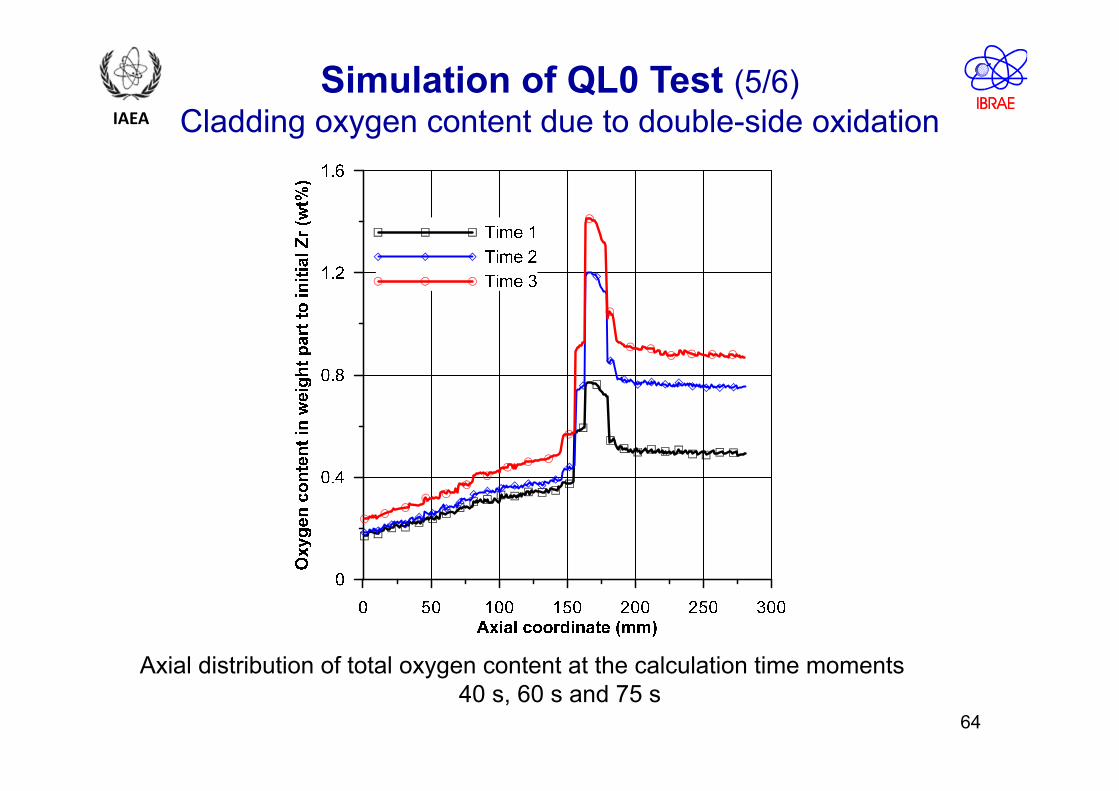
64
Simulation of QL0 Test (5/6)Cladding oxygen content due to double-side oxidation
Axial distribution of total oxygen content at the calculation time moments 40 s, 60 s and 75 s

IAEA
Simulation of QL0 Test (6/6)Cladding hydriding
Axial distribution of cladding total hydrogen content at time
40 s, 60 s and 75 s.
Exp. Rod #1 #7 #3 #14
Oxidation period
~ 74 s ~ 71 s ~ 64 s ~ 32 s
Hydrogen (w.p.p.m.)
2560 2140 1940 1050

IAEA
66
Simulation of ANL Test OCL #17(1/7)Temperature distribution
Temperature evolution at the burst position
Cladding temperature axial distribution at the calculation time
moments 60 s, 80 s and 200 s
0 100 200 300Time, s
1000
1200
1400
1600
LowerMiddleUpper

IAEA
67
Simulation of ANL Test OCL #17(2/7)Burst geometry
Axial distribution of rod dimensions
Axial coordinate (mm)

IAEA
68
Simulation of ANL Test OCL #17(3/7)Gas partial pressures in gap
Gap gas components partial pressures axial distribution at the time moments 60 s, 80 s and 200 s

IAEA
69
Simulation of ANL Test OCL #17(4/7)Internal oxidation
Specimen inner surface oxidation layers thicknesses axial distribution at the time moments 60 s, 80 s and 200 s
-150 -100 -50 0 50 100 150Axial coordinate (mm)
0
40
80
120
160
200
ZrO2, Time1ZrO2, Time2ZrO2, Time3Zr(O), Time1Zr(O), Time2Zr(O), Time3

IAEA
70
Simulation of ANL Test OCL #17(5/7)External oxidation
Axial distribution of gap gas partial pressures (left) and of outer surface oxidation layers thicknesses (right)
at the time moments 60 s, 80 s and 200 s

IAEA
71
Simulation of ANL Test OCL #17(6/7)Cladding oxygen content due to double-side oxidation
Axial distribution of total oxygen content at the calculation time moments 60 s, 80 s and 260 s
-150 -50 50 150Axial coordinate from the burst position (mm)
0
1
2
3
4
5
6
Calc. 60sCalc. 80sCalc. 260sExp. Hold 120s

IAEA
Simulation of ANL Test OCL #17(7/7)Cladding hydriding
Axial distribution of cladding total hydrogen content at times 60 s, 80 s and 100 s in comparison with experimental measurements 72

IAEA
The first version of the fuel performance code SFPR, designed bycoupling of MFPR with the mechanistic thermo-mechanicalmodule SVECHA, was released and tested in 2008
Validation (by IBRAE) and commercial applications to operationconditions of the new VVER-2006 reactor design (byATOMENERGOPROECT) started in 2009
Implementation of SFPR module in the advanced version of theRussian integral best-estimate safety code SOCRAT (for LWRs),started in 2010 (Russian collaboration under IBRAE coordination)
Extension to the Fast Reactor (FR) fuel and implementation in thenew generation integral code EUCLID (developed under IBRAEcoordination) for FR design and safety justification, within the newRussian Federal Target Program “Nuclear Power Technologiesof a New Generation for the years 2010-2015 with a perspectiveto 2020”
SFPR Code: Development Plan
73