Embed Size (px)
Citation preview

Higher Values in Higher Education: A Plan for Western Illinois University
Our Vision Western Illinois University will be the leading comprehensive university in the United States. Our Mission Western Illinois University, a community of individuals dedicated to learning, will have a profound and positive impact on our changing world through the unique interaction of instruction, research, and public service as we educate and prepare a diverse student population to thrive in and contribute to our global society. Our Values Academic Excellence Central to our history and tradition is the commitment to teaching, to the individual learner, and to active involvement in the teaching-learning process. Western Illinois University’s highly qualified, diverse faculty promotes critical thinking, engaged learning, research and creativity in a challenging, supportive learning community. We are committed to an academic environment that encourages lifelong development as learners, scholars, teachers, and mentors. Educational Opportunity Western Illinois University values educational opportunity and welcomes those who show promise and a willingness to work toward achieving shared educational goals. We are committed to providing accessibly, high-quality educational programs and financial support for our students. Personal Growth Because Western Illinois University values the development of the whole person, we are committed to providing opportunities for personal growth in an environment that supports the development of wellness, ethical decision making and personal responsibility. Social Responsibility Western Illinois University is committed to equity, social justice, and diversity, and will maintain the highest standards of integrity in our work with others. We will serve as a resource for and stimulus to economic, educational, cultural, environmental, and community development in our region and well beyond it. For more information on the Western Illinois University Strategic Plan, please visit http://www.wiu.edu/StrategicPlan/

WESTERN ILLINOIS UNIVERSITYACCREDITATION
UNIVERSITY
ACCREDITATION
North Central Association
National Council for
Accreditation of Teacher
Education
ATHLETICS
ACCREDITATION
NCAA-Division I
PROGRAM
ACCREDITATION
Business & Technology
Accountancy
Business Adm.
Economics
Finance
Human Resource M gt.
Information Management
Management
Marketing
Supply Chain Management
Education & Human Services
Counseling (M.S.Ed .)
Family & Consumer Sciences
(Dietetics Option)
Kinesiology
(Athletic Training Option)
Recreation, Park & Tourism
Administration
Social Work
Fine Arts & Communication
Communication Sciences &
Disorders (M.S.)
( Speech-Language Option)
Music
Western’s English as a Second
Language Institute
ACCREDITING BODY
AACSB International--The
Association to Advance
Collegiate Schools of Business
Council for Accreditation of
Counseling & Related Ed. Prog.
American Dietetic Association
Commission on Accreditation of
Athletic Training Education
National Recreation & Park
Association-American Assoc.
for Leisure & Recreation
Council on Social Work Ed.
American Speech-Language-
Hearing Association
National Association of Schools
of Music
Commission on English Language
Program Accreditation
NEXT DATE OF
ACCREDITATION
2010-11
2009
2014-15
2009-10
2008
2016
2007-08
2008
2008
2009
2005
2006

UNDERGRADUATE PROGRAMS AND DEGREES AVAILABLE AT MACOMB CAMPUS
Bachelor of Bachelor ofB.S. B.A. B.B. B.S.Ed. B.F.A. Social Work Music
COLLEGE OF ARTS AND SCIENCES African American Studies X Biology X Chemistry X Clinical Laboratory Science X Economics X English X Forensic Chemistry X French X Geography X Geology X History X Journalism X Mathematics X Meteorology X Philosophy X Physics X Political Science X Psychology X Sociology X Spanish X Women's Studies X
COLLEGE OF BUSINESS AND TECHNOLOGY Accountancy X Agriculture X Computer Science X Construction Management X Economics X Finance X Graphic Communication X Human Resource Management X Information Management X Management X Manufacturing Engineering Technology X Marketing X Supply Chain Management X Telecommunications Management X
COLLEGE OF EDUCATION AND HUMAN SERVICES Bilingual/Bicultural Education X Community Health X Elementary Education X Emergency Management X Family and Consumer Sciences X Health Services Management X Instructional Design & Technology X Kinesiology X Law Enforcement and Justice Administration X Recreation, Park, and Tourism Administration X Social Work X Special Education X

UNDERGRADUATE PROGRAMS AND DEGREES AVAILABLE AT MACOMB CAMPUS
Bachelor of Bachelor ofB.S. B.A. B.B. B.S.Ed. B.F.A. Social Work Music
COLLEGE OF FINE ARTS AND COMMUNICATION Art X X Broadcasting X Communication X Communication Sciences and Disorders X Music X X Musical Theatre X Theatre X
OTHER Board of Trustees Degree Program X Interdisciplinary Studies X X
TOTAL DEGREES OFFERED BY DEGREE 25 18 9 3 2 1 1
POSTBACCALAUREATE CERTIFICATE PROGRAMS AVAILABLE AT MACOMB CAMPUS
COLLEGE OF ARTS AND SCIENCES African & African Diaspora World Studies Applied Mathematics* Community Development* Public & Non-Profit Management Women's Studies Zoo and Aquarium Studies
COLLEGE OF EDUCATION AND HUMAN SERVICES Health Services Administration
Instructional Design & Technology Distance Learning Graphics Application Multimedia Technology Integration in Education Training Development
Police Executive Administration*
Public and Nonprofit Management
*An 18-credit hour program as defined by Illinois Board of Higher Education

GRADUATE PROGRAMS AND DEGREES AVAILABLE AT MACOMB CAMPUS
Master of Master of M.S. M.A. Ed.S. M.S.Ed. S.S.P. M.F.A. M.B.A. Accountancy M.A.T. Music Ed.D
COLLEGE OF ARTS AND SCIENCES Biology X Chemistry X English X Geography X Gerontology (Enrollment suspended FY06-08) X History X Mathematics X Physics X Political Science X Psychology X School Psychology X Sociology X
COLLEGE OF BUSINESS AND TECHNOLOGY Accountancy X Business Administration X Computer Science X Economics X Manufacturing Engineering Systems X
COLLEGE OF EDUCATION AND HUMAN SERVICES College Student Personnel X Educational Leadership X X X Educational and Interdisciplinary Studies X Elementary Education X Health Education X Instructional Design & Technology X Kinesiology X Law Enforcement and Justice Administration X Reading X Recreation, Park, and Tourism Administration X Secondary Education X Sport Management X
COLLEGE OF FINE ARTS AND COMMUNICATION Communication X Communication Sciences and Disorders X Music X Theatre X
TOTAL DEGREES OFFERED BY DEGREE 13 10 1 5 1 1 1 1 1 1 1

WIU-QC UNDERGRADUATE PROGRAMS AND DEGREES AVAILABLE
B.S. B.A. B.B. B.S.Ed.
COLLEGE OF BUSINESS AND TECHNOLOGY Accountancy X Information Management X Management X Manufacturing Engineering Technology X Marketing X
COLLEGE OF EDUCATION AND HUMAN SERVICES Elementary Education X Law Enforcement and Justice Administration X Recreation, Park and Tourism Administration X
OTHER Board of Trustees Degree Program X
TOTAL DEGREES OFFERED BY DEGREE 3 1 4 1
WIU-QC GRADUATE PROGRAMS AND DEGREES AVAILABLE
Master ofM.S. M.A. Ed.S. M.S.Ed. M.B.A. M.A.T. Accountancy Ed.D
COLLEGE OF ARTS AND SCIENCES Biology X English X
COLLEGE OF BUSINESS AND TECHNOLOGY Accountancy X Business Administration X
COLLEGE OF EDUCATION AND HUMAN SERVICES Counseling X Educational and Interdisciplinary Studies X Educational Leadership X X X Elementary Education X Health Education X Instructional Design and Technology X Kinesiology X Law Enforcement and Justice Administration X Reading X Secondary Education X Special Education X Sport Management X
TOTAL DEGREES OFFERED BY DEGREE 5 2 1 6 1 1 1 1
POST-BACCALAUREATE CERTIFICATE PROGRAMS AVAILABLE AT QUAD CITIES CAMPUS
COLLEGE OF ARTS AND SCIENCES Zoo and Aquarium Studies
COLLEGE OF EDUCATION AND HUMAN SERVICES
Health Services Administration
Instructional Design and Technology Distance Learning Graphics Application Multimedia Technology Integration in Education Training Development
Police Executive Administration**An 18-credit hour program as defined by Illinois Board of Higher Education

DEFINITIONS OF TERMS USED
ENROLLMENTS
Border County Students are students who reside in the Iowa counties of Clinton, DesMoines, Dubuque, Lee, Louisa, Jackson, Muscatine, or Scott or the Missouri counties ofClark, Lewis, Lincoln, Marion, Pike or Ralls.
Headcount students is used to refer to the count of individual students enrolled for one ormore credit courses during the time period illustrated. This count is taken on the tenth dayof class.
Fiscal Year Enrollments include the summer and fall semesters of one year and thespring semester of the following year (FY2005 includes Summer and Fall 2004 semestersand Spring 2005 semester).
Full-Time students are undergraduates enrolled for 12 or more credit hours per semesterand graduate students enrolled for 9 or more credit hours per semester. This definition isa classification of individual students and is based on federal guidelines.
FTE students is an abbreviation for full-time equivalent students. To calculate full-timeequivalent students, undergraduate credits are divided by 15, and graduate credits aredivided by 12.
SCH is an abbreviation for student credit hour. A student will typically earn three hours ina course scheduled for three hours a week.
FACULTY
Faculty Staff Year is derived by taking the number of months an employee is employedtimes percent appointment and dividing by 12. (9 months x 100 percent = 9, 9/12 = .75staff year)
Full-Time Employee is an employee who has a 100-percent appointment.
Income Fund - Income generated from tuition and fees.
Part-Time Employee is an employee who has less than a 100-percent appointment.

2006 ENROLLMENT HIGHLIGHTS
Macomb campus headcount enrollment increased from 11,277 in 2005 to 11,368in 2006, up 0.8 percent (Table 1). Total enrollment increased from 13,404 in 2005 to13,602 in 2006 (up 1.5 percent). Table 2 gives the distribution of students by class level,full-/part-time and location. Full-time enrollment increased from 11,083 in Fall 2005 to11,168 in Fall 2006. Table 3 gives the distribution of students by sex and location ofenrollment for Fall Terms 2002-2006. Figures 1a and 1b show enrollment by location forFall 2002, 2004 and 2006. Enrollment by location and student residency are shown inTable 4. Figure 2 shows total headcount by class level for Fall 1996 and 2006.
Figure 3 shows Fall 2006 WIU extension course registrations by county.
Fall headcount enrollments for all Illinois public universities increased 3.1 percentfrom 2001 to 2006 (Table 5). From 2005 to 2006 the overall enrollment for Illinois publicuniversities increased 0.1 percent. Western’s headcount enrollment increased 3.0 percentfrom 2001 to 2006. From 2005 to 2006 the overall enrollment for Western increased 1.5percent.
Table 6 gives the distribution of students by class level, race and sex. Malescomprised 50.6 percent of the Fall 2006 total headcount enrollment while femalesaccounted for 49.4 percent. However, the Macomb campus male/female breakdown is53.4 percent males and 46.6 percent females (Table 3).
The percent of total minority enrollment (Table 7A) was 12.2 percent in Fall 2006.Asian-American enrollment increased 1.2 percent, while Hispanic enrollment increasedby 3.7 percent. Black enrollment increased less than 6.3 percent, while Native Americanenrollment increased by 1.2 percent. International student enrollment increased by 2.7percent.
The percent of Macomb campus minority enrollment (Table 7B) totaled 12.8percent in Fall 2006. Macomb campus Black enrollment increased 6.7 percent, whileInternational enrollment increased 3.1 percent. Fall 2006 ethnic enrollment by locationis shown in Table 7C.
Table 9 shows Fall 2005 undergraduate enrollment by race and sex for the 12Illinois public universities.
Table 10 shows that WIU awarded 2,376 (7.5 percent) of the 31,775 total degreesawarded in FY2005 (July 1, 2004 through June 30, 2005) by the 12 Illinois publicuniversities.

TABLE 1. HEADCOUNT ENROLLMENT BY CLASS LEVEL AND LOCATION, FALL TERMS 2002-2006
2002 2003 2004 2005 2006
MACOMB CAMPUS Freshmen 2,936 3,034 3,173 2,968 2,963 Sophomores 1,907 1,995 2,108 2,196 2,038LOWER DIVISION 4,843 5,029 5,281 5,164 5,001 Juniors 2,334 2,247 2,359 2,587 2,628 Seniors 2,573 2,546 2,498 2,574 2,729UPPER DIVISION 4,907 4,793 4,857 5,161 5,357TOTAL UNDERGRAD 9,750 9,822 10,138 10,325 10,358 Graduates 1,201 1,174 1,049 952 1,010TOTAL 10,951 10,996 11,187 11,277 11,368PCT CHANGE 3.3% 0.4% 1.7% 0.8% 0.8%
QUAD CITIES Freshmen 1 6 8 4 4 Sophomores 16 13 13 10 9LOWER DIVISION 17 19 21 14 13 Juniors 233 209 191 195 234 Seniors 440 412 402 396 367UPPER DIVISION 673 621 593 591 601TOTAL UNDERGRAD 690 640 614 605 614 Graduates 771 670 666 612 717TOTAL 1,461 1,310 1,280 1,217 1,331PCT CHANGE -0.6% -10.3% -2.3% -4.9% 9.4%
EXTENSION Freshmen 19 15 23 14 9 Sophomores 23 22 26 23 25LOWER DIVISION 42 37 49 37 34 Juniors 175 146 129 94 101 Seniors 376 382 380 223 227UPPER DIVISION 551 528 509 317 328TOTAL UNDERGRAD 593 565 558 354 362 Graduates 456 598 533 556 541TOTAL 1,049 1,163 1,091 910 903PCT CHANGE -7.2% 10.9% -6.2% -16.6% -0.8%
TOTAL ENROLLMENT Freshmen 2,956 3,055 3,204 2,986 2,976 Sophomores 1,946 2,030 2,147 2,229 2,072LOWER DIVISION 4,902 5,085 5,351 5,215 5,048 Juniors 2,742 2,602 2,679 2,876 2,963 Seniors 3,389 3,340 3,280 3,193 3,323UPPER DIVISION 6,131 5,942 5,959 6,069 6,286TOTAL UNDERGRAD 11,033 11,027 11,310 11,284 11,334 Graduates 2,428 2,442 2,248 2,120 2,268TOTAL 13,461 13,469 13,558 13,404 13,602PCT CHANGE 1.9% 0.1% 0.7% -1.1% 1.5%

Figure 1a. Total University Enrollment and Total Macomb Campus Enrollment Fall 2002, 2004 and 2006
13,461 13,60213,558
10,951 11,187 11,368
-
2,000
4,000
6,000
8,000
10,000
12,000
14,000
2002 2004 2006
Total Enrollment On-Campus
Figure 1b. Total Extension and Quad Cities Enrollment Fall 2002, 2004 and 2006
1,4611,280
903
1,0911,0491,331
-
250
500
750
1,000
1,250
1,500
1,750
2002 2004 2006
Extension Quad Cities

TABLE 2. FULL-TIME/PART-TIME ENROLLMENT BY CLASS LEVEL AND LOCATION, FALL TERMS 2002-2006
2002 2003 2004 2005 2006FT PT FT PT FT PT FT PT FT PT
MACOMB CAMPUS Freshmen 2,862 74 2,967 67 3,107 66 2,912 56 2,901 62 Sophomores 1,864 43 1,959 36 2,069 39 2,152 44 2,007 31 LOWER DIVISION 4,726 117 4,926 103 5,176 105 5,064 100 4,908 93 Juniors 2,256 78 2,176 71 2,291 68 2,522 65 2,555 73 Seniors 2,394 179 2,356 190 2,322 176 2,388 186 2,535 194 UPPER DIVISION 4,650 257 4,532 261 4,613 244 4,910 251 5,090 267 TOTAL UNDERGRAD 9,376 374 9,458 364 9,789 349 9,974 351 9,998 360 Graduates 767 434 725 449 663 386 621 331 673 337 TOTAL 10,143 808 10,183 813 10,452 735 10,595 682 10,671 697 PCT CHANGE 4.5% -10.0% 0.4% 0.6% 2.6% -9.6% 1.4% -7.2% 0.7% 2.2%
QUAD CITIES Freshmen 1 - 2 4 3 5 1 3 2 2 Sophomores 4 12 4 9 5 8 3 7 1 8 LOWER DIVISION 5 12 6 13 8 13 4 10 3 10 Juniors 97 136 96 113 94 97 91 104 101 133 Seniors 193 247 206 206 216 186 216 180 182 185 UPPER DIVISION 290 383 302 319 310 283 307 284 283 318 TOTAL UNDERGRAD 295 395 308 332 318 296 311 294 286 328 Graduates 63 708 70 600 79 587 73 539 89 628 TOTAL 358 1,103 378 932 397 883 384 833 375 956 PCT CHANGE 9.8% -3.6% 5.6% -15.5% 5.0% -5.3% -3.3% -5.7% -2.3% 14.8%
EXTENSION Freshmen - 19 - 15 1 22 - 14 2 7 Sophomores 1 22 3 19 2 24 - 23 9 16 LOWER DIVISION 1 41 3 34 3 46 - 37 11 23 Juniors 1 174 8 138 5 124 12 82 11 90 Seniors 10 366 13 369 15 365 20 203 31 196 UPPER DIVISION 11 540 21 507 20 489 32 285 42 286 TOTAL UNDERGRAD 12 581 24 541 23 535 32 322 53 309 Graduates 20 436 66 532 60 473 72 484 69 472 TOTAL 32 1,017 90 1,073 83 1,008 104 806 122 781 PCT CHANGE 28.0% -8.0% 181.3% 5.5% -7.8% -6.1% 25.3% -20.0% 17.3% -3.1%
TOTAL ENROLLMENT Freshmen 2,863 93 2,969 86 3,111 93 2,913 73 2,905 71 Sophomores 1,869 77 1,966 64 2,076 71 2,155 74 2,017 55 LOWER DIVISION 4,732 170 4,935 150 5,187 164 5,068 147 4,922 126 Juniors 2,354 388 2,280 322 2,390 289 2,625 251 2,667 296 Seniors 2,597 792 2,575 765 2,553 727 2,624 569 2,748 575 UPPER DIVISION 4,951 1,180 4,855 1,087 4,943 1,016 5,249 820 5,415 871 TOTAL UNDERGRAD 9,683 1,350 9,790 1,237 10,130 1,180 10,317 967 10,337 997 Graduates 850 1,578 861 1,581 802 1,446 766 1,354 831 1,437 TOTAL 10,533 2,928 10,651 2,818 10,932 2,626 11,083 2,321 11,168 2,434 PCT CHANGE 4.7% -7.0% 1.1% -3.8% 2.6% -6.8% 1.4% -11.6% 0.8% 4.9%

Figure 2. Total Headcount Enrollment by Class Level, Fall 1996 and 2006
2006
Freshmen21.9%
Sophomores15.2%
Juniors21.8%
Seniors24.4%
Graduates16.7%
1996
Freshmen20.0%
Sophomores13.9%
Juniors20.5%
Seniors24.7%
Graduates20.8%

TABLE 3. ENROLLMENT BY SEX AND LOCATION, FALL TERMS 2002-2006
2002 2003 2004 2005 2006M F M F M F M F M F
MACOMB CAMPUS Undergraduate 4,977 4,773 5,105 4,717 5,307 4,831 5,415 4,910 5,546 4,812 Graduate 529 672 535 639 502 547 456 496 524 486 TOTAL 5,506 5,445 5,640 5,356 5,809 5,378 5,871 5,406 6,070 5,298 PCT CHANGE 3.8% 2.7% 2.4% -1.6% 3.0% 0.4% 1.1% 0.5% 3.4% -2.0%QUAD CITIES Undergraduate 206 484 195 445 207 407 200 405 221 393 Graduate 229 542 169 501 175 491 169 443 212 505 TOTAL 435 1,026 364 946 382 898 369 848 433 898 PCT CHANGE 4.1% -2.5% -16.3% -7.8% 4.9% -5.1% -3.4% -5.6% 17.3% 5.9%EXTENSION Undergraduate 315 278 280 285 294 264 176 178 179 183 Graduate 179 277 226 372 189 344 191 365 194 347 TOTAL 494 555 506 657 483 608 367 543 373 530 PCT CHANGE -1.6% -11.6% 2.4% 18.4% -4.5% -7.5% -24.0% -10.7% 1.6% -2.4%TOTAL ENROLLMENT Undergraduate 5,498 5,535 5,580 5,447 5,808 5,502 5,791 5,493 5,946 5,388 Graduate 937 1,491 930 1,512 866 1,382 816 1,304 930 1,338 TOTAL 6,435 7,026 6,510 6,959 6,674 6,884 6,607 6,797 6,876 6,726 PCT CHANGE 3.4% 0.6% 1.2% -1.0% 2.5% -1.1% -1.0% -1.3% 4.1% -1.0%
TABLE 4. ENROLLMENT BY LOCATION AND STUDENT RESIDENCY, FALL TERMS 2002-2006
2002 2003 2004 2005 2006
MACOMB CAMPUS In-state* 10,151 10,264 10,514 10,597 10,621 Out-of state* 444 426 398 411 398 Foreign 356 306 275 269 349 TOTAL 10,951 10,996 11,187 11,277 11,368 PCT CHANGE 3.3% 0.4% 1.7% 0.8% 0.8%QUAD CITIES In-state* 1,067 957 937 890 967 Out-of state* 386 345 334 318 356 Foreign 8 9 9 9 8 TOTAL 1,461 1,311 1,280 1,217 1,331 PCT CHANGE -0.6% -10.3% -2.4% -4.9% 9.4%EXTENSION In-state* 765 915 867 761 761 Out-of state* 280 232 216 136 133 Foreign 4 15 8 13 9 TOTAL 1,049 1,162 1,091 910 903 PCT CHANGE -7.2% 10.8% -6.1% -16.6% -0.8%TOTAL In-state* 11,983 12,136 12,318 12,248 12,349 Out-of state* 1,110 1,003 948 865 887 Foreign 368 330 292 291 366 TOTAL 13,461 13,469 13,558 13,404 13,602 PCT CHANGE 1.9% 0.1% 0.7% -1.1% 1.5%*Based on residency code at 10th day of semester.


TABLE 5. FALL HEADCOUNT ENROLLMENTS IN ILLINOIS PUBLIC UNIVERSITIES 2001 TO 2006
Percent Percent Institution 2001 2002 2003 2004 2005 2006* Change Change
2001-06 2005-06 Public Universities Chicago State University 7,079 7,158 7,040 6,835 7,131 7,012 -0.9% -1.7% Eastern Illinois University 10,531 11,163 11,522 11,651 12,129 12,349 17.3% 1.8% Governors State University 5,860 5,897 5,664 5,675 5,389 5,338 -8.9% -0.9% Illinois State University 21,240 21,183 20,860 20,757 20,653 20,261 -4.6% -1.9% Northeastern Ill. University 10,999 11,409 11,825 12,164 12,227 12,056 9.6% -1.4% Northern Illinois University 23,783 24,948 25,260 24,820 25,208 25,313 6.4% 0.4% Western Illinois University 13,206 13,461 13,469 13,558 13,404 13,602 3.0% 1.5%TOTAL 92,698 95,219 95,640 95,460 96,141 95,931 3.5% -0.2%
Southern Illinois University SIU - Carbondale 21,598 21,873 21,387 21,589 21,441 21,003 -2.8% -2.0% SIU - Edwardsville 12,442 12,708 13,295 13,493 13,460 13,449 8.1% -0.1%TOTAL SOUTHERN ILLINOIS UNIVERSITY 34,040 34,581 34,682 35,082 34,901 34,452 1.2% -1.3%
University of Illinois U of I - Chicago 24,955 26,138 25,764 24,865 24,770 24,812 -0.6% 0.2% U of I - Springfield 4,288 4,451 4,574 4,396 4,517 4,761 11.0% 5.4% U of I - Urbana/Champaign 39,291 39,999 40,458 40,687 40,670 41,342 5.2% 1.7%TOTAL UNIVERSITY OF ILLINOIS 68,534 70,588 70,796 69,948 69,957 70,915 3.5% 1.4%
TOTAL PUBLIC UNIVERSITIES 195,272 200,388 201,118 200,490 200,999 201,298 3.1% 0.1%
2001-2005 Source: 2006 IBHE Data Book Table I-5*Preliminary (Source-Illinois Public Universities)

TABLE 6. DISTRIBUTION OF TOTAL STUDENTS BY CLASS LEVEL, RACE AND SEX, FALL 2006
Total Total AllUndergraduates Levels
Race/Sex Freshmen Sophomores Juniors Seniors Unclassified* # % Graduate # %WHITEMale 1,229 928 1,290 1,322 2 4,771 42.1% 663 5,434 40.0%Female 1,096 752 1,138 1,407 2 4,395 38.8% 1,108 5,503 40.5%TOTAL WHITE 2,325 1,680 2,428 2,729 4 9,166 80.9% 1,771 10,937 80.4%
BLACK Male 144 70 75 91 - 380 3.4% 25 405 3.0%Female 129 71 84 116 - 400 3.5% 47 447 3.3%TOTAL BLACK 273 141 159 207 - 780 6.9% 72 852 6.3%
HISPANIC Male 79 48 62 60 - 249 2.2% 15 264 1.9%Female 47 34 56 71 - 208 1.8% 36 244 1.8%TOTAL HISPANIC 126 82 118 131 - 457 4.0% 51 508 3.7%
ASIAN AMERICAN Male 18 9 25 24 2 78 0.7% 7 85 0.6%Female 22 15 11 14 - 62 0.5% 13 75 0.6%TOTAL ASIAN AMERICAN 40 24 36 38 2 140 1.2% 20 160 1.2%
NATIVE AMERICAN Male 5 - 7 5 - 17 0.1% 2 19 0.1%Female 13 3 7 7 - 30 0.3% 3 33 0.2%TOTAL NATIVE AMERICAN 18 3 14 12 - 47 0.4% 5 52 0.4%
INTERNATIONAL Male 40 7 20 20 1 88 0.8% 153 241 1.8%Female 14 13 17 9 - 53 0.5% 72 125 0.9%TOTAL INTERNATIONAL 54 20 37 29 1 141 1.2% 225 366 2.7%
OTHER Male 78 87 87 111 - 363 3.2% 65 428 3.1%Female 55 35 84 66 240 2.1% 59 299 2.2%TOTAL OTHER 133 122 171 177 - 603 5.3% 124 727 5.3%
Total Males 1,593 1,149 1,566 930 5 5,946 52.5% 930 6,876 50.6%Total Females 1,376 923 1,397 1,690 2 5,388 47.5% 1,338 6,726 49.4%Grand Total 2,969 2,072 2,963 3,323 7 11,334 100.0% 2,268 13,602 100.0%*High School Students

TABLE 7A. TOTAL ETHNIC ENROLLMENT DATA, FALL TERMS 2002-2006
Asian Native Percent Year White Black Hispanic American American International Other* TOTAL Minority**
2002 11,249 793 403 139 31 368 478 13,461 10.5%2003 11,197 805 411 163 34 330 529 13,469 10.9%2004 11,132 852 462 170 34 292 616 13,558 11.7%2005 10,880 855 478 173 39 291 688 13,404 12.2%2006 10,937 852 508 160 52 366 727 13,602 12.2%
% of Total2006 80.4% 6.3% 3.7% 1.2% 0.4% 2.7% 5.3% 100.0% 12.2%NOTE: Includes Macomb campus, Quad Cities, & Extension
TABLE 7B. TOTAL MACOMB CAMPUS ETHNIC ENROLLMENT DATA, FALL TERMS 2002-2006
Asian Native Percent Year White Black Hispanic American American International Other* TOTAL Minority**
2002 9,115 693 325 122 22 356 318 10,951 10.9%2003 9,105 715 336 142 22 306 370 10,996 11.4%2004 9,115 758 386 148 26 275 479 11,187 12.3%2005 9,073 780 402 158 27 269 568 11,277 12.8%2006 9,061 758 427 149 42 349 582 11,368 12.8%
% of Total2006 79.7% 6.7% 3.8% 1.3% 0.4% 3.1% 5.1% 100.0% 12.8%
TABLE 7C. ETHNIC ENROLLMENT DATA BY LOCATION, FALL 2006 Asian Native Percent
Location White Black Hispanic American American International Other* TOTAL Minority**
Macomb Campus 9,061 758 427 149 42 349 582 11,368 12.8%
Extension 756 41 21 5 2 9 69 903 8.3%
Quad Cities 1,120 53 60 6 8 8 76 1,331 10.1%
*Includes students who marked "other" and those who failed to complete an ethnic data card.**Percent of student body who completed an ethnic data card (excludes Other) and identified themselves as belonging to one of the four minority groups listed.

TABLE 8. FTE ENROLLMENT BY CLASS LEVEL AND LOCATION, FALL TERMS 2002-2006
2002 2003 2004 2005 2006
MACOMB Freshmen 2,932 3,027 3,151 2,960 2,946 Sophomores 1,873 1,968 2,073 2,164 2,022 LOWER DIVISION 4,805 4,995 5,224 5,124 4,968 Juniors 2,261 2,186 2,285 2,522 2,560 Seniors 2,373 2,328 2,287 2,381 2,523 UPPER DIVISION 4,634 4,514 4,572 4,903 5,083 TOTAL UNDERGRAD 9,439 9,509 9,796 10,027 10,051 Graduates 803 807 721 667 715 TOTAL 10,242 10,316 10,517 10,694 10,766 PCT CHANGE 3.6% 0.7% 1.9% 1.7% 0.7%
QUAD CITIES Freshmen 1 3 4 2 2 Sophomores 8 7 6 5 4 LOWER DIVISION 9 10 10 7 6 Juniors 120 121 113 108 134 Seniors 247 252 248 253 225 UPPER DIVISION 367 373 361 361 359 TOTAL UNDERGRAD 376 383 371 368 365 Graduates 293 261 259 245 288 TOTAL 669 644 630 613 653 PCT CHANGE 1.2% -3.7% -2.2% -2.7% 6.5%
EXTENSION Freshmen 9 13 20 10 14 Sophomores 20 25 28 20 26 LOWER DIVISION 29 38 48 30 40 Juniors 89 83 78 66 69 Seniors 180 175 185 130 143 UPPER DIVISION 269 258 263 196 212 TOTAL UNDERGRAD 298 296 311 226 252 Graduates 218 253 232 239 232 TOTAL 516 549 543 465 484 PCT CHANGE 5.1% 6.4% -1.1% -14.4% 4.1%
TOTAL ENROLLMENT Freshmen 2,942 3,043 3,175 2,972 2,962 Sophomores 1,901 2,000 2,107 2,189 2,052 LOWER DIVISION 4,843 5,043 5,282 5,161 5,014 Juniors 2,470 2,390 2,476 2,696 2,763 Seniors 2,800 2,755 2,720 2,764 2,891 UPPER DIVISION 5,270 5,145 5,196 5,460 5,654 TOTAL UNDERGRAD 10,113 10,188 10,478 10,621 10,668 Graduates 1,314 1,321 1,212 1,151 1,235 TOTAL 11,427 11,509 11,690 11,772 11,903 PCT CHANGE 3.5% 0.7% 1.6% 0.7% 1.1%

TABLE 9. UNDERGRADUATE ENROLLMENT IN ILLINOIS PUBLIC UNIVERSITIES BY RACE AND SEX, FALL 2005
Black Amer. Indian/ White Asian or Non-Resident Non-Hispanic Alaskan Native Non-Hispanic Pacific Islander Hispanic Alien Unknown Total
Institution M F M F M F M F M FChicago State University 1,163 3,294 2 3 84 60 17 20 106 222 14 21 55 99 1,441 3,719 Eastern Illinois University 315 424 10 12 3,685 5,176 61 56 126 133 31 17 159 170 4,387 5,988 Governors State University 199 748 3 4 413 879 12 19 41 112 4 6 80 112 752 1,880 Illinois State University 375 729 21 26 6,427 8,629 124 176 261 337 69 80 304 300 7,581 10,277 Northeastern Ill. University 372 739 10 10 1,618 2,511 442 557 917 1,800 76 90 120 156 3,555 5,863 Northern Illinois University 822 1,474 26 23 6,439 6,700 563 452 563 651 84 62 321 287 8,818 9,649 Western Illinois University 341 433 11 18 4,714 4,482 94 60 218 210 61 59 352 231 5,791 5,493 SIU - Carbondale 1,350 1,384 47 35 6,670 4,846 206 127 341 243 183 135 544 271 9,341 7,041 SIU - Edwardsville 380 722 12 20 4,263 5,035 101 94 93 91 79 55 - - 4,928 6,017 U of I - Chicago 426 934 14 23 3,250 3,311 1,801 1,878 1,058 1,441 91 119 408 396 7,048 8,102 U of I - Springfield 60 170 5 6 846 1,249 32 36 23 32 12 5 74 84 1,052 1,582 U of I - Urbana/Champaign 797 1,227 48 40 11,066 9,751 2,216 1,676 1,016 947 910 529 372 242 16,425 14,412
TOTAL PUBLIC UNIVERSITIES 6,600 12,278 209 220 49,475 52,629 5,669 5,151 4,763 6,219 1,614 1,178 2,789 2,348 71,119 80,023
TABLE 10. BACCALAUREATE DEGREES CONFERRED IN ILLINOIS PUBLIC UNIVERSITIES BY RACE AND SEX, 2004-2005
Black Amer. Indian/ White Asian or Non-Resident Non-Hispanic Alaskan Native Non-Hispanic Pacific Islander Hispanic Alien Unknown Total
Institution M F M F M F M F M F M F M F M FChicago State University 162 448 2 1 14 17 2 4 10 29 - - - 10 190 509 Eastern Illinois University 52 73 3 3 693 1,075 4 6 16 30 9 6 - - 777 1,193 Governors State University 54 186 - 2 143 281 4 6 11 26 1 5 9 26 222 532 Illinois State University 76 122 2 8 1,618 2,246 31 29 37 61 19 19 4 2 1,787 2,487 Northeastern Ill. University 31 101 1 2 238 418 52 74 97 180 19 16 5 13 443 804 Northern Illinois University 91 205 4 3 1,226 1,514 117 118 70 120 32 23 48 55 1,588 2,038 Western Illinois University 56 69 1 2 1,009 1,009 12 10 38 53 20 18 49 30 1,185 1,191 SIU - Carbondale 219 267 10 3 1,611 1,236 51 13 79 47 90 80 437 230 2,497 1,876 SIU - Edwardsville 51 116 - 1 676 965 9 18 12 15 11 9 - - 759 1,124 U of I - Chicago 73 192 2 4 675 822 354 440 179 267 22 30 38 51 1,343 1,806 U of I - Springfield 9 31 - - 224 349 7 8 5 7 7 6 11 8 263 409 U of I - Urbana/Champaign 145 267 8 5 2,391 2,250 455 407 184 169 216 190 32 33 3,431 3,321
TOTAL PUBLIC UNIVERSITIES 1,019 2,077 33 34 10,518 12,182 1,098 1,133 738 1,004 446 402 633 458 14,485 17,290
Source: 2006 IBHE Data Book

TABLE 11A. MACOMB CAMPUS IOWA AND MISSOURI BORDER COUNTY ENROLLMENTS FALL TERMS 2002-2006
2002 2003 2004 2005 2006
IOWA (Counties include: Clinton, Des Moines, Dubuque, Lee, Louisa, Jackson, Muscatine, Scott) Continuing Undergraduates* 83 77 56 69 73 New Freshmen** 33 54 40 54 28 New Transfers** 81 56 59 81 74 Total Graduates 55 52 44 26 29 TOTAL 252 239 199 230 204 Includes counties added in 2005: Clinton, Dubuque, and Jackson
2002 2003 2004 2005 2006
MISSOURI (Counties include: Clark, Lewis, Lincoln, Marion, Pike, Ralls)
Continuing Undergraduates* 3 2 5 8 3 New Freshmen** 8 5 3 5 4 New Transfers** 6 5 8 4 2 Total Graduates - 1 3 5 6 TOTAL 17 13 19 22 15 Includes counties added in 2005: Lincoln, Pike, and Ralls
TOTAL IOWA & MISSOURI 269 252 218 252 219
TABLE 11B. QUAD CITIES CAMPUS IOWA AND MISSOURI BORDER COUNTY ENROLLMENTS FALL TERMS 2002-2006
2002 2003 2004 2005 2006
IOWA (Counties include: Clinton, Des Moines, Dubuque, Lee, Louisa, Jackson, Muscatine, Scott) Continuing Undergraduates* 79 74 71 83 89 New Transfers** 17 26 26 28 34 Total Graduates 191 165 155 141 180 TOTAL 287 265 252 252 303 Includes counties added in 2005: Clinton, Dubuque, and Jackson
2002 2003 2004 2005 2006
MISSOURI (Counties include: Clark, Lewis, Lincoln, Marion, Pike, Ralls)
Continuing Undergraduates* - - - - - New Transfers** - - - - - Total Graduates - - - 1 1 TOTAL - - - 1 1 Includes counties added in 2005: Lincoln, Pike, and Ralls
TOTAL IOWA & MISSOURI 287 265 252 253 304
*Students who were enrolled previously and continue to show one of the above listed counties as their county of origin. **Fall matrics only

TABLE 12. UNDERGRADUATE AND GRADUATE MACOMB CAMPUS DISTRIBUTION OF ILLINOIS STUDENTS BY HOME COUNTY, FALL TERMS 2002-2006
County 2002 2003 2004 2005 2006
Adams 388 364 351 294 284 Alexander 1 1 - 3 5 Bond 2 4 6 6 4 Boone 25 30 33 41 53 Brown 34 36 35 34 43 Bureau 47 51 64 78 74 Calhoun 9 9 9 8 11 Carroll 42 48 41 41 36 Cass 69 64 70 65 71 Champaign 56 52 49 55 63 Christian 27 21 21 19 19 Clark 1 1 - - - Clay 2 5 4 4 2 Clinton 19 21 16 13 12 Coles 11 10 7 5 5 Cook 1,865 1,903 2,049 2,114 2,137 Crawford 4 3 2 2 5 Cumberland - - 2 4 6 DeKalb 80 72 52 65 61 DeWitt 10 11 8 10 12 Douglas 1 3 2 1 2 DuPage 678 824 918 972 986 Edgar 4 2 4 4 4 Edwards 1 1 - - 2 Effingham 7 9 9 4 3 Fayette 7 7 5 4 2 Ford 7 7 6 7 6 Franklin 1 - - - - Fulton 315 292 271 256 259 Gallatin - - - 1 - Greene 28 22 23 22 29 Grundy 34 45 46 37 47 Hamilton - 1 2 1 2 Hancock 321 307 321 266 240 Hardin - - 1 - - Henderson 129 125 106 81 70 Henry 132 135 154 155 172 Iroquois 22 18 15 23 21 Jackson 4 6 4 6 8 Jasper 3 2 4 4 2 Jefferson 5 - - 1 3 Jersey 15 14 8 13 19 JoDaviess 52 48 48 43 48 Johnson 3 1 1 1 1 Kane 332 380 404 473 458 Kankakee 35 30 36 31 38 Kendall 73 64 58 54 66 Knox 260 273 255 264 229 Lake 468 501 525 593 597 LaSalle 71 88 103 101 98 Lawrence 1 1 1 - - Lee 67 71 69 74 81 Livingston 36 25 23 23 22 Logan 49 56 67 68 77 McDonough 1,202 1,132 1,078 1,014 964 McHenry 283 292 319 315 347 McLean 51 60 77 72 70

TABLE 12. (Continued)
County 2002 2003 2004 2005 2006
Macon 63 55 52 56 54 Macoupin 51 48 47 50 47 Madison 113 103 101 86 74 Marion 5 3 3 3 1 Marshall 23 18 9 6 5 Mason 63 60 49 48 53 Massac - - - - - Menard 25 23 26 37 35 Mercer 79 88 76 70 66 Monroe 10 11 14 12 11 Montgomery 22 20 17 11 11 Morgan 89 71 83 91 81 Moultrie 5 3 3 2 2 Ogle 80 87 104 93 80 Peoria 286 269 267 265 259 Perry 3 2 2 3 3 Piatt 4 4 4 7 13 Pike 59 62 71 63 69 Pope - - 1 2 3 Putnam 6 7 7 15 17 Randolph 5 4 4 - 2 Richland 5 5 4 2 1 Rock Island 279 280 270 268 262 St. Clair 45 54 43 53 55 Saline 2 2 - 1 - Sangamon 196 188 194 194 209 Schuyler 91 81 91 78 82 Scott 21 17 19 14 14 Shelby 3 4 3 3 6 Stark 18 24 24 22 25 Stephenson 92 91 89 81 73 Tazewell 158 161 146 155 159 Union 3 1 - - 1 Vermilion 16 20 22 19 15 Wabash 4 3 1 1 3 Warren 170 175 139 146 134 Washington 4 4 1 4 3 Wayne 2 2 2 - 1 White 10 11 5 2 2 Whiteside 112 104 108 113 111 Will 311 322 383 409 443 Williamson 3 1 1 3 8 Winnebago 202 204 227 243 228 Woodford 24 24 20 21 22
TOTALS 10,151 10,264 10,514 10,597 10,619
%Inc (Dec) over Prev Yr 3.7% 1.1% 2.4% 0.8% 0.2%
Total as % of on-campusHDCT enrollment 92.7% 93.3% 94.0% 94.0% 93.4%
NOTE: Top ten 2006 counties are highlighted.
Students from 95 Illinois counties

ORIGIN OF STUDENTS
In 2006 WIU enrolled a total of 660 students from Iowa (Table 13), with 507enrolled from the Iowa border counties of Clinton, Des Moines, Dubuque, Jackson, Lee,Louisa, Muscatine, and Scott. Missouri students totaled 49, with 16 enrolled from theMissouri border counties of Clark, Lewis, Lincoln, Marion, Pike, and Ralls (Table 11).
The distribution of Macomb campus Illinois students by home county (Table 12)shows Cook County sent 2,137 students to WIU in Fall 2006, the largest number ofstudents from any county. DuPage County sent 986 students. Other counties in the topten include Adams, Fulton, Kane, Lake, McDonough, McHenry, Peoria, Rock Island, andWill. The total number of out-of-state students (Table 13) was 887 from 41 states.
The Macomb campus international student population (Table 14) totaled 349, up29.7 percent from Fall 2005, with international students accounting for 3.1 percent oftotal Macomb campus headcount enrollment. Students came from 52 foreign countries.Countries sending the greatest number of students include India (82), followed by SaudiArabia (44), Japan (43), Nepal (28), Korea (23), and Canada (15).

TABLE 13. ORIGIN OF ALL OUT-OF-STATE STUDENTSFALL TERMS 2002-2006
2002 2003 2004 2005 2006Alabama 3 2 3 2 1 Alaska 3 1 1 - 4 Arizona 6 7 4 2 2 Arkansas 1 4 10 9 7 California 25 20 12 9 14 Colorado 9 3 4 1 3 Connecticut 1 - - - - Delaware - - - - - District of Columbia - - - - - Florida 21 18 9 4 6 Georgia 3 3 5 2 3 Hawaii 4 - - 1 1 Idaho 1 3 - - 1 Indiana 11 10 12 5 7 Iowa 725 706 642 647 660 Kansas 9 4 10 12 12 Kentucky 6 6 9 4 2 Louisiana 2 1 - 2 2 Maine 1 2 1 - 1 Maryland 4 3 4 4 5 Massachusetts 1 - 2 4 3 Michigan 11 10 10 9 11 Minnesota 11 14 14 7 9 Mississippi 7 1 2 - - Missouri 54 44 50 48 49 Montana 2 5 - 2 3 Nebraska 6 6 6 7 5 Nevada 1 2 3 1 2 New Hampshire 1 - 2 2 - New Jersey 6 2 2 2 4 New Mexico 5 2 2 3 1 New York 8 6 8 5 1 North Carolina 9 5 6 1 2 North Dakota 4 5 2 - 1 Ohio 8 14 20 12 9 Oklahoma 4 1 2 1 5 Oregon - 3 4 1 2 Pennsylvania 7 9 4 4 4 Rhode Island - - - - - South Carolina 1 - 2 1 2 South Dakota - - - - - Tennessee 7 2 6 2 5 Texas 49 41 33 21 17Utah 2 2 1 - 1 Vermont - - - - - Virginia 8 7 8 3 4 Washington 6 4 6 5 6 West Virginia 2 - 1 1 1 Wisconsin 31 21 20 18 9Wyoming - - - - -
Total 1,086 999 942 864 887
Students from 41 statesTop six states highlightedIncludes all campuses

TABLE 14. ORIGIN OF MACOMB CAMPUS INTERNATIONAL STUDENTS, FALL TERMS 2002-2006
Country 2002 2003 2004 2005 2006Afghanistan - - - 1 1Armenia 1 - - 1 0Australia - - - - 1Bahamas - - 1 1 -Bangladesh 2 - 2 - 1Barbados - 1 - - 1Belarus 1 1 1 1 1Bolivia 1 - - 2 4Botswana 1 - - - -Brazil 8 9 5 - -Bulgaria 2 1 1 - -Cambodia 1 - 1 1 -Cameroon - - - 1 1Canada 6 6 7 10 15Chad - 1 - 1 1China, People's Rep of 22 12 8 6 10China, Republic of (Taiwan) 10 9 11 15 11Colombia 1 - - - -Costa Rica 1 1 - 1 2Croatia - - - 1 1Cuba - - - 1 -Dominican Republic - 1 1 - -Ecuador - - - 3 3Ethiopia 1 - - - 1France - 1 1 1 1Georgia - - - - 2Germany 14 17 6 6 7Ghana 1 1 2 1 1Greece - - 1 - 1Haiti 2 - - - -Honduras - - 1 - -Hong Kong 1 - 1 - 1India 21 29 34 52 82Indonesia 1 1 - 1 1Iran 1 - - - -Israel 1 1 1 - 1Italy 1 - - - -Ivory Coast - - - - -Japan 86 76 80 54 43Jordan - - - 2 2Kazakhstan 1 - - 1 1Kenya 7 5 4 2 2Korea 48 45 32 27 23Kuwait 1 - - - -Latvia - 2 2 1 -Lebanon - - - 1 1Lithuania - 1 1 - -Macedonia - - - 1 1Malaysia 5 1 1 - 1Mexico 8 8 7 6 6

TABLE 14. ORIGIN OF MACOMB CAMPUS INTERNATIONAL STUDENTS, continued
Country 2002 2003 2004 2005 2006Mongolia 1 - - - -Mozambique 1 1 - 1 1Myanmar (formerly Burma) 33 19 9 6 4Namibia - 11 - - -Nepal 11 11 13 12 28Netherlands - - 4 5 1Nigeria 2 - 1 1 -Norway 1 2 - - -Oman 1 - 2 - -Pakistan 12 1 3 4 -Panama 1 9 - - -Poland 1 1 1 - -Romania 2 2 1 3 3Russia 2 3 3 2 1Saint Lucia - - 2 1 -Saudi Arabia 10 8 3 5 44Scotland 1 1 1 - -Senegal - 1 - - -South Africa 1 - - 1 1Spain 1 2 - - 1Sudan - - - 1 1Swaziland 1 1 - - -Sweden 3 1 2 1 2Tajikistan - - - 1 -Tanzania - - 1 - -Thailand 5 4 4 2 1Togo - 2 2 3 5Trinidad and Tobago - - 1 - -Turkey 3 3 1 4 8Turkmenistan - - 4 7 7Ukraine - - - 1 2United Arab Emirates 1 1 - - -United Kingdom 3 2 4 5 6Uzbekistan 1 - - - -Yugoslavia - 1 1 - -Zaire 1 - - 1 1Zambia - - - - 1
TOTALS 356 317 275 269 349
%Inc (Dec) over Prev Yr -5.8% -11.0% -13.2% -2.2% 29.7%
Total as % ofMacomb campus HDCT enroll. 3.3% 2.9% 2.5% 2.4% 3.1%
NOTE: Top eleven 2006 countries are highlighted.

FRESHMEN PROFILE
Selected characteristics of first-time freshmen for Fall 2006 are shown in Table15. The first-time freshmen population is comprised of 52.4 percent males and 47.6percent females, compared to Fall 2005 first-time freshmen enrollment of 50.9 percentmales and 49.1 percent females. Of the 1,922 first-time freshmen 1,816 (94.5 percent)graduated from Illinois high schools. Over 52 percent of the 2006 new freshmengraduated in the top 50 percent of their high school class. The total number of newfreshmen from the Iowa border counties decreased from 54 students in 2005 to 28 in2006. The number of new freshmen from Missouri border counties totaled four. BuffaloGrove High School sent the largest number of new freshmen, 40, to WIU. Of the 1,922first-time freshmen, 1,455, or 75.7 percent, received financial aid. The average financialaid package totaled $6,958.
The number of Fall 2006 first-time freshmen majors (Table 16) shows thatprograms with the largest number of majors include law enforcement & justiceadministration (341), elementary education (115), pre-accountancy (67), psychology (63),biology (49) and pre-marketing (47). Table 17 and Figure 4 show the 4-, 5- and 6-yeargraduation rates for all first-time, full-time freshmen from 1998 through 2002. Tables17A and 17B show the same graduation information for freshmen admitted underregular admission standards as well as freshmen admitted under special admissionstandards. Six-year graduation rates by race for first-time full-time freshmen are shownfor students enrolled in 1996 through 2000 in Table 18. New freshmen retention fromfall semester 2005 to fall semester 2006 by college, race and gender are shown in Table19. Table 20 shows the average number of years to graduate by program and college forstudents entering as new freshmen.
Table 21 shows the distribution of all first-time freshmen ACT composite scores.The average ACT remained steady at 21.2 in 2006, the same as in 2004. The ACTcomposite scores for freshmen admitted under regular admission standards decreasedfrom 21.7 in Fall 2005 to 21.6 in Fall 2006 (Table 21 and Figure 5).
The distribution of Macomb campus Illinois first-time freshmen by home county(Table 22) shows Cook County as the leading source of first-time freshmen with 501students, up 17.6 percent from 2005. Students from DuPage County increased by 3,from 217 in Fall 2005 to 220 in Fall 2006. Other counties in the top ten include Henry,Kane, Lake, McDonough, McHenry, Sangamon, Will and Winnebago. New freshmencame from 74 Illinois counties in Fall 2006.

Race Male Female Total Percent* 1,816
White 815 752 1,567 84.7% 84 Black 74 68 142 7.7%Hispanic 48 34 82 4.4% 7 Asian American 13 15 28 1.5%Native American 5 9 14 0.8% 15 Other 40 31 71 3.8%International 12 6 18 1.0% Total 1,922
Total 1,007 915 1,922 100%
Percent 52.4 47.6
Class Rank Number Percent* 1,843 61
Upper 10% 107 6.1% 1820% 269 15.2%25% 354 20.0% 1,922 30% 458 25.9%40% 686 38.8%50% 929 52.6% 2860% 1,200 68.0% 470% 1,460 82.7%75% 1,572 89.0%80% 1,667 94.4% 3290% 1,754 99.3% 8
100% 1,766 100.0%
52.58%
1,9224038 1,455
Macomb High 262220
Naperville North High 20 8622019 1,2361817 1031717 $6,958 Oswego High School
Downers Grove High SchoolEmployed by institution
HIGH SCHOOLS SENDING THE GREATEST NUMBER OF FIRST-TIME FRESHMEN TO WIU
Geneseo Sr. High
Total New FreshmenBuffalo Grove High School
Hononegah Community High
the three categories listed
Victor Andrew High
William Fremd High School
Neuqua Valley High School
fellowships, tuition and waivers,or traineeships
Received loansPlainfield Central High
AVERAGE AID NOTE: Students may receive aid from one or more of
Total New Freshmen
Missouri Border County Iowa Border County Students
Total Iowa StudentsTotal Missouri
Received scholarships, grants,
FINANCIAL AID
Served by all financial programs
DISTRIBUTION BY RESIDENCY
Foreign Secondary
*Excludes Other
Out-of-state Foreign Residents
HIGH SCHOOL SENIOR CLASS
AVERAGE PERCENTILE
Naperville Central High
*Excludes 154 students with no high school rank.
Illinois Residents
TABLE 15. FIRST-TIME FRESHMEN CLASS PROFILE, FALL 2006
DISTRIBUTION BY RACE AND SEX
Out-of-State High
GED Equivalency or Unknown
HIGH SCHOOL BACKGROUND
Illinois High School Graduates

TABLE 16. MAJORS OF FIRST-TIME FRESHMEN, FALL TERMS 2003-2006*
FALL 2003 FALL 2004 FALL 2005 FALL 2006ENR PCT ENR PCT ENR PCT ENR PCT
COLLEGE OF ARTS & SCIENCES Biology 60 3.06% 62 2.97% 55 3.03% 49 2.55% Chemistry 6 0.31% 9 0.43% 12 0.66% 9 0.47% Clinical Laboratory Science 3 0.15% 4 0.19% 1 0.06% 1 0.05% Economics - 0.00% - 0.00% - 0.00% - 0.00% English 17 0.87% 34 1.63% 16 0.88% 29 1.51% Forensic Chemistry 0 0.00% 0 0.00% 0 0.00% 20 1.04% French 2 0.10% - 0.00% 1 0.06% - 0.00% Geography 2 0.10% 1 0.05% 3 0.17% - 0.00% Geology 8 0.41% 2 0.10% 2 0.11% 3 0.16% History 33 1.68% 41 1.97% 41 2.26% 37 1.93% Journalism 17 0.87% 24 1.15% 19 1.05% 17 0.88% Mathematics 24 1.22% 18 0.86% 10 0.55% 9 0.47% Meteorology 2 0.10% 7 0.34% 10 0.55% 15 0.78% Philosophy 1 0.05% - 0.00% - 0.00% 2 0.10% Physics 3 0.15% 2 0.10% 4 0.22% 1 0.05% Political Science 28 1.43% 31 1.49% 22 1.21% 26 1.35% Pre-Architecture 7 0.36% 10 0.48% 3 0.17% 3 0.16% Pre-Chemical Engineering 2 0.10% 3 0.14% 2 0.11% 2 0.10% Pre-Dentistry 8 0.41% 4 0.19% 5 0.28% 2 0.10% Pre-Engineering 16 0.82% 17 0.82% 8 0.44% 12 0.62% Pre-Medical 19 0.97% 25 1.20% 17 0.94% 15 0.78% Pre-Nursing 16 0.82% 22 1.06% 22 1.21% 14 0.73% Pre-Optometry 1 0.05% 2 0.10% 1 0.06% 1 0.05% Pre-Pharmacy 13 0.66% 11 0.53% 12 0.66% 7 0.36% Pre-Physical Therapy 4 0.20% 9 0.43% 16 0.88% 16 0.83% Psychology 63 3.21% 90 4.32% 63 3.47% 63 3.28% Sociology 8 0.41% 2 0.10% 7 0.39% 8 0.42% Spanish 4 0.20% 4 0.19% 4 0.22% 7 0.36%TOTAL ARTS & SCIENCES 367 18.71% 434 20.82% 356 19.60% 368 19.15%
COLLEGE OF BUSINESS AND TECHNOLOGY Agriculture Sci 26 1.33% 35 1.68% 44 2.42% 26 1.35% Computer Science 68 3.47% 43 2.06% 28 1.54% 39 2.03% Construction Management** - - 8 0.38% 14 0.77% 41 2.13% Graphic Communication 9 0.46% 14 0.67% 15 0.83% 15 0.78% Mfg Engineering Tech 11 0.56% 12 0.58% 10 0.55% 11 0.57% Marketing 1 0.05% - 0.00% - 0.00% - 0.00% Pre-Ag Engineering - 0.00% 2 0.10% - 0.00% 1 0.05% Pre-Forestry - 0.00% 2 0.10% - 0.00% - 0.00% Pre-Vet Medicine 4 0.20% 5 0.24% 7 0.39% 7 0.36% Pre-Accountancy 55 2.80% 46 2.21% 50 2.75% 67 3.49% Pre-Economics 4 0.20% 3 0.14% 2 0.11% 4 0.21% Pre-Finance 19 0.97% 16 0.77% 16 0.88% 22 1.14% Pre-Human Resource Mgt 7 0.36% 4 0.19% 4 0.22% 3 0.16% Pre-Information Management 4 0.20% 5 0.24% 1 0.06% 1 0.05% Pre-Management 74 3.77% 66 3.17% 58 3.19% 44 2.29% Pre-Marketing 44 2.24% 43 2.06% 44 2.42% 47 2.45% Pre-Supply Chain Mgt. - - - - 2 0.11% 1 0.05% Pre-Business Undecided 25 1.27% 28 1.34% 24 1.32% 21 1.09%TOTAL PRE-BUSINESS 207 10.56% 183 8.78% 201 11.07% 210 10.93%TOTAL BUSINESS AND TECHNOLOGY 351 17.90% 332 15.92% 319 17.57% 350 18.21%

TABLE 16. (Continued)
FALL 2003 FALL 2004 FALL 2005 FALL 2006ENR PCT ENR PCT ENR PCT ENR PCT
COLLEGE OF EDUCATION AND HUMAN SERVICES Bilingual/Bicultural Ed 9 0.46% 9 0.43% 4 0.22% 3 0.16% Community Health 1 0.05% - 0.00% - 0.00% 1 0.05% Dietetics, Fashion Merchandising & Hospitality 44 2.24% 56 2.69% 58 3.19% 44 2.29% Elementary Education (and Pre-El Ed) 140 7.14% 128 6.14% 92 5.07% 115 5.98% Health Services Management - 0.00% 1 0.05% 1 0.06% 2 0.10% Instr Tech & Telecommunications 4 0.20% 3 0.14% - 0.00% 3 0.16% Kinesiology 52 2.65% 68 3.26% 56 3.08% 78 4.06% Law Enforcement & Justice Adm (& Pre-Law Enf) 312 15.91% 363 17.41% 356 19.60% 341 17.74% Pre-Social Work 25 1.27% 15 0.72% 19 1.05% 24 1.25% Recreation, Parks and Tourism Administration 8 0.41% 12 0.58% 11 0.61% 8 0.42% Social Work 1 0.05% - 0.00% - 0.00% - 0.00% Special Education 26 1.33% 26 1.25% 33 1.82% 42 2.19%TOTAL EDUCATION AND HUMAN SERVICES 622 31.72% 681 32.66% 630 34.69% 661 34.39%
COLLEGE OF FINE ARTS AND COMMUNICATION Art 23 1.17% 16 0.77% 12 0.66% 25 1.30% Broadcasting 30 1.53% 34 1.63% 23 1.27% 31 1.61% Communication 31 1.58% 31 1.49% 16 0.88% 17 0.88% Comm Science & Disorders 6 0.31% 6 0.29% 6 0.33% 11 0.57% Music 53 2.70% 47 2.25% 47 2.59% 48 2.50% Musical Theatre** - - 8 0.38% 6 0.33% 7 0.36% Theatre 12 0.61% 2 0.10% 8 0.44% 7 0.36%TOTAL FINE ARTS AND COMMUNICATION 155 7.90% 144 6.91% 118 6.50% 146 7.60%
OTHER Board of Trustees 2 0.10% 4 0.19% - 0.00% 1 0.05% General Orientation 463 23.61% 490 23.50% 393 21.64% 396 20.60% Individual Studies - 0.00% - 0.00% - 0.00% - 0.00% Unclassified 1 0.05% - 0.00% - 0.00% - 0.00%TOTAL OTHER 466 23.76% 494 23.69% 393 21.64% 397 20.66%
GRAND TOTAL - NEW FRESHMEN 1,961 100.00% 2,085 100.00% 1,816 100.00% 1,922 100.00%
*Includes Extension & WIU-QC students**New major Fall 2004

TABLE 17A. GRADUATION RATES OF WIU FIRST-TIME, FULL-TIME FRESHMEN 4-, 5- AND 6-YEAR RATES
TOTAL FIRST-TIME FULL-TIME FRESHMEN
Proportion of WIU First-Time Freshmen Graduating from WIU Within:
Year Admitted N 4 Years 5 Years 6 Years1998 1,749 28.8 50.6 54.21999 1,693 32.0 51.6 55.42000 1,766 31.4 51.1 55.62001 1,679 32.9 52.52002 1,917 32.8
TABLE 17B. GRADUATION RATES OF WIU FIRST-TIME FRESHMEN, REGULAR ADMITS 4-, 5- AND 6-YEAR RATES
ADMITTED UNDER REGULAR ADMISSION STANDARDS
Proportion of WIU First-Time Freshmen Graduating from WIU Within:
Year Admitted N 4 Years 5 Years 6 Years1998 1,327 30.7 51.5 54.61999 1,295 35.3 53.1 56.12000 1,353 34.5 53.8 57.92001 1,266 35.6 54.22002 1,540 34.8
TABLE 17C. GRADUATION RATES OF WIU FIRST-TIME FULL-TIME FRESHMEN, SPECIAL ADMITS 4-, 5- AND 6-YEAR RATES
ADMITTED UNDER SPECIAL ADMISSION STANDARDS
Proportion of WIU First-Time Freshmen Graduating from WIU Within:
Year Admitted N 4 Years 5 Years 6 Years1998 422 21.6 47.6 52.81999 398 20.4 47.0 52.92000 413 21.1 42.4 48.22001 413 24.5 47.32002 377 23.1
NOTES: Students graduating within n years includes all students who graduated by the summer term of the nth year. The cohort selection is based on IPEDS GRS procedures. Beginning with the 1999 cohort, six-year rates exclude veterans with active status.

Figure 4. Graduation Rates of WIU First-Time Full-Time Freshmen Four-, Five- and Six-Year Rates
50.654.2
32.0
51.655.4
31.4
51.1
55.6
32.9
52.5
32.828.8
0
10
20
30
40
50
60
1998 1999 2000 2001 2002

TABLE 18. WESTERN ILLINOIS UNIVERSITY SIX-YEAR GRADUATION RATES BY RACEFIRST-TIME FULL-TIME FRESHMEN*
Year Enrolled Race Number of Percent GraduatingStudents Within Six Years
1996 White 1,275 52.5Black 103 37.9Hispanic 35 34.3All Minority 154 37.0All Students 1,477 50.8
1997 White 1,388 57.8Black 104 43.3Hispanic 33 42.4All Minority 167 40.1All Students 1,602 55.4
1998 White 1,502 55.7Black 123 43.9Hispanic 37 62.2All Minority 195 44.6All Students 1,749 54.2
1999 White 1,434 57.5
Black 119 38.7Hispanic 40 60.0All Minority 181 43.6All Students 1,690 55.4
2000 White 1,492 56.6
Black 135 39.3Hispanic 63 61.9All Minority 217 46.5All Students 1,763 55.4
*Excludes those who enrolled but did not attend.Notes: All Minority includes Black, Hispanic, Asian, Native American. Beginning with the 1999 cohort, excludes veterans with active status.

TABLE 19. NEW FRESHMEN RETENTION BY RACE AND SEX, FALL 2005 TO FALL 2006TOTAL UNIVERSITY
RETURNING FALL 2006 NON-RETURNING FALL 2006 TOTAL NON-RET. FALL 2006
ACADEMICRACE/SEX FALL 2005 GOOD PROBATION/
ENROLLED # % STANDING SUSPENSION # %
WHITE MALE 733 547 74.6 86 100 186 25.4 FEMALE 722 515 71.3 130 77 207 28.7 TOTAL 1,455 1,062 73.0 216 177 393 27.0
BLACK MALE 68 50 73.5 6 12 18 26.5 FEMALE 75 52 69.3 9 14 23 30.7 TOTAL 143 102 71.3 15 26 41 28.7
HISPANIC MALE 41 26 63.4 7 8 15 36.6 FEMALE 36 25 69.4 6 5 11 30.6 TOTAL 77 51 66.2 13 13 26 33.8
ASIAN/ MALE 11 6 54.5 1 4 5 45.5 AMERICAN FEMALE 15 14 93.3 1 - 1 6.7
TOTAL 26 20 76.9 2 4 6 23.1
AMERICAN MALE 2 1 50.0 1 - 1 50.0 INDIAN FEMALE 6 4 66.7 - 2 2 33.3
TOTAL 8 5 62.5 1 2 3 37.5
OTHER/ MALE 67 51 76.1 9 7 16 23.9 FOREIGN FEMALE 35 23 65.7 8 4 12 34.3
TOTAL 102 74 72.5 17 11 28 27.5
UNIVERSITY TOTAL 1,811 1,314 72.6 264 233 497 27.4
NOTE: Includes summer matriculants, excludes "no shows" and active veteran students.Data Source: Tenth Day Files/History Database

TABLE 20. AVERAGE NUMBER OF YEARS TO GRADUATE BY PROGRAM ANDCOLLEGE FOR STUDENTS ENTERING AS NEW FRESHMEN*
College/Program Average Years to Graduate
COLLEGE OF ARTS & SCIENCES 4.7African-American Studies 4.5Biology 4.5Chemistry 4.1Economics 4.7English 5.3French 4.3Geography 5.5Geology 4.7History 4.8Journalism 4.6Mathematics 4.3Medical Technology (Clinical Lab. Sciences) 4.3Meteorology 4.0Philosophy 4.4Physics 5.3Political Science 4.4Psychology 4.4Sociology 5.0Spanish 4.9Women's Studies 5.5
COLLEGE OF BUSINESS AND TECHNOLOGY 4.4Accountancy 4.4Agriculture 4.2Computer Science 4.4Construction Management 5.2Economics 4.2Finance 4.4Graphic Communication 4.5Human Resource Management 4.2Industrial Technology 6.0Information Management 4.4Management 4.5Manufacturing Engineering 4.6Marketing 4.5Supply Chain Management 4.5
COLLEGE OF EDUCATION AND HUMAN SERVICES 4.5Bilingual/Bicultural 4.8Community Health 4.8Dietetics, Fashion Merchandising & Hospitality 4.5Elementary Education 4.6Health Services Management 4.4Instructional Design & Technology 4.6Kinesiology 4.7Law Enforcement & Justice Administration 4.2Recreation, Park & Tourism Administration 4.9Social Work 4.8Special Education 4.8
FINE ARTS & COMMUNICATION 4.6Art (B.A.) 5.0Art (B.F.A.) 4.4Broadcasting 4.4Communication 4.4Communication Sciences & Disorders 4.2Music 5.1Theatre 4.7
OTHER 6.6Individual Studies 4.6Board of Trustees 8.6
**TOTAL UNIVERSITY 4.5*Represents graduates from Fall 2001 to Summer 2006**Excludes Board of Trustees program

TABLE 21. DISTRIBUTION OF ALL FIRST-TIME FRESHMEN BY ENHANCED ACT COMPOSITE STANDARD SCORES, FALL TERMS 2002-2006
Standard 2002 % of 2003 % of 2004 % of 2005 % of 2006 % of Score Total Total Total Total Total Total Total Total Total Total
36 - - 1 0.1 1 0.1 - - - - 35 - - - - - - - - - - 34 2 0.1 - - - - 1 0.1 - - 33 5 0.3 - - 1 0.1 2 0.1 1 0.1 32 4 0.2 4 0.2 4 0.2 3 0.2 - - 31 7 0.4 9 0.5 11 0.6 5 0.3 9 0.5 30 16 0.8 19 1.0 17 0.9 14 0.8 12 0.7 29 20 1.0 21 1.1 26 1.3 17 0.9 24 1.3 28 27 1.4 35 1.8 43 2.2 34 1.9 37 2.0 27 71 3.7 44 2.3 41 2.1 47 2.6 40 2.2 26 78 4.0 81 4.2 78 4.0 64 3.5 68 3.7 25 109 5.6 99 5.1 124 6.4 94 5.2 110 6.1 24 150 7.7 162 8.4 153 7.9 119 6.6 124 6.8 23 188 9.7 187 9.6 171 8.8 163 9.0 141 7.8 22 243 12.5 236 12.2 248 12.8 177 9.7 204 11.2 21 212 10.9 206 10.6 253 13.0 217 11.9 262 14.4 20 205 10.6 215 11.1 236 12.2 240 13.2 265 14.6 19 165 8.5 205 10.6 231 11.9 204 11.2 204 11.2 18 202 10.4 196 10.1 206 10.6 173 9.5 174 9.6 17 99 5.1 113 5.8 111 5.7 104 5.7 113 6.2 16 & Below 60 3.1 71 3.7 70 3.6 87 4.8 85 4.7
SUBTOTAL 1,863 96.1 1,904 97.1 2,025 97.1 1,765 97.2 1,873 97.5
No Official Score 76 3.9 57 2.9 60 2.9 51 2.8 49 2.5
TOTAL 1,939 100.0 1,961 100.0 2,085 100.0 1,816 100.0 1,922 100.0
OAS Admits 367 18.9 334 17.0 296 14.2 301 16.6 18.7 1.0
Mean Score-Regular Admits 22.4 -- 22.1 -- 21.9 -- 21.7 -- 21.6 --
Mean Score-AllWIU First-Time 21.6 -- 21.4 -- 21.4 -- 21.2 -- 21.2 -- Freshmen
Nat'l Avg.-- 20.8 -- 20.8 -- 20.9 -- 20.9 21.1
OAS - Office of Academic Services

Figure 5. First-Time Freshmen Mean ACT Scores Fall Terms 2002-2006
22.4 22.1 21.9 21.7 21.621.6 21.4 21.4 21.2 21.2
0
5
10
15
20
25
2002 2003 2004 2005 2006
Regular Admits All Admits

TABLE 22. MACOMB CAMPUS DISTRIBUTION OF ILLINOIS FIRST-TIME FRESHMEN BY HOME COUNTY, FALL TERMS 2002-2006
County 2002 2003 2004 2005 2006
Adams 59 40 33 30 29Alexander - - - 2 1Bond 1 1 2 1 1Boone 8 9 9 3 12Brown 2 4 5 7 2Bureau 8 3 16 14 10Calhoun - 1 1 - 3Carroll 7 7 6 6 2Cass 9 10 9 7 9Champaign 12 8 8 6 4Christian 7 3 4 3 3Clark - - - - -Clay - 2 - - -Clinton 4 3 2 - 2Coles 3 1 1 - -Cook 417 486 514 426 501Crawford - - 1 1 3Cumberland - - 2 1 1DeKalb 24 13 8 10 14DeWitt 2 2 2 2 3Douglas - 2 - - -DuPage 183 232 249 217 220Edgar 1 - 1 - -Edwards - - - - -Effingham 1 1 - - 1Fayette 1 - - - 1Ford - 3 2 - 1Franklin - - - - -Fulton 31 18 23 22 29Gallatin - - - 1 -Greene 4 4 6 2 4Grundy 9 17 9 3 16Hamilton - 1 - - -Hancock 37 27 28 28 30Hardin - - - - -Henderson 9 7 16 7 8Henry 19 10 17 14 39Iroquois 8 2 2 7 2Jackson 1 - 1 1 -Jasper - - - 1 -Jefferson - - - 1 1Jersey - 1 - 4 3JoDaviess 6 10 11 3 9Johnson - - - - -Kane 108 108 112 115 86Kankakee 7 2 10 5 8Kendall 24 15 8 8 26Knox 19 30 16 28 14Lake 114 121 128 160 113LaSalle 18 23 16 12 13Lawrence - - - - -Lee 12 8 7 17 18Livingston 7 5 5 3 6Logan 15 7 13 15 16

TABLE 22. (Continued)
County 2002 2003 2004 2005 2006
McDonough 81 82 103 85 62McHenry 60 64 81 54 65McLean 13 17 17 12 12Macon 12 6 14 11 7Macoupin 15 11 7 10 9Madison 23 19 17 11 18Marion - - - 1 -Marshall 2 - - - 1Mason 8 4 3 10 8Massac - - - - -Menard 4 6 3 7 5Mercer 11 14 9 5 8Monroe 3 5 3 2 -Montgomery 3 2 3 1 2Morgan 22 6 17 21 13Moultrie 1 - - - -Ogle 25 14 28 9 11Peoria 54 51 41 27 27Perry 1 - - 2 -Piatt 1 - 1 2 5Pike 13 12 14 9 9Pope - - - - -Pulaski - - - - -Putnam 2 1 2 5 3Randolph - - - - -Richland - - - 1 -Rock Island 25 45 36 27 31St. Clair 6 18 11 12 6Saline - 1 - - -Sangamon 37 36 38 33 34Schuyler 4 1 15 7 11Scott 2 6 3 4 2Shelby - 1 1 - -Stark 4 4 1 2 4Stephenson 20 9 11 6 10Tazewell 29 31 17 23 21Union 1 - - - 1Vermilion 2 1 1 1 3Wabash - - - - 3Warren 22 17 20 11 15Washington 1 1 - - -Wayne - - - - -White 3 1 - - -Whiteside 30 14 21 14 21Will 68 78 112 80 104Williamson 1 - 1 1 3Winnebago 51 43 45 28 41Woodford 4 2 4 3 4
TOTALS 1,861 1,870 2,003 1,730 1,843
%Inc (Dec) over Prev Yr 14.9% 0.5% 7.1% -13.6% 6.5%
Total as % of on-campusHDCT enrollment 17.0% 17.0% 17.9% 15.3% 16.2%
NOTE: Top five 2006 counties are highlighted.Students from 74 Illinois counties.

TRANSFER AND GRADUATE PROFILES
Selected characteristics of Fall 2006 transfer students are shown in Table 23.Programs with the largest number of transfer majors include law enforcement and justiceadministration (236), elementary education (125), and agriculture (68). The majors withthe highest transfer enrollment by location include law enforcement and justiceadministration at the Macomb campus (272), elementary education in the Quad Cities37) and the Board of Trustees bachelor of arts at extension locations (39). Of the 1,203transfers, 1,219 are enrolled at the Macomb campus, 154 are enrolled in the Quad Citiesand 50 are enrolled at extension locations. Forty-eight percent of the total transferstudents transferred to WIU at the junior level. Black Hawk College-Quad Cities sent134 transfer students to WIU, while Spoon River College sent 100 and Carl SandburgCollege sent 73.
Transfer student enrollment for Macomb and off-campus (Table 24) increasedfrom 1,403 in 2005 to 1,423 in 2006. Transfer students from junior/community collegesin Illinois increased 1.8 percent from Fall 2005 to Fall 2006.
A profile of 2006 graduate students is shown in Table 25. Graduate enrollmenttotaled 2,268 in Fall 2006, up from 2,120 in Fall 2005. Almost 65 percent of thesegraduate students were enrolled part-time (less than 9 hours). New graduate studentenrollment totaled 705 for Fall 2006 (up 10.3 percent from Fall 2005). A total of 227new graduate students indicated that WIU was their previous school, while 182indicated their previous school was an “other” Illinois school and 185 indicated theirprevious school was out-of-state
Graduate and teaching assistants totaled 492 in Fall 2006. This is up from 468in Fall 2005. The average age of a WIU graduate student is 32.0, down slightly from32.1 in Fall 2005. Approximately 24 percent of the total female graduate students areage 40 or over compared to 18.9 percent of the total male graduate students in the sameage category.

TABLE 23. NEW TRANSFER PROFILE, FALL 2006
TOP TEN MAJORS OF TRANSFER STUDENTS MOST POPULAR TRANSFER MAJOR BY LOCATION
LEJA/Pre-LEJA 236 Macomb: LEJA/Pre-LEJA 222 Elementary Education/Pre-El Ed 125 Quad CitiesElementary Education/Pre El Ed 37 Agriculture 68 Extension: Board of Trustees 39 Board of Trustees 68Psychology 67 TRANSFERS BY LOCATIONKinesiology 62General Orientation 50 Macomb 1,219 History 48 Quad Cities 154 Pre-Business Management 47 Extension 50 Pre-Business Accounting 39
TOTAL TRANSFERS: 1,423
DISTRIBUTION BY RACE, CLASS AND SEX
Freshmen Sophomore Junior Senior Total TOTALM F M F M F M F M F
White 101 74 178 125 298 241 43 37 620 477 1,097 Black 17 16 10 15 16 20 4 1 47 52 99 Hispanic 11 3 14 1 17 16 1 4 43 24 67 Asian Ame 1 2 2 - 7 1 - - 10 3 13 Amer. Ind. - - - 3 4 4 1 - 5 7 12 Foreign - - 1 1 5 7 3 - 9 8 17 Other 14 7 24 11 31 23 7 1 76 42 118
TOTAL 144 102 229 156 378 312 59 43 810 613 1,423 GRAND TOTAL 246 385 690 102 1,423
TOP TEN TRANSFER COLLEGES TRANSFERS BY FULL-TIME/PART-TIME
Black Hawk College-Quad Cities 134 Full-Time 1,275 Spoon River College 100 Part-Time 148 Carl Sandburg College 73Illinois Central College 66College of DuPage 60 TOTAL TRANSFERS 1,423 John Wood Comm College 53Southeastern Comm College 51Black Hawk College-East 46Scott Comm College 39Lincoln College 38Wm. Rainey Harper College 38

TABLE 24. SUMMARY OF NEW TRANSFER STUDENT ORIGIN, FALL TERMS 2002-2006*
% DIFF Year Origin FR SO JR SR TOTAL PREV
YEAR 2002 Quad Cities Transfers 1 12 113 27 153 -17.7%
Extension Transfers 4 5 28 23 60 -25.0%Macomb Campus Transfers Jr/Community Colleges in IL 170 233 390 26 819 Senior Colleges in IL 39 40 25 17 121 Colleges in Other States 47 77 126 24 274 TOTAL MACOMB CAMPUS 256 350 541 67 1,214 9.5% GRAND TOTAL 257 362 654 94 1,427 3.8%
2003 Quad Cities Transfers 4 11 92 34 141 -7.8%Extension Transfers 3 8 28 19 58 -3.3%Macomb Campus Transfers Jr/Community Colleges in IL 162 264 375 24 825 Senior Colleges in IL 33 47 18 15 113 Colleges in Other States 44 61 107 14 226 TOTAL MACOMB CAMPUS 239 372 500 53 1,164 -4.1% GRAND TOTAL 246 391 620 106 1,363 -4.5%
2004 Quad Cities Transfers 4 10 93 35 142 0.7%Extension Transfers 4 8 28 27 67 15.5%Macomb Campus Transfers Jr/Community Colleges in IL 170 266 380 19 835 Senior Colleges in IL 31 39 26 15 111 Colleges in Other States 58 53 98 11 220 TOTAL MACOMB CAMPUS 259 358 504 45 1,166 0.2% GRAND TOTAL 267 376 625 107 1,375 0.9%
2005 Quad Cities Transfers 2 8 92 28 130 -8.5%Extension Transfers 3 4 17 8 32 -52.2%Macomb Campus Transfers Jr/Community Colleges in IL 162 267 406 34 869 Senior Colleges in IL 23 38 32 13 106 Colleges in Other States 53 61 130 22 266 TOTAL MACOMB CAMPUS 238 366 568 69 1,241 6.4% GRAND TOTAL 240 374 660 97 1,403 2.0%
2006 Quad Cities Transfers 1 6 110 37 154 18.5%Extension Transfers 1 5 25 19 50 56.3%Macomb Campus Transfers Jr/Community Colleges in IL 170 288 409 18 885 Senior Colleges in IL 28 33 30 12 103 Colleges in Other States 46 53 116 16 231 TOTAL MACOMB CAMPUS 244 374 555 46 1,219 -1.8% GRAND TOTAL 245 380 665 83 1,423 1.4%
*Includes transfer students with matriculation dates of June and August

TABLE 25. WESTERN ILLINOIS UNIVERSITY GRADUATE PROFILE, FALL 2006
TOTAL GRADUATE STUDENT ENROLLMENT BY COLLEGENew
Total Out-of- Graduate On-Campus Off-Campus Graduates Full-Time# Part-Time In-State State International Students
Arts and Sciences 294 50 344 222 122 235 53 56 112 Business and Technology 207 72 279 185 94 150 23 106 125 Education and Human Services 258 930 1,188 275 913 924 240 24 282 Fine Arts and Communication 130 - 130 117 13 84 36 10 69 Other* 121 206 327 32 295 245 53 29 117
TOTAL 1,010 1,258 2,268 831 1,437 1,638 405 225 705 *Includes unclassified, advanced graduates and WESL.#Full-Time = 9 or more credit hours.
GRADUATE ASSISTANTS BY COLLEGE/AREA NEW GRADUATE STUDENTS, BY COLLEGE/PREVIOUS SCHOOLQuad Cities Macomb Other U.S.
Arts and Sciences 1 81 WIU IL Non-IL InternationalBusiness and Technology 2 38 Education and Human Services 8 40 Arts & Sciences 46 24 27 15Fine Arts and Communication - 51 Business & Technology 34 11 22 58Planning Budget & Institut. Res. - 1 Education & Human Serv 94 89 90 9Provost 1 38 Fine Arts & Comm 17 20 27 5Libraries - 3 Other 36 38 19 24VP Adm. Services - - VP Adv. & Pub. Services - 2 TOTAL 227 182 185 111VP Student Services - 56 Total New Grad Students 705Extended Studies - 6 University Housing & Dining - 21 Union - 1 AGE OF TOTAL GRADUATE STUDENTSCampus Recreation - 13 Restricted Funds - 68 Full-Time Part-TimeAdministrative Support - 9 M F M FPhysical Plant - - 18-21 13 14 1 1Total Graduate Assistants 12 428 22-24 227 239 56 96
25-29 105 85 97 283Teaching Assistants 30-34 40 21 93 164 Arts & Sciences - 25 35-39 23 10 99 109 Business & Technology - 10 40-49 16 22 104 175 Education & Human Services - 12 50-64 6 8 45 109 Fine Arts & Communication - 3 65+ 1 1 4 1 Restricted Funds - 2 Unknown - - - - Total Teaching Assistants - 52
TOTAL 431 400 499 938GRAND TOTAL 12 480
AVERAGE AGE: 32

MAJORS AND DEGREES
Total Fall 2006 headcount enrollment by degree program, race, sex and studentlevel is shown in Table 26.
The number of undergraduate majors (Table 28) increased from Fall 2005 to Fall2006 in the College of Business and Technology (3.0%) and the College of Fine Arts andCommunication (1.0%). Small decreases in enrollment occurred in the College of Arts andSciences (0.1%) and the College of Education & Human Services (0.3%). Programs withthe largest number of majors include law enforcement and justice administration(including pre-LEJA, 1,682), elementary education (including pre-el ed, 784) Board ofTrustees bachelor of arts (452), psychology (405), and biology (391). Table 29 shows thenumber of undergraduates with second majors. The second majors with highestenrollment include Spanish (38), psychology (29), sociology (24), political science (11), andmusic (10).
The total number of undergraduate students by minor is listed in Table 30. Theminors with the greatest enrollment include management (470), sociology (346),psychology (289), marketing (281), and law enforcement and justice administration (224).
The number of graduate majors (Table 31) decreased overall by 14.3 percent.Programs with the highest number of majors include reading (200), educationalleadership (176), business administration (130), and counseling and guidance (127), andlaw enforcement and justice administration (102).
Degrees conferred between July 1, 2005 and June 30, 2006 by degree program,race and sex are shown in Table 32. Undergraduate degrees conferred totaled 2,285 andgraduate and advanced degrees conferred totaled 559.
The total number of degrees conferred in FY2006 (Table 33) decreased by 7.1percent from FY2005. Bachelor degrees conferred decreased from 2,376 to 2,285, or 3.8percent, while the master's degree level decreased from 653 to 541, or 17.2 percent.Specialist degrees conferred decreased from 31 in FY2005 to 18 in FY2006.

TABLE 26. TOTAL HEADCOUNT ENROLLMENT BY DEGREE PROGRAM, RACE, SEX AND STUDENT LEVEL, FALL 2006
Non-resid. Black Amer. Indian/ Asian/ WhiteAlien Non-Hisp. Alaskan Native Pac. Islander Hispanic Non-Hisp. Unknown Total
Degree Program Men Women Men Women Men Women Men Women Men Women Men Women Men Women Men WomenUndeclared/Unclassified Undergraduates 35 8 38 28 - 3 5 8 24 12 428 338 33 25 563 422 B.S. in Agriculture - - 1 2 2 2 - - - - 221 76 13 3 237 83 B.A. in African-American Studies 1 - 5 9 - - - - - 1 - 1 - - 6 11 B.A. in Women's Studies - 1 - - - - - - - - - 18 - - - 19 B.A. in Communication 1 2 22 12 - 1 4 3 7 8 149 154 9 7 192 187 B.A. in Journalism - - 7 10 - - - - 4 2 49 57 4 2 64 71 B.A. in Broadcasting - 2 19 15 - 1 2 1 10 - 88 44 9 2 128 65 B.S. in Graphic Communication 1 2 4 2 - 1 1 - 5 1 49 50 7 2 67 58 B.S. in Computer Science 12 1 19 3 - - 1 - 5 - 98 11 11 1 146 16 B.S. in Telecommunications Management - - - - - - - - - - - - - - - - B.S.Ed. in Bilingual/Bicultural Education - - - 1 - - - - 2 18 - 22 - 3 2 44 B.S. in Instructional Design & Technology 2 1 8 2 - - 2 2 - 1 28 10 1 - 41 16 B.S.Ed. in Special Education - - 1 6 - 1 - 1 2 7 36 171 5 7 44 193 B.S.Ed. in Elementary Education - - 2 24 - 4 - 5 2 19 65 634 7 22 76 708 B.S. in Community Health - - 1 2 - - - - - - 2 9 - 1 3 12 B.S. in Industrial Technology - - - - - - - - - - - - - - - - B.S. in Manufacturing Engineering Tech 2 - 13 1 - - 2 - 1 1 81 2 6 - 105 4 B.A. in French - - - - - - 1 - - - 1 5 - 1 2 6 B.A. in Spanish - - 2 1 - - - - 7 1 4 28 1 - 14 30 B.S. in Family and Consumer Sciences 1 5 8 16 - - 2 3 4 9 49 270 2 14 66 317 B.A. in English - - 1 16 1 - 3 1 - 3 66 118 4 10 75 148 Board of Trustees Bachelor of Arts - - 18 18 1 1 1 - 5 5 172 201 16 14 213 239 B.A. and B.S. in Interdisciplinary Studies - 2 1 1 - - - - - - 28 22 1 1 30 26 B.S. in Biology 2 3 13 41 2 - 5 6 5 11 160 239 21 10 208 310 B.S. in Mathematics 2 - 2 2 - - 1 2 3 2 42 35 3 3 53 44 B.S. in Recreation Park and Tourism Admin - 1 4 4 - 1 1 - 4 4 106 102 7 5 122 117 B.S. in Kinesiology 7 4 19 11 - - 2 2 12 5 259 138 17 9 316 169 B.A. in Philosophy - - 1 - - - 1 - 1 1 12 6 3 - 18 7 B.S. in Meteorology 1 1 1 1 1 1 - - 2 - 29 22 - 1 34 26 B.S. in Chemistry 2 1 4 3 - - 2 - - 4 21 28 2 - 31 36 B.S. in Forensic Chemistry - - - 3 - - - - - - 8 19 1 1 9 23 B.S. in Geology - - - - - - - 1 - - 17 3 2 1 19 5 B.S. in Physics - - - 1 - - - - 1 - 14 1 3 1 18 3 B.S. in Psychology - 1 6 30 - 1 2 6 4 12 85 233 7 18 104 301 B.S. in Law Enforcement and Justice Admin 1 2 51 30 5 5 15 3 76 37 1,054 303 78 22 1,280 402 B.S. in Emergency Management - - - - - - - - - - - - - - - - Bachelor of Social Work - 1 4 23 - 1 - - 2 8 13 147 1 4 20 184 B.A. in Economics 1 - 1 - - - - - - - 13 1 2 - 17 1 B.S. in Geography - - - - - - 1 - 1 - 17 - 1 - 20 - B.A. in Political Science - 1 7 8 - - 1 1 8 1 77 39 2 2 95 52

TABLE 26. (Continued)
Non-resid. Black Amer. Indian/ Asian/ White Alien Non-Hisp. Alaskan Native Pac. Islander Hispanic Non-Hisp. Unknown Total
Degree Program Men Women Men Women Men Women Men Women Men Women Men Women Men Women Men Women B.A. in Sociology - 3 9 13 - - 2 2 1 3 48 58 4 2 64 81 B.A. in Theatre - - 1 1 - - - 1 - 1 25 17 2 3 28 23 B.A. in Art - 1 5 1 - 1 3 - 3 3 39 67 7 6 57 79 Bachelor of Fine Arts in Art - 1 - - - - 1 1 1 - 2 6 1 - 5 8 B.A. in Music 2 - 4 5 1 - 2 2 1 3 49 65 2 6 61 81 Bachelor of Music 1 1 1 1 - - - - 1 1 32 26 1 1 36 30 B.F.A. in Musical Theatre - - 2 - - 1 - - 1 - 4 14 1 1 8 16 B.S. in Communication Sciences and Disorders - - - 1 - - - - - 1 1 58 - 1 1 61 B.S. in Health Services Management - - 3 4 - - 1 - 1 2 6 18 1 2 12 26 B.S. in Clinical Laboratory Science - - 1 - - - - - - - 2 4 - 1 3 5 B.B. in Management 4 4 21 19 1 - 3 2 14 8 221 133 17 7 281 173 B.B. in Supply Chain Management - 2 - - - - - - - - 26 13 1 - 27 15 B.B. in Accountancy 3 - 12 11 1 2 3 2 5 4 123 120 7 2 154 141 B.B. in Economics 2 1 - - - - - 1 - 1 14 5 2 1 18 9 B.B. in Finance 2 - 7 2 1 1 5 2 5 2 98 40 5 3 123 50 B.B. in Human Resource Management - - - 3 - - - - 1 2 6 17 - 1 7 23 B.B. in Information Management 2 - 1 - - - - - 1 - 35 7 3 - 42 7 B.B. in Marketing 1 1 12 8 1 1 2 2 5 2 122 112 9 5 152 131 B.S. in Construction Management - - 12 2 - - 1 - 6 - 197 2 6 1 222 5 B.A. in History - - 6 3 - 1 - 2 6 2 180 56 15 5 207 69
TOTAL BACHELORS AND UNCLASSIFIED/UNDECLARED UNDERGRADUATES 88 53 380 400 17 30 78 62 249 208 4,771 4,395 363 240 5,946 5,388
Undeclared/Unclassified Graduates 20 9 1 8 1 1 2 3 3 6 85 159 16 12 128 198 M.A. in Broadcasting - 2 - 2 1 - - - - - 4 10 1 1 6 15 M.S. in Computer Science 43 15 - - - - - 1 - - 16 2 2 - 61 18 M.S.Ed. in Ed. Admin and Supervision 1 - 2 3 - - - - 1 3 78 80 4 4 86 90 M.S. in Instructional Design & Technology 4 2 - 4 - - 1 3 - - 28 37 2 1 35 47 M.S.Ed. in Educ. and Interdisciplinary Studies - 1 - 2 - - - - 1 2 12 31 2 - 15 36 M.S.Ed. in Special Education - - - 1 - - - - - 1 6 35 - 3 6 40 M.S.Ed. in Counseling - 1 1 5 - 1 - 1 - 6 16 70 1 - 18 84 M.S. in College Student Personnel 1 5 1 2 - - - - - 2 10 19 - - 12 28 M.S.Ed. in Elementary Education - - - - - - - - - 3 11 102 1 4 12 109 M.A.T. (Secondary Education) - - - - - - - - - - 5 3 2 - 7 3 M.S. in Health Education 1 3 1 - - - - - - 1 8 34 1 5 11 43

TABLE 26. (Continued)
Non-resid. Black Amer. Indian/ Asian/ White Alien Non-Hisp. Alaskan Native Pac. Islander Hispanic Non-Hisp. Unknown Total
Degree Program Men Women Men Women Men Women Men Women Men Women Men Women Men Women Men Women M.S.Ed. in Reading - - - 3 - - - - - 3 4 179 1 10 5 195 M.S. in Manufacturing Engineering Systems 11 - - - - - - - 1 - 9 2 - - 21 2 M.A. in English - 1 1 2 - - - 1 1 - 9 25 2 1 13 30 M.S. in Biology - 1 - 2 - - - 1 - 2 21 30 4 2 25 38 M.S. in Mathematics 4 - 1 - - - - - - - 3 1 1 - 9 1 M.A. in Gerontology - - - - - - - - - - - - - - - - M.S. in Recreation, Park and Tourism Admin 1 1 1 - - - 1 1 - - 19 8 - 2 22 12 M.S. in Sport Management 1 - 2 - - - - - 1 1 28 16 1 - 33 17 M.S. in Kinesiology - 1 - - - 1 - - 1 - 13 15 - - 14 17 M.S. in Chemistry 15 9 1 - - - 1 - - - 1 2 - - 18 11 M.S. in Physics 7 1 - - - - - - - - 5 - - - 12 1 M.S. in Psychology - 1 - - - - - - - 1 11 20 1 1 12 23 M.A. in Law Enforcement and Justice Admin - 1 - 5 - - 1 - 2 1 64 26 1 1 68 34 M.A. in Economics 18 3 2 - - - - - - - 5 2 1 - 26 5 M.A. in Geography 5 1 2 - - - 1 - - - 8 1 - 1 16 3 M.A. in Political Science 8 2 3 1 - - - - 1 1 6 2 2 1 20 7 M.A. in Sociology - 1 2 1 - - - 1 1 - 9 12 - 1 12 16 M.F.A. in Theatre - - - 2 - - - - 1 - 17 9 1 1 19 12 M.M. in Music 2 3 - - - - - - - - 10 10 2 - 14 13 M.S. in Communication Sciences and Disorders - 3 - 1 - - - - - 1 - 46 - - - 51 Master of Business Administration 8 3 3 1 - - - 1 1 2 56 47 6 2 74 56 Master of Accountancy 3 2 - - - - - - - - 6 5 - - 9 7 M.A. in History - - - 1 - - - - - - 24 8 2 1 26 10
TOTAL MASTERS AND UNCLASSIFIED/UNDECLARED GRADUATES 153 72 24 46 2 3 7 13 15 36 607 1,048 57 54 865 1,272
Specialist in School Psychology - - - - - - - - - - 8 19 - 1 8 20 Ed.S. in Educational Leadership - - 1 1 - - - - - - 32 20 7 - 40 21 Ed.D. in Educational Admin. - - - - - - - - - - 12 7 - 3 12 10 Post-Bacc. Cert in Community Development - - - - - - - - - - - - - - - - Post-Bacc. Cert. in African & African Diaspora World Studies - - - - - - - - - - - - 1 - 1 - Post-Bacc. Cert in Applied Mathematics - - - - - - - - - - - - - - - - Post-Bacc. Cert. in Health Services Admin - - - - - - - - - - - 2 - 1 - 3 Post-Bacc. Cert. in Police Executive Adm. - - - - - - - - - - - - - - - - Post-Bacc. Cert. in Public & Non-Profit Mgt. - - - - - - - - - - - - - - - - Post-Bacc. Cert in Instruct. Design & Tech. - - - - - - - - - - 1 2 - - 1 2 Post-Bacc. Cert in Zoo/Aquarium Studies - - - - - - - - - - 3 7 - - 3 7 Post-Bacc. Cert in Women's Studies - - - - - - - - - - - 3 - - - 3
TOTAL ADVANCED CERTIFICATES - - 1 1 - - - - - - 56 60 8 5 65 66
TOTAL GRADUATE AND ADVANCED CERTIFICATES 153 72 25 47 2 3 7 13 15 36 663 1,108 65 59 930 1,338
TOTAL HEADCOUNT ENROLLMENT 241 125 405 447 19 33 85 75 264 244 5,434 5,503 428 299 6,876 6,726
NOTE: ENROLLMENTS INCLUDE MACOMB CAMPUS, QUAD CITIES CAMPUS, HOME-STUDY, AND COST RECOVERY HEADCOUNTS

TABLE 27. QUAD CITIES CAMPUS TOTAL HEADCOUNT ENROLLMENT BY DEGREE PROGRAM, RACE, SEX AND STUDENT LEVEL, FALL 2006
Non-resid. Black Amer. Indian/ Asian/ WhiteAlien Non-Hisp. Alaskan Native Pac. Islander Hispanic Non-Hisp. Unknown Total
Degree Program Men Women Men Women Men Women Men Women Men Women Men Women Men Women Men WomenUndeclared/Unclassified Undergraduates - - - - - - - - - 1 6 21 1 - 7 22 B.A. in Communication - - - - - - - - 1 - - - - - 1 - B.S.Ed. in Elementary Education - - - 6 - - - - 1 5 13 107 3 7 17 125 B.S. Ed. In Special Education - - - - - - - - - - - 1 1 - 1 1 B.S. in Manufacturing Engineering Tech - - 1 - - - - - - - 18 2 1 - 20 2 B.A. in English - - - - - - - - - - - 1 - - - 1 Board of Trustees Bachelor of Arts - - 6 4 - - - - - 4 25 62 5 4 36 74 B.S. in Biological Science - - - - - - - - - - - 1 - - - 1 B.S. in Recreation Park and Tourism Admin - 1 - - - 1 - - - - 6 15 2 - 8 17 B.S. in Psychology - - - - - - - - - 1 - - - - - 1 B.S. in Law Enforcement and Justice Admin - - - 2 1 - - - 2 2 23 19 3 5 29 28 B.A. in Economics 1 - - - - - - - - - - - - - 1 - B.A. in Music - - - - - - - - - - 1 - - - 1 - B.S. in Health Services Management - - - - - - - - - - 1 - - - 1 - B.B. in Finance - - - - - - - - - - 1 - - - 1 - B.B. in Management 1 - 1 4 - - 1 - 7 5 33 42 4 2 47 53 B.B. in Accountancy - - 1 2 1 1 1 - 2 1 20 35 2 1 27 40 B.B. in Information Management - - - - - - - - - - 13 4 2 - 15 4 B.B. in Marketing - - - - 1 - - 1 2 1 4 20 1 2 8 24 B.S. in Construction Management - - - - - - - - - - 1 - - - 1 -
TOTAL BACHELORS AND UNCLASSIFIED/UNDECLARED UNDERGRADUATES 2 1 9 18 3 2 2 1 15 20 165 330 25 21 221 393
Undeclared/Unclassified Graduates - - - 5 1 1 - 2 2 2 21 67 1 3 25 80 M.S.Ed. in Educational Admin and Supervision 1 - 1 3 - - - - 1 2 57 49 2 3 62 57 M.S. in Instructional Design & Technology - - - - - - - - - - - - - - - - M.S.Ed. in Educ. and Interdisciplinary Studies - - - 2 - - - - 1 1 3 11 1 - 5 14 M.S.Ed. in Special Education - - - 1 - - - - - 1 6 34 - 3 6 39 M.S.Ed. in Counselor Education - 1 1 5 - 1 - 1 - 6 16 69 1 - 18 83 M.S.Ed. in Elementary Education - - - - - - - - - 2 5 39 - 1 5 42 M.A.T. (Secondary Education) - - - - - - - - - - 1 - - - 1 - M.S. in Health Education and Promotion - - - - - - - - - - 1 14 - 1 1 15 M.S. in Kinesiology - - - - - - - - - - 2 1 - - 2 1 M.S.Ed. in Reading - - - 1 - - - - - 2 3 76 - 2 3 81 M.A. in English - - - 1 - - - - 1 - 2 11 - - 3 12 M.S. in Biology - - - 1 - - - - - 1 1 10 - - 1 12 M.S. in Recreation, Park and Tourism Admin - - - - - - - - - - - - - - - - M.S. in Sport Management - - - - - - - - - 1 6 1 1 - 7 2 M.A. in Law Enforcement and Justice Admin - - - 1 - - - - 1 - 5 3 - - 6 4 M.A. in Sociology - - 1 - - - - - - - - - - - 1 - Master of Business Administration 1 2 1 - - - - - - 1 25 29 3 1 30 33 Master of Accountancy - - - - - - - - - - 1 3 - - 1 3
TOTAL MASTERS AND UNCLASSIFIED/UNDECLARED GRADUATES 2 3 4 20 1 2 - 3 6 19 155 417 9 14 177 478
Post-Bacc. Cert. in Health Services Admin - - - - - - - - - - - 1 - - - 1 Post-Bacc. Cert. in Police Executive - - - - - - - - - - - - - - - - Ed.S. in Educational Admin & Supervision - - 1 1 - - - - - - 18 13 4 - 23 14 Ed.D. in Educational Admin. - - - - - - - - - - 12 7 - 3 12 10 Post-Bacc. Cert in Instruct. Design & Technology - - - - - - - - - - - 1 - - - 1 Post-Bacc. Cert in Women's Studies - - - - - - - - - - - 1 - - - 1 Post-Bacc. Cert in Zoo/Aquarium Studies - - - - - - - - - - - - - - - -
TOTAL ADVANCED CERTIFICATES - - 1 1 - - - - - - 30 23 4 3 35 27
TOTAL GRADUATE AND ADVANCED CERTIFICATES 2 3 5 21 1 2 - 3 6 19 185 440 13 17 212 505
TOTAL HEADCOUNT ENROLLMENT 4 4 14 39 4 4 2 4 21 39 350 770 38 38 433 898

TABLE 28. NUMBER OF UNDERGRADUATE MAJORS BY COLLEGE, FALL TERMS 2002-2006*
Fall 2002 Fall 2003 Fall 2004 Fall 2005 Fall 2006 Major M F Total M F Total M F Total M F Total M F Total
COLLEGE OF ARTS & SCIENCES African-American Studies - - - 2 5 7 3 4 7 3 9 12 6 11 17 Biology 111 188 299 114 219 333 127 254 381 138 249 387 166 225 391 Biology Ed 8 13 21 5 11 16 10 11 21 12 14 26 12 13 25 Chemistry 13 16 29 19 19 38 21 21 42 22 22 44 18 18 36 Chemistry Ed 2 - 2 2 - 2 1 2 3 3 2 5 2 3 5 Clinical Laboratory 2 15 17 3 13 16 4 9 13 5 10 15 3 5 8 Economics 25 4 29 17 6 23 13 4 17 21 3 24 17 1 18 English 38 64 102 50 72 122 55 77 132 44 64 108 48 62 110 English Ed 35 81 116 24 71 95 34 70 104 28 80 108 27 86 113 French 1 3 4 - 4 4 - 4 4 1 5 6 2 3 5 Forensic Chemistry - - - - - - - - - - - - 9 23 32 French Ed - 3 3 1 3 4 1 1 2 1 3 4 - 3 3 Geography 23 9 32 23 3 26 16 3 19 20 1 21 20 - 20 Geography Ed 2 3 5 1 1 2 - - - - - - - - - Geology 13 5 18 20 6 26 18 4 22 21 5 26 19 5 24 History 69 21 90 78 22 100 95 26 121 80 29 109 69 22 91 History Ed 99 45 144 119 38 157 113 46 159 119 48 167 138 47 185 Journalism 47 70 117 36 68 104 43 71 114 51 74 125 64 71 135 Mathematics 12 9 21 16 7 23 10 8 18 9 8 17 9 7 16 Mathematics Ed 18 30 48 24 41 65 32 34 66 25 37 62 16 30 46 Meteorology - - - 6 3 9 13 9 22 20 18 38 34 26 60 Philosophy 15 4 19 13 5 18 14 10 24 18 9 27 18 7 25 Physics 17 1 18 14 2 16 22 - 22 21 1 22 14 1 15 Physics Ed 2 - 2 1 - 1 1 1 2 4 1 5 4 2 6 Political Science 93 67 160 91 57 148 78 56 134 88 58 146 95 52 147 Political Science Ed 5 2 7 3 1 4 - - - - - - - - - Pre-Architecture 9 2 11 9 2 11 10 5 15 5 3 8 3 4 7 Pre-Chemical Eng 3 2 5 5 - 5 6 - 6 3 1 4 3 - 3 Pre-Dentistry 4 5 9 6 9 15 4 3 7 5 2 7 2 4 6 Pre-Engineering 37 5 42 45 5 50 36 3 39 20 2 22 25 3 28 Pre-Medical 17 26 43 14 27 41 18 23 41 12 15 27 8 15 23 Pre-Nursing 2 18 20 1 33 34 5 58 63 2 51 53 1 32 33 Pre-Optometry 2 - 2 2 - 2 - 2 2 2 - 2 1 2 3 Pre-Pharmacy 8 23 31 9 27 36 13 19 32 7 24 31 8 15 23 Pre-Physical Therapy 7 18 25 3 16 19 7 10 17 11 13 24 18 19 37 Psychology 110 323 433 115 320 435 129 347 476 123 324 447 104 301 405 Psychology Ed 2 3 5 - 1 1 - - - - - - - - -

TABLE 28. (Continued)
Fall 2002 Fall 2003 Fall 2004 Fall 2005 Fall 2006 Major M F Total M F Total M F Total M F Total M F Total
COLLEGE OF ARTS & SCIENCES (Continued) Sociology 35 80 115 43 70 113 48 74 122 59 76 135 64 81 145 Spanish 7 17 24 6 16 22 8 9 17 12 12 24 10 23 33 Spanish Ed 3 11 14 3 11 14 5 11 16 4 7 11 4 7 11 Women's Studies 2 9 11 1 8 9 1 7 8 1 12 13 - 19 19 TOTAL ARTS & SCIENCES 898 1,195 2,093 944 1,222 2,166 1,014 1,296 2,310 1,020 1,292 2,312 1,061 1,248 2,309
COLLEGE OF BUSINESS AND TECHNOLOGY Accountancy 26 59 85 28 59 87 36 56 92 37 65 102 39 59 98 Pre-Accountancy 72 124 196 86 117 203 98 94 192 99 88 187 115 82 197 Agriculture Sci 211 43 254 184 50 234 186 41 227 200 55 255 227 67 294 Ag Sci Ed 12 8 20 14 7 21 17 9 26 9 14 23 8 9 17 Computer Science 316 46 362 285 32 317 221 27 248 174 18 192 146 16 162 Construction Management - - - - - - 69 3 72 148 3 151 222 5 227 Economics 10 4 14 10 3 13 9 5 14 6 6 12 6 5 11 Pre-Economics 13 6 19 13 9 22 14 3 17 13 4 17 12 4 16 Finance 31 26 57 33 18 51 51 17 68 42 20 62 52 22 74 Pre-Finance 58 23 81 71 26 97 55 30 85 54 26 80 71 28 99 Graphic Communication 36 49 85 57 49 106 53 52 105 58 54 112 67 58 125 Human Resource Mgt 1 7 8 1 11 12 2 10 12 2 10 12 1 7 8 Pre-Human Resource Mgt 5 28 33 6 21 27 7 18 25 6 14 20 6 16 22 Industrial Technology 3 3 6 - 1 1 2 - 2 1 - 1 - - - Information Management 32 20 52 32 11 43 26 7 33 18 7 25 17 4 21 Pre-Info Management 60 26 86 35 14 49 34 5 39 29 6 35 25 3 28 Management (Gen. Bus.) 50 32 82 48 45 93 54 55 109 71 58 129 68 54 122 Pre-Management 126 87 213 173 95 268 182 111 293 184 115 299 181 87 268 Mfg Engineering Tech 214 13 227 221 9 230 153 6 159 107 5 112 105 4 109 Marketing 31 45 76 46 43 89 34 38 72 48 38 86 39 29 68 Pre-Marketing 123 107 230 121 87 208 136 76 212 128 76 204 113 102 215 Supply Chain Management - - - - - - - - - 1 2 3 9 5 14 Pre-Supply Chain Mgt - - - - - - - - - 4 2 6 18 10 28 Pre-Ag Engineering 1 - 1 1 - 1 3 - 3 2 - 2 - 1 1 Pre-Forestry - - - - - - 2 - 2 - - - - - - Pre-Vet Medicine 3 15 18 2 11 13 2 10 12 2 6 8 2 6 8 PRE-BUSINESS UNDECIDED 64 31 95 57 23 80 82 33 115 63 31 94 32 32 64 TOTAL PRE-BUSINESS 457 401 876 505 369 874 526 337 863 513 329 842 523 322 845 TOTAL BUSINESS AND TECH 1,498 802 2,336 1,524 741 2,265 1,528 707 2,235 1,506 723 2,229 1,581 715 2,296

TABLE 28. (Continued)
Fall 2002 Fall 2003 Fall 2004 Fall 2005 Fall 2006 Major M F Total M F Total M F Total M F Total M F Total
COLLEGE OF EDUCATION AND HUMAN SERVICES Bilingual/Bicult Ed 2 18 20 4 30 34 3 39 42 4 45 49 2 44 46 Community Health 4 27 31 6 32 38 5 30 35 8 16 24 3 12 15 Community Health Ed - - - - - - - - - - - - - - - Dietetics, Fashion Merch, & Hosp. 43 189 232 47 227 274 51 260 311 55 291 346 66 317 383 Elementary Ed 47 407 454 35 329 364 34 335 369 26 289 315 33 278 311 Pre-Elementary Ed 39 373 412 41 403 444 52 396 448 54 407 461 43 430 473 Health Services Management 7 19 26 5 15 20 8 14 22 11 20 31 12 26 38 Instruc Design & Tech 76 33 109 64 25 89 57 20 77 48 16 64 41 16 57 Law Enf & Just Adm (& Pre-LEJA) 965 353 1,318 1,032 390 1,422 1,115 397 1,512 1,257 472 1,729 1,280 402 1,682 Kinesiology 122 83 205 104 93 197 110 108 218 115 92 207 143 93 236 Kinesiology Teacher Ed 141 55 196 137 51 188 166 70 236 190 66 256 173 76 249 Recreation, Park & Tour Adm 142 149 291 133 145 278 141 154 295 131 153 284 122 117 239 Social Work 6 42 48 2 48 50 2 44 46 6 55 61 2 47 49 Pre-Social Work 5 89 94 6 102 108 16 117 133 10 132 142 18 137 155 Special Education 32 177 209 29 139 168 34 142 176 33 179 212 44 193 237 TOTAL EDUC AND HUMAN SERV 1,631 2,014 3,645 1,645 2,029 3,674 1,794 2,126 3,920 1,948 2,233 4,181 1,982 2,188 4,170
COLLEGE OF FINE ARTS AND COMMUNICATION Art 46 58 104 41 56 97 43 52 95 41 55 96 45 52 97 Art (BFA) 12 14 26 13 14 27 11 10 21 6 9 15 5 8 13 Art Ed 5 33 38 8 30 38 11 26 37 13 22 35 12 27 39 Broadcasting 104 74 178 121 74 195 128 68 196 138 74 212 128 65 193 Communication 157 214 371 139 191 330 165 159 324 179 185 364 192 187 379 Comm Sci & Disorders 1 59 60 2 62 64 3 50 53 1 55 56 1 61 62 Music 43 70 113 50 70 120 43 69 112 63 78 141 57 66 123 Music Ed 52 42 94 47 48 95 47 51 98 29 31 60 40 45 85 Musical Theatre - - - - - - 7 3 10 8 12 20 8 16 24 Theatre 21 30 51 23 25 48 29 25 54 33 23 56 28 23 51 TOTAL FINE ARTS AND COMM 441 594 1,035 444 570 1,014 487 513 1,000 511 544 1,055 516 550 1,066
OTHER Board of Trustees 348 377 725 303 337 640 309 306 615 196 223 419 213 239 452 General Orientation 501 409 910 522 407 929 512 438 950 452 375 827 433 345 778 Interdiciplinary Studies 35 45 80 42 37 79 45 35 80 38 17 55 30 26 56 Non Degree Student - - - - - - - - - 1 5 6 5 2 7 WESL 14 14 28 11 11 22 10 13 23 12 6 18 34 6 40 Unclassified** 132 85 217 145 93 238 109 68 177 107 75 182 91 69 160 TOTAL OTHER 1,030 930 1,960 1,023 885 1,908 985 860 1,845 806 701 1,507 806 687 1,493
GRAND TOTAL - UNDERGRAD 5,498 5,535 11,033 5,580 5,447 11,027 5,808 5,502 11,310 5,791 5,493 11,284 5,946 5,388 11,334 *Includes Extension & WIU-QC students **Includes Unclassified, Transitional and High School StudentsNOTE: Top five 2006 majors are highlighted.

TABLE 29. UNDERGRADUATES WITH SECOND MAJORS, FALL TERMS 2002-2006
Second Majors 2002 2003 2004 2005 2006
Accountancy 1 1 1 - 2 African-American Studies - 6 5 5 3Agriculture - 1 - - - Art - 3 3 1 3Biology 2 4 7 5 4Broadcasting - 1 5 6 6Chemistry - 2 1 2 1Clinical Laboratory Science - 1 1 1 - Communication 8 12 4 1 3Communication Science & Disorders - - - - 1 Community Health - - - - - Computer Science 5 2 3 4 5Construction Management - - - - 1Dietetics, Fashion Merchandising & Hospitality 3 1 3 3 3Economics 3 4 5 3 2English 5 4 3 4 9Finance 3 6 4 4 1French 8 8 11 10 5Geography - 2 3 2 1Geology - - - - - Graphic Communication 2 4 3 1 1History 8 7 6 3 7Human Resource Management 1 - - - - Industrial Technology - 1 1 - - Information Management 2 3 1 1 1Instructional Design & Technology 4 2 1 1 - Journalism 4 3 1 6 4 Kinesiology 3 2 - - 2 Law Enforcement & Justice Adm (& Pre LEJA) 11 7 10 9 11Management 5 5 5 2 3Manufacturing Engineering Technology 1 - - - - Marketing 4 - 2 3 3Mathematics 5 - 6 6 3Music 1 4 6 10 10Musical Theatre* - - 2 - 1 Philosophy - - 2 - 2 Physics 1 - - - 1 Political Science 9 9 7 16 11Pre-Accountancy 2 3 3 8 7Pre-Business Undecided - - - - - Pre-Chemistry - - - - - Pre-Economics - - 2 - 1 Pre-Elementary Education 1 - - - - Pre-Engineering - - - - - Pre-Finance 1 1 2 2 2Pre-Human Resource Management 1 - - - - Pre-Information Management - - - - - Pre-Management - 2 3 3 1Pre-Marketing 2 - 2 1 1Pre-Medicine 1 - - - - Psychology 24 23 23 26 29Recreation, Park & Tourism Administration 1 1 2 2 1Social Work 1 1 1 - - Sociology 21 20 27 26 24Spanish 32 28 26 38 38Special Education - - - - - Supply Chain Management - - - - 1 Theatre 6 8 4 2 0Women's Studies 4 3 5 1 1
TOTALS 196 195 212 218 216
Top five majors highlighted.*New major Fall 2004

TABLE 30. UNDERGRADUATE MINORS, FALL TERMS 2002-2006
Minors 2002 2003 2004 2005 2006
Accountancy 27 26 24 28 34Acquisition & Disorders of Language 1 - 2 - 2 African American Studies 51 33 37 34 33Agricultural Economics 12 7 3 8 10Agricultural Technology Management 2 1 1 - 3 Agriculture 1 1 1 - - Agronomy 1 2 1 1 4American Humanics 0 0 0 0 1Animal Science 5 5 9 10 20Anthropology 23 22 15 17 25Art History - 4 2 2 3Art, Studio 72 75 84 87 89Bilingual Education 2 5 4 3 3Biology 7 4 1 1 1Botany 14 15 11 11 10Broadcast and Print Media 4 4 4 1 0Broadcasting 35 36 39 46 51Business 46 40 61 85 56Business Education 2 - - - - Chemistry 54 77 88 80 81Coaching 12 12 14 22 24Communication 44 56 56 58 73Community Health 4 4 8 10 10Computer Science 236 204 187 171 154Construction Technology 5 1 5 2 7Creative Writing 54 70 68 59 64Cultural Studies 1 - - - - Dance 19 25 32 31 25Economics 22 27 21 27 43Electronic Media 21 31 24 18 9English 56 62 57 70 59Environmental Studies 12 16 12 4 10Ethics 1 2 5 4 1Family & Consumer Sciences 46 54 45 32 36Finance 45 51 53 69 77Fire Administration 14 34 64 108 162Forensic Chemistry 4 24 37 28 33Forensic Science 2 26 51 55 47French 17 12 19 24 23General Science 13 11 3 - - Geographic Information Systems - 2 2 1 9Geography 34 24 13 15 7Geology 4 4 6 18 16German 18 15 9 15 16Gerontology 2 4 3 4 4Graphic Communication 45 38 37 42 41Health Services Management 1 1 1 3 1History 85 87 81 89 87Horticulture 4 7 11 12 9Human Resource Management 34 32 29 39 38

TABLE 30. UNDERGRADUATE MINORS, FALL TERMS 2002-2006, continued
Minors 2002 2003 2004 2005 2006
Industrial Technology 8 4 3 6 13Information Management 30 21 18 19 18International Agriculture - - 1 - - International Business 23 31 30 30 27International Relations 11 13 8 8 6International Studies 11 8 6 6 7Journalism 47 59 70 82 80Kinesiology 28 31 29 24 29Law and Society 16 26 35 49 47Law Enforcement & Justice Administration 136 110 135 197 224Management 486 562 553 483 470Manufacturing Engineering Technology 6 8 7 5 10Marketing 242 202 178 247 281Mathematics 77 66 71 55 64Meteorology - 1 4 6 6Microbiology 40 34 26 26 25Military Science 54 64 58 52 58Music 27 27 27 25 24Music Business 7 20 34 67 63Natural Resources Conservation 31 26 29 32 27Neuroscience - - - 1 6Nutrition - - 34 54 63Occupational Safety 28 26 23 23 31Operations Management - - 2 - 2 Philosophy 24 19 18 22 32Photography - - - 2 - Photographic Media - - - - 12 Physics 4 6 3 5 9Political Science 85 76 80 66 70Pre-Law 26 24 26 31 22Professional Writing 23 21 27 31 19Psychology 212 258 253 274 289Public Administration 5 6 7 10 11Public Communication & Human Relations 19 4 1 - - Recreation, Park & Tourism Administration 48 49 53 57 54Religious Studies 16 19 27 37 25School Health 26 25 17 11 6Security Administration 64 65 73 97 123Sociology 264 279 290 360 346Spanish 94 98 146 208 190 Special Education 4 - 1 - - Speech Science - 1 - - - Statistics 2 2 2 2 1Supply Chain Management 21 17 16 13 19Theatre 21 19 27 19 19Urban Forestry 11 5 3 7 6Women's Studies 27 27 26 36 37Zoology 33 33 26 26 24
TOTALS 3,551 3,685 3,843 4,255 4,406
Includes only first minors.Top five minors for Fall 2006 highlighted.

TABLE 31. NUMBER OF GRADUATE MAJORS BY COLLEGE, FALL TERMS 2002-2006*
Fall 2002 Fall 2003 Fall 2004 Fall 2005 Fall 2006Major M F Total M F Total M F Total M F Total M F Total
COLLEGE OF ARTS & SCIENCES Biology 16 34 50 17 30 47 22 28 50 19 31 50 25 38 63 Chemistry 10 4 14 5 10 15 5 12 17 16 14 30 18 11 29 English 14 28 42 12 28 40 16 24 40 16 22 38 13 30 43 Geography 12 9 21 14 5 19 11 2 13 10 4 14 16 3 19 Gerontology 1 4 5 - 1 1 - - - - - - - - - History 25 10 35 31 12 43 23 15 38 25 10 35 26 10 36 Mathematics 10 4 14 10 5 15 6 3 9 7 2 9 9 1 10 Physics 6 2 8 9 3 12 6 2 8 10 1 11 12 1 13 Political Science 10 5 15 12 11 23 12 9 21 16 5 21 20 7 27 Psychology 7 29 36 9 23 32 13 21 34 8 22 30 12 23 35 School Psychology 6 17 23 8 20 28 5 23 28 7 21 28 8 20 28 Sociology 16 31 47 11 27 38 16 27 43 14 20 34 12 16 28 TOTAL ARTS & SCIENCES 133 177 310 138 175 313 135 166 301 148 152 300 171 160 331
COLLEGE OF BUSINESS AND TECHNOLOGY Accountancy 6 10 16 10 10 20 4 16 20 5 6 11 9 7 16 Business Administration 70 51 121 76 48 124 67 52 119 70 51 121 74 56 130 Computer Science 46 13 59 44 11 55 40 8 48 46 9 55 61 18 79 Economics (M.A.) 21 10 31 15 9 24 22 6 28 20 9 29 26 5 31 Manufacturing Engineering Systems 20 5 25 14 3 17 16 - 16 11 1 12 21 2 23 TOTAL BUSINESS AND TECH 163 89 252 159 81 240 149 82 231 152 76 228 191 88 279
COLLEGE OF EDUCATION AND HUMAN SERVICES College Student Personnel 12 29 41 9 36 45 15 31 46 12 28 40 12 28 40 Counseling & Guidance 19 103 122 21 88 109 24 94 118 20 89 109 18 84 102 Doctor of Education Leadership - - - - - - - - - - - - 12 10 22 Educational Leadership 58 41 99 57 42 99 57 57 114 74 51 125 86 90 176 Ed Leadership--6th Year 10 10 20 33 16 49 32 11 43 23 11 34 40 21 61 Elementary Education 20 144 164 10 139 149 8 114 122 8 99 107 12 109 121 Health Education & Promotion 20 48 68 13 47 60 14 37 51 14 46 60 11 43 54 Instruc Design & Technology 43 61 104 33 40 73 33 44 77 26 41 67 35 47 82 Interdisciplinary Studies 21 66 87 23 67 90 26 52 78 18 45 63 15 36 51 Kinesiology 50 39 89 69 35 104 62 32 94 38 25 63 14 17 31 Law Enforcement & Just Adm 99 48 147 90 47 137 90 48 138 82 40 122 68 34 102 M.A.T. (Seconday Education) 7 15 22 2 17 19 3 9 12 4 6 10 7 3 10 Reading 2 102 104 1 138 139 1 176 177 3 187 190 5 195 200 Rec, Park & Tourism Adm 6 22 28 8 12 20 15 23 38 17 17 34 22 12 34 Special Education 5 42 47 7 36 43 8 44 52 6 36 42 6 40 46 Sports Management - - - - - - - - - 11 2 13 33 17 50 TOTAL EDUC AND HUMAN SERV 372 770 1,142 376 760 1,136 388 772 1,160 356 723 1,079 396 786 1,182

TABLE 31. (Continued)
Fall 2002 Fall 2003 Fall 2004 Fall 2005 Fall 2006Major M F Total M F Total M F Total M F Total M F Total
COLLEGE OF FINE ARTS AND COMMUNICATION Communication 7 22 29 7 22 29 6 21 27 2 20 22 6 15 21 Comm Sci & Disorder 1 37 38 - 33 33 - 30 30 - 37 37 - 51 51 Music 8 7 15 8 11 19 10 13 23 12 13 25 14 13 27 Pub Comm & Broadcasting - - - - - - - - - - - - - - - Theatre--MFA 16 11 27 15 14 29 16 10 26 12 11 23 19 12 31 TOTAL FINE ARTS AND COMM 32 77 109 30 80 110 32 74 106 26 81 107 39 91 130
OTHER Advanced Graduate 93 134 227 80 164 244 68 116 184 40 96 136 51 70 121 Unclassified** 137 226 363 142 237 379 91 155 246 88 161 249 77 128 205 Post-Baccalaureate Certificates - - African & African World Diaspora - - - - - - - - - - - - 1 - 1 Biology 3 7 10 1 4 5 2 6 8 1 12 13 3 7 10 Counseling - 3 3 - 2 2 - 1 1 - - - - - - Health Services Administration - - - - - - - 2 2 - - - - 3 3 Instructional Design & Tech 3 8 11 4 9 13 1 6 7 5 2 7 1 2 3 Language Literacy - - - - - - - 2 2 - - - - - - Police Executive Cert. 1 - 1 - - - - - - - - - - - - Women's Studies - - - - - - - - - - 1 1 - 3 3 TOTAL OTHER 237 378 615 227 416 643 162 288 450 134 272 406 133 213 346
GRAND TOTAL - GRAD 937 1,491 2,428 930 1,512 2,442 866 1,382 2,248 816 1,304 2,120 930 1,338 2,268
*Includes Macomb Campus, Extension & WIU-QC Majors**Includes WESL, Unclassified
NOTE: Top 10 majors are highlighted.

TABLE 32. DEGREES CONFERRED BETWEEN JULY 1, 2005 AND JUNE 30, 2006 BY DEGREE PROGRAM, RACE, AND SEX
Non-resident Black American Indian/ Asian/ White Alien Non-Hispanic Alaskan Native Pacific Islander Hispanic Non-Hispanic Unknown Total
Degree Program Men Women Men Women Men Women Men Women Men Women Men Women Men Women Men WomenB.S. in Agriculture - - - - - - - - - - 52 9 2 - 54 9 B.A. in African-American Studies - - 1 - - - - - - - - - - - 1 - B.A. in Women's Studies - - - - - - - - - - 1 3 - - 1 3 B.A. in Communication - 3 1 4 1 - - 1 4 2 46 41 2 1 54 52 B.A. in Journalism 1 - - 2 - - - 1 - - 6 10 1 - 8 13 B.A. in Broadcasting - - 4 7 - - - - 1 - 22 11 3 - 30 18 B.S. in Graphic Communication - - - 2 - - - - - - 12 16 - - 12 18 B.S. in Computer Science 2 - 2 1 - - - - - - 25 5 5 - 34 6 B.S.Ed. in Bilingual/Bicultural Education - - - - - - - 1 - 1 - 2 - - - 4 B.S. in Instructional Technology and Telecommunications - 1 2 1 - - 3 1 - - 16 4 - - 21 7 B.S.Ed. in Special Education - - - - - - - - - - 3 25 - 2 3 27 B.S.Ed. in Elementary Education - 1 - 5 - - - 1 - 7 11 123 - 5 11 142 B.S. Community Health - - - - - - - - - - 3 13 - - 3 13 B.S. in Industrial Technology - - - - - - - - - - - - 1 - 1 - B.S. in Manufacturing Engineering Technology - - 1 - - - - - - - 24 1 1 - 26 1 B.A. in French - - - - - - - 1 - - - 2 - - - 3 B.A. in Spanish - - - - - - - - - 1 4 4 - - 4 5 B.S. in Family and Consumer Sciences - - 2 5 - - - 2 - - 13 50 1 - 16 57 B.A. in English - - - 3 - - 1 - - 1 19 31 - 1 20 36 Board of Trustees Bachelor of Arts 1 - 7 12 1 - - 2 2 4 79 92 5 3 95 113 B.A. and B.S. in Individual Studies - - 2 1 - - - 1 1 - 10 6 1 1 14 9 B.S. in Interdisciplinary Studies - - - - - - - - - - 1 1 1 - 2 1 B.S. in Biology - - - 6 - - 1 - - 1 18 59 3 1 22 67 B.S. in Mathematics - - - - - - - - - - 8 7 - - 8 7 B.S. in Recreation Park and Tourism Administration - 2 - - - - 2 1 - - 36 54 - 1 38 58 B.S. in Kinesiology - - 1 1 - - 1 - 1 - 34 32 - 1 37 34 B.A. in Philosophy - - 1 1 - - - - - - 3 2 2 - 6 3 B.A. in Meteorology - - - - - - 1 - - - 1 1 1 - 3 1 B.S. in Chemistry - - - 1 - - - - - 1 3 3 - - 3 5 B.S. in Geology - - - - - - 1 - - - 3 1 - - 4 1 B.S. in Physics - - - - - - - - - - 3 - - - 3 - B.S. in Psychology - 2 - 6 - - - 1 3 3 30 67 3 5 36 84 B.S. in Law Enforcement and Justice Administration - - 4 7 1 1 2 1 8 5 192 71 9 5 216 90 Bachelor of Social Work - - - 4 - - - - - 1 3 38 - 1 3 44 B.A. in Economics - 1 - 1 - - - - - - 1 1 - - 1 3 B.S. in Geography - - - - - - - - - - - - 1 - 1 - B.A. in Political Science 1 - 2 2 - - - - 1 - 13 12 - - 17 14

TABLE 32. (Continued)
Non-resident Black American Indian/ Asian/ White Alien Non-Hispanic Alaskan Native Pacific Islander Hispanic Non-Hispanic Unknown Total
Degree Program Men Women Men Women Men Women Men Women Men Women Men Women Men Women Men Women B.A. in Sociology - - 4 4 - - - - 3 - 15 17 - 1 22 22 B.A. in Theatre - - 1 - - - - - - - 5 2 - - 6 2 B.A. in Art - 1 - 1 - - - - 1 1 13 11 - 1 14 15 Bachelor of Fine Arts in Art - 1 - - - - - - - - 2 1 - - 2 2 B.A. in Music - - - - - - - - - - 11 12 - - 11 12 B.M. in Music - 1 - - - - - - - - 2 1 - 1 2 3 B.F.A. in Musical Theatre - - - - - - - - - - 1 - - - 1 - B.S. in Communication Sciences and Disorders - - - 1 - - - - - - - 15 - - - 16 B.S. in Health Services Management - - - - - - - - - - - 4 - - - 4 B.S. in Clinical Laboratory Science - - - - - - - - - - - 1 - - - 1 B.B. in Management - 1 1 4 - - 1 - 3 1 51 36 3 - 59 42 B.B. in Supply Chain Management 1 - - - - - - - - - 3 1 - - 4 1 B.B. in Accountancy - 1 - - - - 1 - - 2 10 23 1 2 12 28 B.B. in Economics 1 - 1 - - - - - - - 4 5 - - 6 5 B.B. in Finance 1 - - 2 - 1 1 - 1 - 31 11 - 2 34 16 B.B. in Human Resource Management - - 1 1 - - - - - - 2 10 - - 3 11 B.B. in Information Management - - - - - - - - 1 - 10 4 - - 11 4 B.B. in Marketing 2 - - 1 - - 1 - 1 1 38 25 1 1 43 28 B.S. in Construction Management - - 1 - - - 1 - - - 28 - - - 30 - B.A. in History - 1 1 1 - - 2 - 2 - 35 11 4 - 44 13 0
TOTAL BACHELORS DEGREES CONFERRED 10 16 40 87 3 2 19 14 33 32 956 987 51 35 1,112 1,173
M.A. in Communication - - - - - - - - - - 1 2 - 1 1 3 M.S. in Computer Science 14 3 - - - - - - - - 2 2 1 - 17 5 M.S.Ed. in Educational Leadership - - 1 - - - - - - - 21 14 1 1 23 15 M.S. in Instructional Technology and Telecommunications 2 2 1 - - - - - - 1 10 10 - 2 13 15 M.S.Ed. in Educational and Interdisciplinary Studies - - - - - - - - - 1 8 14 - 2 8 17 M.S.Ed. in Special Education - - - - - - - - - - 1 9 - - 1 9 M.S.Ed. in Counseling - - - 2 - - - 1 1 - 5 25 1 - 7 28 M.S. in College Student Personnel - 1 - - - - - - - - 5 9 2 1 7 11 M.S.Ed. in Elementary Education - - - - - - - - - - - 20 - 1 - 21 M.A.T. (Secondary Education) - - - 1 - - - - - - - 4 - 1 - 6 M.S. in Health Education - 1 - 1 - - - - - 1 4 5 1 - 5 8 M.S. in Manufacturing Engineering 5 1 - - - - - - - - 3 - - - 8 1 M.S.Ed. in Reading - - - 1 - - - - - - - 39 - 2 - 42 M.A. in English - - - - - - - - - - 7 6 - 1 7 7 M.S. in Biology - 1 - 1 - - - - - - 4 7 - - 4 9 M.S. in Mathematics - - - - - - - - - - 1 - 1 - 2 -

TABLE 32. (Continued)
Non-resident Black American Indian/ Asian/ White Alien Non-Hispanic Alaskan Native Pacific Islander Hispanic Non-Hispanic Unknown Total
Degree Program Men Women Men Women Men Women Men Women Men Women Men Women Men Women Men Women M.A. in Gerontology - - M.S. in Recreation, Park and Tourism Administration - - 1 2 - - - - - - 10 7 - - 11 9 M.S. in Sport Management 2 - - - - - - 1 - - 11 4 1 - 14 5 M.S. in Kinesiology (Physical Education) - - - - - - - - - - 11 4 2 2 13 6 M.S. in Chemistry 3 2 - - - - - - - - - 2 - - 3 4 M.S. in Physics 1 - - - - - - - - - 1 - - - 2 - M.S. in Psychology - - - - - - - - - - 5 5 - - 5 5 M.A. in Law Enforcement and Justice Administration - - 2 - - - - - - 1 17 4 1 - 20 5 M.A. in Economics 7 2 1 - - - - - - - 2 2 1 - 11 4 M.A. in Geography - 1 - - - - - - - - 1 - - - 1 1 M.A. in Political Science - - - - - - - - - - 2 2 - 1 2 3 M.A. in Sociology 1 1 - 2 - 1 - 1 - - 4 3 - - 5 8 M.F.A. in Theatre - - - 1 - - - - - - 2 2 - - 2 3 M.A. in Music - - - - - - - - - - 3 3 - - 3 3 M.S. in Communication Sciences and Disorders - - - - - - - - - - - 15 - - - 15 Master of Business Administration 6 2 - - - - - - - - 20 14 6 - 32 16 Master of Accountancy - - - - - - - - - - 1 1 - - 1 1 M.A. in History - - - - - - 1 - 1 - 5 5 1 - 8 5
TOTAL GRADUATE DEGREES CONFERRED 41 17 6 11 - 1 1 3 2 4 167 239 19 15 236 290
Ed.S. in Educational Leadership - - - - - - - - - - 8 3 - - 8 3 Specialist in School Psychology - - - - - - - 1 - - - 6 - - - 7 Post-Baccalaureate Certificate in Community Development - - - - - - - - - - 2 1 - - 2 1 Post Baccalaureate Certificate in Counseling - - - - - - - - - 1 - 1 - - - 2 Post-Baccalaureate Certificate in Police Exective Cert. - - - - - - - - - - 6 1 - - 6 1 Post-Baccalaureate Certificate in Zoology & Aquarium Studies - 1 - - - - - - - - - 2 - - - 3
TOTAL ADVANCED DEGREES CONFERRED - 1 - - - - - 1 - 1 16 14 - - 16 17
TOTAL GRADUATE AND ADVANCED DEGREES CONFERRED 41 18 6 11 - 1 1 4 2 5 183 253 19 15 252 307
TOTAL 51 34 46 98 3 3 20 18 35 37 1,139 1,240 70 50 1,364 1,480
Source: IPEDS Table Z

TABLE 33. NUMBER OF DEGREES CONFERRED BY MAJOR, FISCAL YEARS 2002-2006*
2002 2003 2004 2005 2006Ed.S. & Ed.S. & Ed.S. & Ed.S. & Ed.S. &
Degree Program B** M# S.S.P.@ B** M# S.S.P.@ B** M# S.S.P.@ B** M# S.S.P.@ B** M# S.S.P.@COLLEGE OF ARTS & SCIENCES Africian American Studies - - - - - - 3 - - 5 - - 1 - - Biology 67 10 - 45 13 - 62 15 - 78 15 - 89 13 - Chemistry 6 5 - 5 3 - 7 5 - 4 3 - 8 7 - Clinical Laboratory Science 3 - - 2 - - 0 - - 4 - - 1 - - Economics 12 11 - 16 14 - 11 24 - 6 12 - 4 15 - English 46 11 - 53 12 - 60 18 - 46 21 - 56 14 - French 1 - - 3 - - 1 - - 2 - - 3 - - Geography 9 5 - 10 9 - 6 12 - 7 7 - 1 2 - Geology 3 - - 6 - - 3 - - 4 - - 5 - - Gerontology - 3 - - 3 - - 3 - - 1 - - - - History 40 10 - 39 6 - 53 8 - 47 14 - 57 13 - Journalism 14 - - 28 - - 24 - - 24 - - 21 - - Mathematics 11 7 - 9 4 - 13 8 - 9 4 - 15 2 - Meteorology - - - - - - 1 - - 1 - - 4 - - Philosophy 4 - - 6 - - 5 - - 3 - - 9 - - Physics 5 8 - 3 3 - 6 7 - 8 5 - 3 2 - Political Science 22 5 - 41 3 - 35 3 - 32 4 - 31 5 - Psychology 96 9 3 110 7 6 101 13 8 105 11 10 120 10 7 Sociology 44 11 - 38 14 - 42 7 - 45 13 - 44 13 - Spanish 19 - - 9 - - 13 - - 6 - - 9 - - Women's Studies 1 - - 4 - - 3 - - 6 - - 4 - -TOTAL ARTS & SCIENCES 403 95 3 427 91 6 446 123 8 442 110 10 485 96 7
COLLEGE OF BUSINESS AND TECHNOLOGY Accountancy 45 4 - 56 5 - 47 5 - 49 15 - 40 2 - Agricultural Sciences 84 - - 93 - - 79 - - 82 - - 63 - - Computer Science 58 20 - 61 23 - 50 27 - 57 18 - 40 22 - Con. Management - - - - - - - - - 10 - - 30 - - Economics 7 - - 8 - - 11 - - 10 - - 11 - - Finance 51 - - 46 - - 40 - - 53 - - 50 - - Graphic Communication - - - 10 - - 21 - - 32 - - 30 - - Human Resource Mgmt 11 - - 10 - - 14 - - 10 - - 14 - - Industrial Education - - - - - 3 - - - - - - - - Industrial Technology 22 - - 11 - - 3 - - - - - 1 - - Information Management 51 - - 44 - - 37 - - 23 - - 15 - - Management 77 55 - 69 63 - 79 90 - 82 64 - 101 48 - Mfg Engineering Technology/Systems 45 8 - 49 7 - 59 13 - 58 5 - 27 9 - Marketing 52 - - 67 - - 80 - - 68 - - 71 - - Supply Chain Management - - - - - - - - - - - - 5 -TOTAL BUSINESS AND TECH 503 87 - 524 98 - 523 135 0 534 102 0 498 81 0

TABLE 33. (Continued)
2002 2003 2004 2005 2006Ed.S. & Ed.S. & Ed.S. & Ed.S. & Ed.S. &
Degree Program B** M# S.S.P.@ B** M# S.S.P.@ B** M# S.S.P.@ B** M# S.S.P.@ B** M# S.S.P.@COLLEGE OF EDUCATION AND HUMAN SERVICES Bilingual/Bicultural 9 - - 3 - - 6 - - 2 - - 4 - - College Student Pers - 22 - - 21 - - 19 - - 24 - - 18 - Community Health 14 15 - 6 - - 6 - - 14 - - 16 - - Counselor Education - 25 - - 68 - - 32 - - 35 - - 35 - Educational Leadership - 67 17 - 121 12 - 64 20 - 51 21 - 38 11 Educ & Interdisciplinary Studies - 33 - - 32 - - 31 - - 30 - - 25 - Elementary Education 201 51 - 231 56 - 167 39 - 188 65 - 153 21 - Family & Consumer Sciences 46 - - 40 - - 46 - - 67 - - 73 - - Health Education - - - - 17 - - 19 - - 14 - - 13 - Health Services Management 2 - - 3 - - 13 - - 7 - - 4 - - Instr Tech & Telecomm 19 28 - 28 51 - 35 30 - 21 26 - 28 28 - Kinesiology 84 47 - 103 31 - 69 32 - 83 43 - 71 19 - Law Enforcement & Just Adm 297 20 - 281 21 - 315 27 - 306 21 - 306 25 - Reading - 34 - - 32 - - 40 - - 41 - - 42 - Recreation, Park & Tour Adm 83 12 - 80 21 - 107 14 - 81 13 - 96 20 - Secondary Education - 8 - - 10 - - 8 - - 7 - - 6 - Social Work 27 - - 32 - - 36 - - 28 - - 47 - - Special Education 70 34 - 74 22 - 23 13 - 21 12 - 30 10 - Sport Management - - - - - - - - - - - - - 19 -
TOTAL EDUC AND HUMAN SERV 852 396 17 881 503 12 823 368 20 818 382 21 828 319 11
COLLEGE OF FINE ARTS AND COMMUNICATION Art 27 - - 29 - - 33 - - 29 - - 29 - - Art (BFA) 9 - - 3 - - 11 - - 6 - - 4 - - Broadcasting 11 - - 30 - - 41 - - 38 - - 48 - - Communication 141 6 - 157 5 - 132 8 - 97 6 - 106 4 - Comm Sci & Disorders 18 15 - 19 17 - 23 19 - 15 13 - 16 15 - Music (B.A.) 25 6 - 32 8 - 25 6 - 35 12 - 23 6 - Music (B.M.) - - - - - - - - - - - - 5 - - Theatre 15 9 - 9 6 - 7 5 - 16 10 - 8 - - Theatre (BFA) 1 - - 1 5 -TOTAL FINE ARTS AND COMM 246 36 - 279 36 - 272 38 0 237 41 0 240 30 0Post-Baccal. Certif. in Community Development - 3 - - 3 - - 5 - - 1 - - 3 -Post-Baccal. Certif. in Counseling - - - - - - - - - - - - - 2 -Post-Baccal. Certif. in Police Executive Cert. - 9 - - 14 - - 7 - - 10 - - 7 -Post-Baccal. Certif. in Zoology & Aquarium Stud. - - - - - - - 4 - - 7 - - 3 -
OTHER Board of Trustees 235 - - 259 - - 259 - - 299 - - 208 - - Individual/Interdisciplinary Studies 46 - - 44 - - 47 - - 46 - - 26 - -TOTAL OTHER 281 12 0 303 17 0 306 16 0 345 18 0 234 15 0
TOTAL 2,285 626 20 2,414 745 18 2,370 680 28 2,376 653 31 2,285 541 18
% Inc/(Dec)Over Previous Year 5.6% -5.0% 42.9% 5.6% 19.0% -10.0% -1.8% -8.7% 55.6% 0.3% -4.0% 10.7% -3.8% -17.2% -41.9%
*Includes Extension and WIU-QC Majors**Bachelor's Degrees#Master's Degrees@Education Specialist Degree and Specialist in School Psychology

TABLE 33A. COMPARISON OF TOTAL STUDENT CREDIT HOUR PRODUCTION, FISCAL YEARS 2005 AND 2006
FY2005 FY2006
COLLEGE AND DEPARTMENT MACOMB QUAD CITIES EXTENSION TOTAL MACOMB QUAD CITIES EXTENSION TOTAL % CHANGE 2005-2006
ARTS AND SCIENCES 139,196 1,435 7,079 147,710 138,963 1,536 5,662 146,161 (1.05)
Afri-Am Studies 2,714 54 219 2,987 2,802 57 297 3,156 5.66 Biological Sci 12,287 135 576 12,998 11,945 218 555 12,718 (2.15)Chemistry 5,199 - 4 5,203 5,171 - - 5,171 (0.62)Eng & Journalism 22,394 174 805 23,373 22,093 180 652 22,925 (1.92)Foreign Lang & Lit 3,885 - 854 4,739 3,837 - 766 4,603 (2.87)Geography 8,018 72 641 8,731 7,744 39 591 8,374 (4.09)Geology 3,584 42 413 4,039 3,486 38 160 3,684 (8.79)History 10,167 48 756 10,971 9,784 81 392 10,257 (6.51)Mathematics 21,771 459 499 22,729 21,970 303 639 22,912 0.81 Phil & Rel Studies 5,467 60 418 5,945 5,908 51 360 6,319 6.29 Physics 4,099 - - 4,099 4,930 - - 4,930 20.27 Political Science 6,823 - 312 7,135 6,946 - 124 7,070 (0.91)Psychology 13,618 39 453 14,110 13,038 27 379 13,444 (4.72)Sociology/Anthropology 15,756 352 961 17,069 14,790 467 447 15,704 (8.00)Women's Studies 3,414 - 168 3,582 4,519 75 300 4,894 36.63
BUSINESS & TECHNOLOGY 55,038 5,887 3,277 64,202 56,118 6,323 3,271 65,712 2.35
Accountancy 4,782 954 60 5,796 4,809 947 111 5,867 1.22 Agriculture 5,543 - 153 5,696 6,045 - 261 6,306 10.71 Computer Science 10,450 138 105 10,693 9,914 113 87 10,114 (5.41)Economics 5,719 150 288 6,157 6,173 357 229 6,759 9.78 Engineering Technology 5,368 265 193 5,826 5,304 457 225 5,986 2.75 Info Mgt & Decision Sci 4,446 921 51 5,418 4,053 921 39 5,013 (7.48)Management 10,362 1,824 1,356 13,542 10,857 1,890 1,461 14,208 4.92 Marketing & Finance 8,368 1,635 1,071 11,074 8,963 1,638 858 11,459 3.48
EDUCATION & HUMAN SERVICES 79,964 12,784 9,691 102,439 83,691 11,776 9,090 104,557 2.07
Counselor Education 466 2,626 93 3,185 195 2,327 - 2,522 (20.82)Curriculum & Instruction 6,510 3,036 2,209 11,755 7,230 2,694 2,366 12,290 4.55 Dietetics, Fashion Merch. & Hosp. 7,944 - 543 8,487 8,989 20 237 9,246 8.94 Ed & Interdiscplinary Studies 7,010 1,508 526 9,044 6,814 1,291 583 8,688 (3.94)Educational Leadership 3,403 2,103 1,760 7,266 3,404 1,995 1,805 7,204 (0.85)Health Sciences 6,438 175 453 7,066 7,249 210 370 7,829 10.80 Instr Tech & Telecommunications 2,546 171 1,351 4,068 2,174 174 1,351 3,699 (9.07)Kinesiology 13,596 74 210 13,880 12,787 66 134 12,987 (6.43)Law Enforce & Justice Admin 17,897 1,209 1,904 21,010 19,282 1,386 1,962 22,630 7.71 Military Science* 1,172 - - 1,172 1,048 - - 1,048 (10.58)Rec, Park & Tour Adm 8,988 753 642 10,383 9,346 662 282 10,290 (0.90)Social Work 2,653 - - 2,653 3,256 - - 3,256 22.73 Special Education 2,513 1,129 - 3,642 2,965 951 - 3,916 7.52
FINE ARTS & COMMUNICATION 34,642 - 792 35,434 34,424 6 840 35,270 (0.46)
Art 5,777 - 84 5,861 5,218 6 55 5,279 (9.93)Broadcasting - - - - 3,876 - 339 4,215 -Communication** 15,070 - 657 15,727 12,386 - 261 12,647 (19.58)School of Music 8,975 - 3 8,978 7,870 - 6 7,876 (12.27)Theatre and Dance 4,820 - 48 4,868 5,074 - 179 5,253 7.91
TOTALS 308,840 20,106 20,839 349,785 313,196 19,641 18,863 351,700 0.55
*Student Credit Hour data reported but not included in totals.***Included Broadcasting FY2005NOTE: Percentages may not add to total due to rounding.
Planning, Budget and Institutional Research: MSY 2/27/2007 SCHFY06

TABLE 33B. COMPARISON OF STUDENT CREDIT HOURS PRODUCED BY STUDENT LEVEL, FISCAL YEARS 2005 AND 2006
COLLEGE AND DEPARTMENTLOWER DIVISION UPPER DIVISION GRAD I GRAD II GRAND TOTAL
2005 2006 % Change 2005-2006 2005 2006 % Change
2005-2006 2005 2006 % Change* 2005-2006 2005 2006 % Change
2005-2006 2005 2006 % Change 2005-2006
ARTS & SCIENCES 86,092 82,542 (4.12) 54,408 56,176 3.25 7,210 7,443 3.23 - - - 147,710 146,161 (1.05)
Afri-Am Studies 1,770 1,686 (4.75) 1,187 1,428 20.30 30 42 40.00 - - - 2,987 3,156 5.66 Biological Sci 7,087 6,498 (8.31) 4,799 5,084 5.94 1,112 1,136 2.16 - - - 12,998 12,718 (2.15)Chemistry 2,758 2,273 (17.59) 1,913 2,075 8.47 532 823 54.70 - - - 5,203 5,171 (0.62)Eng & Journalism 15,745 15,486 (1.64) 6,813 6,799 (0.21) 815 640 (21.47) - - - 23,373 22,925 (1.92)Foreign Lang & Lit 2,430 2,248 (7.49) 2,183 2,168 (0.69) 126 187 48.41 - - - 4,739 4,603 (2.87)Geography 5,866 5,332 (9.10) 2,557 2,650 3.64 308 392 27.27 - - - 8,731 8,374 (4.09)Geology 1,934 1,681 (13.08) 2,088 1,983 (5.03) 17 20 17.65 - - - 4,039 3,684 (8.79)History 5,881 5,571 (5.27) 4,325 4,022 (7.01) 765 664 (13.20) - - - 10,971 10,257 (6.51)Mathematics 15,582 14,716 (5.56) 6,523 7,316 12.16 624 880 41.03 - - - 22,729 22,912 0.81 Phil & Rel Studies 3,420 3,961 15.82 2,498 2,334 (6.57) 27 24 (11.11) - - - 5,945 6,319 6.29 Physics 2,050 2,352 14.73 1,727 2,268 31.33 322 310 (3.73) - - - 4,099 4,930 20.27 Political Science 3,788 3,636 (4.01) 2,913 3,014 3.47 434 420 (3.23) - - - 7,135 7,070 (0.91)Psychology 6,845 6,084 (11.12) 5,954 6,142 3.16 1,311 1,218 (7.09) - - - 14,110 13,444 (4.72)Sociology/Anthropology 8,752 8,333 (4.79) 7,537 6,774 (10.12) 780 597 (23.46) - - - 17,069 15,704 (8.00)Women's Studies 2,184 2,685 22.94 1,391 2,119 52.34 7 90 1185.71 - - - 3,582 4,894 36.63
BUSINESS & TECHNOLOGY 15,867 15,720 (0.93) 42,940 44,551 3.75 5,395 5,441 0.85 - - - 64,202 65,712 2.35
Accountancy 2,394 2,307 (3.63) 2,826 2,981 5.48 576 579 0.52 - - - 5,796 5,867 1.22 Agriculture 1,490 1,818 22.01 3,917 4,143 5.77 289 345 19.38 - - - 5,696 6,306 10.71 Computer Science 5,362 4,702 (12.31) 4,430 4,302 (2.89) 901 1,110 23.20 - - - 10,693 10,114 (5.41)Economics 2,709 2,993 10.48 2,663 2,930 10.03 785 836 6.50 - - - 6,157 6,759 9.78 Engineering Technology 1,317 1,149 (12.76) 4,155 4,552 9.55 354 285 (19.49) - - - 5,826 5,986 2.75 Info Mgt & Decision Sci 1,152 1,059 (8.07) 3,975 3,702 (6.87) 291 252 (13.40) - - - 5,418 5,013 (7.48)Management 1,044 1,215 16.38 11,604 12,045 3.80 894 948 6.04 - - - 13,542 14,208 4.92 Marketing & Finance 399 477 19.55 9,370 9,896 5.61 1,305 1,086 (16.78) - - - 11,074 11,459 3.48
EDUCATION & HUMAN SERVICES 25,461 25,974 2.01 57,065 60,242 5.57 19,913 17,577 (7.89) - 764 - 102,439 104,557 2.07
Counselor Education 292 155 (46.92) 346 182 (47.40) 2,547 2,185 (14.21) - - - 3,185 2,522 (20.82)Curriculum & Instruction 767 691 (9.91) 7,725 8,247 6.76 3,263 3,352 2.73 - - - 11,755 12,290 4.55 Dietetics, Fashion Merch. & Hosp. 3,589 4,325 20.51 4,863 4,904 0.84 35 17 (51.43) - - - 8,487 9,246 8.94 Ed & Interdiscip. Studies 2,178 2,077 (4.64) 3,651 3,883 6.35 3,215 2,629 (15.15) - 99 - 9,044 8,688 (3.94)Educational Leadership 7 48 585.71 3,969 3,780 (4.76) 3,290 2,711 2.61 - 665 - 7,266 7,204 (0.85)Health Sciences 3,157 3,313 4.94 3,131 3,587 14.56 778 929 19.41 - - - 7,066 7,829 10.80 Instr Tech & Telecomm. 891 733 (17.73) 1,779 1,640 (7.81) 1,398 1,326 (5.15) - - - 4,068 3,699 (9.07)Kinesiology 4,421 3,921 (11.31) 7,569 7,708 1.84 1,890 1,358 (28.15) - - - 13,880 12,987 (6.43)Law Enforce. & Justice Adm. 5,876 5,963 1.48 13,377 15,227 13.83 1,757 1,440 (18.04) - - - 21,010 22,630 7.71 Military Science** 934 817 (12.53) 238 231 (2.94) - - - - - - 1,172 1,048 (10.58)Rec, Park & Tour Admin 3,038 3,345 10.11 6,504 6,138 (5.63) 841 807 (4.04) - - - 10,383 10,290 (0.90)Social Work 552 600 8.70 2,098 2,656 26.60 3 - (100.00) - - - 2,653 3,256 22.73 Special Education 693 803 15.87 2,053 2,290 11.54 896 823 (8.15) - - - 3,642 3,916 7.52
FINE ARTS & COMMUNICATION 15,906 13,982 (12.10) 16,919 18,598 9.92 2,609 2,690 3.10 - - - 35,434 35,270 (0.46)
Art 3,108 2,328 (25.10) 2,654 2,851 7.42 99 100 1.01 - - - 5,861 5,279 (9.93)Broadcasting - 986 - - 3,216 - - 591 - - - - 4,840 4,793 (0.97)Communication*** 4,840 3,565 (26.34) 9,654 7,695 (20.29) 1,233 1,053 (14.60) - - - 16,173 12,313 (23.87)School of Music 5,286 4,161 (21.28) 3,121 3,150 0.93 571 601 5.25 - - - 6,364 7,912 24.32 Theatre & Dance 2,672 2,942 10.10 1,490 1,686 13.15 706 345 (51.13) - - - 2,196 4,973 126.46
TOTALS 143,326 138,218 (3.56) 171,332 179,567 4.81 35,127 33,151 (3.45) - 764 - 349,785 351,700 0.55 *Includes Grad II**Student Credit Hour data reported but not included in totals.***Included Broadcasting FY2005NOTE: Percentages may not add to total due to rounding.
Planning, Budget and Institutional Research: MSY 2/27/2007 SCHFY06

OTHER CHARACTERISTICS
The total number of completed applications increased by 4.1 percent (from 11,814to 12,303) from Fall 2005 to Fall 2006 (Table 34). The number of accepted applicationsincreased by 2.4 percent from Fall 2005 to Fall 2006. The number of first-time studentsenrolling increased by 4.9 percent (from 3,865 to 4,056) from Fall 2005 to Fall 2006. Ofthe 12,303 completed applications, 71.3 percent (or 8,777) were accepted. From the 8,777accepted applications, 46.2 percent (or 4,056) enrolled.
The ages of WIU students by student level and sex are shown in Table 35.Students age 25 and over accounted for 9.6 percent of full-time students and 79.3 percentof part-time students. The average age for all WIU undergraduate students is 21.8 whilethe average age for graduate students is 32.0. Tables 36 and 37 show age breakdownsfor Macomb campus and all off-campus students.
Housing occupancy in residence halls (Table 38) decreased from 4,759 in 2005 to4,733 in 2006. Total living off-campus increased from 6,171 in 2005 to 6,283 in 2006.
Table 39 shows total student credit hours produced by fiscal year and level.Figure 7 shows student credit hours produced by each of the four colleges in FY2006.
The tuition and fee guarantee began for all undergraduate students entering theUniversity in Fall 1999. In-state undergraduate annual tuition increased from $4,968in 2005-06 to $5,439 in 2006-07. This tuition will remain in effect for students enteringFall 2006 for four years, as long as the student maintains continuous enrollment (Table40).

TABLE 34. APPLICATIONS, ACCEPTANCES, AND ENROLLMENTS OF DEGREE-SEEKING FIRST-TIME FRESHMEN, UNDERGRADUATE TRANSFER, AND GRADUATE STUDENTS BY SEX, FALL TERMS 2003-2006
First-Time Freshmen Undergraduate Transfers Graduate Students TOTALMale Female Total Male Female Total Male Female Total STUDENTS
FALL 2003 TERM*# Completed Applications 3,562 4,050 7,612 1,423 1,562 2,985 696 855 1,551 12,148 # Accepted Applications 2,357 2,675 5,032 1,044 1,109 2,153 560 691 1,251 8,436 # Enrolling Fall 2003 1,026 944 1,970 703 660 1,363 258 372 630 3,963 % Students Accepted 66.2% 66.0% 66.1% 73.4% 71.0% 72.1% 80.5% 80.8% 80.7% 69.4%% Students Accepted That Enrolled 43.5% 35.3% 39.1% 67.3% 59.5% 63.3% 46.1% 53.8% 50.4% 47.0%
FALL 2004 TERM*# Completed Applications 3,705 4,128 7,833 1,480 1,430 2,910 691 811 1,502 12,245 # Accepted Applications 2,528 2,962 5,490 1,080 1,018 2,098 510 614 1,124 8,712 # Enrolling Fall 2004 1,058 1,038 2,096 746 629 1,375 270 344 614 4,085 % Students Accepted 68.2% 71.8% 70.1% 73.0% 71.2% 72.1% 73.8% 75.7% 74.8% 71.1%% Students Accepted That Enrolled 41.9% 35.0% 38.2% 69.1% 61.8% 65.5% 52.9% 56.0% 54.6% 46.9%
FALL 2005 TERM*# Completed Applications 3,422 3,864 7,286 1,509 1,457 2,966 656 906 1,562 11,814 # Accepted Applications 2,383 2,841 5,224 1,130 1,040 2,170 481 694 1,175 8,569 # Enrolling Fall 2005 927 896 1,823 786 617 1,403 267 372 639 3,865 % Students Accepted 69.6% 73.5% 71.7% 74.9% 71.4% 73.2% 73.3% 76.6% 75.2% 72.5%% Students Accepted That Enrolled 38.9% 31.5% 34.9% 69.6% 59.3% 64.7% 55.5% 53.6% 54.4% 45.1%
FALL 2006 TERM*# Completed Applications 3,716 3,904 7,620 1,475 1,342 2,817 903 963 1,866 12,303 # Accepted Applications 2,525 2,846 5,371 1,106 999 2,105 587 714 1,301 8,777 # Enrolling Fall 2005 1,011 917 1,928 810 613 1,423 311 394 705 4,056 % Students Accepted 67.9% 72.9% 70.5% 75.0% 74.4% 74.7% 65.0% 74.1% 69.7% 71.3%% Students Accepted That Enrolled 40.0% 32.2% 35.9% 73.2% 61.4% 67.6% 53.0% 55.2% 54.2% 46.2%
*Includes high school students.

TABLE 35. AGE OF WIU STUDENTS BY STUDENT LEVEL AND SEX, FALL 2006*
Undergraduate Graduate Total Students Students All Students
M F M F M F FULL-TIME STUDENTS Under 18 23 42 - - 23 42 18-19 1,671 1,642 - 1 1,671 1,643 20-21 2,239 2,062 13 13 2,252 2,075 22-24 1,115 809 227 239 1,342 1,048 25-29 316 168 105 85 421 253 30-34 53 58 40 21 93 79 35-39 17 50 23 10 40 60 40-49 22 35 16 22 38 57 50-64 3 11 6 8 9 19 65 and Over - - 1 1 1 1 Age Unknown - 1 - - - 1 TOTAL FULL-TIME STUDENTS 5,459 4,878 431 400 5,890 5,278
PART-TIME STUDENTS Under 18 5 2 - - 5 2 18-19 18 8 - - 18 8 20-21 53 45 1 1 54 46 22-24 114 105 56 96 170 201 25-29 100 85 97 283 197 368 30-34 53 59 93 164 146 223 35-39 56 58 99 109 155 167 40-49 66 101 104 175 170 276 50-64 20 44 45 109 65 153 65 and Over 2 3 4 1 6 4 Age Unknown - - - - - - TOTAL PART-TIME STUDENTS 487 510 499 938 986 1,448
TOTAL ALL STUDENTS 5,946 5,388 930 1,338 6,876 6,726
*Includes Macomb Campus, Quad Cities Campus, and Extension
AVERAGE AGE, FALL 2006Macomb campus undergraduates 20.9 Total Undergraduates 21.8 Macomb campus graduates 28.6 Total Graduates 32.0 All new freshmen 18.1 Total University 23.5 Quad Cities 31.5 Extension 33.7 Macomb campus 21.6 New Transfers 22.4
STUDENTS 25 YEARS OLD AND OLDER, FALL 2006*# % # %
Full-Time 1,071 9.7 Undergraduates 1,380 12.2 Part-Time 1,930 83.2 Graduates 1,621 14.4
Total 3,001 22.4 Total 3,001 22.4

TABLE 36. AGE OF MACOMB STUDENTS BY STUDENT LEVEL AND SEX, FALL 2006 Undergraduate Students Graduate Students Total All Students
M F M F M F FULL-TIME STUDENTS Under 18 23 42 - - 23 42 18-19 1,668 1,639 - - 1,668 1,639 20-21 2,211 2,024 12 13 2,223 2,037 22-24 1,076 731 197 209 1,273 940 25-29 288 130 93 48 381 178 30-34 40 38 34 10 74 48 35-39 14 29 14 9 28 38 40-44 14 14 7 6 21 20 45-54 5 9 5 8 10 17 55+ - 2 5 3 5 5 Age Unknown - 1 - - - 1 TOTAL FULL-TIME STUDENTS 5,339 4,659 367 306 5,706 4,965
PART-TIME STUDENTS Under 18 5 2 - - 5 2 18-19 18 7 - - 18 7 20-21 42 22 1 - 43 22 22-24 72 49 32 29 104 78 25-29 43 18 39 51 82 69 30-34 9 14 26 21 35 35 35-39 5 13 22 17 27 30 40-44 7 9 15 18 22 27 45-54 5 19 15 40 20 59 55+ 1 - 7 4 8 4 Age Unknown - - - - - - TOTAL PART-TIME STUDENTS 207 153 157 180 364 333 TOTAL ALL MACOMB CAMPUS STUDENTS 5,546 4,812 524 486 6,070 5,298
TABLE 37. AGE OF OFF-CAMPUS STUDENTS BY STUDENT LEVEL AND SEX, FALL 2006 Undergraduate Students Graduate Students Total All Students
M F M F M F FULL-TIME STUDENTS Under 18 - - - - - - 18-19 3 3 - 1 3 4 20-21 28 38 1 - 29 38 22-24 39 78 30 30 69 108 25-29 28 38 12 37 40 75 30-34 13 20 6 11 19 31 35-39 3 21 9 1 12 22 40-44 4 8 3 4 7 12 45-54 2 10 3 10 5 20 55+ - 3 - - - 3 Age Unknown - - - - - - TOTAL FULL-TIME STUDENTS 120 219 64 94 184 313
PART-TIME STUDENTS Under 18 - - - - - - 18-19 - 1 - - - 1 20-21 11 23 - 1 11 24 22-24 42 56 24 67 66 123 25-29 57 67 58 232 115 299 30-34 44 45 67 143 111 188 35-39 51 45 77 92 128 137 40-44 33 32 42 62 75 94 45-54 39 71 66 129 105 200 55+ 3 17 8 32 11 49 Age Unknown - - - - TOTAL PART-TIME STUDENTS 280 357 342 758 622 1,115 TOTAL ALL OFF-CAMPUS STUDENTS 400 576 406 852 806 1,428

TABLE 38. MACOMB CAMPUS HOUSING, FALL TERMS 2002-2006
Residence Residence Single University Total Total TotalHall Hall Room Married* Living Living Macomb
Year Capacity No. No. No. On-Campus Off-Campus Students
2002 4,960 4,948 1,989 315 5,283 5,668 10,951 2003 5,200 4,993 1,764 244 5,237 5,759 10,996 2004 5,200 5,045 1,869 318 5,363 5,824 11,187 2005 5,200 4,759 1,953 347 5,106 6,171 11,277 2006 5,000 4,733 1,792 352 5,085 6,283 11,368 % Inc (Dec)Over Prev (3.85) (0.55) (8.24) 1.44 (0.41) 1.81 0.81 Year
*Number of units available.
Figure 6. Macomb Campus Housing OccupancyFall Terms 2002-2006
5,283
5,106
5,3635,237 5,085
5,824
6,283
5,759
6,171
5,668
4,600
4,800
5,000
5,200
5,400
5,600
5,800
6,000
6,200
6,400
2002 2003 2004 2005 2006
On Campus Off-Campus

TABLE 39. TOTAL STUDENT CREDIT HOURS, TOTAL UNIVERSITY FOR FISCAL YEARS 2001-2006
Fiscal Year Lower Upper Grad I Grad II
2001 123,435 167,154 36,882 -2002 124,684 169,461 40,042 -2003 130,311 172,645 40,164 -2004 137,916 168,460 38,258 -2005 143,326 171,332 35,127 -2006 138,218 179,567 32,107 1,808
Figure 7. Total Student Credit Hours by College Fiscal Year 2006
146.16
65.71
104.56
35.27
-
20
40
60
80
100
120
140
Arts & Sciences Business &Technology
Educ & HumanServices
Fine Arts & Comm
Thou
sand
s

TABLE 40. WIU ANNUAL TUITION, FEES, ROOM AND BOARD FOR FULL-TIME STUDENTS, 1995-96 THROUGH 2006-07
In-State In-State Out-of-State Out-of-State All StudentsUndergraduate Graduate Undergraduate Graduate
Tuition Fees Tuition Fees Tuition Fees Tuition Fees Room & Board
1995-96 1,968 734 2,076 734 5,904 734 6,228 734 3,413 1996-97 2,040 770 2,148 770 6,120 770 6,444 770 3,613 1997-98 2,119 918 2,232 918 6,358 918 6,696 918 3,838 1998-99 2,184 1,001 2,304 1,001 6,552 1,001 6,912 1,001 4,088 1999-00 2,730 1,106 2,970 1,106 5,940 1,106 5,940 1,106 4,292 2000-01 2,812 1,160 3,060 1,160 5,625 1,160 6,120 1,160 4,506 2001-02 2,982 1,225 3,245 1,225 5,964 1,225 6,489 1,225 4,822 2002-03 3,465 1,381 3,818 1,381 6,930 1,381 7,635 1,381 5,062 2003-04 3,915 1,487 4,313 1,487 7,830 1,487 8,625 1,487 5,366 2004-05 4,537 1,646 5,003 1,646 9,075 1,646 10,003 1,646 5,768 2005-06 4,968 1,931 4,382 1,642 7,452 1,931 8,765 1,642 6,113 2006-07 5,439 1,972 4,799 1,675 8,158 1,972 9,598 1,675 6,446
Full-time equals 15 semester hours per semester for undergraduate, 12 semester hours for graduate.

PERSONNEL AND SALARY DATA
The distribution of employees by race and sex is shown in Table 41. Malesconstituted 48.9 percent of total employees including graduate assistants, and females51.1 percent.
Employees by full-/part-time, sex and negotiating status are shown in Table 42.Faculty comprised 35.9 percent of all employees, not including graduate assistants; civilservice, 43.2 percent; administrators, 14.1 percent; and professionals, 6.8 percent. QuadCities employees by full-/part-time, sex and negotiating status are shown in Table 43.At the Quad Cities campus, faculty account for 54.3 percent of employees, civil service19.8 percent, administrators 23.5 percent, and professionals 2.5 percent.
Nearly 35 percent of full-time faculty were in the 50-59 age group in Fall 2006(Table 44). The greatest proportion of civil service employees was in the 50-59 age group(42.3%). The average age of all WIU employees in Fall 2006 was 47.5, compared to 47.4in Fall 2005.
In FY2007, employees received average percentage salary increases (includingpromotions) ranging from 3.3 percent in the “civil service” category to 6.2 percent in the“faculty” category (Table 45).
Table 46 gives the distribution of employees by job category, full-/part-time andsex for Fall 2002 and 2006. The overall number of full-time employees in the sevengroups increased 4.4 percent from Fall 2005 to 2006, while the number of part-timeemployees rose by 11.8 percent.
The average faculty salary (Table 47) increased from $57,447 in FY2006 to$59,970 in FY2007. The largest percentage increase occurred at the instructor level (up4.7% between FY2006 and FY2007).
Table 48 compares the FY2006 average salary of full-time faculty in Illinois publicuniversities by sex and rank. Western’s average FY2006 salary for all ranks was$59,100.
The total number of standard rank faculty increased from 731 in Fall 2005(Table 50) to 737 in Fall 2006 (Table 49). In Fall 2006, 66.2 percent of faculty hadterminal degrees, 47.6 percent were tenured and 22.8 percent were tenure trackcompared to 65.4 percent with terminal degrees in Fall 2005, 45.7 percent tenured and23.9 percent on tenure track.

TABLE 41. EMPLOYEES BY RACE AND SEX, FALL 2006*
Associate Assistant Total Graduate Civil Total Race/Sex Professors Professors Professors Instructors Lecturers Faculty Assistants@ Service@ Administrators@ Professionals# Employees WHITEMale 115 90 85 67 3 360 172 350 119 47 1,048 Female 52 56 62 80 10 260 181 499 131 76 1,147 TOTAL WHITE 167 146 147 147 13 620 353 849 250 123 2,195
BLACK Male 5 5 3 - - 13 9 22 7 5 56 Female 1 4 3 1 - 9 12 13 12 2 48 TOTAL BLACK 6 9 6 1 - 22 21 35 19 7 104
HISPANIC Male 1 2 3 1 - 7 3 1 1 - 12 Female 3 1 1 - - 5 5 4 5 2 21 TOTAL HISPANIC 4 3 4 1 - 12 8 5 6 2 33
ASIAN AMERICAN Male 7 3 4 - - 14 1 - 3 2 20 Female 2 6 5 - 1 14 4 4 2 3 27 TOTAL ASIAN AMERICAN 9 9 9 - 1 28 5 4 5 5 47
NATIVE AMERICAN Male 2 - - 1 - 3 - 3 - - 6 Female 1 2 2 - - 5 1 - - - 6 TOTAL NATIVE AMERICAN 3 2 2 1 - 8 1 3 - - 12
OTHER Male - 1 - - - 1 6 - 1 - 8 Female - - - - - - 6 - - - 6 TOTAL OTHER - 1 - - - 1 12 - 1 - 14
INTERNATIONAL** Male 2 8 19 1 1 31 59 - 7 3 100 Female - 1 9 3 2 15 33 - 4 - 52 TOTAL INTERNATIONAL 2 9 28 4 3 46 92 - 11 3 152
Total Males 132 109 114 70 4 429 250 376 138 57 1,250 Total Females 59 70 82 84 13 308 242 520 154 83 1,307 Grand Total 191 179 196 154 17 737 492 896 292 140 2,557 *Department chairs included with faculty. @Based on BOT code.#Includes executive assistants and faculty assistants.**Includes nonresident employees only.

TABLE 42. WESTERN ILLINOIS UNIVERSITY TOTAL FACULTY AND STAFF, SEPTEMBER 2006
Male FemaleFT PT Total FT PT Total TOTAL FTE
CIVIL SERVICE Negotiating 179 - 179 73 - 73 252 Prevailing Wage 44 - 44 1 - 1 45 Non-Negotiating 151 2 153 427 19 446 599 TOTAL CIVIL SERVICE 374 2 376 501 19 520 896 881
FACULTY Regular Negotiating* 304 1 305 177 1 178 483 Temporary Negotiating* 41 5 46 57 4 61 107 Non-Negotiating Faculty 16 43 59 22 35 57 116 Department Chairpersons 26 - 26 13 - 13 39 TOTAL FACULTY 387 49 436 269 40 309 745 681
ADMINISTRATORS Negotiating 12 - 12 55 - 55 67 Non-Negotiating 125 1 126 95 4 99 225 TOTAL ADMINISTRATORS 137 1 138 150 4 154 292 287
PROFESSIONALS# Negotiating 12 - 12 10 - 10 22 Non-Negotiating 40 4 44 58 14 72 116 Temporary Negotiating 1 - 1 1 - 1 2 TOTAL PROFESSIONALS 53 4 57 69 14 83 140 125
SUBTOTAL 951 56 1,007 989 77 1,066 2,073 1,974
GRADUATE ASSISTANTS 149 101 250 163 79 242 492
GRAND TOTAL 1,100 157 1,257 1,152 156 1,308 2,565 1,974
*Total full- and part-time faculty in bargaining unit#Now includes employees who were previously classified as faculty without standard rank.

TABLE 43. WESTERN ILLINOIS UNIVERSITY-QUAD CITIES TOTAL FACULTY AND STAFF, SEPTEMBER 2006
Male FemaleFT PT Total FT PT Total TOTAL FTE
CIVIL SERVICE Negotiating - - - - - - - Prevailing Wage - - - - - - - Non-Negotiating 2 - 2 13 1 14 16 TOTAL CIVIL SERVICE 2 - 2 13 1 14 16 16
FACULTY Regular Negotiating* 15 - 15 13 - 13 28 Temporary Negotiating* 2 1 3 2 - 2 5 Non-Negotiating Faculty - 4 4 - 7 7 11 Department Chairpersons - - - TOTAL FACULTY 17 5 22 15 7 22 44 44
ADMINISTRATORS Negotiating 1 - 1 6 - 6 7 Non-Negotiating 6 - 6 6 - 6 12 TOTAL ADMINISTRATORS 7 - 7 12 - 12 19 19
PROFESSIONALS# Negotiating - - - 1 - 1 1 Non-Negotiating - - - - - - - Temporary Negotiating 1 - 1 - - - 1 TOTAL PROFESSIONALS 1 - 1 1 - 1 2 2
SUBTOTAL 27 5 32 41 8 49 81 81
GRADUATE ASSISTANTS 4 1 5 2 3 5 10
GRAND TOTAL 31 6 37 43 11 54 91
*Total full- and part-time faculty in bargaining unit#Now includes what was previously faculty without standard rank.

TABLE 44. PERCENT OF ALL FULL-TIME EMPLOYEES BY AGE GROUP, SEPTEMBER 2006*
2006 2003 2000N UNDER 30 30-39 40-49 50-59 60+ Avg. Age Avg. Age Avg. Age
Civil Service 870 6.0 12.6 27.4 42.3 11.7 48.7 47.9 46.7
Faculty 656 2.6 21.0 28.4 34.8 13.3 48.1 48.1 47.3
Administration 286 11.5 24.1 23.4 30.8 10.1 44.9 44.0 44.5
Professional 124 17.7 25.8 31.5 20.2 4.8 41.9 41.4 49.1
AVERAGE EMPLOYEE AGE, FALL 2006: 47.5AVERAGE EMPLOYEE AGE, FALL 2003: 47.0AVERAGE EMPLOYEE AGE, FALL 2000: 46.7
*Excludes unknown age
Figure 8. Percent of All Full-Time Employees by Age GroupSeptember 2003 and 2006
6.7
10.2
6.0
11.7
37.0
28.5
17.6
27.4
12.6
42.3
0
5
10
15
20
25
30
35
40
45
Under 30 30-39 40-49 50-59 60+
Age Group
2003 2006

TABLE 45. PERCENTAGE SALARY INCREASE BY EMPLOYEE CATEGORY INCLUDING PROMOTIONS, FISCAL YEARS 1995-2007@
Other Senior Administrators/ CivilYEAR Administrators# Professional Faculty Service
FY1995 3.0 3.9 4.3 3.9FY1996 6.9 5.5 4.4 4.5FY1997 3.9 4.8 3.8 4.4FY1998 3.2 4.5 3.7 3.3FY1999 4.4 5.4 4.5 4.0FY2000 5.6 6.2 5.7 6.1FY2001 6.9 6.9 6.9 6.4FY2002 12.1 11.9 11.3 10.6FY2003 0.8 0.9 1.4 0.5FY2004 5.7 3.2 3.7 3.9FY2005 4.2 4.8 5.1 4.7FY2006 5.2 6.0 5.1 6.5FY2007* 4.5 5.5 6.2 3.3
#President, Vice Presidents, Deans @Based on annualized monthly salary.*Reflects salary increases implemented as of Sept. 30, 2006.

TABLE 46. DISTRIBUTION OF FULL- & PART-TIME EMPLOYEES BY JOB CATEGORY*, FALL 2002 & 2006
2002 2006
Full-Time Part-Time Full-Time Part-Time 2006JOB CATEGORY M F Total M F Total M F Total M F Total TOTAL
Faculty 379 234 613 40 36 76 387 269 656 49 40 89 745 Executive/Administrative 120 130 250 - 2 2 136 150 286 3 5 8 294 Professional Non-Faculty 94 161 255 2 14 16 101 172 273 4 19 23 296 Secretarial/Clerical 16 275 291 - 20 20 20 263 283 - 9 9 292 Technical/Paraprofessional 70 82 152 2 2 4 72 79 151 1 2 3 154 Skilled Craft 75 1 76 - - - 79 1 80 - - - 80 Service/Maintenance 153 65 218 - 1 1 149 58 207 - 1 1 208
TOTAL 907 948 1,855 44 75 119 944 992 1,936 57 76 133 2,069
*EEO6 Categories
TABLE 47. AVERAGE SALARIES FOR FULL-TIME, 9-MONTH FACULTY, FISCAL YEARS 2003-2007
FY2003 FY2004 FY2005 FY2006 FY2007N Mean N Mean N Mean N Mean N Mean
Professor 177 71,968 156 73,740 163 76,875 155 78,887 153 81,998 Associate 132 55,389 147 56,933 145 58,584 151 60,332 171 62,995 Assistant 173 46,691 187 46,876 170 47,989 204 48,789 195 50,618 Instructor 84 33,961 87 34,646 84 35,449 89 36,665 84 38,397 Lecturer 6 32,445 5 33,156 7 32,842 7 37,022 11 37,049
Total University 572 54,501 582 54,671 569 56,926 606 57,447 614 59,970
Source: AAUP Annual Salary Survey (9 month)

TABLE 48. AVERAGE SALARY OF FULL-TIME FACULTY IN ILLINOIS PUBLIC UNIVERSITIES BY SEX AND RANK, FY2006*
Associate AssistantProfessors Professors Professors Instructors All Ranks
Institution M F Total M F Total M F Total M F Total M F Total
Chicago State University 75.8 74.2 75.3 63.8 59.8 61.8 54.2 55.0 54.7 na na na 67.0 61.1 64.2 Eastern Illinois University 75.9 72.3 74.6 61.6 59.1 60.7 52.0 49.9 51.0 37.4 36.0 36.6 60.2 52.2 56.6 Governors State University 92.7 83.8 89.3 75.9 72.8 74.2 64.5 62.1 63.0 na na na 79.7 71.5 75.4 Illinois State University 77.9 72.5 76.7 60.8 57.1 59.1 57.5 51.3 54.5 na na na 64.1 52.6 59.1 Northeastern Ill. University 78.5 76.6 77.6 66.0 59.7 63.3 54.5 54.1 54.3 31.7 32.3 32.0 55.7 53.0 54.4 Northern Illinois University 85.2 77.9 83.4 64.5 62.0 63.5 53.2 53.8 53.5 35.7 35.3 35.4 65.4 55.0 60.9 Western Illinois University 80.8 77.9 80.0 62.1 59.5 61.1 49.5 47.6 48.8 38.6 35.5 36.7 62.2 54.4 59.1
Southern Illinois University SIU - Carbondale 83.8 73.8 81.5 63.0 57.6 61.1 54.7 51.8 53.6 31.5 36.0 33.7 60.7 53.0 57.9 SIU - Edwardsville 81.8 73.1 80.0 67.7 60.0 64.4 53.5 49.8 51.7 37.1 37.1 37.1 63.4 51.7 58.3
University of Illinois U of I - Chicago 105.9 99.2 104.3 76.5 71.2 74.5 68.7 62.1 65.0 na 50.1 51.3 87.7 72.2 81.6 U of I - Springfield 86.0 76.2 82.9 68.2 62.4 65.7 56.6 48.2 53.2 na na 45.0 64.2 55.7 60.7 U of I - Urbana/Champaign 116.3 104.3 114.4 79.4 75.8 78.2 71.3 62.9 68.1 37.7 43.1 40.0 93.9 73.7 88.1
AVERAGE SALARY $97.2 $85.1 $94.3 $69.8 $64.6 $67.8 $60.1 $55.5 $58.0 $35.3 $36.6 $36.1 $74.6 $60.0 $68.9
*Twelve-month salaries are converted to a nine-month equivalent using a factor of 9/11.
NOTE: Only All Rank data are shown for institutions which do not use traditional faculty ranks. Salary data are displayed as NA when there are fewer than three individuals in a given category.
Source: 2006 IBHE Data Book

TABLE 49. SELECTED FACULTY CHARACTERISTICS, FALL 2006
Male Female Total Total Avg. Yrs. Terminal Degrees Tenured Tenure TrackRank FT PT Total FT PT Total FT PT Faculty at WIU** # % # % # %
Professor 128 4 132 59 - 59 187 4 191 17.5 183 95.8 187 97.9 1 0.5Associate 108 1 109 68 2 70 176 3 179 8.3 159 88.8 146 81.6 30 16.8Assistant 115 1 116 80 2 82 195 3 198 2.9 126 63.6 15 7.6 137 69.2Instructor 32 43 75 54 31 85 86 74 160 7.4 20 12.5 3 1.9 - 0.0Lecturer 4 - 4 8 5 13 12 5 17 6.1 - 0.0 - - - -
SUBTOTAL 387 49 436 269 40 309 656 89 745 9.1 488 65.5 351 47.1 168 22.6
Librarian 11 - 11 5 - 5 16 - 16 9.8 14 87.5 9 56.3 5 31.3Counselors 3 - 3 7 - 7 10 - 10 9.8 2 20.0 2 20.0 - - Graduate Assistants 150 97 247 163 81 244 313 178 491 - - - - - - -
TOTAL 551 146 697 444 121 565 995 267 1,262 9.1 504 39.9 362 123 173 13.7
Excludes Executive Assistants and Faculty Assistants**For those new in 2006, years at WIU were counted as 0.5.
TABLE 50. SELECTED FACULTY CHARACTERISTICS, FALL 2005
Male Female Total Total Avg. Yrs. Terminal Degrees Tenured Tenure TrackRank FT PT Total FT PT Total FT PT Faculty at WIU** # % # % # %
Professor 133 - 133 54 - 54 187 - 187 19.4 182 97.3 184 98.4 - 0.0Associate 93 - 93 65 1 66 158 1 159 9.6 138 86.8 129 81.1 27 17.0Assistant 126 2 128 76 4 80 202 6 208 4.2 132 63.5 18 8.7 147 70.7Instructor 35 39 74 59 32 91 94 71 165 7.4 24 14.5 3 1.8 1 0.6Lecturer 3 1 4 5 3 8 8 4 12 7.3 2 16.7 - - - -
SUBTOTAL 390 42 432 259 40 299 649 82 731 10.1 478 65.4 334 45.7 175 23.9
Librarian 11 - 11 6 - 6 17 - 17 12.2 15 88.2 10 58.8 5 29.4Counselors 3 - 3 6 - 6 9 - 9 12.9 2 22.2 2 22.2 - - Graduate Assistants 147 82 229 164 75 239 311 157 468 - - - - - - -
TOTAL 551 124 675 435 115 550 986 239 1,225 10 495 40.4 346 127 180 14.7
Excludes Executive Assistants and Faculty Assistants**For those new in 2005, years at WIU were counted as 0.5.

COST COMPARISONS AND WIU APPROPRIATIONS
Western Illinois University cost comparisons based on the Illinois Board of HigherEducation Discipline Cost Study are shown in Table 51 and Figure 9. The comparativecost analysis indicates for fiscal year 2006 Western was, for the third year in a row,underfunded (1.7 percent in FY2004 and 3.3 percent in FY2005). FY2006 informationis not available at this time.
The FY1998-FY2007 state appropriations for WIU are shown in Table 52 andFigure 10. Income fund as a percent of the total appropriation has increased to an all-time high at over 47 percent.
Table 53 shows the FY2002-FY2007 state higher education appropriations for allIllinois public universities. The percent change in state higher education appropriationswas 12.9 percent from FY2002 to FY2007. From FY2006 to FY2007, appropriationsincreased 3.6 percent.

TABLE 51. WIU COST COMPARISONS PERCENT OVER/(UNDER), FISCAL YEARS 1995-2005
PercentFiscal Year Dollars* Over/Under1995 1,506.6 3.2 1996 1,665.6 3.4 1997 3,378.8 6.9 1998 3,363.3 5.4 1999 375.7 0.7 2000 853.3 1.5 2001 1,421.6 2.3 2002 297.3 0.4 2003 (541.9) (0.8) 2004 (1,122.7) (1.7) 2005 2,448.1 (3.3) *In thousands at the total less physical plant level with IBHE Fixed Cost Adjustments
Source: IBHE Comparative Cost Study
Figure 9. WIU Cost Comparisons--Weighted Average Percent Over/(Under), Fiscal Years 1995-2005
(1.7)
(3.3)
1.5
5.4
(0.8)
0.4
2.3
0.7
6.9
3.43.2
(5.0)
-
5.0
10.0
1995 1996 1997 1998 1999 2000 2001 2002 2003 2004 2005
Total Less Physical Plant

TABLE 52. WESTERN ILLINOIS UNIVERSITY APPROPRIATION HISTORY, FISCAL YEARS 1998-2007
FY98 FY99 FY00 FY01 FY02*Total Appropriation 74,438,800 77,776,000 82,483,700 89,114,800 94,898,700 % Change 4.48 4.48 6.05 8.04 6.49
General Funds 52,442,700 54,859,500 58,151,900 61,407,400 64,306,700 % Change 4.25 4.61 6.00 5.60 4.72
Income Fund 21,996,100 22,916,500 24,331,800 27,707,400 30,592,000 % Change 5.03 4.18 6.18 13.87 10.41
Income Fund % of Total 29.55 29.46 29.50 29.50 32.24
FY03* FY04* FY05 FY06 FY07Total Appropriation 95,319,000 94,084,100 97,714,100 103,154,100 109,393,400 % Change 0.44 -1.30 3.86 5.57 6.05
General Funds 61,126,000 56,091,100 56,391,100 56,391,100 57,213,400 % Change -4.95 -8.24 0.53 0.00 1.46
Income Fund 34,193,000 37,984,000 41,323,000 46,763,000 52,180,000 % Change 11.77 11.09 8.79 13.16 11.58
Income Fund % of Total 35.87 40.37 42.29 45.33 47.70
Note: Total appropriations exclude retirement. *Required lapse of $741,100 caused revision of the Total Appropriation FY02.*Required lapse of $1,666,200 caused revision of the Total Appropriation FY03.*Required lapse of $1,082,900 caused revision of the Total Appropriation FY04.
Figure 10. Percent Change in Total Appropriation and Income Fund as a Percent of Total
6.055.57
3.86-1.300.44
6.498.046.054.484.48
47.7045.3342.2940.37
35.8732.24
29.5029.5029.4629.55
(10.00)
-
10.00
20.00
30.00
40.00
50.00
60.00
FY98 FY99 FY00 FY01 FY02* FY03* FY04* FY05 FY06 FY07
% Change-Total Appropriation Income Fund
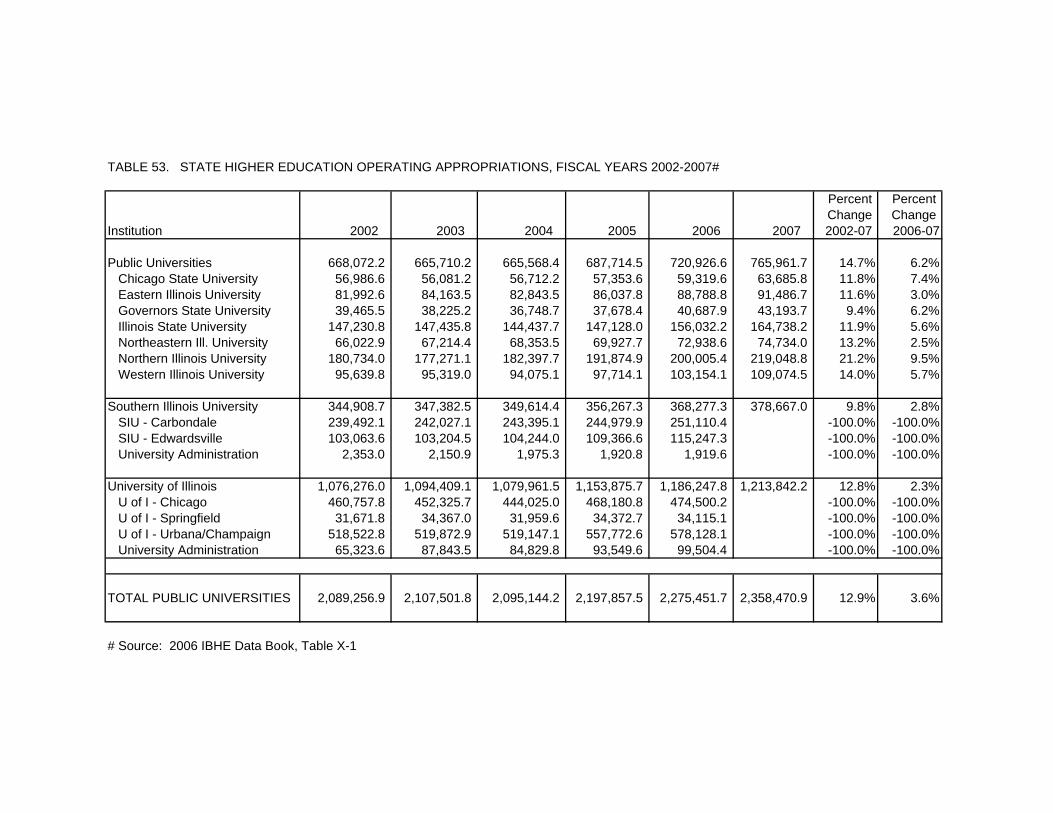
TABLE 53. STATE HIGHER EDUCATION OPERATING APPROPRIATIONS, FISCAL YEARS 2002-2007#
Percent Percent Change Change
Institution 2002 2003 2004 2005 2006 2007 2002-07 2006-07
Public Universities 668,072.2 665,710.2 665,568.4 687,714.5 720,926.6 765,961.7 14.7% 6.2% Chicago State University 56,986.6 56,081.2 56,712.2 57,353.6 59,319.6 63,685.8 11.8% 7.4% Eastern Illinois University 81,992.6 84,163.5 82,843.5 86,037.8 88,788.8 91,486.7 11.6% 3.0% Governors State University 39,465.5 38,225.2 36,748.7 37,678.4 40,687.9 43,193.7 9.4% 6.2% Illinois State University 147,230.8 147,435.8 144,437.7 147,128.0 156,032.2 164,738.2 11.9% 5.6% Northeastern Ill. University 66,022.9 67,214.4 68,353.5 69,927.7 72,938.6 74,734.0 13.2% 2.5% Northern Illinois University 180,734.0 177,271.1 182,397.7 191,874.9 200,005.4 219,048.8 21.2% 9.5% Western Illinois University 95,639.8 95,319.0 94,075.1 97,714.1 103,154.1 109,074.5 14.0% 5.7%
Southern Illinois University 344,908.7 347,382.5 349,614.4 356,267.3 368,277.3 378,667.0 9.8% 2.8% SIU - Carbondale 239,492.1 242,027.1 243,395.1 244,979.9 251,110.4 -100.0% -100.0% SIU - Edwardsville 103,063.6 103,204.5 104,244.0 109,366.6 115,247.3 -100.0% -100.0% University Administration 2,353.0 2,150.9 1,975.3 1,920.8 1,919.6 -100.0% -100.0%
University of Illinois 1,076,276.0 1,094,409.1 1,079,961.5 1,153,875.7 1,186,247.8 1,213,842.2 12.8% 2.3% U of I - Chicago 460,757.8 452,325.7 444,025.0 468,180.8 474,500.2 -100.0% -100.0% U of I - Springfield 31,671.8 34,367.0 31,959.6 34,372.7 34,115.1 -100.0% -100.0% U of I - Urbana/Champaign 518,522.8 519,872.9 519,147.1 557,772.6 578,128.1 -100.0% -100.0% University Administration 65,323.6 87,843.5 84,829.8 93,549.6 99,504.4 -100.0% -100.0%
TOTAL PUBLIC UNIVERSITIES 2,089,256.9 2,107,501.8 2,095,144.2 2,197,857.5 2,275,451.7 2,358,470.9 12.9% 3.6%
# Source: 2006 IBHE Data Book, Table X-1
![AACSB INTERNATIONAL SELF EVALUATION REPORT GUIDELINESweb.mst.edu/~scm1/AACSB/AACSB_SER_Data_Reuqirement.pdf · AACSB INTERNATIONAL SELF EVALUATION REPORT GUIDELINES ... [MISSION STATEMENT]](https://img.pdfslide.net/doc/110x75/5afcd9637f8b9a864d8cb5fb/aacsb-international-self-evaluation-report-scm1aacsbaacsbserdatareuqirementpdfaacsb.jpg)