Embed Size (px)
Citation preview
Board of Higher Education Meeting | October 6, 2009
3
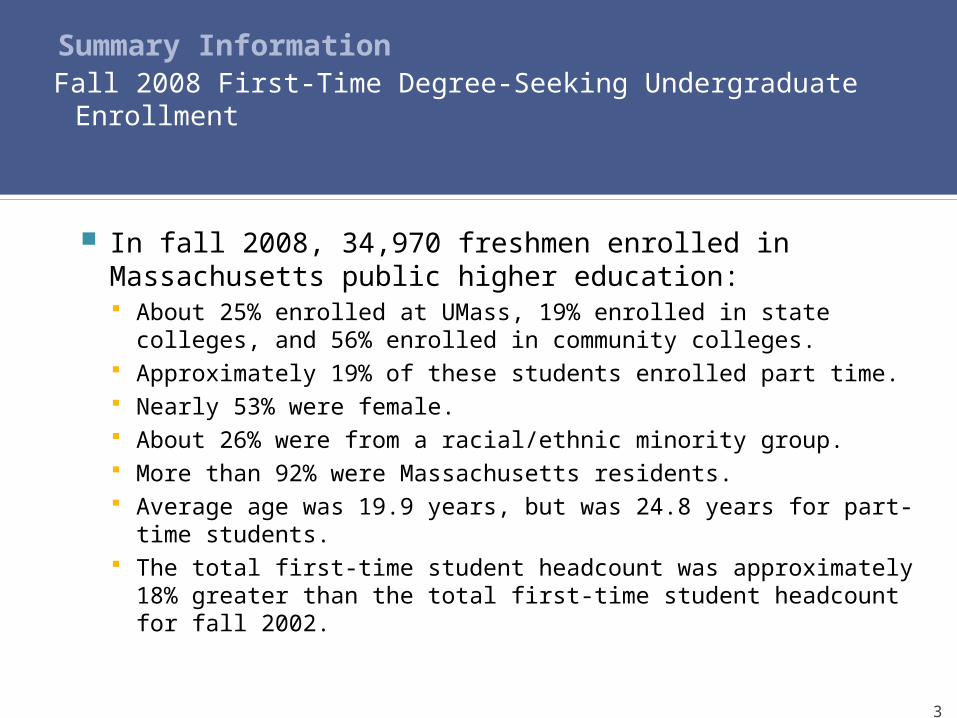
Summary InformationFall 2008 First-Time Degree-Seeking Undergraduate Enrollment
In fall 2008, 34,970 freshmen enrolled in Massachusetts public higher education: About 25% enrolled at UMass, 19% enrolled in state
colleges, and 56% enrolled in community colleges. Approximately 19% of these students enrolled part time. Nearly 53% were female. About 26% were from a racial/ethnic minority group. More than 92% were Massachusetts residents. Average age was 19.9 years, but was 24.8 years for part-
time students. The total first-time student headcount was approximately
18% greater than the total first-time student headcount for fall 2002.
4
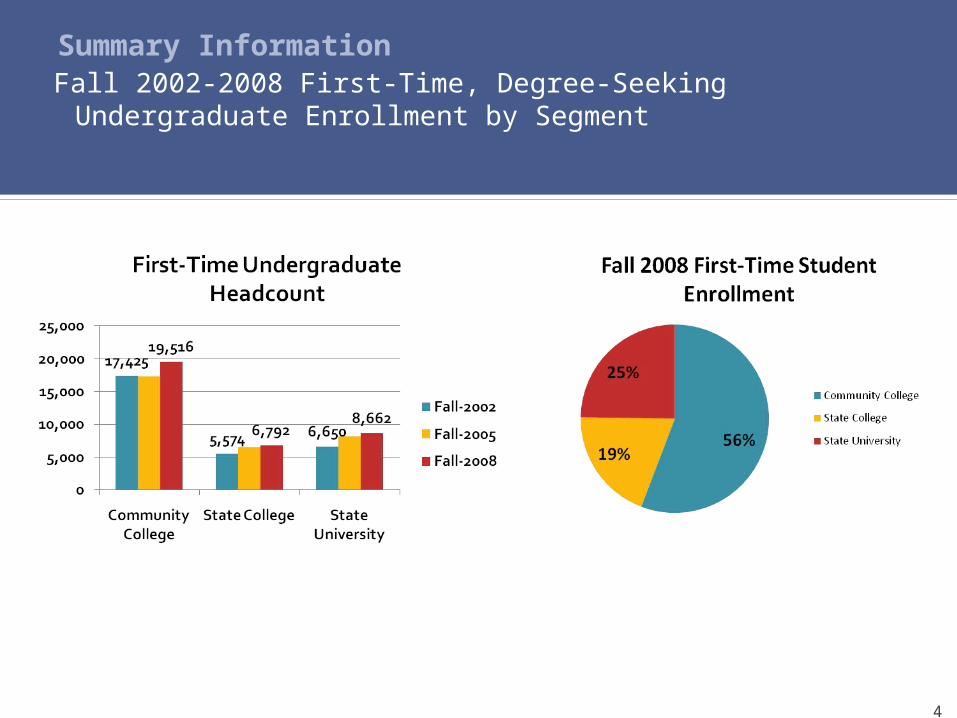
Summary InformationFall 2002-2008 First-Time, Degree-Seeking Undergraduate
Enrollment by Segment
5
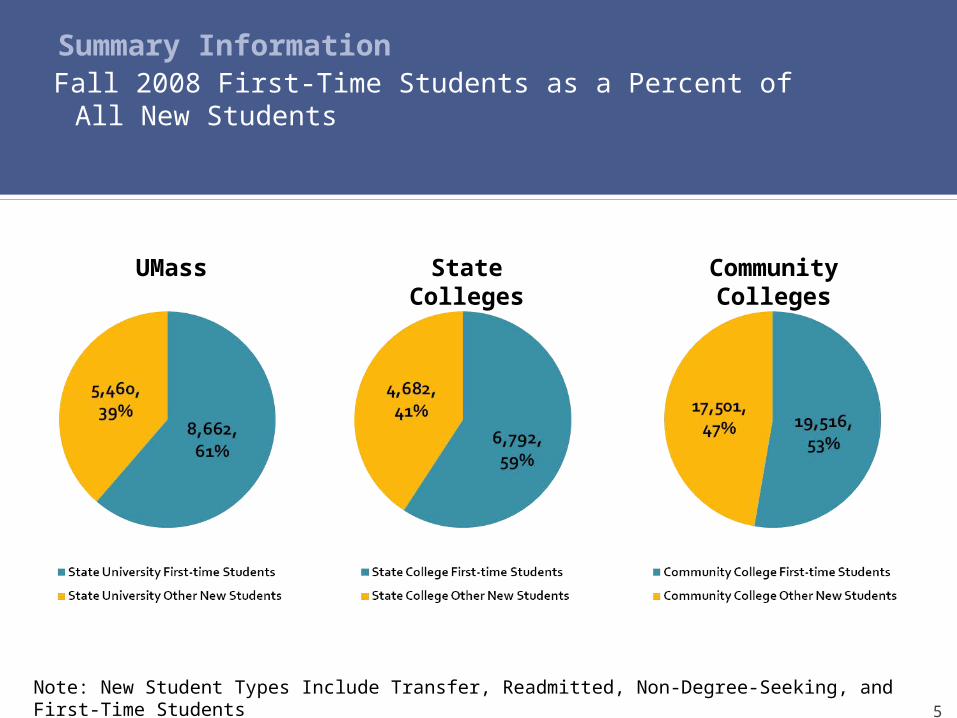
Summary InformationFall 2008 First-Time Students as a Percent of
All New Students
Note: New Student Types Include Transfer, Readmitted, Non-Degree-Seeking, and First-Time Students
UMass State Colleges
Community Colleges
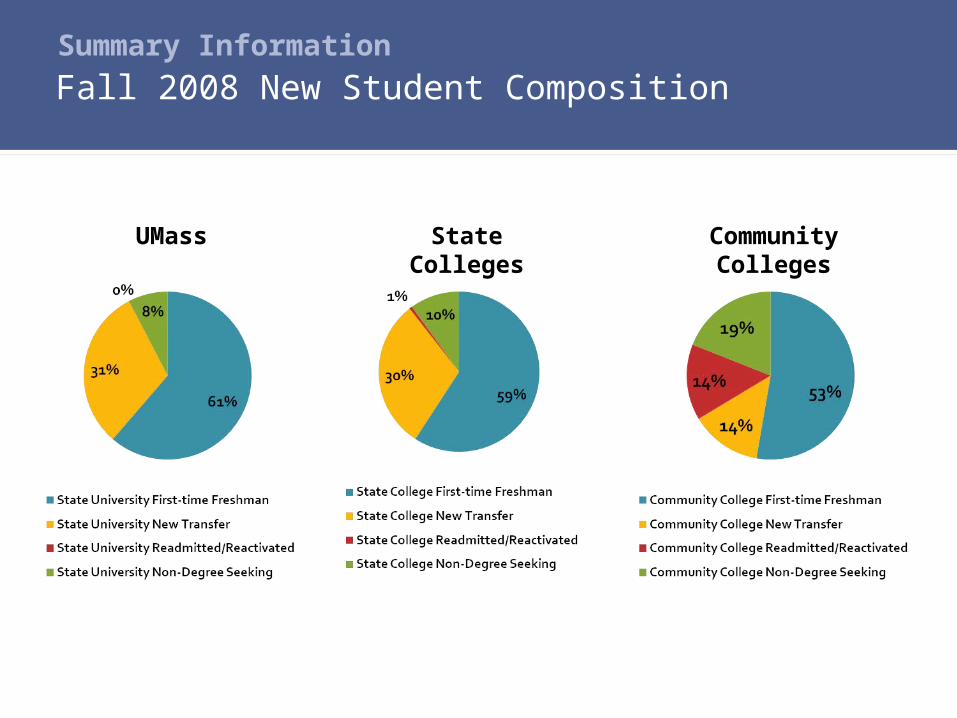
Summary Information
Fall 2008 New Student Composition
UMass State Colleges
Community Colleges
7
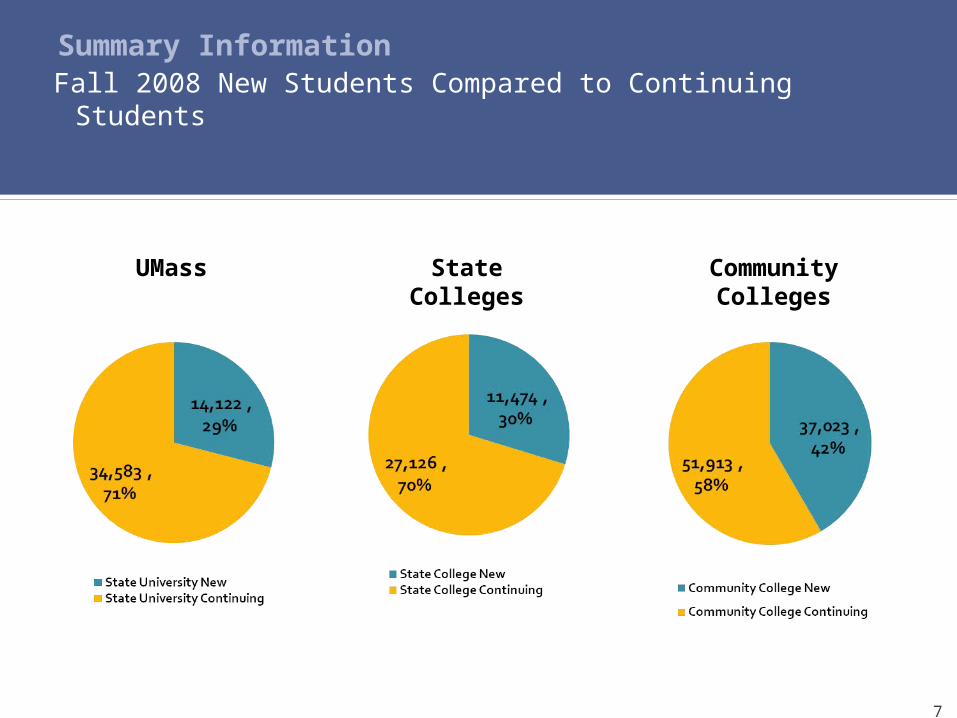
Summary InformationFall 2008 New Students Compared to Continuing Students
UMass State Colleges
Community Colleges
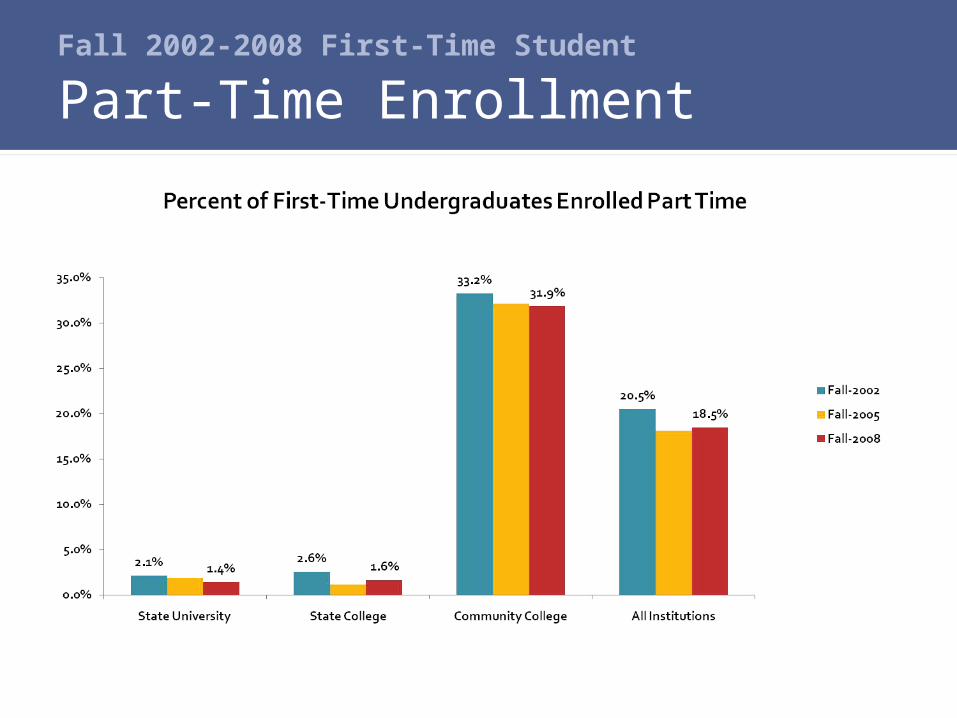
Fall 2002-2008 First-Time Student
Part-Time Enrollment
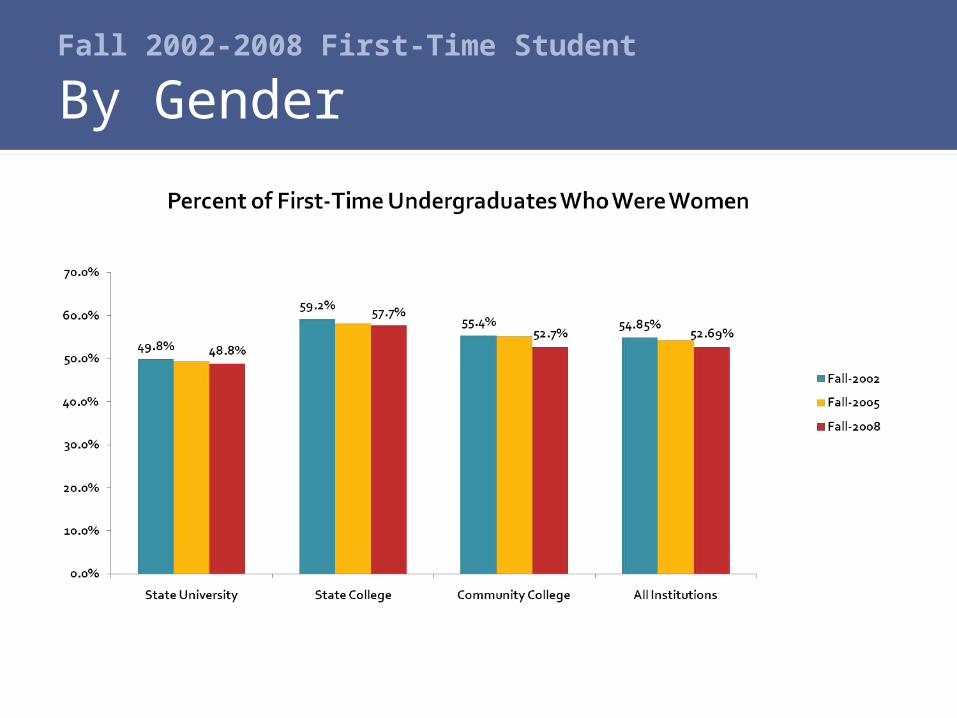
Fall 2002-2008 First-Time Student
By Gender
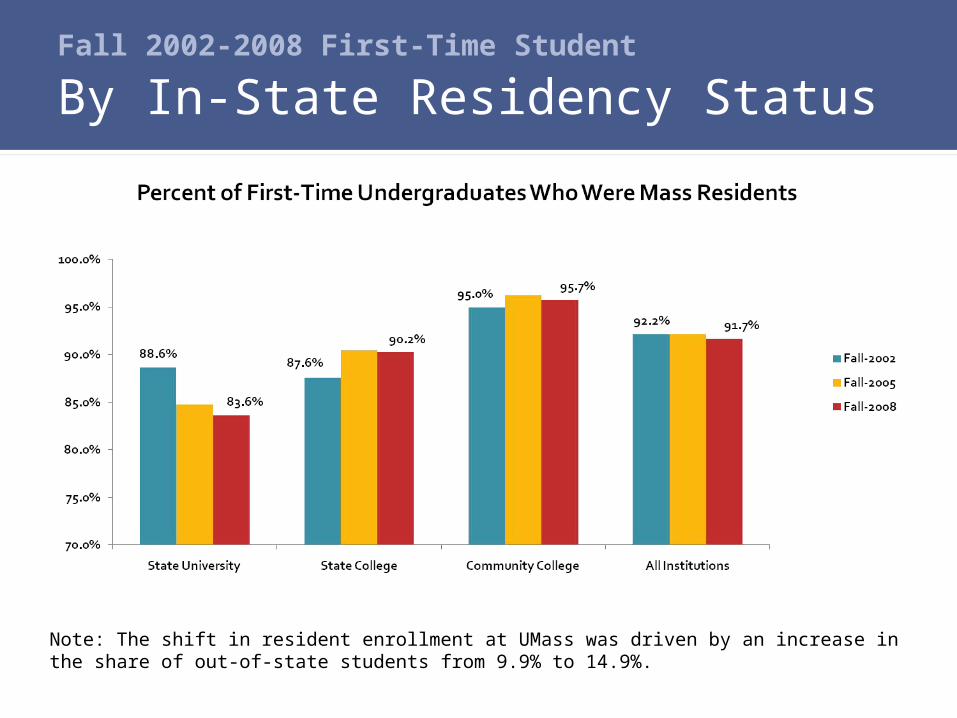
Fall 2002-2008 First-Time Student
By In-State Residency Status
Note: The shift in resident enrollment at UMass was driven by an increase in the share of out-of-state students from 9.9% to 14.9%.
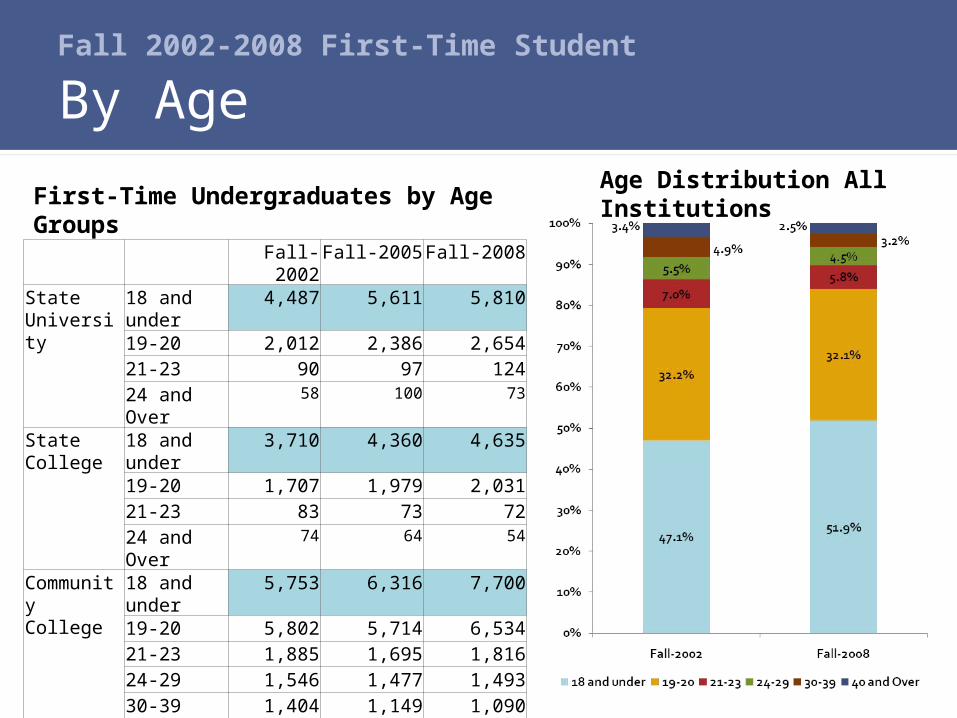
Fall 2002-2008 First-Time Student
By Age
First-Time Undergraduates by Age Groups
Fall-2002 Fall-2005 Fall-2008State University
18 and under
4,487 5,611 5,810
19-20 2,012 2,386 2,65421-23 90 97 12424 and Over
58 100 73
State College
18 and under
3,710 4,360 4,635
19-20 1,707 1,979 2,03121-23 83 73 7224 and Over
74 64 54
Community College
18 and under
5,753 6,316 7,700
19-20 5,802 5,714 6,53421-23 1,885 1,695 1,81624-29 1,546 1,477 1,49330-39 1,404 1,149 1,09040 and Over
984 949 855
Age Distribution All Institutions
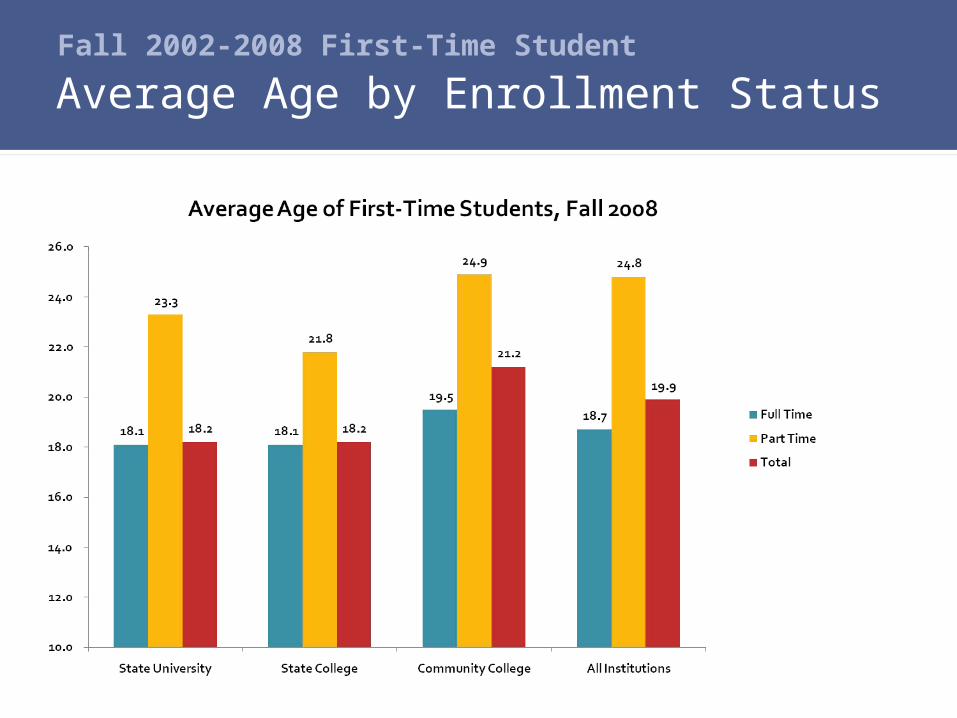
Fall 2002-2008 First-Time Student
Average Age by Enrollment Status
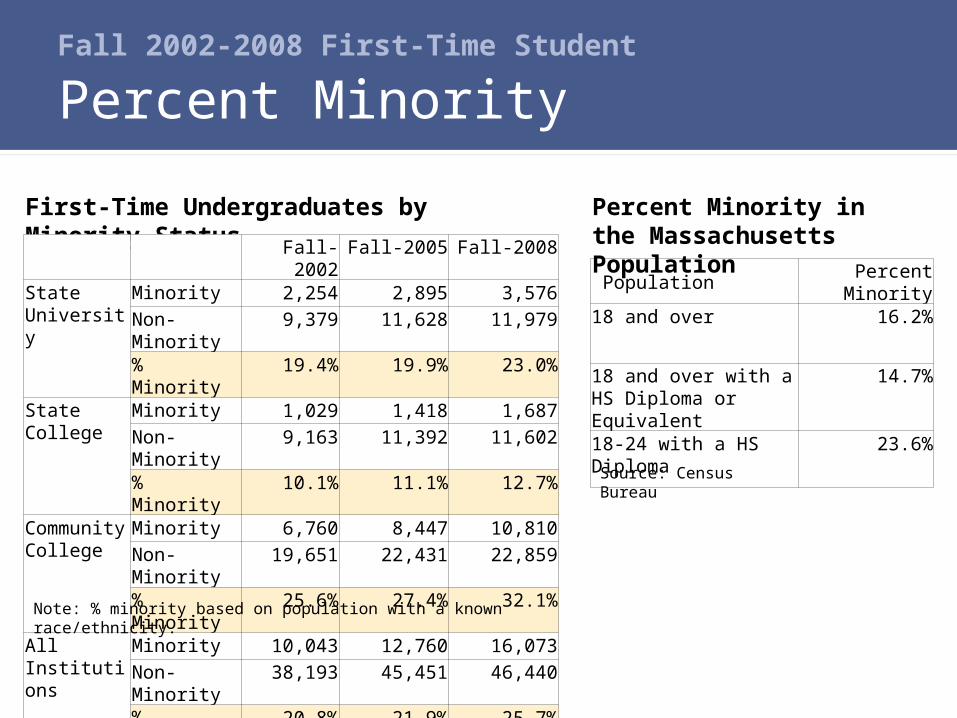
Fall 2002-2008 First-Time Student
Percent Minority
First-Time Undergraduates by Minority Status Fall-2002 Fall-2005 Fall-2008State University
Minority 2,254 2,895 3,576Non-Minority
9,379 11,628 11,979
% Minority 19.4% 19.9% 23.0%State College
Minority 1,029 1,418 1,687Non-Minority
9,163 11,392 11,602
% Minority 10.1% 11.1% 12.7%Community College
Minority 6,760 8,447 10,810Non-Minority
19,651 22,431 22,859
% Minority 25.6% 27.4% 32.1%All Institutions
Minority 10,043 12,760 16,073Non-Minority
38,193 45,451 46,440
% Minority 20.8% 21.9% 25.7%
PopulationPercent Minority
18 and over 16.2%18 and over with a HS Diploma or Equivalent
14.7%
18-24 with a HS Diploma
23.6%
Percent Minority in the Massachusetts Population
Note: % minority based on population with a known race/ethnicity.
Source: Census Bureau
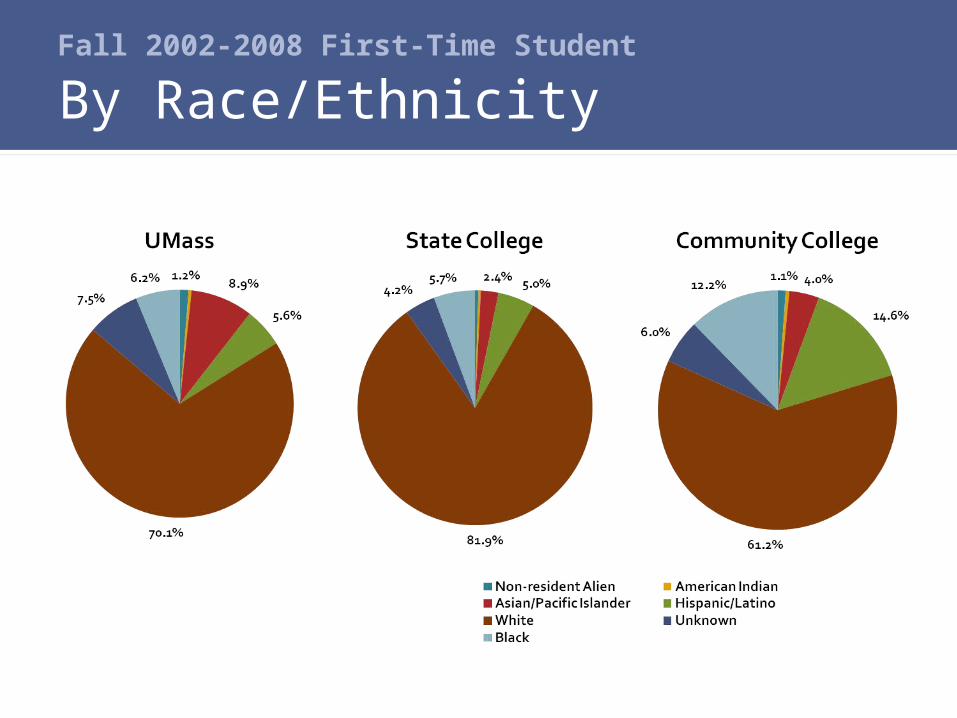
Fall 2002-2008 First-Time Student
By Race/Ethnicity
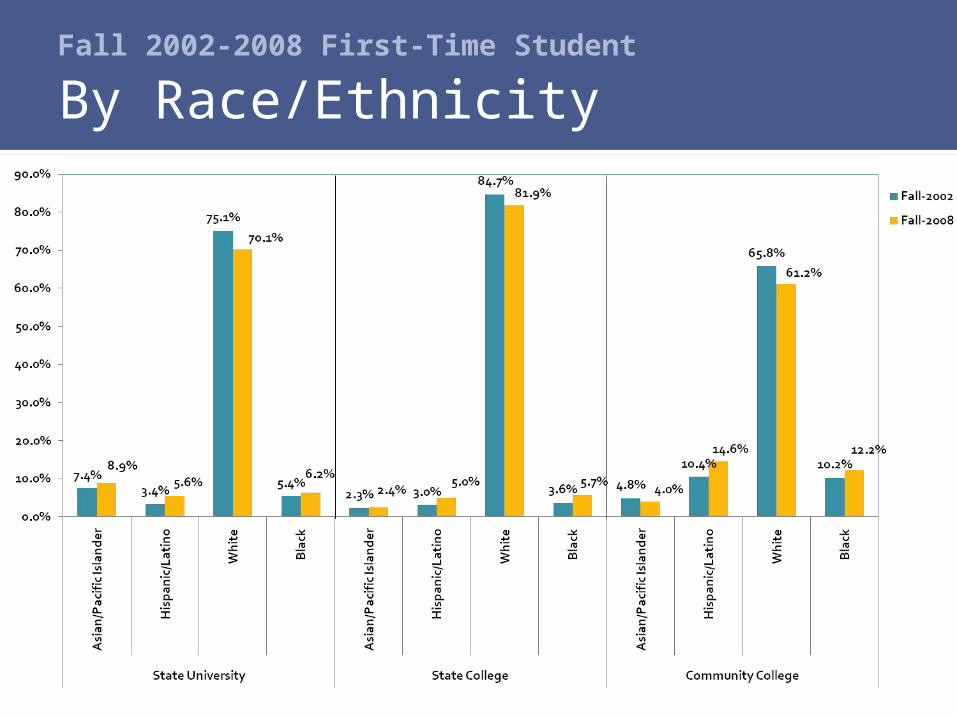
Fall 2002-2008 First-Time Student
By Race/Ethnicity
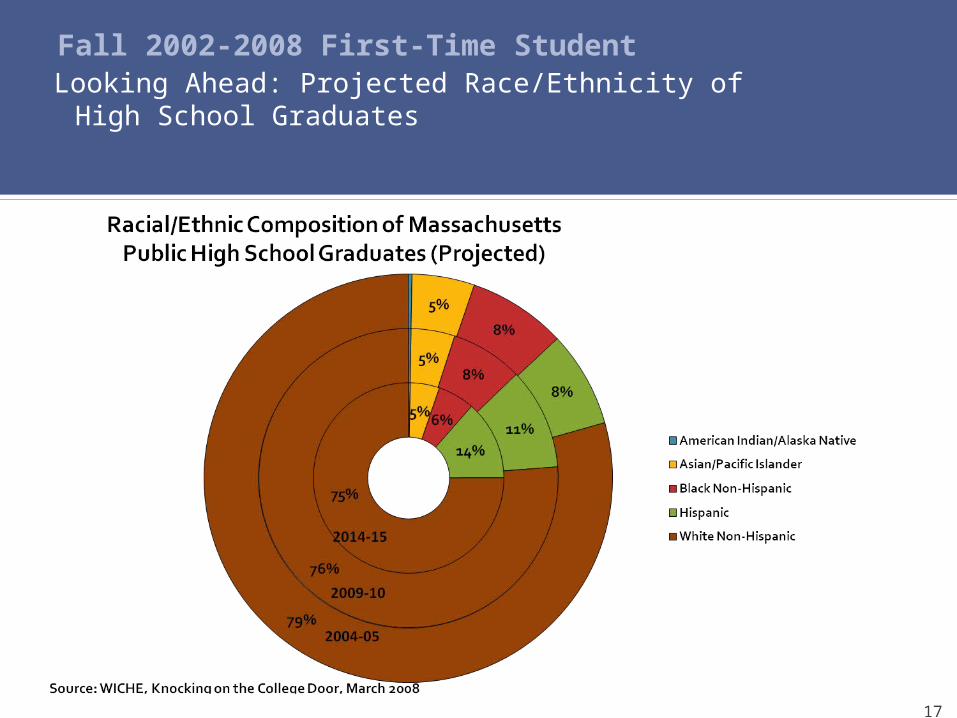
17
Fall 2002-2008 First-Time StudentLooking Ahead: Projected Race/Ethnicity of
High School Graduates
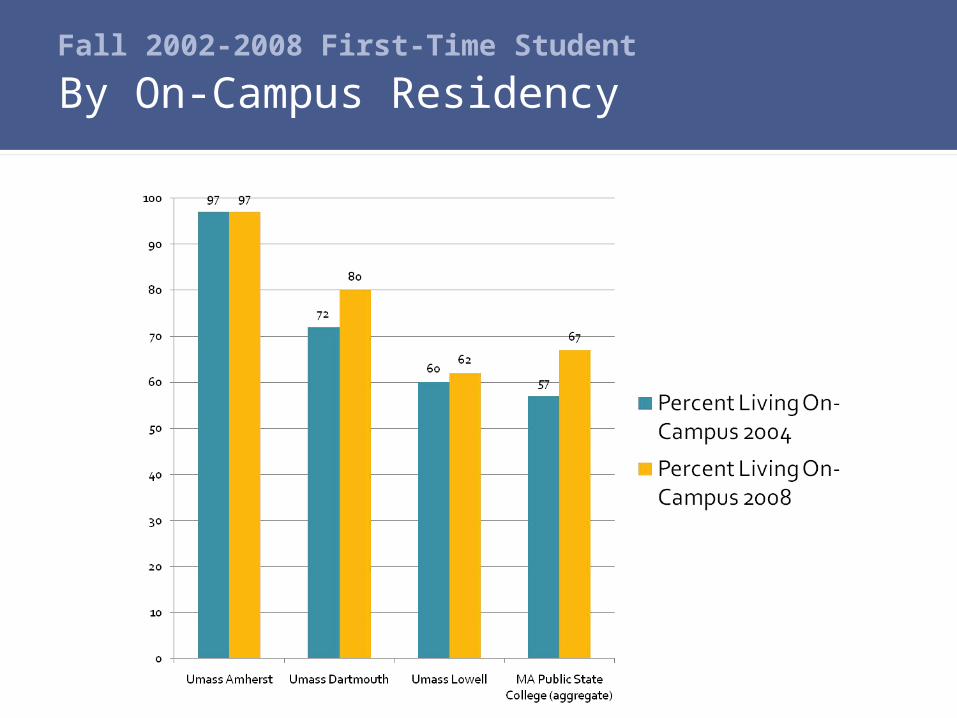
Fall 2002-2008 First-Time Student
By On-Campus Residency
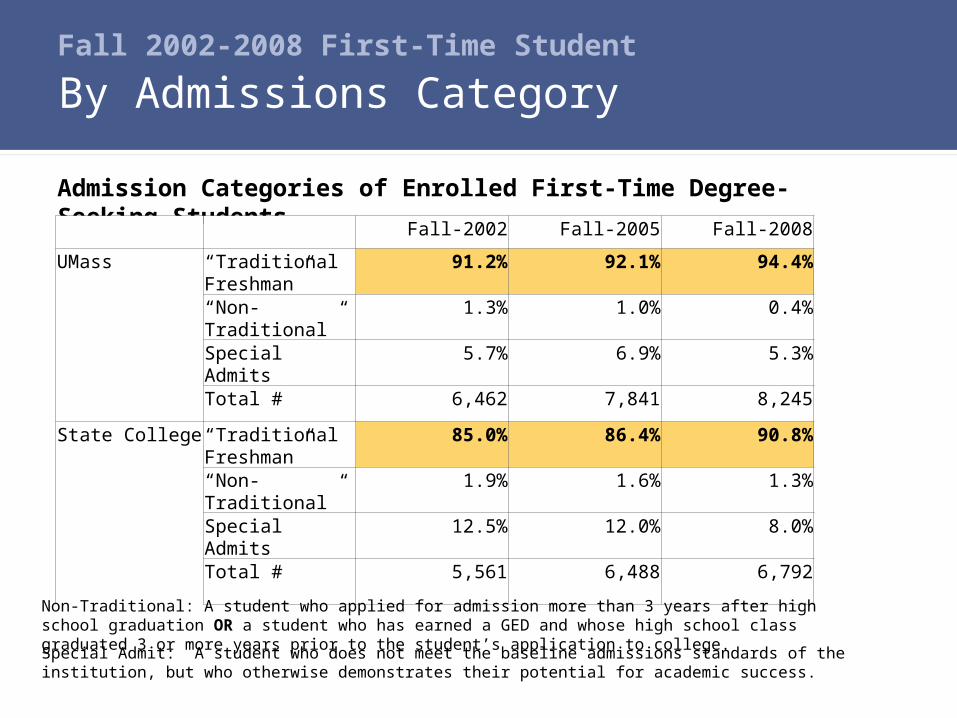
Fall 2002-2008 First-Time Student
By Admissions Category
Admission Categories of Enrolled First-Time Degree-Seeking Students Fall-2002 Fall-2005 Fall-2008
UMass “Traditional Freshman”
91.2% 92.1% 94.4%
“Non-Traditional” 1.3% 1.0% 0.4%
Special Admits 5.7% 6.9% 5.3%
Total # 6,462 7,841 8,245
State College “Traditional Freshman”
85.0% 86.4% 90.8%
“Non-Traditional” 1.9% 1.6% 1.3%
Special Admits 12.5% 12.0% 8.0%
Total # 5,561 6,488 6,792
Non-Traditional: A student who applied for admission more than 3 years after high school graduation OR a student who has earned a GED and whose high school class graduated 3 or more years prior to the student’s application to college.Special Admit: A student who does not meet the baseline admissions standards of the institution, but who otherwise demonstrates their potential for academic success.
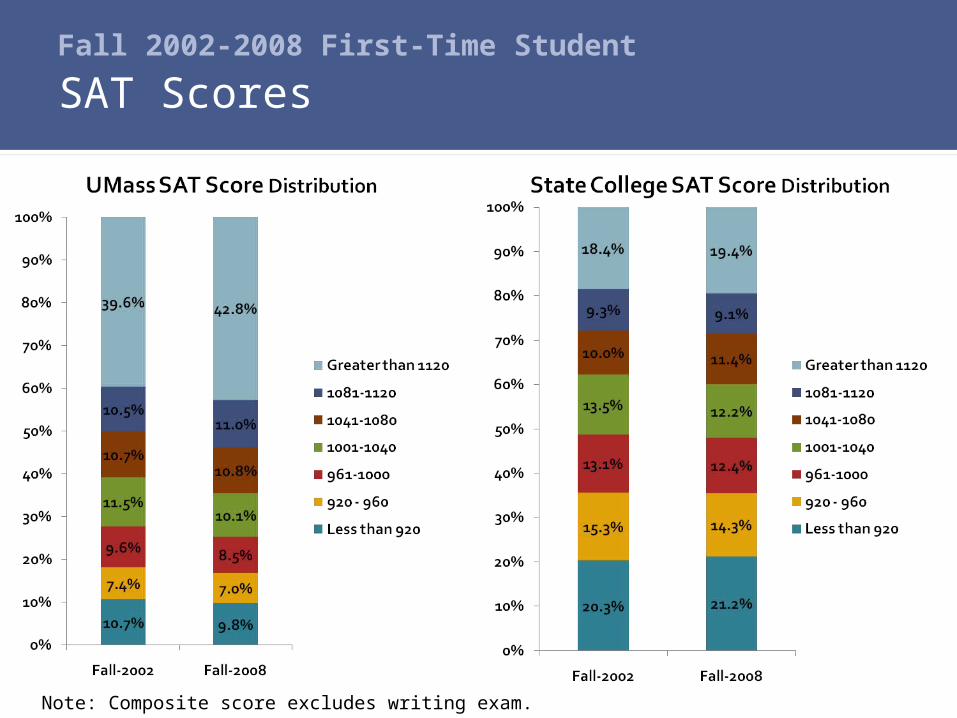
Fall 2002-2008 First-Time Student
SAT Scores
Note: Composite score excludes writing exam.
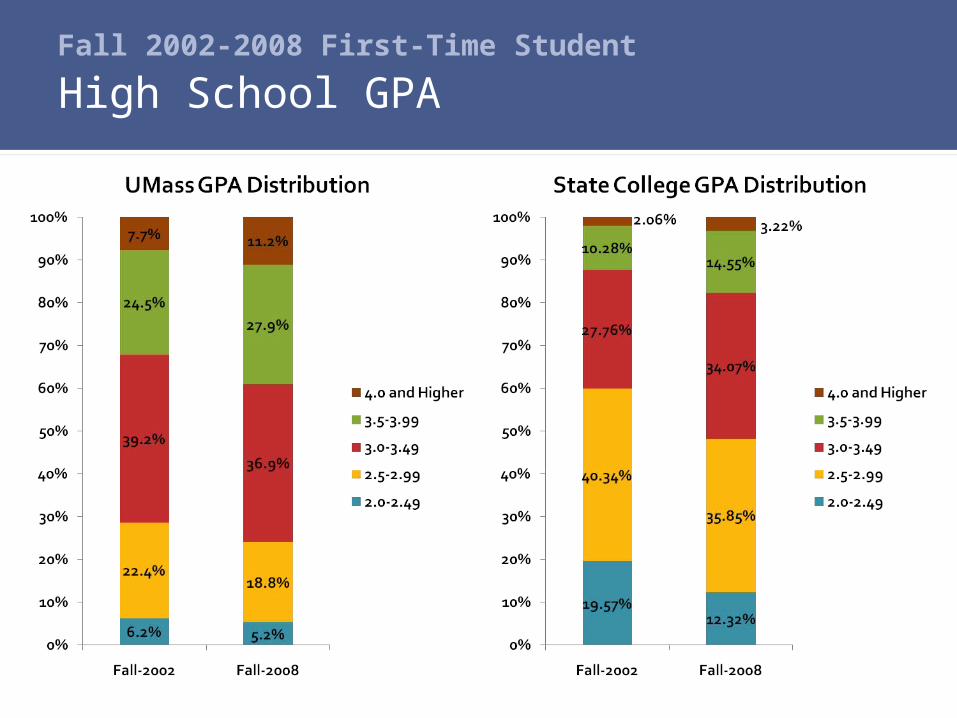
Fall 2002-2008 First-Time Student
High School GPA
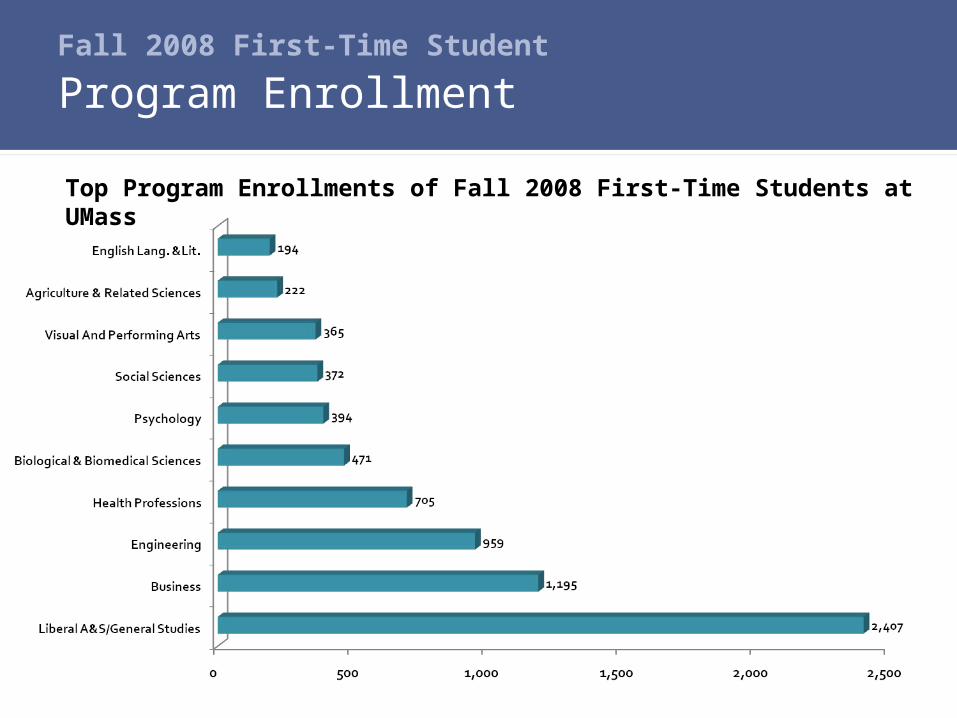
Fall 2008 First-Time Student
Program Enrollment
Top Program Enrollments of Fall 2008 First-Time Students at UMass
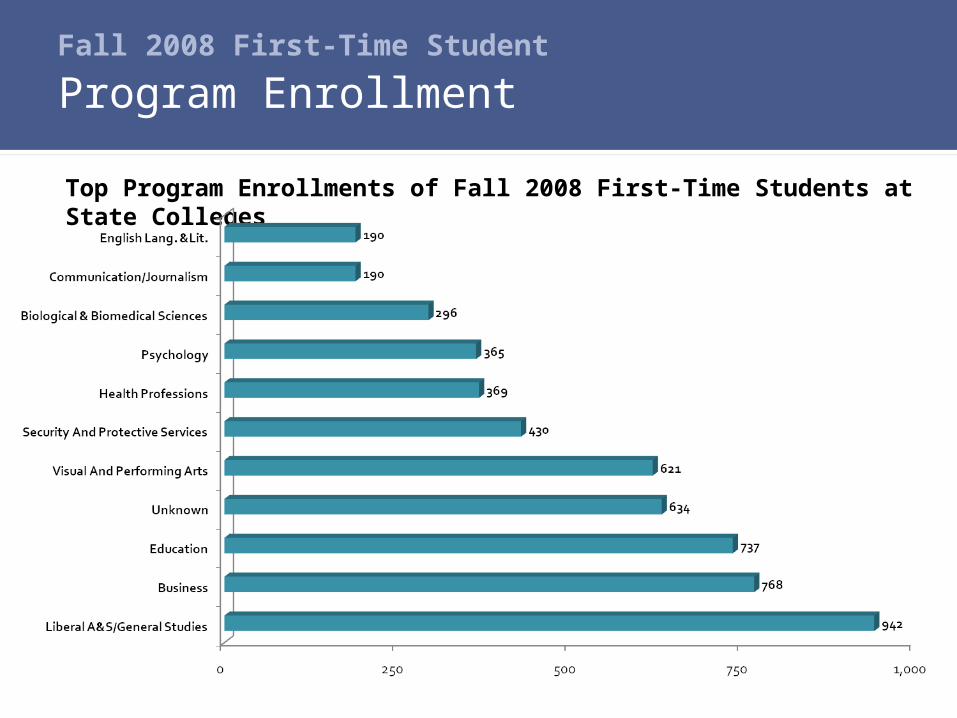
Fall 2008 First-Time Student
Program Enrollment
Top Program Enrollments of Fall 2008 First-Time Students at State Colleges
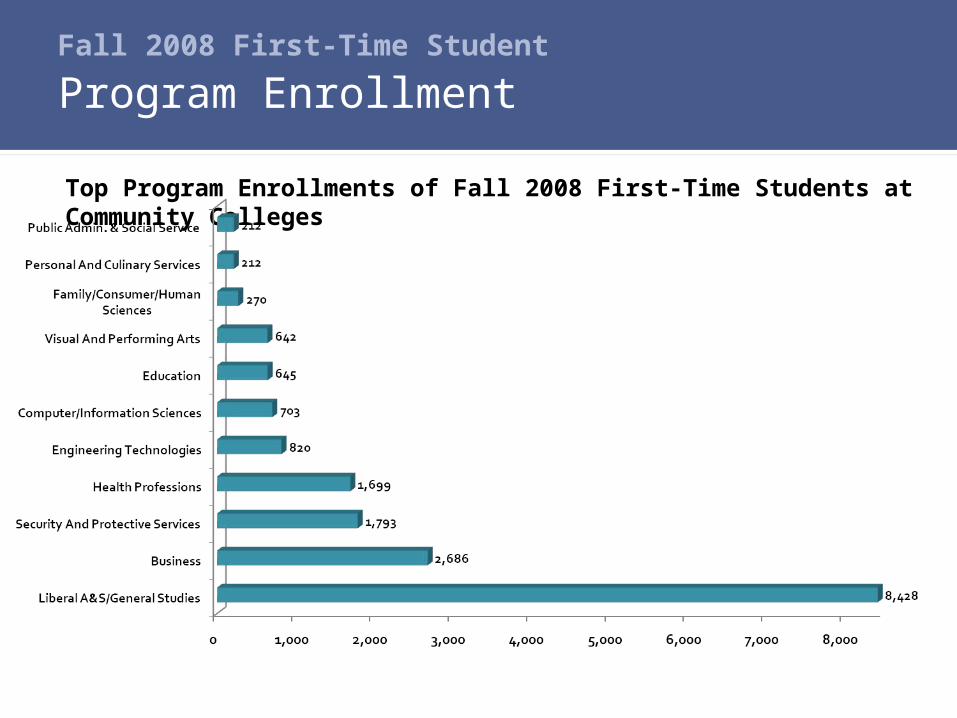
Fall 2008 First-Time Student
Program Enrollment
Top Program Enrollments of Fall 2008 First-Time Students at Community Colleges
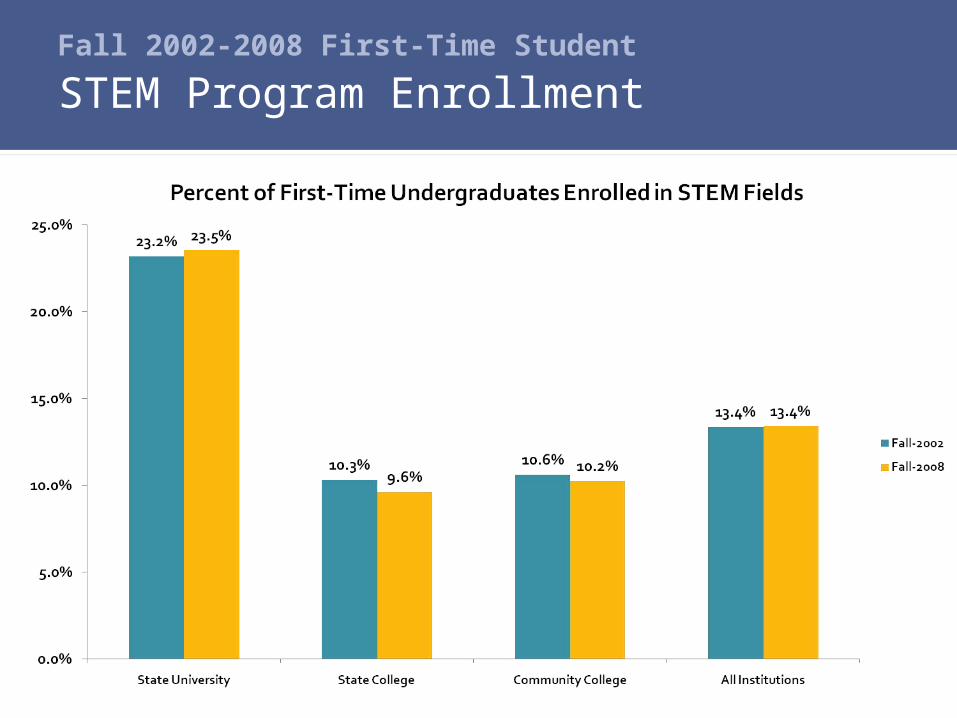
Fall 2002-2008 First-Time Student
STEM Program Enrollment
Fall 2002-2008 First-Time Student
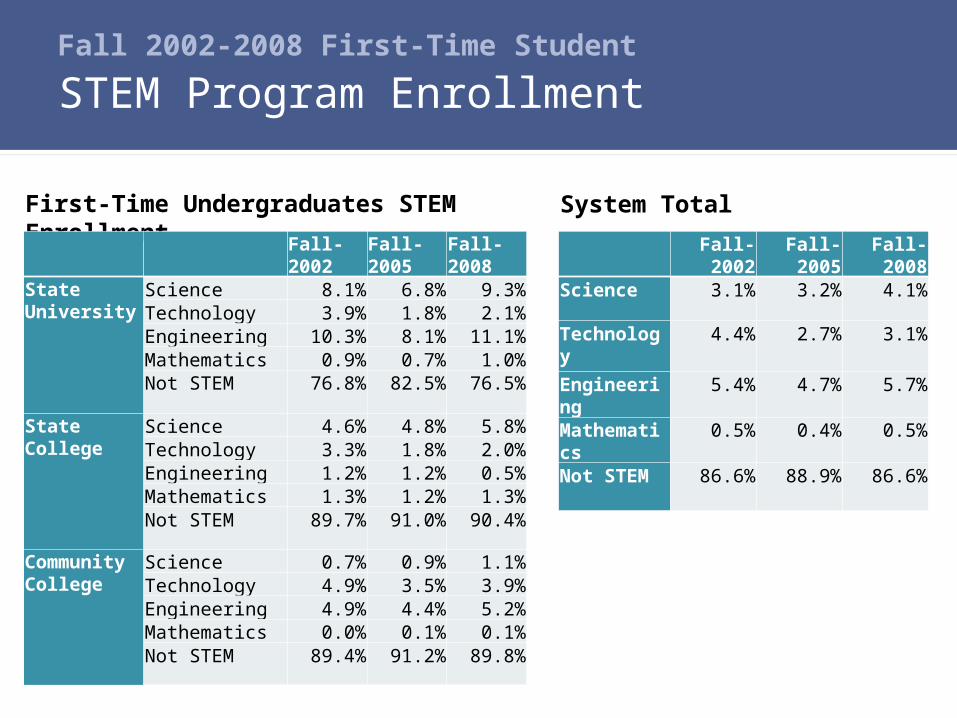
STEM Program Enrollment
First-Time Undergraduates STEM Enrollment
Fall-2002
Fall-2005
Fall-2008
State University
Science 8.1% 6.8% 9.3%Technology 3.9% 1.8% 2.1%Engineering 10.3% 8.1% 11.1%Mathematics 0.9% 0.7% 1.0%Not STEM 76.8% 82.5% 76.5%
State College
Science 4.6% 4.8% 5.8%Technology 3.3% 1.8% 2.0%Engineering 1.2% 1.2% 0.5%Mathematics 1.3% 1.2% 1.3%Not STEM 89.7% 91.0% 90.4%
Community College
Science 0.7% 0.9% 1.1%Technology 4.9% 3.5% 3.9%Engineering 4.9% 4.4% 5.2%Mathematics 0.0% 0.1% 0.1%Not STEM 89.4% 91.2% 89.8%
Fall-2002
Fall-2005
Fall-2008
Science 3.1% 3.2% 4.1%Technology
4.4% 2.7% 3.1%
Engineering
5.4% 4.7% 5.7%
Mathematics
0.5% 0.4% 0.5%
Not STEM 86.6% 88.9% 86.6%
System Total