Embed Size (px)
Citation preview
1
Highlights
Banana peel can be utilized as a promising alternative for the commercial production of
pectin.
The process parameters were investigated and optimized using artificial neural network
(ANN) and response surface methodology (RSM).
The physiochemical characterization of pectin was carried out at optimized operating
conditions.
The extracted pectin was characterized in terms of moisture, anhydrouronic acid, and
degree of esterification, ash, equivalent weight and methoxyl contents.
Experiments carry out using Neural Network Toolbox of MAT LAB version 8.1
(R2013a) and Central composite design (CCD) through design expert 11.0.0 software to
evaluate the effect of process variables on oil yield.
2
Artificial Neural Networks (ANNs) and Response Surface Methodology (RSM) Approach
for Modeling and Optimization of pectin extraction from banana peel
ERMIAS GIRMA AKLILU
School of Chemical Engineering, Jimma Institute of Technology, Jimma University, Jimma,
Ethiopia
Corresponding author’s e-mail:[email protected]; [email protected]
Abstract
The present study, the influence of three independent variables for extraction of pectin
were investigated and optimized using artificial neural network and response surface
methodology on the yield and degree of esterification of banana peel pectin obtained using acid
extraction method. The results revealed that properly trained artificial neural network model is
found to be more accurate in prediction as compared to response surface method model. The
optimum conditions were found to be temperature of 82oC, pH of 2 and extraction time of 102
min in the desirable range of the order of 0.977. The yield of pectin and degree of esterification
under these optimum conditions was 15.64% and 65.94, respectively. Temperature, extraction
time and pH revealed a significant (p < 0.05) effect on the pectin yield and degree of
esterification. The extracted banana peel pectin was categorized as high methoxyl pectin, based
on the high methoxyl content and degree of esterification. In general, the findings of the study
show that banana peel can be explored as a promising alternative for the commercial production
of pectin.
Keywords: Banana peel; Pectin; Artificial Neural Networks; Response surface methodology;
Extraction
Introduction
The cultivated desert banana and plantain (Musa sp.) are considered as one of the most
important food crop for tropical and subtropical region and play important role in food security
and economy (Waghmare and Arya, 2016). In Ethiopia banana is considered as the most popular
fruit crop that is most broadly grown and consumed. It covers about 59.64% of the overall fruit
area, approximately 68.00% of the entire fruits produced, and about 38.30% of the total fruit
3
producing farmers (Woldu et al. 2015). Bananas are most widely consumed as a raw, and
processed into products such as banana flour, chips/crackers, and puree. Banana fruit peels
constitute about 30% of the fruit, and represent an environmental problem due to their large
nitrogen and phosphorus contents as well as their high water content, making them highly
susceptible to microbial degradation(Oliveira et al. 2016). Utilization of banana peels as a source
of high value compounds like pectin (Happi Emaga et al. 2008), cellulose nanofibers and
phenolic compounds is interesting not only from an economic point of view, but also from an
environmental perspective(González-Montelongo et al. 2010).
Pectin is a water-soluble, methylated ester of polygalacturonic acid which contains
methoxylgalacturonic acid and galacturonic acid as their key components(Liu et al. 2015) and
present within all dicotyledonous plant cell walls. Pectin is considered as one of the most
valuable products which can be primarily extracted from apple pomace, citrus peel, guava
extract, sugar beet and sunflower heads. Pectin’s are widely used as a functional ingredient
within the food industry, pharmacy and cosmetic manufacture thanks to its ability to form
aqueous gels, dispersion stabilizer (Mohamed, 2016). Generally, two types of pectin are
available in nature such as high methoxyl pectin (greater than 50% DE) and low methoxyl pectin
(below 50% DE) forms gel after heating in sugar solutions at concentration above 55% and pH
below 3.5. On the other hand, the formation of gel with a low methoxyl pectin (LMP; DE <
50%) requires the presence of calcium ions, extending the use of this gelling agent to a broader
range of foods(Wai et al. 2010).
The effect of process parameters on pectin yield during extraction from banana peels have
been studied by several researchers, however, to the best our knowledge there was no report on
the detailed analysis of process parameters for extraction of pectin and degree of
esterification(DE) from banana peel by coupling ANN and RSM methodology. The RSM is a
statistical mathematical tool that widely employed to examine multiple regression analysis using
quantitative data obtained from appropriate experiments to determine and simultaneously solve
multivariant equations. In recent years, artificial neural network (ANN) has arisen as an efficient
and attractive approach for nonlinear multifactor modeling due to its generic structure and ability
to learn from historical data. ANN is a powerful mathematical method suitable for modeling and
simulation of various processes in real engineering application.
4
Therefore in the present work, RSM and ANN linked genetic algorithm-based models
have been developed to predict the relationship between the input variables and the output
variables. Subsequently, the results predicted by the ANN and RSM techniques were
compared statistically to the coefficient of determination (R2), root mean square error (RMSE),
mean absolute error (MAE), standard error of prediction (SEP%), and absolute average deviation
(AAD%) based on the validation data set for their predictive and generalization capabilities. An
effective RSM model and a feed-forward neural network on back-propagation were developed
by utilizing the experimental data, and the efficiency of both models was compared. Therefore, it
is important to identify appropriate extraction conditions to obtain maximum possible yield of
pectin from banana peel. Therefore, this study was conducted to investigate the effect of
extraction conditions namely pH, temperature and time on yield and the degree of esterification
of banana peel pectin and to optimize these conditions to extract maximum possible pectin by
employing ANN and RSM.
2. Materials and methods
2.1 Materials
Banana (varieties: Dwarf Cavendish and Giant Cavendish) were collected from some
selected hotels, juice processing houses and restaurants in Jimma, Ethiopia. All chemicals used
for the extraction process were of analytical reagent grade.
2.2 Raw material preparation
The fresh banana peels were segregated according to their type and chopped into
approximately 1cm2 pieces using a stainless steel knife for easy drying and washed with water
three times. Sample drying was carried out in an oven at 60°C for 48 hours to obtain easily
crushable material. The dried peel was milled using a mechanical grinder and then screened to
pass through a sieve size of 60 meshes and packed in an airtight, moisture-proof bag at room
temperature and ready for the extraction process.
2.3 Preparation alcohol insoluble solids
Banana peel powder of the samples were homogenized in boiling ethanol (solid–liquid
ratio of 1:10, w/v) with a final ethanol concentration of 80% (v/v) at 70oC for 20min in a shaking
water-bath to inactivate possible endogenous enzymes and remove AIS. Then after, the resulting
residue was washed with distilled water and air-dried at 50°C.
2.4 Pectin extraction
5
In this study, pectin was extracted according with the methodology proposed by (do
Nascimento Oliveira et al., 2018), with a few modifications. An alcohol insoluble solid was
mixed in a conical flask with the extracted solution (solid-liquid ratio of 1:40 (w/v). Pectin was
extracted from alcohol insoluble solids by using three different extraction conditions to study the
effect of each condition on the pectin yield. The extraction was done at different temperatures
(52.5, 60, 71, 82, and 89.5oC), pH (1.66, 2, 2.5, 3 and 3.34) and extraction time (44.7, 60,
82.5,105 and 120 min). The hot acid extracts were separated from the alcohol insoluble solids
residue by filtering through nylon/muslin cloth and cooled immediately by chilled water,
dispersed in an equal volume of 96% ethanol, stirred 5 min for proper mixing and allowed to
stand for 3h. The precipitate was washed 2-3 times by 70% acidic ethanol (0.5% HCl), 70%
ethanol and finally 95% ethanol. Finally, the precipitate was dried at 40°C in hot air oven
overnight to remove the moisture until a constant weight was reached. The ground powder pectin
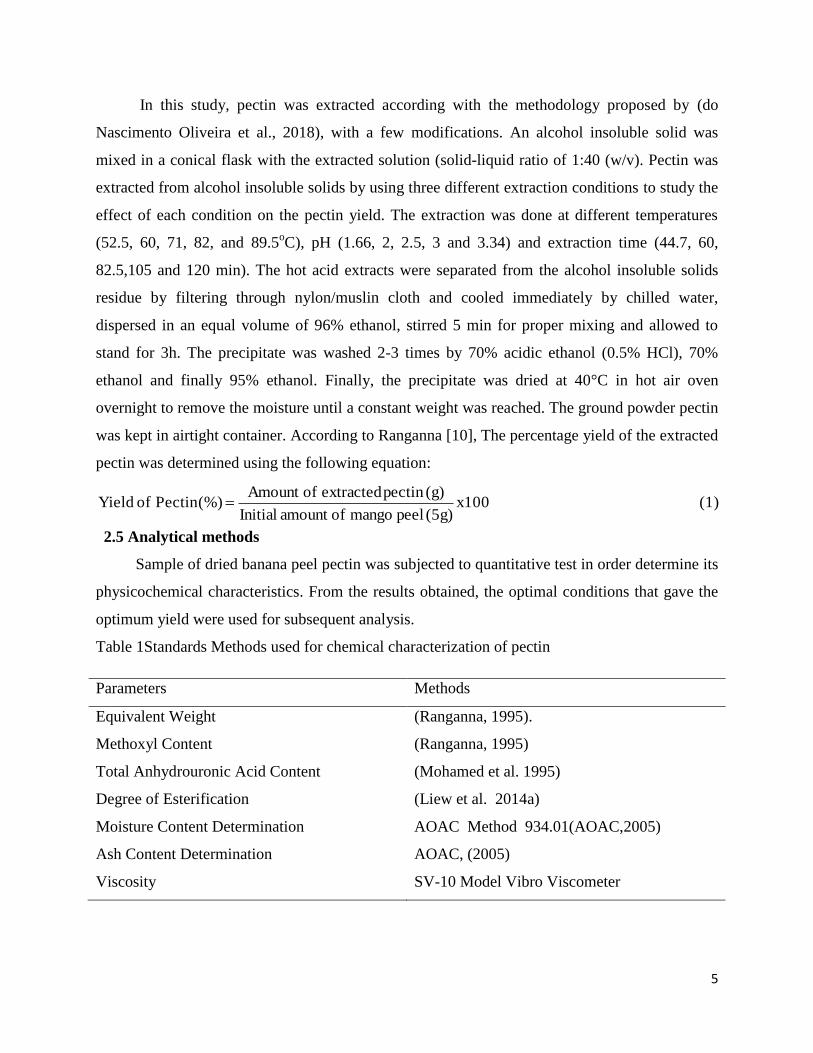
was kept in airtight container. According to Ranganna [10], The percentage yield of the extracted
pectin was determined using the following equation:
(1)x100(5g) peel mango ofamount Initial
(g)pectin extracted ofAmount (%)Pectin of Yield
2.5 Analytical methods
Sample of dried banana peel pectin was subjected to quantitative test in order determine its
physicochemical characteristics. From the results obtained, the optimal conditions that gave the
optimum yield were used for subsequent analysis.
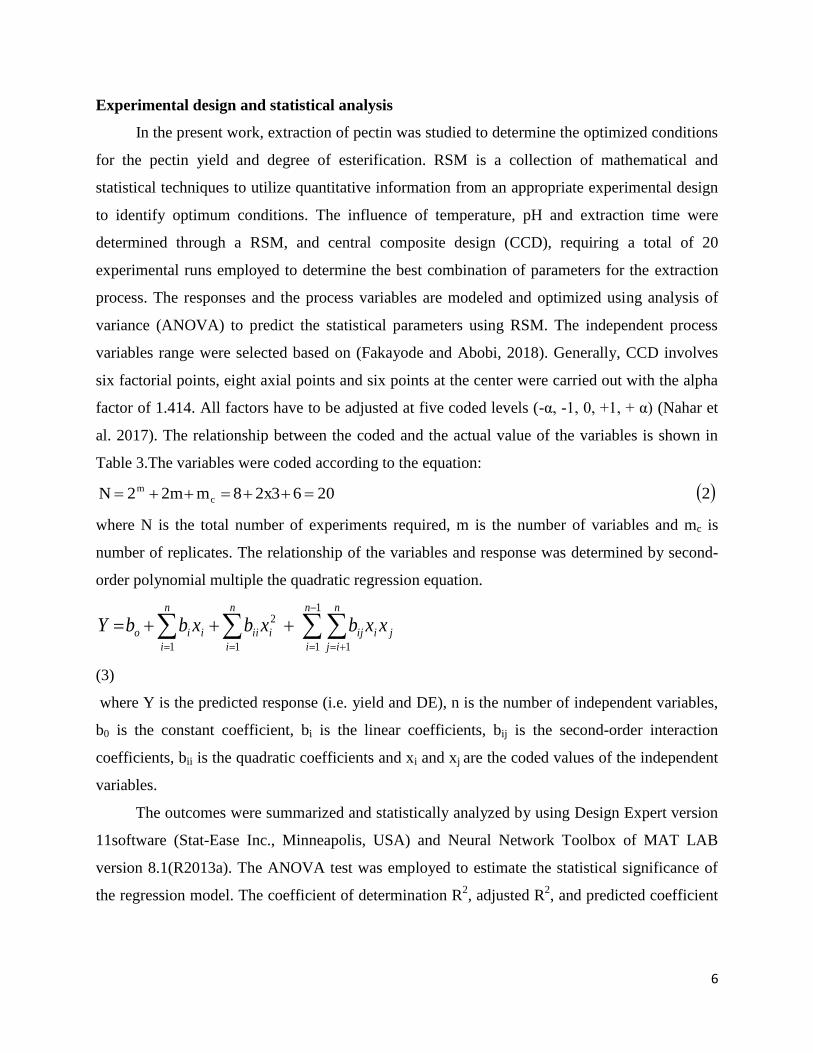
Table 1Standards Methods used for chemical characterization of pectin
Parameters Methods
Equivalent Weight (Ranganna, 1995).
Methoxyl Content (Ranganna, 1995)
Total Anhydrouronic Acid Content (Mohamed et al. 1995)
Degree of Esterification (Liew et al. 2014a)
Moisture Content Determination AOAC Method 934.01(AOAC,2005)
Ash Content Determination AOAC, (2005)
Viscosity SV-10 Model Vibro Viscometer
6
Experimental design and statistical analysis
In the present work, extraction of pectin was studied to determine the optimized conditions
for the pectin yield and degree of esterification. RSM is a collection of mathematical and
statistical techniques to utilize quantitative information from an appropriate experimental design
to identify optimum conditions. The influence of temperature, pH and extraction time were
determined through a RSM, and central composite design (CCD), requiring a total of 20
experimental runs employed to determine the best combination of parameters for the extraction
process. The responses and the process variables are modeled and optimized using analysis of
variance (ANOVA) to predict the statistical parameters using RSM. The independent process
variables range were selected based on (Fakayode and Abobi, 2018). Generally, CCD involves
six factorial points, eight axial points and six points at the center were carried out with the alpha
factor of 1.414. All factors have to be adjusted at five coded levels (-α, -1, 0, +1, + α) (Nahar et
al. 2017). The relationship between the coded and the actual value of the variables is shown in
Table 3.The variables were coded according to the equation:
22062x38m2m2N c
m
where N is the total number of experiments required, m is the number of variables and mc is
number of replicates. The relationship of the variables and response was determined by second-
order polynomial multiple the quadratic regression equation.
1
1 11 1
2n
i
n
ij
jiij
n
i
n
i
iiiiio xxbxbxbbY
(3)
where Y is the predicted response (i.e. yield and DE), n is the number of independent variables,
b0 is the constant coefficient, bi is the linear coefficients, bij is the second-order interaction
coefficients, bii is the quadratic coefficients and xi and xj are the coded values of the independent
variables.
The outcomes were summarized and statistically analyzed by using Design Expert version
11software (Stat-Ease Inc., Minneapolis, USA) and Neural Network Toolbox of MAT LAB
version 8.1(R2013a). The ANOVA test was employed to estimate the statistical significance of
the regression model. The coefficient of determination R2, adjusted R
2, and predicted coefficient
7
R2, lack of fit from ANOVA were used in the determination of the quality of the developed
model.
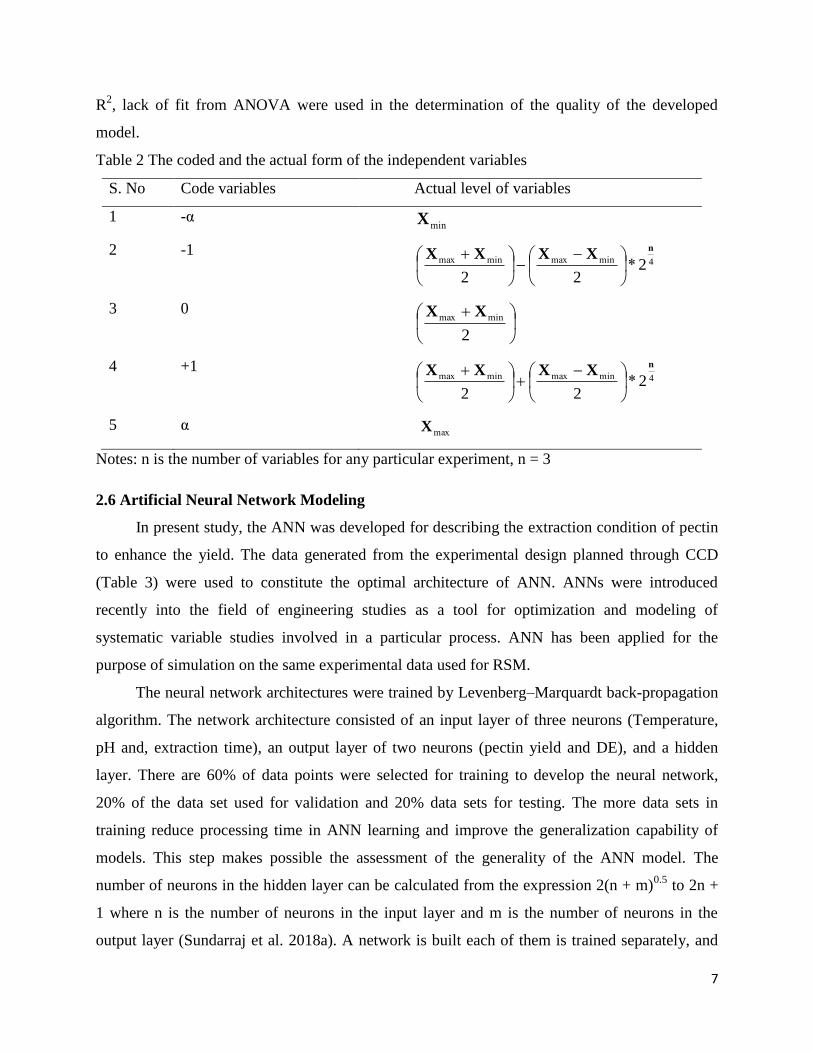
Table 2 The coded and the actual form of the independent variables
S. No Code variables Actual level of variables
1 -α minX
2 -1 42
22
nXXXX
*minmaxminmax
3 0
2
minmax XX
4 +1 42
22
nXXXX
*minmaxminmax
5 α maxX
Notes: n is the number of variables for any particular experiment, n = 3
2.6 Artificial Neural Network Modeling
In present study, the ANN was developed for describing the extraction condition of pectin
to enhance the yield. The data generated from the experimental design planned through CCD
(Table 3) were used to constitute the optimal architecture of ANN. ANNs were introduced
recently into the field of engineering studies as a tool for optimization and modeling of
systematic variable studies involved in a particular process. ANN has been applied for the
purpose of simulation on the same experimental data used for RSM.
The neural network architectures were trained by Levenberg–Marquardt back-propagation
algorithm. The network architecture consisted of an input layer of three neurons (Temperature,
pH and, extraction time), an output layer of two neurons (pectin yield and DE), and a hidden
layer. There are 60% of data points were selected for training to develop the neural network,
20% of the data set used for validation and 20% data sets for testing. The more data sets in
training reduce processing time in ANN learning and improve the generalization capability of
models. This step makes possible the assessment of the generality of the ANN model. The
number of neurons in the hidden layer can be calculated from the expression 2(n + m)0.5
to 2n +
1 where n is the number of neurons in the input layer and m is the number of neurons in the
output layer (Sundarraj et al. 2018a). A network is built each of them is trained separately, and
8
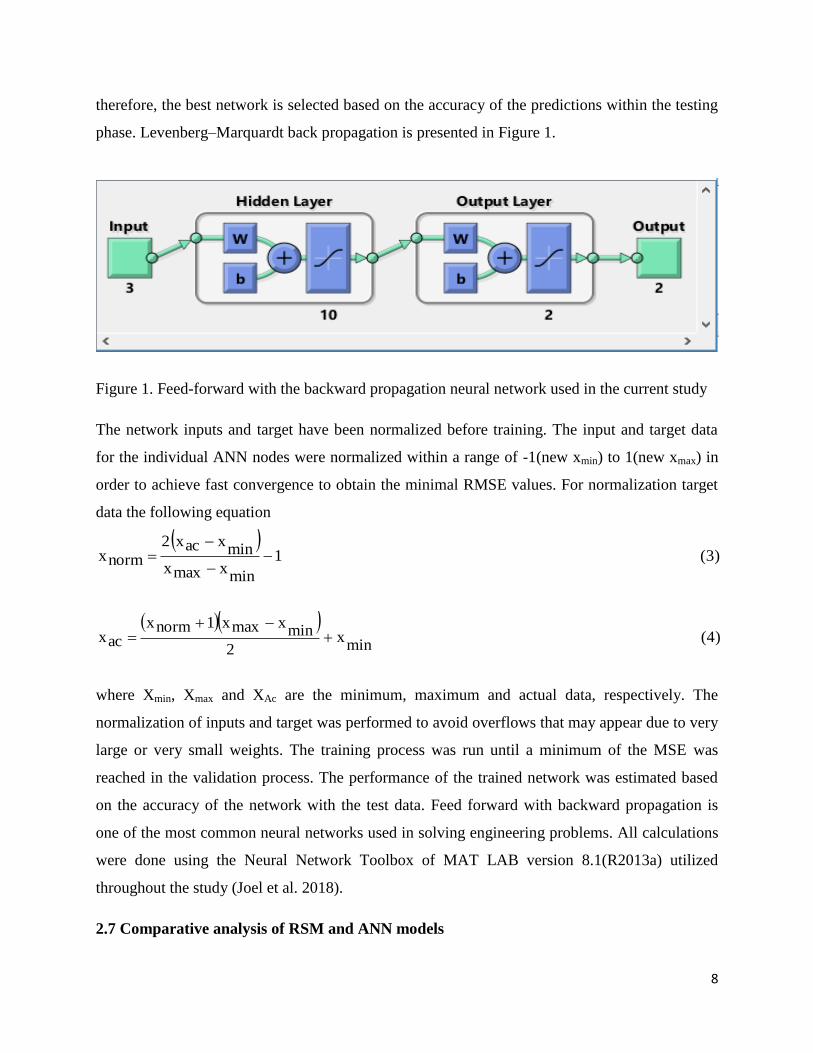
therefore, the best network is selected based on the accuracy of the predictions within the testing
phase. Levenberg–Marquardt back propagation is presented in Figure 1.
Figure 1. Feed-forward with the backward propagation neural network used in the current study
The network inputs and target have been normalized before training. The input and target data
for the individual ANN nodes were normalized within a range of -1(new xmin) to 1(new xmax) in
order to achieve fast convergence to obtain the minimal RMSE values. For normalization target
data the following equation
(3) 1
minxmaxx
minxacx2
normx
(4)
minx
2
minxmaxx1normx
acx
where Xmin, Xmax and XAc are the minimum, maximum and actual data, respectively. The
normalization of inputs and target was performed to avoid overflows that may appear due to very
large or very small weights. The training process was run until a minimum of the MSE was
reached in the validation process. The performance of the trained network was estimated based
on the accuracy of the network with the test data. Feed forward with backward propagation is
one of the most common neural networks used in solving engineering problems. All calculations
were done using the Neural Network Toolbox of MAT LAB version 8.1(R2013a) utilized
throughout the study (Joel et al. 2018).
2.7 Comparative analysis of RSM and ANN models
9
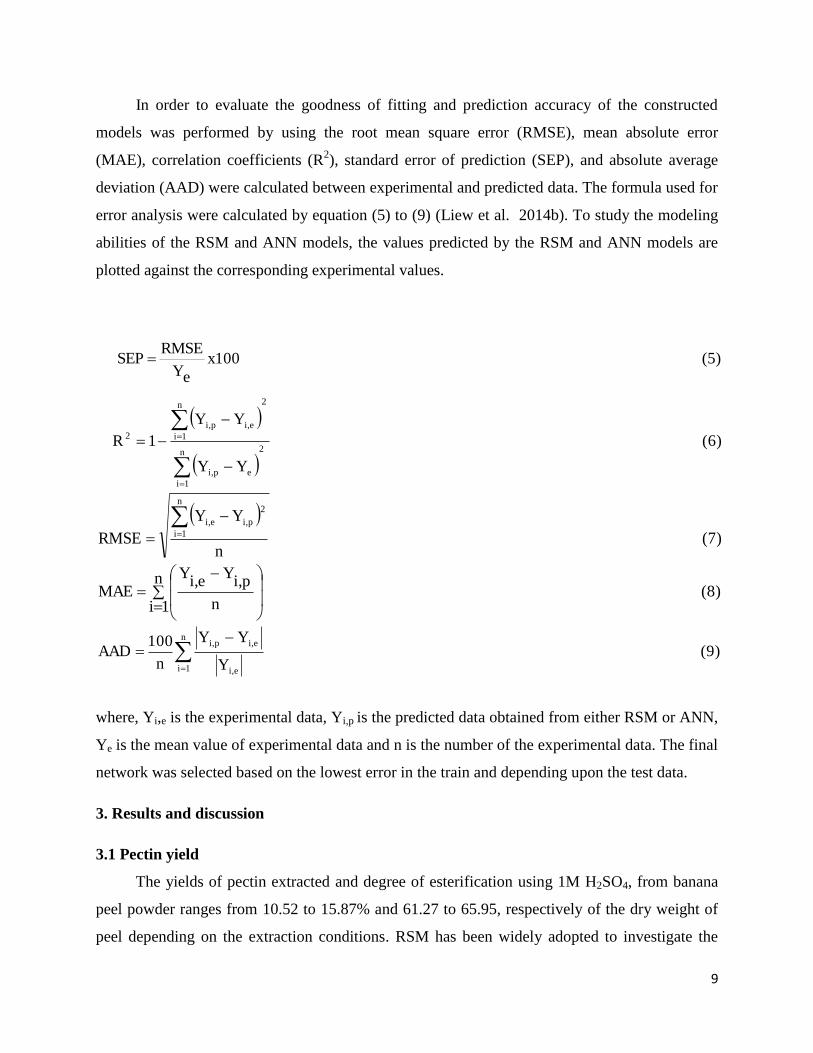
In order to evaluate the goodness of fitting and prediction accuracy of the constructed
models was performed by using the root mean square error (RMSE), mean absolute error
(MAE), correlation coefficients (R2), standard error of prediction (SEP), and absolute average
deviation (AAD) were calculated between experimental and predicted data. The formula used for
error analysis were calculated by equation (5) to (9) (Liew et al. 2014b). To study the modeling
abilities of the RSM and ANN models, the values predicted by the RSM and ANN models are
plotted against the corresponding experimental values.
(7)
n
YY
RMSE
n
1i
2
pi,ei,
(8)n
1i n
pi,Y
ei,Y
MAE
(9)Y
YY
n
100AAD
n
1i ei,
ei,pi,
where, Yi,e is the experimental data, Yi,p is the predicted data obtained from either RSM or ANN,
Ye is the mean value of experimental data and n is the number of the experimental data. The final
network was selected based on the lowest error in the train and depending upon the test data.
3. Results and discussion
3.1 Pectin yield
The yields of pectin extracted and degree of esterification using 1M H2SO4, from banana
peel powder ranges from 10.52 to 15.87% and 61.27 to 65.95, respectively of the dry weight of
peel depending on the extraction conditions. RSM has been widely adopted to investigate the
(5)x100
eY
RMSESEP
(6)
YY
YY
1R2n
1i
epi,
2n
1i
ei,pi,
2

10
effects of several design factors influencing a response by varying them simultaneously in a
limited set of experiments. Thus, temperature, pH and extraction time were examined as factors
to investigate the correlation between the process variables to the pectin yield and DE by using
CCD. The complete experiment variables design matrix together with the values of experimental
responses is presented in Table 3. The analysis of variance was carried out to investigate the
model terms, to select a suitable model, and to detect the significances of the model equation.
Table 3 Central Composite design matrix and experimental results
Run Coded variable Decoded Variable Dependent Variable
A B C Temp(oC) pH Time (min) Pectin yield (%) DE
1 -α 0 0 52.5 2.5 82.5 12.08 62.98
2 0 0 0 71 2.5 82.5 14.32 64.97
3 1 -1 -1 82 2 60 14.65 65.13
4 1 1 1 82 3 105 12.84 63.25
5 0 0 0 71 2.5 82.5 14.26 64.88
6 1 1 -1 82 3 60 11.67 62.16
7 -1 1 -1 60 3 60 10.52 61.27
8 -1 -1 -1 60 2 60 12.74 63.11
9 0 0 +α 71 2.5 120 14.49 65.07
10 0 0 0 71 2.5 82.5 14.19 64.75
11 0 -α 0 71 1.7 82.5 14.86 65.52
12 0 0 0 71 2.5 82.5 14.23 64.79
13 0 0 0 71 2.5 82.5 13.98 64.43
14 0 0 -α 71 2.5 44.7 12.81 63.23
15 1 -1 1 82 2 105 15.87 65.95
16 +α 0 0 89.5 2.5 82.5 13.98 64.39
17 0 0 0 71 2.5 82.5 14.13 64.68
18 -1 -1 1 60 2 105 13.78 64.24
19 -1 1 1 60 3 105 12.53 63.08
20 0 +α 0 71 3.3 82.5 10.62 61.58
11
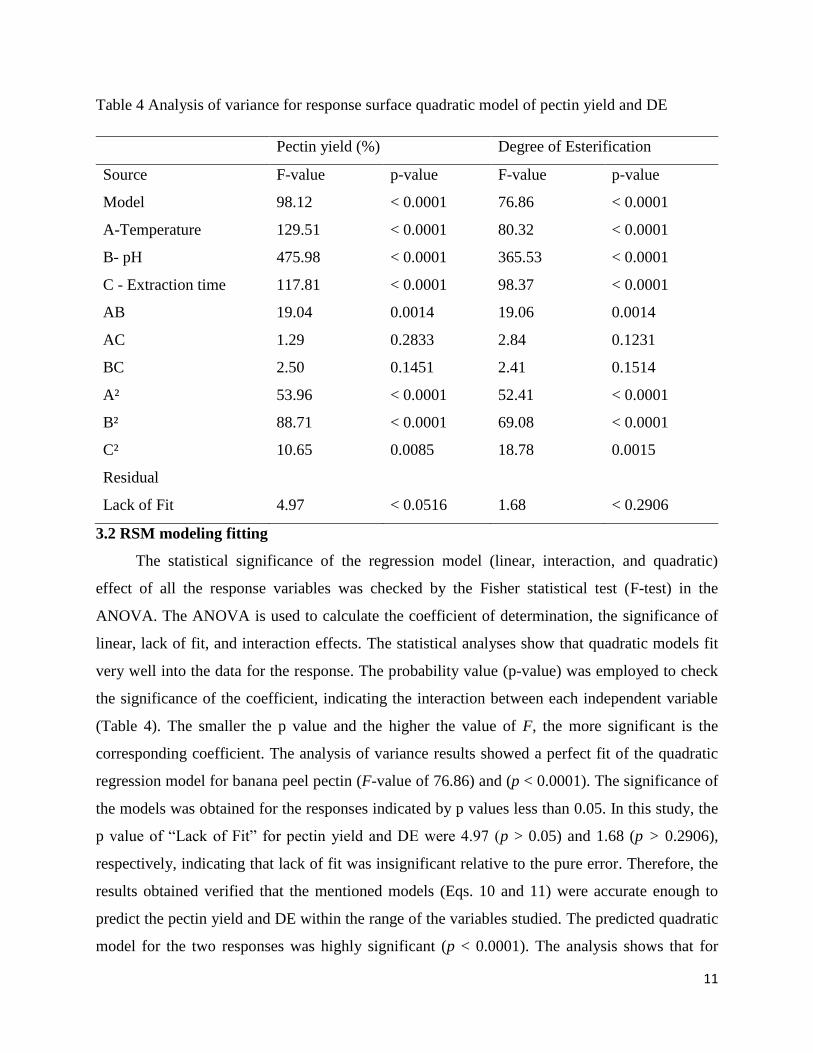
Table 4 Analysis of variance for response surface quadratic model of pectin yield and DE
Pectin yield (%) Degree of Esterification
Source F-value p-value F-value p-value
Model 98.12 < 0.0001 76.86 < 0.0001
A-Temperature 129.51 < 0.0001 80.32 < 0.0001
B- pH 475.98 < 0.0001 365.53 < 0.0001
C - Extraction time 117.81 < 0.0001 98.37 < 0.0001
AB 19.04 0.0014 19.06 0.0014
AC 1.29 0.2833 2.84 0.1231
BC 2.50 0.1451 2.41 0.1514
A² 53.96 < 0.0001 52.41 < 0.0001
B² 88.71 < 0.0001 69.08 < 0.0001
C² 10.65 0.0085 18.78 0.0015
Residual
Lack of Fit 4.97 < 0.0516 1.68 < 0.2906
3.2 RSM modeling fitting
The statistical significance of the regression model (linear, interaction, and quadratic)
effect of all the response variables was checked by the Fisher statistical test (F-test) in the
ANOVA. The ANOVA is used to calculate the coefficient of determination, the significance of
linear, lack of fit, and interaction effects. The statistical analyses show that quadratic models fit
very well into the data for the response. The probability value (p-value) was employed to check
the significance of the coefficient, indicating the interaction between each independent variable
(Table 4). The smaller the p value and the higher the value of F, the more significant is the
corresponding coefficient. The analysis of variance results showed a perfect fit of the quadratic
regression model for banana peel pectin (F-value of 76.86) and (p < 0.0001). The significance of
the models was obtained for the responses indicated by p values less than 0.05. In this study, the
p value of “Lack of Fit” for pectin yield and DE were 4.97 (p > 0.05) and 1.68 (p > 0.2906),
respectively, indicating that lack of fit was insignificant relative to the pure error. Therefore, the
results obtained verified that the mentioned models (Eqs. 10 and 11) were accurate enough to
predict the pectin yield and DE within the range of the variables studied. The predicted quadratic
model for the two responses was highly significant (p < 0.0001). The analysis shows that for
12
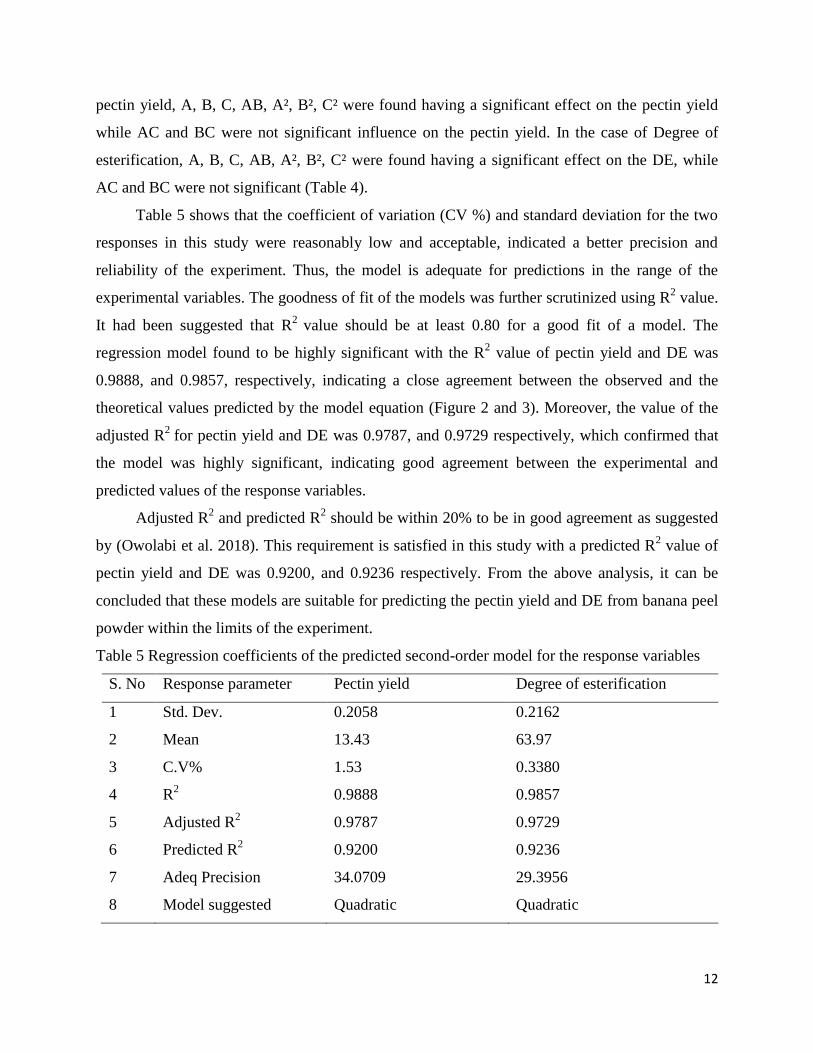
pectin yield, A, B, C, AB, A², B², C² were found having a significant effect on the pectin yield
while AC and BC were not significant influence on the pectin yield. In the case of Degree of
esterification, A, B, C, AB, A², B², C² were found having a significant effect on the DE, while
AC and BC were not significant (Table 4).
Table 5 shows that the coefficient of variation (CV %) and standard deviation for the two
responses in this study were reasonably low and acceptable, indicated a better precision and
reliability of the experiment. Thus, the model is adequate for predictions in the range of the
experimental variables. The goodness of fit of the models was further scrutinized using R2 value.
It had been suggested that R2
value should be at least 0.80 for a good fit of a model. The
regression model found to be highly significant with the R2 value of pectin yield and DE was
0.9888, and 0.9857, respectively, indicating a close agreement between the observed and the
theoretical values predicted by the model equation (Figure 2 and 3). Moreover, the value of the
adjusted R2
for pectin yield and DE was 0.9787, and 0.9729 respectively, which confirmed that
the model was highly significant, indicating good agreement between the experimental and
predicted values of the response variables.
Adjusted R2 and predicted R
2 should be within 20% to be in good agreement as suggested
by (Owolabi et al. 2018). This requirement is satisfied in this study with a predicted R2 value of
pectin yield and DE was 0.9200, and 0.9236 respectively. From the above analysis, it can be
concluded that these models are suitable for predicting the pectin yield and DE from banana peel
powder within the limits of the experiment.
Table 5 Regression coefficients of the predicted second-order model for the response variables
S. No Response parameter Pectin yield Degree of esterification
1 Std. Dev. 0.2058 0.2162
2 Mean 13.43 63.97
3 C.V% 1.53 0.3380
4 R2 0.9888 0.9857
5 Adjusted R2 0.9787 0.9729
6 Predicted R2 0.9200 0.9236
7 Adeq Precision 34.0709 29.3956
8 Model suggested Quadratic Quadratic
13
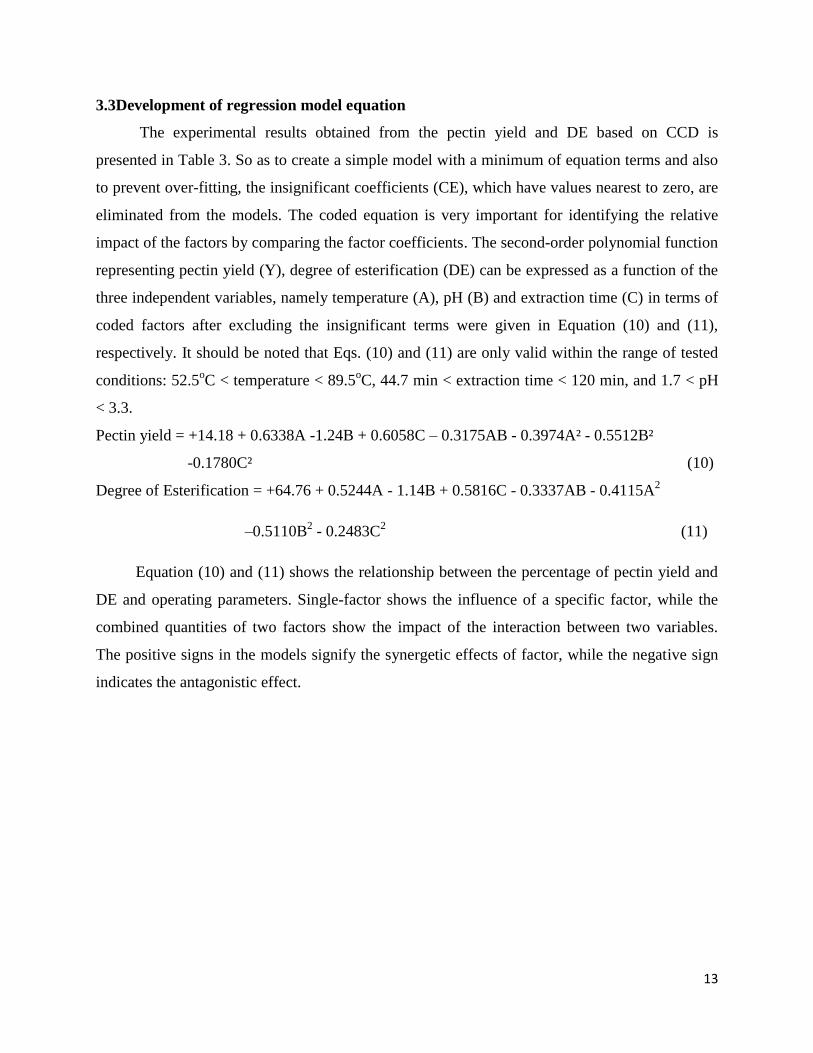
3.3Development of regression model equation
The experimental results obtained from the pectin yield and DE based on CCD is
presented in Table 3. So as to create a simple model with a minimum of equation terms and also
to prevent over-fitting, the insignificant coefficients (CE), which have values nearest to zero, are
eliminated from the models. The coded equation is very important for identifying the relative
impact of the factors by comparing the factor coefficients. The second-order polynomial function
representing pectin yield (Y), degree of esterification (DE) can be expressed as a function of the
three independent variables, namely temperature (A), pH (B) and extraction time (C) in terms of
coded factors after excluding the insignificant terms were given in Equation (10) and (11),
respectively. It should be noted that Eqs. (10) and (11) are only valid within the range of tested
conditions: 52.5oC < temperature < 89.5
oC, 44.7 min < extraction time < 120 min, and 1.7 < pH
< 3.3.
Pectin yield = +14.18 + 0.6338A -1.24B + 0.6058C – 0.3175AB - 0.3974A² - 0.5512B²
-0.1780C² (10)
Degree of Esterification = +64.76 + 0.5244A - 1.14B + 0.5816C - 0.3337AB - 0.4115A2
–0.5110B
2 - 0.2483C
2 (11)
Equation (10) and (11) shows the relationship between the percentage of pectin yield and
DE and operating parameters. Single-factor shows the influence of a specific factor, while the
combined quantities of two factors show the impact of the interaction between two variables.
The positive signs in the models signify the synergetic effects of factor, while the negative sign
indicates the antagonistic effect.
14
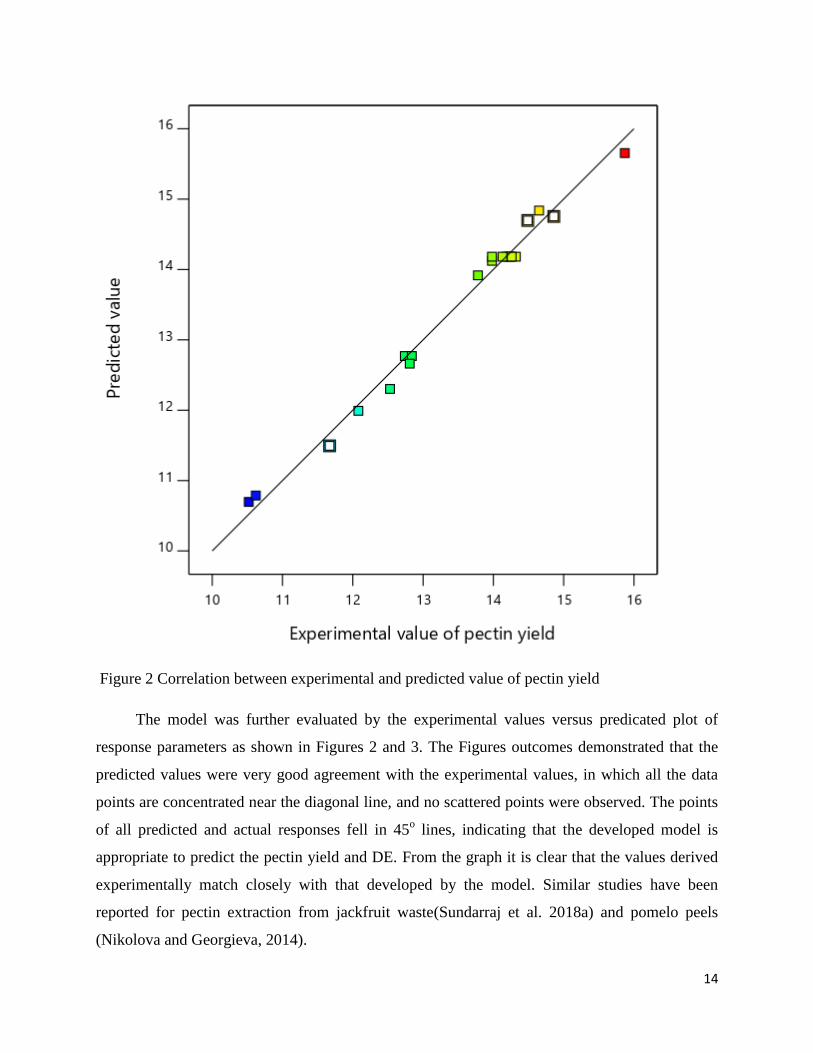
Figure 2 Correlation between experimental and predicted value of pectin yield
The model was further evaluated by the experimental values versus predicated plot of
response parameters as shown in Figures 2 and 3. The Figures outcomes demonstrated that the
predicted values were very good agreement with the experimental values, in which all the data
points are concentrated near the diagonal line, and no scattered points were observed. The points
of all predicted and actual responses fell in 45o lines, indicating that the developed model is
appropriate to predict the pectin yield and DE. From the graph it is clear that the values derived
experimentally match closely with that developed by the model. Similar studies have been
reported for pectin extraction from jackfruit waste(Sundarraj et al. 2018a) and pomelo peels
(Nikolova and Georgieva, 2014).

15
Figure 3 Correlation between experimental and predicted value of DE
3.4 Response surface analysis of extraction process
The three-dimensional response surfaces plots help to understand the main and interaction
effects on the responses in a straightforward way. The regression models developed in this study
have four independent variables; two variables are held constant at the optimum level, whereas
the other two factors are varying within their experimental range. Based on the analysis of
variance, the pectin yield and degree of esterification were significantly affected by linear,
interaction and quadratic process variables. The most significant interactive effects on each
response are demonstrated in Figs. 4 and 5 through 3D response surface plots.
16
3.5 Effect of extraction condition on the pectin yield
The present work was carried out under different experimental conditions (temperature,
pH and extraction time) shown in Table 3. Pectin yield obtained in this experiment was found to
be in the range of10.52-15.87% (Table 3), which is comparable to the ripe mango peel pectin
(10.76-30.43%) (Nahar et al. 2017), Citrus sinensis peels (12.93–29.05%)(Fakayode and Abobi,
2018) and mango peel pectin (6.1-16.3%) (Girma and Worku, 2016; Sangheetha et al. 2018).
Pectin yield obtained in this study is in agreement with previous studies(Sangheetha et al., 2018).
Pectin extracted from banana peel was lower than Artocarpus integer (15.80 - 39.05%)
(Sundarraj et al. 2018b), Azanza garckeana (24.38 and 26.75%) (Joel et al., 2018), grapefruit
peels (25%)(Mohamed, 2016) and Ubá mango peel (18.8 - 32.1%) at different cooking
conditions (Liew et al. 2014b), but higher than that of Durio zibethinus (2.27-9.35%,w/w) (Wai
et al. 2009) and passion fruit peels (7.12-7.16%) (Wai et al. 2009). According to (Happi Emaga
et al. 2008) reported that the yield of pectin extracted from the banana peel ranges from 2.4-
21.7% while (Khamsucharit et al. 2018) reported that the yield of banana peel pectin ranged
from 15.89 to 24.08%. These differences may be due to the nature of the fruits and extraction
processing conditions.
Generally, compared to the data obtained from different sources, pectin yield lies in the
accepted limits of pectin extracted conditions as suggested by (Khamsucharit et al. 2018; Liew et
al. 2014b) According to the results presented herein, it is evident that the pectin yield of banana
peel was comparable to values obtained from the conventional sources of pectin (i.e. apple
pomace, sugar beet and citrus peel) thus, signifying the potential use of banana peel as an
alternative source for the commercial-scale pectin production. Pectin yield was directly
proportional to temperature and extraction time and indicated that increasing any of those
parameters would result increase the pectin yield until the optimum value was achieved (Eq.10).
The yields always increased if temperature and extraction time increased (with the other
remaining constant), because each of these factors increases the solubility of the extracted pectin,
giving a higher rate of extraction. However, further increase in temperature and extraction time
decreasing the tendency of pectin yield, since too high extraction time and temperature would
lead to breaking down of pectin molecules as pectin is composed of α-(1-4) inked units of
galacturonic acid or methyl ester resulting in pectin of lower molecular size which is not
perceptible with alcohol. Besides, the colors of the pectin extract became dark brown which in
17
turn required a higher number of alcoholic washing of the precipitate. At lower temperatures, the
lower viscosity of pectin might cause poor diffusion between the phases that will lead to a slower
rate of extraction.
The result shows that the yield increases with an increase in extraction time as the
prospecting naturally present in cells takes time to solubilize and go into the solution. The
temperature, pH and extraction time show a significant (p < 0.0001) effect on the pectin yield.
The pH value has the most significant effect on the pectin yield whose F value is 475.98,
followed by extraction temperature and time (Table 4). The pH value was inversely proportional
to pectin yield and indicated that increasing the value of pH would result in a decreasing
percentage of pectin yield (Eq.10). A similar effect was noted in the extraction of pectin from
durian rind (Sangheetha et al. 2018). The pectin yield decreases with increasing pH value; this is
might be due to some pectin that might still be attached to the cell wall components although,
pectin molecules can be partially solubilized from plant tissues without degradation in a weak
acid solution.
18
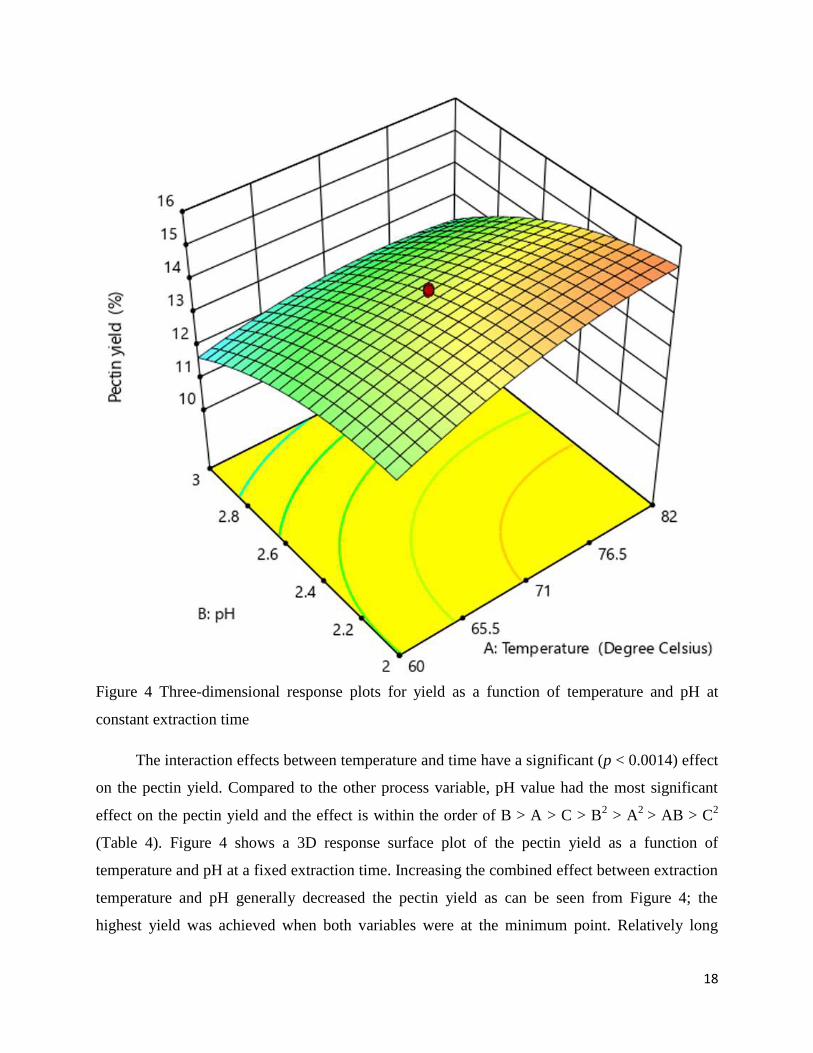
Figure 4 Three-dimensional response plots for yield as a function of temperature and pH at
constant extraction time
The interaction effects between temperature and time have a significant (p < 0.0014) effect
on the pectin yield. Compared to the other process variable, pH value had the most significant
effect on the pectin yield and the effect is within the order of B > A > C > B2 > A
2 > AB > C
2
(Table 4). Figure 4 shows a 3D response surface plot of the pectin yield as a function of
temperature and pH at a fixed extraction time. Increasing the combined effect between extraction
temperature and pH generally decreased the pectin yield as can be seen from Figure 4; the
highest yield was achieved when both variables were at the minimum point. Relatively long
19
period of temperature and extraction time would cause a thermal degradation effect on the
extracted pectin, thus causing a decrease in the amount perceptible by alcohol. The effect of
temperature, pH and period in this study is similar to previous work of(Oliveira et al., 2016).
3.6 The effect of process variable on the degree of esterification
The degree of esterification obtained in the experiment is found to be in the range of 61.27
– 65.95 (Table 3). Based on the degree of esterification pectin can be classified as low methoxyl
pectin with ≤ 50% and high methoxyl pectin with > 50%. The presence of high methoxyl pectin
(DE > 50 %) in the extracted banana peel pectin was evident (Table 3). These results were
consistent with previous work of 76.30 % DE in citrus maxima and 79.51%DE in premature
lemon pomace pectin(Azad, 2014) and 63.15 -72.03%DE of extracted pectins from various
banana varieties, indicating that banana peel pectins have been classified as high methoxyl pectin
similar to those from the citrus peel (62.83%) and apple pomace (58.44%)(Khamsucharit et al.
2018).
20
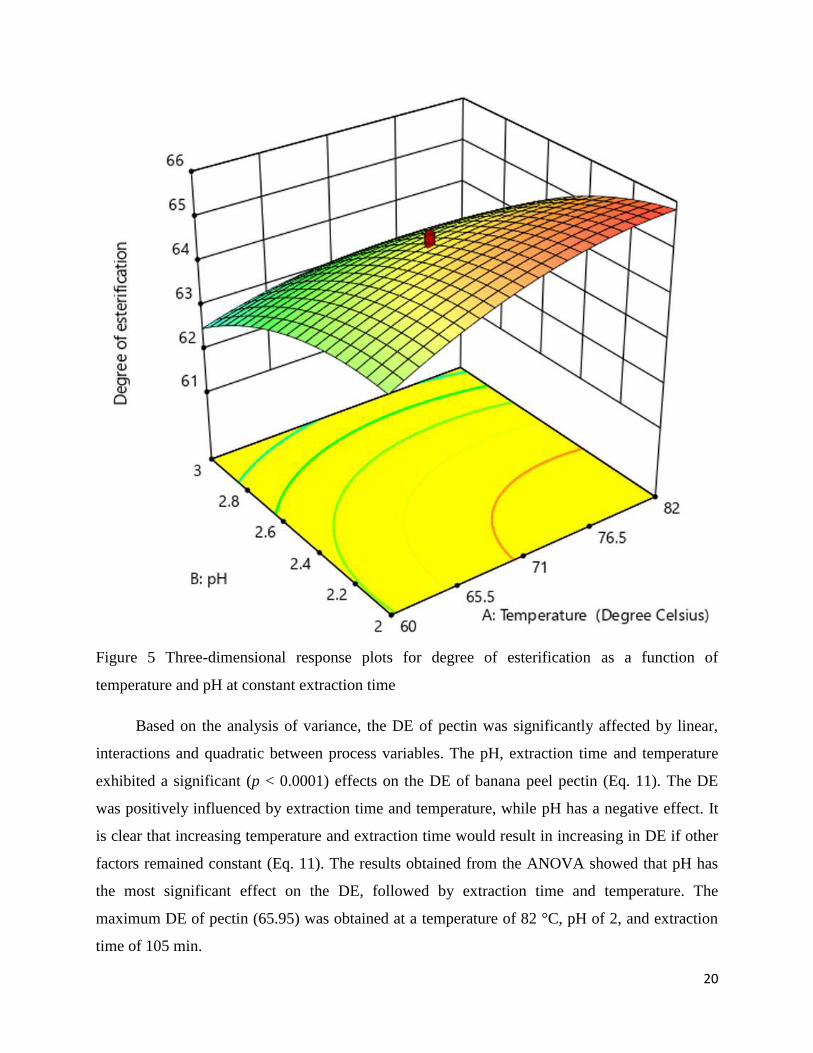
Figure 5 Three-dimensional response plots for degree of esterification as a function of
temperature and pH at constant extraction time
Based on the analysis of variance, the DE of pectin was significantly affected by linear,
interactions and quadratic between process variables. The pH, extraction time and temperature
exhibited a significant (p < 0.0001) effects on the DE of banana peel pectin (Eq. 11). The DE
was positively influenced by extraction time and temperature, while pH has a negative effect. It
is clear that increasing temperature and extraction time would result in increasing in DE if other
factors remained constant (Eq. 11). The results obtained from the ANOVA showed that pH has
the most significant effect on the DE, followed by extraction time and temperature. The
maximum DE of pectin (65.95) was obtained at a temperature of 82 °C, pH of 2, and extraction
time of 105 min.
21
The interaction between temperature and pH exhibited a strong significant (p < 0.0014)
effect on the DE of pectin. Significant interaction indicates that the factors work independently,
whilst the presence of interaction indicates that the difference in DE at different levels of a factor
is not the same at all levels of another factor. It is to note that the interaction between
temperature and extraction time, as well as pH and time, did not exhibit a significant effect on
DE (Table 4). In order to visualize the relationship between the response and process variables
3D response surface plots were generated from the model equation (Eq. 11) developed in this
study. The 3D dimension response surface showed mutual interactions between pH and
temperature as shown in Figure 5.
The three-dimensional response surface model obtained reflects a linear correlation
between the DE with that of pH and temperature. This result is in agreement with the
observations made by other authors (Wai et al. 2010). Figure 5 shows a 3D response surface plot
of the DE of pectin as a function of temperature and pH at fixed extraction time. DE was
generally decreased as the interaction between temperature and pH increased (Eq.11). The
quadratic of temperature, pH and time have a significant effect on the DE of pectin. Similar
findings were reported by other researchers for banana peel (Happi Emaga et al. 2008) and
durian rind pectin (Wai et al. 2010).
3.7 Artificial neural network based results
Feed-forward with backward propagation neural network 3-10-2 is used in the present
investigation to train the experimental data given in Table 3. In the present study, different
training algorithms were tested by varying the number of hidden layers and neurons by training
the different feed-forward with backward propagation networks of various topologies, in order to
select the optimal architecture based on the minimization of the performance function the mean
square error (MSE) and R-values of the data set with 20 samples. The ANN model depends on
the decisive optimal neuron numbers. Figure 6 shows the spread plot of the experimental versus
the computed ANN data in both training, testing and validation networks. The correlation
coefficients (R) values for training (0.99823), validation (0.99851), test (0.99937) and all
prediction set (0.99837) indicating that the ANN model shows better regression and fitting
compared to RSM model. Nearly each and every data points have been scattered around the 45°
line indicating remarkable compatibility between the experimental and predicted output data
values by ANN. Therefore, the ANN prediction for training, validation, and testing is highly
22
substantial and meritorious in terms of correlation and implies that the predicted model was more
precise in predicting the responses.
The value of MSE obtained from the ANNs for both batch and continuous modes was
0.00098, which is close to the acceptance limit for the MSE, set to zero. The closeness of the
training and testing errors validates the accuracy of the model. The linear regression analysis
between the values predicted by ANN and RSM showed that the values predicted by the ANN
model were much closer to experimentally measured data, suggesting that the ANN model was
better modeling ability for both simulation and predicted values. Therefore, in the case of data
sets with a limited number of observations in which regression models fail to capture reliably,
advanced soft computing approaches like ANN may be preferred. ANN model had fitted the
experimental data with an excellent accuracy.

23
Figure 6 Neural Network model with training, validation, test and all prediction set
24
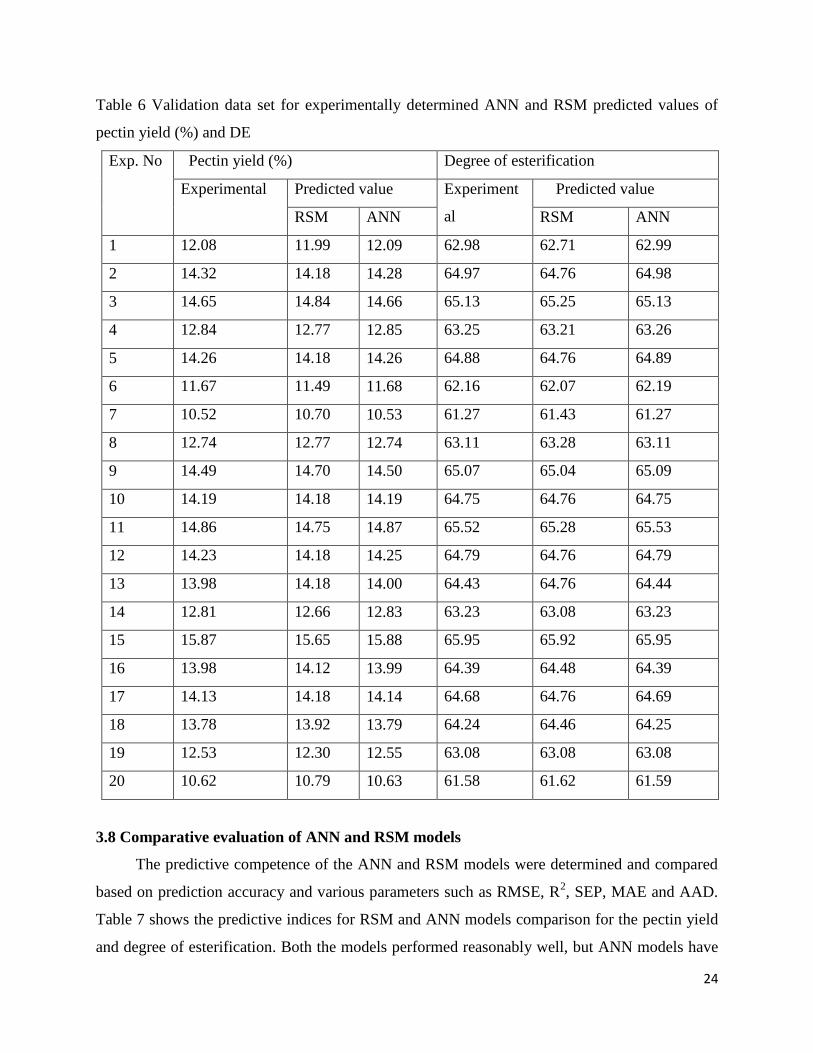
Table 6 Validation data set for experimentally determined ANN and RSM predicted values of
pectin yield (%) and DE
Exp. No Pectin yield (%) Degree of esterification
Experimental Predicted value Experiment
al
Predicted value
RSM ANN RSM ANN
1 12.08 11.99 12.09 62.98 62.71 62.99
2 14.32 14.18 14.28 64.97 64.76 64.98
3 14.65 14.84 14.66 65.13 65.25 65.13
4 12.84 12.77 12.85 63.25 63.21 63.26
5 14.26 14.18 14.26 64.88 64.76 64.89
6 11.67 11.49 11.68 62.16 62.07 62.19
7 10.52 10.70 10.53 61.27 61.43 61.27
8 12.74 12.77 12.74 63.11 63.28 63.11
9 14.49 14.70 14.50 65.07 65.04 65.09
10 14.19 14.18 14.19 64.75 64.76 64.75
11 14.86 14.75 14.87 65.52 65.28 65.53
12 14.23 14.18 14.25 64.79 64.76 64.79
13 13.98 14.18 14.00 64.43 64.76 64.44
14 12.81 12.66 12.83 63.23 63.08 63.23
15 15.87 15.65 15.88 65.95 65.92 65.95
16 13.98 14.12 13.99 64.39 64.48 64.39
17 14.13 14.18 14.14 64.68 64.76 64.69
18 13.78 13.92 13.79 64.24 64.46 64.25
19 12.53 12.30 12.55 63.08 63.08 63.08
20 10.62 10.79 10.63 61.58 61.62 61.59
3.8 Comparative evaluation of ANN and RSM models
The predictive competence of the ANN and RSM models were determined and compared
based on prediction accuracy and various parameters such as RMSE, R2, SEP, MAE and AAD.
Table 7 shows the predictive indices for RSM and ANN models comparison for the pectin yield
and degree of esterification. Both the models performed reasonably well, but ANN models have
25
the superiority modeling capability compared to the RSM models for both pectin yield and
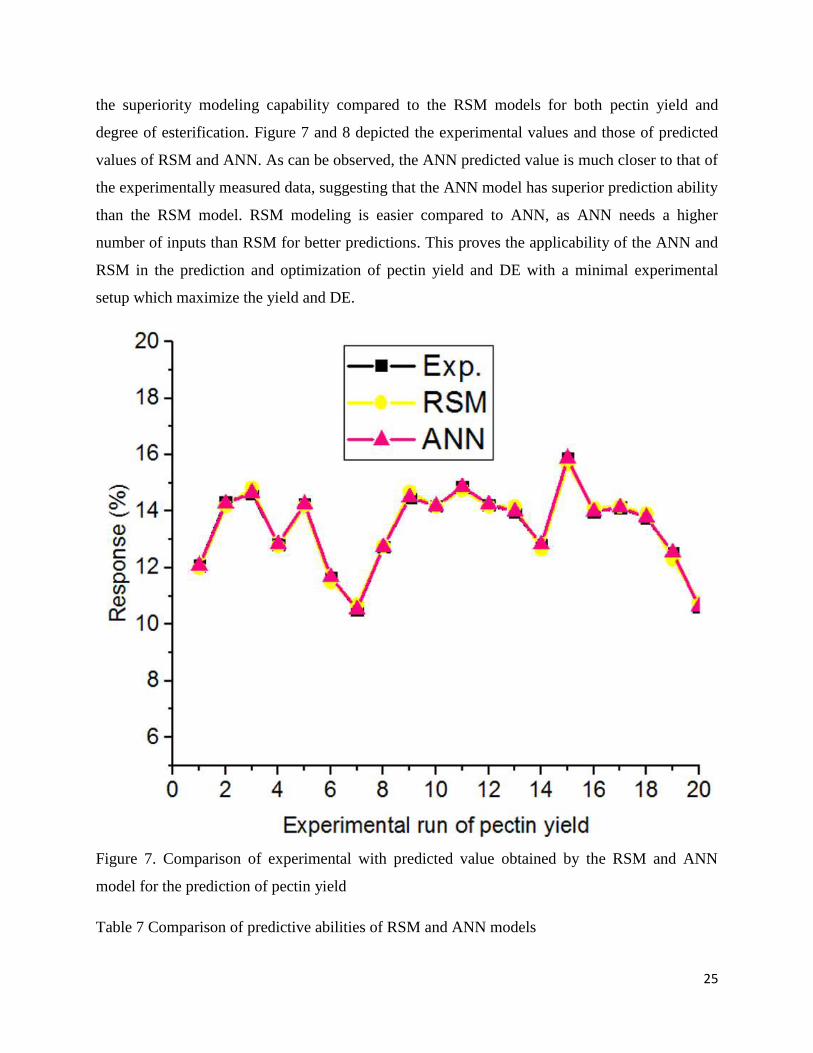
degree of esterification. Figure 7 and 8 depicted the experimental values and those of predicted
values of RSM and ANN. As can be observed, the ANN predicted value is much closer to that of
the experimentally measured data, suggesting that the ANN model has superior prediction ability
than the RSM model. RSM modeling is easier compared to ANN, as ANN needs a higher
number of inputs than RSM for better predictions. This proves the applicability of the ANN and
RSM in the prediction and optimization of pectin yield and DE with a minimal experimental
setup which maximize the yield and DE.
Figure 7. Comparison of experimental with predicted value obtained by the RSM and ANN
model for the prediction of pectin yield
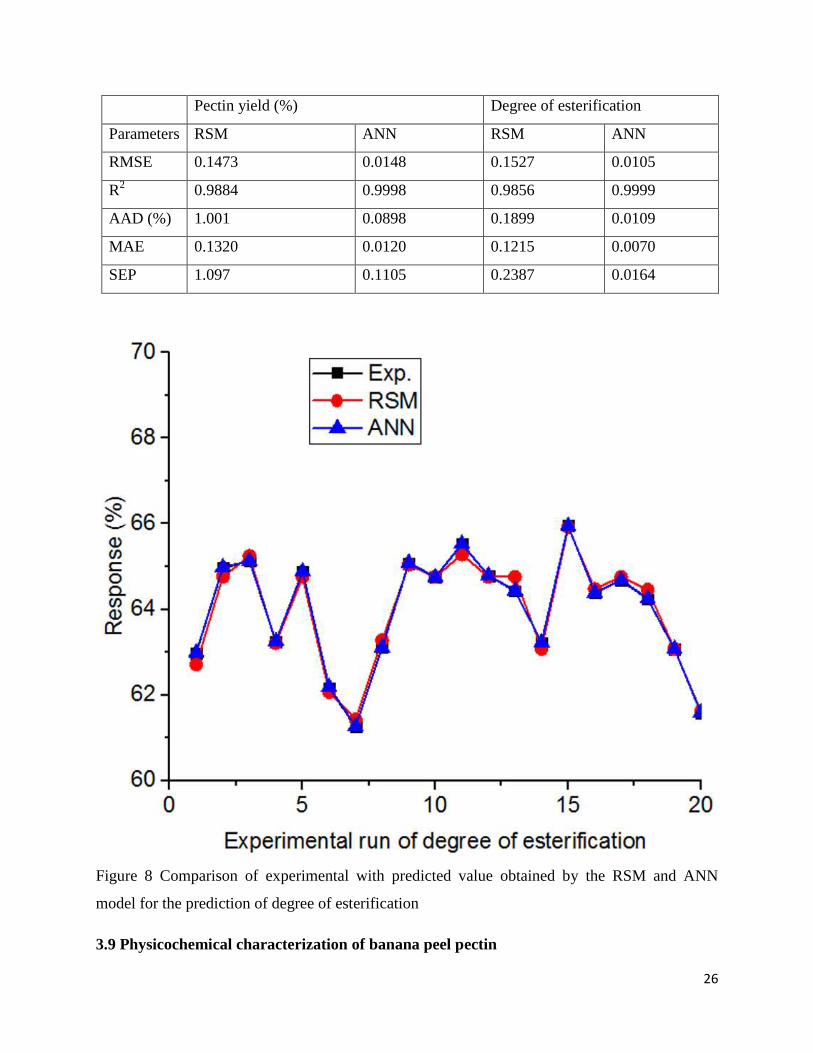
Table 7 Comparison of predictive abilities of RSM and ANN models
26
Pectin yield (%) Degree of esterification
Parameters RSM ANN RSM ANN
RMSE 0.1473 0.0148 0.1527 0.0105
R2 0.9884 0.9998 0.9856 0.9999
AAD (%) 1.001 0.0898 0.1899 0.0109
MAE 0.1320 0.0120 0.1215 0.0070
SEP 1.097 0.1105 0.2387 0.0164
Figure 8 Comparison of experimental with predicted value obtained by the RSM and ANN
model for the prediction of degree of esterification
3.9 Physicochemical characterization of banana peel pectin
27
The characterization of extracted pectin obtained from banana peel was carried out to
evaluate its suitability in food industries. The physiochemical characterization of pectin was
carried out at optimized operating conditions. The yield and properties of pectin are dependent
on the source and are also affected by the nature of the extraction process used. The result shows
that the anhydrouronic acid and methoxyl contents were found to be dependent on the pH while
equivalent weight depends on extraction time. The extraction time and pH had significance effect
on the degree of esterification and moisture content of banana peel pectin. However, moisture,
anhydrouronic acid, degree of esterification, ash, equivalent weight and methoxyl contents of
banana peel pectin were independent of the extraction variables. The physicochemical
characterizations of pectin depend mainly on the raw material source and conditions selected for
isolation and purification of pectin.
Moisture content of pectin extracted in this experiment was found to be 7.87%, which is
slightly higher than banana peels of different varieties (4.54 – 6.24%) and apple pomace (4.54%)
but slightly lower than citrus peel (7.92%) (Khamsucharit et al. 2018). Low moisture content is
necessary for safe storage because they inhibit the growth of microorganisms and pectinase
enzymes that adversely affect pectin quality (Mohamadzadeh et al. 2010).
The ash content of pectin extracted from banana peel was found to be1.44% (Table 8)
which was in similar range to that obtained from the conventional pectin sources, apple pomace
(1.96%) and citrus peel (3.46%). The current finding was in agreement with an earlier finding of
varies banana peel pectin (1.43-2.76%) (Khamsucharit et al. 2018). Low ash content (below
10%) and maximum limit of ash content 10% are one of the good criteria for gel formation
(Manh et al. 2019). Lower ash content means higher purity. Therefore, the ash content found in
this experiment indicates the purity of the pectin.
The Anhydrouronic acid content of pectin extracted from banana peel was found to be
67.43% (Table 8), which is comparable to pectin extracted from banana peels of different
varieties (34.56– 66.67%) while lower than citrus peel and apple pomace (Khamsucharit et al.
2018). The content of anhydrouronic acid (AUA) indicates the purity of the extracted pectin with
a recommended value of not less than 65% for pectin used as food additives or for
pharmaceutical purpose(May, 1990). In this study the highest AUA content of banana peel pectin
was obtained which lies in the acceptable limits of pectin purity. This requirement has limited the
potential sources of food and pharmaceutical pectin. Based on the AUA content the extracted
28
pectin from banana peel had higher than 65% and met the criteria for commercial pectin; thus,
banana peel can be an alternative source of high methoxyl pectin.
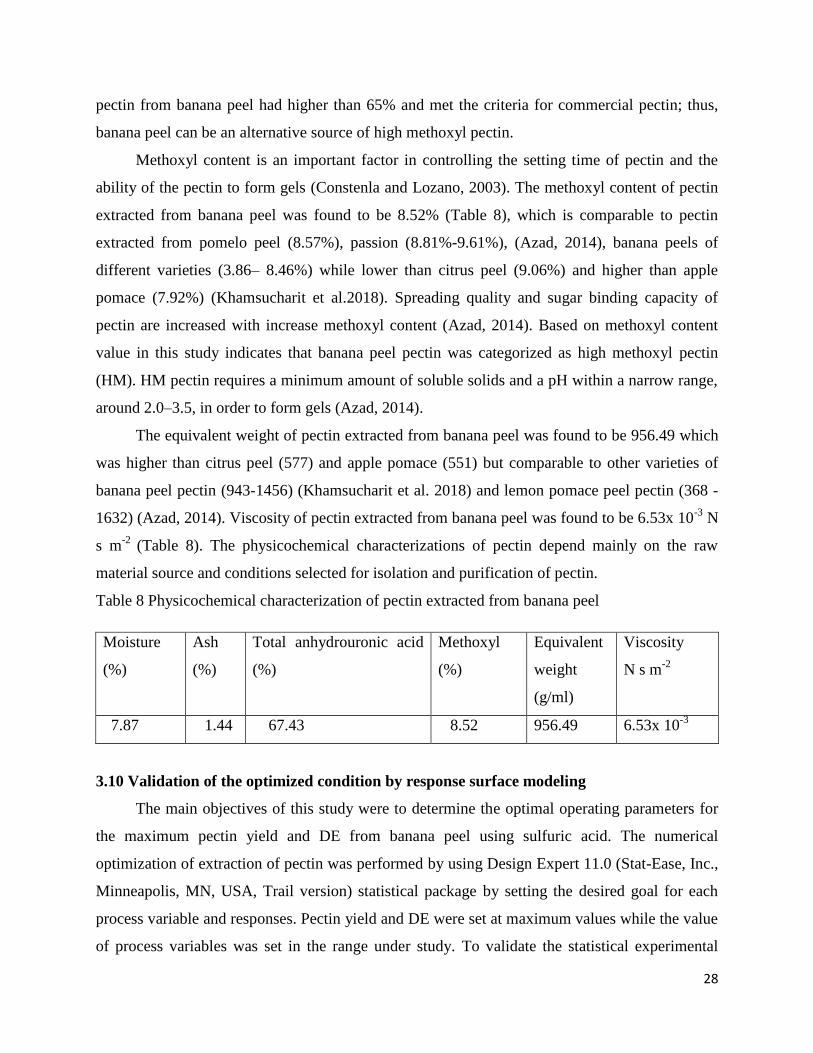
Methoxyl content is an important factor in controlling the setting time of pectin and the
ability of the pectin to form gels (Constenla and Lozano, 2003). The methoxyl content of pectin
extracted from banana peel was found to be 8.52% (Table 8), which is comparable to pectin
extracted from pomelo peel (8.57%), passion (8.81%-9.61%), (Azad, 2014), banana peels of
different varieties (3.86– 8.46%) while lower than citrus peel (9.06%) and higher than apple
pomace (7.92%) (Khamsucharit et al.2018). Spreading quality and sugar binding capacity of
pectin are increased with increase methoxyl content (Azad, 2014). Based on methoxyl content
value in this study indicates that banana peel pectin was categorized as high methoxyl pectin
(HM). HM pectin requires a minimum amount of soluble solids and a pH within a narrow range,
around 2.0–3.5, in order to form gels (Azad, 2014).
The equivalent weight of pectin extracted from banana peel was found to be 956.49 which
was higher than citrus peel (577) and apple pomace (551) but comparable to other varieties of
banana peel pectin (943-1456) (Khamsucharit et al. 2018) and lemon pomace peel pectin (368 -
1632) (Azad, 2014). Viscosity of pectin extracted from banana peel was found to be 6.53x 10⁻³
N
s m-2
(Table 8). The physicochemical characterizations of pectin depend mainly on the raw
material source and conditions selected for isolation and purification of pectin.
Table 8 Physicochemical characterization of pectin extracted from banana peel
Moisture
(%)
Ash
(%)
Total anhydrouronic acid
(%)
Methoxyl
(%)
Equivalent
weight
(g/ml)
Viscosity
N s m-2
7.87 1.44 67.43 8.52 956.49 6.53x 10⁻³
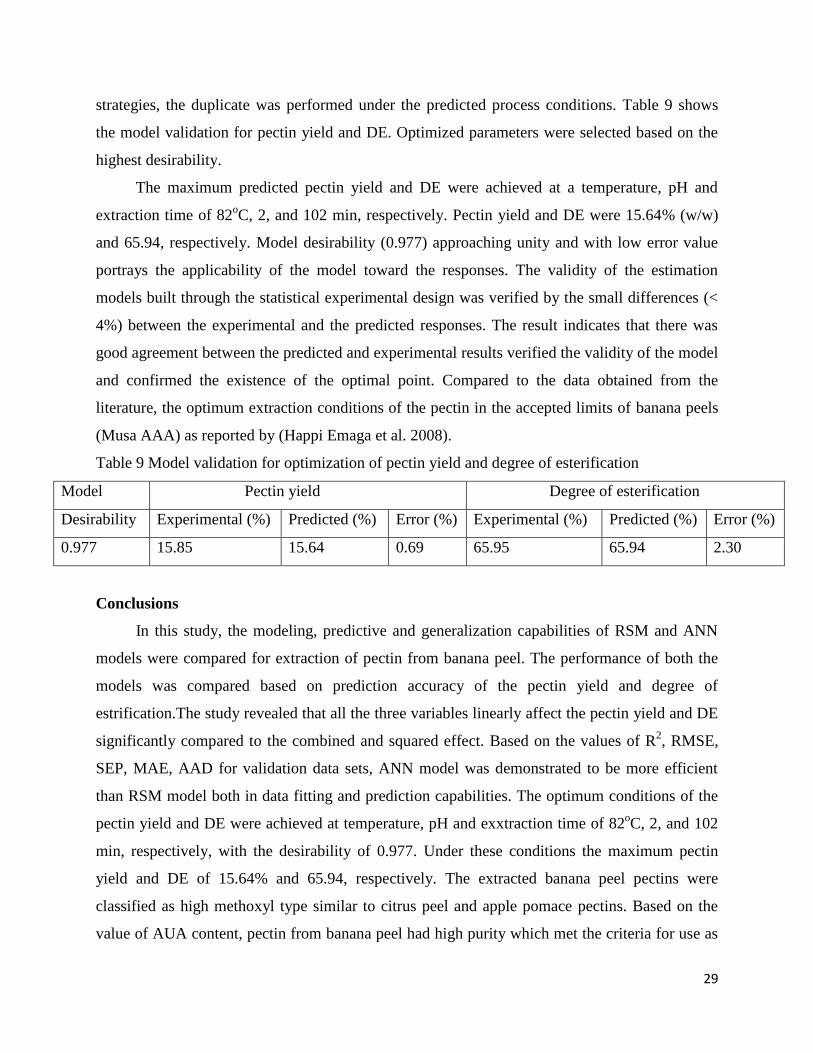
3.10 Validation of the optimized condition by response surface modeling
The main objectives of this study were to determine the optimal operating parameters for
the maximum pectin yield and DE from banana peel using sulfuric acid. The numerical
optimization of extraction of pectin was performed by using Design Expert 11.0 (Stat-Ease, Inc.,
Minneapolis, MN, USA, Trail version) statistical package by setting the desired goal for each
process variable and responses. Pectin yield and DE were set at maximum values while the value
of process variables was set in the range under study. To validate the statistical experimental
29
strategies, the duplicate was performed under the predicted process conditions. Table 9 shows
the model validation for pectin yield and DE. Optimized parameters were selected based on the
highest desirability.
The maximum predicted pectin yield and DE were achieved at a temperature, pH and
extraction time of 82oC, 2, and 102 min, respectively. Pectin yield and DE were 15.64% (w/w)
and 65.94, respectively. Model desirability (0.977) approaching unity and with low error value
portrays the applicability of the model toward the responses. The validity of the estimation
models built through the statistical experimental design was verified by the small differences (<
4%) between the experimental and the predicted responses. The result indicates that there was
good agreement between the predicted and experimental results verified the validity of the model
and confirmed the existence of the optimal point. Compared to the data obtained from the
literature, the optimum extraction conditions of the pectin in the accepted limits of banana peels
(Musa AAA) as reported by (Happi Emaga et al. 2008).
Table 9 Model validation for optimization of pectin yield and degree of esterification
Model Pectin yield Degree of esterification
Desirability Experimental (%) Predicted (%) Error (%) Experimental (%) Predicted (%) Error (%)
0.977 15.85 15.64 0.69 65.95 65.94 2.30
Conclusions
In this study, the modeling, predictive and generalization capabilities of RSM and ANN
models were compared for extraction of pectin from banana peel. The performance of both the
models was compared based on prediction accuracy of the pectin yield and degree of
estrification.The study revealed that all the three variables linearly affect the pectin yield and DE
significantly compared to the combined and squared effect. Based on the values of R2, RMSE,
SEP, MAE, AAD for validation data sets, ANN model was demonstrated to be more efficient
than RSM model both in data fitting and prediction capabilities. The optimum conditions of the
pectin yield and DE were achieved at temperature, pH and exxtraction time of 82oC, 2, and 102
min, respectively, with the desirability of 0.977. Under these conditions the maximum pectin
yield and DE of 15.64% and 65.94, respectively. The extracted banana peel pectins were
classified as high methoxyl type similar to citrus peel and apple pomace pectins. Based on the
value of AUA content, pectin from banana peel had high purity which met the criteria for use as
30
food additive, signifying its potential use as an alternative source of commercial pectin
production.
Abbreviations
AAD: Absolute average deviation; ANN: Artificial neural network; ANOVA: analysis of
variance; AUA: Content of anhydrouronic acid; CCD: Central composite design; CE:
Insignificant coefficients; DE: Degree of esterification; HCl: Hydrochloric acid; H2SO4 : Sulfuric
acid; LMP: Low methoxyl pectin; MAE: Mean absolute error; RSM: Response surface
methodology; R2 : Coefficient of determination; RMSE: Root mean square error; SEP: Standard
error of prediction; Y: Pectin yield.
Acknowledgements
This study was supported by the School of Chemical Engineering laboratory and Environmental
Engineering laboratory at Jimma Institute of Technology
Authors’ contributions
The Author performed all the experiments and wrote this paper and also participated in
experiment design and research supervision. The author read and approved the final manuscript.
Funding
This work was supported by the School of Chemical Engineering Jimma Institute of Technology,
Samara University, and Addis Ababa Institute of Technology, Ethiopia.
Availability of data and materials
All data analyzed during this study are included in this research article.
Competing of Interest
The author certifies that NO affiliations with or involvement in any organization or entity with
any financial interest or non-financial interest in the subject matter or materials discussed in this
manuscript.
Ethics approval and consent to participate
Not applicable.
Consent for publication
Not applicable.
Author information
31
1 School of Chemical Engineering, Jimma Institute of Technology, Jimma University, Jimma,
Ethiopia.
References
Azad, A. K. M. (2014) Isolation and Characterization of Pectin Extracted from Lemon Pomace
during Ripening. Journal of Food and Nutrition Sciences, 2(2), 30.
https://doi.org/10.11648/j.jfns.20140202.12
Constenla, D., & Lozano, J. E. (2003). Kinetic model of pectin demethylation. Latin American
Applied Research, 33(2), 91–95.
do Nascimento Oliveira, A., de Almeida Paula, D., Basílio de Oliveira, E., Henriques Saraiva, S.,
Stringheta, P. C., & Mota Ramos, A. (2018). Optimization of pectin extraction from Ubá
mango peel through surface response methodology. International Journal of Biological
Macromolecules, 113, 395–402. https://doi.org/10.1016/j.ijbiomac.2018.02.154
Fakayode, O. A., & Abobi, K. E. (2018). Optimization of oil and pectin extraction from orange
(Citrus sinensis) peels: a response surface approach. Journal of Analytical Science and
Technology, 9(1). https://doi.org/10.1186/s40543-018-0151-3
Girma, E., & Worku, T. (2016). Extraction and Characterization of Pectin From Selected Fruit
Peel Waste. 6(2), 447–454.
González-Montelongo, R., Gloria Lobo, M., & González, M. (2010). Antioxidant activity in
banana peel extracts: Testing extraction conditions and related bioactive compounds. Food
Chemistry, 119(3), 1030–1039. https://doi.org/10.1016/j.foodchem.2009.08.012
Happi Emaga, T., Ronkart, S. N., Robert, C., Wathelet, B., & Paquot, M. (2008).
Characterisation of pectins extracted from banana peels (Musa AAA) under different
conditions using an experimental design. Food Chemistry, 108(2), 463–471.
https://doi.org/10.1016/j.foodchem.2007.10.078
Joel, J. M., Barminas, J. T., Riki, E. Y., Yelwa, J. M., & Edeh, F. (2018). Extraction and
Characterization of Hydrocolloid Pectin from Goron Tula (Azanza garckeana) fruit. World
Scientific News, 101(June), 157–171. Retrieved from www.worldscientificnews.com
Khamsucharit, P., Laohaphatanalert, K., Gavinlertvatana, P., Sriroth, K., & Sangseethong, K.
32
(2018). Characterization of pectin extracted from banana peels of different varieties. Food
Science and Biotechnology, 27(3), 623–629. https://doi.org/10.1007/s10068-017-0302-0
Liew, S. Q., Chin, N. L., & Yusof, Y. A. (2014a). Extraction and Characterization of Pectin from
Passion Fruit Peels. Italian Oral Surgery, 2, 231–236.
https://doi.org/10.1016/j.aaspro.2014.11.033
Liew, S. Q., Chin, N. L., & Yusof, Y. A. (2014b). Extraction and Characterization of Pectin from
Passion Fruit Peels. Agriculture and Agricultural Science Procedia, 2, 231–236.
https://doi.org/10.1016/j.aaspro.2014.11.033
Liu, Z., Yao, L., & Fan, C. (2015). Optimization of fermentation conditions of pectin production
from Aspergillus terreus and its partial characterization. Carbohydrate Polymers, 134, 627–
634. https://doi.org/10.1016/j.carbpol.2015.08.032
Manh, B., Nguyen, N., & Pirak, T. (2019). Cogent Food & Agriculture Physicochemical
properties and antioxidant activities of white dragon fruit peel pectin extracted with
conventional and ultrasound- assisted extraction Physicochemical properties and antioxidant
activities of white dragon fruit p. Cogent Food & Agriculture, 5(00).
https://doi.org/10.1080/23311932.2019.1633076
May, C. D. (1990). Industrial pectins: Sources, production and applications". Carbohydrate
Polymers. J. Ind. Appl. Pectin, 12(1), 79–99.
Mohamadzadeh, J., Sadeghi-Mahoonak, A. R., Yaghbani, M., & Aalami, M. (2010). Extraction
of pectin from sunflower head residues of selected iranian cultivars. World Applied Science
Journal, 8(1), 21–24.
Mohamed, H. (2016). Extraction and Characterization of Pectin from Grapefruit Peels. MOJ
Food Processing & Technology, 2(1), 31–38.
https://doi.org/10.15406/mojfpt.2016.02.00029
Mohamed S, & Z., H. (1995). Extraction and characterization of pectin from various tropical
agrowastes. ASEAN Food Journal,2: 43-50. ASEAN Food Journal, 2, 143–150.
Nahar, K., Haque, M., Nada, K., Uddin, M., Mansur, M. A. Al, Khatun, N., & Jabin, S. (2017).
Pectin from ripe peels of mango cultivars. Bangladesh Journal of Scientific and Industrial
Research, 52(3), 229–238. https://doi.org/10.3329/bjsir.v52i3.34159
Nikolova, I., & Georgieva, N. (2014). Optimization of the pectin extraction from pomelo peels
by oxalic acid and microwave. Banat?S Journal of Biotechnology, 5(9), 67–73.
33
https://doi.org/10.7904/2068
Oliveira, T. Í. S., Rosa, M. F., Cavalcante, F. L., Pereira, P. H. F., Moates, G. K., Wellner, N., …
Azeredo, H. M. C. (2016) Optimization of pectin extraction from banana peels with citric
acid by using response surface methodology. Food Chemistry, 198, 113–118.
https://doi.org/10.1016/j.foodchem.2015.08.080
Owolabi, R. U., Usman, M. A., & Kehinde, A. J. (2018) Modelling and optimization of process
variables for the solution polymerization of styrene using response surface methodology.
Journal of King Saud University - Engineering Sciences, 30(1), 22–30.
https://doi.org/10.1016/j.jksues.2015.12.005
Ranganna, S. (1995) Hand book of analysis and quality control for fruits and vegetable products
(2nd Ed.). In ASEAN Food Journal.
Ranganna, s. (2004) handbook of analysis and quality control for fruit and vegetable products ,
second edition.
Sangheetha, S., Illeperuma, D. C. K., Navaratne, A. N., & Jayasinghe, C. (2018) Effect of pH,
temperature and time combinations on yield and degree of esterification of mango peel
pectin: a box-behnken design based statistical modelling. Tropical Agricultural Research,
30(2), 1. https://doi.org/10.4038/tar.v30i2.8304
Sundarraj, A. A., Thottiam Vasudevan, R., & Sriramulu, G. (2018a) Optimized extraction and
characterization of pectin from jackfruit (Artocarpus integer) wastes using response surface
methodology. International Journal of Biological Macromolecules, 106, 698–703.
https://doi.org/10.1016/j.ijbiomac.2017.08.065
Sundarraj, A. A., Thottiam Vasudevan, R., & Sriramulu, G. (2018b) Optimized extraction and
characterization of pectin from jackfruit (Artocarpus integer) wastes using response surface
methodology. International Journal of Biological Macromolecules, 106(November 2017),
698–703. https://doi.org/10.1016/j.ijbiomac.2017.08.065
Waghmare, A. G., & Arya, S. S. (2016) Utilization of unripe banana peel waste as feedstock for
ethanol production. Bioethanol, 2(1). https://doi.org/10.1515/bioeth-2016-0011
Wai, W. W., Alkarkhi, A. F. M., & Easa, A. M. (2009) Optimization of pectin extraction from
durian rind (durio zibethinus) using response surface methodology. Journal of Food
Science, 74(8), 637–641. https://doi.org/10.1111/j.1750-3841.2009.01331.x
Wai, W. W., Alkarkhi, A. F. M., & Easa, A. M. (2010) Effect of extraction conditions on yield
34
and degree of esterification of durian rind pectin: An experimental design. Food and
Bioproducts Processing, 88(2–3), 209–214. https://doi.org/10.1016/j.fbp.2010.01.010
Woldu, Z., Mohammed, A., Belew, D., & Shumeta, Z. (2015) Assessment of Banana Production
and Marketing in. International Journal of Science s: Basic and Applied Research, 4531,
283–307.