Embed Size (px)
Citation preview

Chapter XX
Highly cultured brush manufactured by traditional brush mixing technique “KEM
OMI”KAWABATA Shinichiro*, KAMADA Toshiyuki**, NASU Maki**,
NAKAHARA Kenichi**, TSUKUDA Hiroshi **, GOTO Akihiko***, HAMADA Hiro
yuki*
*Kyoto institute of technology
Kyoto Japan
** soliton corporation CO. LTD.
Kyoto Japan
***Osaka Sangyo University
Osaka Japan
ABSTRACT
To hand down the technique of the traditional handicrafts usually takes over a
decade. Therefore, the shortage of successors is becoming a serious problem.
Thereby there are needs of analyzing the technique scientifically to hand down the
technique in less time. FUDE which is Japanese calligraphy brush have been

designated as traditional products of Nara prefecture. It is impossible to
manufacture high performance brush from a single raw material, however high
performance brush can be obtained by blending many kinds of materials with
different characteristics. This process of blending filaments with different
characteristics is called “KEGUMI”. The next manufacturing process of
“KEGUMI” is “KEMOMI”. “KEMOMI” is the work to even up the humidity
mixing ratio in all the parts of the filaments bunch. Filaments are not to be able to
demonstrate the performance only by mixing the filaments with different
characteristics, synergy of high performance only begins to appear when filaments
are uniformly distributed. In this study“KEMOMI” process was analyzed by the
method of Image thresholding and motion analysis.
Keywords: brush, Traditional handicrafts, motion analysis, soliton corporation
1. INTRODUCTION
Traditional handicrafts, more precisely expressed as artisanic handicraft, is a type
of work where useful and decorative devices are made completely by hand or by
using only simple tools. It is a traditional main sector of craft. Usually the term is
applied to traditional means of making goods. The individual artisanship of the
items is a paramount criterion, such items often have cultural significance, also
aimed to create new tradition of technology. The main idea of the work should be
handmade using natural materials, and the fields of handicrafts are widely ranged,
such as dyed and woven stuff textiles, metal work, lacquer ware, ceramic arts,
calligraphy brush. As of April 2009, there are 211 traditional handicrafts in Japan,
specified by the Ministry of Economy, Trade and Industry. Traditional handicraft is
specified to satisfy five requirements described below. (1) What is used mainly in
daily life. (2) The main portions of a manufacture process are handmade. (3)
Manufactured by traditional technology and technique. (4) Traditional raw material
is used. (5) The place of production is formed in the fixed region.

However, in recent years traditional handicraft industry is facing serious problems.
As for traditional handicrafts main processes are handmade and since it is what is
depended on advanced traditional technology, long years are needed for the
acquisition to obtain the technique. Furthermore, with change of a lifestyle, the
demand of traditional handicrafts articles has showed low transition, causing
difficulties of training successors which has become a big subject of the whole
industry.
It is not an exception in the traditional “FUDE” (Japanese calligraphy brush)
industry of Nara prefecture in Japan. In recent years, an opportunity of taking the
brush itself is diminishing, due to the change of a lifestyle such as using a pen
instead of a brush, reduction of calligraphy lesson in school, spread of personal
computers which can print brush characters easily at home and etc. Moreover, a
cheap Chinese brush flows into a market in large quantities, consumer intention to
low price products also helped to decrease both the amount of consumption and the
quantity of production of a domestic brush.
The surrounding situation of traditional handicrafts industry is very severe as
mentioned above. In order to overthrow this situation, such method as mechanizing
a section of manufacturing process while leaving a traditional technique, and
quantifying master craftsman`s work behavior and technique as a data is highly
required. Mechanizing the section of manufacturing process enables to lower the
cost of manufactured goods, which will be able to oppose against cheap import
products from overseas. Quantifying master craftsman`s work behavior and
technique has potentialities to achieve shortening successor's training period.
As described above, in recent years the demand of traditional handicrafts articles
hangs low with change of a lifestyle, increase of the imported product at a low
price, and the shortage of raw material, causing doubt of the continued existence.
There are some companies which were obliged to discontinuance of business, and
there are some cases which relocate a factory to overseas. However, there are
companies corresponding to change of such a severe situation, one of them is
soliton corporation CO. LTD, which is a brush manufacturing company in Japan.

soliton corporation CO. LTD has succeeded in mechanizing a part of manufacturing
process, also inheriting the traditional craftsmanship technique of the Nara Fude to
manufacture the high quality brush which fulfills contemporary needs.
Nevertheless, not all processes are mechanized, even now the important process is
manufactured by the manual labor, aimed to apply the warmth of the person`s hand
and to receive the benefit of the wisdom from traditional craftsmanship as well as
being highly efficient with high quality. In this study analysis of “KEMOMI”
process, which is supposed as the most important process during brush
manufacturing, was taken place using Image thresholding and motion analysis.
2. EXPERIMENTS
2-1 Analysis of “KEMOMI” progress degree
The scenery of “KEMOMI” process is shown in Fig.1 and Fig.2.
Fig.1 “KEMOMI” scenery Fig.2 “KEMOMI” scenery (close up)
2-1-1 Material
In this study three types of PBT(Polybutylene Terephthalate) filaments listed
below was used for experiment. The taper is processed to the PBT filaments by the
chemical mean (hydrolysis). As the result, row materials of PBT filaments are
supplied with the rose in the angle and shape of the taper, even though in the same
lot. Therefore, at the stage of “KEGUMI”, measurement, selection and classification
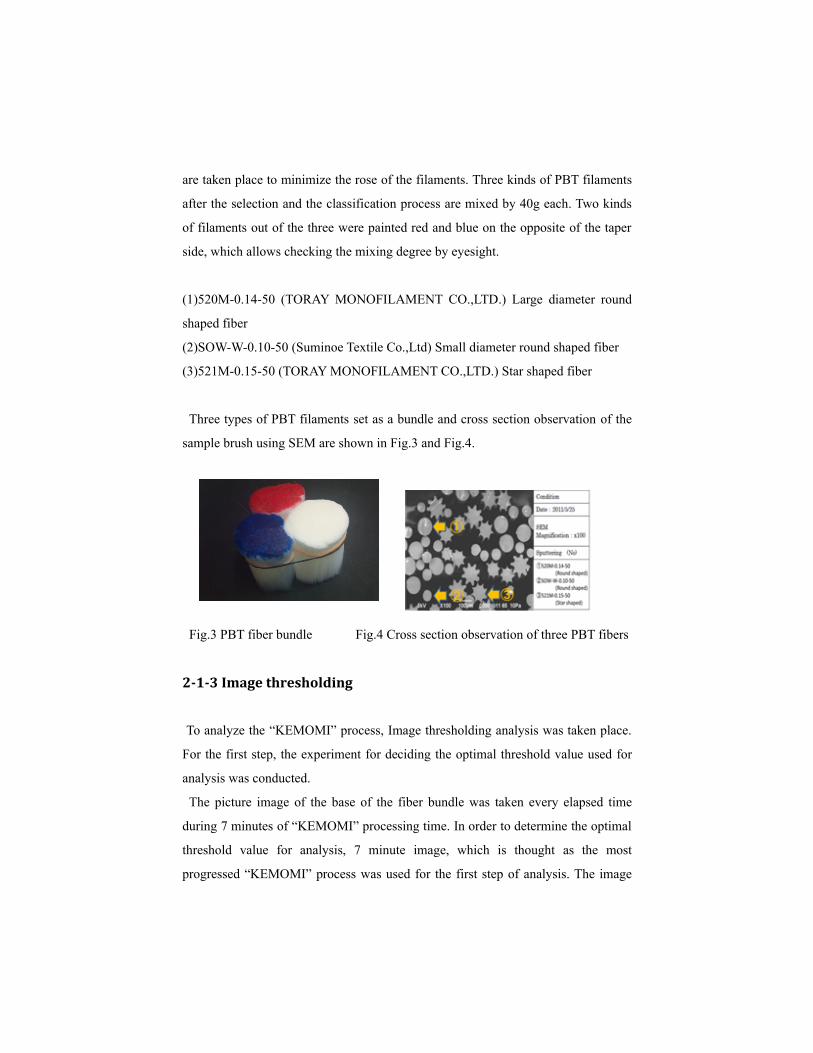
are taken place to minimize the rose of the filaments. Three kinds of PBT filaments
after the selection and the classification process are mixed by 40g each. Two kinds
of filaments out of the three were painted red and blue on the opposite of the taper
side, which allows checking the mixing degree by eyesight.
(1)520M-0.14-50 (TORAY MONOFILAMENT CO.,LTD.) Large diameter round
shaped fiber
(2)SOW-W-0.10-50 (Suminoe Textile Co.,Ltd) Small diameter round shaped fiber
(3)521M-0.15-50 (TORAY MONOFILAMENT CO.,LTD.) Star shaped fiber
Three types of PBT filaments set as a bundle and cross section observation of the
sample brush using SEM are shown in Fig.3 and Fig.4.
Fig.3 PBT fiber bundle Fig.4 Cross section observation of three PBT fibers
2-1-3 Image thresholding
To analyze the “KEMOMI” process, Image thresholding analysis was taken place.
For the first step, the experiment for deciding the optimal threshold value used for
analysis was conducted.
The picture image of the base of the fiber bundle was taken every elapsed time
during 7 minutes of “KEMOMI” processing time. In order to determine the optimal
threshold value for analysis, 7 minute image, which is thought as the most
progressed “KEMOMI” process was used for the first step of analysis. The image

was cut to 320×240 pixel size for thresholding. To analyze the “KEMOMI”
progress, distribution of the white fiber was focused and threshold value used for
next analysis step was computed as the number of lumps of a white pixel becomes
the maximum in the 7minutes image. The optimal threshold value presupposed as
the same value from which the number of lumps of the white pixel became the
maximum. The next step to analyze the share of a white pixel in bundle of fiber was
carried out using this threshold.
The image of every elapsed time was partitioned to Upper, Left, Right parts for
analysis and each image was analyzed based on a similar threshold computed in the
first step, and the occupancy rate of the white pixel at every elapsed time was
calculated. In this experiment the master craftsman showed the intention that the
“KEMOMI” process was completed after 6 minutes, although extra 1 minute was
added for measurement.
2-2 Motion analysis of “KEMOMI” process by master
craftsman and unskilled operator
Motion analysis of “KEMOMI” process by master craftsman and unskilled
operator was taken place due to achieve useful information for shortening
successor's training period. Until now improvement in the technique had taken time
without the ability of knowing tips of the technique. To see the difference of the
motion compared with master craftsman by scientific data, it becomes possible to
understand more concretely and more clearly.
Motion analysis was measured by using MAC 3D SYSTEM (made by the Motion
Analysis Inc.) which is the optical real time motion capture system with 6 infrared
cameras and a video camera(sampling rate:100Hz). Image of MAC 3D SYSTEM is
shown in Fig.5. MAC 3D SYSTEM extracts the position of the infrared reflective
marker stuck on the subject with three-dimensional coordinates. In this study 16
pieces of infrared markers were set. The “KEMOMI” process of master craftsman
and an unskilled operator was recorded 3 times respectively to compare the
difference.

Test subject
1. Master craftsman: 43years old male, 17 years of “KEMOMI” experience.
2. Unskilled operator: 51years old female, 8 month of “KEMOMI” experience.
2-3 InLluence which a “KEMOMI” progress ratio has on Linished product
150 brushes of finished product manufactured from 25%, 50%, and
100%“KEMOMI” progress degree were prepared for verification to see the
influence of “KEMOMI” progress degree to finished products.
2-3-1 Brush Liber distribution observation
2 brushes were chosen as forbearance from each “KEMOMI” progress degree, in
order to evaluate the mixture condition of three kinds of fiber items which forms a
brush, the scanning electron microscope was used and the arbitrary section of the
brush was observed to count a sum total of fiber and its items.
2-3-2 Rigidity evaluation
In order to evaluate the rose of the brush rigidity of the finished products,
micrometer (MHD-50M Mitsutoyo Ltd.,) was set on the top of the scale, displaced
down to 2mm and load was measured at each 0.1mm displacement. 20 brushes from
each “KEMOMI” progress were chosen as forbearance.
2-3-3 Ink maintenance performance evaluation
20 brushes were chosen as forbearance to measure the amount of ink maintenance
of each brush according to “KEMOMI” progress. The brush was first weigh in dry
condition, subsequently was immersed in water for 3 minutes. After 3 minutes
immersion in water, the brush was hung for 1minute with a condition of tip turned
down. After that weight of wet condition was measured.
2-3-4 Incidence of defective rate evaluation
In order to evaluate the quality stability of a brush manufactured from different
“KEMOMI” progress, defective rate of longer than reference value, shorter than
reference value, slant, loop, twist, was counted on all 150 final products.
3. RESULT AND DISCUSSIONS
3-1 Analysis of “KEMOMI” progress degree
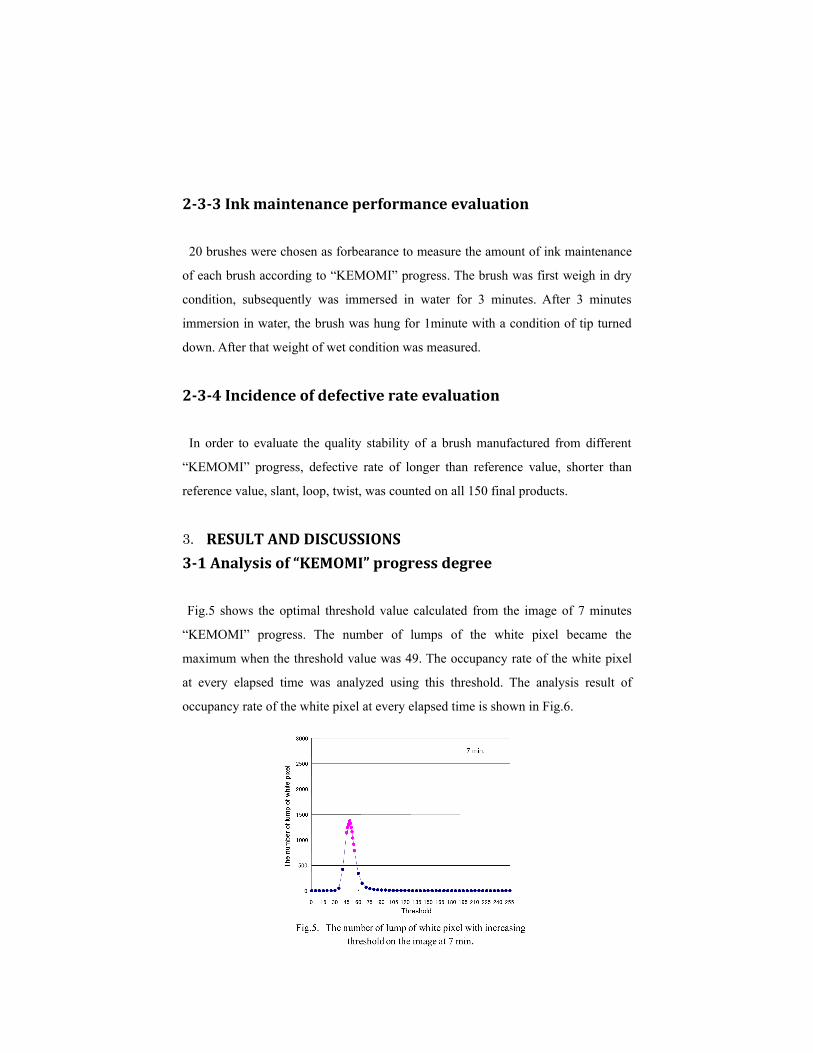
Fig.5 shows the optimal threshold value calculated from the image of 7 minutes
“KEMOMI” progress. The number of lumps of the white pixel became the
maximum when the threshold value was 49. The occupancy rate of the white pixel
at every elapsed time was analyzed using this threshold. The analysis result of
occupancy rate of the white pixel at every elapsed time is shown in Fig.6.

The share of a white pixel settled around in the passage of 3 minutes to
approximately 20 percent. During 3minutes to 5minutes, change was seen only on
left image which declined 10%, moreover during 5minutes to 6minutes, 10%
decline was seen in right image. At the time of 6 minute progress, the white pixel
share settled down to 9% and settled to 12.7% after 7minutes of progress. The share
of a white pixel share showed the lowest at 6 minutes, this result shows that the
experience of master craftsman matches with this analysis. From this
result,“KEMOMI” progress can be divided to 3 stage as follows.
STEP 1 Start to 3minutes. The rapid mixing stage.
STEP 2 3minutes to 5 minutes. The overall adjustment stage.
STEP 3 5minutes to 6 minute. The finishing stage.
Fig.6 Change in white pixel count during “KEMOMI”

3-2 Motion analysis of “KEMOMI” process by master
craftsman and unskilled operator
The results of motion analysis are described below.
1. The average number of time which master craftsman applies to a “KEMOMI”
process is 6 minutes, and an unskilled operator takes 8 minutes.
2. The unskilled operator took an action of arranging the fiber bundles bottom for
35 times an average in the work for 8 minutes, which master craftsman took
only 10 times in 6 minutes.
3. The unskilled operator`s right hand in earlier stage only moves 44% compare to
master craftsman
4. The unskilled operator`s left hand only moves 59.2% during the process
compare to master craftsman
The result shows that unskilled operator takes 2 minutes longer to complete
“KEMOMI” process. Unskilled operator took time to arrange the fiber spreading
apart from the bundle, from there to understand that master craftsman has excellent
technique to hold the bundle of fibers securely, which enables to complete the
process with less arrangement.
Unskilled operator`s right hand in earlier stage only moves 44% compare to
master craftsman, this can be explained by the following reasons. Three fibers are
solidified densely in the early stage of the process, therefore experience and
technique are needed for mixing in this stage.
The reason of unskilled operator`s left hand only moving 59.2% compare to
master craftsman is that unskilled operator has less skills to hold the fiber bundle
securely. She had an anxious of spreading the fibers causing her left hand motion
becoming small.
For urging the improvement in “KEMOMI” technique, unskilled operator needs
to holds below the central point of the fiber bundle, and reduce the number of times
of the motion to arrange a fiber bundle, moreover, needing to be conscious of
moving a left hand greatly and practicing the early stage of the process.
3-3 Brush Liber distribution observation
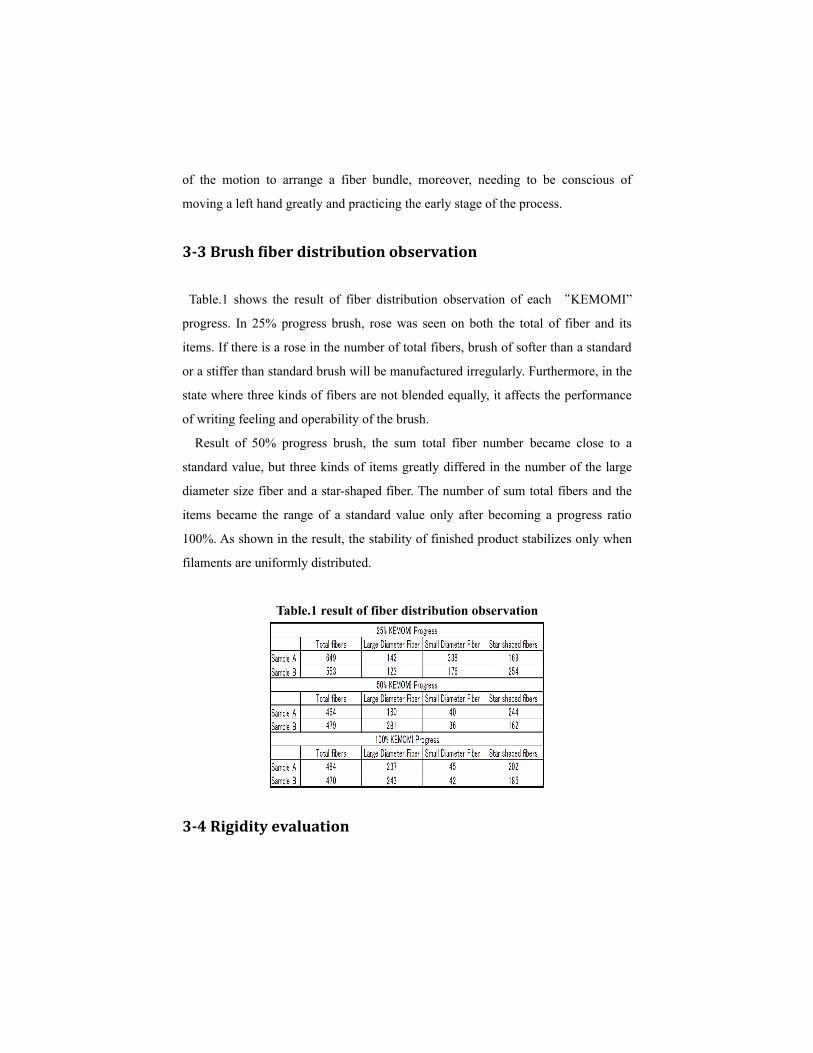
Table.1 shows the result of fiber distribution observation of each “KEMOMI”
progress. In 25% progress brush, rose was seen on both the total of fiber and its
items. If there is a rose in the number of total fibers, brush of softer than a standard
or a stiffer than standard brush will be manufactured irregularly. Furthermore, in the
state where three kinds of fibers are not blended equally, it affects the performance
of writing feeling and operability of the brush.
Result of 50% progress brush, the sum total fiber number became close to a
standard value, but three kinds of items greatly differed in the number of the large
diameter size fiber and a star-shaped fiber. The number of sum total fibers and the
items became the range of a standard value only after becoming a progress ratio
100%. As shown in the result, the stability of finished product stabilizes only when
filaments are uniformly distributed.
Table.1 result of fiber distribution observation
3-4 Rigidity evaluation

The results for rigidity evaluation are shown in Fig.7. When the “KEMOMI”
progress stage is low, the rose can be seen in the load. This result dues because the
three kinds of fiber materials has not become uniformed in the low stage of
“KEMOMI” progress, the rigidity increases when the percentage of large diameter
filaments increase and the rigidity decrease when the percentage of small diameter
filaments increase. The rigidity is an important element that controls the
performance of the brush. Therefore it is important for the brush fibers to be
uniformly distributed to secure a stable performance.
Fig.7 Result of brush rigidy evaluation
3-5 Ink maintenance performance evaluation
The result for coefficient of water absorption is shown in Fig.8. The coefficient of
water absorption reduces in proportion to “KEMOMI” progress, this is to consider
that distribution of the small diameter fiber has influenced. When the small diameter
fiber is not distributed uniformly, large space will be made among the large
diameter fibers, causing capillary phenomenon to occur which remains the ink
inside a brush.

Fig.8 Result of coefficient of water absorption
3-6 Incidence of defective rate evaluation
Fig.9 displays the rejection rate of each brush manufactured by different
“KEMOMI” progress. When the stage of KEMOMI progress proceeds, rejection
rate of longer than reference value, shorter than reference value, slant, decreases
sharply. This result have been caused because when the “KEMOMI” progress stage
is low, fiber material of the brush are not uniformly distributed, and thereby fibers
will not be inserted constantly in the picker which grips the amount of one brush.
This will also give influence to next process of fiber sheath insertion and vibration,
which causes irregular arrange of the fiber materials which leads to increase of
rejection rate.
Fig.9 Incidence of defective rate
5. CONCLUSIONS
In this study “KEMOMI”
process (process to even up
the humidity mixing ratio in all
the parts of the filaments bunch)
during brush manufacturing was
analyzed using Image thresholding

and motion analysis. The result made it possible to achieve useful information for
shortening successor's training period. Moreover the influence given by
“KEMOMI” progress degree concerning the performance of the highly cultured
brush manufactured by the machine was examined. As a result, “KEMOMI”
progress degree gave extensive influence on brush performance such as fiber
distribution, brush rigidity, ink maintenance and defective rate of the finished
products. The results confirm that it is very important to distribute the material
filaments uniformly, therefore improving one's ability of “KEMOMI” process in
less time will be required to manufacture a high performance cultured brush.
ReferencesA. Yoshida and M. Nihei.et. (1996) Investigation of test method for stiffness of
toothbrushes : (Part 2)Correlation among different test methods 316-317
M. Nihei and A. Yoshida.et. (1996) Investigation of test method for stiffness of
toothbrushes