Embed Size (px)
Citation preview

8
Accounts
FromCommittee
nnan)
from the SenateCommittee on finance
Senator Peter K Bahalas
Senator Clive L Duval, 2d
Senator William A. Truhan
the Senateon
Senator Daniel W Bird, IrSenator Saslaw
Senator Lawrence Wilder
to avoidis
beyondDHTcurrent
form based on staff andthe of funds. While the pace ofmain tenance hasincreased over the last severalyears, more information on replace-ment needs should be made available. Adoption of a pavement management system andimprovement of existing bridge rating procedures will help DHT to better relate the levelof maintenance replacement spending to the
mandate for reasonable and necessary maintenance
Maintenance Productivity. Efficient use ofresources by DHT is also important in determining maintenance funding needs. Analysisof DHT expenditures and labor and equipmentuse shows that there is substantial variation inproductivity between residencies, and that atleast some of the variation can be attributed to
the different practices used in performingmaintenance. Statistical analysis of these differences indicate that DHT could achieve asavings of approximately eight percent in itsordinary maintenance program by improvingproductivity. This would amount to a biennialsavings of $9.7 million. DHT should reviewits procedures for identifying and disseminatingimproved work practices to more quickly andeffectively upgrade maintenance productivity.
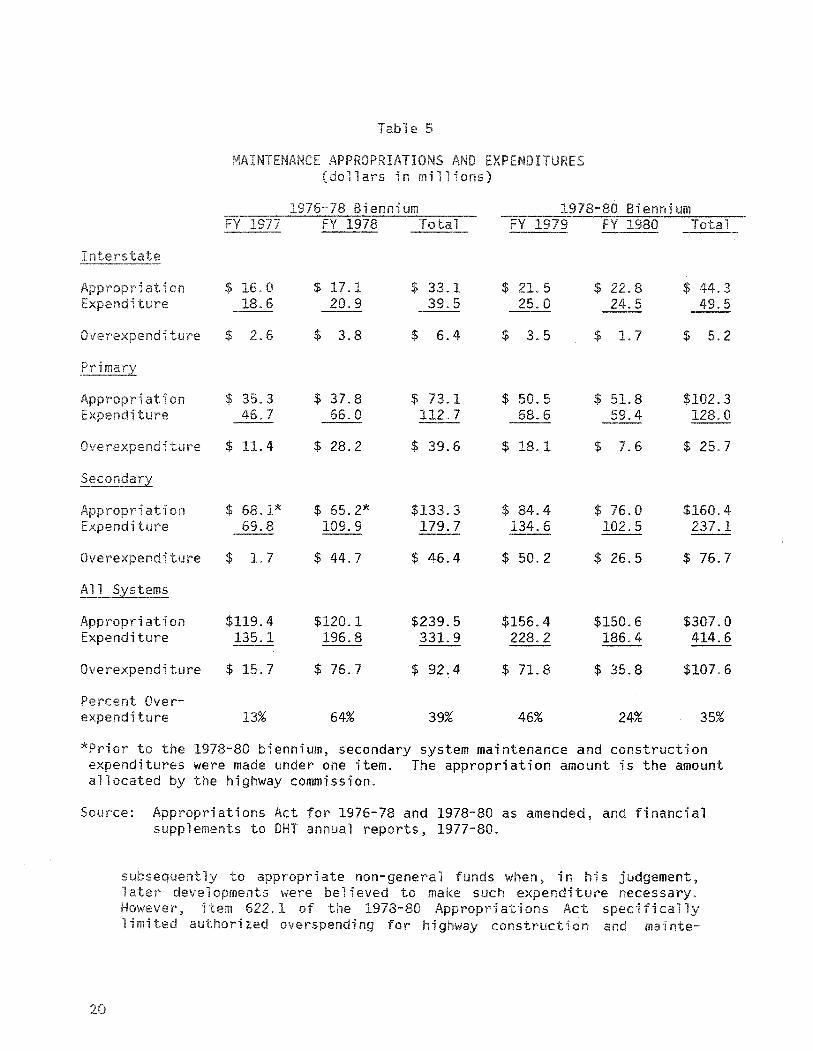
Legislative Control. A review of DHTspending also found that the 1978-80 biennialmaintenance budget was overspent by $59million above legislative appropriations. Appropriations Act provisions clearly establish aspending limit for highway maintenance butthis provision appears to have been disregarded. DHT contends that the overspending wasfor purposes more similar to construction thanmaintenance. However, similar activities havebeen coded as maintenance by DHT since atleast FY 1971. A revision in control procedureswithin the Department of Accounts is necessary to ensure that future spending is consistent with the Appropriations Act.
Overall, the review found that the recordis unclear on the degree to which pastpatterns of maintenance spending have beenconsistent legislative mandate tobudget for reasonable and necessary levels ofactivity. is is spending has
in in one case,
budget formaintenance. Several DHTmaintenance budgeting practice afor more refined information, however.
Routine Maintenance. Routine maintenancebudgets are developed through a MaintenanceManagement System (MMS) which uses standards to establish funding needs for the vari0us activities. While the system appears fundamentally sound, the standards do not alwaysreflect actual workloads nor do they necessarily guide field crews in carrying out routinemaintenance.
For example, MMS budgets do not alwaysreflect the actual work to be performed. Arecent review of several workload indicators bythe Virginia Highway and TransportationResearch Council found that the workload estimates used in MMS varied from actual workloads by as much as 800 percent. While theresearch council did not attempt to projectthese findings to the entire system, an efforthas been undertaken to measure more accurately workload for pavement surfaces, drainage structures, bridges, and other major components of the highway system.
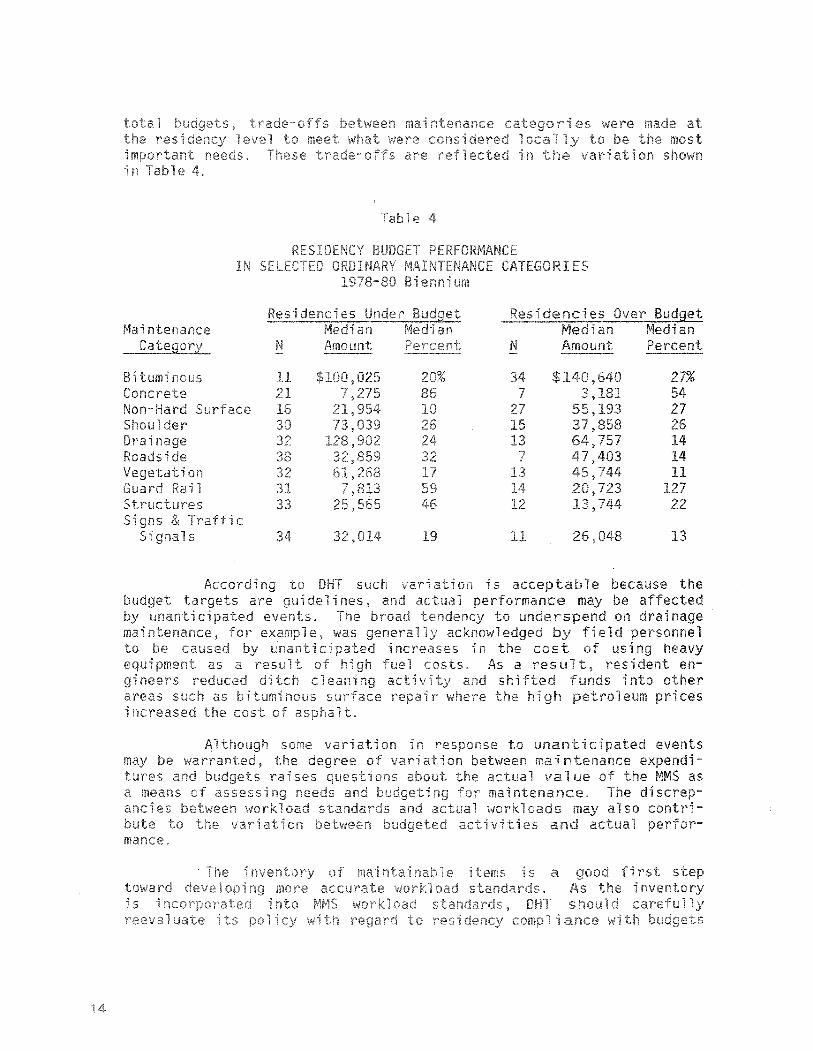
Moreover, field staff often vary theirworkload from what was used to developbudgets based on standards. For example, 32residencies spent $4.1 million, or 24 percenton the average, less on drainage than wasbudgeted by MMS. In contrast, 34 residenciesspent approximately $5.5 million, or 27percent on the average, over budgeted amountsfor bituminous surface maintenance.
Although some variation necessitated byunanticipated events may be warranted, thedegree of variation between maintenanceexpenditures and budgets raises questions aboutthe actual value of the MMS as a means ofassessing needs and budgeting for maintenance.DHT should carefully reevaluate its policyconcerning residency compliance with budgetsbased on workload standards. Either closeradherence to the standards should be requiredor the value of maintaining and updating thestandards should be reviewed.
Maintenance Replacement. Maintenancereplacement activities are budgeted on thebasis of years' coupled with areview of field office requests district andcentral office staff. for maintenance
follows a traditional incremental
II
in
anya means of
projectsof use to
one
primarylast 15 years,way construction.recent assessmentshowed$6.7DHT reportreasonableestablishingis essentialtheand ap~lror)riate
An1980
inof
role
econothis
quanconsidera-
Inenvironment
policy,to review
a
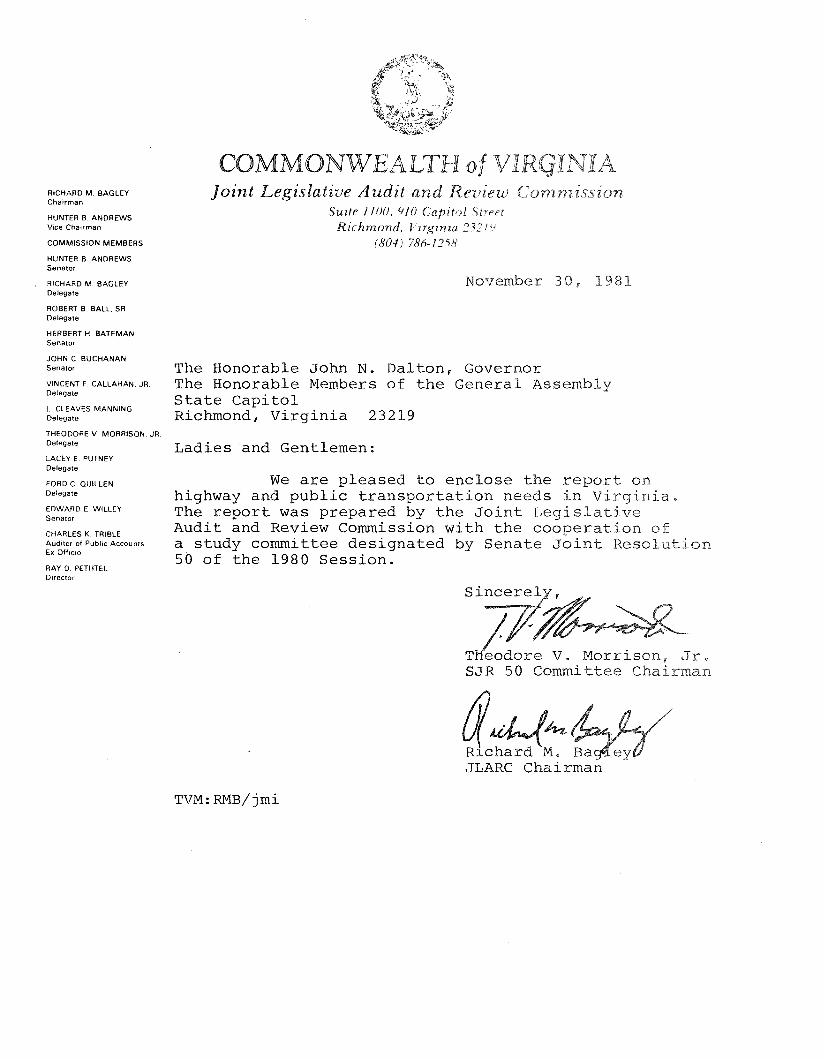
We are pleased to enclose the report onhighway and public transportation needs in Virginia.The report was prepared by the Joint LegislativeAudit and Review Commission with the cooperation ofa study committee designated by Senate Joint Resolut50 of the 1980 Session.
RICHARD M. BAGLEYChairman
HUNTER B. ANDREWSVice Chairman
COMMISSION MEMBERS
HUNTER B ANDREWSSenator
RICHARD M. BAGLEYDelegate
ROBERT B. BALL. SRDelegate
HERBERT H. BATEMANSenator
JOHN C BUCHANANSenator
VINCENT F. CALLAHAN. JRDelegate
L CLEAVES MANNINGDelegate
THEODORE V. MORRISON. JRDelegate
LACEY E PUTNEYDelegate
FORD C. OUILLENDelegate
EDWARD E. WILLEYSenator
CHARLES K. TRIBLEAuditor of Public AccountsEx Officio
RAY 0 PETHTELDirector
COMMONWEALTHJoint Legislative Audit and Review
Suite 1100. 910 Capitol StTNtRichmond. Virgima 2321
(804) 786-12'58
November 30, 1981
The Honorable John N. Dalton, GovernorThe Honorable Members of the General AssemblyState CapitolRichmond, Virginia 23219
Ladies and Gentlemen:
Sin~%,
T~dore v. Morrison,SJR 50 Committee
~. 4.,-----.Rlchard M.JLARC Chairman
TVM:RMB/jmi
Jr.

I7
Needs Assessment . . . . . . . . . . . . . . . . . . . . . . . . . . . . . . . 10Maintenance Productivity. . . . . . . . . . . . . . . . . . . . . . . . . . 21Maintenance Funding Requirements and Recommendations . . . . . 27
III.
IV.
HIGHWAY NEEDSAND FUNDING REQUIREMENTS .
Interstate System Funding Requirement . . . . . . . . . . . . . . .Urban, Secondary System Needs .
Construction Funding Options . . . . . . . . . . . .Conclusions and .
PUBLIC TRANSPORTATION NEEDSAND FUNDING REQUIREMENTS .
Public Transportation Systems . . . . . . . . . . . . . . . . . . . . . . .Transit Finance . . . . . . . . . . . . . . . . . . . . . . . . . . . . . . . .Ride-sharing . . . . . . . . . . . . . . . . . . . . . . . . . . . . . . . . . .Funding Policy Options for Public Transit . . . . . . . . . . . . ...
31
36404956
59
59637173
Technical Appendix Summary . . . . . . . . . . . . . . . . . . . . . . . . . 75

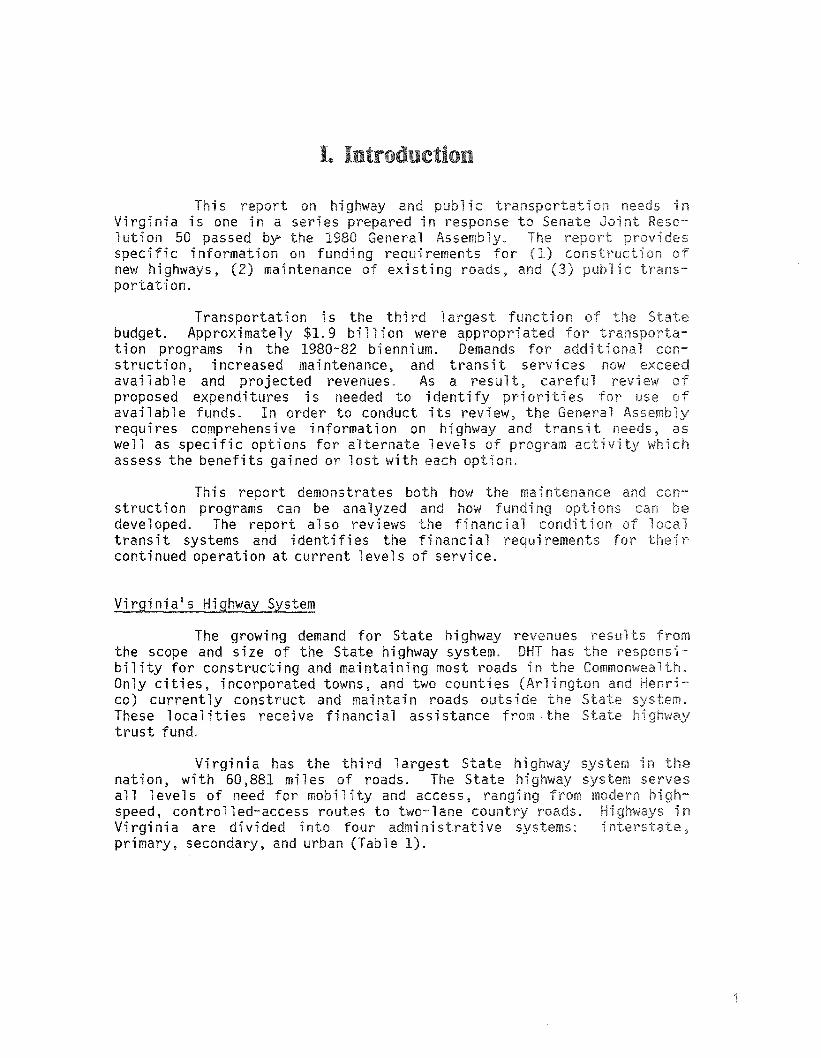
isVi nia is one in a1 on 50 passed bY'specific informationnew hi ghways, (2)portation.
Transportat ion is thi 1argestbudget. Approximately $1.9 billion were approprit i on programs in the 1980-82 bi enni urn. Demands for istruction, increased maintenance, and transit servicesavailable and projected revenues. As a result, carefulproposed expenditures is needed to identify esavailable funds. In order to conduct its review, therequires comprehensive information on highway and transitwell as specific options for alternate levels ofassess the benefits gained or lost with on.
Thi s report demonstrates both howstruction programs can analyzeddeveloped. The report also reviews the nancial ontrans it systems and i dent ifi es the nand a1 requi rementscontinued operation at current levels of service.
Virginia's Highway System
The growi ng demand for State hi ghway revenuesthe scope and size of the State highway system. hasbility for constructing and maintaining most roadsOnly cities, incorporated towns, and two countiesco) currently construct and maintain roads outsiThese 1oca1it i es recei ve fi nanci a1 ass i stancetrust fund.
Vi rgi ni a has the thi rd 1argest Statenat ion, with 60,881 mil es of roads. The Stateall levels of need for ility and access,speed, controlled-access routes to two-laneVi rgi ni a are di vi ded into niprimary, secondary, and urban (Table
cities
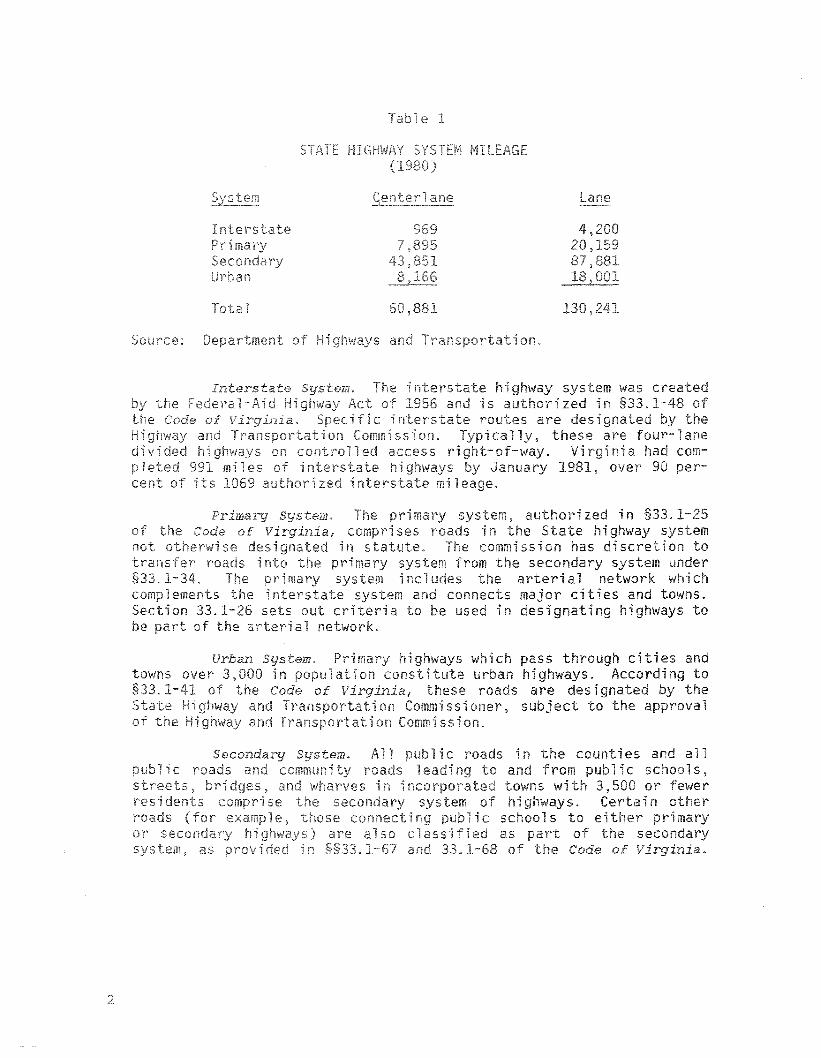
increasedusted
ntenanceave the
i ng has been marked a real 1ass inon are removed. Over the
third of its purchasing power.
ng theon, a
i ng measureddecade.program scopedecade the
Fi
(dollars in millions)
$500
400
350
300
250
200
150
100
50
Construction
Maintenance*.---------------------------
1971 1972 1973 1974 1975 1976 1977 1978 1979 1980
Actual
- Adjusted
*Excludes snow removal ice contro and winter floodexpenditures.
Source: of Highways on.
is abut
on the ysis ofconstruct ion, andfor this infie d personnel
ofextensiveI ic transit
ich was
arentenance,
sourcethsystemn each
rli:>'c:rv"bed be1ow.
was basedmates of future
1icy docuntenance
Maintenance.on data the ntenance ,maintenance requirements, Maintenance D v s onments, and i ntervi ews at all Ieveorgani on. ture data the
mates covered sca yearssion analyses were applied to
ivi of eld units.
inwere
ocal transused in the
ic rtatiia status of transit
the systems. Interon Division personnel,
cal s. i ngcollected from these sources.
the rIII analyzes
rements for threeon needs are
nder of of

the Hnecesother
cientment incomfort,
Ane reasonable
growth int ion renance servi ces c
a1 ons.
needs s required tontenance. The 1;
the continued i a-uate the need for mai nte-
more ci ent to rform essen-orities ma ntenance vities
eXlperlCll ture 11 i de a II rea-can a so more
ssion. J IS review of11ion or more can be saved
are: (1) theilities; and 2) the pro
lie. The maintenance(tunnels ands as reshi users.
Fi 2
MILLION
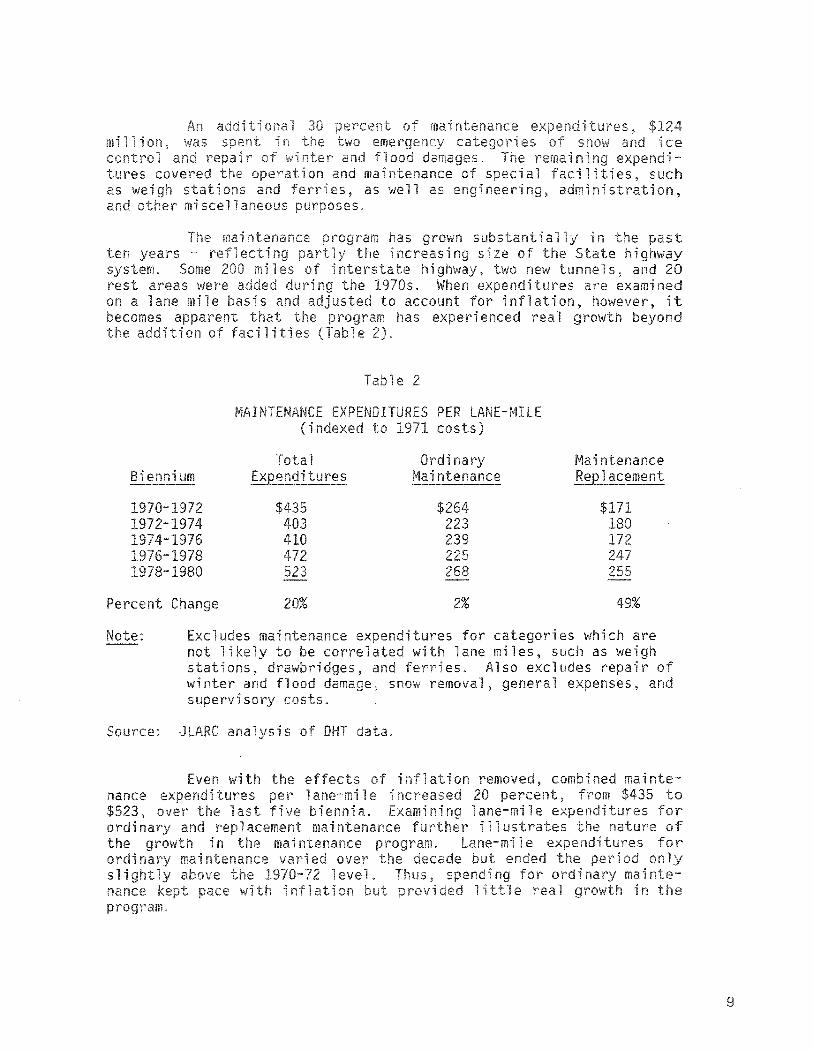
le 2
costs)
Biennium
2%
intenanceReplacement
49%
Routi
yearresources
sac(:oITlplishment of the
Maintenancetee of ntenance
betweenthe basis of their jUd~gen~erlt
and levels service theconvenience, ttee
ons to be ntained
for the rstatementsd be achi eved.
Performance standards were deveactual work performed by 38 ntenance areasaround the State and a rev ew of threestudies were performed to improve
ne activities and work unit measures.establishment of fo ng:
workloads for each activity; (2) the resources--laborals-··required for i (3) the re
workloads and road types; the andtions in wo oad
Jorgenson study ve and resoffered a sound to ne rna i ntenance.uent changes in ntenance standards have refl ected in work-loads, conditions, costs, and po ic es. These ustments havethe resource rement unit f most cases, seither increased effi ci ency or a that the idards were hi gher than necessary. In genera , thedeveloped in the 1960s remains intact and serves as a base fori ng.
These standardsmost routine maintenance
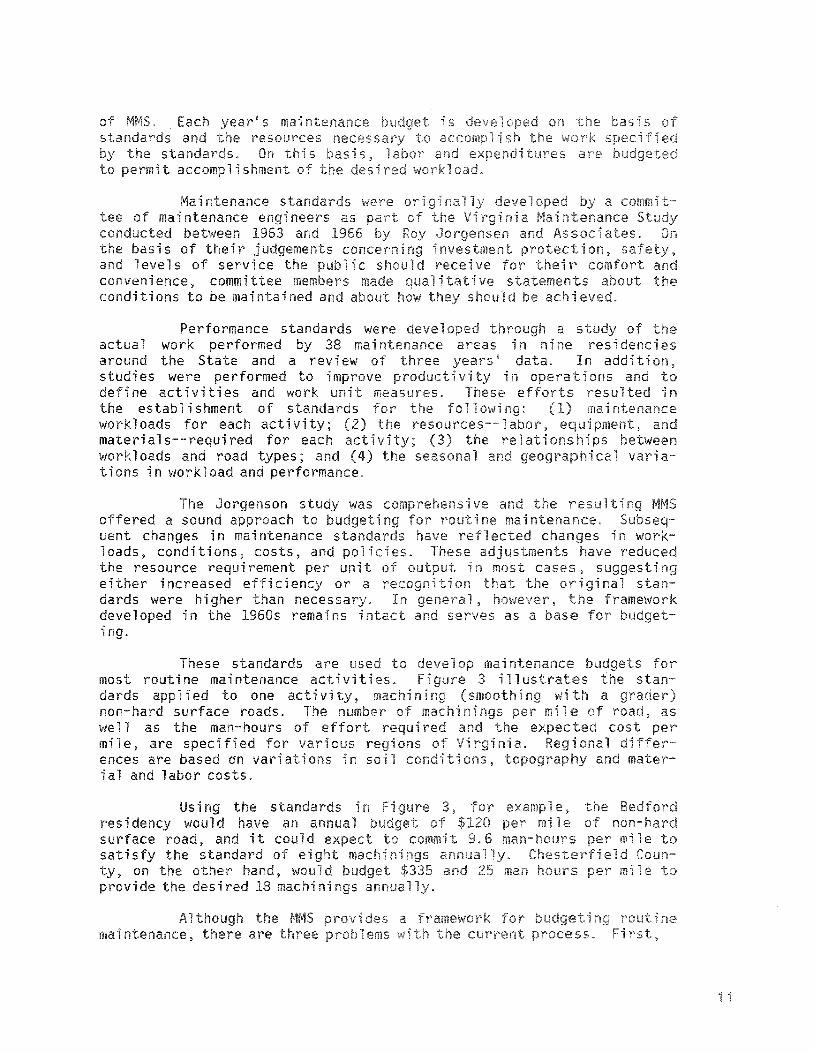
1i to onenon-hard surface roads.we 11 as the man-hours of effortmile, are speci ed for variousences are based an ons iial labor costs.
Usi ng theresidency would have ansurface road, and it could
s the of eithethe
thentenance there are
3
ng Hard Surface on
es non-hard surface roads in
mach; i le annually - Staunton, Salem, Bristol di ctsmach;nings/mile annually - Culpeper and lynchburg districts
ini le annually - Richmond, Suffolk and Fredericksburgdistricts
4.0 man le machined - West of Blue Ridge2.4 man hours/mile machined - Counties bordering on eastern slope
of Blue Ridge1.4 man hours/mile machined - State
$53. le - Wise, Dickenson, Buchanan49.50/mile - Staunton, Salem and Bristol districts31. le - leesburg3D. DO/mile - Amherst, Charlottesville, Culpeper, Warrenton,
Bedford, Martinsville and Rocky Mount residencies.DO/mile - Fairfax
20.00/mile - Manassas18.60/mile - lynchburg, Richmond, Suffolk and Fredericksburg
districts and Louisa residency
Source: Highways and Transportation.
ons about workloads that are incorporated into MMS stanto be reviewed and updated. Second, field staff commonly
compliance th the budget targets. The third problem isdoes not establish ties for routine maintenance.
The assumptions about workload indeveloped in the 1960s, appear to need
usted the Maintenance vision to meetHowever, the rgi a Hi ghway and
) demonstrated in 1979 inons d not ect actual
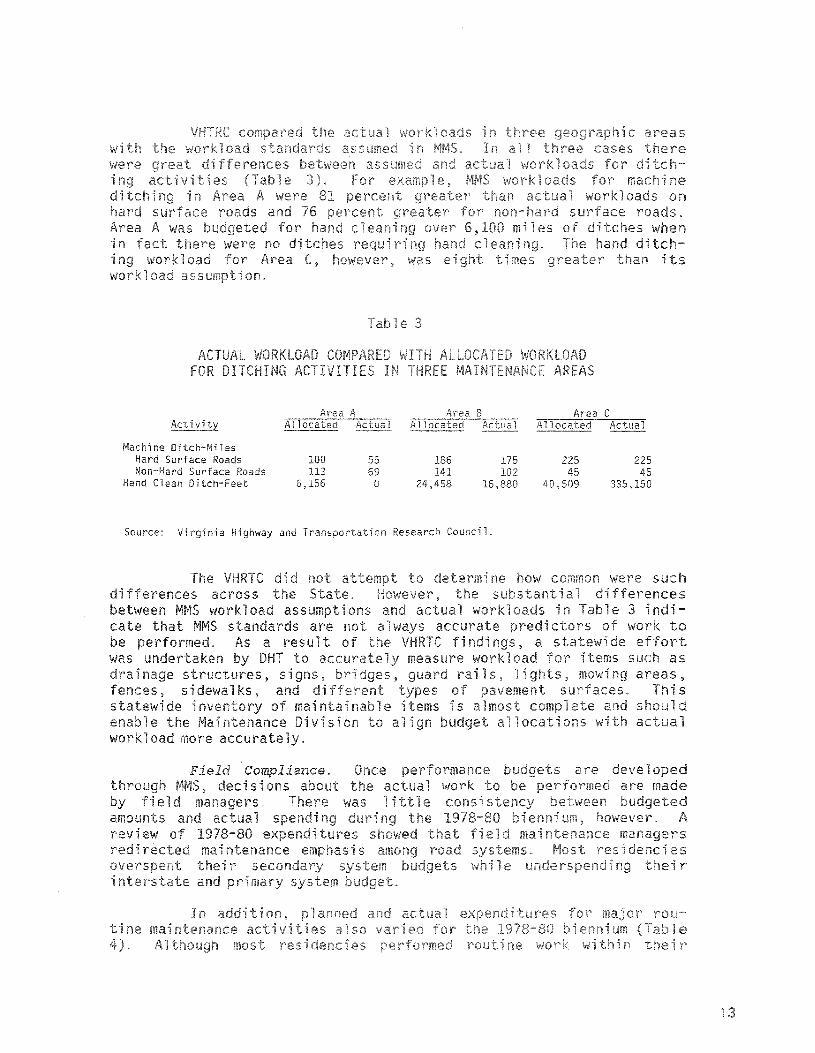
Machine Ditch-Mi esHard Surface RoadsNon-Hard Surface Roads
Hand Clean tch-Feet
100113
,156
5569o 24,
186 175 225 22545
335,150
Source: Virginia Highway and Transportation Research
ntenance Divisiaccurate y.
7
neand
on andcareful
vidualthat
are madedeliber-
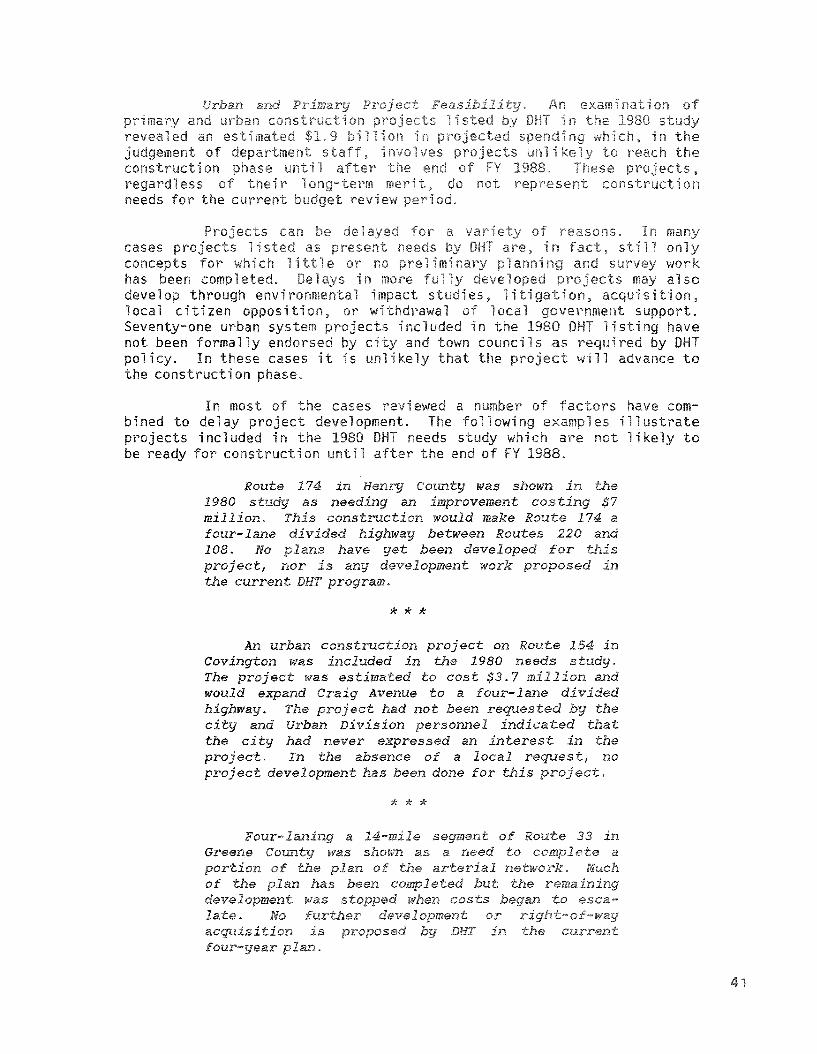
idencan be5and
there is
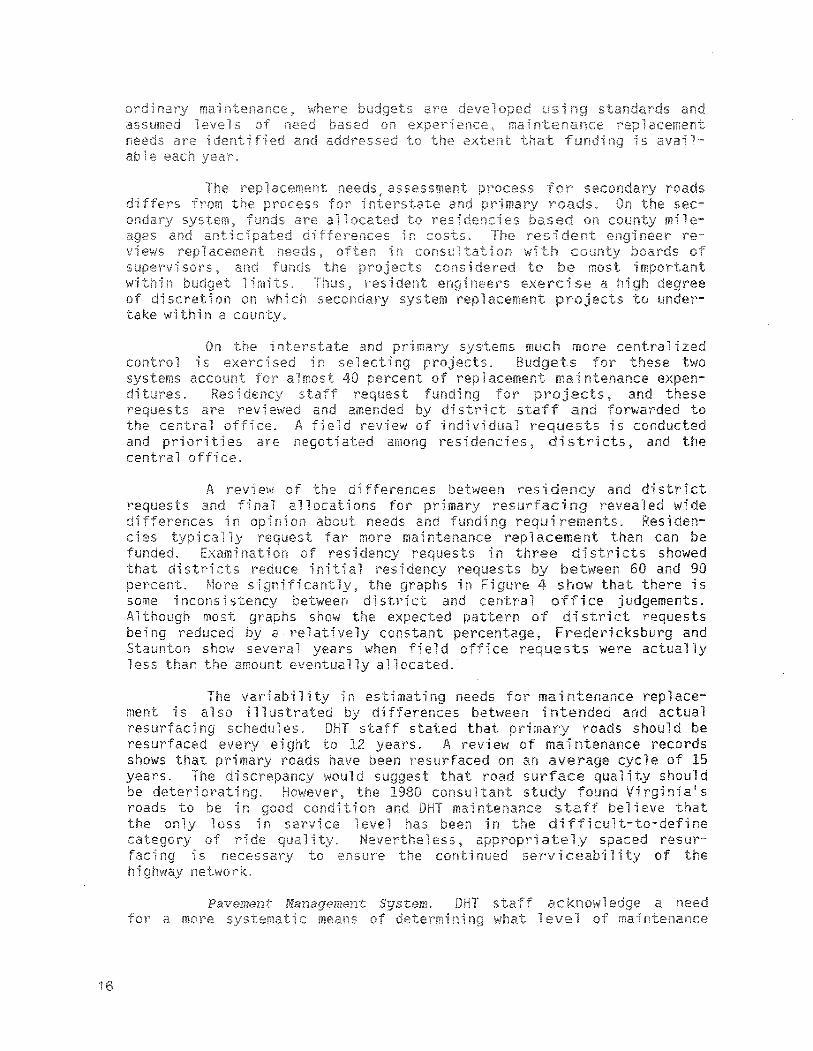
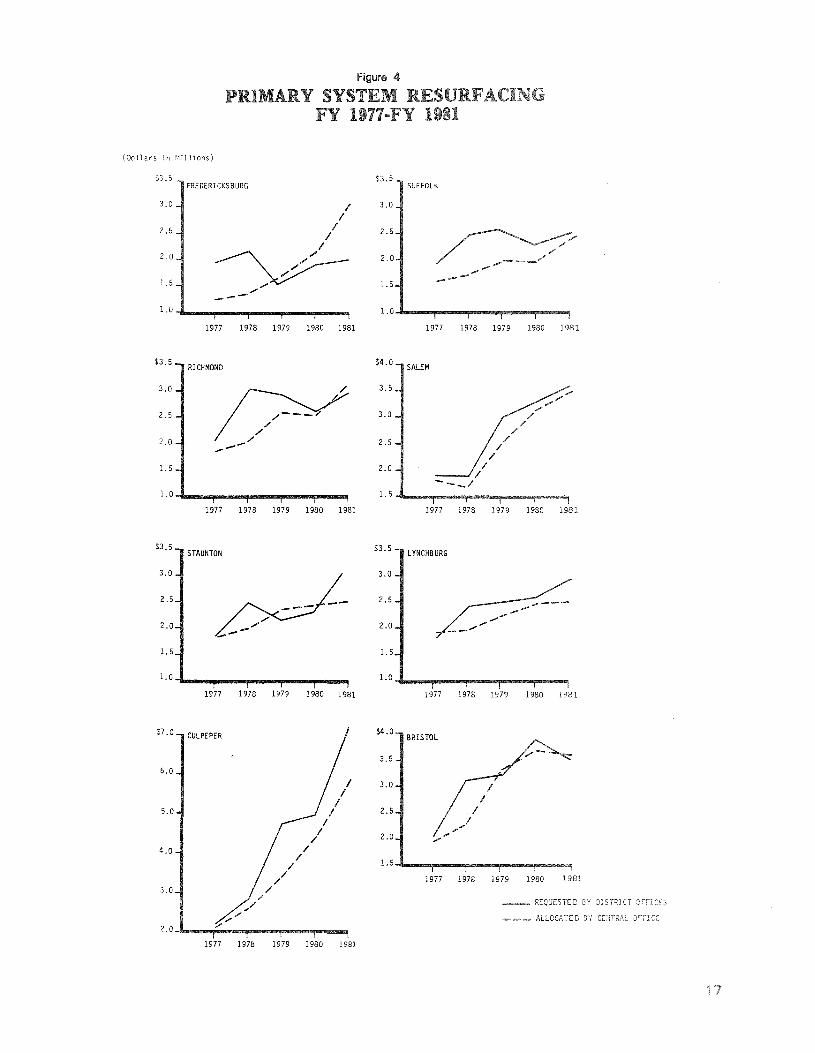
mentres ngresurfacedshows thatyears.
(Dollars in t1illions)
S3.5 $3.5FREDERICKSBURG SUFFOLK
3.0 I 3.0
I2.5 I 2.5I
I2.0
~2.0
---1.5 1.5 ---""---1.0 1.0
1977 1978 1979 1980 1981 1977 1978 1979 1980 1981
$3.5RICHMOND
$4.0SALEM
3.0 3.5
2.5/-__ 7
3.0/
/2.0 / 2.5.---1.5 2.0
1.0 1.5
1977 1978 1979 1980 1981 1977 1978 1979 1980 1981
$3.5 $3.5STAUNTON LYNCHBURG
3.0 3.0
2.5 2.5 ..... ----.--2.0 2.0 ---"-----1.5 1.5
1.0 1.0
1977 1978 1979 1980 1981 1977 1978 1979 1980 1981
S7.0 CULPEPER$4.0
BRISTOL
3.5
6.0
I 3.0 /II I
5.0 I 2.5 II
'"I
I ..../ 2.0 .",-
.,4.0 /
/1.5/
/ 1977 197B 1979 1980/3.0 /
'" REQIJESTE 0",,I'.,
ALLOCATED...2.0 /"
1977 1978 1979 1980 1981
ntenance Di vis i on has i t i ated theia s highways. According to the maintenance
on on the interstate system 11 beGiven an adequate pri ty, data on a ~~I~~&'~~.nT
mary, , and secondary systems couldOHT 1d place a hi gh pri ority on deve 1opi ng a
manalJeolenlt system for rginia. The preliminary information si in a status report to the 1983 General Assemb
lete assessment of highway condition should be completeding of 1984-86 biennial budget cycle.
Maintenance Information. A second area of maintenancereplacement needs assessment and budgeting which underutilizesi on is dge maintenance. DHT spent $11 mi 11 ion in
maintenance lacement work on bridges. Bridge maintenanceand a11 ocated to res i denci es on the bas is of a fi e1dincorporates professional judgement, field requests, and
arerevi ew whi chcampl nts.
DHT Bridge Division maintains a comprehensive in\l,~nT'n~\I
dges on a11 systems. The inventory provi des i nformat ioncondition based on periodic field inspections made by
neers. Reports made by the inspectors are used to ratetion of each dge. Ratings range from 100 (excellent condi
zero (very condition). In addition, inspectors' reportscontai ons for specific maintenance needs on the bri
usemaintenance
c-.-:"-.-.,,,nde.
ial usefulness the bridgenot reviewed by the central ce
ntenance replacement budgets. Ar,rnl~rli
neer, di stri cts are supposed toto set es for
c use the data
can serve as anacement ntenance needson the i can
differentof indication
a
that ncons stent ratusefulness
is tonecesever,
i i
ons madecontro loverincrease itsprovisions also
ntenancebas c
some exisions,
e
$ 16..6
$ 17.120.9
$ 33.139.5
$ 21. 525.0
$ 22.824.5
$ 44.349.5
Ih/<::'Y>;:l,yn",nri 1 ture $ 2. 6 $ 3.8 $ 6.4 $ 3.5 $ 1.7 $ 5.2
$ 35.346.7
$ 37.866.0
$ 73.1112.7
$ 50.568.6
$ 51. 859.4
$102.3128.0
lhll:>",c,vnon';'ture $ 11. 4 $ 28.2 $ 39.6 $ 18.1 $ 7.6 $ 25.7
$ 68.69.8
$ 65.2*109.9
$133.3179.7
$ 84.4134.6
$ 76.0102.5
.4237.1
UVI~re!xpen<1iture $ 1. 7 $ 44. 7 $ 46.4 $ 50.2 $ 26.5 $ 76.7
$119.4 $120.1 $239.5 $156.4 $150.6 $307.0135.1 196.8 331. 9 228.2 186.4 414.6-- -- --
ture $ 15.7 $ 76. 7 $ 92.4 $ 71. 8 $ 35.8 $107.6
Percent Over-iture 13% 64% 39% 46% 24% 35%
or to the 1978-80 biennium, secondary system maintenance and constructionexpenditures were made under one item. The appropriation amount is the amountallocated by the highway commission.
Source: ations Act for 1976-78 and 1978-80 as amended, and financialsupplements to DHT annual reports, 1977-80.
s Y to ate non-general funds when, in his judlClefillerltdevel were believed to make such ture necessary.
item 622.1 of the ons Act callyauthorized ng for hi construction and mainte-
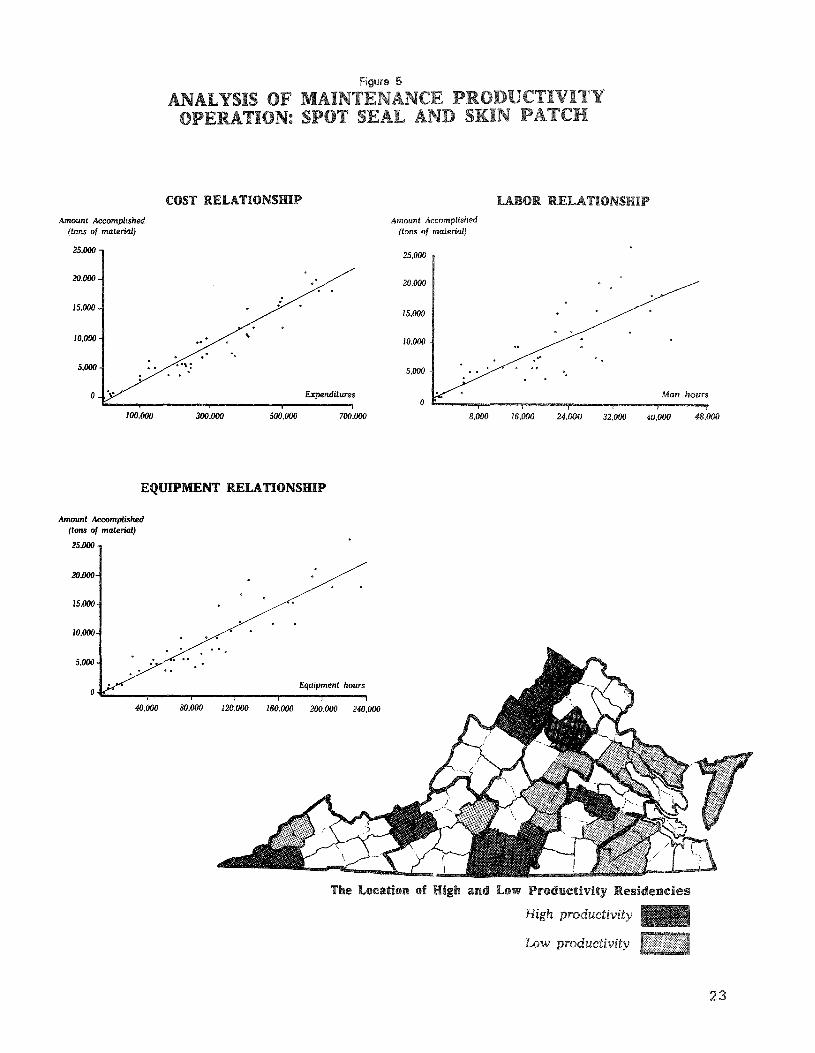
promoteonto
acrossaceom
use.ve
lineton
onship
poss; e to plot a lineaverage or norm
• and equive more
res i denc; es above there ve y essThe same
COST RELATIONSHIP LABOR. RELATIONSHIPAmount Accomplished
(tons of material)Amount Accomplished
(tons of material)
25.000 25,000
20.000 20.000
15.00015.000
10,000 10.000
5,000 5.000 '.
48.000
Man hours
w,ooo32.00024,00016,0008,000
O~__,....__,.....__,.....__,....._-...,,....._""",,""!o
100.000
EQUIPMENT RELATIONSHIP
Amount Accomplished(tons of material)
25,000
20,000
15,000
10,000
40.000 80,000 120.000 160.000 200.000 240.000
Equipment hourso"L__..,..__,....__,...._-...,__....,.__-,
5.000
Low
Tbe Location of Higb and Low Productivity Residencies
High
its methodsareas. First, the
on about theght
systematically~oro,~m'ne if they
residencies.transfer is
whichThe cost of
reduced in many casesditchers. A rotaryfor hauling material
trucks. Ins tead,banks, or into woods
is thisbe used in densely popu-
where the soil is too
a very
or inareaslated
is essential toditches can be
the use ofditcher iminates the needremoved from ditches in
is thrown back ontoBecause the
cannot
ditcher.on about 60
e the second residencyWhere the
reducedper mile
00 with
tar.did a bettermake this
beNotareare
nerna i ntenanceal
rna i ntenancee 1d crews.
lower it cost than
matelythese
1"",...... ",r<
about actua11 be or
ntenance is i
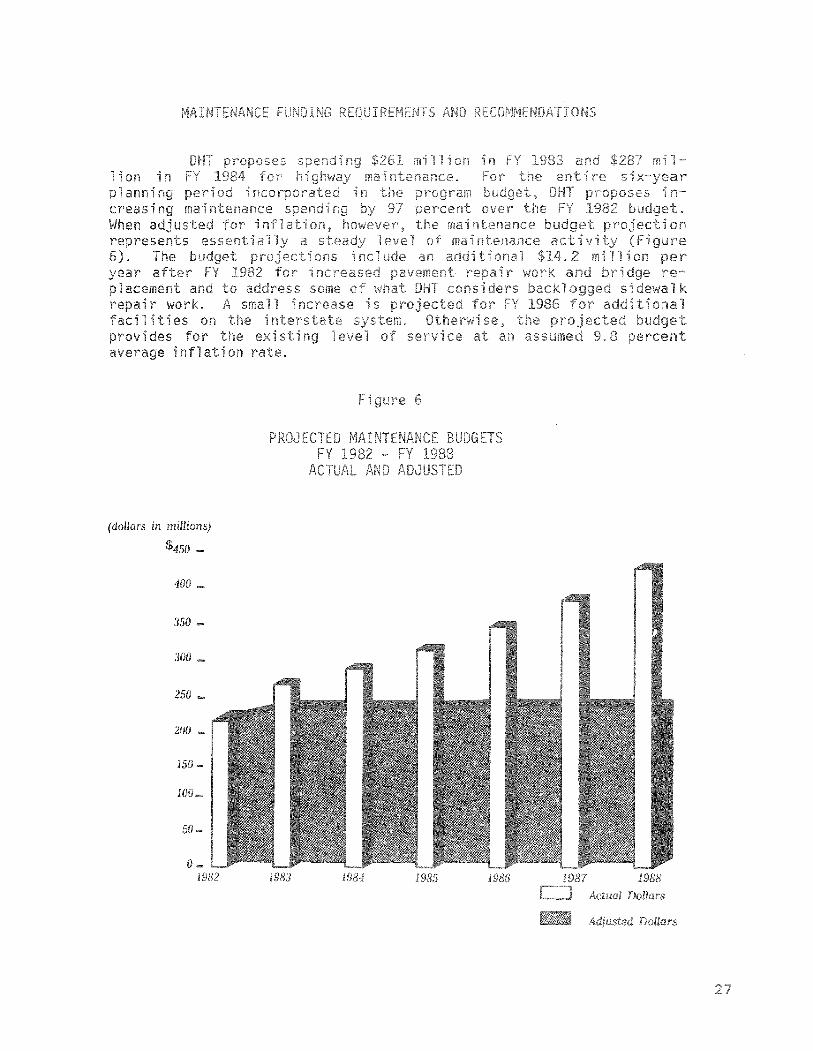
400 _
350 _
aced on theRecommendationcondi on ng
Division should takebridge engineers to ensure that ratirating system should be used systematistatewide priorities for bridge maintenance.
Recommendation (5). shouldtake the lead in developing a methods improvementat reducing costs and improving efficiency. servicesdivision, in conjunction with the maintenance neer, should under-take a comprehensive review of the various methods used residenciesto perform maintenance activities and the conditions whichods can be transferred to improve productivity. When productivityimprovements are feasible and appropriate, maintenance managers shouldensure that they are fully implemented.

5
in Alexandria calledRoute 1 to a six-
The wasat the
than four lanesdoes not appearstruction the ~"u"e<4~~'~~
a oflane limited access facilintended to traffiction of Route 1 and the1-595. The 1-595 extension is itsel
the ci not now desirein this corridor. Therefore itthat Route will be under con-
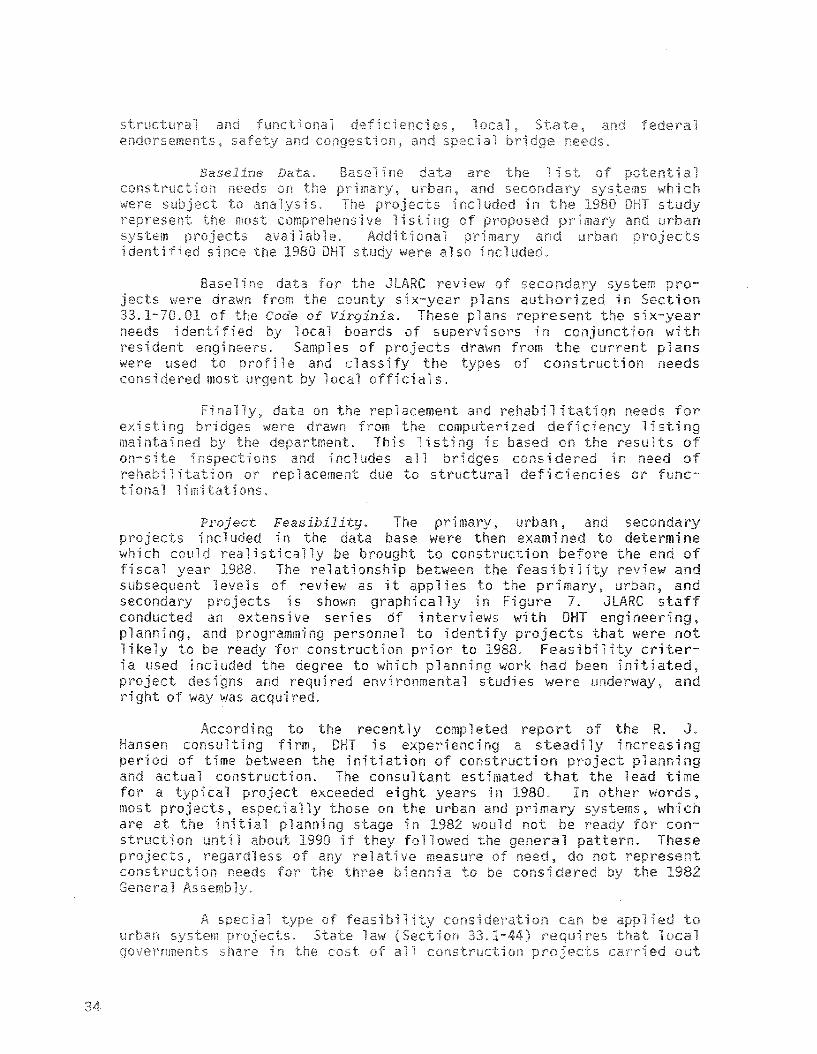
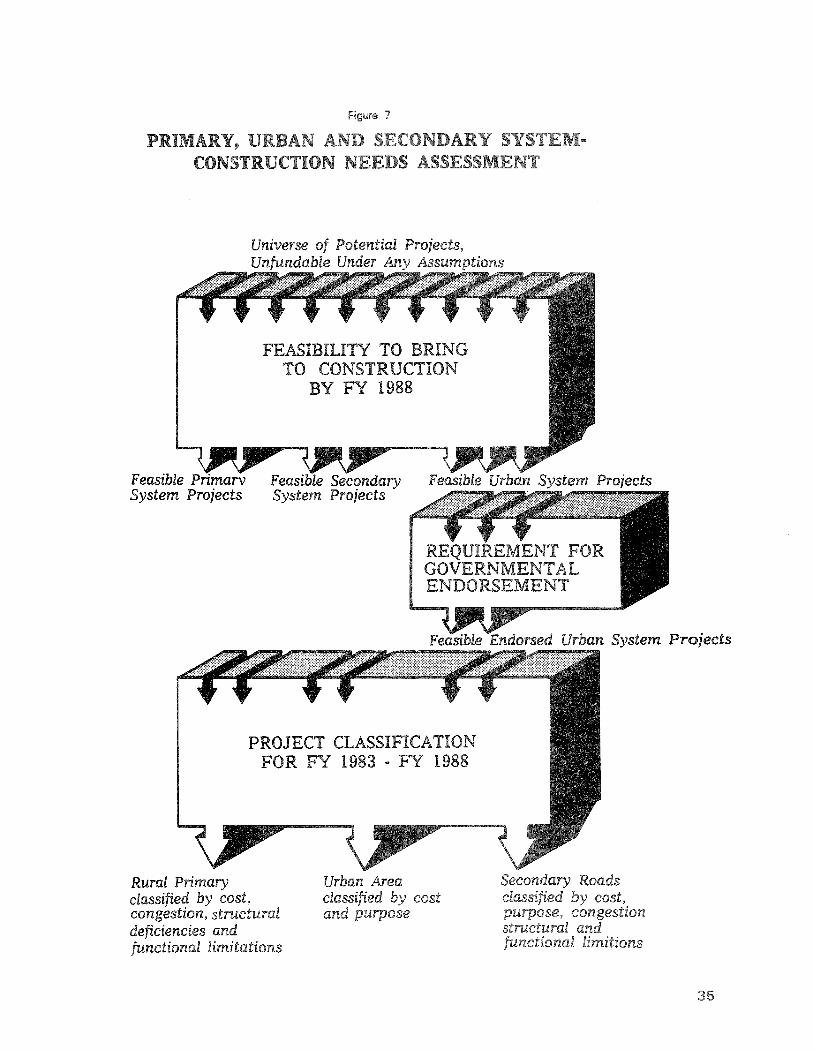
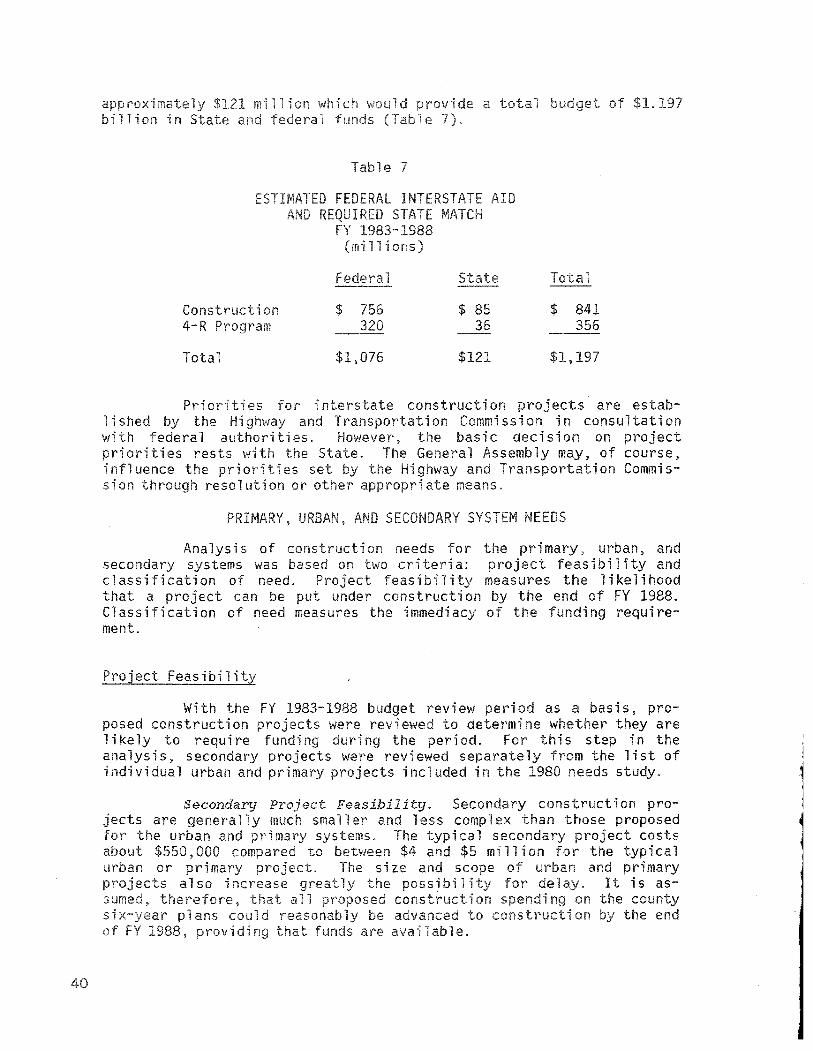
Figure 7
FEASIBILITYTO CONSTRUCTION
BY 1988
Feasible Primarv Feasible SecondarySystem Projects System Projects
PROJECT CLASSIFICATIONFOR FY 1983 - 1988
Rural Primaryclassified by cost,congestion, "r.... ''''1".deficienciesfunctional limitaltiorts
System Projects
35
access hi nn\tJ~\,I<;'
and nato 42,
n a. As
In 1idetermi ng
bility of federal d.for approved projects at a
In
,la
1 leto a 10restor-
rgi ni ar",n"irv>"r"t"., on zat ion
cost to complete interstatecost to complete re
sys tern is reca1cuani federal funds
recent estimate of theDHT in
Construction Aid.recei ves a percentage theequa1 to the ratio of ( thesystems in rginia, to (2)system. estimated cost toevery two years and serves asfor the subsequent peri mostcost to campl system in rginia wasber 1980.
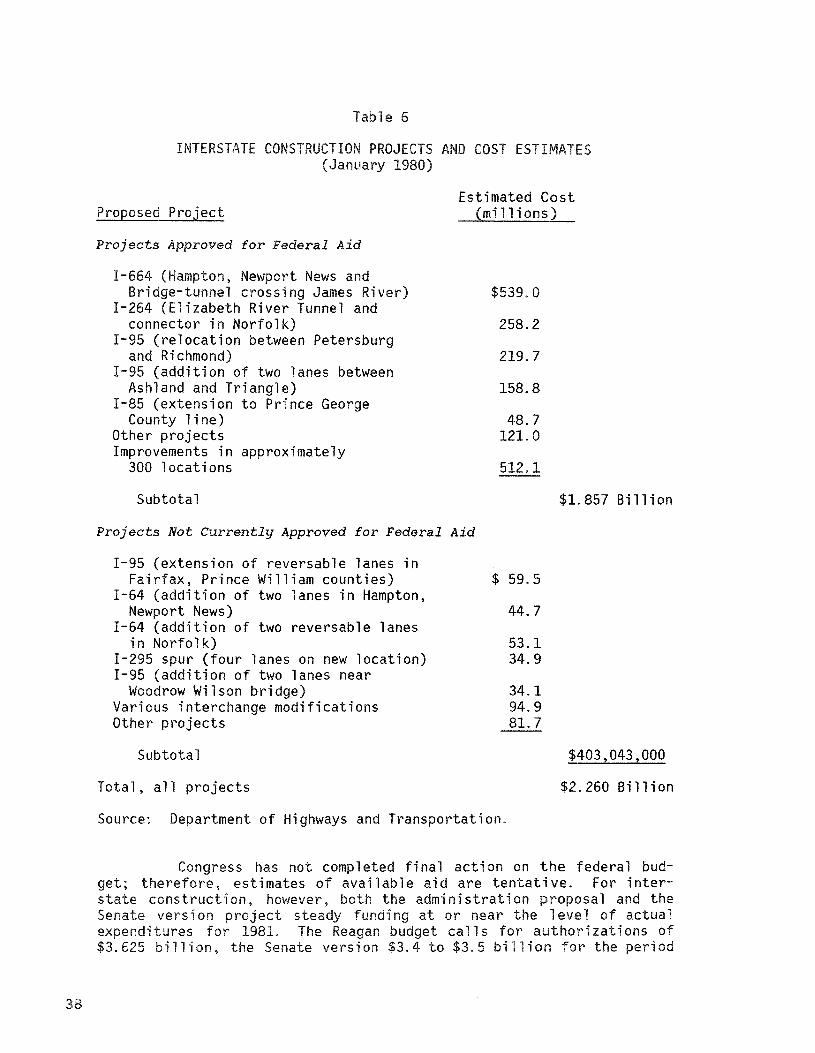
Table 6
INTERSTATE CONSTRUCTION PROJECTS AND COST ESTIMATES(January 1980)
Proposed Project
Projects Approved for Federal Aid
1-664 (Hampton, Newport News andBridge-tunnel crossing James River)
1-264 (Elizabeth River Tunnel andconnector in Norfolk)
1-95 (relocation between Petersburgand Richmond)
1-95 (addition of two lanes betweenAshland and Triangle)
1-85 (extension to Prince GeorgeCounty line)
Other projectsImprovements in approximately
300 locations
Subtotal
Estimated Cost(millions)
$539.0
258.2
219. 7
158.8
48. 7121. 0
512.1
$1.857 Billion
Projects Not Currentlg Approved for Federal Aid
1-95 (extension of reversable lanes inFairfax, Prince William counties)
1-64 (addition of two lanes in Hampton,Newport News)
1-64 (addition of two reversable lanesin Norfolk)
1-295 spur (four lanes on new location)1-95 (addition of two lanes near
Woodrow Wilson bridge)Various interchange modificationsOther projects
Subtotal
Total, all projects
$ 59.5
44.7
53.134.9
34.194.981. 7
$403,043,000
$2.260 Bi 11 ion
Source: Department of Highways and Transportation.
Congress has not completed final action on the federal budget; therefore, estimates of available aid are tentative. For interstate construction, however, both the admi ni strat ion proposal and theSenate version project steady funding at or near the level of actualexpenditures for 1981. The Reagan budget calls for authori zations of$3.625 billion, the Senate version $3.4 to $3.5 billion for the period
to match avai1ab e 3-RnY'nroc:s. sla-
ly change the11
nownv-,,,nll'::>m i
ai 11as well as
toresurfacing,
os 11 be changed to 90
state 4-R entitlements 11 be1ane mi 1es and total interstate
current formula includes only1d.
are 5
ve.to mates of 4-R funding
fiscal yearsVi rgi ni a IS ap
mate1yrO!)05·a in
mately1983 and 1988.
funds.
of
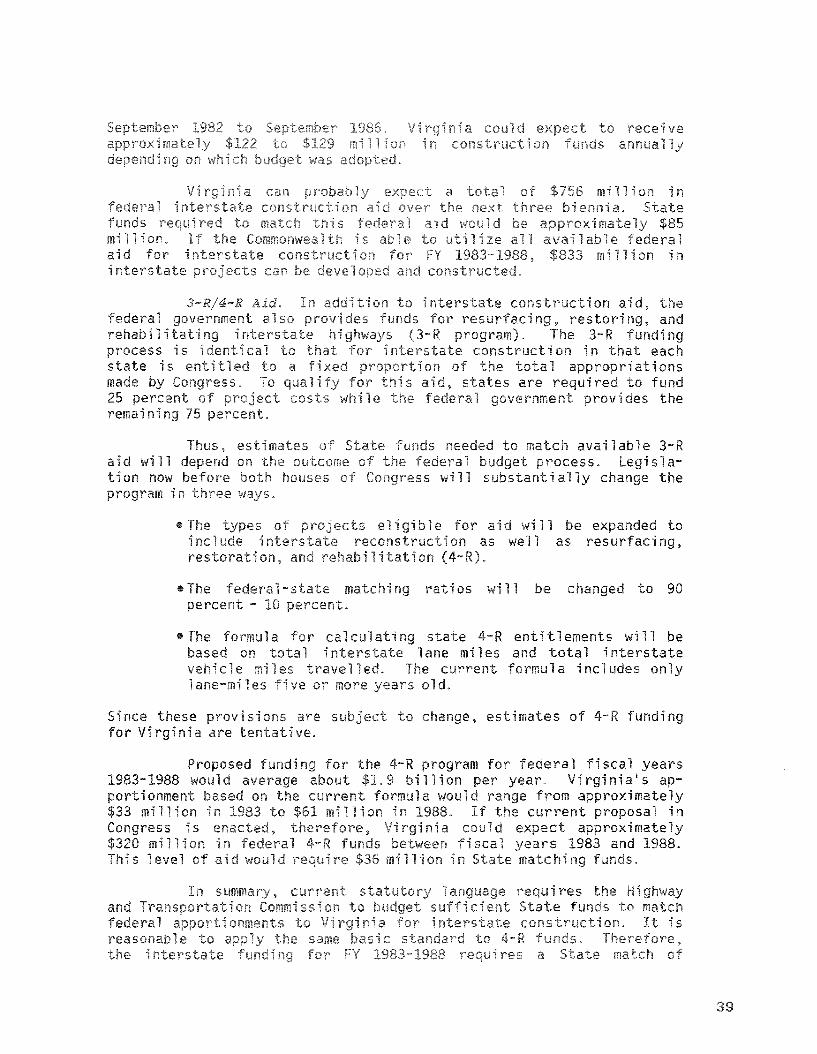
Tab e 7
o
Total
$320
$1,076
$ 8536
$ 841356
$1,197
1i shed by theth federal
priorities restsi uencesian
ects aress on in consultation
decision on projectly may, of course,
on Commis-
s
Analysissecondary systems wasclassification ofthat a project canClassi cation of needment.
on for the mary urban, andbased on two te a: ect feasibil ity and
Project feasibility measures the likelihoodput under construction by the end of FY 1988.measures immedi acy ng requi re-
With the 1983-1988 budget revi ew pe as a bas is, pro-posed construction projects were revi to determine whether they are1i ke ly to requi re ng duri ng the peri ad. thi s step in theanalysis, secondary projects were reviewed separately from the list ofindividual urban mary projects included in 1980 needs study.
~U.~VIIUM Y be advanced tothat funds are ava lab e.
Secondaryjects are generallyfor the urbanabout $550, 000urban or prip ects also increasesumedsix-year
f
hasdeveloplocal ci zenSeventy-onenot been formalpolicy. In thesethe construction
In mostb i ned to de 1ayprojects includedbe ready for
of com-ng examples illustrate
whi are not likely toof FY
Route 174 in was shown in the1980 as an $7million. This construction would make Route 174 afour-lane divided highway between Routes 220 and108. No have been developed for thisproject, nor any work proposed inthe current DHT program.
* * *An urban construction project on Route 154 in
Covington was included in the 1980 needsThe project was estimated to cost $3.7 million andwould expand Craig Avenue to a four-lane dividedhighway. The project had not been requested thecity and Urban Division personnel indicated thatthe city had never expressed an interest in theproject. In the absence of a local reques noproject development has been done for this ect.
* * *
Greene14-mile
of
t:.hatThein
"the
and NineRichmond
1:.0 "the
toMile Road Corridor were
COWlcil in 1978.surfaced in "the affected neig·h£,oI'
hood which desired awould the
* * *need for $84
(Rou"te 1up wi"th Laburnum
at butproposals
cons"truc"tion
a.nd linkuJ'lder
Noand any
The 1980 needsmillion to extendacross the James RiverAvenue. This isis stillha.vewell into
construction feasibility1i i n the 1980
required for constructionof the 1980 tota1
and urban ects associ atedy be advanced to construction
are able.
The net effectcons deration to the urbanstudy was to reduce theon the two systems $1. 9estimate. The remainingcosts on could
the end of FY if funds
In total, about $1.55 billion in mary, urban, and secon-dary could be dates for ng between FY 1983 and 1988.Constructing 1 of these projects would require an annual constructionbudget, exclusive of interstate, of mately $304 million in 1980dollars for each year the six-year period. liminary projections forthe 1982-84 biennium 1 for on spending, exclusive ofinterstate, of about llion These ections, accom-panied nuing inflation of on costs, suggest that full
og of al feasible p ects is ikely.
theon.
is of i
Rural Prima.ry Projects. This category consists of primarysystem projects, including the arterial network, which lie outsideurban planning areas. Most primary highway mileage is rural and servesto connect major lation and economic regions of the State. Assuch, these roads provide for longer distance through trips. Alternative routes between major termini are generally limited. Therefore,the traffic volume and relative congestion on a given route is a goodindication of travel demand in the corridor.
A second characteristic of the rural primary system is thefact that much of the mileage consists of older sections of highwaydesigned and constructed to meet lower standards than those currentlyin use. As a result, a portion of the rural primary system is structurally deficient and in need of reconstruction.
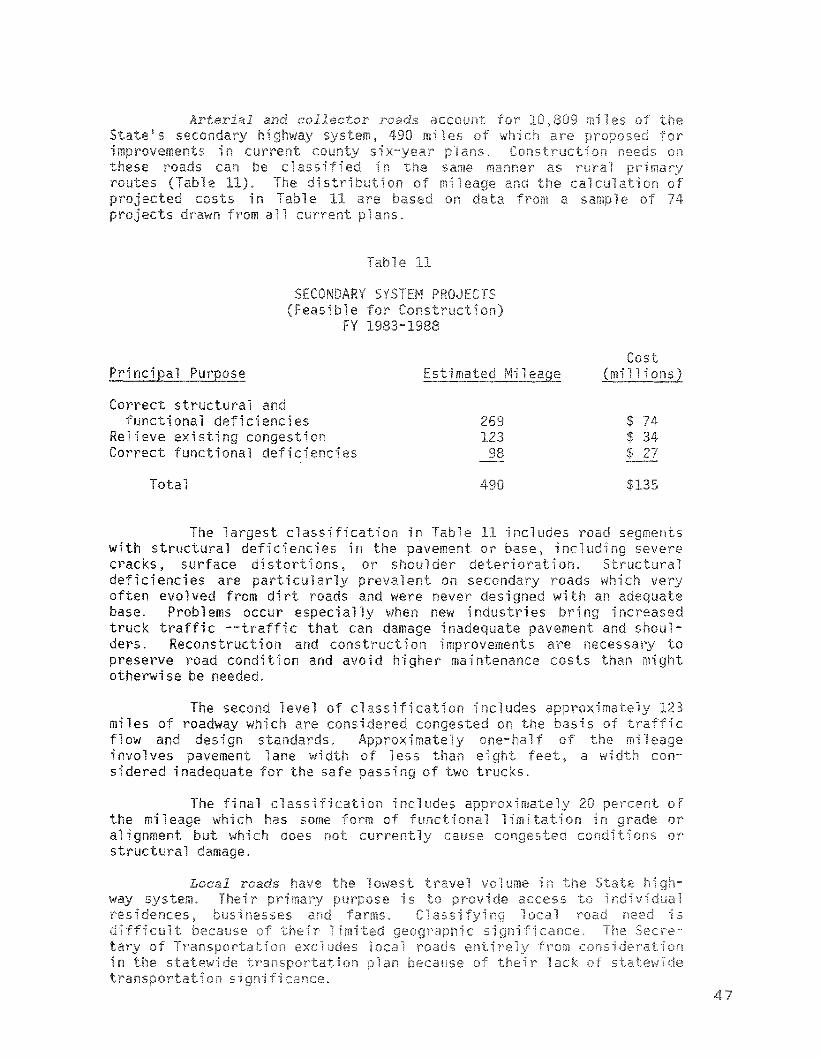
A total of 55 construction projects on rural primary routesare feasible between FY 1983 and 1988. For the most part, these projects do not develop new corridors or relocate major sections of highway. Rather, their primary purpose is to address existing structuraldeficiencies or increase the travel capacity of existing roads.
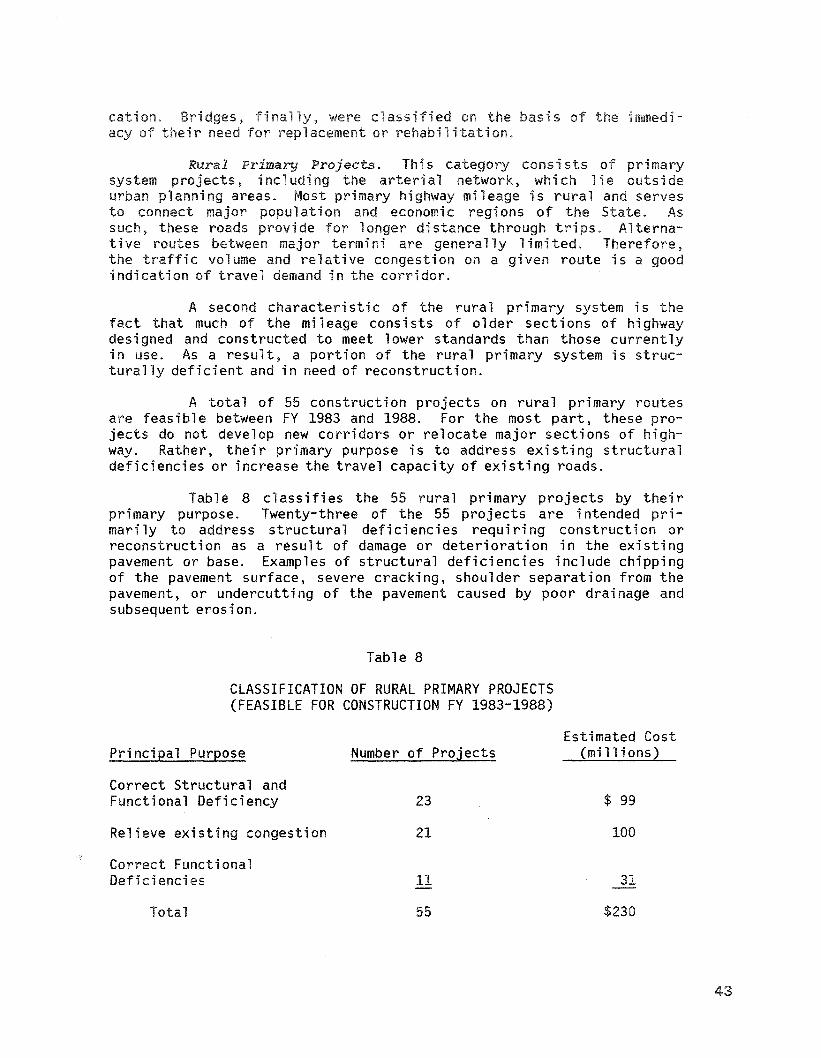
Table 8 classifies the 55 rural primary projects by theirprimary purpose. Twenty-three of the 55 projects are intended primari ly to address structural defi ci enei es requi ri ng construction orreconstruction as a result of damage or deterioration in the existingpavement or base. Examples of structural deficiencies include chippingof the pavement surface, severe cracking, shoulder separation from thepavement, or undercutting of the pavement caused by poor drainage andSUbsequent erosion.
Table 8
CLASSIFICATION OF RURAL PRIMARY PROJECTS(FEASIBLE FOR CONSTRUCTION FY 1983-1988)
Principal Purpose Number of Projects
Correct Structural andFunctional Deficiency 23
Relieve existing congestion 21
Correct FunctionalDefi ei enei es 11
55
Estimated Cost(mi 11 ions)
$ 99
100
31
$230
43
these 23 are i edthe some nd of functional problem.
ci enci es y to narrow 1ane or poorali gnment or grade for the re 1at i ve traffi c vo 1ume. Func-tional deficiencies can lead to structural failure. Forexamp 1e, if a 1ane is too narrow, the outs i de tire of a tandem whee 1edtruck wi 11 extend onto the shoul der. The wei ght of the truck wi 11damage the shoulder, leaving the exposed. The result canbe pavement deterioration and erosion of the roadway base.
The second classi on in le 8 includes projects whichare structurally sound but current carry more traffic than theirdesign capacity. Capacity is measured by a ratio of actual traffic tothe number of vehicles which could use the facility at a desired speedwithout impeding one another or creating undue safety hazards. Capacity can be limited by a combination of excess traffic and physicalfeatures of the roadway whi ch impede safe travel such as narrow 1anes,sharp curves, or steep grades.
The third classification in Table 8 includes 11 projectscons i de red by DHT to have poor ali gnment or grade or narrow pavementrelative to traffic volume. However, roadway is structurally soundand not considered to be current congested.
Urban Area Projects. Urban area projects inc 1ude both theurban administrative system and pri and arterial routes withinurban transportation planning areas. two administrative systemsare combined for analysis because they share many planning considerations: the effects of complex land use patterns, zoning, high population density, and heavy travel volumes.
An additional consideration for treating urban system andurban area primary roads as a single category is the interrelationshipof the transportation needs on the two systems, as shown in the followi ng examp 1e.
Construction needs in much of suburban Chesterfield County are directly related to the traveldemands generated by commuting between the cOLUltgand Richmond City. In 1980 DHT listed $228 mi12ionin construction needs in Chesterfield County inVOlving existing commuter routes, including Routes147, 150, 10, 60, 360, and 76, and two new circumferentials. Most of this proposed construction,although involving routes on the state primarysystem, is conditioned bg travel patterns on urhanroutes which link northern Chesterfield Countg tothe metropolitan area.
areas is inor relieve
expressways.
in urbanng
h\/··n;:!c;ses or
constructioni of exidors as
Vi rtual all prOl)O~;ed
primari to expand theon by developing new
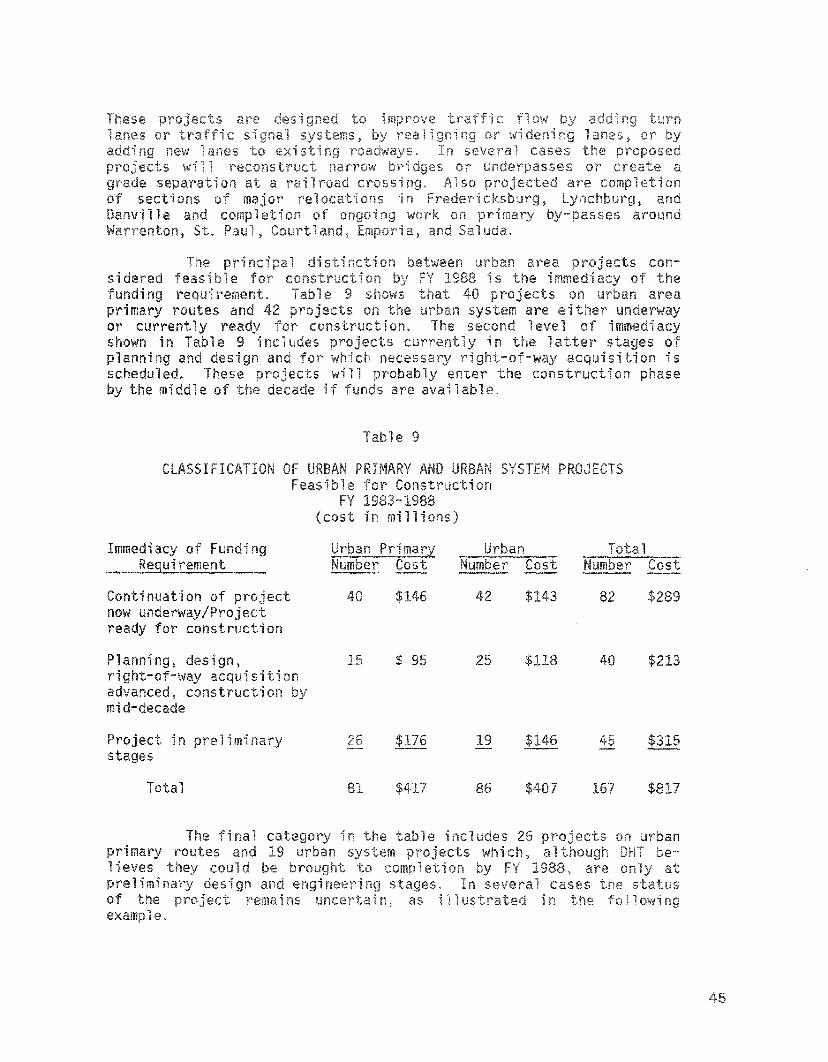
e 9
IF!
$ $213
i
$817
the inter-state ends at the south shore 1 ofthe James because the FHWA has allocated all the42,500 miles of interstate routes allowed in ta-tute. Under conditions 11 be
to a extension built tointerstate standards to link the withRoute 17 nea.r Belleville at an estimated cost of$32.3 million. if another sta.te re1uishes some portion of its allocated eage and aninterstate designation is to thethe project will be el for 90 federalfunding.
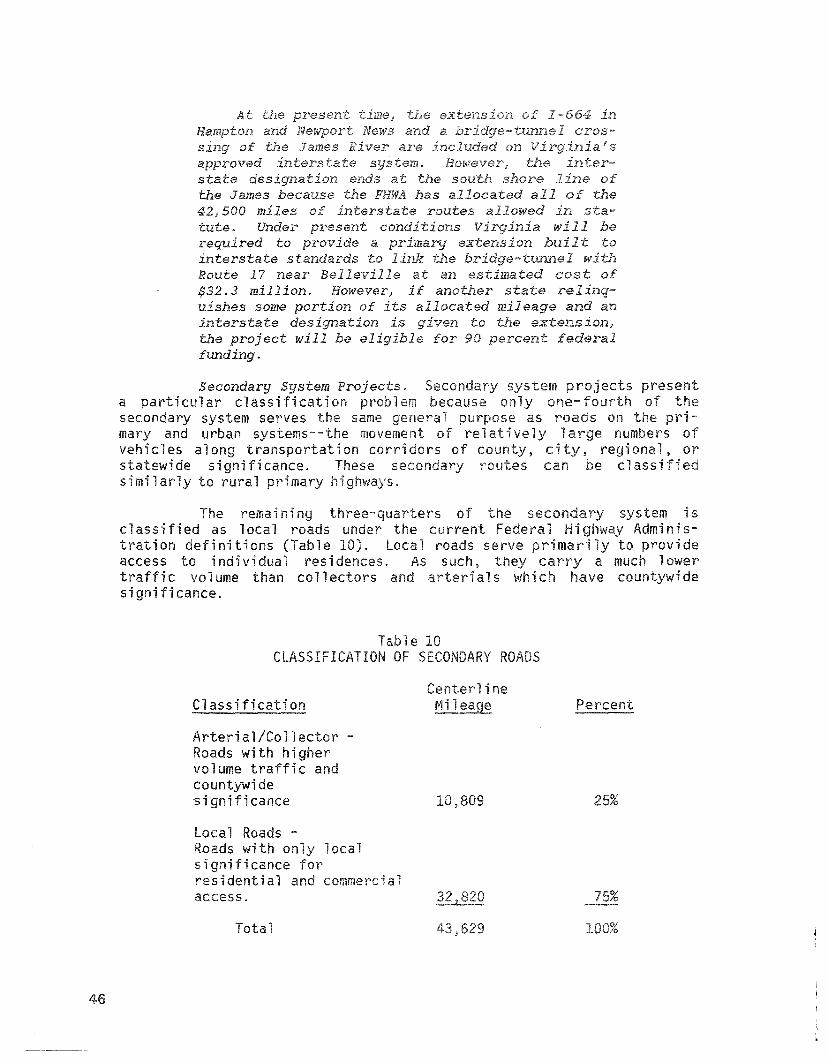
Secondarg Sgstem Projects.a particular classification lemsecondary system serves samemary and urban systems-- movement re1vehicles along transportation co dors ofstatewide signi cance.similarly to rural pri
46
The remainingclassified as local roadstration definitions (Tableaccess to individual residences.traffi c vo 1ume than co 11 ectors ands i gnifi cance.
leCLASSIFICATION
Classification
Arterial/Collector Roads with highervolume traffic andcountywidesignificance
Local Roads -Roads th only localsigni cance forresidential and commerciaaccess.
,809
system isAdminis
to providea much lower
countywi
Percent
25%
es123
$$ 34
to
class;ciencies in
stortions,cul
rt roadsoccur especi
c
1with structuralcracks, surfacedefi ci enci es areoften evo 1vedbase. Problemstruck c -ders.preserve roadotherwi se be
lesow
involvessidered inalje(~Ualte
maryneed
edther
o structure,c earances, or poor
and iacement
site i ,",c,")or'"!"
structural defects in the briona i tations such asof
for classiand interviews
bri on the de c encywas drawn from the ist
roads,
The secondfor use below
are onfor
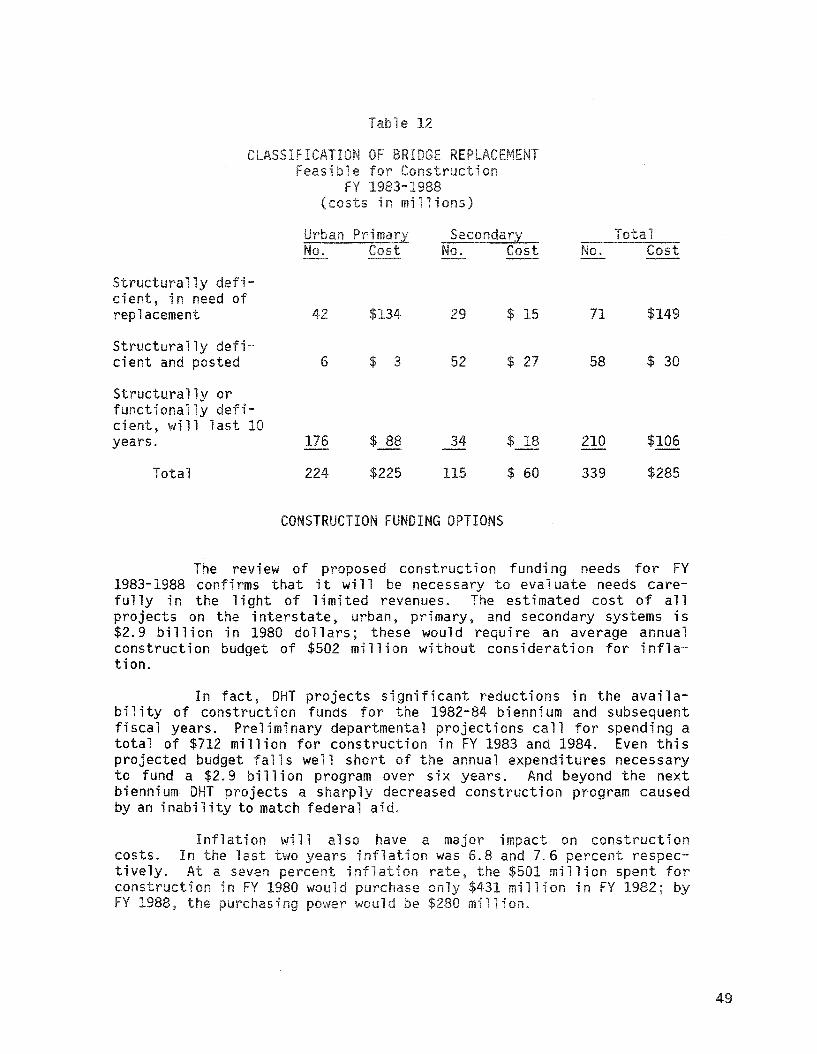
lyci ent, in need ofreplacement $134 $ 15 71 $149
Structurally defi-cient and posted 6 $ 3 52 $ 27 58 $ 30
Structurally orfunctionally defi-cient, will last 10years. 176 $ 88 34 $ 18 210 $106
Total 224 $225 115 $ 60 339 $285
CONSTRUCTION FUNDING OPTIONS
The revi ew of proposed construction fundi ng needs for FY1983-1988 confirms that it will be necessary to evaluate needs carefully in the light of limited revenues. The estimated cost of allprojects on the interstate, urban, pri mary, and secondary systems is$2.9 billion in 1980 dollars; these would require an average annualconstruct i on budget of $502 mi 11 i on without cons i derat i on for i nfl ation.
In fact, DHT projects significant reductions in the availability of construction funds for the 1982-84 biennium and subsequentfiscal years. Preliminary departmental projections call for spending atotal of $712 million for construction in FY 1983 and 1984. Even thisprojected budget falls well short of the annual expenditures necessaryto fund a $2.9 bi 11 i on program over six years. And beyond the nextbiennium DHT projects a sharply decreased construction program causedby an inability to match federal aid.
have a major impact on constructionon was 6.8 and 7.6 percent respec-
at i on rate, $501 11 i on spent foronly llion in 1982;
llion.
Inflation will alsocosts. In the last two years itively. At a seven iconstruction in 1980 would
, the i
49
Levels of Need: 1983-1988
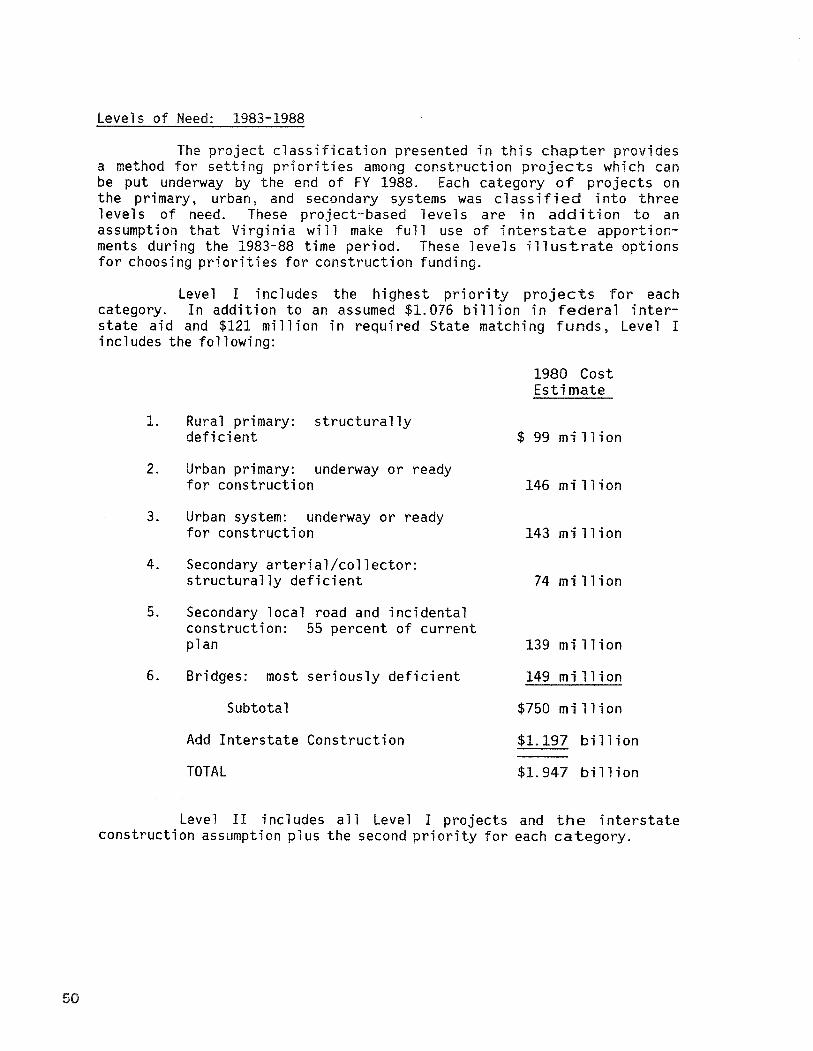
The project classification presented in this chapter providesa method for setting priorities among construction projects which canbe put underway by the end of FY 1988. Each category of projects onthe primary, urban, and secondary systems was classified into threelevels of need. These project-based levels are in addition to anassumption that Virginia will make full use of interstate apportionments during the 1983-88 time period. These levels illustrate optionsfor choosing priorities for construction funding.
Level I includes the highest priority projects for eachcategory. In addition to an assumed $1.076 billion in federal interstate aid and $121 million in required State matching funds, Level Iincludes the following:
1980 CostEstimate
1.
2.
3.
4.
5.
6.
Rural primary: structurallydeficient
Urban primary: underway or readyfor construction
Urban system: underway or readyfor construction
Secondary arterial/collector:structurally deficient
Secondary local road and incidentalconstruction: 55 percent of currentplan
Bridges: most seriously deficient
Subtotal
Add Interstate Construction
TOTAL
$ 99 million
146 million
143 million
74 mi 11 ion
139 mi 11 ion
149 mi 11 ion
$750 million
$1.197 bi 11 ion
$1. 947 bi 11 ion
50
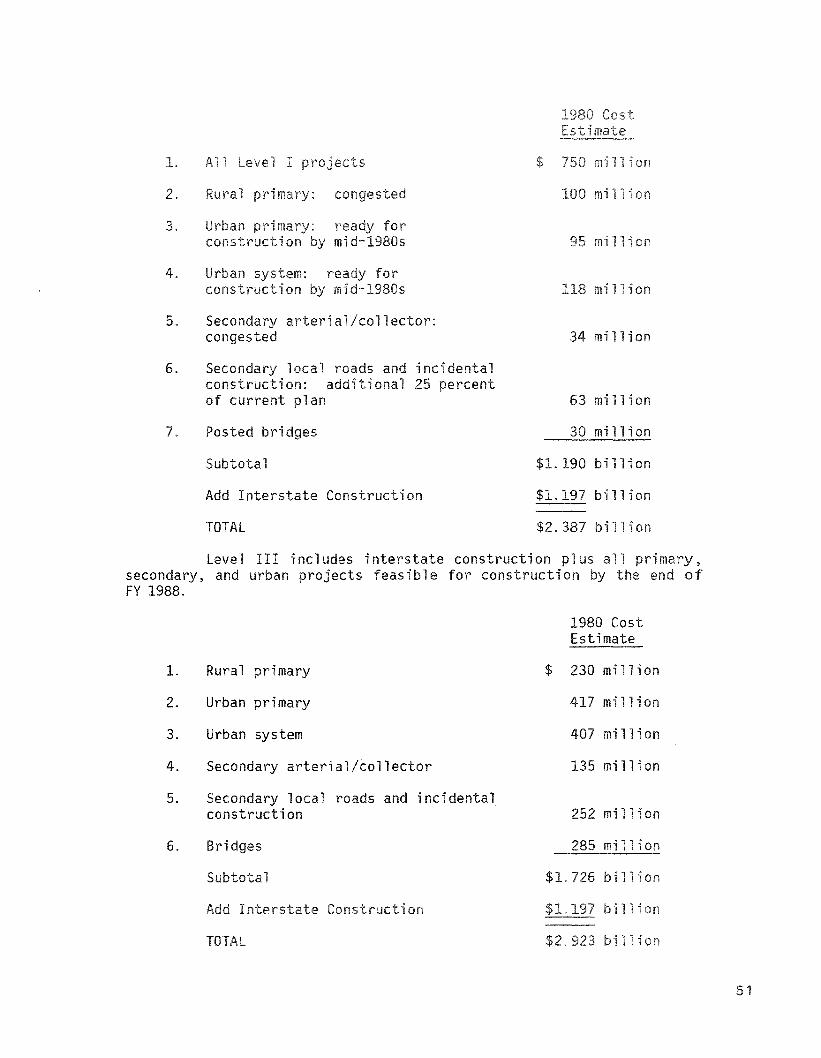
Level II includes all Level I projects and the interstateconstruction assumption plus the second priority for each category.
$
2.
3. for1980s
ion
4. for19805 on
5. Secondarycongested
al/collector:34 mi 11 ion
6. Secondary local roads and incidentalconstruction: add; anal 25 percentof current plan 63 Ilion
7. Posted bridges
Subtotal
Add Interstate Construction
TOTAL
$1. 190 bi 11 ion
$1.197 billion
$2.387 billion
Level III includes interstate construction plus 1 primary,secondary, and urban projects feasible for construction by the end ofFY 1988.
1. Rural primary
2. Urban primary
3. Urban system
4. Secondary arterial/collector
5. Secondary local roads and incidentalconstruction
6. Bridges
Subtotal
Interstate on
1980 CostEstimate
$ 230 mi 11 ion
million
407 million
135 llion
252 Ilion
$1. billion
i
51
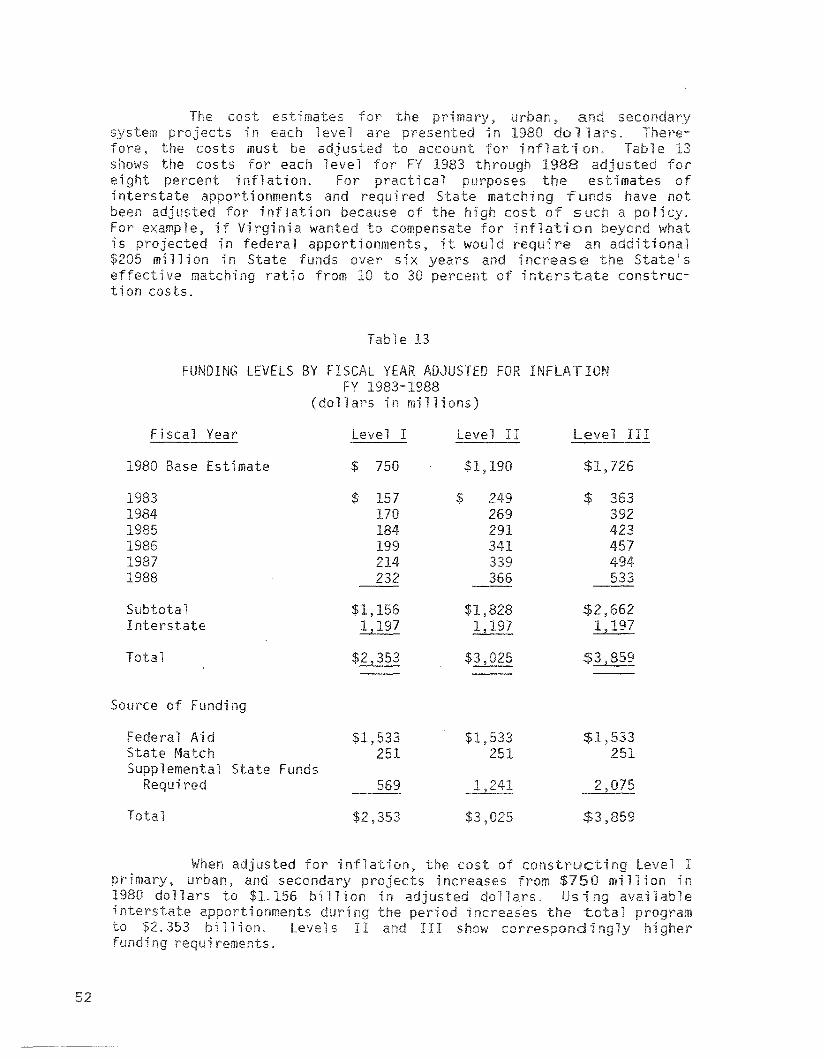
ars.Tab
usted forpurposes the mates
matchi ng funds have noti cost of s a po icy.for i ati what
wou 1 requ re anand increase
interstate
cost est matesects eve
the costs must be usted tocosts for each 1eve 1 fo
ei i on. Forinterstate appo onments and
usted for i nfl on bel:alJSeFor example, if Vi nia wanted tois pin federal i onments, it
llion in ave sixve matchi ratio from
tion costs.
II
1988 232
$269291
$392423
533
SubtotalInterstate
Total
$1,1,197
$2,353
,8281,197
,6621,
859
of ng
State Funds
$1,533251
241 2
$2, 025
When usted, urban, and
1980 do 1ars to .156nterstate onments
i ion. Leve sirements.
(Leve1 I)nium.Ilmi nifederal aidquirements, and
which
iond
as
drawn from
e
StateAid Match Total
Interstate $159 $ 0 $177mary 0
Urban & 13 2lachian Devel
Program 5 1 0 6Unpaved Roads 0 0 4 4
Totals $241 $43 $6 $290
Interstate $20 $ 0 $197mary 34 11 0 45
Urban & Secondary 36 9 19 64Appalachian Devel
p 5 1 0 60 0 5 5
Totals $252 $41 $24 $317
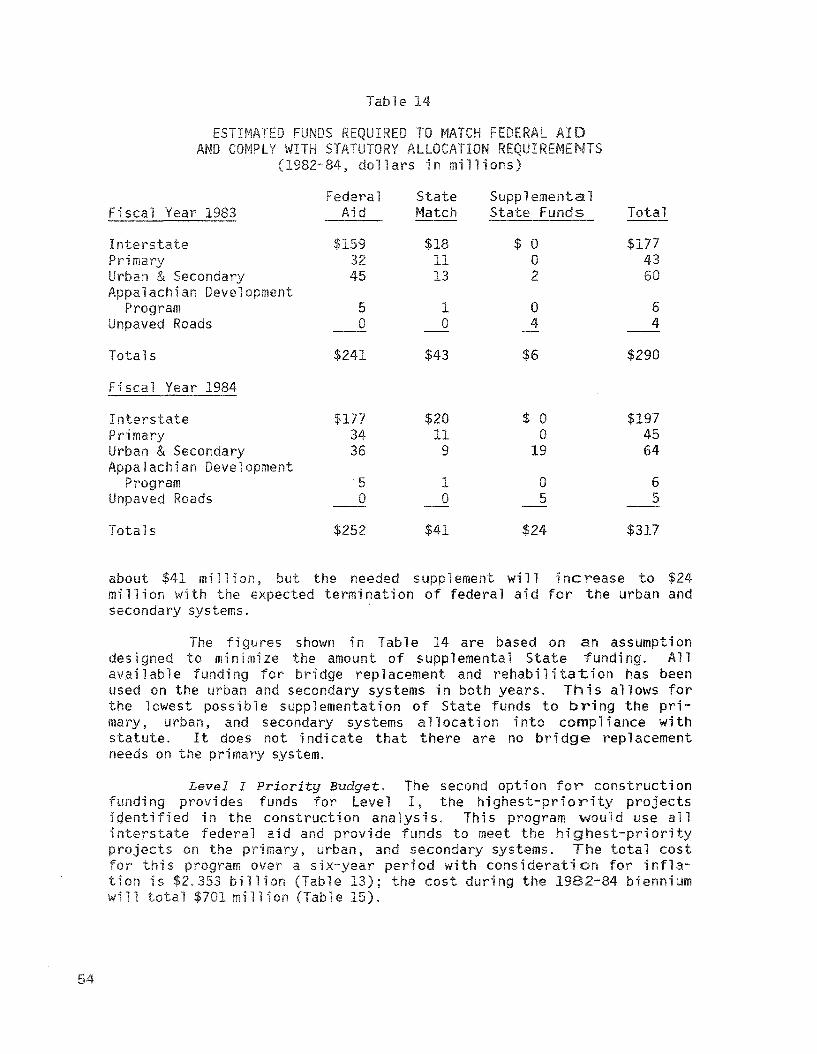
about million, but the needed supplement wi 11 increase to $24mi 11 ion th the expected termination of federal aid for the urban andsecondary systems.
The fi gures shown in Tab 1e 14 are based on an assumptiondesi to mini ze the amount of supplemental State funding. All
lable fundi for bridge replacement and rehabilitation has beenused on the urban and secondary systems in both years. This allows forthe lowest possible supplementation of State funds to bring the primary, urban, and secondary systems allocation into compliance withstatute. It does not i ndi cate that there are no bri dge repl acementneeds on the primary system.
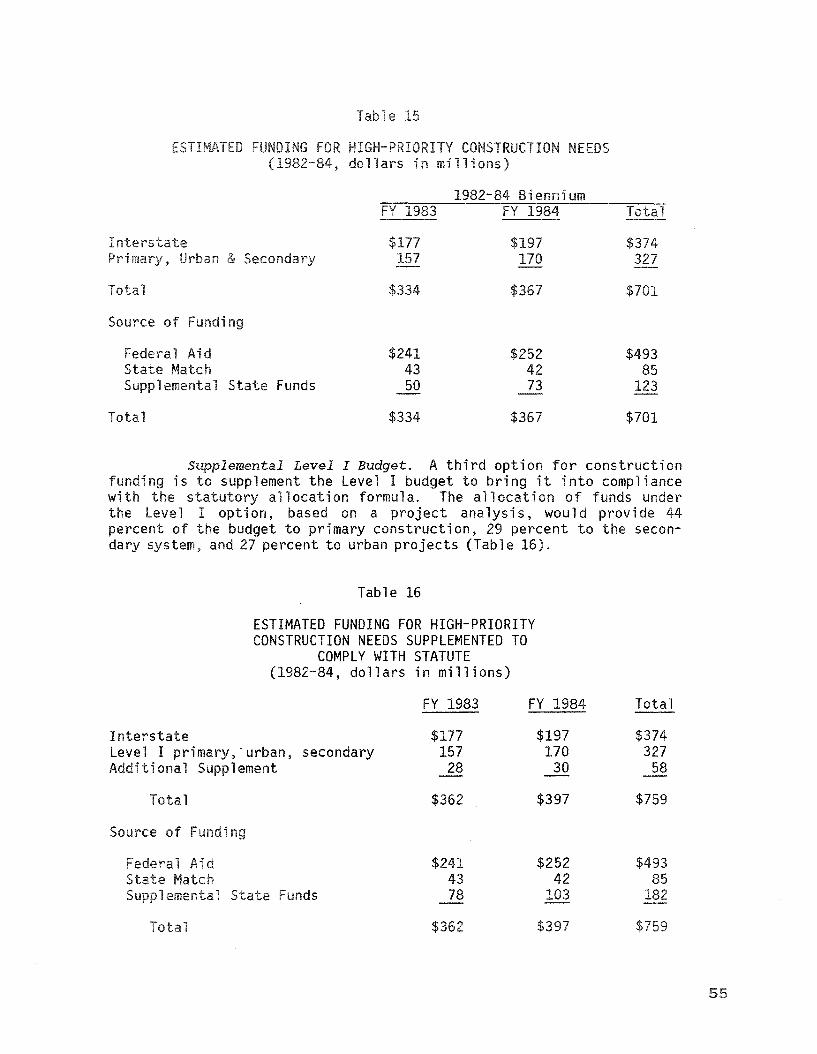
Level I Prioritg Budget. The second option for constructioning provides funds for Level I. the highest-priority projects
identi ed in the construction analysis. This program would use alli tate ai d and provi de funds to meet the hi ghest-pri orip on the mary. urban, and secondary systems. The total cost
this program over a six-year period th consi on for infla-on is $2.353 billion le 13); the cost during the biennium
wil total 1 ion le 15).
Tab e
llions)
Supplemental Level I Budget. A third option for constructionfunding is to supplement the Level I budget to bring it into compliancewith the statutory location formula. The allocation of funds underthe Level I option, based on a project analysis, would provide 44percent of the budget to primary construction, 29 percent to the secondary system, and 27 percent to urban projects (Table 16).
Table 16
ESTIMATED FUNDING FOR HIGH-PRIORITYCONSTRUCTION NEEDS SUPPLEMENTED TO
COMPLY WITH STATUTE(1982-84, dollars in millions)
InterstateLevel I primary, . urban, secondaryAdd; Supplement
FY 1983
$177157
28
$362
FY 1984
$197170
30
$397
Total
$374327
58
$759
Funds
$2414378
$362
$25242
103
$49385
182
55
Statutenot sped cally excl
and 25fore, an addi
a Levellthe analysis as a himillion in addi
thi n theallocated to the
CONCLUSIONS
The analysis of construction need suggests that a biennialspendi ng program of $701 mi 11 ionpri ority construction needs on allfederal aid availability. Aperi woul d be necessary towithin the statutory allocationava i1 ab 1e to meet somestraints.
1982-84 woul d meet the hi ghestwithin constraints of
$759 mi 11 i on for the two-yearority cons t ruct i on needs
The additional funds would beneeds wi thi n statutory con-
An optional on would capture Virginia'sfedera 1 d apport i anments 1984 but wou 1d fall short ofmeeting a number of hi pri needs, icularly on the andsecondary systems. uri that lable federal aid funds arematched appears to be the intent 1 slature, but this priorityis not stated explicitly in exi
Recommendation (6). 1 Assembly may wish to amendstatute to require that the Hi ra,\"",,, and Transportation Commissionallocate sufficient funds to match available federal aid. This actionwould have the effect of provi ng a minimum construction programthat would to be given pri ty maintenance spending.
Funding a hi on program is a legislativeprerogative through the appropri ons process. In order to
vely oversee this responsibili General Assembly needs a clear-ly presented framework for on needs, establishingpriorities, and monitoring the on program. In the past,DHT-supplied needs assessments have been ended and unrealistic.As a result, the hi planni s of the department has littlevalue to the General Assembly thout a means for translatingended needs assessments into al ve for funding consider-ation.
Recommendationneeds assessment process ng the
construction
a. futureshould reflecti
sments done theacy of the fund ng requirement
can is t i ca1 advance
56
b. An analytic framework sing espresentithe biennialinc1ude but not(1) federal d 1congestion; (3) safety; (4)functional limitations of thelocal government endorsement.
(5)
c. DHT should expedite the completion of a highway improve-ment program which identifies 0 iobjectives for construction during subsequent four-to six-year period. The program should be completed andmade available to the General As ly for review in the1982 session. The program should ide for an annualupdating and adjusting to report on progress in fulfilling program objectives and to accommodate General Assembly action or other changes in existing condi ons.
d. The Highway and Transportation Commission shouldly revi ew and approve the hi ghway improvement programand annual updates as well as keep apprised progressmade by the department in meeting program ectives.

inDu ng1ion.leavingcover
i nsystems
remainareas.
es.grants.1oca1 110VPIf'nnnPflt.
gasoline
Massmate
oversiits
onpreparing a comprehensive
on needs and programs. s ~OI;nV'T
east biennially and provided to the appropriateI;o,no~'~ Assembly.
of the Emergencg and Energy Services.Energy Division of OEES administered
grants for ride-sharing until yprograms funded through OEES were part of the State s
on Dud ng FY 1980 these grants provi ded$80, By direction of the Governor, however, responsi li
for ni ng energy grants for ride-sharing was transferred to theOHT Public Transportation Division. OEES continues to apply for
grants as part of its conservation program, but once thesefunds are received, they are distributed by the Public
tation Division.
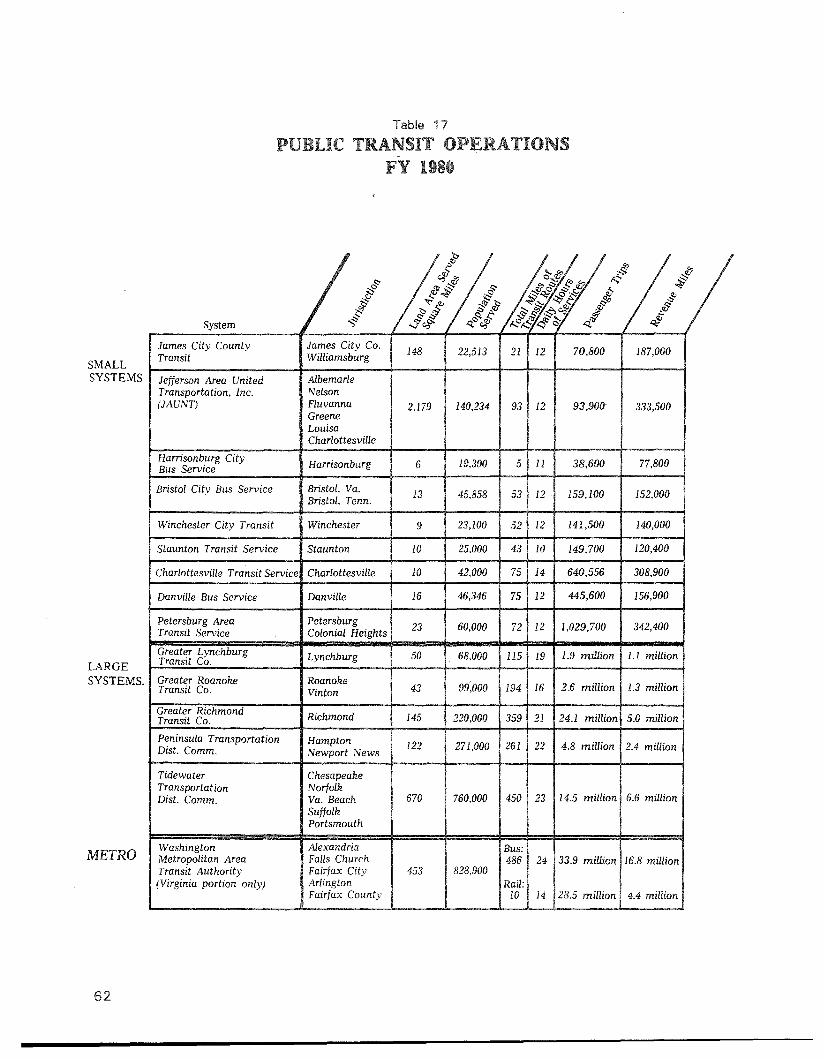
Public transit systems in Virginia provided 114 millionsenger trips while operating approximately 39 million miles
FY 1980. The levels of service provided by the different systemsvaried substantially (Table 17). The most extensive services wereprovided by the six large systems located in the State's major urbanareas. These systems accounted for approximately 97 percent of transit
dership and miles operated in that year.
For descriptive purposes, the transit systems shown in Table17 are di vi ded into three groups based on thei r size and scope ofoperations. The nine small systems typically operate 12 hours daily,range in size from five to 93 route miles, and serve relatively limitedgeographic areas. Five large systems provide extensive services overwide areas. The final category is the Washington Metropolitan AreaTrans it Authority (WMATA) whose Metrobus and Metrorail services inNorthern Virginia make it the largest in the State. Because of itssize and unique ~ombination of bus and rapid rail transit, WMATA cannotbe readily compared to other systems.
trend in trans it operations in recent years has beentoward increasing ridership and maintaining a relatively stable leve
1eage covered. Bus ri dership increased 23 percent betweenlow point) and 1980. With the exception of the on
id rail service in Northern Virginia, the number of miles oper-transit systems has not increased appreciably since This
i cates that more people are using existing transit serv cesthan trans it systems expandi ng thei r servi ces to draw more
SMALLSYSTEMS
LARGESYSTEMS.
METRO
Table 7
j%It!Jj;~ ~ ~~ ~ ~<f? ~ .~
/, #0~ "'<,,,, <';;; :f!1l'.:::;; ;:;. fJ,§i~'l.i;..
& ~~ :.§ ~~~t & .§''t'~ '1>'1::-."" I';' ;:;.
.f:} 't> ;; ;;; ~ ~ (;j ::-,~ ~ ~
System.§ -fe,~'1>' 4J.~ A,~~4;;)~~ 4J.1 4...,
James City County James City Co. 148 22.513 21 12 70,800 187,000Transit Williamsburg
Jefferson Area United AlbemarleTransportation, Inc. Nelson(JAUNT) Fluvanna 2,179 140,234 93 12 93,900 333,500
GreeneLouisaCharlottesville
Harrisonburg CityHarrisonburg 6 19,300 5 11 38,600 77,800Bus Service
Bristol City Bus Service Bristol, Va. 13 45,858 53 12 159,100 152,000Bristol, Tenn.
Winchester City Transit Winchester 9 23,100 52 12 141,500 140,000
Staunton Transit Service Staunton 10 25,000 43 10 149,700 120,400
Charlottesville Transit Service Charlottesville 10 42,000 75 14 640,556 308,900
Danville Bus Service Danville 16 46,346 75 12 445,600 156,900
Petersburg Area Petersburg 23 60,000 72 12 1,029,700 342,400Transit Service Colonial Heights
Greater Lynchburg Lynchburg 50 68,000 115 19 1.9 million 1.1 millionTransit Co.
Greater Roanoke Roanoke43 99:000 194 16 2.6 million 1.3 millionTransit Co. Vinton
Greater Richmond Richmond 145 220,000 359 21 24.1 million 5.0 millionTransit Co.
Peninsula Transportation Hampton 122 271,000 261 22 4.8 million 2.4 millionDist. Comm. Newport News
Tidewater ChesapeakeTransportat ion NorfolkDist. Comm. Va. Beach 670 760,000 450 23 14.5 million 6.6 million
SuffolkPortsmouth
Washington Alexandria Bus:Metropolitan Area Falls Church 486 24 33.9 million 16.8 millionTransit Authority Fairfax City 453 828,900(Virginia portion only) Arlington Rail:
Fairfax County 10 14 28.5 million 4.4 million
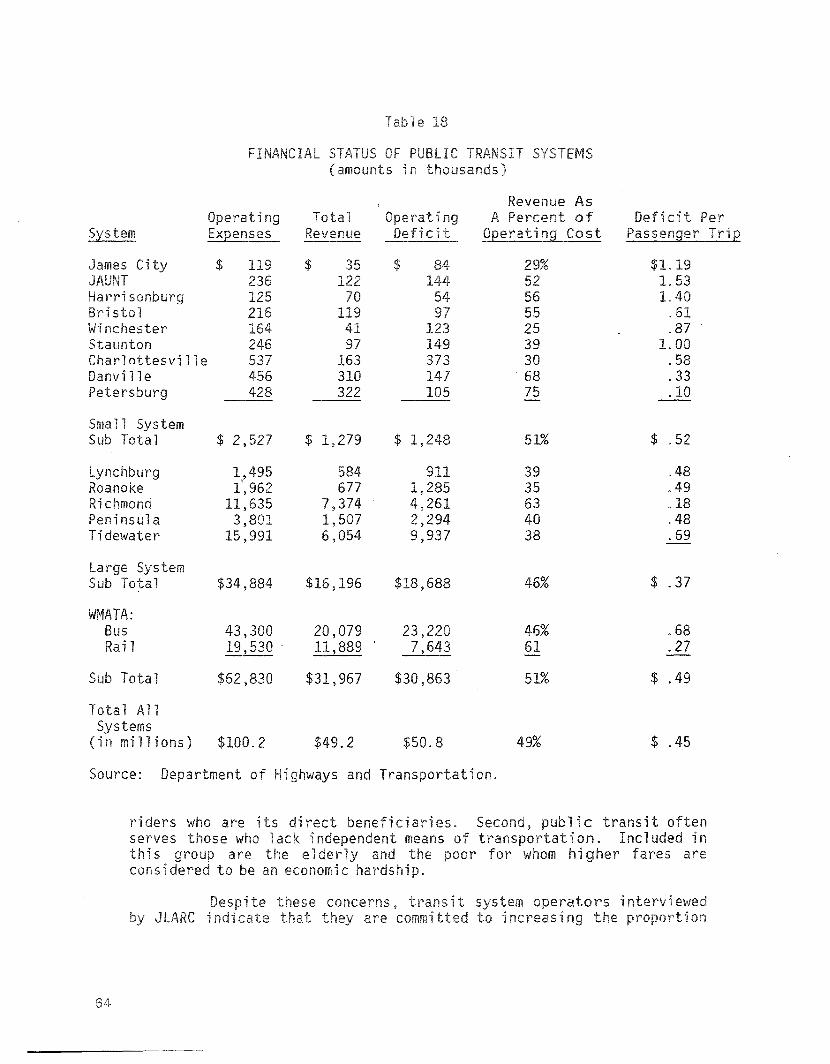
Tableci status; (the operat i 1assating costs from itsthan others. Forpercent) and theone half of costssystemsother systems
closestlost 18small er
In termsto cost'cents per trip
lost over
cover
services.that rece
are two reasonsto be a c
F
$ $ $ 29%236 52 1.125 54 56 1. 40216 119 55 .61
41 123 25 .87246 149 39 1. 00
nttesville 163 373 30 .58Danvi 11 e 310 68 .33Petersburg 322 105 75 .10
Small SystemS $ 2,527 $ 1,279 $ 1,248 51% $ .52
Lynchburg 1 495 584 911 39 .48Roanoke ,962 677 1,285 35 .49
chmond 11,635 7,374 4,261 63 .18ins a 3,801 1,507 2,294 40 .48
dewater 15,991 6,054 9,937 38 .69
SystemSub Total $34,884 $16,196 $18,688 46% $ .37
WMATA:Bus 43,300 20,079 23,220 46% .68Rail 19,530 . 11,889 7,643 61 .27
Sub Total $62,830 $31,967 $30,863 51% $ .49
AllSystems
(in millions) $100.2 $49.2 $50.8 49% $ .45
Department of Highways and Transportation.
Second, publ ic transitserves ion. Incl
is hi faresconsi
concerns,J are
Routes are evaluatedeffectiveness andpassenger instructured el';m-in""r",ri1 TRT eliminatedand consolidated others.
For areas where does not find busto be cost thepassenger vans which are leasedrate which covers all costsinsurance). TRT alsofor persons to initiate
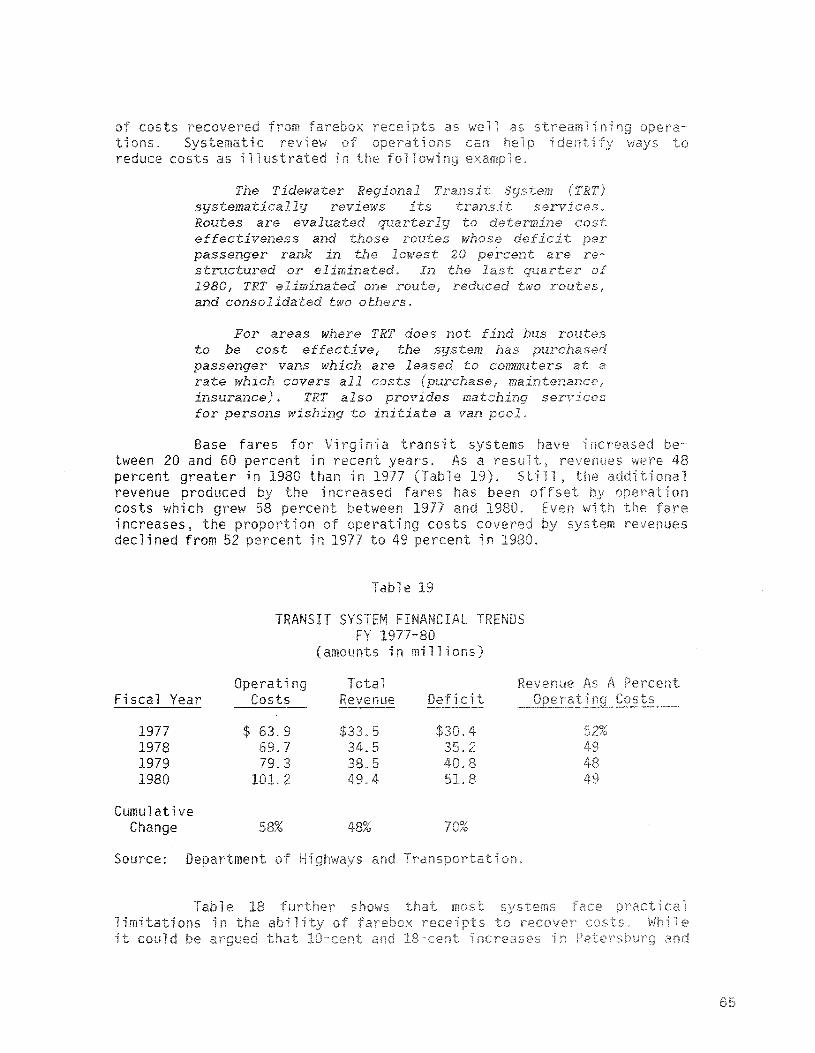
tween 20percentrevenuecosts whi ch grewincreases, the p~n,~~v'T
declined from 52
e
TRANS
Fiscal Year
197819791980
CumulativeChange
$ 63.9
79.3.2
keven int, systemsunlike y to be able to
decl i nes in ridership.ing subsi es raise
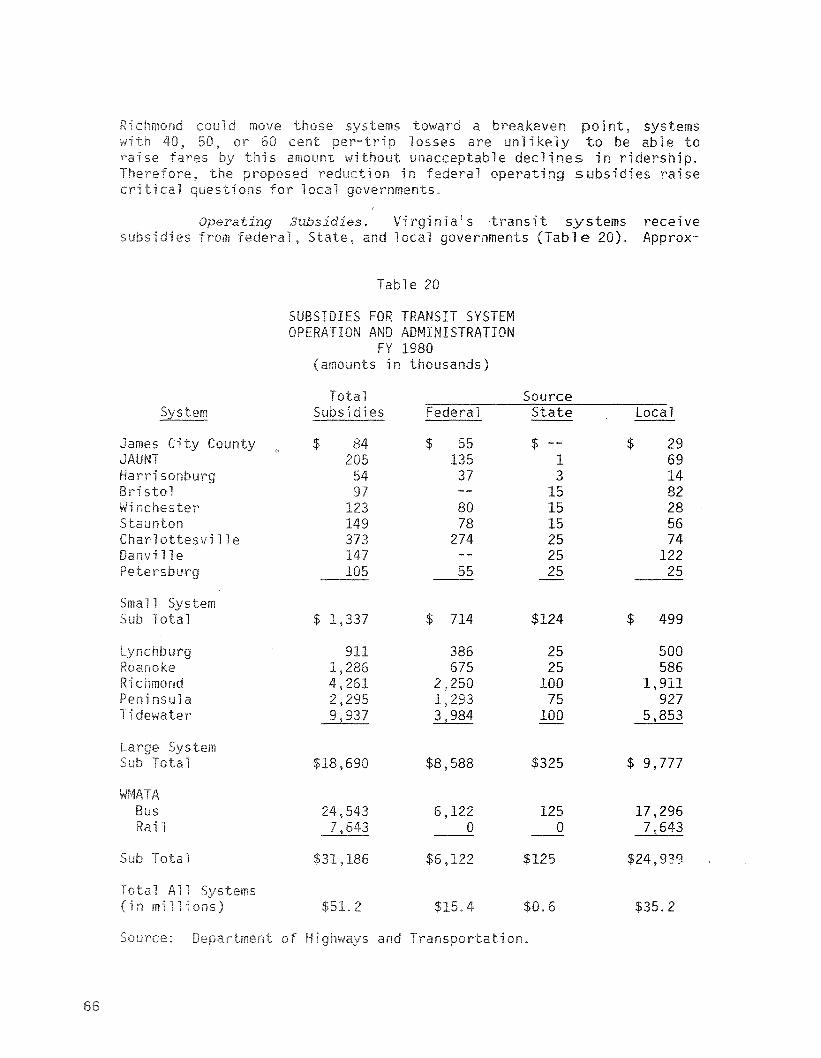
Subsidies. nia's trans it systems receivesubs es ra1, State, and loca governments (Table 20). Approx-
le
SUBSIDIES TRANS SYSTEMAND ADMINISTRATION
FY 1980(amounts in thousands)
1 SourceSubsidies Federal State Local--
Ci $ 84 $ 55 $ $ 29205 135 1 69
37 3 1497 15 82
123 80 15 28149 78 15 56373 274 25 74147 25 122
55 25 25
1 SystemS Total $ 1,337 $ 714 $124 $ 499
911 386 25 500ke 1,286 675 25 586
R chmond 4, 2,250 100 1,911Peninsula 2,295 1,293 75 927
dewater 9,937 3,984 100 5,853
$18,690 $8,588 $325 $ 9,777
24,543 6,122 125 17,2967,643 0 0 7,643
,186 $6,122 $125 $24,939
.2 .4 $0.6 $35.2
rce: on.
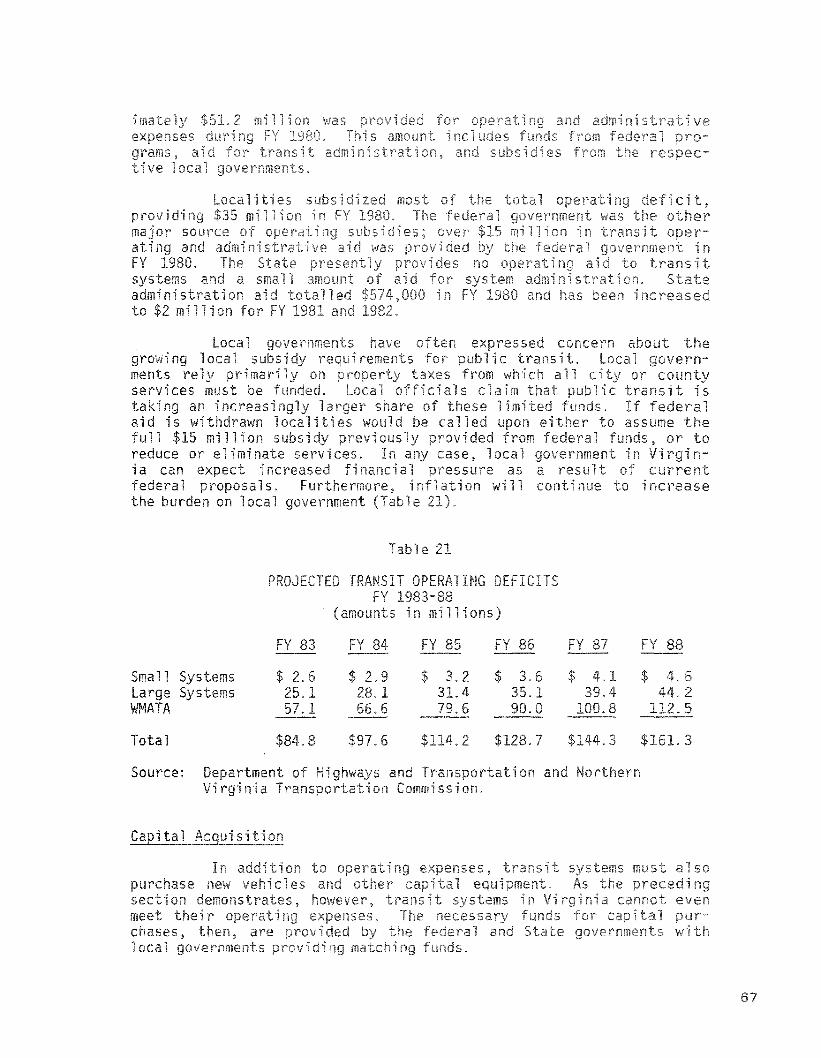
e
I
--Small 2.6 $ 2.9 $ 3.2 $ $ .6Large .1 1 .4 .2WMATA .1 .6 .6 .5
Total .6 .2 .7 .3 .3
Source:
such as
the assistancetrans it veh c es.
provi ded 1i on to thefor construction of 1 i Northern
d are also provided for sit on of otherlaryequi and transit ilj ies.
sigovern1oca1ii to
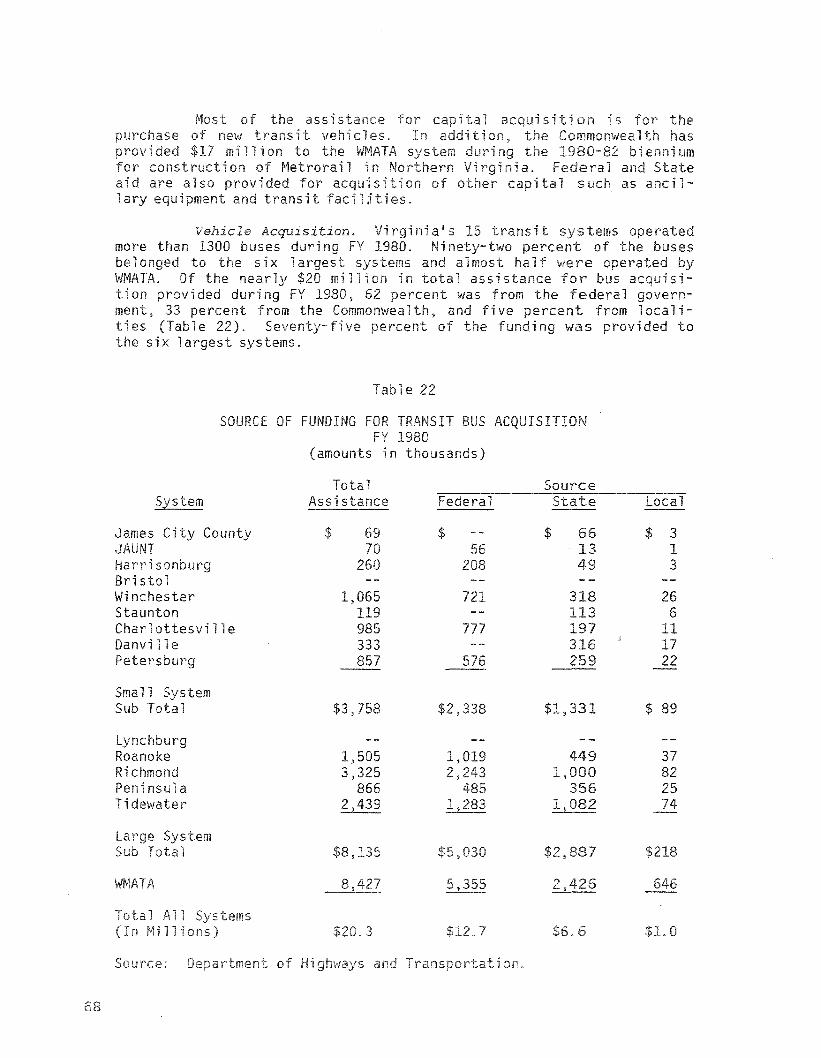
ni a IS 15 trans it temsNi two percent of the buses
and a most 1f rein tota assistance fo
percent was from the federalI:n,nm()n"'~~lth, and five
of the
Vehiclemore than 1300 busesbe 1 to the sixWMATA. Of nearlytion provided ng FYment, 33 percent from the
es (Table ).the 5 ix 1 t
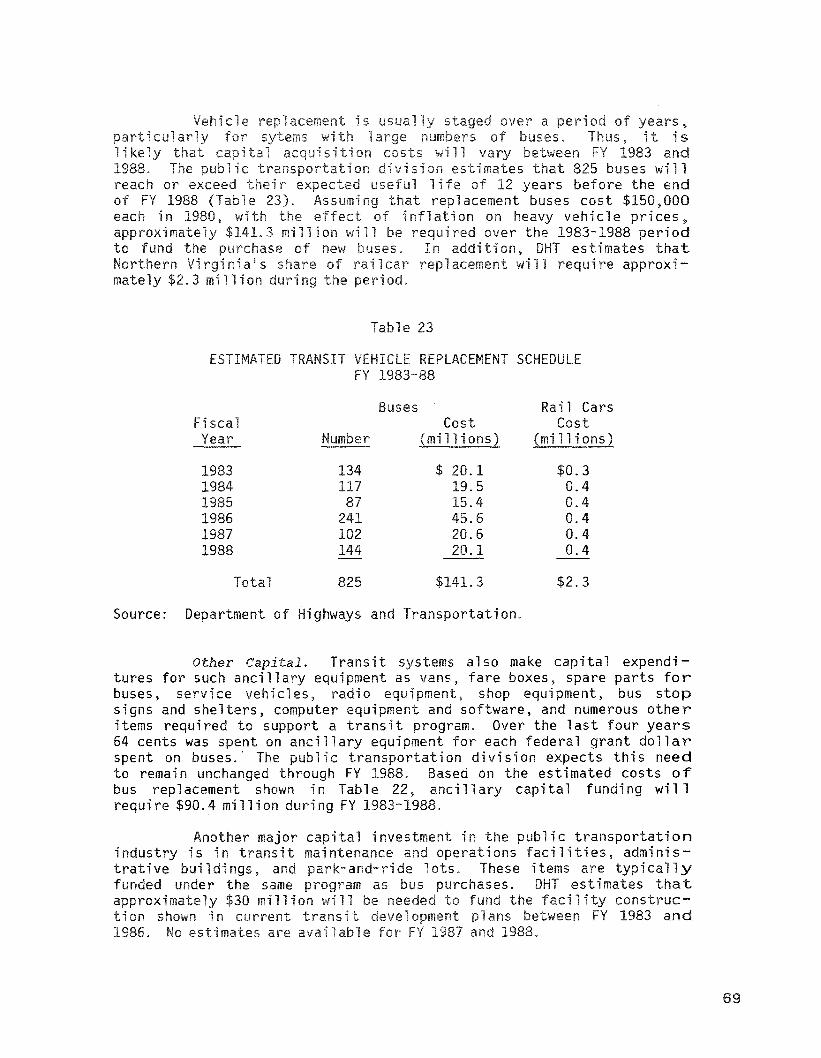
years,, it is
1983that 825 buses will
life 12 years before the endreplacement buses cost $150,000
on on vehicle prices,red over the 1983-1988 period
In on, DHT estimates thatreplacement 11 require approxi-
le 23
Ie1983-88
SCHEDULE
FiscalYear
BusesCost
emi 11 ions)
Rail CarsCost
emi 11 ions)
19831984
198619871988
134 $ 20.119.5
.4
.6102 20.6144 20.1
$0.30.40.40.40.40.4
Total 825 $141.3 $2.3
Source: Department of Highways and Transportation.
Other Capital. Transit systems also make capital expenditures for such ancillary equipment as vans, fare boxes, spare parts forbuses, service vehicles, radio equipment, shop equipment, bus stopsigns and shelters, computer equipment and software, and numerous otheritems required to support a transit program. Over the last four years64 cents was spent on ancillary equipment for each federal grant dollarspent on buses.' The public transportation division expects this needto remain unchanged through 1988. Based on the estimated costs ofbus replacement shown in Table 22, ancillary capital funding willrequire $90.4 million ng FY 1983-1988.
i investment in the public transportationntenance operations facilities, adminis-
park-and-ri lots. items are typicallyas purchases. est i mates that
to the faci 1i construc-pans between FY 1983 andand
Another majorindustry is in transittrative buil ngs,funded under the sameapproximately 1 ion 1
on shown i current trans itmates are ab e
69
summarynecessary to 1acefaci 1it i es over the nextt ion. i ng to thecapital acquisi on isprovi s icientBased on current estimates, .2 llionfor the State share capital acquisitionfunds. State provides offederal. State and local In addition, the Stateunder $1 llion bienni to 0of acquisition costs for do not involveLocal funding irements isition areonly $500,000 annually.
Metrorail Construction. Washi ngton Metrorai 1 system isunique among Virginia lic transit systems. Metrorail isWMATA and is the only id rail serving nia.cost of the 101 rai le system i wi 11 serve DistrictCol ia and its and suburbs as well as ve cities andin Northern Virginia was estimated to be $2.5 billi inmost recent estimate puts the cost at $8.2 billion.
Funding for Metrorail cons come from asources. Ini ally, ing was provided the issuanceby totaled l1ion plus lionwhi ch were to be redeemed i c oca1it i es.i a, the ve 1oca 1it i es wh tute theportation Commission ( es ofFai rfax and the es of andresponsibility for Metrorail
The five Virginia localities paid approxi ly $145for Metrorail construction FY 1980 1e the COlnm<)n\il/eaprovided $75 million ng ad. State aid inclfor parki ng faci 1i ty construction between 1973 andtional $7 million in State funding 11 provided for paties during FY 1981 and 1982 as well as a $10 llion appropri on inthe 1980-82 budget. Both of State sources are due toexpire at the end of 1982.
The costs ofthe fi nanci a1 burdens ofties. A 1979 study prepared forthat these 1oca1i es had arest of the Commonwealth andthan in the remainderMetrorai1 funding ipo,nar,+1i ke 1y to consume a PPf1/'1P"C
and that the burden wouowner.
have added tonia 10ca1i
on showedthan
more rapidlyconel uded
rations) wereoPlnp Y't'll
ly
70
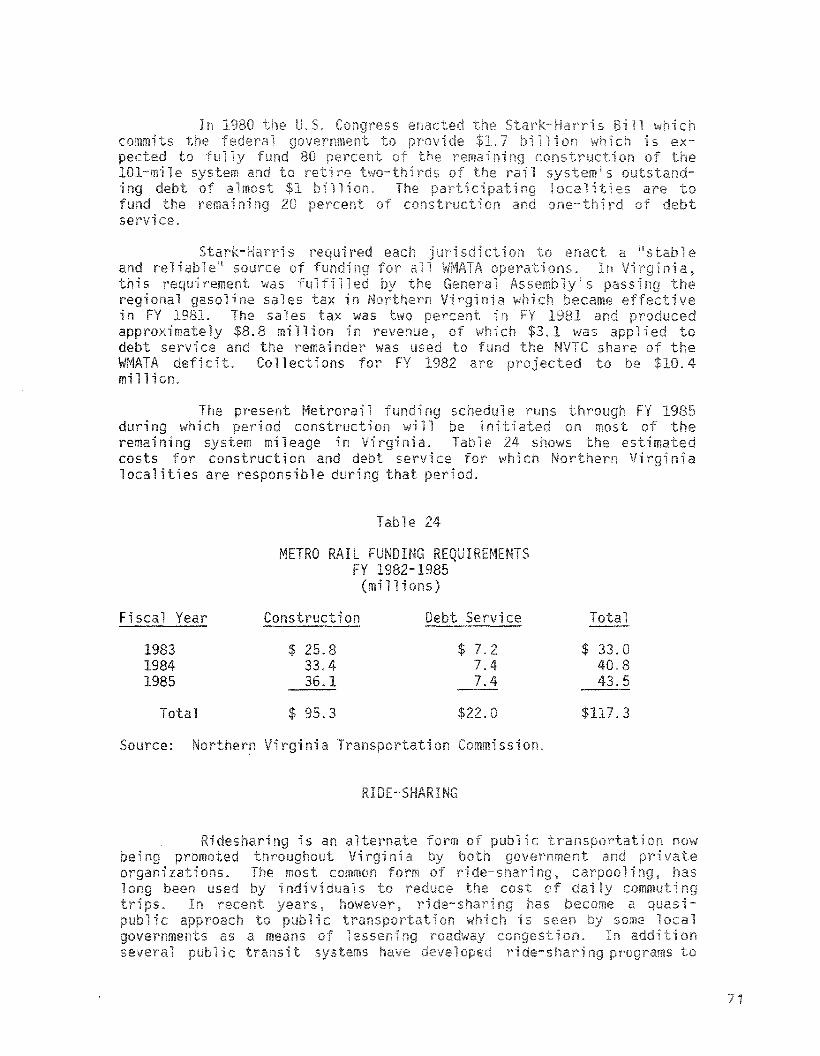
Fiscal Year Construction ice --
1983 $ .8 $ 7.2 $1984 33.4 7.4 .81985 36. 7. 43.5
$ .3 .0 .3
nia s
s 1ementareas.
i res
Although the accrue nlyindivi s invol , ic congestion,
saving energy, reduci services in marginalareas are also reasons, 1i c agenc i es have becomei nva 1ved ins 1i c i nvo 1vement usually takesone of two approaches: some p only assist individuals in locat-ing persons with whom to share ile others also purchase vehic-1es and 1ease them to i ndi vi dua 1s for the purpose of i nit i at i ng avanpool. These publicly sponsored activities are identical to ride-sharing programs sponsored by vate employers and organi zations.
Ride-sharing Issues
There are two in promotion of ride-sharing asan al form of pub on. rst issue, legal andregulatory barriers, been largely resolved wi thepassage of House Bi 11 Genera1 Assemb 1y. The ri de-sharing bill excluded carpools 1s from the legal requirementsimposed on commercial operators. Discussions wi publ ic transportation division and energy office officials indicate that no major legalor regul atory barri ers are 1i ke to hi nder future ri de-shari ng efforts.
The second issue is funding. The Commonwealth presently hasno funding specifically targeted for ride-sharing. The financialsupport provided to date has come through the State I s experimentaldemonstrat i on grants program and federal energy grants. The experi-mental grant program provides only for the first year, afterwhich the sponsoring locality must program.
72
The OHT program proposalfic funding for ride-sharithe first year and $150,000 n theto 75 percent of program costs.funded at $770,000 for bienniumto fund fi s
1983 and 1984 i nc 1udes speciproposed aid would be $200,000 in
This aid would finance upAV'''''''''menta1 grant program wi 11 be
11 continue to be available
for ri de-shari ng profedera 1 pri rna ry, secondary,
is some question as tonia law. Sections
cons onnhlAirl\/-re1 mass trans it
but in no caseas
Paragraph 0fund rideyear.
ich is used to1i mited to one
Nodressed thi s issue.funds for ri de-sbeyond the amountsDHT shaul d cons iclarify the status
nera1 have ad~O(iQV'~l construction
ride-sharingAppropriations Act.Attorney General to
ion 33.1-46.1.
FUNDI C TRANSIT
1i th regard to 1i c transpor-language of the Appropriations Act
funds for operating subsidies except1 grants. In contrast, the Statecapital acquisi on. Local gov
on ly one percent of federa 1-ve percent non-federal grants.
i 1 isition, aside from metro-to be only $500,000 annually over the
The y station is clearly spelled out inwhi ch prohi bits the use Statefor small limited-duration experihas provi ded substantial fundiernments and transit systems mustparticipation capitalLoca1 fundi ng requi "'o'noYdo
rail construction, is ,",v,,,,",,-+,..,rl
next several biennia.
Metrorail constructionNorthern Vi rgi ni a 1oca1i es.$92 million in metrorail1982, local governments inrai se even 1argermotor fuel. Ofi a Transportationassistance1ess forthe res
a special situation forthough the State wi 11 have provi ded
on assistance through the end of FYservice area n required to
local sales tax onrthern Virgin-
cut in metrorailly $8 million
on is princi ly
73
assumey
of proposed substantial reductions inmetrorail assistance led with the possible loss of fedeoperating subsidies has created a new licy environment for publictransportation. In to address the changing envi~n,nm£,nT
General As ly may sh to make a review of State policy.
Recommendation (8). The General Asembly may wish to create aspecial joint committee to review State policies regarding publictransportation. The committee should be directed to review the financial needs of public transit, ride-sharing programs, and other masstransportat i on act i vi es in 1i ght of changi ng federal ai d pol ici es.Among the alternatives that should be considered are (1) provision ofdi rect State support for operat i ng expenses of pub1i c transportation,(2) authorizing local governments to impose special taxes, or (3) otheralternatives which would provide a stable and reliable source ofing for public transportation. The committee should identify policyoptions and make recommendations to the 1983 General Assembly.
public transportation division should take the lead rolein providing the General Assembly with information, analysis, andoptions for consi on in icy development as provided for in law.
Recommendation (9). The public transportation engineershould take lead in developing form nancial and operatireport formats whi ch provi de comparable i nformat i on on all trans itsystems. As a part of a technical assistance program to local transitsystems, the public transportation engineer should aggressively pursueidentifying ways of reducing operating costs and evaluating transitservices.
Finally, the public transportation engineer should prepare abiennial report on public transportation in Virginia which includes theresults of effi ci ency revi ews carri ed out under statute as well as adetailed assessment of public transportation needs of the Commonwealth.This report should have wide distribution and be provided to the appropriate committees of the General Assembly.
Recommendation (10). The Department of Hi ghways and Transportation should request an opinion from the Attorney General to clfy eligibili of de-sharing for funding under the Highway Aid toMass Transit sions of the Code of Virginia (Section 33.1-46.1).
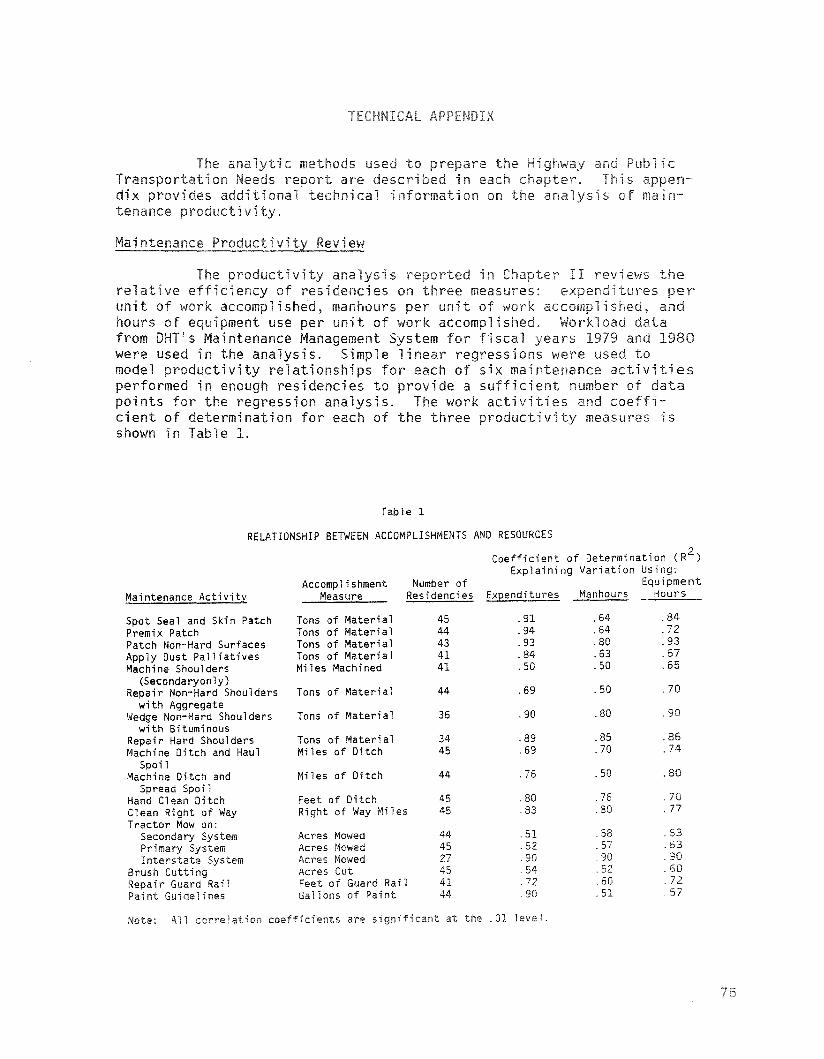
The vie I Irel ve ci resi three measures: expeunit of accomplished, r un t of work lishours of i use per unit of work accomplished. Workload datafrom IS Maintenance Management System fiscal and 1980were used in the analysis. Simple linear regressions were used tomodel productivity relationships for each of six maintenance vitiesperformed in enough residencies to provide a sufficient number of datapoints for the regression analysis. work vities and coeffi-cient of determination for each of the three productivi measures sshown in Table 1.
Table 1
RELATIONSHIP BETWEEN ACCOMPLISHMENTS AND RESOURCES
Coefficient of Determination CR2 )Explaining Variation Using:
Accomplishment Number of EquipmentMaintenance Activity Measure Res i denci es Expenditures Manhours Hours
Spot Seal and Skin Patch Tons of Material 45 .91 .64 .84Premix Patch Tons of Material 44 .94 .64 .72
Patch Non-Hard Surfaces Tons of Material 43 .93 .80 .93Apply Dust Palliatives Tons of Materi a 1 41 .84 .63 .67Machine Shoulders Mil es Machi ned 41 .50 .50 .65
(Secondaryonly).69 .50 .70Repair Non-Hard Shoulders Tons of Material 44
with Aggregate.80 .90Wedge Non-Hard Shoulders Tons of Material 36 .90
with BituminousRepair Hard Shoulders Tons of Material 34 .89 .85 .86Machine Ditch and Haul Miles of Ditch 45 .69 .70 .74
Spoil.50 .80Machine Ditch and Miles of Ditch 44 .76
Spread Spoil.76 .70Hand Clean Ditch Feet of Ditch 45 .80
Clean Right of Way Right of Way Miles 45 .83 .80 .77Tractor Mow on:
Secondary System Acres Mowed 44 .51 .58 .63Pri mary System Acres Mowed 45 .52 .57 .53Interstate System Acres Mowed 27 .90 .90 90
Brush Cutting Acres Cut 45 .54 52Repair Guard Rail Feet of Guard Rai 1 41 .72 .60 .72
Paint Guidelines Gallons of Paint 44 .90 .51 57
Note: All correlation coefficients are significant at the .01 level.
hi cients for the iti es abasis for viewing the sian line as a e mate ofachievable productivity all resi es across the state. Thoseresidencies that accomplis less icted on basis ofresources used in all three ls were vely less productive,while those that accomplished, more were ve more productive.The locations of the resi ies were to examine geographicvariation which could account for differences. Fieldi ntervi ews with mai ntenance staff confi rmed differences in pro-cedures and ope rat i ng practice were despread and more 1i ke ly toaccount for productivity variation ic expla on.
The savings that would be realized if low productivity residenci es were to improve performance to the regress i on 1 i ne were measured for each activity. Potential savings of 8 percent were found inthe 16 activities combined.

JI
JOINT LEGISLATIVE AUDIT AND REVIEW COMMISSION
Research Staff
F. Daniel Ahern, Jr.
John M. Bennett
John W. Braymer
L. Douglas Bush, Jr.
Charles E. Cummings, Jr.
Mark S. Fleming
Lynn L. Grebenstein
Gary T. Henry
Clarence L. Jackson
Kirk Jonas
R. Jay LandisWilliam E. Landsidle
Sarah J. Larson
Philip A. Leone
Joseph H. Maroon
Barbara A. Newlin
Ray D. Pethtel
Walter L. Smiley
Ronald L. Tillett
Glen S. Tittermary
Susan L. Urofsky
Karen F. Washabau
Mark D. Willis
William E Wilson
Margi J. Winters
Administrative Staff
Deborah A. Armstron,'
Sandy C. Davidson
Sharon L. Harrison
Shari D. Hindman
Joan M Irby
Betsy M. Jackson