Embed Size (px)
Citation preview
ORIGINAL ARTICLE
Histomolecular interpretation of pleomorphic adenomas of the salivary gland bymatrix-assisted laser desorption ionization imaging and spatial segmentation
G€unther Ernst, MD,1 Orlando Guntinas–Lichius, MD,2 Lena Hauberg–Lotte, PhD,3 Dennis Trede, PhD,4 Michael Becker, PhD,5
Theodore Alexandrov, PhD,3,4,6 Ferdinand von Eggeling, PhD1,7*
1Core Unit Chip Application, Institute of Physical Chemistry and Institute of Human Genetics, Friedrich Schiller University and Jena University Hospital, Germany, 2Department ofOtorhinolaryngology, Jena University Hospital, Germany, 3MALDI Imaging Lab, Department of Biology and Chemistry, University of Bremen, Germany, 4SCiLS GmbH, Bremen, Ger-many, 5Bruker Daltonik GmbH, Bremen, Germany, 6Center for Industrial Mathematics, University of Bremen, Germany, 7Jena Center for Soft Matter, Friedrich Schiller UniversityJena, Jena, Germany.
Accepted 4 April 2014
Published online 11 July 2014 in Wiley Online Library (wileyonlinelibrary.com). DOI 10.1002/hed.23713
ABSTRACT: Background. Despite efforts in localization of key proteinsusing immunohistochemistry, the complex proteomic composition ofpleomorphic adenomas has not yet been characterized. Matrix-assistedlaser desorption/ionization imaging mass spectrometry (MALDI imaging)allows label-free and spatially resolved detection of hundreds of proteinsdirectly from tissue sections and of histomorphological regions by findingcolocalized molecular signals. Spatial segmentation of MALDI imagingdata is an algorithmic method for finding regions of similar proteomiccomposition as functionally similar regions.Methods. We investigated 2 pleomorphic adenomas by applying spatialsegmentation to the MALDI imaging data of tissue sections.
Results. The spatial segmentation subdivided the tissue in a goodaccordance with the tissue histology. Numerous molecular signals colo-calized with histologically defined tissue regions were found.Conclusion. Our study highlights the cellular transdifferentiation withinthe pleomorphic adenoma. It could be shown that spatial segmentationof MALDI imaging data is a promising approach in the emerging field ofdigital histological analysis and characterization of tumors. VC 2014 WileyPeriodicals, Inc. Head Neck 37: 1014–1021, 2015
KEY WORDS: pleomorphic adenoma, salivary gland, matrix-assistedlaser desorption ionization (MALDI) imaging mass spectrometry, digi-tal histology
INTRODUCTIONPleomorphic adenoma is a sheep in wolf’s clothing. It isa special entity of benign parotid gland tumor with highrecurrence rate in case of incomplete resection or seedingof cells by involuntary violation of the tumor’s pseudo-capsule.1,2 Even small amounts of remaining tumor cellshave a probability to survive. Such small amounts of cellscan only be observed on a histopathologic level butremain invisible for the head and neck surgeon evenusing an operation microscope. Remaining pleomorphicadenoma tumor cells seem to spread very fast intohealthy, nonoperated, neighbored tissue, and form multi-ple new nodules. Such nodules in healthy tissue beyondthe scar line from previous surgery have been found asfast as 8 weeks after primary surgery.3
Not only the initial surgical technique (enucleationyields the highest recurrence rates), but also young ageand female sex are independent negative prognostic fac-tors. Enucleation but not the other clinical risk factors canbe explained with the characteristic histopathology ofpleomorphic adenoma. Nearly all tumors show areas withvery thin pseudocapsule and especially tumors of the
myxoid (stroma-rich) subtype have areas without distinctpseudocapsule.1 The myxoid subtype is also the predomi-nant subtype in recurrent tumors.3 A molecular biologicexplanation why myxoid tumors are predestined for thesecapsular features and risk of recurrence is still lacking.Analysis of the expression of the proliferation markers(Ki67/MIB-1) in primary pleomorphic adenoma hasshown that many smaller nodules have a higher prolifera-tion activity than larger nodules.3 But the meaning of ahigher proliferation rate for risk of recurrence remainsunclear as no difference in terms of proliferative activitywas seen between primary and recurrent pleomorphicadenomas.4 Expression of some mucin glycoproteinsmight also predict recurrence.5
Beyond these unspecific markers, more detailed andprobably more salivary gland-specific immunohistochem-istry and polymerase chain reaction expression analysishas been performed for the steroid hormone family.4,6
Sex steroid hormones play a significant role in the physi-ology of saliva secretion and composition.7 Moreover,progesterone receptor expression but not estrogen receptorexpression or insulin-like growth factor-1 is much higherin recurrent tumors than in primary tumors not developinga recurrence.4 Progesterone plays an important role in thegrowth of several malignant tumors, including breast,endometrium, and prostate carcinoma, but a role inbenign tumors was not observed otherwise. As pleomor-phic adenomas occur predominantly in women at a
*Corresponding author: F. von Eggeling, Core Unit Chip Application (CUCA),Institut f€ur Humangenetik, Universit€atsklinikum Jena, 07740 Jena, Germany.E-mail: [email protected]
1014 HEAD & NECK—DOI 10.1002/HED JULY 2015
premenopausal age, it is suggested that steroid receptorsin general are related to the specific growth pattern ofpleomorphic adenoma and that especially progesteronemight influence the development of recurrent pleomorphicadenoma. There might be some similarities to anotherbenign tumor: uterine leiomyoma are also most commonin premenopausal women in the productive years andthey are steroid hormone dependent. Here, estrogens (notprogesterone) and estrogen receptors (and not progester-one receptors) are associated with the growth pattern ofthe tumor.8 As in uterine myoma, but under reversed sexhormone circumstance, pleomorphic adenoma hormonetreatment may target progesterone receptors to prevent ortreat recurrent pleomorphic adenoma.4
A link between the protein expression profiles in pleo-morphic adenoma and the reason for increased risk forrecurrence and the high probability of the tumor cells toestablish a new tumor if just a few cells are left in theresection area is still missing. Considering the slow-goingexploitation of new specific and spatial characteristics ofpleomorphic adenoma by methods used in the cited stud-ies so far, and considering the methodological limitationof classical immunohistochemistry and polymerase chainreaction techniques, new investigation methods areneeded to gain more insights into pleomorphic adenomaand its special characteristics concerning tumor recur-rence. Nevertheless, as matrix-assisted laser desorptionionization (MALDI) imaging is, at the moment, restrictedto 50 lm spatial resolution, we propose that this methodwill advance the knowledge on pleomorphic adenoma,because it allows for the investigation of the molecularcontent of tissues within its morphological context.9
MALDI imaging that is predominately used in cancerresearch10 can measure the distribution of hundreds ofanalytes in 1 tissue section, is label free, and has greatpotential to clarify why pleomorphic adenoma often recurafter treatment. We present computationally supportedMALDI imaging analysis of pleomorphic adenoma anddiscuss the histological findings of this analysis.
MATERIALS AND METHODS
Tissue collection and preparation
Tissue samples from a primary tumor from 2 patientswith pleomorphic adenoma (PA439: woman, 55 yearsold; 5- 3 4- 3 3-cm tumor; lateral parotidectomy; andPA488: man, 50 years old; 6- 3 6- 3 6-cm tumor; totalparotidectomy; myxoid subtype) were obtained from theDepartment of Otorhinolaryngology of the UniversityHospital Jena, Germany. The necessary approval from thelocal ethics committee (2781-03/10) was obtained. Thepatients gave written informed consent to use tumor mate-rial for the presented investigations. After surgical resec-tion, the samples were snap frozen in liquid nitrogen, andstored at -80�C until analysis. Specimens were catego-rized according to the World Health Organization classifi-cation.11 A detailed histological analysis of thehematoxylin-eosin stained cryosections used for MALDIimaging was performed by an experienced pathologist(G.E.). Functional areas were marked in digital images totransfer this information to the evaluation of the MALDIimaging data.
Matrix-assisted laser desorption ionization imaging
Cryosections of 10 lm were prepared and thaw-mounted on precooled conductive glass slide (Bruker Dal-tonik GmbH, Bremen, Germany). Sections were brieflywashed twice for 1 minute each in 70% ethanol and oncefor 1 minute in absolute ethanol, then dried in a vacuumdesiccator. The sections were scanned on a slide scanner(Nikon Super Coolscann 5000 ED, Nikon GmbH,D€usseldorf, Germany). The matrix (Sinapinic acid at 10mg/mL in 60% acetonitrile and 40% water with 0.2% tri-fluoroacetic acid) was applied using an ImagePrep(Bruker Daltonik GmbH, Bremen, Germany) following astandard protocol. Mass spectra were acquired on aMALDI-TOF instrument (autoflex speed LRF; BrukerDaltonik GmbH) equipped with a 1 kHz smartbeam IIlaser. The instrument was operated in linear mode andpositive polarity. Spectra were acquired at a mass rangefrom m/z 2000 to 20,000 at a sampling rate of 0.13 GS/s(8192 data points per spectrum). The MALDI imagingraster width for the MALDI imaging experiment was setto 50 lm. A total of 300 laser shots were summarized perposition. Acquisition and initial data visualization werecarried out using the flexImaging 3.0 software (BrukerDaltonik GmbH). After MALDI imaging analysis, thesection was hematoxylin-eosin stained, scanned using adigital MIRAX scanner (Carl Zeiss, Goettingen, Ger-many), and histologically analyzed with the MIRAX soft-ware (Carl Zeiss) by an experienced histologist. Thehigh-resolution hematoxylin-eosin image and histologicalannotation was overlaid with MALDI imaging data usingthe flexImaging software (Bruker Daltonik GmbH).
Mass spectrometry data pre-processing
Spectra were converted into mzXML format using theCompassXport software (Bruker Daltonik GmbH); thelater processing was done using custom made scripts inMatlab (The Mathworks, Natick, MA). Each spectrumwas loaded using the mzxmlread Matlab routine (Bioin-formatics Toolbox) and interpolated to 10,000 bins, whichis the standard number of bins used in our segmentationpipeline. After normalization to the total ion count, eachspectrum was baseline corrected with the msbackadj Mat-lab routine (Bioinformatics Toolbox) with regressionmethod “pchip,” smoothing method “lowess,” and win-dow size of 200 m/z. For each data set, peak picking wasperformed by selecting data set relevant peaks using theorthogonal matching pursuit method with subsequentselection of consensus peaks and their alignment to thepeaks of the data set mean spectrum, as described byAlexandrov et al.12 We considered each 10th spectrum(in chronological order) and selected its 100 most promi-nent peaks based on the peak shape and intensity (seeAlexandrov et al13 for a discussion on the peak pickingprocedure). As consensus peaks, we selected those foundin at least 1% of the considered spectra. However,because a peak width normally exceeds the m/z-bin size,this approach can select several m/z values per peak thatcan influence the subsequent clustering increasing thecontribution of large and broad peaks. To solve the prob-lem, we performed alignment of the selected m/z valuesto the peaks of mean spectrum and selected only 1 m/z
MOLECULAR INTERPRETATION OF PLEOMORPHIC ADENOMAS OF THE SALIVARY GLAND
HEAD & NECK—DOI 10.1002/HED JULY 2015 1015
value per peak, as introduced by Alexandrov et al.12 Theparameters for the peak’s alignment are described byAlexandrov et al.12
Spatial segmentation of matrix-assisted laser desorptionionization imaging data
For each data set, we performed its spatial segmenta-tion using our original method as proposed by Alexan-drov et al.13 Spatial segmentation represents a MALDIimaging data set with 1 image, a segmentation map,where regions of distinct molecular composition are colorcoded. We performed spatial segmentation by applyingedge-preserving image denoising to the data set followedby spectra clustering. Moderate edge-preserving imagedenoising was used. The k-means algorithm was used forclustering, as in our previous study on laryngeal carci-noma14 with the following parameters: 10 replicates,“cluster” initialization, and “cityblock” distance; see Mat-lab documentation for information on these parameters.We did not use any computational method for selectionof the number of clusters automatically, but generatedsegmentation maps for 2 to 10 clusters, which were visu-ally analyzed by an experienced pathologist (G.E.). Aftersegmentation, we determined m/z values colocalized withindividual segments of the spatial map corresponding toeach cluster, by calculating the Pearson correlationbetween the cluster spatial mask (an image equal to 1 at
the pixels of the cluster and 0 otherwise) and each m/zimage. Significantly correlated (p value < .05) m/z valueswith high correlation coefficients were selected andaligned to the peaks of the mean spectrum as done afterpeak picking (see above and Alexandrov et al12). Thepeak alignment reduces the number of colocalized m/zvalues by omitting redundant m/z values and selectingonly 1 m/z value per peak, thus simplifying resultsinterpretation.
RESULTSTwo complex pleomorphic adenoma specimens contain-
ing different tissue structures were histopathologicallyanalyzed by hematoxylin-eosin staining. Pleomorphic ade-noma 439 revealed a cell-rich subtype and pleomorphicadenoma 488 a myxoid subtype. One cryosection of pleo-morphic adenoma, pleomorphic adenoma 488, and pleo-morphic adenoma 439, were analyzed by MALDIimaging. The resulting spectra were subjected to spatialsegmentation to perform a detailed insight into the com-plex structures of pleomorphic adenoma.
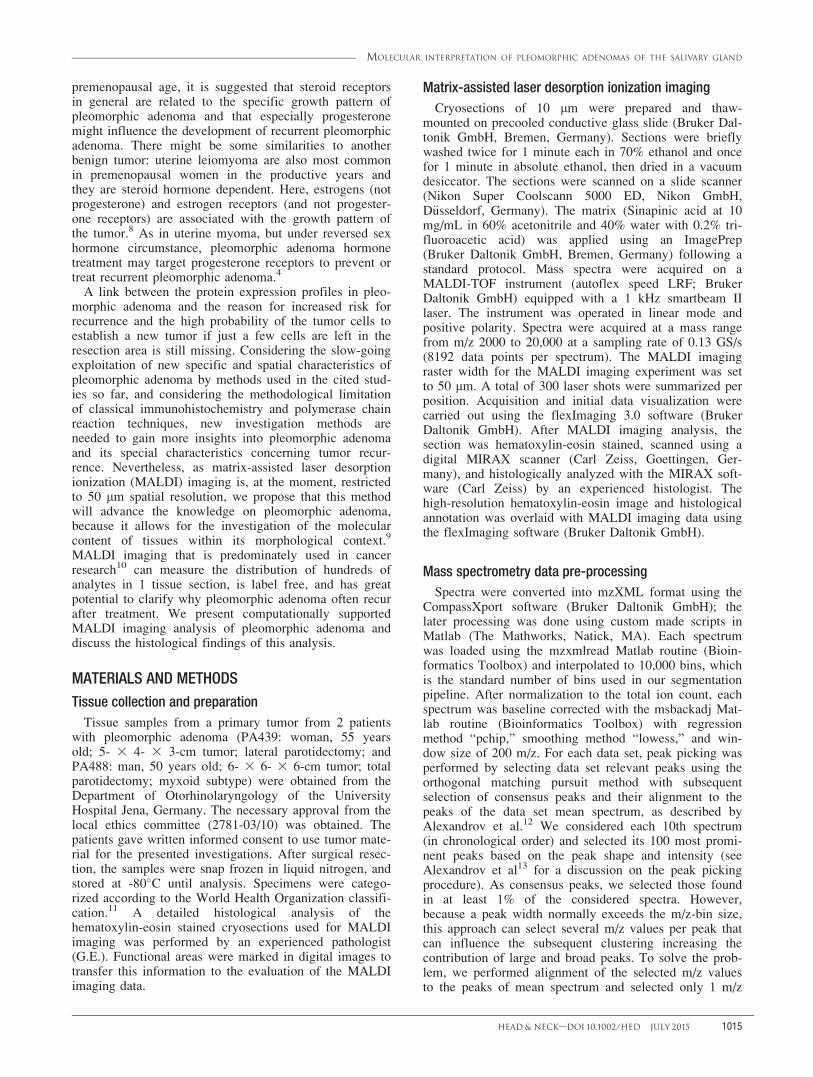
The pleomorphic adenoma 488 (Figure 1A) is com-posed of tubular epithelial cell complexes (Figure 2D and2E) and stroma with stellate cells in myxoid ground sub-stance (Figure 2F). In some areas, the stroma betweenepithelial complexes is hyalinized (Figure 2D). Myoepi-thelial cells are rarely detectable. Between stroma and
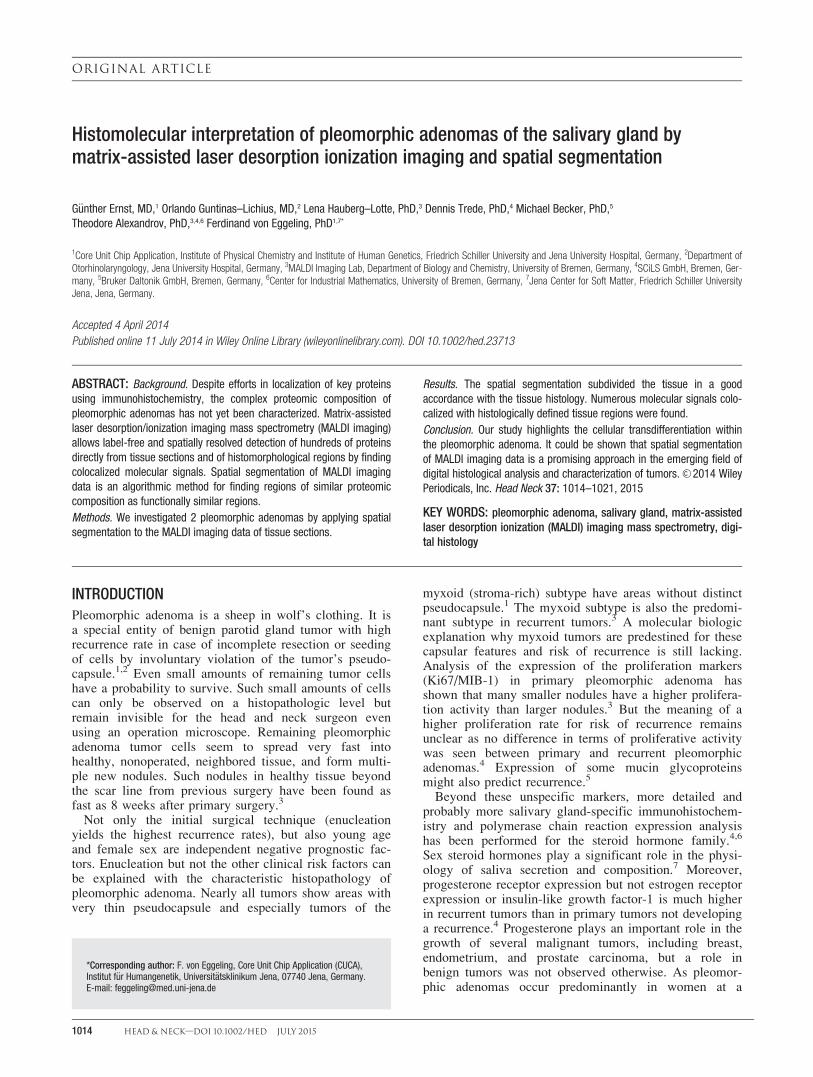
FIGURE 1. Histological images and exemplary molecular signals assigned to histomorphological structures. Pleomorphic adenoma pleomorphicadenoma 488 (original magnification 35): microscopy image after hematoxylin-eosin staining (A); matrix-assisted laser desorption ionization(MALDI) m/z images (B–D) characterize myoepithelial cell complexes (B), connective tissue (C), and myxoid areals (D) within the adenoma. Pleo-morphic adenoma pleomorphic adenoma 439 (original magnification 35): microscopy image after hematoxylin-eosin staining (E). N, normal sali-vary gland tissue; Ad, Adenoma; arrowheads, pseudocapsule of the adenoma. MALDI m/z images (F–H) characterize the adenoma (F),pseudocapsule and connective tissue (G), and normal salivary gland tissue (H). [Color figure can be viewed in the online issue, which is availableat wileyonlinelibrary.com.]
ERNST ET AL.
1016 HEAD & NECK—DOI 10.1002/HED JULY 2015
epithelial components, a “transition zone” (Figure 2C) islocated where the epithelial component is dissociated andpasses over in the mesenchymal stroma. This “transitionzone” is also reflected in the segmentation map (Figure2B, yellow), whereas the myxoid component was repre-sented in ochre colored clusters. The red and black clus-ters contain epithelial cell complexes. The further clusterscontain epithelial and mesenchymal stroma componentsin qualitative and quantitative different proportions. Thedark blue clusters (Figure 2B), for instance, contain nestsof epithelial cells in a hyalinized stroma. The proportionof epithelial cells to myxoid stroma is reflected in lightblue, brown, and orange colored clusters. The green-blue
cluster marks the connective tissue. It remains unclear ifthe cluster is a part of the pseudocapsule. Altogether, thespatial segmentation of the MALDI imaging data frompleomorphic adenoma 488 provides an unsupervised waya histopathogically relevant annotation of the tissuesection.
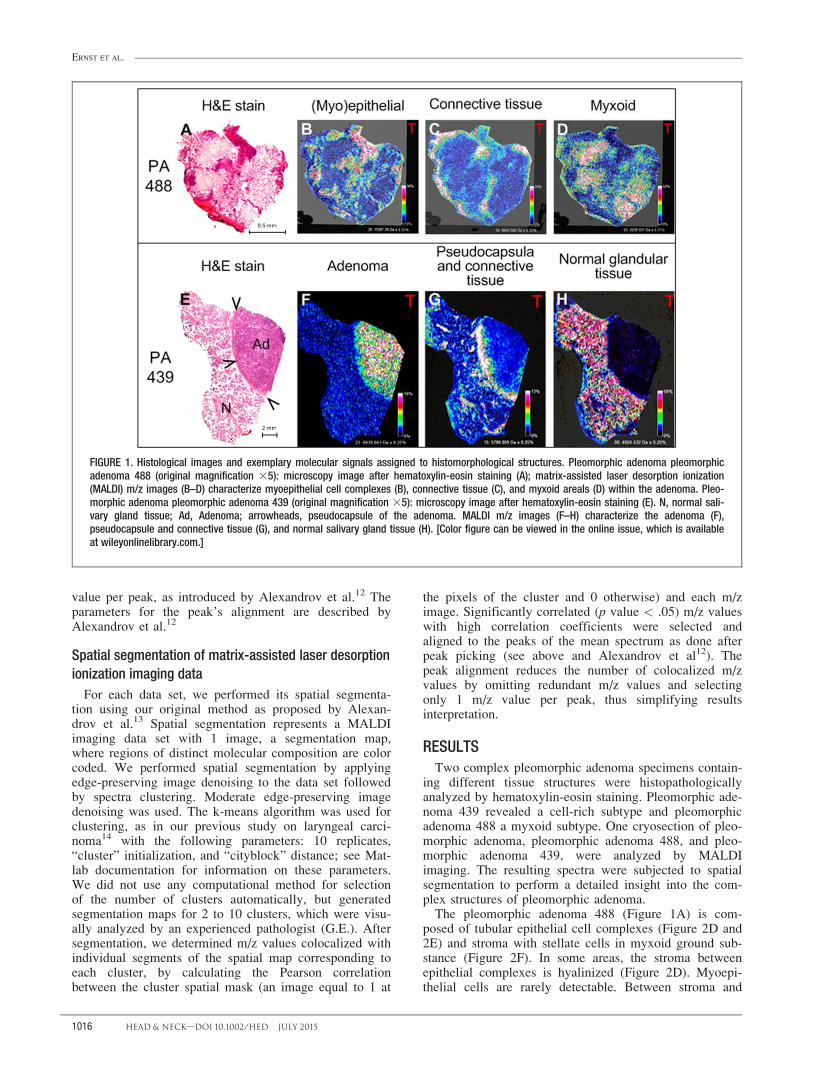
The section of pleomorphic adenoma (pleomorphic ade-noma 439; Figure 1E) is composed of parts of the normalsalivary gland and the adenoma, which consists of tubularstructures with an inner epithelial layer and an outermyoepithelial layer facing the stroma component (Figures1E and 3C). The stroma of the adenoma consists ofstrands of loose connective tissue and is partly hyalinized.
FIGURE 2. Comparison of (A) histopathology of pleomorphic adenoma pleomorphic adenoma 488 (hematoxylin-eosin staining; original magnifica-tion 35) and (B) matrix-assisted laser desorption ionization (MALDI) imaging (segmentation map). The details (C, D, E, F) demonstrate the morpho-logic composition of the adenoma in higher magnification (380): tubular (myo)epithelial cell complexes (D, E), stroma with stellate cells andmyxoid ground substance (F). The stroma is hyalinized in some areas between epithelial cell complexes (D). Transition from (myo)epithelial to myx-oid structures is shown in (C, arrows). The segmentation map shows 10 clusters: yellow 5 “transition zone”; ochre 5 myxoid component; red/black 5 epithelial cell complexes; dark blue 5 nests of epithelial cells; light blue/brown/orange 5 changing proportions of epithelial cells to myx-oid stroma; and green-blue 5 connective tissue. [Color figure can be viewed in the online issue, which is available at wileyonlinelibrary.com.]
MOLECULAR INTERPRETATION OF PLEOMORPHIC ADENOMAS OF THE SALIVARY GLAND
HEAD & NECK—DOI 10.1002/HED JULY 2015 1017

The proportion of epithelial to mesenchymal componentis changing within the adenoma. Adenoma and normalgland tissue are separated by a continuous pseudocapsule(Figure 1E, arrowheads).
Figure 1F to 1H shows exemplary MALDI images form/z values 6640, 5787, and 4925 colocalized with the tis-sue structures. In Figure 1F adenoma, Figure 1G pseudo-capsule, and Figure 1H connective tissue within thenormal gland, the normal gland tissue is defined by thepresence of mass spectrometry signals. In Figure 3, theregion A of the pleomorphic adenoma pleomorphic ade-noma 439 shows detailed epithelial and myoepithelialstructures of the adenoma, and the region C showsdetailed structures of the normal salivary gland. The spa-tial segmentation of MALDI imaging data displayed inthe segmentation map (Figure 3B) with 10 clusters showsthat 3 clusters (1–3) are present within the adenoma with-out a clear morphologic tissue correlation in thehematoxylin-eosin stained imaged tissue section and
consecutive hematoxylin-eosin stained tissue sections.The fourth cluster (light blue) represents a part of thepseudocapsule. Clusters within the normal salivarygland can be assigned to epithelial and mesenchymal(connective tissue, fat tissue) components.
In general, the spatial segmentation of the MALDIimaging data from pleomorphic adenoma 439 automati-cally provides a histopathogically relevant annotation ofthe tissue section and presents 3 regions within the areaof the pseudocapsule, which cannot be interpreted lookingat histological images.
DISCUSSIONThe development of temporally and spatially resolved
proteomic techniques to study biological processes rele-vant for human health is one of the most important fieldsof current proteomic analysis of complex tissue. WithMALDI imaging, it became possible to generate
FIGURE 3. Comparison of: (A) histopathology of pleomorphic adenoma pleomorphic adenoma 439 (hematoxylin-eosin staining; original magnifica-tion 35) and (B) matrix-assisted laser desorption ionization (MALDI) imaging segmentation map. The details (C, D) were enlarged (380) to showdetails of myoepithelial structures of the adenoma (C) and details of the normal salivary gland (D). The segmentation map with 10 clusters displays3 clusters (1–3) within the adenoma and cluster 4 as a part of the pseudocapsule. Within the normal gland, the light blue segment corresponds tothe perivascular and periductal connective tissue and to a part of the pseudocapsule, the other segments include glandular parenchyma, fat tissue,and connective tissue between the lobuli of the gland (see also discussion). [Color figure can be viewed in the online issue, which is available atwileyonlinelibrary.com.]
ERNST ET AL.
1018 HEAD & NECK—DOI 10.1002/HED JULY 2015
molecular profiles of proteins, peptides, and lipidsdirectly from the tissue surface of thin sections.15 Eachmolecular species in MALDI imaging generates an m/zimage and can provide a molecular interpretation of histo-logical structures if superimposed with histologicalimages (eg, microscopy images of hematoxylin-eosin orimmunohistochemical [IHC] stained tissue). Complex cor-relations of protein distribution can be visualized in theseexperiments and may indicate both molecular heterogene-ity of tissue samples and previously unknown colocalizedproteins, which functionally define the histological struc-tures. Compared to IHC, MALDI imaging can, withoutany label, depict hundreds of peptides and proteins.Because of the hundreds of molecular images generatedin a single MALDI imaging study and the multitude ofpossible correlations, the interpretation of such experi-mental data is complex.16 Previously,17 we comparedIHC, microdissection followed by surface-enhanced laserdesorption and ionization and MALDI imaging to
highlight advantages and disadvantages as well as syner-gistic effects. For the present study, we demonstrate howcomputationally supported analysis of MALDI imagingdata using the recently proposed segmentation pipe-line13,14 in combination with improved peak picking,12
can reveal molecular structures in a complex tissue speci-men of pleomorphic adenoma.
The MALDI imaging analyses of the 2 selected pleo-morphic adenoma specimens revealed a complex segmen-tation pattern, which allows functional interpretation ofhistological structures. On the basis of segmentation ofpleomorphic adenoma 488, histological structures couldbe identified in detail, displayed, and discussed (see Fig-ure 2). Initially, several regions were found that could beassigned to 1 segment. They can be named as a“transition zone.” In these regions, a continuous transitionoccurs from dense (myo)-epithelial structures to mesen-chymal myxoid stroma that forms a distinct segmentagain (Figures 2 and 4). Therefore, the transition and the
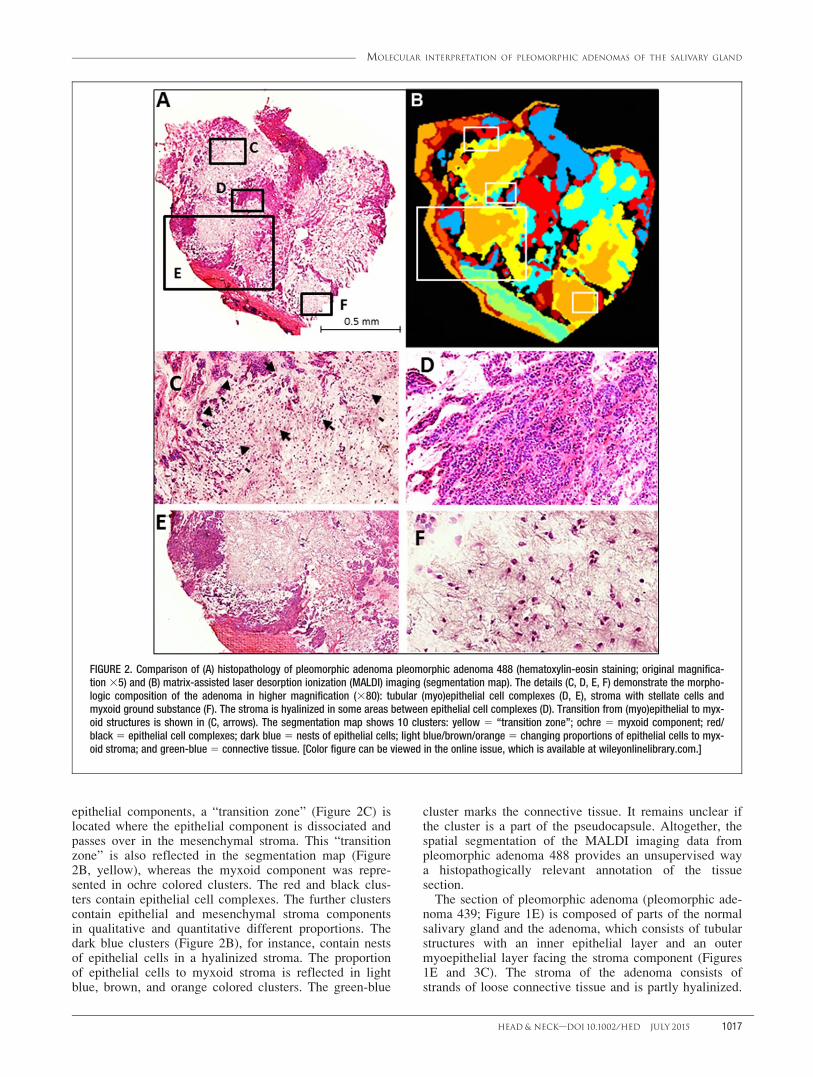
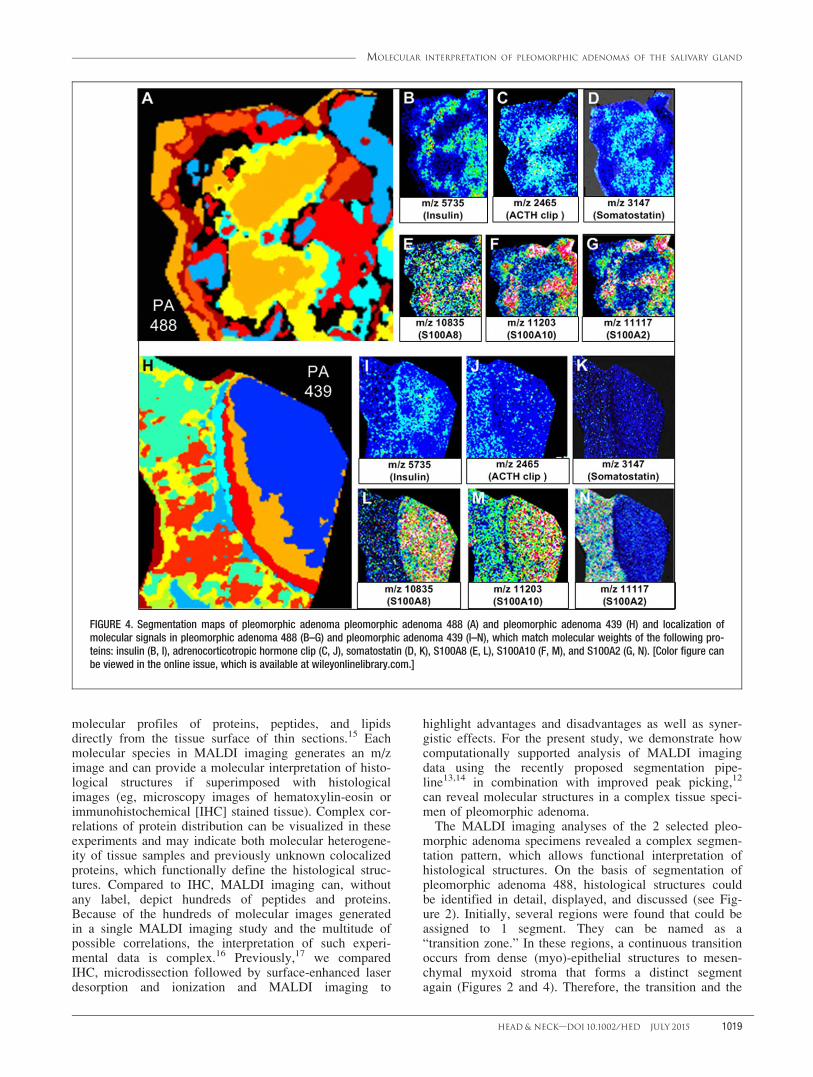
FIGURE 4. Segmentation maps of pleomorphic adenoma pleomorphic adenoma 488 (A) and pleomorphic adenoma 439 (H) and localization ofmolecular signals in pleomorphic adenoma 488 (B–G) and pleomorphic adenoma 439 (I–N), which match molecular weights of the following pro-teins: insulin (B, I), adrenocorticotropic hormone clip (C, J), somatostatin (D, K), S100A8 (E, L), S100A10 (F, M), and S100A2 (G, N). [Color figure canbe viewed in the online issue, which is available at wileyonlinelibrary.com.]
MOLECULAR INTERPRETATION OF PLEOMORPHIC ADENOMAS OF THE SALIVARY GLAND
HEAD & NECK—DOI 10.1002/HED JULY 2015 1019
myxoid zone form the most dynamic areas of the tumor,which clearly differ in their proteome from areas likehyaline stroma or (myo)epithelial cells. A matter of inter-est is that pleomorphic adenomas are deviated from ductalor myoepithelial cells of the salivary glands.18–20 Theyare monoclonal because in every cell the same geneticaberrations are present (eg, PLAG1).21 The transitionfrom epithelial to the mesenchymal phenotype, therefore,could be seen as an epithelial-mesenchymal transition-likeprocess, which makes an essential contribution to the phe-notypic polymorphism. Mesenchymal stromal cells mightgo the way back to myoepithelial cells and therefore con-tribute to a relapse if parts of the myxoid stroma are leftduring surgery. In the transition zone and the myxoidstroma, biological relevant peptides and proteins are pres-ent, which can participate in the growth and differentia-tion of the adenoma (Figure 4B–4D and 4I–4K).
Interestingly, the segmentation of pleomorphic adenoma439 results in at least 3 conchoidal segments that appa-rently do not correlate with the morphology of the ade-noma (see Figure 3). Structural differences in tumorcomposition are merely present in the relation of epithe-lial to stromal areas and in the central parts in a focalhyalinization of the stroma. It is not clear whether thesedifferences contribute to formation of segments. Thepseudocapsule of the pleomorphic adenoma is summar-ized in 1 segment with the connective tissue areas of thenormal salivary gland tissue. This indicates that the devel-opment of the pseudocapsule can be seen as a reaction ofthe local connective tissue to the tumor.
MALDI imaging can detect hundreds of proteinsdirectly from the pleomorphic adenoma tissue sectionsand provides a tool for molecular interpretation of struc-tural components of the tumor by finding molecular sig-nals colocalized with these components. The spatialsegmentation offers the possibility to automatically findareas of similar proteomic composition. In Figure 4, thepresence of such colocalized signals for pleomorphicadenomas 439 and 488 is indicated.
Therefore, it can be hypothesized that insulin is locatedin the “transition zone” (yellow) of pleomorphic adenoma488 and in parts of the pseudocapsule, and the adenomacrossing segmental borders within pleomorphic adenoma439 as a mass of 5735 Da is detected as colocalized withthe corresponding cluster (Figures 3 and 4). Within the“transition zone” of pleomorphic adenoma 488 near tothe myxoid component, a molecular signal of 3147 Da isalso present that can be assumed to be the peptide hor-mone somatostatin 28 (Uniprot P61278).22 Remarkably,this mass is absent in pleomorphic adenoma 439 (Figure4K). In the myxoid stroma component (ochre colored) ofpleomorphic adenoma 488, a signal of 2465 Da could bedetected, which might be assigned to adrenocorticotropichormone clip (18–39) protein. In pleomorphic adenoma439, these signals for the protein are pronounced in thenormal salivary gland tissue and only focally scattered inthe adenoma (Figure 4J). The epithelial components (red,black, and blue colored) of pleomorphic adenoma 488show high signals at 10835 Da, 11203 Da, and 11117 Da,whereas the molecular signal at 10835 Da is exclusivelylocalized in the adenoma with regional changing expres-sion levels in pleomorphic adenoma 439 (see Figure 4).One can hypothesize that these signals match to the
proteins A8, A10, and A2 of the S100 protein family,respectively. Interestingly, the mass corresponding toS100A10 is present in the adenoma but also occurred inthe normal salivary gland tissue. Vice versa, the masscorresponding to S100A2 is only detectable in the normalglandular tissue but not in the adenoma.
Moreover, we have found masses matching the molecu-lar weight of insulin and somatostatin in the transitionzone (pleomorphic adenoma 488). In contrast, the mass2465 Da (presumably adrenocorticotropic hormone clip[18–39]) is localized mainly in the myxoid stroma. Inpleomorphic adenoma 439, the mass of 5735 Da corre-sponding to insulin, is detectable in parts of the pseudo-capsule and in the segment exceeding parts of theadenoma. Also, the normal glandular tissue might partlycontain insulin, whereas adrenocorticotropic hormone clip(18–39) could be predominantly localized in the normalgland, but sparely expressed in the adenoma.
We hypothesize that in pleomorphic adenoma 488, mem-bers of the S100 family are present with high intensity inthe (myo)epithelial parts of the adenoma, because m/z val-ues matching their molecular weights were detected inMALDI imaging. In pleomorphic adenoma 439, the signalat 10835 Da, presumably protein S100A8 marked withchanging intensity of the adenoma, whereas S100A2 mightonly be present in the normal gland. Probably, S100A10 ispresent in both tissues. The molecular species of the above-mentioned proteins as well as their functional significancefor pleomorphic adenoma have to be verified in furtherstudies. Insulin may play a role in the tumor proliferationand adrenocorticotropic hormone clip (18–39) might influ-ence the amylase secretion.23,24 The pleotropic effect ofsomatostatin point to an involvement in signal transductionduring the introduction of apoptosis.25 That may also betrue for cytochrome C that is as well involved in the apo-ptotic pathway.26 S100 proteins, especially S100A8, canaffect tumor growth both positively and negatively.27,28
In conclusion, this study shows that the spatial segmen-tation provides a unique way to depict the complex func-tional proteomic heterogeneity of pleomorphic adenomain 1 image. For pleomorphic adenoma 488, MALDIimaging segmentation clusters were consistent with differ-ent histological structures obtained by hematoxylin-eosinstaining. For pleomorphic adenoma 439, additional seg-mentation clusters indicate proteomic differences, whichwere not reflected in the hematoxylin-eosin stained imagebut may indicate functional differences. Further studieson pleomorphic adenoma sample series will allow us toconfirm the proteomic hypotheses on the discovered massspectrometry signals and to show whether this can beconvoluted and whether segmentation maps are also help-ful in detection of biomarkers for recurrence and malig-nant transformation.
AcknowledgmentThe research leading to the results has received fundingfrom a grant from the European Union 7th FrameworkProgramme (Grant 305259 to T.A.).
REFERENCES1. Stennert E, Guntinas–Lichius O, Klussmann JP, Arnold G. Histopathology
of pleomorphic adenoma in the parotid gland: a prospective unselectedseries of 100 cases. Laryngoscope 2001;111:2195–2200.
ERNST ET AL.
1020 HEAD & NECK—DOI 10.1002/HED JULY 2015
2. Wittekindt C, Streubel K, Arnold G, Stennert E, Guntinas–Lichius O.Recurrent pleomorphic adenoma of the parotid gland: analysis of 108 con-secutive patients. Head Neck 2007;29:822–828.
3. Stennert E, Wittekindt C, Klussmann JP, Arnold G, Guntinas–Lichius O.Recurrent pleomorphic adenoma of the parotid gland: a prospective histo-pathological and immunohistochemical study. Laryngoscope 2004;114:158–163.
4. Glas AS, Hollema H, Nap RE, Plukker JT. Expression of estrogen receptor,progesterone receptor, and insulin-like growth factor receptor-1 and ofMIB-1 in patients with recurrent pleomorphic adenoma of the parotidgland. Cancer 2002;94:2211–2216.
5. Hamada T, Matsukita S, Goto M, et al. Mucin expression in pleomorphicadenoma of salivary gland: a potential role for MUC1 as a marker to pre-dict recurrence. J Clin Pathol 2004;57:813–821.
6. Zhang XW, Li Y, Liu JJ, Liu X, Wang ZL, Hu B. Glucocorticoid receptorsubunit gene expression in parotid gland and adenomas. Otolaryngol HeadNeck Surg 2006;135:849–852.
7. V€alimaa H, Savolainen S, Soukka T, et al. Estrogen receptor-beta is thepredominant estrogen receptor subtype in human oral epithelium and sali-vary glands. J Endocrinol 2004;180:55–62.
8. Valladares F, Frias I, B�aez D, et al. Characterization of estrogen receptorsalpha and beta in uterine leiomyoma cells. Fertil Steril 2006;86:1736–1743.
9. Balluff B, Sch€one C, H€ofler H, Walch A. MALDI imaging mass spectrom-etry for direct tissue analysis: technological advancements and recent appli-cations. Histochem Cell Biol 2011;136:227–244.
10. Gemoll T, Roblick UJ, Habermann JK. MALDI mass spectrometry imag-ing in oncology (Review). Mol Med Rep 2011;4:1045–1051.
11. Barnes L, Eveson JW, Reichart P, Sidransky D, editors. World HealthOrganization Classification of Tumours: Pathology and Genetics of Headand Neck Tumours, volume 9. Lyon, France: IARC; 2005.
12. Alexandrov T, Kobarg JH. Efficient spatial segmentation of large imagingmass spectrometry datasets with spatially aware clustering. Bioinformatics2011;27:i230–i238.
13. Alexandrov T, Becker M, Deininger SO, et al. Spatial segmentation ofimaging mass spectrometry data with edge-preserving image denoising andclustering. J Proteome Res 2010;9:6535–6546.
14. Alexandrov T, Becker M, Guntinas–Lichius O, Ernst G, von Eggeling F.MALDI-imaging segmentation is a powerful tool for spatial functional pro-teomic analysis of human larynx carcinoma. J Cancer Res Clin Oncol2013;139:85–95.
15. Seeley EH, Caprioli RM. Molecular imaging of proteins in tissues by massspectrometry. Proc Natl Acad Sci U S A 2008;105:18126–18131.
16. Deininger SO, Ebert MP, F€utterer A, Gerhard M, R€ocken C. MALDI imag-ing combined with hierarchical clustering as a new tool for the interpreta-tion of complex human cancers. J Proteome Res 2008;7:5230–5236.
17. Wehder L, Ernst G, Crecelius AC, et al. Depicting the spatial distributionof proteins in human tumor tissue combining SELDI and MALDI imagingand immunohistochemistry. J Histochem Cytochem 2010;58:929–937.
18. Noguchi S, Aihara T, Yoshino K, et al. Demonstration of monoclonal originof human parotid gland pleomorphic adenoma. Cancer 1996;77:431–435.
19. Lee PS, Sabbath–Solitare M, Redondo TC, Ongcapin EH. Molecular evi-dence that the stromal and epithelial cells in pleomorphic adenomas of sali-vary gland arise from the same origin: clonal analysis using humanandrogen receptor gene (HUMARA) assay. Hum Pathol 2000;31:498–503.
20. Debiec–Rychter M, Van Valckenborgh I, Van den Broeck C, et al. Histo-logic localization of PLAG1 (pleomorphic adenoma gene 1) in pleomor-phic adenoma of the salivary gland: cytogenetic evidence of commonorigin of phenotypically diverse cells. Lab Invest 2001;81:1289–1297.
21. Matsuyama A, Hisaoka M, Nagao Y, Hashimoto H. Aberrant PLAG1expression in pleomorphic adenomas of the salivary gland: a moleculargenetic and immunohistochemical study. Virchows Archiv 2011;458:583–592.
22. Bairoch A, Apweiler R, Wu CH, et al. The universal protein resource (Uni-Prot). Nucleic Acids Res 2005;33:D154–D159.
23. Marshall JB, Kapcala LP, Manning LD, McCullough AJ. Effect ofcorticotropin-like intermediate lobe peptide on pancreatic exocrine functionin isolated rat pancreatic lobules. J Clin Invest 1984;74:1886–1889.
24. Gallagher EJ, LeRoith D. Minireview: IGF, insulin, and cancer. Endocri-nology 2011;152:2546–2551.
25. Hayashi Y, Saito H, Saito S, et al. Immunoreactive somatostatin in War-thin’s tumor. Am J Pathol 1986;123:250–255.
26. Bertini I, Cavallaro G, Rosato A. Cytochrome c: occurrence and functions.Chem Rev 2006;106:90–115.
27. Melle C, Ernst G, Schimmel B, et al. A technical triade for proteomic iden-tification and characterization of cancer biomarkers. Cancer Res 2004;64:4099–4104.
28. Alexandrov T, Kastl EA, Desgranges C, Delhommelle J. Determination ofvapor-liquid equilibria using hybrid Monte Carlo Wang–Landau simulationsin the isothermal-isobaric ensemble. Abstr Pap Am Chem S 2011. Available at:https://aiche.confex.com/aiche/2011/webprogram/Paper236977.html. AccessedMarch 1, 2013.
MOLECULAR INTERPRETATION OF PLEOMORPHIC ADENOMAS OF THE SALIVARY GLAND
HEAD & NECK—DOI 10.1002/HED JULY 2015 1021


![[PAPER] Pleomorphic Adenoma Print.docx](https://img.pdfslide.net/doc/110x75/56d6bd9b1a28ab30168ea546/paper-pleomorphic-adenoma-printdocx.jpg)