Embed Size (px)
DESCRIPTION
HIV/AIDS in Kenya. Population – 43 million HIV prevalence: 6.1% 1.6 million infected 1.1 million children orphaned by AIDS 190,000 children living with HIV 58,000 AIDS related deaths HIV prevalence in Mombasa: 11.1%. Project Sunshine Kenya. - PowerPoint PPT Presentation
Citation preview

www.aids2014.org
HIV/AIDS in Kenya
• Population – 43 million• HIV prevalence: 6.1%– 1.6 million infected– 1.1 million children orphaned
by AIDS– 190,000 children living with HIV – 58,000 AIDS related deaths
• HIV prevalence in Mombasa: 11.1%

www.aids2014.org
Project Sunshine Kenya• Nonprofit providing free
educational, recreational and social service programming to children and families living with medical challenges
• Launched in Kenya in 2006 at Bomu Hospital in Mombasa
• Trained 40 Community Health Workers (CHW)
• Deliver clinic- and community-based programming
• Serve over 6,500 children living with HIV/AIDS

www.aids2014.org
Healthy Living Initiative• Launched 2011 • Objectives– Improve retention in care
for HIV+ children– Prevent diarrhea and
malaria in HIV+ children– Evaluate program impact

www.aids2014.org
Diarrhea and Malaria in PLHIV• Diarrheal diseases– Disease rates are 2 to 6
times higher – Water and hygiene (WASH)
interventions reduce risk by 25 – 48%
• Malaria– Higher incidence and
severity– Insecticide-treated bednets
(ITN) reduce risk by 50%

www.aids2014.org
Healthy Living Initiative Eligibility Criteria
• HIV positive children• OVC• Linked to CHW

www.aids2014.org
Program Enrollment• February – August, 2011• Baseline Survey– Demographic and SES characteristics– Water handling practices– ITN use– Hand washing behavior
• Distribution of Free Healthy Living Package (HLP)– 20 L storage vessel with lid and spigot– WaterGuard disinfectant solution– Soap– ITN– Educational Guide

www.aids2014.org
Intervention Phase• September, 2011 – August,
2012• CHWs conducted
bimonthly home visits• Program monitoring:
interim surveys on usage of WaterGuard, Soap and ITNs
• WaterGuard and soap refills provided at each home visit

www.aids2014.org
Program Evaluation• Analysis of baseline
survey and program monitoring data
• Assess clinical data– Hospital chart reviews
for illness• Compare 1 year pre-
enrollment to 1 year intervention phase

www.aids2014.org
Evaluation Timeline
Pre-Enrollment
• January 1, 2010- January 31, 2011
• Chart reviews
Enrollment
• February 1, 2011 – August 31, 2011
• Baseline surveys
Intervention
• September 1, 2011 – August 31, 2012
• Bimonthly home visits
• Program monitoring
• Chart reviews

www.aids2014.org
Data Analysis• Demographic data• Observations of water handling and ITN use • Comparison of illness data from pre-enrollment
period to intervention phase– Chi-Square Test
www.aids2014.org
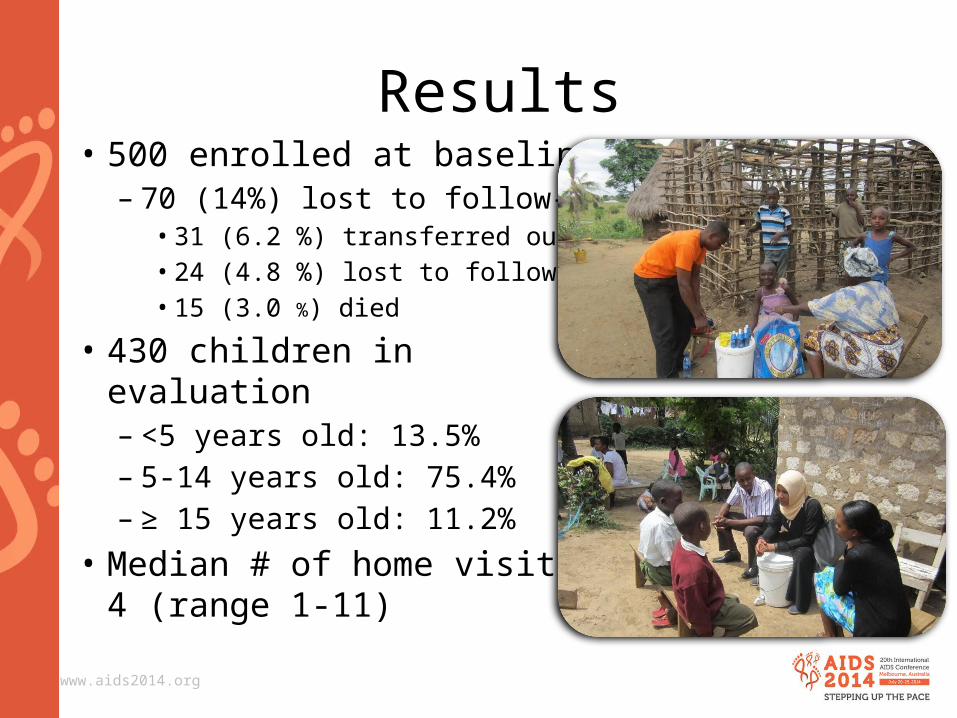
Results• 500 enrolled at baseline– 70 (14%) lost to follow-up
• 31 (6.2 %) transferred out • 24 (4.8 %) lost to follow-up • 15 (3.0 %) died
• 430 children in evaluation– <5 years old: 13.5%– 5-14 years old: 75.4%– ≥ 15 years old: 11.2%
• Median # of home visits: 4 (range 1-11)

www.aids2014.org
Results• Water observed in vessel at
95% of home visits • Subjective evidence of
chlorine use at 85% of home visits

www.aids2014.org
Diarrhea Episodes per Person-Visit, Overall and by Age Group
Pre-enrollment InterventionTotal visits No of
episodes (%)
Total visits No of episodes (%)
P Value
Overall 3628 118 (3.3%)
3690 44 (1.2%) <0.0001
Age group <5 yo 1022 41 (4.0%) 549 10 (0.8%) 0.074 5-14 2437 72 (3.0%) 2719 23 (1.8%) <0.0001 >15 169 5 (3.0%) 422 11 (2.6%) 0.812

www.aids2014.org
Results• Overall reported/observed
ITN use: 82% of home visits • Reported/observed ITN use
at all home visits: 48% of households

www.aids2014.org
Confirmed Malaria per Person-Visit, Overall and by Age Group
Pre-enrollment InterventionTotal visits No of
episodes (%)
Total visits No of episodes (%)
P Value
Overall 3628 30 (1.0%) 3690 4 (0.1%) <0.0001Age group <5 yo 1022 11 (1.1%) 549 0 (0.0%) 0.015 5-14 2437 27 (1.1%) 2719 4 (0.1%) < 0.0001 >15 169 1 (0.6%) 422 0 (0.0%) 0.114

www.aids2014.org
Limitations• Announced home visits may have influenced use
of interventions – courtesy bias vs. Hawthorne Effect
• CTX can reduce malaria and diarrhea incidence• Limited sample of children – not necessarily
representative of Kenya

www.aids2014.org
Healthy Living Initiative - Conclusions• Significantly fewer
hospital visits for diarrhea and malaria
• High retention in care: 86%
• High adherence to water handling and ITN interventions

www.aids2014.org
AcknowledgementsProject Sunshine
Beatrice Kernan
Caitlin Moses
Mohammed Naem
Jenny Lue
Marieka Walsh
New York UniversitySumathi SivapalasingamMolly Anderson
Benjamin Patterson
CDC, AtlantaRobert QuickKatharine Schilling
Gilead Foundation
Bomu HospitalAabid Ahmed
Dennis Ngui
Asia Abdullah
Rukiya Ali
Hayati Anjarwalla
Mahad Hassan
CHWs
Data Entry Clerks
Children and families who participated in the Healthy Living Initiative
ASANTENI SANA!