Embed Size (px)
DESCRIPTION
Home Cage Activity Monitoring MLog. Europe: North America: BIOBSERVE GmbHBIOBSERVE Koenigswinterer Str. 4182125 Center Ave., Suite 500 53227 BonnFort Lee, New Jersey 07024 Tel.: +49 228 20 160 20 Tel.: 201-302-6083 Fax: +49 228 20 160 29Fax: 201-302-6062 - PowerPoint PPT Presentation
Citation preview
Home Cage Activity Monitoring
MLog
This document and its content is confidential and was created for the solely use of the intended audience. It is not complete unless supported by the underlying analyses and oral presentation of BIOBSERVE GmbH. It may not be reproduced, disclosed or passed on to third parties except with the explicit prior consent of BIOBSERVE GmbH.
Europe: North America:BIOBSERVE GmbH BIOBSERVE Koenigswinterer Str. 418 2125 Center Ave., Suite 50053227 Bonn Fort Lee, New Jersey 07024Tel.: +49 228 20 160 20 Tel.: 201-302-6083Fax: +49 228 20 160 29 Fax: 201-302-6062
www.biobserve.com [email protected]
Solutions for Your ScienceBIOBSERVE
Home Cage Activity Monitoring - MLog
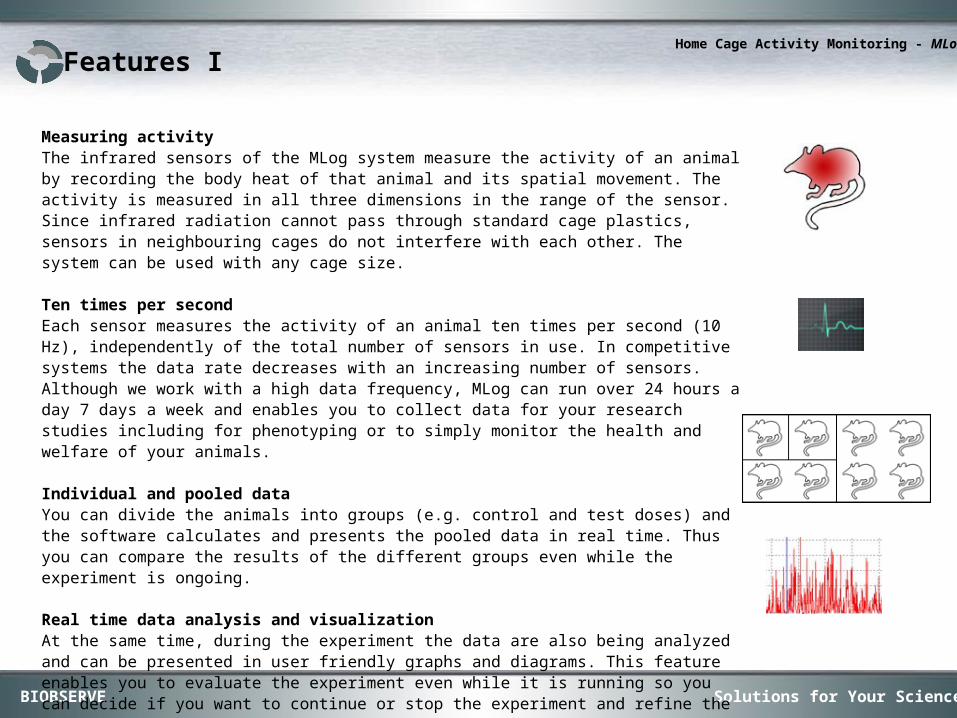
Measuring activityThe infrared sensors of the MLog system measure the activity of an animal by recording the body heat of that animal and its spatial movement. The activity is measured in all three dimensions in the range of the sensor. Since infrared radiation cannot pass through standard cage plastics, sensors in neighbouring cages do not interfere with each other. The system can be used with any cage size.
Ten times per secondEach sensor measures the activity of an animal ten times per second (10 Hz), independently of the total number of sensors in use. In competitive systems the data rate decreases with an increasing number of sensors. Although we work with a high data frequency, MLog can run over 24 hours a day 7 days a week and enables you to collect data for your research studies including for phenotyping or to simply monitor the health and welfare of your animals.
Individual and pooled dataYou can divide the animals into groups (e.g. control and test doses) and the software calculates and presents the pooled data in real time. Thus you can compare the results of the different groups even while the experiment is ongoing.
Real time data analysis and visualizationAt the same time, during the experiment the data are also being analyzed and can be presented in user friendly graphs and diagrams. This feature enables you to evaluate the experiment even while it is running so you can decide if you want to continue or stop the experiment and refine the selected parameters.
Features I
Solutions for Your ScienceBIOBSERVE
Home Cage Activity Monitoring - MLog
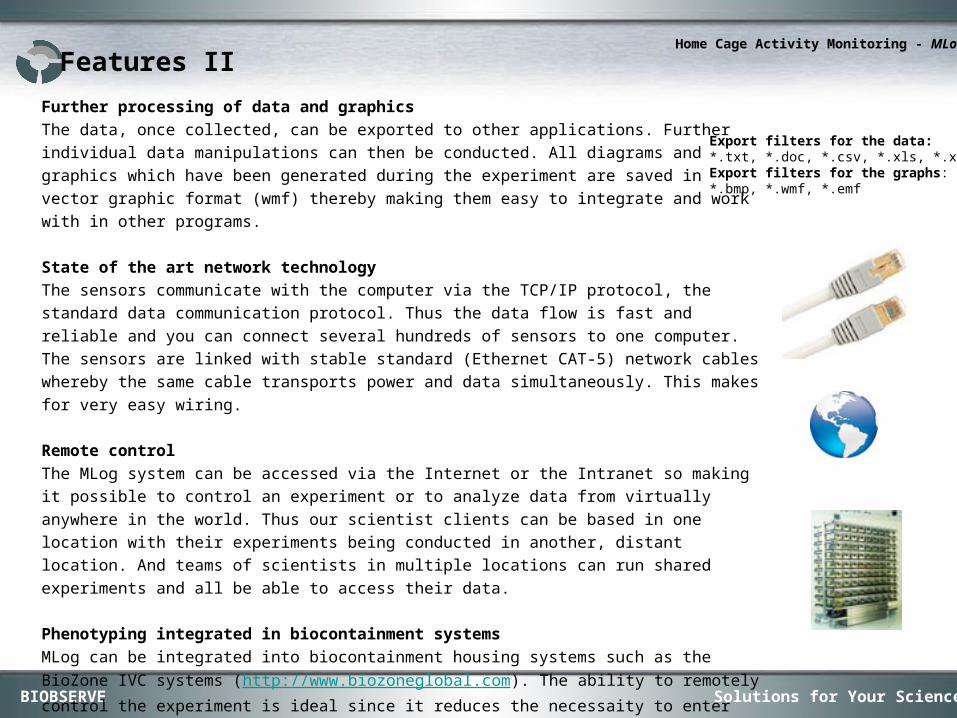
Further processing of data and graphics
The data, once collected, can be exported to other applications. Further individual data manipulations
can then be conducted. All diagrams and graphics which have been generated during the experiment
are saved in vector graphic format (wmf) thereby making them easy to integrate and work with in
other programs.
State of the art network technology
The sensors communicate with the computer via the TCP/IP protocol, the standard data
communication protocol. Thus the data flow is fast and reliable and you can connect several hundreds
of sensors to one computer. The sensors are linked with stable standard (Ethernet CAT-5) network
cables whereby the same cable transports power and data simultaneously. This makes for very easy
wiring.
Remote control
The MLog system can be accessed via the Internet or the Intranet so making it possible to control an
experiment or to analyze data from virtually anywhere in the world. Thus our scientist clients can be
based in one location with their experiments being conducted in another, distant location. And teams
of scientists in multiple locations can run shared experiments and all be able to access their data.
Phenotyping integrated in biocontainment systems
MLog can be integrated into biocontainment housing systems such as the BioZone IVC systems (http:
//www.biozoneglobal.com). The ability to remotely control the experiment is ideal since it reduces the
necessaity to enter the animal area either to perform experiments or to analyse data.
Features II
Export filters for the data:*.txt, *.doc, *.csv, *.xls, *.xmlExport filters for the graphs:*.bmp, *.wmf, *.emf
Solutions for Your ScienceBIOBSERVE
Home Cage Activity Monitoring - MLog
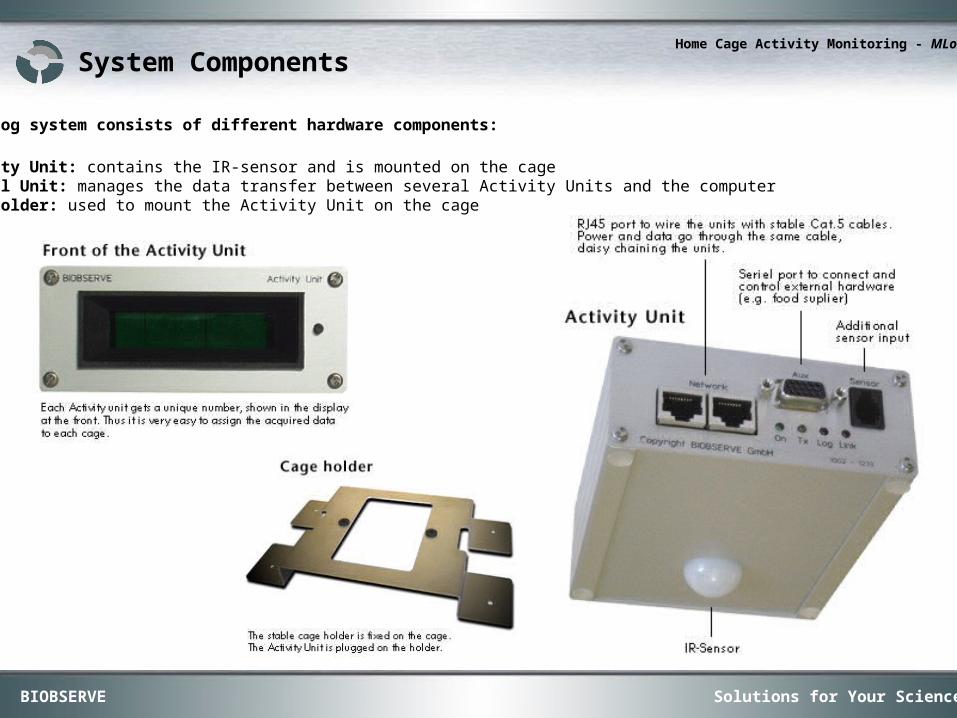
System Components
The MLog system consists of different hardware components:
Activity Unit: contains the IR-sensor and is mounted on the cageCentral Unit: manages the data transfer between several Activity Units and the computerCage Holder: used to mount the Activity Unit on the cage
Solutions for Your ScienceBIOBSERVE
Home Cage Activity Monitoring - MLog
There are several options for setting up the MLog system.
In the standard installation, the MLog hardware (Activity Units and Central Unit) is installed in the animal room and the
MLog software is installed on one computer that is directly connected with the Central Unit. To control the experiment or
analyze the data one has to be present in the lab.
In the enhanced installation, the MLog software is running on an Application server, allowing one to control and view the
experiment from different computers at different locations with the MLog client software. With this solution, different
experiments can be performed at the same time and different individuals can simultaneously use the system.
System Architecture
Solutions for Your ScienceBIOBSERVE
Home Cage Activity Monitoring - MLog
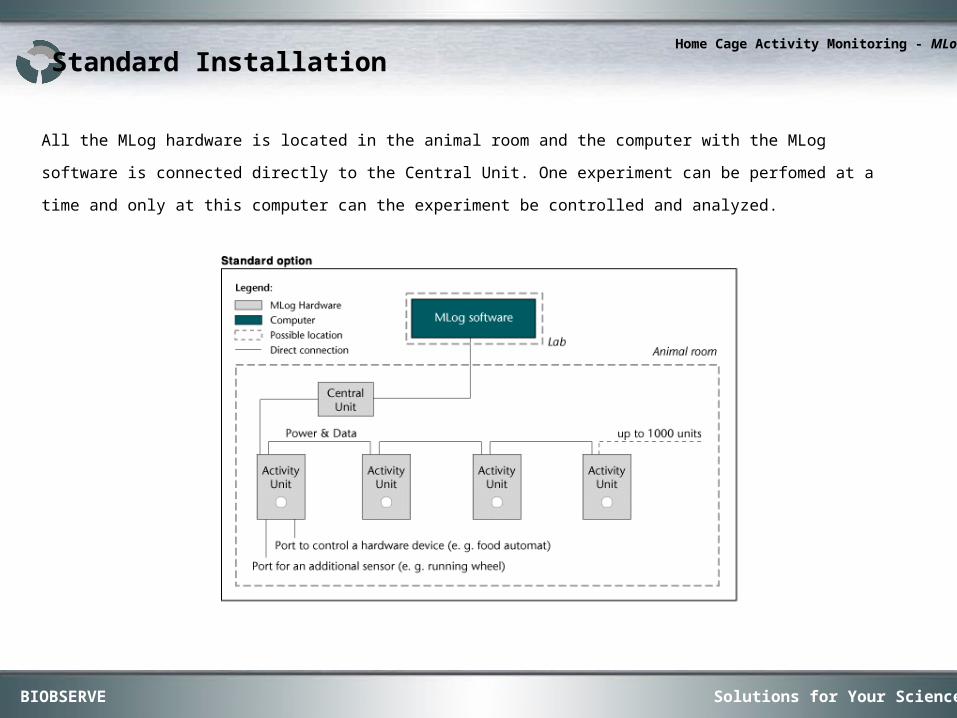
All the MLog hardware is located in the animal room and the computer with the MLog software is connected directly to the
Central Unit. One experiment can be perfomed at a time and only at this computer can the experiment be controlled and
analyzed.
Standard Installation
Solutions for Your ScienceBIOBSERVE
Home Cage Activity Monitoring - MLog
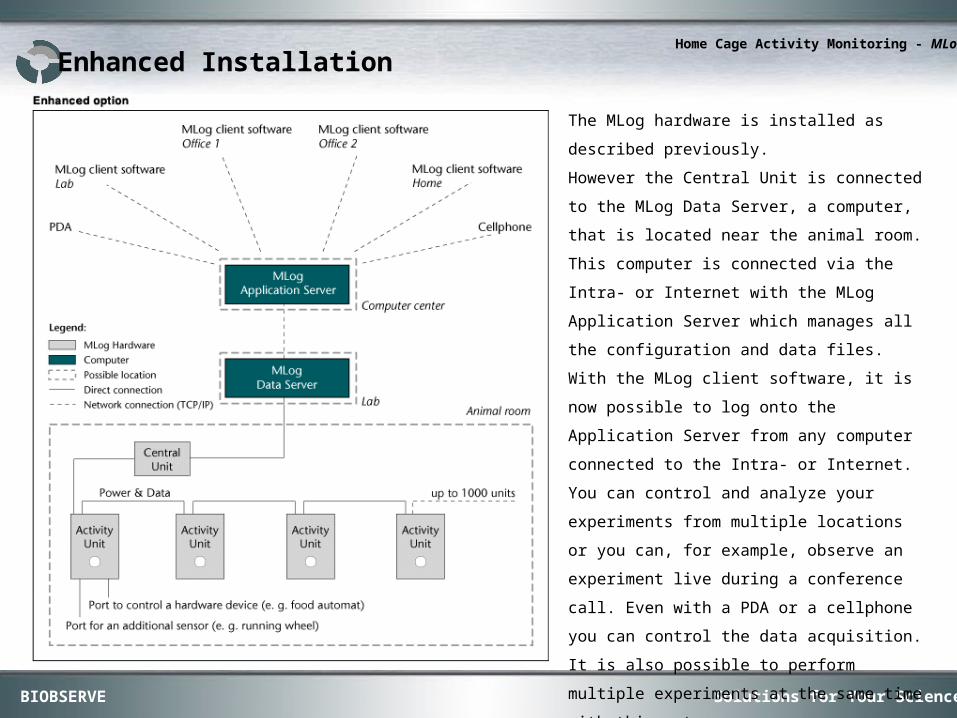
The MLog hardware is installed as described
previously.
However the Central Unit is connected to the
MLog Data Server, a computer, that is located
near the animal room. This computer is connected
via the Intra- or Internet with the MLog Application
Server which manages all the configuration and
data files. With the MLog client software, it is now
possible to log onto the Application Server from
any computer connected to the Intra- or Internet.
You can control and analyze your experiments
from multiple locations or you can, for example,
observe an experiment live during a conference
call. Even with a PDA or a cellphone you can
control the data acquisition. It is also possible to
perform multiple experiments at the same time
with this set up.
Enhanced Installation
Solutions for Your ScienceBIOBSERVE
Home Cage Activity Monitoring - MLog
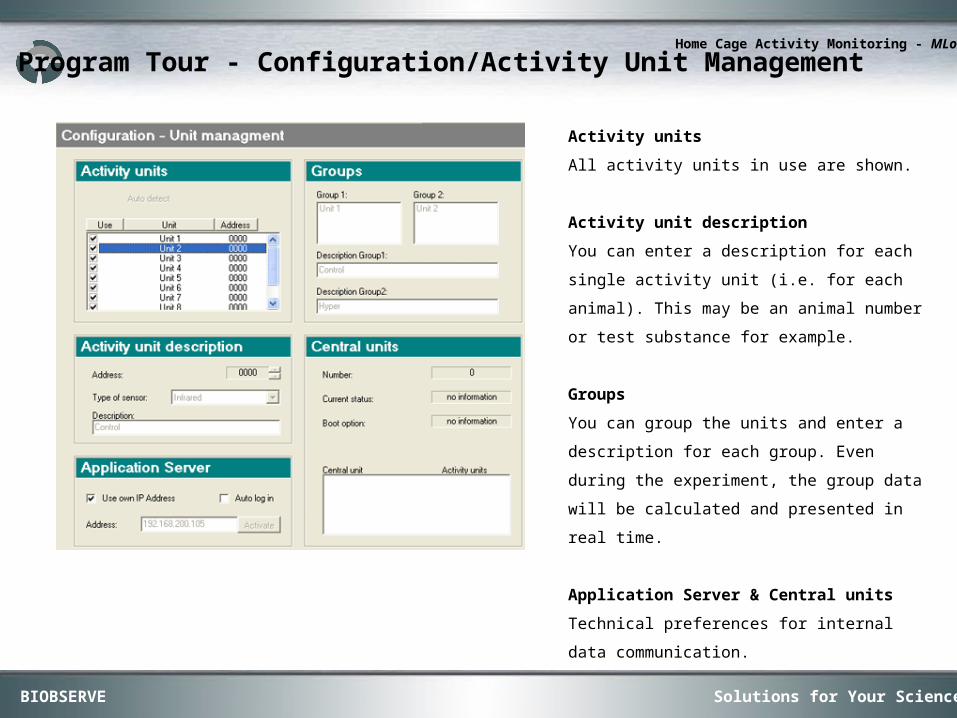
Activity units
All activity units in use are shown.
Activity unit description
You can enter a description for each single
activity unit (i.e. for each animal). This may be an
animal number or test substance for example.
Groups
You can group the units and enter a description
for each group. Even during the experiment, the
group data will be calculated and presented in
real time.
Application Server & Central units
Technical preferences for internal data
communication.
Program Tour - Configuration/Activity Unit Management
Solutions for Your ScienceBIOBSERVE
Home Cage Activity Monitoring - MLog
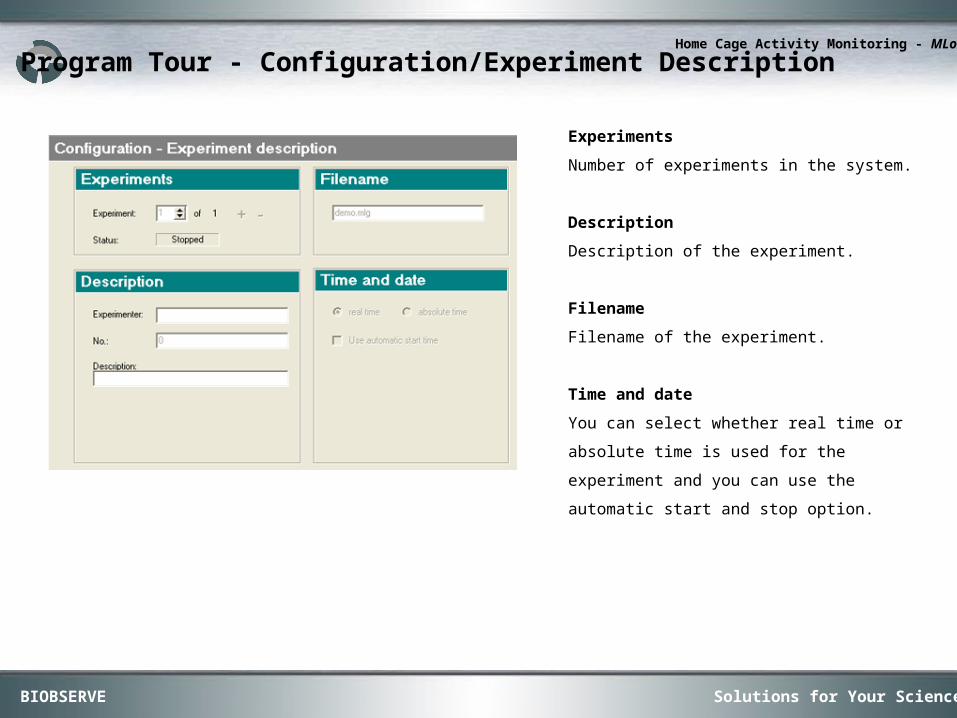
Experiments
Number of experiments in the system.
Description
Description of the experiment.
Filename
Filename of the experiment.
Time and date
You can select whether real time or absolute time
is used for the experiment and you can use the
automatic start and stop option.
Program Tour - Configuration/Experiment Description
Solutions for Your ScienceBIOBSERVE
Home Cage Activity Monitoring - MLog
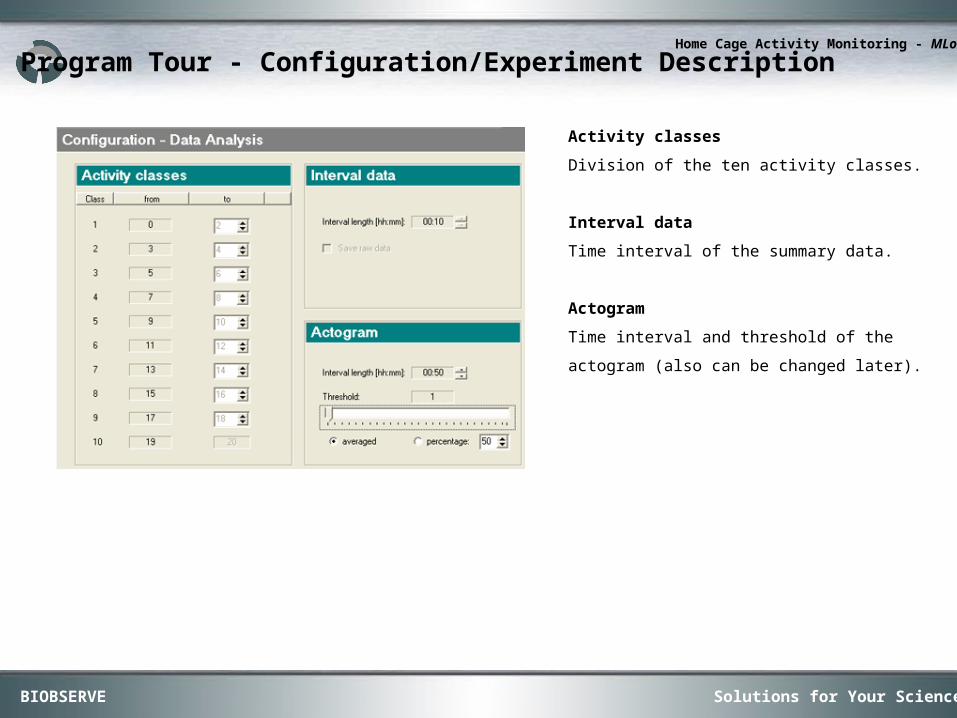
Activity classes
Division of the ten activity classes.
Interval data
Time interval of the summary data.
Actogram
Time interval and threshold of the actogram (also
can be changed later).
Program Tour - Configuration/Experiment Description
Solutions for Your ScienceBIOBSERVE
Home Cage Activity Monitoring - MLog
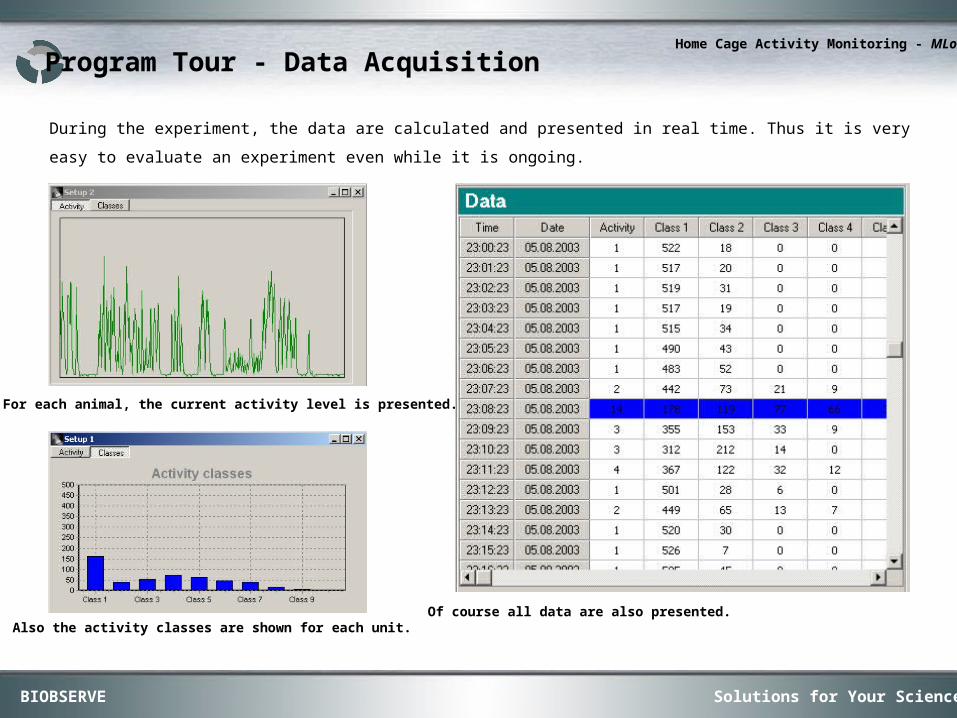
During the experiment, the data are calculated and presented in real time. Thus it is very easy to evaluate an experiment
even while it is ongoing.
Program Tour - Data Acquisition
For each animal, the current activity level is presented.
Also the activity classes are shown for each unit.Of course all data are also presented.
Solutions for Your ScienceBIOBSERVE
Home Cage Activity Monitoring - MLog
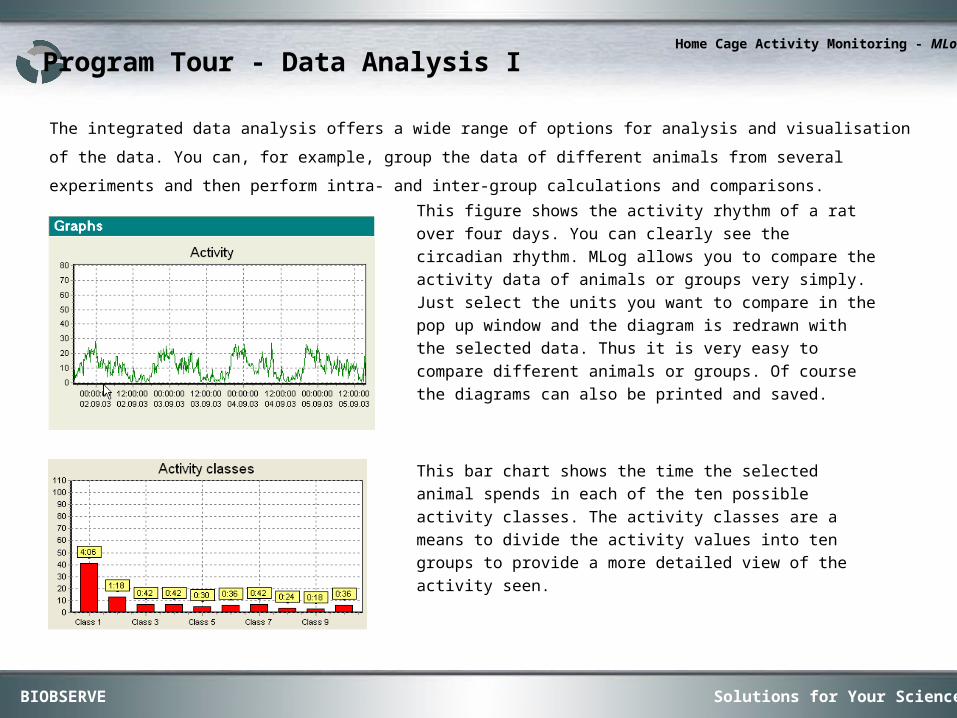
The integrated data analysis offers a wide range of options for analysis and visualisation of the data. You can, for
example, group the data of different animals from several experiments and then perform intra- and inter-group calculations
and comparisons.
Program Tour - Data Analysis I
This figure shows the activity rhythm of a rat over four days. You
can clearly see the circadian rhythm. MLog allows you to
compare the activity data of animals or groups very simply. Just
select the units you want to compare in the pop up window and
the diagram is redrawn with the selected data. Thus it is very
easy to compare different animals or groups. Of course the
diagrams can also be printed and saved.
This bar chart shows the time the selected animal spends in
each of the ten possible activity classes. The activity classes
are a means to divide the activity values into ten groups to
provide a more detailed view of the activity seen.
Solutions for Your ScienceBIOBSERVE
Home Cage Activity Monitoring - MLog
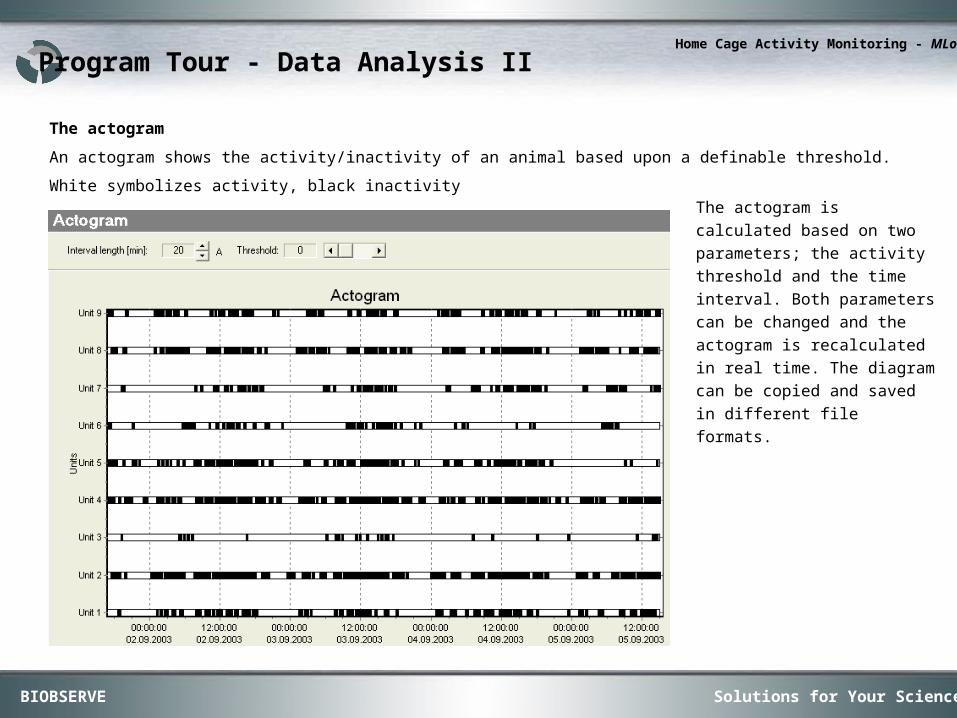
The actogram
An actogram shows the activity/inactivity of an animal based upon a definable threshold. White symbolizes activity, black
inactivity
Program Tour - Data Analysis II
The actogram is calculated based
on two parameters; the activity
threshold and the time interval.
Both parameters can be changed
and the actogram is recalculated
in real time. The diagram can be
copied and saved in different file
formats.
Solutions for Your ScienceBIOBSERVE
Home Cage Activity Monitoring - MLog
Thank you very much for your interest in our solution.
We hope we could provide you an useful overview over the features and capabilities of our Home Cage Activity
Monitoring Solution „MLog“.
If you have further questions, please do not hesitate to contact us.
Thank you!
Europe: North America:BIOBSERVE GmbH BIOBSERVE Koenigswinterer Str. 418 2125 Center Ave., Suite 50053227 Bonn Fort Lee, New Jersey 07024Tel.: +49 228 20 160 20 Tel.: 201-302-6083Fax: +49 228 20 160 29 Fax: 201-302-6062
www.biobserve.com [email protected]