Embed Size (px)
Citation preview

Home Energy Score Analysis Report
Joan Glickman, U.S. Department of Energy
February 2014

Introduction
The U.S. Department of Energy developed the Home Energy Score as a method for homeowners and others to be able to easily understand and compare the energy performance of different homes across the U.S. Since the initial formulation of the program, the Department has undertaken a wide range of analytical efforts to ensure that the Home Energy Score is reliable and effective in providing useful information.
This paper summarizes findings from these efforts and is periodically updated to include new information from studies and analysis. While the majority of this paper focuses on the 2011 Pilot Program and analysis of the Scoring Tool used in that pilot (i.e., Home Energy Scoring Tool v.2011), the Appendix covers more recent analysis reflecting the latest version of the Scoring Tool (v.2013).
This paper does not include program updates such as information on homes scored to date, improvements to assessor training and testing, and other program developments. For more information on the program, visit www.homeenergyscore.gov.

Home Energy Score: Findings from 2011 Pilot Program and Analysis
In 2011, the U.S. Department of Energy partnered with organizations across the U.S. to evaluate the Home Energy Score program’s ability to provide consumers with credible and easy to understand information about a home’s energy performance at an affordable cost. The Department worked with the National Renewable Energy Laboratory to conduct a variety of analyses using data generated from the pilots as well as energy usage and home characteristic data collected from other sources1.
This paper summarizes the findings from both of these efforts and outlines the changes DOE has made to the program in response to these findings. Table 1 lists DOE’s research topics and questions, the method by which these questions were analyzed, the data source, and the lead for each analysis.
Section 1 of this paper presents results from the pilots and addresses all research questions that relied on pilot data. Section 2 presents findings from supplemental analysis and addresses all remaining questions listed in Table 1. Section 3 summarizes the changes that DOE is making to the program in light of the research and pilot findings.
The following three papers, available at www.homeenergyscore.gov provide more detailed discussions of the analyses summarized here.
Assessment of the U.S. Department of Energy’s Home Energy Scoring Tool (by the National Renewable Energy Laboratory)
2011 Home Energy Score Pilot Program: Qualified Assessor Analysis
2011 Home Energy Score Pilot Program: Homeowner Understanding and Interest
1 NREL conducted much of the analysis using data contained in its Field Data Repository. More information about the Repository can be found at http://www.nrel.gov/docs/fy12osti/54026.pdf.

Table 1: Research Questions and Corresponding Analysis
Research Question Analysis Method Lead Data
Source
Topic I. Home Energy Scoring Tool
How do modeled energy uses compare to actual usage data?
Comparison of modeled energy use with actual usage data
NREL 5 States
What changes can be made to the Scoring Tool to improve agreement with usage data?
Comparison of modeled energy use with actual usage data
NREL 5 States
To what degree do the Scoring Tool’s energy calculations vary given inclusion or exclusion of blower door information?
Sensitivity analysis NREL Pilots
To what degree do climatic differences within the proposed 19 geographic zones affect the score?
Energy calculations for each of the TMY2 weather station locations
DOE N/A
Does the Scoring Tool generate reasonable energy improvement recommendations?
Partner and assessor feedback
DOE Pilots
Topic II. Asset and Operational Variability
How much variability in energy usage can be attributed to behavioral differences?
Monte Carlo analysis using BEopt™ EnergyPlus model
NREL N/A
How much variability in predicted energy use can be attributed to imprecise characterization of the home’s asset features?
Monte Carlo analysis using Home Energy Scoring Tool
DOE N/A
Topic III. Home Energy Score Program Information and Implementation
Can the tool be applied consistently given variation in home types, climates, and assessors?
Pilot program DOE Pilots
Are DOE’s training and information tools sufficient to assist assessors in interpreting the Scoring Tool’s data requirements?
Pilot Partner and assessor feedback
DOE Pilots
Can a Qualified Assessor score a home in an hour or less?
Assessor feedback DOE Pilots
Do homeowners understand the information presented and find it useful?
Pilot Partner and homeowner feedback
DOE Pilots
Section 1: Pilot Results
The pilot program was designed to evaluate
applicability of the scoring system and tool to different types of homes and in different climates;
usability of the Scoring Tool; and,
homeowner understanding of the score and supplemental information. Figure 1 depicts the 10 organizations that partnered with DOE to pilot test the Home Energy Score. All of the pilots, with the exception of Utah, provided Home Energy Scores to homeowners through existing programs. Utah joined the process after the other pilots had begun; as a result, they scored homes using previously collected home data but did not provide these scores to homeowners.
Figure 1: Home Energy Score Pilot Partners
All 31 assessors participating in the pilot program met DOE’s qualification requirements, took DOE’s on-line Home Energy Score training module, and passed the Home Energy Score on-line test. In addition to collecting the home characteristics and scoring the homes, the assessors provided useful information based on their use of the Scoring Tool and the overall program. Assessors were asked to
PECI mini-pilot, Utah

respond to questions about the Scoring Tool; time requirements for data collection and data entry; training; recommendations provided by the tool; and support materials. Of the 31 Qualified Assessors participating with the pilot programs, 20 assessors returned questionnaires representing a 65 percent response rate. In addition to getting feedback from assessors, a number of the pilots provided a standard set of questions to the homeowner at the time of the assessment, and then mailed or emailed a follow-up set of questions after the homeowner received the Home Energy Score results. About 150 homeowners responded to both the pre- and post-score questions. Pilot Partners also informally reported feedback from homeowners through observations during the pilot. The questions posed were primarily intended to gauge the extent to which homeowners understand the information provided and find it useful in helping them decide how to improve the energy efficiency of their homes.
Can the scoring system and tool be applied consistently given differences in home types, climates, and assessors?
The range of energy estimates and scores from the pilots demonstrate that the Scoring Tool can be applied to a diverse housing stock in a wide range of climates. In post-pilot discussions, assessors and pilot Partners suggested that assessors need additional guidance, training and Scoring Tool tips to improve consistent reporting of home characteristics data, particularly for less common housing configurations. As a result, the Department improved its training to include modules on building science and data entry, added an R-value calculator, and expanded the informational tips provided within the Scoring Tool. These changes are outlined in Section 3 of this paper.
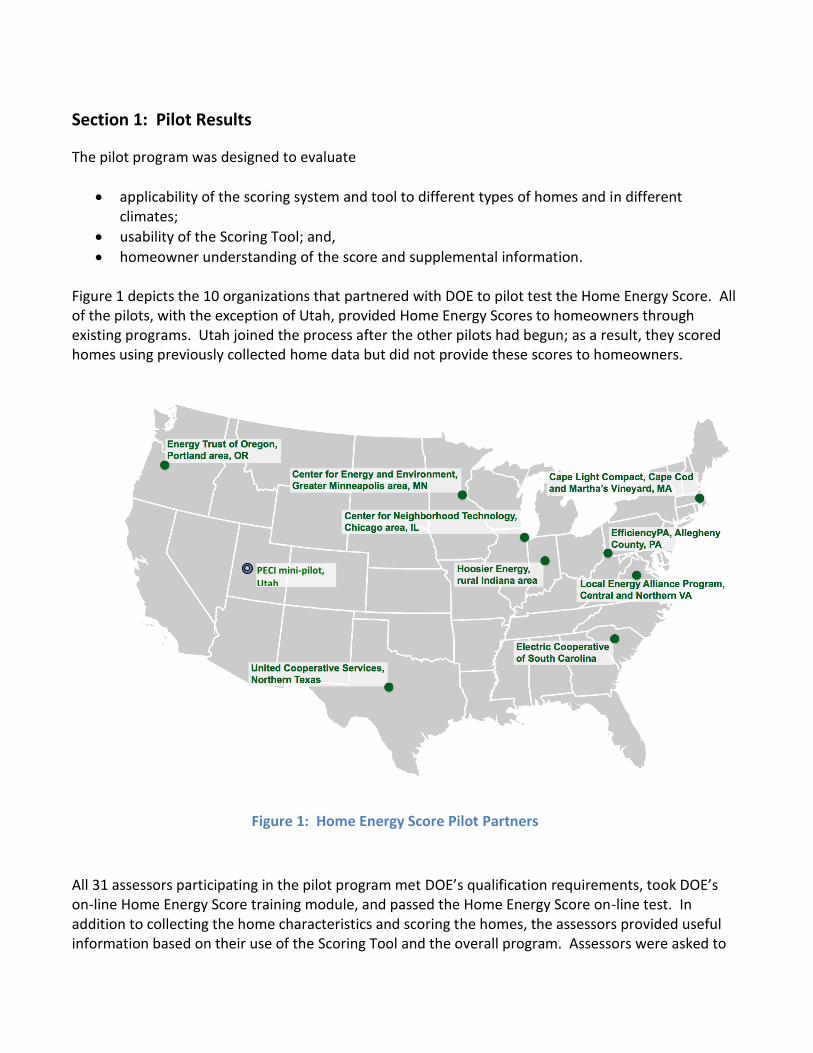
The pilots (not including Utah2) assessed and scored more than 1,000 homes between March and June 2011. In most cases, the home scores fit a relatively normal distribution, with about 70 percent of the homes scoring between 4 and 7; about 20 percent scoring a 3 or below; and, the remaining 10 percent scoring an 8 or higher. About 30 percent of the homes that scored a 3 or lower were from the Chicago pilot. Excluding the Chicago pilot homes, 70 percent still scored between 4 and 7, with the remaining 30 percent split more evenly between the top and bottom portions of the scale. One reason that could explain why the majority of the Chicago pilot homes scored in the bottom third of the scale is likely the fact that these homes had a median vintage of 1924 and had generally not been upgraded. Figure 2
2 Unless otherwise noted in this report, the pilot data analyzed does NOT include data from Utah given that this pilot began
the process midway and was not involved in most of the analytical pilot efforts.
shows the distribution of scores from all the pilots, with individual colors corresponding to the different locations.
Figure 2: Distribution of Scores from Pilot Results
To what degree do the Scoring Tool’s energy calculations vary given inclusion or
exclusion of blower door information?
Based on the pilot analysis, the measured air leakage rate (CFM503) is unlikely to change a home’s energy score on the 10 point scale. Sixty percent of the time, the difference in estimated energy use did not affect the home’s score on the 10 point scale. And, only 7 percent of the time did the score vary by more than 1 point when an air leakage model based on a qualitative assessment was used to determine the air leakage rate instead of using a measured value. When the qualitative selection (either "sealed" or "not sealed”) and the measured air leakage rate were in close agreement the score changed on average one-quarter
3 Air leakage rate in cubic feet per minute (CFM) at 50 pascals of pressure induced by a blower door

of a point. When the qualitative selection and the measured air leakage rate were not in close agreement the score changed on average seven-tenths of a point.
Of the 1000+ homes scored during the pilot phase, 655 had a blower door test performed as part of the Partner’s overall assessment. The Home Energy Scoring Tool accepts either a quantitative measurement of whole-house leakage using a blower door or a qualitative assessment of whether the home has been air sealed or not. Given DOE’s interest in developing a scoring method that is reliable yet fairly inexpensive to implement, the Department asked the National Renewable Energy Laboratory (NREL) to conduct a sensitivity analysis to determine the extent to which a measured air leakage rate (as determined by a blower door test) affected a home’s final score. NREL reran each of the 655 homes three times using the following different inputs as the value for whole-house air leakage:
Blower door data
Qualitative assessment: “Sealed”
Qualitative assessment: “Unsealed”
Figures 3 and 4 show the extent to which the tool’s predicted source energy value differs when using a blower door number vs. noting that the house is “not air sealed” or “air sealed” respectively.

Figure 3. Predicted source energy use from Home Energy Score using “Unsealed” qualitative input for whole-house air leakage versus quantitative whole-house
leakage.
Figure 4. Predicted source energy use from Home Energy Score using “Sealed” qualitative input for whole-house air leakage versus quantitative whole-house
leakage.
On average, for this sample of homes, when compared to the predictions stemming from quantitative input, the source energy use increased by 6 MBtu when the sealed qualitative input was used and by 25 MBtu/yr when the unsealed qualitative input was used. So, on average, homes received a slightly better score if the blower door data was used than if the home was noted as either sealed or not sealed.
Figure 5 shows a distribution of the difference in scores generated by the Scoring Tool using the quantitative and qualitative inputs for whole-house air infiltration. Sixty percent of the time, the difference in estimated energy use did not change the home’s score on the 10 point scale. And, only 7 percent of the time did the score vary by more than 1 point given a qualitative assessment vs. blower door value.

Figure 5. Distribution of Differences in Home Energy Score Generated using
Qualitative and Quantitative Inputs for Whole-House Leakage
Can Qualified Assessors typically score a home in an hour or less?
The pilots confirmed that Qualified Assessors can collect and enter required data and score a home in an hour or less. If the assessor is already doing some type of home energy audit or assessment, the scoring will typically require only an additional 15 minutes of effort.
In general, assessors indicated that data collection and entry could be completed in a reasonable amount of time and that report generation was straightforward. Sixteen (80 percent) of the assessors who responded also collected additional data for their particular pilot programs’ administrative needs. For these assessors, the additional time required to collect information for the Home Energy Score (and not captured by their other program activities) averaged 17 minutes. Of the four assessors who only collected information for the Home Energy Score program, two assessors indicated 26 to 30 minutes, one assessor indicated less than 15 minutes, and the fourth assessor indicated needing greater than 30 minutes to collect the information required by the Scoring Tool. Three out of four assessors reported that data entry required 20 minutes or less. All reported needing less than 30 minutes to enter data into the tool. (Figure 6).

Figure 6. Time Required by Assessor to Enter Data into Tool
Overall, these responses support DOE’s goal of scoring a home in one hour or less. Based on the pilot results, the entire scoring process (data collection and data entry) will take approximately 45 minutes if done as a stand-alone effort or 30 minutes4 if done in conjunction with a larger audit. The time required for data entry is expected to drop considerably after an API (application programming interface) for the Scoring Tool is made available and allows seamless integration with other software tools.
Are DOE’s training and information tools sufficient to assist assessors in interpreting the Scoring Tool’s data requirements?
The pilot Partners and assessors highlighted a number of deficiencies in the training, testing, and Scoring Tool tips provided as for the pilot. As a result, the Department enhanced its training modules, testing requirements, and informational tips provided within the tool. These changes are outlined in Section 3 of this paper.
In their responses to the questionnaire as well as in follow-up discussions, many assessors noted that the data required by the tool, as well as intended methods to measure these data points, were unclear.
4 The 30 minute estimate represents the additional time an assessor would need to generate a score if done as part of a
larger audit. It is not an estimate of the time needed to conduct a comprehensive audit. In most cases, the assessor will already be collecting the majority of data needed for the score as part of the larger energy audit; therefore, the time required for generating a score as part of an audit is less than if done as a stand-alone effort.

A few assessors (3 to 5) were also confused about the intent of the Home Energy Score program as well as what the score meant. DOE has taken a number of steps to address these problems. Specific improvements to the tool, training, and overall program are described in Section 3 of this paper.
Does the Scoring Tool generate reasonable energy improvement recommendations?
The pilot Partners and assessors noted a number of instances in which the tool’s recommendations were not applicable given improvements already made in the home. Partners also questioned the payback figures provided with the recommendations. As a result, the Department made substantial changes to the method in which recommendations are generated thru the tool as well as what types of information are included. These changes are outlined in Section 3 of this paper.
Although assessors are not required to present the energy improvement recommendations generated by the tool, assessors were asked for their impressions of the tool’s recommendations. Assessors reported cases in which recommendations generated by the Scoring Tool did not match recommendations generated by their particular energy program. Furthermore, in some instances, the Scoring Tool recommended improvements that had already been implemented in the home. Assessors also reported inaccurate payback estimates generated by the tool for different improvements. This was not unexpected given that the tool uses average national cost of improvement and state-average (rather than utility-specific) energy prices to calculate payback. As a result payback estimates were removed from the final recommendation list, but they are still used to prioritize the list of recommendations.
Do homeowners understand the information presented and find it useful?
Homeowners who participated in the pilot generally found the information and score easy to understand. It was not clear whether or not the score and/or other information would motivate them to undertake energy improvements. As a result, the Department intends to undertake additional evaluation efforts to assess how to make information as motivational and useful as possible.
Based on homeowner responses, most homeowners thought the score’s scale of 1-10 was easy to understand; understood how they compared to more efficient homes; and thought that the time required to do the assessment was reasonable. The majority also noted that they were likely to tell others about the program and that the score encouraged them to make improvements.

As depicted in Figures 7 and 8, homeowners also commented on what motivates them to make energy improvements, as well as what stands in the way of getting improvements done. They cited “help me save on my utilities’” as the main reason for making improvements, followed by ‘increase comfort in my home’, and ‘improve my Home Energy Score’. The most frequently cited reasons for not making improvements were expense and having to hire someone to do the work.
Some homeowners and pilot Partners were concerned that certain homes, even with improvements, might not achieve a high score. To address this problem, Partners suggested providing greater explanation of what a low score means, particularly if the home could benefit from improvements but still not achieve a high score.
The pilots did not track whether or not the score made a difference in homeowners’ decisions about investing in improvements. This question will be considered as part of a longer-term evaluation to be conducted during the first phase of implementation of the program.
Figure 7: Reasons Why Homeowners Make Improvements

Figure 8: Reasons Homeowners Don’t Make Improvements
Section 2: Research Results
As a complement to the pilot review, the National Renewable Energy Laboratory (NREL) and DOE conducted a variety of other analyses to assess the Scoring Tool and overall scoring methodology. The following provides a high-level summary of the analytical findings. More detailed information concerning methodology as well as additional results is presented in the NREL paper entitled, Assessment of the U.S. Department of Energy’s Home Energy Scoring Tool.
How do modeled energy calculations compare to actual usage data?
The Home Energy Scoring Tool’s energy predictions compare favorably with measured usage data. As shown in Table 2, the median difference between the Home Energy Scoring Tool’s predicted energy use and measured energy use is -4 MBtu (-2%). This compares to -35 MBtu (-17%) for SIMPLE5 and 44 MBtu (22%) for REM/Rate6.
NREL used home characteristics and utility bill data collected for homes in 5 states (OR, WI, TX, MN and NC) to compare energy calculations from different tools against measured energy use data (i.e., weather-normalized utility billing data). Figure 9 shows how the energy estimates calculated by the Home Energy Scoring Tool, SIMPLE and REM/Rate all compare to the actual energy use data. Figure 10 shows how energy estimates calculated by the pilot version of the Scoring Tool and the newer version of the Scoring Tool compare to actual energy use data. As the graphs suggest, results from the new version of the Scoring Tool map more closely to the actual usage data. Table 2 provides a summary of statistics. As Table 2 indicates, the energy calculations generated by the new version of the Scoring Tool more closely align with the actual usage data (n=537). Given that all of these tools apply standard assumptions about occupant behavior and non-asset energy-using equipment in the home (plug loads, lighting, etc. as well as atypical features such as pools), the tools’ estimated energy use calculations are not expected to line up on a one-to-one basis with actual usage data that reflects a wide range of occupant behavior.
5 The SIMPLE residential energy analysis tool was developed by Blasnik & Associates. SIMPLE is available as a Microsoft
Excel spreadsheet and is licensed as the underlying engine for several Web-based energy analysis tools, including Earth Advantage Institute’s Energy Performance Score (Earth Advantage Institute, Conservation Services Group 2009). 6 The REM/Rate home energy rating software is developed by Architectural Energy Corporation. It is used by home energy
raters to predict energy use and energy savings in new and existing homes.
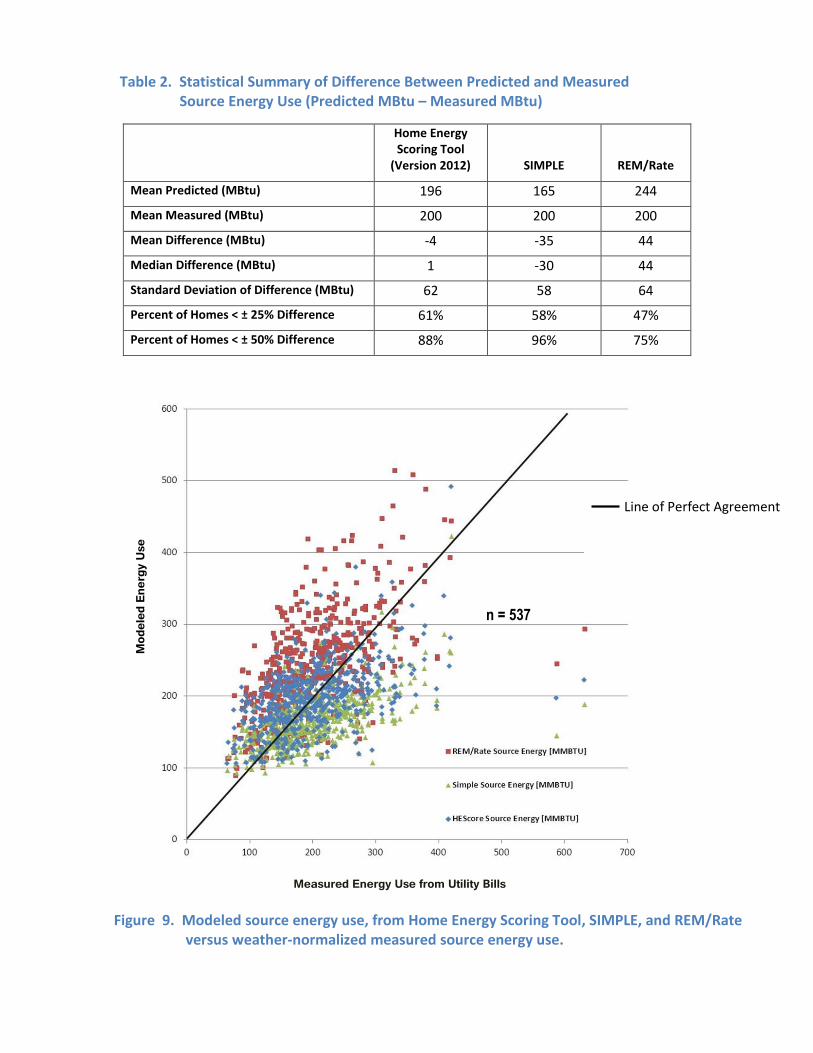
Table 2. Statistical Summary of Difference Between Predicted and Measured Source Energy Use (Predicted MBtu – Measured MBtu)
Home Energy Scoring Tool
(Version 2012) SIMPLE REM/Rate
Mean Predicted (MBtu) 196 165 244
Mean Measured (MBtu) 200 200 200
Mean Difference (MBtu) -4 -35 44
Median Difference (MBtu) 1 -30 44
Standard Deviation of Difference (MBtu) 62 58 64
Percent of Homes < ± 25% Difference 61% 58% 47%
Percent of Homes < ± 50% Difference 88% 96% 75%
Figure 9. Modeled source energy use, from Home Energy Scoring Tool, SIMPLE, and REM/Rate versus weather-normalized measured source energy use.
N = 449 homes
Mode
led E
nerg
y Use
n = 537
Measured Energy Use from Utility Bills
Line of Perfect Agreement

Figure 10. Home Energy Scoring Tool predicted source energy use versus weather-normalized measured source energy use
Home Energy Scoring Tool
Pilot Version S
oft
war
e p
red
icte
d s
ou
rce
to
tal e
ne
rgy
use
(M
MB
tu)
Home Energy Scoring Tool
Version 2012
---- Scoring Tool Linear Regression
Line of Perfect Agreement
---- Scoring Tool Linear Regression
Line of Perfect Agreement

What changes can be made to the Scoring Tool to improve correlation to energy usage data?
DOE and Lawrence Berkeley National Laboratory made significant changes to the Scoring Tool, given pilot findings and aforementioned analysis. A number of these are listed in Box 1. For full documentation, please consult the LBNL web site.
BOX 1: Examples of Scoring Tool Changes
Neighboring house on left and right assumed for shading calculations
Default thermostat now 78/84 cooling, 68/60 heating
Default clothes washer loads now 1 warm/warm, 2 warm/cold, and 3 cold/cold per week
Increased DOE2 weather shielding class which will reduce local wind speeds
Conditioned basements now have thermostat setting 5 degrees lower than main living area for heating and 5 degrees higher for cooling
Operable window shading now applied only during summer
Default refrigerator now a 10-year-old large, top freezer auto-defrost
Reduced default clothes dryer energy use, and number of loads to 5 per week
Reduced default dishwasher water use to 8.2 gallons/cycle and number of loads to 3 per week
Default water heater energy factors now 0.59 for gas and 0.9 for electric
Lowered default water heater set point to 120 F
Increased inlet water temperatures by approximately 8 degrees
Updated the default for number of clothes washer Loads per week and Energy use.
Fixed issue where specifications for custom windows were not set correctly when all sides were the same.
Modified occupancy so that it is no longer static, but reflects the number of bedrooms in home.
Modified calculation of lighting energy use to be based on floor area.
Modified calculation of appliance energy use to be based on floor area and number of bedrooms.
Updated weather data with new Average Temperature and Inlet Water temperature values
Updated climate zone default values for foundation type, stories above ground, window type, and dryer, stove and oven fuels.
Updated default number of ceiling fans to "none".

How much variability in energy usage can be attributed to behavioral differences?
Based on NREL’s uncertainty analysis, behavioral differences account for +/-14% of energy use variability two-thirds of the time. Variability is greater in mild climates (+/- 18%) and less pronounced in harsh climates (+/-11%). On average, behavioral differences account for +/-28% of energy use variability 95% of the time. In other words, if a home’s energy use is expected to be 100 MBtu, actual energy use (95% of the time) will range from 72 MBtu to 128 MBtu depending upon the behavior of occupants.
The Home Energy Score reflects the predicted energy use of the energy-related assets of a home under typical operating conditions (standard occupancy and behavior). Utility billing data, on the other hand, reflect the actual energy use of the energy-related assets of a home under actual operating conditions, which may not be typical. NREL ran a Monte Carlo7 uncertainty analysis to estimate what portion of the total observed variability between predicted and measured energy use can be explained by variability in occupant behavior. A development version of BEopt™/EnergyPlus8 was used to perform the simulations. To assess the effect of behavior on overall energy use, NREL calculated energy usage given varying operational assumptions for two prototypical houses. The homes had the following physical characteristics:
House A: 1,500 sq ft, one story, detached, inefficient home, representative of 1960s-era
construction
House B: 2,500 sq ft, two story, detached, more-efficient home, representative of new
construction.
7 A Monte Carlo analysis is a technique that converts uncertainties in input variables of a model into probability
distributions. A probably distribution is defined for each one of the variables being examined. Values from these probability distributions are randomly selected and then run a large number of times through a simulation model. By generating distributions and randomly selecting values from them, this method recalculates the simulated model many times and brings out the probability of the output. 8The BEopt™ (Building Energy Optimization) software was developed by NREL to evaluate residential building
designs. The software can be used to analyze both new construction and existing home retrofits, and provides detailed analysis using house characteristics. The version of BEopt™ used in this analysis utilizes the EnergyPlus building energy simulation engine. EnergyPlus has been developed and supported by DOE Building Technologies Program since 1996.

Table 3. Perturbed Operational Inputs and Associated Uncertainty Ranges
Input Minimum Nominal Maximum
Space Heating Set Point (°F) 60 68 75
Space Cooling Set Point9 (°F) 71 78 86
Miscellaneous Electric Loads Multiplier 0.2 0.8 2.0
Miscellaneous Gas Loads Multiplier 0.2 0.8 2.0
Miscellaneous Hot Water Loads Multiplier 0.2 0.8 2.0
Interior Shading Multiplier 0.5 0.6 1.0
Interior Lighting Multiplier 0.2 0.8 2.0
Exterior Lighting Multiplier 0.2 0.8 2.0
Furniture Conductivity (Btu-in./hr-ft2-°F) 0.64 0.80 0.96
Furniture Density (lb/ft3) 32 40 48
Furniture Specific Heat (Btu/lb-°F) 0.232 0.290 0.348
Furniture Area Fraction 0.1 0.3 0.5
Furniture Weight (lb/ft2) 2 8 14
Furniture Solar Absorptance 0.4 0.6 0.8
Refrigerator Multiplier 0.7 1.0 1.3
Range/Dishwasher Multiplier 0.2 0.8 2.0
Clothes Washer/Dryer Multiplier 0.2 0.8 2.0
Fraction of Total Window Area Open 0.00 0.04 0.14
Water Heater Setpoint (°F) 110 125 140
Given that this analysis was aimed at looking at the effects of behavior on total energy use, the asset characteristics of these homes were held constant. NREL varied 19 operational inputs and developed triangular probability distributions for each of these inputs. Table 3 provides the minimum, nominal, and maximum values used to define the triangular probability distributions for the 19 operational inputs.
NREL ran the BEopt™ model approximately 2,500 times, with randomly selected values for the 19 inputs, to generate a probability distribution for total energy use in these homes. The 2,500 runs were repeated using 6 different climate locations in the U.S. Operational variability had a greater impact in more temperate climates and in the older, less efficient home. Table 4 provides the mean, standard deviation, and coefficient of variation (COV) associated with the simulations run for each house in each climate zone.
9 The thermostat model in BEopt™/EnergyPlus does not allow the heating set point to be greater than the cooling
set point. The small percentage of realizations where this occurred was excluded from the analysis.

Table 4. Mean and Standard Deviation for Total Source Energy Use (MBtu/yr) by climate
Location Bin
Size10
HOUSE A HOUSE B
Likelihood of Being Within 1 Point of Predicted Energy Use Given Behavioral Differences
MEAN SD COV MEAN SD COV
Atlanta, GA 25 212.2 27.4 0.13 146.5 19.8 0.14 89%
Chicago, IL 23 327.1 34.8 0.11 193.8 20.4 0.11 79%
Houston, TX 21 192.5 26.8 0.14 142.9 21.2 0.15 81%
Los Angeles, CA 11 129.5 22.9 0.18 111.4 18.1 0.16 58%
Phoenix, AZ 28 228.7 30.5 0.13 157.6 22.4 0.14 89%
Seattle, WA 25 233.6 37.5 0.16 148.7 19.4 0.13 81%
Average 22.2 220.6 30 0.14 150.1 20.2 0.14 80%
The standard deviations noted above, when compared to the MMBtu ranges represented by the Home Energy Score’s 10 point scale (varying by climate), indicate that across all the locations, home types, and behavioral differences tested, the homeowner’s actual energy use will correspond to within one point of predicted energy use 80 percent of the time. In other words, in the tests conducted here, occupant behavior can have at least as big an impact on actual energy use in the home as asset uncertainty. The analysis shows that even if all other sources of inaccuracy are eliminated in an asset analysis, software predictions may vary considerably from measured source energy due to occupant variability relative to standard occupant assumptions. These simulations showed total source energy use differences of up to 36%.11
Figure 11 compares the results of the operational uncertainty analysis to the results from the analysis comparing the Scoring Tool’s estimates to actual energy use. The grey distribution shows the differences between the Scoring Tool’s predictions and actual energy uses. These differences are the result of all sources of uncertainty, including uncertainty in inputs related to the occupants, the asset, and the site. The overlaid blue distribution represents the predicted differences due to occupant variability relative to standard occupant assumptions.
12 As Figure
10
“Bin Size” refers to the range of MMBTUs represented by one point on the 10 point scale. This range varies depending on location, since the 10 point scale is adjusted for climate. However, for any individual 10 point scale associated with a climate, the bin size is equal for all points on the scale (2 thru 9), with the exception of 1 and 10. These end points represent the “tails” of potential energy performance, with the 10 stopping at zero energy use, and the 1 going to infinity. 11
The 36% value corresponds to two standard deviations in the Los Angeles climate and roughly bounds 95% of the differences. 12
A COV value of 0.14 was used generate occupant variability plot. To simplify the presentation, differences are shifted so the mean difference is zero for each distribution.

11 shows, occupant variability can explain a large amount of the differences, but does not explain all of the differences observed in the comparative analysis.
Figure 11. Predicted differences due to operational uncertainty overlaid on the differences between the Home Energy Scoring Tool’s predictions and actual energy uses13.
How much variability in predicted energy usage can be attributed to imprecise14 characterization of the home’s asset features?
Based on thousands of simulations using the Home Energy Scoring Tool, a reasonable15 amount of uncertainty regarding a home’s asset
13
Actual energy use and home characteristics were obtained from the National Renewable Energy Laboratory’s Field Data Repository 14
Imprecision here is defined as assessor measurement error as well as uncertainty about various home characteristics (e.g., wall insulation). 15
In both probability analyses, DOE worked with experts to define a reasonable range for varying each of the characteristics. Documentation concerning the ranges used for the operational analysis can be found in the NREL Report, “Assessment of the U.S. Department of Energy’s Home Energy Scoring Tool.” To set ranges for the asset

characteristics is likely to only have a minimal effect on the final Home Energy Score in most cases. In 90% of the simulations, the predicted score was within 1 point of what it should have been given the asset characteristics assigned to the home.
Simulations resulted in larger deviations in terms of predicted MMBtus in harsher climates. However, this larger range in energy estimates did not always correspond to a larger effect on the final Home Energy Score. Given the fact that there’s greater variability in energy use in harsh climates, the 10 point scales associated with these climates tend to have large bins – that is, the energy difference between 2 points on the 10 point scale is relatively larger in the harsher climates. As a result, a large absolute difference in estimated MMBtus will not have as great an impact on the final score as it would in a mild climate.
Similar to the Monte Carlo analysis that considered operational variability, DOE conducted a Monte Carlo probability analysis in which key asset inputs were varied. Only asset inputs required for the Home Energy Score were considered. DOE focused on those inputs that are typically more difficult to measure (e.g., wall insulation) or might be measured incorrectly (e.g., conditioned space) to address the known uncertainty that exists due to differences in subjective judgment by assessors. Box 2 lists the asset characteristics that were varied (using triangular probability distributions) for this analysis.
Simulations were run using the Home Energy Scoring Tool16 to assess the degree to which estimated energy use varies given uncertainty in key asset parameters. 500 simulations were run for 6 different climates and 3
parameters, DOE began by defining likely characteristics of 1930s, 1980s and 2005 homes, and then defined likely ranges given the initially selected values for each parameter. 16
Explain that a “proxy” version of the tool was used.
Box 2: Parameters Varied for Monte Carlo Asset Analysis
Year built
Stories above ground level
Interior floor-to-ceiling height
Conditioned floor area (all stories combined)
Direction faced by front of house
Air leakage rate
Presence of weather-stripping and/or caulking
Absorptance of exterior surface of the roof
Attic floor insulation
Foundation type (description)
Floor insulation
Wall R Value
Window Area
Type of heating system, Efficiency value
Type of cooling system, Efficiency value
Duct insulation
Duct sealing
Water heater fuel, Water heater Energy Factor
Floor Construction
Wall Construction
Attic/Ceiling Type

different vintages of home for a total of 9000 runs.
Table 5 shows how the range of predicted MMBtu, given uncertainty in asset parameters, translates into effect on the final Home Energy Score. In Seattle, varying asset characteristics had minimal impact in terms of affecting the final Home Energy Score. In fact, for 95% of these simulations, the Score stayed the same or changed by one point. Varying asset characteristics had the greatest impact on the Home Energy Score in Minneapolis, where 15% of the simulations resulted in a change of greater than 1 point on the Home Energy Score scale.
Table 5. Effect of Asset Uncertainty on Home Energy Score in Six Cities
Location Likelihood of Being Within 1 Point on the Home Energy Score Given
Asset Uncertainty
Minneapolis, MN 85% San Diego, CA
Tampa, FL Boston, MA Seattle, WA Golden, CO
88% 93% 91% 95% 91%
Average 90%
To what degree do climatic differences within the proposed 19 geographic zones affect the score?
Under the initial program design, each of the 19 geographic zones had a corresponding 10 point scale with energy levels defined for each point on the scale. Analysis showed that weather differences within each of the 19 zones are significant enough to skew scoring results. In fact, the scores of identical homes – with different weather but within one geographic zone -- could vary by several points.
As a result, the Department recognized the need to generate 10 point scales for more than 240 different weather stations across the U.S. This new approach is outlined in Section 3 of this paper.

For the pilot phase of the Home Energy Score program, the U.S. was divided into 19 climate zones. These zones corresponded to different geographic regions established by the Residential Energy Consumption Survey (RECS). Each of these zones was associated with its own 10 point scale to account for climatic differences. For example, a home in San Diego (RECS Climate Zone 19) could score a 10 by using less than 88 MBtu, while a home in Minneapolis (Climate Zone 5) could score a 10 by using less than 119 MBtu. While the 19 climate zones and associated 10 point scales accounted for major climatic differences in the U.S., DOE was uncertain whether these climate zones adequately addressed micro-climates.
To assess how varied climates within one zone might affect scores, DOE calculated energy estimates for 2 prototype homes using TMY217 climate data from more than 240 different locations. In some cases, identical homes within the same zone were expected to use significantly different amounts of energy due to differences in their weather. With the program’s 19 zone structure, two identical homes could therefore score differently due simply to weather variations.
To address this problem, DOE created a 10 point scale for each of the 240+ weather stations. This approach is discussed in Section 3 of this paper.
17
Typical meteorological year second edition is a climate data format representing typical conditions based on weather data collected from 1961 – 1990 for a specific location.

Section 3: Program Changes
DOE has made a number of improvements to the Home Energy Score program as a result of the pilot and research findings. The most significant changes are described below.
Updates to the Scoring Tool As a result of the pilot findings and the aforementioned analyses, DOE has incorporated a number of changes into the Scoring Tool. The typical operating conditions in the latest version of the Scoring Tool are based on the 2009 Residential Energy Consumption Survey (RECS). The primary changes are summarized below. A comprehensive documentation of the calculations used in the Scoring Tool can be found at https://sites.google.com/a/lbl.gov/hes-public/home-energy-scoring-tool.
The current version of the Scoring Tool uses new values for typical operating conditions for a number of home characteristics and usage. The following are some of the operating conditions that changed in the new version :
o Thermostat settings
o Water heater temperature set points
o Water heater energy factor
o Dishwasher loads, water use and energy use per cycle
o Clothes dryer energy use per load and number of loads per week
o Refrigerator vintage, size, and type
o Ceiling fan energy
Plug load calculations (lighting and appliances) are now based on home square footage rather than being fixed for all homes.
Occupancy (which affects water-heating energy use) is now based on a formula related to number of bedrooms rather than assumed to be 2 adults and 1 child for every home.
Recommendations and savings calculations have been improved so that they more fully take into account the current home’s conditions and other circumstances. The following are examples of the changes made:
o The tool has been fixed so it no longer recommends improvements that have already been implemented in the house. For example, if the home has an ENERGY STAR qualified furnace, the report will not recommend replacing the furnace. On the other hand, if the home has a 30 year old inefficient furnace,

the savings will be based on comparing it to a furnace that meets the minimum criteria for ENERGY STAR.
o Sheathing-type insulation is now only recommended at time of roof or siding replacement, rather than independently.
The user-selectable choices for certain data fields have been updated to more accurately reflect conditions of U.S. homes. The following are some examples of fields that changed:
o Reduced average ceiling height options to a maximum of 12 feet
o Changed lower limit on roof absorptance range to 0.1
o Added exterior sheathing types
o Added roof sheathing types Changes to 10 Point Scale When the first phase of implementation begins in 2012, homes will be scored based on newly established 10 point scales – one for each of 240+ weather stations. Previously, the Scoring Tool calculated energy load requirements based on the 240+ weather stations, but mapped homes to 19 different zones – each with only one 10 point scale. In the updated version of the Scoring Tool, a home is mapped to its local weather station not only to determine the energy load requirements but also to link it to a particular 10 point scale for that climate. To more accurately account for climate differences, DOE used the latest version of the Scoring Tool to estimate energy use for a wide range of homes in each of the 240+ weather station locations. DOE then established energy values for the 10 point scale in each location based on the following guidelines and objectives:
The amount of energy reduction needed to move one point up the scale is set as low as possible, while still allowing the vast majority of homes to score between 2 and 9 on the scale.
The value between each point on the scale is constant for any one weather station.
Homes with equivalent energy-related features score equally regardless of where they are located in the country.
The maximum and minimum energy cut-offs corresponding to 1 and 10 on the scale also reflect the different types of housing stock found in various parts of the country.
Updates to Assessor Information As a result of feedback from pilot Partners and assessors, DOE has incorporated a number of changes in the training, information, and testing for assessors.

The assessor training module now includes greater detail on how to calculate various inputs (e.g., conditioned floor space, window measurement).
The training module and supplemental materials for assessors contains more information about the intent of the Home Energy Score program and the meaning of the score.
Reference and explanatory information is now provided in each section of the Scoring Tool to assist assessors as they input data.
The assessor test has been updated to include questions concerning building science as well as the program and Scoring Tool.
Assessors are now required to “score” sample homes as part of the test.
Partner organizations will be encouraged to mentor assessors before they begin scoring homes.
Availability of Application Programming Interface (API) In Spring 2012, the Lawrence Berkeley National Laboratory began licensing an API for use of the Home Energy Scoring Tool with other software. The API allows a software developer to create an interface between their software program and the Scoring Tool. Qualified Assessors are able to use the Scoring Tool directly through the primary web interface or via another software tool that licenses the API. In the latter case, the assessor can enter data into the original software tool once and can avoid double entry of data into the Scoring Tool. Either way, the score and corresponding materials are equivalent and continue to be accessible only thru the internet.
DOE, working with NREL and LBNL, has developed guidelines for translating typically collected energy audit data into the 40 or so fields required by the Scoring Tool. DOE, with NREL, has also created a test to ensure that different software tools that use the API deliver the same results as direct use of the Home Energy Scoring Tool.
Another benefit of the API is that it reduces the need to rely on assessor judgment under certain circumstances. For example, rather than relying on an assessor to calculate a weighted average for heating efficiency in a home with multiple heating units, the software developer can have their program calculate the weighted average before supplying that number to the Scoring Tool via the API.
Updates to Homeowner Materials As a result of feedback from pilot Partners and homeowners, DOE improved the materials provided to homeowners.
The MBtu value has been removed from the score page and is now included on the Home Facts sheets accompanying the score.

The home’s estimated uses of electricity and specific fuels are now included in the Home Facts sheets. This information was previously not provided to the homeowner.
Partners can include their logo on the Score page.
Partners can customize information provided to better meet their needs and the interests of the customers. DOE plans to work with its Partners in 2012 to determine the specific types of customization that will be allowed.
The recommendations page no longer includes payback information; however, the recommendations are still ordered according to payback based on state average fuel prices and national average installation costs18.
Greenhouse gas information is no longer presented as a reduction in pounds of carbon associated with each improvement. Instead, the total reduction in greenhouse gases associated with the recommendations is converted into a “reduction in the home’s carbon footprint”.
The main score page now shows “10 year savings” instead of annual savings. Given that homeowners typically don’t move after one year, the longer-term savings more appropriately demonstrate benefits that will likely be achieved from improvements.
18
NREL’s National Residential Efficiency Measures Database

Conclusion
Our findings and refinements indicate that the Home Energy Score is now ready for the first phase of implementation. We have met our design goals by creating a reliable scoring method that can provide homeowners with easy to understand information about their home’s energy performance at an affordable cost.
As this paper indicates, DOE learned a tremendous amount from the pilot phase of the Home Energy Score program as well as the additional analysis undertaken in 2011. Findings have led to significant improvements in the scoring method, training, homeowner materials, and other components of the program.
Some of the recommendations from the pilots have not been completed yet but will be addressed during actual implementation of the program. As the Department progresses with the first phase of implementation of the program, it will be critical to work closely with our Home Energy Score Partners to ensure effective communication with assessors and homeowners. The program will need to maintain certain standardized methods, but at the same time be flexible enough to serve local contexts and audiences. While Partners will tailor their message to their specific audience, DOE plans to work with them to make sure that the information provided is clear, consistent, and in line with the overall objectives of the Home Energy Score program.
As the first phase of implementation begins, some Partners will choose to deliver the Home Energy Score as part of a broader energy efficiency effort. In these cases, DOE will work with its Partners to ensure that materials and information provided to consumers clearly explain the relationship between the score and other services provided. Other Partners may choose to provide the score without other energy-related services. DOE plans to work with these Partners to ensure information provided to consumers clearly notes that the score is not intended to take the place of a comprehensive energy audit.
The Home Energy Score provides a simple, transparent and low-cost method for communicating how much energy a home is likely to use under standardized conditions. It is one device that can help consumers understand that energy efficiency has value. As part of the first phase implementation, the Department will continue to evaluate the tool and overall program; improve program offerings; and, assess how effectively the score motivates homeowners, sellers, and buyers to invest in energy improvements and place a premium on more efficient homes.

Appendix A:
Fall 2013 Update: Measured vs. Actual Usage Data
After incorporating additional improvements into the Home Energy Score model and methodology, the Department requested that NREL rerun data available in its Field Data Repository through the Scoring Tool v.2013. Table 1A serves as an update to Table 2 shown in the body of this report. Scoring Tool v.2013 yielded similar results; however, the standard deviation has improved with the version of the tool, as did the percentage of homes where predicted energy use fell within 25% and 50% of measured energy use.
Table 1A. Statistical Summary of Difference Between Predicted and
Measured Source Energy Use (Predicted MBtu – Measured MBtu) Comparison of Home Energy Scoring Tool v.2012 and v.2013
Home Energy
Scoring Tool
(v. 2013)
Home Energy
Scoring Tool
(v. 2012)
Mean Predicted (MBtu) 191 196
Mean Measured (MBtu) 200 200
Mean Difference (MBtu) -8 -4
Median Difference (MBtu) -5 1
Standard Deviation of Difference (MBtu) 53 62
Percent of Homes < ± 25% Difference 66% 61%
Percent of Homes < ± 50% Difference 92% 88%

Figure 1A shows the change in the distribution of the predicted energy use from HEScore v.2012 to v.2013 both compared to the weather normalized utility bills.
Figure 1A Home Energy Scoring Tool predicted source energy use versus weather-normalized measured source energy use
Figure 2A shows the cumulative error distribution of both versions of Home Energy Score. Both follow
the same pattern but the new version tends to under predict ever so slightly more often, but when it
over predicts, it does so to a lesser extent.
Figure 2A Cumulative Error Distribution of Source Energy Predictions
n=821

Figure 3A shows the change in energy predictions from Home Energy Score v.2013 over v.2012 relative
to each other. The new version tends to predict slightly lower energy use overall, but very close to the
original.
Figure 3A Home Energy Score v.2012 and v.2013 source energy predictions.
Note that these results are from a pre-release version of Home Energy Score v.2013. The final version,
while similar, may produce slightly differing results. This report will be updated to reflect final version.