Embed Size (px)
Citation preview

7/21/2019 Home Node B Output Power
http://slidepdf.com/reader/full/home-node-b-output-power 1/8
3GPP TSG-RAN Working Group 4 (Radio) meeting #43bis R4-070969Orlando, USA, 25th – 29th June, 2007
Agenda Item: 7.3
Source: Ericsson
Title: Home Node B output power
Document for: Discussion
1 Introduction
The radio requirements for Home Node B (HNB) are currently being specified within 3GPP RAN WG4.
One of the issues is the maximum output power of the HNB.
This paper discusses the issue about HNB output power and the trade-off between HNB downlinkcoverage and the downlink interference towards co-existing mobiles, which are not allowed to connect to
the HNB.
The assumed scenario is described in Figure 1. No specific geographical locations, in terms of (x,y,z)
coordinates, within the macro cell are studied, but the impact of macro cell is taken into account with thehelp of two parameters: macro cell RSSI and P-CPICH Ec/N0 at the location of the home cell, but withzero HNB output power.
vUE
hUE
Macro RSSI
Best P-CPICH Ec/N0
Home NB
coverage
area
Macro cell
dead zone
Figure 1. Assumed scenario.
The results shown in this paper are not based on specific system simulations, but are obtained with the use
of well-known WCDMA equations.
7/21/2019 Home Node B Output Power
http://slidepdf.com/reader/full/home-node-b-output-power 2/8
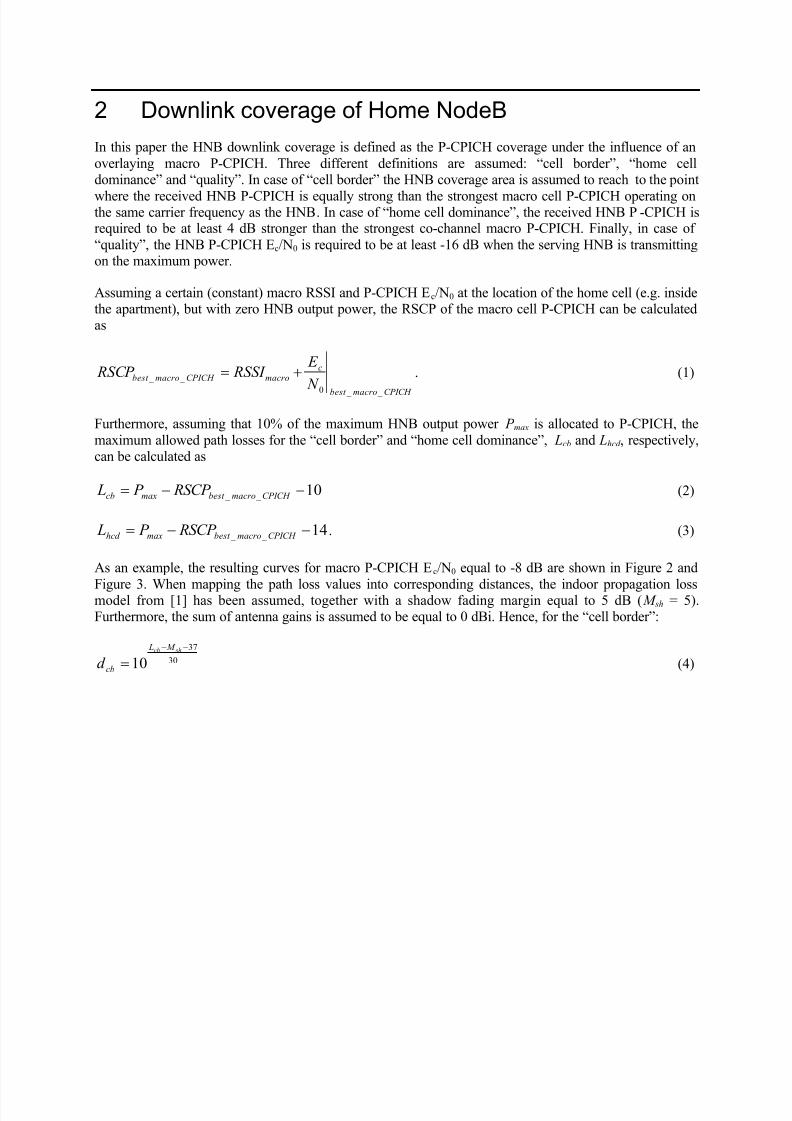
2 Downlink coverage of Home NodeB
In this paper the HNB downlink coverage is defined as the P-CPICH coverage under the influence of an
overlaying macro P-CPICH. Three different definitions are assumed: “cell border”, “home celldominance” and “quality”. In case of “cell border” the HNB coverage area is assumed to reach to the point
where the received HNB P-CPICH is equally strong than the strongest macro cell P-CPICH operating onthe same carrier frequency as the HNB. In case of “home cell dominance”, the received HNB P-CPICH isrequired to be at least 4 dB stronger than the strongest co-channel macro P-CPICH. Finally, in case of
“quality”, the HNB P-CPICH Ec/N0 is required to be at least -16 dB when the serving HNB is transmittingon the maximum power.
Assuming a certain (constant) macro RSSI and P-CPICH Ec/N0 at the location of the home cell (e.g. insidethe apartment), but with zero HNB output power, the RSCP of the macro cell P-CPICH can be calculatedas
CPICH macrobest
c
macroCPICH macrobest N
E RSSI RSCP
_ _ 0
_ _ . (1)
Furthermore, assuming that 10% of the maximum HNB output power P max is allocated to P-CPICH, the
maximum allowed path losses for the “cell border” and “home cell dominance”, Lcb and Lhcd , respectively,can be calculated as
10 _ _ CPICH macrobest maxcb RSCP P L (2)
14 _ _ CPICH macrobest maxhcd RSCP P L . (3)
As an example, the resulting curves for macro P-CPICH Ec/N0 equal to -8 dB are shown in Figure 2 and
Figure 3. When mapping the path loss values into corresponding distances, the indoor propagation lossmodel from [1] has been assumed, together with a shadow fading margin equal to 5 dB ( M sh = 5).Furthermore, the sum of antenna gains is assumed to be equal to 0 dBi. Hence, for the “cell border”:
30
37
10
shcb M L
cbd (4)

7/21/2019 Home Node B Output Power
http://slidepdf.com/reader/full/home-node-b-output-power 3/8
7/21/2019 Home Node B Output Power
http://slidepdf.com/reader/full/home-node-b-output-power 4/8
11.0
log10
0
10
HNB
cUE
UE macro
maxq
N
E N
ACIR
N RSSI
P L . (6)
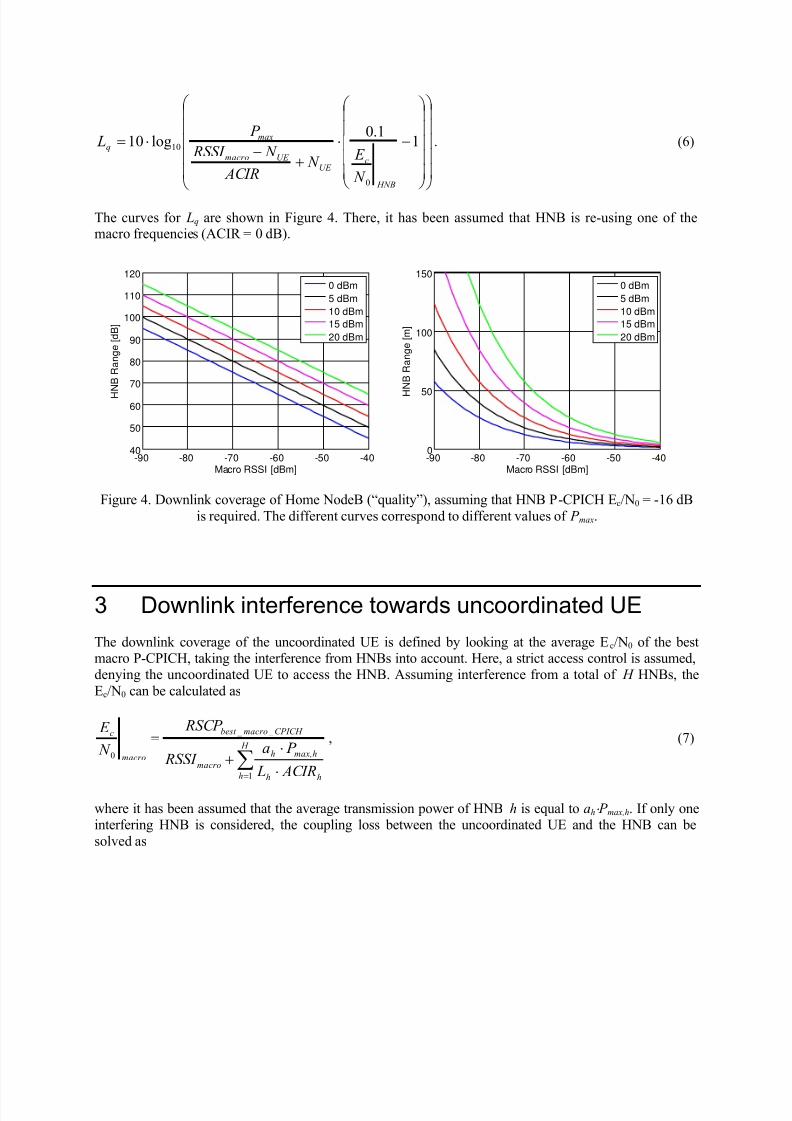
The curves for Lq are shown in Figure 4. There, it has been assumed that HNB is re-using one of themacro frequencies (ACIR = 0 dB).
-90 -80 -70 -60 -50 -4040
50
60
70
80
90
100
110
120
Macro RSSI [dBm]
H N B R a n g e [ d B ]
0 dBm
5 dBm
10 dBm
15 dBm
20 dBm
-90 -80 -70 -60 -50 -400
50
100
150
Macro RSSI [dBm]
H
N B R a n g e [ m ]
0 dBm
5 dBm
10 dBm
15 dBm
20 dBm
Figure 4. Downlink coverage of Home NodeB (“quality”), assuming that HNB P-CPICH Ec/N0 = -16 dB
is required. The different curves correspond to different values of P max.
3 Downlink interference towards uncoordinated UE
The downlink coverage of the uncoordinated UE is defined by looking at the average Ec/N0 of the bestmacro P-CPICH, taking the interference from HNBs into account. Here, a strict access control is assumed,denying the uncoordinated UE to access the HNB. Assuming interference from a total of H HNBs, the
Ec/N0 can be calculated as
H
h hh
max,hh
macro
CPICH macrobest
macro
c
ACIR L
P a RSSI
RSCP
N
E
1
_ _
0
, (7)
where it has been assumed that the average transmission power of HNB h is equal to ah P max,h. If only oneinterfering HNB is considered, the coupling loss between the uncoordinated UE and the HNB can be
solved as

7/21/2019 Home Node B Output Power
http://slidepdf.com/reader/full/home-node-b-output-power 5/8
macro
macro
c
CPICH macrobest
max
h
RSSI
N
E
RSCP ACIR
P a
L
0
_ _
10log10 . (8)
Assuming that the average Ec/N0 should be at least -16 dB and that a = 0.3, the curves in Figure 5 ( P max =10 dBm) and Figure 6 ( P max = 20 dBm) can be obtained. The solid lines represent the situation for theuncoordinated co-channel mobiles (ACIR = 0 dB) while the dashed lines represent the situation for the
uncoordinated adjacent channel mobiles (ACIR = 33 dB). The different colors represent different macroP-CPICH Ec/N0 values without the HNB.
-90 -80 -70 -60 -50 -400
20
40
60
80
100
Macro RSSI [dBm]
D e a d Z o n e [ d B ]
HNB max power 10 dBm. HNB power usage 30%
-6 dB
-8 dB
-11 dB
-90 -80 -70 -60 -50 -400
10
20
30
40
50
Macro RSSI [dBm]
D e a d Z o n e [ m ]
HNB max power 10 dBm. HNB power usage 30%
-6 dB
-8 dB
-11 dB
Figure 5. Size of macro cell dead zone with HNB P max = 10 dBm.

7/21/2019 Home Node B Output Power
http://slidepdf.com/reader/full/home-node-b-output-power 6/8
-90 -80 -70 -60 -50 -400
20
40
60
80
100
120
Macro RSSI [dBm]
D e a d Z o
n e [ d B ]
HNB max power 20 dBm. HNB power usage 30%
-6 dB
-8 dB
-11 dB
-90 -80 -70 -60 -50 -400
20
40
60
80
100
Macro RSSI [dBm]
D e a d Z o n e [ m ]
HNB max power 20 dBm. HNB power usage 30%
-6 dB
-8 dB
-11 dB
Figure 6. Size of macro cell dead zone with HNB P max = 20 dBm.
4 Coverage vs interference tradeoff
Assuming access control, the downlink dead zone for uncoordinated co-channel mobiles cannot beavoided with any reasonable P max settings. However, the dead zone for any uncoordinated adjacent
channel mobiles should be kept at minimum in order to secure as good macro cell coverage as possiblewithin the location of the home cell. Furthermore, any unnecessary interference towards neighboringapartments and close-by outdoor areas should be avoided also. This can be done for example by adjusting
the P max based on the estimated macro cell interference. The downside is that by limiting the P max, also thehome cell coverage is reduced. This tradeoff is further discussed in this chapter.
Assuming that Lh is limited to 40 dB (ACIR = 33 dB) and that P max ≤ 20 dBm, the maximum allowed P max
levels are shown in Figure 7. Again, the different colors represent different macro P-CPICH Ec/N0 valueswithout the HNB.
-90 -80 -70 -60 -50 -40-10
-5
0
5
10
15
20
25
Macro RSSI [dBm]
M a
x i m u m H
N B p o w e r [ d B m ]
Allowed size of dead zone = 40 dB
-6 dB
-8 dB
-11 dB
Figure 7. Maximum allowed HNB P max so that the macro cell dead zone for adjacent channel mobiles does
not exceed 40 dB.

7/21/2019 Home Node B Output Power
http://slidepdf.com/reader/full/home-node-b-output-power 7/8
Given the P max in Figure 7, the corresponding HNB downlink coverage can be obtained following themethodology described in chapter 2. The results are shown in Figure 8 and 9. The maximum range for 1
Mbps data rate is calculated assuming a required geometry of -2 dB, a channel with 90% orthogonalityand that 80% of the HNB power is allocated to HS-DSCH and HS-SCCH.
-90 -80 -70 -60 -50 -400
5
10
15
20
Macro RSSI [dBm]
H N B r a n g e [ m ]
Dominance. Allowed size of dead zone = 40 dB
-6 dB
-8 dB
-11 dB
-90 -80 -70 -60 -50 -400
5
10
15
20
25
Macro RSSI [dBm]
H N B r a n g e [ m ]
Border. Allowed size of dead zone = 40 dB
-6 dB
-8 dB
-11 dB
Figure 8. Size of HNB coverage area (“dominance” and “cell border”).
-90 -80 -70 -60 -50 -400
10
20
30
40
50
Macro RSSI [dBm]
H N B r a n g e
[ m ]
Coverage. Allowed size of dead zone = 40 dB
-6 dB
-8 dB
-11 dB
-90 -80 -70 -60 -50 -400
5
10
15
20
25
30
35
40
Macro RSSI [dBm]
H N B r a n g e
[ m ]
1 Mbps. Allowed size of dead zone = 40 dB
-6 dB
-8 dB
-11 dB
Figure 9. Size of HNB coverage area (“quality” and “1 Mbps”).
As the results in Figure 8 and Figure 9 suggest, the size of the obtained HNB downlink coverage area isacceptable, unless the HNB is placed very close to the macro site, with RSSI macro levels equal to -45 dBmor even more. However, it is very likely that only a marginal part of the indoor areas will in reality
experience such high levels of RSSI macro.
7/21/2019 Home Node B Output Power
http://slidepdf.com/reader/full/home-node-b-output-power 8/8
5 Conclusions
This paper has discussed the topic of maximum Home NodeB output power. As shown, it is difficult or
even impossible to find a single P max value that would be suitable for all thinkable HNB deploymentscenarios under an overlaying macro cell. Selecting a P max will always be a trade-off between the size of
the HNB coverage area and the size of the macro cell dead zone.
At locations close to a co-channel macro site, a large P max is required to obtain a sufficient HNB coveragearea. Fortunately, the close-by (e.g. neighboring) co-channel mobiles and the visiting adjacent channel
mobiles (belonging to the same operator) will in most of the cases be close to their serving base station,and can therefore tolerate the interference caused by the high P max. The situation is the opposite, when the
HNB is located far away from the macro site. Due to the low level of co-channel macro interference, evena low P max is enough to provide the sufficient HNB coverage. At the same time, the visiting or close-bymobiles will not be able to tolerate too much additional downlink interference, which also suggests the use
of a low P max.
This paper has considered the performance of a HNB with P max ≤ 20 dBm. As the results suggest, the size
of the obtained coverage area is acceptable, unless the HNB is placed very close to the macro site, with RSSI macro levels equal to -45 dBm or even more. However, it is very likely that only a marginal part of theindoor areas will in reality experience such high levels of RSSI macro.
6 References
[1] 3GPP TR 25.951, “FDD Base Station (BS) classification”, v6.3.0 .


![· Ficbot Position:cml g 12 Fig. 12. Winner Node Number and Output of Each Node in Experimental Environment E Lic. 10 (2[sec)) Critic (0.8[sec]) Lit](https://img.pdfslide.net/doc/110x75/5c627e2109d3f293108b8536/-ficbot-positioncml-g-12-fig-12-winner-node-number-and-output-of-each-node.jpg)


![IBM System Storage - IBM - United States Parameters Node A (top node) Node B (bottom node) Filer location Enter the root directory for HTTP files [/vol/vol0/home/http] Do you want](https://img.pdfslide.net/doc/110x75/5acb22947f8b9a7d548e6b1e/ibm-system-storage-ibm-united-states-parameters-node-a-top-node-node-b-bottom.jpg)