Embed Size (px)
Citation preview

有關本刊物的查詢,請聯絡:政府統計處 綜合統計組(一)乙
地址:中國香港灣仔港灣道十二號灣仔政府大樓十九樓電話: (852) 2582 4738 圖文傳真: (852) 2827 1708
Enquiries about this publication can be directed to :General Statistics Section (1) B
Census and Statistics DepartmentAddress: 19/F, Wanchai Tower, 12 Harbour Road, Wan Chai, Hong Kong, China.
Tel. : (852) 2582 4738 Fax : (852) 2827 1708E-mail : [email protected]
政府統計處網站 Website of the Census and Statistics Departmenthttp://www.info.gov.hk/censtatd/
香港統計月刊Hong Kong
Monthly Digest of Statistics
二零零三年六月June 2003


香港統計月刊 二零零三年六月 iii Hong Kong Monthly Digest of Statistics June 2003
目錄 Contents頁數
Page
緒言 Introduction iv
主要統計項目的最新數字 Key Statistics Update vii
統計表一覽 List of Statistical Tables xi
統計圖一覽 List of Charts xvi
統計表及統計圖 Statistical Tables and Charts1. 人口及生命事件 1. Population and Vital Events 12. 勞工 2. Labour 7
� 勞動人口、就業及空缺 � Labour Force, Employment and Vacancies� 薪金及工資 � Payroll and Wage� 職業傷亡及停工 � Occupational Injuries and Work Stoppage
3. 對外貿易 3. External Trade 41� 商品貿易 � Merchandise Trade� 服務貿易 � Trade in Services
4. 工業生產 4. Industrial Production 635. 土地、房屋、樓宇、建造 5. Land, Housing, Building and Construction 716. 運輸、通訊、旅遊 6. Transport, Communications and Tourism 957. 政府收支、貨幣、金融 7. Public Accounts, Money and Finance 1238. 物價 8. Prices 1539. 商業 9. Commerce 163
10. 社會狀況 10. Social Conditions 17511. 能源 11. Energy 19112. 國民收入及國際收支平衡 12. National Income and Balance of Payments 19513. 雜項統計 13. Miscellaneous Statistics 221
專題文章 Feature Articles二零零二年按區議會分區劃分的香港人口概況剖析 A Profile of Hong Kong Population Analysed by District
Council District, 2002FA1
香港的資訊科技及電訊業 The Information Technology and TelecommunicationsSector in Hong Kong
FB1
香港服務貿易的發展 Development of Trade in Services of Hong Kong FC1二零零三年一月至六月刊載的專題文章目錄 (二零
零二年間刊載的專題文章題目列於書背。)
List of Feature Articles Published during January to June2003 (A list of the titles of feature articles published in 2002 is on theback cover page.)
FL1
附錄 Annex
二零零三年七月至十月政府統計處定期性統計數
發布日期一覽表
Schedule for Issuing Regular Releases of Statistical Databy the Census and Statistics Department, July – October2003
A1
政府統計處刊物及唯讀光碟產品一覽(截至二零零
三年六月一日)
List of Publications and CD-ROM Products of the Censusand Statistics Department (as at 1.6.2003)
A5
郵購表格(政府統計處刊物) Mail Order Form (Publications of the Census andStatistics Department)
A11
訂閱表格(香港統計月刊) Subscription Form (Hong Kong Monthly Digest ofStatistics)
A13

香港統計月刊 二零零三年六月 iv Hong Kong Monthly Digest of Statistics June 2003
緒言 Introduction
《香港統計月刊》是政府統計處編製的綜合性
統計刊物之一,其他綜合性統計刊物包括《香
港經濟趨勢》(半月刊)、《香港統計年刊》
和《香港社會及經濟趨勢》(雙年刊)。這些
綜合性統計刊物輯錄香港社會及經濟各方面的
統計資料,提供範圍十分廣泛的數據,涉及社
會、經濟和工商業各主題。它們各具特色,出
版頻次、所載數列的統計期、詳細程度及形式
有所不同,相輔相成,組成一個全面的參考系
列。
The Hong Kong Monthly Digest of Statistics is one ofthe general statistical digests compiled by the Censusand Statistics Department. Other digests include HongKong Economic Trends (half-monthly), Hong KongAnnual Digest of Statistics and Hong Kong Social andEconomic Trends (biennial). Each digest bringstogether statistical data covering various social andeconomic aspects of Hong Kong. Statistical datacontained cover a very wide range of topics relating tosociety, the economy and businesses. The digests areeach featured in its own way. They are published atdifferent frequencies with statistical data seriespresented in various length, depth and format.Complementing each other, together they form acomprehensive series for reference.
《香港統計月刊》分為13節,載有超過130個統計表,匯集各種官方統計數字。月刊收錄本
港各項最新社會及經濟統計數列,並盡可能將
資料齊備的最近十五個月份的按月或按季統計
數字,連最近三個完整年份的按年統計數字一
同刊載。此外,本月刊亦載有超過20個統計
圖,展示選定主要統計項目在過去十年的按年
趨勢及最近兩年的按月或按季趨勢。
The Hong Kong Monthly Digest of Statistics is acompact volume of official statistics containing over130 tables in 13 sections. It collects up-to-datestatistical series on various aspects of the social andeconomic situation of Hong Kong. Statistics arepresented wherever possible in the form of monthly orquarterly figures for the latest 15 months for whichdata are available, together with annual figures for thelatest three complete years. For selected key statisticalitems, over 20 charts depicting the annual trend in thepast decade and quarterly or monthly trend in therecent two years are also available.
由於月刊輯錄需時,政府統計處每半月出版
《香港經濟趨勢》,列載主要經濟指標最新按
月、按季資料,讓讀者在其他詳盡數據尚未齊
備前,盡快掌握香港的經濟脈搏。
Since collation of data for this Monthly Digest takestime, the Census and Statistics Department compilesthe Hong Kong Economic Trends on a half-monthlybasis. This publication presents up-to-date monthlyand quarterly data of major economic indicators whichhelp readers grasp the pulse of Hong Kong’s economybefore more detailed statistics become available.
若需要較詳細的社會及經濟統計資料或較遠年
份的按年數據,則可參考《香港統計年刊》。
當中所載大部分數據是以七個年份的時間數列
發表,而數列跨越的年期為十年。至於《香港
社會及經濟趨勢》,則旨在選錄與社會及經濟
各方面有關的主要按年統計數列並加以分析。
除載有統計圖表外,兼有短評闡釋,讓讀者綜
觀香港過去十年的社會及經濟趨勢。這本刊物
為雙年刊,於單數年份出版。
In case users require more detailed social andeconomic data or more back-dated annual data, theyshould refer to the Hong Kong Annual Digest ofStatistics. Most of the data are presented for sevenyears, spanning a period of ten years. As regards theHong Kong Social and Economic Trends, thispublication aims to present selected major annual dataseries relating to various social and economic aspectsof Hong Kong for analysis. With the use of tables andcharts, plus commentaries, this publication is meant togive readers an overall view of Hong Kong’s socialand economic trends in the past decade. It is publishedbiennially in odd-numbered years.

香港統計月刊 二零零三年六月 v Hong Kong Monthly Digest of Statistics June 2003
本月刊內統計資料範圍和性質的說明,以及各
用語的定義,均載於每節的「概念及方法」部
分內。而每節亦列出與所述課題有關的主題性
報告供讀者作進一步參考。
Description of the scope and nature of the statisticaldata and definitions of the terms used in this MonthlyDigest are provided in the 'Concepts and Methods' partin each section. Further references to thematic reportsrelating to the topics covered in each section are alsolisted.
除載列最新的統計數字外,本月刊每期也刊登
數篇專題文章,主要作用是 (i) 進行更深入的
分析,以補充定期出版的統計報告,(ii) 摘錄
特別出版的專題統計報告主要結果,(iii) 提供
一個詳盡闡釋相關統計方法的機會,或發布一
些未能以其他方式公布的統計數字,以及(iv)用統計角度陳述大眾關注的課題。
Apart from providing up-to-date statistics, this MonthlyDigest also contains several feature articles in eachissue. These articles mainly serve to (i) supplementroutine statistical reports by providing more in-depthanalysis, (ii) provide a synopsis of ad hoc statisticalreports, (iii) provide a forum for elaboration of relevantmethodological details or for release of statistics whichmay not be published elsewhere, and (iv) present topicsof current interest in a statistical perspective.
本月刊所載統計數據是由政府統計處及其他政
府部門和機構編製。政府統計處承蒙有關部門
和機構提供資料,深表謝意。資料來源刊載在
統計表下。
Statistical data contained in this Monthly Digest arecompiled by the Census and Statistics Department andby other government departments and organizations.The Census and Statistics Department gratefullyacknowledges such contributions. Data sources aregiven under each table.
除非另有註明外,每節的「其他有關刊物」所
述的刊物是由政府統計處編製。本刊末載有政
府統計處刊物及唯讀光碟產品一覽表和郵購表
格。
Unless otherwise specified, the publications in 'FurtherReferences' of each section are produced by the Censusand Statistics Department. A list of publications andCD-ROM products of the Census and StatisticsDepartment and a mail order form are available at theend of this publication.
選定章節供網上購買 Selected Sections for Purchase Online由二零零三年五月號起,本月刊的選定章節已
於網上有售。為滿足個別讀者對選定主題的統
計數字的需要,本刊的13節內容已組合為四個
章節 : (i) 人口、勞工及社會統計,(ii) 對外貿
易、工商業及能源統計,(iii) 房屋、運輸、通
訊及旅遊統計,及(iv) 貨幣、金融、國民收
入、國際收支平衡及物價統計。此外,每期所
載專題文章亦自組成一個獨立章節。這五個選
定章節目前只提供下載版,並於本刊的出版當
日在網上「香港統計數據書店」 (網址 :http://www.statisticalbookstore.gov.hk) 同 時 發
售。
As from the May 2003 issue, selected sections of thisMonthly Digest are available for purchase online. Inorder to better meet the needs of readers who areinterested in official statistics of specific subject areas,the 13 sections of this Digest are grouped into foursections : (i) Population, Labour and Social Statistics,(ii) External Trade, Commerce and Industry and EnergyStatistics, (iii) Housing, Transport, Communications andTourism Statistics, and (iv) Money and Finance,National Income, Balance of Payments and PriceStatistics. Besides, feature articles in each issue are alsogrouped to form one separate section. All the fiveselected sections are currently available in softcopy onlyand can be purchased at the online “StatisticalBookstore, Hong Kong” (Address :http://www.statisticalbookstore.gov.hk) on the same daywhen this Digest is released.

香港統計月刊 二零零三年六月 vi Hong Kong Monthly Digest of Statistics June 2003
代號 Symbols月刊內各代號的含意如下: The following symbols are used throughout the Digest:Q1, Q2, Q3, Q4#@*-N.A.
第一、第二、第三、第四季
臨時數字
數字在日後會作出修訂
修訂數字
不適用
沒有數字
Q1, Q2, Q3, Q4#@*-N.A.
First, second, third, fourth quarterProvisional figuresFigures are subject to revision later onRevised figuresNot applicableNot available
計量單位 Units of Measurement1 兆焦耳 = 2.778 x 10⁵ 千瓦小時
= 9.478 x 10³ 撒姆
1 公噸 = 2 204.623 磅
= 0.984 噸
1 公斤 = 2.205 磅
= 1.653 斤
1 平方米 = 10.764 平方呎
1 立方米 = 219.969 英加侖
1 百帕斯卡 = 211.00 毫巴
每小時 1 公里 = 0 00.540 浬
1 terajoule (TJ) = 2.778 x 10⁵ kilowatt hours= 9.478 x 10³ therms
1 tonne (t) = 2 204.623 pounds= 0.984 ton
1 kilogram (kg) = 2.205 pounds= 1.653 catties
1 square metre (sq.m.) = 0 010.764 square feet1 cubic metre (cu.m.) = 0 219.969 imperial gallons1 hectopascal = 0 001.000.00 millibar1 km/h = 0 000.540 knot
貨幣數字 Monetary Figures月刊內所有引述的貨幣數字,除特別聲明以
外,均為港元。港元是香港特別行政區的法定
貨幣。
All monetary figures quoted are in Hong Kong dollarsunless otherwise specified. Hong Kong dollar is thelegal tender in the Hong Kong Special AdministrativeRegion.
匯率 Exchange Rate自一九八三年十月十七日起,政府透過一項有
關發行紙幣的措施,將港元與美元聯繫,由發
鈔銀行以 7.8 港元兌 1 美元的固定匯率發行紙
幣。自此,港元兌美元的匯率在外匯市場僅有
窄幅變動。有關匯率的統計數字載於第七節。
As from 17 October 1983 the Hong Kong dollar hasbeen linked to the US dollar through an arrangement inthe note issuing mechanism permitting note issuingbanks to issue Hong Kong dollar notes at a fixed rateof HK$7.80=US$1.00. Since then, the exchange rateof Hong Kong dollar against the US dollar in theforeign exchange market has moved only within anarrow range. Statistics on exchange rates arepresented in Section 7.
數字的捨入 Rounding of Figures由於四捨五入關係,統計表內個別項目的數字
加起來可能與總數略有出入。
There may be a slight discrepancy between the sum ofindividual items and the total as shown in the tablesowing to rounding.

主要統計項目的最新數字
Key Statistics Update
香港統計月刊 二零零三年六月 Hong Kong Monthly Digest of Statistics June 2003vii
人口 Population 生命事件 Vital Events 勞工 Labour
二零零二年年底人口#
Population as at End-2002#
6 815 800
與二零零一年年底比較#
Compared with End-2001#
+0.8%
出生、死亡及婚姻Births, Deaths and Marriages
二零零三年五月May 2003
出生 Births 3 837死亡 Deaths 3 219婚姻 Marriages 2 824
與二零零二年五月比較Compared with May 2002
出生 Births +0.8%死亡 Deaths +11.5%婚姻 Marriages +13.2%
失業率及就業不足率
Unemployment andUnderemployment Rates
二零零三年二月至四月#February - April 2003#
經季節性調整的失業率 7.8%Seasonally AdjustedUnemployment Rate
就業不足率 3.2%Underemployment Rate
表 Table : 1.1 表 Table : 1.4 表 Table : 2.1
就業 Employment 就業 Employment 就業 Employment
製造業就業人數
Persons Engaged inManufacturing Sector
二零零二年十二月
December 2002184 503
與二零零一年十二月比較
Compared with December 2001-9.1%
與二零零二年九月比較
Compared with September 2002-2.4%@§
批發、零售、進出口貿易、
飲食及酒店業就業人數
Persons Engaged in Wholesale,Retail and Import/Export Trades, Restaurants and Hotels Sector
二零零二年十二月
December 2002982 957
與二零零一年十二月比較
Compared with December 2001-1.4%
與二零零二年九月比較
Compared with September 2002-0.3%@§
運輸、倉庫及
通訊業就業人數
Persons Engaged inTransport, Storage andCommunications Sector
二零零二年十二月
December 2002175 693
與二零零一年十二月比較
Compared with December 2001-3.3%
與二零零二年九月比較
Compared with September 2002-2.6%
表 Tables : 2.5, 2.8 表 Tables : 2.5, 2.8 表 Table : 2.5
就業 Employment 工資 WagesExternal
對外商品貿易 Merchandise Trade
金融、保險、地產及商用服務業就業人數
Persons Engaged in Financing,Insurance, Real Estate and
Business Services Sector
二零零二年十二月
December 2002441 305
與二零零一年十二月比較
Compared with December 2001+1.7%
與二零零二年九月比較
Compared with September 2002+3.8%@§
名義工資指數
Nominal Wage Index
二零零二年十二月
December 2002
與二零零一年十二月比較
Compared with December 2001
-0.8%
進口貨值(百萬元)
Imports ($ million)
二零零三年四月
April 2003141,302
與二零零二年四月比較
Compared with April 2002+8.4%
截至二零零三年四月止的三個月
與對上三個月比較的變動
Change of the 3-month period endingApril 2003
over the preceding 3-month period+0.9%§
表 Tables : 2.5, 2.8 表 Table : 2.12 表 Tables : 3.1, 3.12
§ 計算自經季節性調整後的數字。 § Compiled based on the seasonally adjusted figures.

主要統計項目的最新數字
Key Statistics Update
香港統計月刊 二零零三年六月 Hong Kong Monthly Digest of Statistics June 2003viii
External對外商品貿易 Merchandise Trade
External對外商品貿易 Merchandise Trade
External對外商品貿易 Merchandise Trade
整體出口貨值(百萬元)
Total Exports ($ million)
二零零三年四月
April 2003134,146
與二零零二年四月比較
Compared with April 2002+9.0%
截至二零零三年四月止的三個月
與對上三個月比較的變動
Change of the 3-month period endingApril 2003
over the preceding 3-month period+0.9%§
轉口貨值(百萬元)
Re-exports ($ million)
二零零三年四月
April 2003125,732
與二零零二年四月比較
Compared with April 2002+11.3%
截至二零零三年四月止的三個月
與對上三個月比較的變動
Change of the 3-month period endingApril 2003
over the preceding 3-month period+1.5%§
港產品出口貨值(百萬元)
Domestic Exports ($ million)
二零零三年四月
April 20038,414
與二零零二年四月比較
Compared with April 2002-16.9%
截至二零零三年四月止的三個月
與對上三個月比較的變動
Change of the 3-month period endingApril 2003
over the preceding 3-month period-6.6%§
表 Tables : 3.1, 3.12 表 Tables : 3.1, 3.12 表 Tables : 3.1, 3.12
工業生產 Industrial Production 樓宇 Building 物業 Property
工業生產指數
Index of IndustrialProduction
二零零二年第四季#Fourth Quarter 2002#
與二零零一年第四季比較#Compared with fourth quarter 2001#
-9.2%
與二零零二年第三季比較#Compared with third quarter 2002#
-3.8%§
所有居住單位
All Residential Flats
二零零三年第一季
First Quarter 2003
新落成 6 990Newly completed與二零零二年第四季比較 -11 673Compared with fourth quarter 2002
獲批准動工興建 12 351With consent to commence work與二零零二年第四季比較 +6 058Compared with fourth quarter 2002
樓宇售價指數Property Price Indices
二零零三年三月#
March 2003#
與二零零二年三月比較#
Compared with March 2002#
私人住宅 -18.3%Private Domestic
私人寫字樓 -14.3%Private Office
表 Tables : 4.2, 4.3 表 Tables : 5.6-5.7 表 Table : 5.9
物業 Property 建造 Construction 運輸 Transport
租金指數Rental Indices
二零零三年三月#
March 2003#
與二零零二年三月比較#
Compared with March 2002#
私人住宅 -12.9%Private Domestic
私人寫字樓 -10.2%Private Office
建造工程完成名義總值(百萬元)
Construction Output,in Nominal Terms ($ million)
二零零二年第四季#
Fourth Quarter 2002#25,457
與二零零一年第四季比較#Compared with fourth quarter 2001#
-16.6%
與二零零二年第三季比較#
Compared with third quarter 2002#
-7.2%§
進出香港貨運車輛Inward and Outward
Movements ofGoods Vehicles
二零零三年四月
April 2003
813 130
與二零零三年三月比較
Compared with March 2003
-27 323
表 Tables : 5.11, 5.12 表 Table : 5.14 表 Table : 6.1
§ 計算自經季節性調整後的數字。 § Compiled based on the seasonally adjusted figures.

主要統計項目的最新數字
Key Statistics Update
香港統計月刊 二零零三年六月 ix Hong Kong Monthly Digest of Statistics June 2003
運輸 Transport 旅遊 Tourism 電訊 Telecommunications
空運貨物吞吐量(千公噸)Air Cargo Throughput
('000 tonnes)二零零三年四月# 203April 2003#
與二零零二年四月比較# +3.0%Compared with April 2002#
港口貨櫃吞吐量(千個標準貨櫃單位)
Port's Container Throughput('000 TEUs)
二零零三年二月 1 261February 2003與二零零二年二月比較 +9.8%Compared with February 2002
訪港旅客Visitor Arrivals
二零零三年四月
April 2003
493 666
與二零零三年三月比較
Compared with March 2003
-853 720
公共流動無線電話用戶系統(不包括儲值智能咭)
Public Mobile Radio-telephoneSubscriber Units
(Excluding Pre-paid SIM Cards)
二零零三年三月
March 2003
4 194 633
與二零零三年二月比較
Compared with February 2003
+2 540
表 Tables : 6.2, 6.3 表 Table : 6.11 表 Table : 6.15
貨幣 Money 利率 Interest Rate 外幣兌換 Exchange Rate
貨幣供應 M3(百萬元)Money Supply M3 ($ million)
二零零三年第一季末@End of First Quarter 2003@
3,547,201
與二零零二年第一季末比較
Compared with end offirst quarter 2002
+1.9%
最優惠貸款利率Best Lending Rate
二零零三年五月
May 2003
5.00%
港匯指數(貿易總值(進口及整體出口)加權)
Effective Exchange Rate Indexfor HK Dollar (Trade(import
and export) - weighted)
二零零三年五月
May 2003
100.7
與二零零三年四月比較
Compared with April 2003
-1.2%
表 Table : 7.1 表 Table : 7.9 表 Table : 7.12
證券交易 Securities 資產 Assets 物價 Prices
恒生指數Hang Seng Index
二零零三年五月 9 487May 2003與二零零三年四月比較 +770Compared with April 2003
主板成交金額(百萬元)
Main Board Turnover($ million)
二零零三年五月 159,048May 2003與二零零三年四月比較 +14,774Compared with April 2003
外匯儲備資產(百萬美元)Foreign Currency Reserve Assets
(US$ million)
二零零三年第一季
First Quarter 2003
113,565
與二零零二年第四季比較
Compared with fourth quarter 2002
+1,646
綜合消費物價指數Composite Consumer Price Index
與二零零二年同期比較
Compared with same period in 2002二零零三年四月 -1.8%April 2003
二零零三年一月至四月 -1.9%January -April 2003
最近三個月內的平均每月變動率Average monthly rate of change during
the latest 3 months
二零零三年二月至四月 -0.1% §February - April 2003
表 Table : 7.14 表 Table : 7.20 表 Tables : 8.5-8.6
§ 計算自經季節性調整後的數字。 § Compiled based on the seasonally adjusted figures.

主要統計項目的最新數字
Key Statistics Update
香港統計月刊 二零零三年六月 x Hong Kong Monthly Digest of Statistics June 2003
物價 Prices 零售 Retail 零售 Retail
甲類消費物價指數Consumer Price Index (A)
與二零零二年同期比較
Compared with same period in 2002二零零三年四月 -1.2%April 2003
二零零三年一月至四月 -1.7%January -April 2003
最近三個月內的平均每月變動率Average monthly rate of change during
The latest 3 months
二零零三年二月至四月 +0.2%§February - April 2003
零售指數Retail Sales Index
與二零零二年同期比較
Compared with same period in 2002
價值Value
二零零三年三月# -6.0%March 2003#
二零零三年一月至三月# -2.5%January - March 2003#
零售指數Retail Sales Index
與二零零二年同期比較
Compared with same period in 2002數量
Volume二零零三年三月# -3.7%March 2003#二零零三年一月至三月# -0.8%January - March 2003#
截至二零零三年三月止的三個月與對上三個月的變動
Change of the 3-month period endingMarch 2003 over the preceding
3-month period+1.0%#§
表 Tables : 8.5-8.6 表 Table : 9.1 表 Table : 9.1
服務 Services 本地生產總值 GDP 本地生產總值 GDP
選定業務收益指數Selected BusinessReceipts Indices
二零零二年第四季
Fourth Quarter 2002
與二零零一年第四季比較
Compared with fourth quarter 2001
通訊 Communications +0.5%
保險 Insurance +15.0%
商用服務 Business Services -3.5%
二零零二年按人口平均計算的本地生產總值以當時市價計算@
Per Capita GDP 2002at Current Market Prices@
$185,615
與二零零一年比較
Compared with 2001
-1.7%
本地生產總值實質變動率Rate of Change in GDP
in Real Terms
二零零三年第一季@First Quarter 2003@
與二零零二年第一季比較
Compared with first quarter 2002
+4.5%
與二零零二年第四季比較
Compared with fourth quarter 2002
-0.3%§
表 Table : 9.3 表 Table : 12.1 表 Table : 12.3
國際收支平衡表 BoP Account 國際收支平衡表 BoP Account 國際收支平衡表 BoP Account
整體的國際收支(百萬元)
Overall Balanceof Payments($ million)
二零零二年第四季@
Fourth Quarter 2002@
-11,582(赤字)
(in deficit)
經常帳差額(百萬元)
Current Account Balance($ million)
二零零二年第四季@
Fourth Quarter 2002@
45,306(盈餘)
(in surplus)
與二零零一年第四季比較
Compared with fourth quarter 2001
+6,863
非儲備性質的金融資產(變動淨值)
(百萬元)Financial Non-reserve
Assets (net change)($ million)
二零零二年第四季@
Fourth Quarter 2002@
-65,542
表 Table :12.9 表 Table : 12.9 表 Table : 12.9
§ 計算自經季節性調整後的數字。 § Compiled based on the seasonally adjusted figures.

統計表一覽 List of Statistical Tables頁數
Page1. 人口及生命事件 Population and Vital Events 11.1 年中及年底人口 Mid-year and end-year population 41.2 出生率、死亡率、生育率、出生時平均 Birth rate, death rate, fertility rate and expectation of life 4
預期壽命 at birth1.3 按性別及年齡組別劃分的人口 Population by sex and age group 51.4 出生、死亡及婚姻登記數字 Registered births, deaths and marriages 6
2. 勞工 Labour 7勞動人口、就業及空缺 Labour Force, Employment and Vacancies
2.1 勞動人口、失業及就業不足統計 Labour force, unemployment and underemployment 142.2 按以前從事的行業劃分的曾工作的失業人數 Unemployed persons with a previous job by previous industry 152.3 按以前從事的職業劃分的曾工作的失業人數 Unemployed persons with a previous job by previous occupation 162.4 公務員人數及有關職位空缺數目 Number of civil servants and civil service vacancies 172.5 按行業類別劃分的機構單位數目、就業人數 Number of establishments, persons engaged and vacancies, 18
及職位空缺數目 (公務員除外) (other than those in the civil service) by industry sector2.6 按主要行業組別劃分的機構單位數目、就業 Number of establishments, persons engaged and vacancies, 21
人數及職位空缺數目 (公務員除外) (other than those in the civil service) by major industry group2.7 按行業類別及機構規模劃分的機構單位數目 Number of establishments and persons engaged (other than those 25
及就業人數 (公務員除外) in the civil service) by industry sector and size of establishment2.8 選定行業類別內經季節性調整及未經調整的 Quarter-to-quarter percentage change of the seasonally adjusted 27
就業人數 (公務員除外) 的按季變動百分率 and seasonally unadjusted statistics of persons engaged (otherthan those in the civil service) in selected industry sectors
2.9 選定行業類別內經季節性調整及未經調整的 Quarter-to-quarter percentage change of the seasonally adjusted 28職位空缺 (公務員除外) 的按季變動百分率 and seasonally unadjusted statistics of vacancies (other than
those in the civil service) in selected industry sectors薪金及工資 Payroll and Wage
2.10 按行業類別劃分的就業人士名義及實質平均 Nominal and real indices of payroll per person engaged by 29薪金指數 industry sector
2.11 按行業類別劃分的經季節性調整及未經季節 Quarter-to-quarter rates of change in the seasonally adjusted 30性調整的就業人士名義及實質平均薪金指 and seasonally unadjusted series of nominal and real數按季變動 indices of payroll per person engaged by industry sector
2.12 按行業類別及主要職業組別劃分的工資指數 Wage indices by industry sector and broad occupational group 312.13 按行業類別、主要職業組別及性別劃分的 Average wage rates by industry sector, broad occupational 32
二零零二年十二月份平均工資率 group and sex for December 20022.14 僱用於政府建築工程的工人每日平均工資 Average daily wages of workers engaged in government 33
building and construction projects2.15 按主要經濟行業類別劃分的經理級與專業 Salary indices for managerial and professional employees by 34
僱員薪金指數 major economic sector職業傷亡及停工 Occupational Injuries and Work Stoppage
2.16 按意外類別劃分的職業傷亡個案 Occupational injuries by type of accident 35(二零零二年一月至十二月) (January - December 2002)
2.17 按意外類別及行業劃分的工業意外個案 Industrial accidents analysed by type of accident and industry 36(二零零二年一月至十二月) (January - December 2002)
2.18 按行業劃分的僱員停工事件 Stoppages of work by industry 39
3. 對外貿易 External Trade 41商品貿易 Merchandise Trade
3.1 對外商品貿易統計數字 External merchandise trade statistics 463.2 按主要供應地劃分的商品進口貨值 Imports of goods by main supplier 483.3 按主要目的地劃分的港產品出口貨值 Domestic exports of goods by main destination 483.4 按主要來源地劃分的商品轉口貨值 Re-exports of goods by main origin 493.5 按主要目的地劃分的商品轉口貨值 Re-exports of goods by main destination 49
xi香港統計月刊 二零零三年六月 Hong Kong Monthly Digest of Statistics June 2003

統計表一覽 (續) List of Statistical Tables (cont'd.)頁數
Page商品貿易 (續 ) Merchandise Trade (cont'd.)
3.6 按貨品類別劃分的進口貨值 Imports by commodity section 503.7 按貨品類別劃分的港產品出口貨值 Domestic exports by commodity section 513.8 按貨品類別劃分的轉口貨值 Re-exports by commodity section 523.9 按用途類別劃分的進口及轉口貨值 Imports and re-exports by end-use category 533.10 按用途類別劃分的留用進口貨值 Retained imports by end-use category 543.11 按主要貨品類別劃分的港產品出口貨值 Domestic exports by principal commodity 553.12 對外商品貿易貨值變動情況 Movement of external merchandise trade values 563.13 商品貿易指數 Merchandise trade index numbers 573.14 經季節性調整的商品貿易指數 Seasonally adjusted merchandise trade index numbers 583.15 涉及外發中國內地加工的貿易 Trade involving outward processing in the mainland of China 59
服務貿易 Trade in Services3.16 按主要服務組別劃分的服務輸出及輸入 Exports and imports of services by major service group 60
─ 以當時市價計算 ─ at current market prices3.17 按主要服務組別劃分的服務輸出及輸入 Exports and imports of services by major service group 61
─ 物量指數 (二零零零年=100) ─ volume indices (2000=100)
4. 工業生產 Industrial Production 634.1 製造業生產者價格指數 Producer price indices for manufacturing industries 654.2 工業生產指數 Index of industrial production 664.3 經季節性調整的所有製造行業工業生產指數的 67
變動百分率 production for all manufacturing industries4.4 紡織業生產 Textile production 684.5 主要製造行業手頭訂單價值指數 Value indices of orders-on-hand by major manufacturing industry 694.6 經季節性調整的所有製造行業手頭訂單價值指 70
數的變動百分率
4.7 石礦生產
on-hand for all manufacturing industries Quarry production 70
5. 土地、房屋、樓宇、建造 Land, Housing, Building and Construction 715.1 永久性屋宇單位總數 Stock of permanent quarters 755.2 公營租住單位總數 Stock of public housing rental flats 755.3 公營租住單位認可居民人數 Authorized population of public housing rental flats 765.4 按樓宇種類劃分的新落成私人樓宇 Private buildings newly completed by type of building 775.5 按樓宇種類劃分的獲批准可動工興建私人樓宇 Private buildings with consent to commence work by type of 78
building5.6 按地區及房屋類型劃分的新落成居住單位 Residential flats newly completed by geographic area and 79
type of housing5.7 按地區及房屋類型劃分的獲批准可動工興建 Residential flats with consent to commence work by 80
居住單位 geographic area and type of housing5.8 按房屋類型及樓面面積劃分的新落成或獲批准 Residential flats newly completed or with consent to commence 81
可動工興建居住單位 work by type of housing and floor area5.9 按樓宇種類劃分的樓宇售價指數 Property price indices by type of premises 825.10 按樓宇種類劃分的樓宇平均售價 Average property prices by type of premises 825.11 私人住宅樓宇新訂租約平均租金及租金指數 Average rents and rental indices of fresh lettings of private 85
domestic premises5.12 按私人非住宅樓宇類別劃分的新訂及續租租約 Average rents and rental indices of fresh and renewal lettings 87
平均租金及租金指數 by type of private non-domestic premises5.13 送達市區及新界土地註冊處登記的文件數目和 Number and considerations of documents received for 89
涉及的價值 registration in the urban and New Territories Land Registries5.14 屋宇建造及土木工程機構單位所完成工程名義 Gross value of construction work, in nominal terms, performed 91
總值 by building and civil engineering establishments5.15 政府土地拍賣及批租 Disposals of Government land 92
Rate of change in the seasonally adjusted index of industrial
Rates of change in the seasonally adjusted value indices of orders-
xii香港統計月刊 二零零三年六月 Hong Kong Monthly Digest of Statistics June 2003

統計表一覽 (續) List of Statistical Tables (cont'd.)頁數
Page6. 運輸、通訊、旅遊 Transport, Communications and Tourism 956.1 進出香港的飛機、船隻、車輛及火車 Inward and outward movements of aircraft, vessels, motor 99
vehicles and trains6.2 進出香港貨物 Inward and outward movements of cargo 1026.3 按主要貨物裝卸地點劃分的貨櫃吞吐量 Container throughput by main cargo handling location 1046.4 公共交通:按營辦商劃分的乘客人數 Public transport: passenger journeys by operator 1066.5 領牌及新登記車輛數字 Motor vehicles licensed and newly registered 1076.6 隧道汽車流量、青嶼幹線汽車流量及汽車渡輪 Vehicular traffic through tunnels, Lantau Link and vehicular 110
服務 ferry services6.7 交通意外及傷亡 Traffic accidents and casualties 1126.8 按出入境管制站劃分的抵港人數 Passenger arrivals by control point 1136.9 按出入境管制站劃分的離港人數 Passenger departures by control point 1146.10 按目的地劃分的本港居民離港人數 Hong Kong resident departures by destination 1156.11 按居住國家/地區劃分的訪港旅客人數 Visitor arrivals by country/territory of residence 1166.12 按居住國家/地區劃分的訪港旅客帶來之收益 Receipts from visitors by country/territory of residence 1166.13 按居住國家/地區劃分的訪港旅客每人平均消費 Per capita spending and length of stay of visitors by 117
及留港時間 country/territory of residence6.14 香港酒店統計數字 Hotel statistics of Hong Kong 1186.15 電訊服務 Telecommunications services 1196.16 互聯網服務 Internet services 1216.17 郵遞服務 Postal services 122
7. 政府收支、貨幣、金融 Public Accounts, Money and Finance 1237.1 流通貨幣及貨幣供應 Currency in circulation and money supply 1307.2 按類別劃分的客戶存款 Customer deposits by type 1317.3 就外幣掉期存款作出調整的貨幣供應及客戶存款 Money supply and customer deposits adjusted for foreign 133
currency swap deposits7.4 資產負債表 Balance sheet 1347.5 對其他認可機構的負債 Liabilities due to other authorized institutions 1357.6 按用途劃分的貸款及墊款 Loans and advances by type 1367.7 按經濟行業劃分在香港使用的貸款及墊款 Loans and advances for use in Hong Kong by economic sector 1377.8 外匯頭寸 Foreign currency positions 1387.9 港元利率 Hong Kong dollar interest rates 1387.10 香港銀行同業拆息及票據交換 Hong Kong interbank offered rates and clearing house transactions 1397.11 對外負債及債權 External liabilities and claims 1397.12 外幣兌換率及港幣匯率指數 Exchange rates and the effective exchange rate indices 1407.13 二零零三年五月份外幣兌換率及港幣匯率指數 Exchange rates and the effective exchange rate indices 141
in May 20037.14 股票價格指數、成交金額及市場總值 Index of share prices, turnover and market capitalisation 1437.15 二零零三年五月份恒生指數成份股每日收市價 Daily closing prices of the Hang Seng Index constituent stocks 148
in May 20037.16 二零零三年五月份恒生指數期貨及期權 Hang Seng Index Futures and Options in May 2003 1507.17 金銀買賣報價 Gold and silver trading prices 1517.18 二零零三年五月份金銀買賣報價 Gold and silver trading prices in May 2003 1517.19 政府一般收入帳目的收入和開支 Government revenue and expenditure under the 152
General Revenue Account^ 7.20 外匯儲備資產 Foreign currency reserve assets 152
8. 物價 Prices 1538.1 以一九九九至二零零零年為基期的綜合消費物價 1999/2000-based Composite Consumer Price Index 156
指數
8.2 以一九九九至二零零零年為基期的甲類消費物價 1999/2000-based Consumer Price Index (A) 157指數
^ 新增統計表 ^ New statistical table
xiii香港統計月刊 二零零三年六月 Hong Kong Monthly Digest of Statistics June 2003

統計表一覽 (續) List of Statistical Tables (cont'd.)頁數
Page物價 (續 ) Prices (cont'd.)
8.3 以一九九九至二零零零年為基期的乙類消費物價 1999/2000-based Consumer Price Index (B) 158指數
8.4 以一九九九至二零零零年為基期的丙類消費物價 1999/2000-based Consumer Price Index (C) 159指數
8.5 消費物價指數的按年變動率 Year-on-year rates of change in the Consumer Price Indices 1608.6 經季節性調整的消費物價指數在最近三個月內的 Average monthly rates of change during the latest 3 months in 160
平均每月變動率 the seasonally adjusted Consumer Price Indices8.7 選定食品的平均批發價格 Average wholesale prices of selected food items 1618.8 選定食品的平均零售價格 Average retail prices of selected food items 1629. 商業 Commerce 1639.1 零售業銷貨額 Retail sales 1679.2 食肆收益 Restaurant receipts 1709.3 業務收益指數 Business receipts indices 171
^ 9.4 選定服務業生產者價格指數 Producer price indices of selected service industries 1729.5 本地公司及在本港以外註冊成立公司:登記、 Local companies and companies incorporated outside 173
清盤及解散數目 Hong Kong : number registered, wound-up and dissolved
10. 社會狀況 Social Conditions 17510.1 罪案統計數字 Statistics of crimes 17810.2 留院及門診服務 In-patient and out-patient services 180
^ 10.3 已呈報的傳染病 Notified infectious diseases 18110.4 綜合社會保障援助計劃 Comprehensive social security assistance scheme 18210.5 公共福利金計劃 Social security allowance scheme 18310.6 家庭服務中心處理中的個案 Active cases of family services centres 18410.7 安老服務 Services for the elderly 18410.8 主要文化場地的使用率 Usage rates of major cultural venues 18510.9 按種類劃分的康樂設施使用率 Usage rates of recreation facilities by type 18710.10 按類別劃分的有效市政牌照及許可證 Municipal services licences and permits in force by type 188
11. 能源 Energy 19111.1 油產品進口留用數量 Quantity of retained imports of oil products 19311.2 主要煤產品進口留用數量 Quantity of retained imports of major coal products 19311.3 電力耗用 Electricity consumption 19411.4 煤氣耗用 Gas consumption 194
12. 國民收入及國際收支平衡 National Income and Balance of Payments 19512.1 按開支組成部分劃分的本地生產總值 Gross Domestic Product (GDP) by expenditure component 206
─ 以當時市價計算 ─ at current market prices12.2 按開支組成部分劃分的本地生產總值 Gross Domestic Product (GDP) by Expenditure Component 207
─ 物量指數 (二零零零年=100) ─ Volume Indices (2000=100)12.3 本地生產總值及個別開支組成部分的 Percentage change in real terms of quarterly Gross Domestic 208
按季實質變動百分率 Product (GDP) and selected expenditure components12.4 按經濟活動劃分的本地生產總值 Gross Domestic Product (GDP) by economic activity 209
─ 以當時價格計算 ─ at current prices12.5 按經濟活動劃分的本地生產總值 Gross Domestic Product (GDP) by economic activity 210
─ 以固定(二零零零年)價格計算 ─ at constant (2000) prices12.6 二零零三年本地生產總值與其開支組成項目及 Forecast rates of change in the Gross Domestic Product 211
主要價格指標的預測增減率 and its expenditure components and in the main price Indicators for 2003
12.7 本地居民生產總值及按收益組成部分和 Gross National Product (GNP) and external factor income 212交易者類別劃分的對外要素收益流動 flows (EFIF) by income component by type of transactor (以當時市價計算) (at current market prices)
^ 修訂統計表 ^ Revised statistical tables
xiv香港統計月刊 二零零三年六月 Hong Kong Monthly Digest of Statistics June 2003

統計表一覽 (續) List of Statistical Tables (cont'd.)頁數
Page國民收入及國際收支平衡 (續 ) National Income and Balance of Payments (cont'd.)
12.8 按主要收益來源地/目的地國家/地區劃分 External factor income flows (EFIF) by major 213的對外要素收益流動 source/destination country/territory
12.9 國際收支平衡表 Balance of Payments Account 21412.10 國際收支平衡表分項:經常帳 Balance of Payments sub-account components : 215
current account12.11 國際收支平衡表分項:資本及金融帳 Balance of Payments sub-account components : 217
capital and financial account12.12 對外債務統計數字 (季末頭寸) External debt statistics (position as at end of quarter) 219
13. 雜項統計 Miscellaneous Statistics 22113.1 消防服務 Fire services 22213.2 食水供應 Water supplies 22413.3 氣象觀測 Meteorological observations 225
xv香港統計月刊 二零零三年六月 Hong Kong Monthly Digest of Statistics June 2003

統計圖一覽 List of Charts頁數
Page
1. 人口及生命事件 Population and Vital Events 11.1 按性別劃分的年中及年底人口 Mid-year and end-year population by sex 31.2 按年齡組別劃分的年中及年底人口 Mid-year and end-year population by age group 3
2. 勞工 Labour 72.1 失業率及就業不足率 Unemployment rate and underemployment rate 132.2 名義及實質工資指數的變動情況 Movements of the nominal and real wage indices 13
3. 對外貿易 External Trade 413.1 對外商品貿易貨值 External merchandise trade values 443.2 經季節性調整的對外商品貿易貨值近三個月 Change of the latest 3-month period over the preceding 3-month period 44
與對上三個月比較的變動百分率 of seasonally adjusted series of external merchandise trade values3.3 服務輸出的變動情況 Movements of exports of services 453.4 服務輸入的變動情況 Movements of imports of services 454. 工業生產 Industrial Production 634.1 所有製造行業的生產者價格指數的變動情況 Movements of producer price index for all manufacturing industries 644.2 所有製造行業的工業生產指數的變動情況 Movements of index of industrial production for all manufacturing 64
industries
5. 土地、房屋、樓宇、建造 Land, Housing, Building and Construction 715.1 私人住宅單位的售價及租金指數 Price and rental indices of private domestic units 745.2 私人寫字樓的售價及租金指數 Price and rental indices of private office 74
6. 運輸、通訊、旅遊 Transport, Communications and Tourism 956.1 空運貨物吞吐量 Air cargo throughput 976.2 港口貨櫃吞吐量 Port's container throughput 976.3 訪港旅客人數 Visitor arrivals 98
7. 政府收支、貨幣、金融 Public Accounts, Money and Finance 1237.1 港元貨幣供應的變動情況 Movements of the Hong Kong dollar money supply 1287.2 港元利率 Hong Kong dollar interest rates 1287.3 恒生指數及主板成交金額 Hang Seng Index and Main Board market turnover 129
8. 物價 Prices 1538.1 綜合消費物價指數的變動情況 Movements of the Composite Consumer Price Index 155
9. 商業 Commerce 1639.1 總零售價值指數 Value index of total retail sales 1659.2 總零售量指數 Volume index of total retail sales 1659.3 選定服務行業的業務收益指數 Business receipts indices of selected service industries 166
10. 社會狀況 Social Conditions 17510.1 綜合社會保障援助(綜援)計劃 Comprehensive Social Security Assistance (CSSA) Scheme 177
─ 個案數目;發放款項 ─ number of cases; amount of payment
11. 能源 Energy 19111.1 電力及煤氣耗用 Electricity and gas consumption 192
12. 國民收入及國際收支平衡 National Income and Balance of Payments 19512.1 本地生產總值的實質變動百分率 Percentage change in GDP in real terms 20512.2 國際收支平衡表 Balance of Payments Account 205
xvi香港統計月刊 二零零三年六月 Hong Kong Monthly Digest of Statistics June 2003

香港統計月刊 二零零三年六月 Hong Kong Monthly Digest of Statistics June 20031
人口及生命事件
Population and Vital Events
概念及方法 Concepts and Methods
自二零零零年八月起,「居住人口」方法已取
代「廣義時點」方法用以編製香港的人口數
字。追溯至一九九六年的修訂人口數字經已編
製。利用「居住人口」方法所編製的人口估
計,稱「居港人口」。「居港人口」包括「常
住居民」和「流動居民」。
Since August 2000, the “resident population”approach has been adopted in place of the “extendedde facto” approach for compiling Hong Kongpopulation figures. Revised population figuresbackdated to 1996 have been compiled. Thepopulation estimate compiled under the “residentpopulation” approach is referred to as the “HongKong Resident Population”. The “Hong KongResident Population” comprises “Usual Residents”and “Mobile Residents”.
「常住居民」指兩類人士:(一)在統計時點
之前的六個月內,在港逗留最少三個月,又或
在統計時點之後的六個月內,在港逗留最少三
個月的香港永久性居民,不論在統計時點他們
是否身在香港;及(二)在統計時點身在香港
的香港非永久性居民。
“Usual Residents” refer to two categories of people:(1) Hong Kong Permanent Residents who havestayed in Hong Kong for at least three months duringthe six months before or for at least three monthsduring the six months after the reference time-point,regardless of whether they are in Hong Kong or notat the reference time-point; and (2) Hong Kong Non-permanent Residents who are in Hong Kong at thereference time-point.
至於「流動居民」,是指在統計時點之前的六
個月內,在港逗留最少一個月但少於三個月,
又或在統計時點之後的六個月內,在港逗留最
少一個月但少於三個月的香港永久性居民,不
論在統計時點他們是否身在香港。
As for “Mobile Residents”, they are Hong KongPermanent Residents who have stayed in Hong Kongfor at least one month but less than three monthsduring the six months before or for at least one monthbut less than three months during the six months afterthe reference time-point, regardless of whether theyare in Hong Kong or not at the reference time-point.
根據「居住人口」的編製方法,旅客並不包括
在香港人口內。
Under the “resident population” approach, visitorsare not included in the Hong Kong Population.
有關香港人口估計編製方法的詳細資料,請參
閱刊載於本月刊二零零二年二月號題為「香港
人口估計的編製」的專題文章。該文章亦載於
政府統計處的網站內 (http://www.info.gov.hk/censtatd/chinese/news/rev_stat/new_pop_est/pop_fa_index.html)。
For details of the method of compiling populationestimates of Hong Kong, please see the feature articleentitled “Compiling Population Estimates of HongKong” published in the February 2002 issue of thispublication. The article is also available on thewebsite of the Census and Statistics Department(http://www.info.gov.hk/censtatd/eng/news/rev_stat/new_pop_est/pop_fa_index.html).
出生率、死亡率及自然增長率,是以一年內出
生及死亡的所知人數,與及兩者的差額為分
子,分別與同年年中的人口數字為分母構成比
率。嬰兒死亡率是一年內嬰兒死亡的所知人數
與該年嬰兒出生的所知人數的比率。
Birth rate, death rate and rate of natural increase arecalculated by relating the known births, the knowndeaths and their difference in a year to theircorresponding mid-year population. Infant mortalityrate is obtained by relating the known infant deaths ina year to the known births in the same year.

香港統計月刊 二零零三年六月 Hong Kong Monthly Digest of Statistics June 20032
出生時平均預期壽命是指某年出生人士,若其
一生經歷一如該年按性別及年齡劃分的死亡率
所反映的死亡情況,他/她預期能活的年數。
Expectation of life at birth is the number of years oflife that a person born in a given year is expected tolive if he/she were subjected to the prevalentmortality conditions as reflected by the set of age-sexspecific death rates for that year.
某年的總和生育率是指一千名婦女,若她們在
生育齡期(即十五至四十九歲)經歷了一如該
年的年齡組別生育率,其一生中活產子女的平
均數目。
Total fertility rate refers to the average number ofchildren that would be born alive to 1 000 womenduring their lifetime if they were to pass through theirchildbearing ages 15-49 experiencing the age specificfertility rates prevailing in a given year.
表 1.4 內的統計數字是指統計期內登記的出
生、死亡及婚姻事件。它們並不一定相等於在
該期間內實際發生的事件數目。
Statistics in Table 1.4 refer to births, deaths andmarriages registered in the period covered. Theymay not necessarily be equal to the number of suchevents which occurred in the period.
其他有關刊物 Further References
香港人口趨勢 1981–2001 Demographic Trends in Hong Kong 1981–2001香港人口生命表 1996–2031 Hong Kong Life Tables 1996–2031香港人口推算 2002–2031 Hong Kong Population Projections 2002–2031香港社會及經濟趨勢 Hong Kong Social and Economic Trends人口普查及中期人口統計報告 Population Census and Population By-census
Reports

圖 1.1 按性別劃分的年中及年底人口Chart 1.1 Mid-year and End-year Population by Sex
圖 1.2 按年齡組別劃分的年中及年底人口Chart 1.2 Mid-year and End-year Population by Age Group
0
1
2
3
4
5
6
7
8
年底end-1996
年中mid-1997
年底end-1997
年中mid-1998
年底end-1998
年中mid-1999
年底end-1999
年中mid-2000
年底end-2000
年中mid-2001
年底end-2001
年中mid-2002
年底end-2002
百萬人Million persons
男Male
女Female
0
1
2
3
4
5
6
7
8
年底end-1996
年中mid-1997
年底end-1997
年中mid-1998
年底end-1998
年中mid-1999
年底end-1999
年中mid-2000
年底end-2000
年中mid-2001
年底end-2001
年中mid-2002
年底end-2002
百萬人Million persons
零歲至十四歲Aged 0-14
十五歲至六十四歲Aged 15-64
六十五歲及以上Aged 65+
3香港統計月刊 二零零三年六月 Hong Kong Monthly Digest of Statistics June 2003

1.1 年中及年底人口
Mid-year and End-year Population年 男 女 總計
Year Male Female Total
1998 年中 Mid 3 249 900 3 293 800 6 543 700年底 End 3 260 700 3 322 700 6 583 400
1999 年中 Mid 3 264 700 3 341 800 6 606 500年底 End 3 271 000 3 366 600 6 637 600
2000 年中 Mid 3 276 500 3 388 500 6 665 000年底 End 3 288 500 3 423 000 6 711 500
2001 年中 Mid 3 287 000 3 437 900 6 724 900年底 End 3 296 600 3 462 400 6 759 000
2002 年中 Mid 3 299 900 3 487 100 6 787 000年底# End# 3 307 400 3 508 400 6 815 800
資料來源: 政府統計處人口統計組 Source : (查詢電話 :2716 8345)
1.2 出生率、死亡率、生育率、出生時平均預期壽命
Birth Rate, Death Rate, Fertility Rate and Expectation of Life at Birth1999 2000 2001 2002
人口增長率(%)(1) Population growth rate(%)(1) 1.0 0.9 0.9 0.9粗出生率(2) Crude birth rate(2) 7.8 8.1 7.2 7.1粗死亡率(2) Crude death rate(2) 5.0 5.1 5.0 5.0 #
自然增長率(2) Rate of natural increase(2) 2.7 3.1 2.2 2.1 #
嬰兒死亡率(3) Infant mortality rate(3) 3.1 3.0 2.6 2.4 #
總和生育率(4) Total fertility rate(4) 965 1 024 927 959出生時平均預期壽命(年)
男 Male 77.7 78.0 78.4 78.7 #
女 Female 83.2 83.9 84.6 84.7 #
註釋 : (1) 指年中人口的按年增長率。 Notes : (1)
(2) 按每千名人口計算。 (2)
(3) 按每千名活產嬰兒計算。 (3)
(4) 按每千名十五歲至四十九歲沒有包括女性外籍 (4)
家庭傭工的女性人口計算。 domestic helpers.
資料來源: 政府統計處人口統計組 Source : (查詢電話 :2716 8345)
1998
77.4
5.0
Expectation of life at birth (years)
Demographic Statistics Section, Census and Statistics Department
0.8
3.2 990
(Enquiry Telephone No.: 2716 8345)
8.1
83.0
(Enquiry Telephone No.: 2716 8345)
3.1
Per 1 000 female population aged 15-49 excluding female foreign
Per 1 000 population.Per 1 000 live births.
Census and Statistics Department
Refer to the year-on-year growth rate of the mid-year population.
Demographic Statistics Section,
4香港統計月刊 二零零三年六月 Hong Kong Monthly Digest of Statistics June 2003

1.3 按性別及年齡組別劃分的人口
Population by Sex and Age Group
性別 年齡組別 人數 百分比 人數 百分比Sex Age group Numbers % Numbers %男 Male
0 - 4 138 600 2.0 137 100 2.0 5 - 9 202 800 3.0 198 200 2.910 - 14 223 700 3.3 224 900 3.315 - 19 226 600 3.3 226 500 3.320 - 24 222 800 3.3 223 500 3.325 - 29 236 800 3.5 232 500 3.430 - 34 253 700 3.7 252 800 3.735 - 39 302 200 4.5 294 500 4.340 - 44 337 100 5.0 337 700 5.045 - 49 283 300 4.2 290 100 4.350 - 54 235 000 3.5 239 100 3.555 - 59 149 600 2.2 157 100 2.360 - 64 128 700 1.9 126 000 1.865 - 69 128 800 1.9 130 000 1.970 - 74 105 300 1.6 107 300 1.675 - 79 67 300 1.0 69 700 1.080 - 84 36 500 0.5 38 100 0.6≧ 85 21 100 0.3 22 300 0.3小計 Sub-total 3 299 900 48.6 3 307 400 48.5
女 Female 0 - 4 129 000 1.9 128 300 1.9 5 - 9 189 500 2.8 185 900 2.710 - 14 210 800 3.1 212 000 3.115 - 19 213 600 3.1 213 900 3.120 - 24 227 000 3.3 221 000 3.225 - 29 274 700 4.0 265 900 3.930 - 34 334 700 4.9 335 800 4.935 - 39 372 900 5.5 368 600 5.440 - 44 356 300 5.2 364 700 5.445 - 49 288 700 4.3 299 000 4.450 - 54 225 500 3.3 232 900 3.455 - 59 133 800 2.0 144 100 2.160 - 64 112 600 1.7 110 200 1.665 - 69 122 900 1.8 123 900 1.870 - 74 110 400 1.6 111 700 1.675 - 79 83 900 1.2 85 900 1.380 - 84 54 600 0.8 56 600 0.8≧ 85 46 200 0.7 48 000 0.7小計 Sub-total 3 487 100 51.4 3 508 400 51.5
合計 Overall 0 - 4 267 600 3.9 265 400 3.9 5 - 9 392 300 5.8 384 100 5.610 - 14 434 500 6.4 436 900 6.415 - 19 440 200 6.5 440 400 6.520 - 24 449 800 6.6 444 500 6.525 - 29 511 500 7.5 498 400 7.330 - 34 588 400 8.7 588 600 8.635 - 39 675 100 9.9 663 100 9.740 - 44 693 400 10.2 702 400 10.345 - 49 572 000 8.4 589 100 8.650 - 54 460 500 6.8 472 000 6.955 - 59 283 400 4.2 301 200 4.460 - 64 241 300 3.6 236 200 3.565 - 69 251 700 3.7 253 900 3.770 - 74 215 700 3.2 219 000 3.275 - 79 151 200 2.2 155 600 2.380 - 84 91 100 1.3 94 700 1.4≧ 85 67 300 1.0 70 300 1.0總計 Total 6 787 000 100.0 6 815 800 100.0
資料來源: 政府統計處人口統計組 Source : Demographic Statistics Section, (查詢電話:2716 8345) Census and Statistics Department
(Enquiry Telephone No.: 2716 8345)
二零零二年年中
Mid-2002 二零零二年年底#
End-2002 #
5香港統計月刊 二零零三年六月 Hong Kong Monthly Digest of Statistics June 2003

1.4 出生、死亡及婚姻登記數字
Registered Births, Deaths and Marriages
婚姻
Marriages
年 男 女 總計 女 總計(1)
Year Male Female Total Female Total(1)
2000 28 186 25 534 53 720 14 718 33 993 30 8792001 25 599 23 545 49 144 14 294 33 305 32 8252002 24 925 23 194 48 119 14 791 34 316 32 0702002 3 1 849 1 768 3 617 1 236 2 790 2 981
4 1 945 1 848 3 793 1 329 2 993 1 8175 1 998 1 808 3 806 1 200 2 888 2 4956 1 776 1 608 3 384 1 100 2 544 2 2157 2 121 2 003 4 124 1 300 3 003 1 9518 2 066 1 967 4 033 1 142 2 701 1 7559 2 113 1 929 4 042 1 101 2 556 2 856
10 2 387 2 123 4 510 1 210 2 809 2 81911 2 273 2 142 4 415 1 085 2 564 3 63912 2 368 2 203 4 571 1 304 3 016 3 892
2003 1 2 176 2 111 4 287 1 526 3 398 2 8542 1 935 1 784 3 719 1 377 3 268 2 2453 1 992 1 913 3 905 1 391 3 119 3 9114 1 913 1 760 3 673 1 498 3 364 1 8895 1 984 1 853 3 837 1 434 3 219 2 824
註釋 : (1) 包括一個小數目不知性別的死亡人數。 Note : (1) Include a small number of deaths of unknown sex.
資料來源: 入境事務處 Source : Immigration Department(查詢電話:2829 3578) (Enquiry Telephone No.: 2829 3578)
1 559
1 664
1 891
1 712
月
Month男
Male
出生
Births 死亡
Deaths
19 27119 007
1 872
1 728
1 785
19 523
1 479
1 702
1 599
1 444
1 455
1 553
1 866
1 688
6香港統計月刊 二零零三年六月 Hong Kong Monthly Digest of Statistics June 2003

香港統計月刊 二零零三年六月 Hong Kong Monthly Digest of Statistics June 20037
勞工
Labour
概念及方法 Concepts and Methods
勞動人口及失業 Labour Force and Unemployment
勞動人口、失業和就業不足的統計數字是從綜
合住戶統計調查獲取的數據編製所得。
Statistics on labour force, unemployment andunderemployment are compiled based on data obtainedfrom the General Household Survey.
勞動人口是指十五歲及以上陸上非住院人口,
並符合就業人口或失業人口定義的人士。勞動
人口參與率是指勞動人口佔所有十五歲及以上
陸上非住院人口的比例。
The labour force refers to the land-based non-institutional population aged 15 and over who satisfythe criteria for inclusion in the employed population orthe unemployed population. The labour forceparticipation rate refers to the proportion of labour forcein the land-based non-institutional population aged 15and over.
就業人口包括在統計前七天內有做工賺取薪酬
或利潤或有一份正式工作的十五歲及以上人
士。
The employed population consists of persons aged 15and over who have been at work for pay or profit duringthe 7 days before enumeration or who have had formaljob attachment.
失業人口包括所有符合下列條件的十五歲及以
上人士:
The unemployed population comprises all those personsaged 15 and over who fulfil the following conditions:
(a) 在統計前七天內並無職位,且並無為
賺取薪酬或利潤而工作;及
(a) have not had a job and have not performed any workfor pay or profit during the 7 days beforeenumeration; and
(b) 在統計前七天內隨時可工作;及 (b) have been available for work during the 7 daysbefore enumeration; and
(c) 在統計前三十天內有找尋工作。 (c) have sought work during the 30 days beforeenumeration.
不過,一名十五歲或以上的人士,如果他/她符合上述 (a) 和 (b) 的條件,但由於相信沒有
工作可做而在統計前三十天內沒有找尋工作,
仍會被界定為失業,即所謂「因灰心而不求職
的人士」。
However, if a person aged 15 or over fulfils theconditions (a) and (b) above but has not sought workduring the 30 days before enumeration because he/shebelieved that work was not available, he/she is stillclassified as unemployed, being regarded as a so-called"discouraged worker".
除上述情況外,下列人士亦視作失業人士: Notwithstanding the above, the following types ofpersons are also classified as unemployed:
(a) 並無職位,有找尋工作,但由於暫時
生病而不能工作的人士;及
(a) persons without a job, have sought work but havenot been available for work because of temporarysickness; and
(b) 並無職位,且隨時可工作,但由於下
列原因並無找尋工作的人士:
(b) persons without a job, have been available for workbut have not sought work because they:
(i) 已為於稍後時間擔當的新工作或
開展的業務作出安排;或
(i) have made arrangements to take up a new jobor to start business at a subsequent date; or
(ii) 正期待返回原來的工作崗位。 (ii) were expecting to return to their original jobs.

香港統計月刊 二零零三年六月 Hong Kong Monthly Digest of Statistics June 20038
失業率是指失業人士在勞動人口中所佔的比
例。經季節性調整的失業率可用作不同時間
的比較。由二零零一年一月至三月期間開
始,政府統計處已採用「X-11自迴歸-求和
-移動平均」(X-11 ARIMA)方法,編製經季
節性調整的失業率。較早期間的經季節性調
整的失業率數字,已按這個新方法重新編
製。
The unemployment rate refers to the proportion ofunemployed persons in the labour force. Seasonallyadjusted unemployment rates are compiled for makingcomparison over time. As from January – March 2001,the X-11 ARIMA method has been adopted forcompiling the seasonally adjusted unemployment rate.The seasonally adjusted unemployment rates for earlierperiods have been re-compiled accordingly using thenew method.
就業不足人口包括在統計前七天內在非自願
情況下工作少於三十五小時,而在統計前三
十天內有找尋更多工作,或即使沒有找尋更
多工作,但在統計前七天內可擔任更多工作
的人士。根據此定義,因工作量不足而在統
計前七天內放取無薪假期的就業人士,若在
該七天期間內工作少於三十五小時(或甚至完
全沒有工作),亦會界定為就業不足人士。就
業不足率是指就業不足人士在勞動人口中所
佔的比例。
The underemployed population comprises thoseemployed persons who have involuntarily worked lessthan 35 hours during the 7 days before enumeration andhave sought additional work during the 30 days beforeenumeration, or have not sought additional work but havebeen available for additional work during the 7 daysbefore enumeration. Following this definition, employedpersons taking no-pay leave due to slack work during the7 days before enumeration are also classified asunderemployed if they worked less than 35 hours (or evendid not work at all) during the 7-day period. Theunderemployment rate refers to the proportion ofunderemployed persons in the labour force.
勞動人口統計數字會由於以下的原因而作出
例行修訂:
The labour force statistics are subject to routinerevision arising from:
(a) 人口估計的例行修訂 --- 在「居住人口」
方法下,某一年內所有的最終人口估
計,只會在翌年的八月才可備妥。
(a) Routine revision to population estimates --- underthe “resident population” approach, all populationestimates in a given year can only be finalized inAugust of the following year.
(b) 使用「X-11自迴歸—求和—移動平均」
方法編製的季節性因子的例行修訂 --- 當某一年內所有移動三個月期間的修訂勞
動人口統計數字備妥後,季節性因子便
會作出修訂,而該年的所有移動三個月
期間的經季節性調整失業率數列亦會作
出相應的例行修訂。
(b) Routine revision to seasonal factors compiledusing the X-11 ARIMA method --- the series ofseasonally adjusted unemployment rate in respectof all moving three-month periods in a givencalendar year is subject to routine revision later,when the finalized labour force statistics for allmoving three-month periods in that year areavailable to enable re-estimation of the finalseasonal factors.
表 2.1 內的全年數字為該年四季估計數字的平
均數。
Annual figures in Table 2.1 are averages of theestimates for the four quarters of the year.
香港標準行業分類 Hong Kong Standard IndustrialClassification
本統計月刊所發表的按行業分類統計數字是
以《香港標準行業分類 1.1 版》(HSIC V1.1)為依據,這分類以聯合國的《國際標準產業
分類(第二訂正本)》(ISIC Rev. 2) 為基礎,
因應本地經濟的行業結構而釐定。
The industry breakdowns of statistics shown in thisMonthly Digest are based on the "Hong Kong StandardIndustrial Classification Version 1.1" (HSIC V1.1), whichis modelled on the United Nations’ "International StandardIndustrial Classification (Revision 2)" (ISIC Rev. 2), withadaptation for the industrial structure of the local economy.

香港統計月刊 二零零三年六月 Hong Kong Monthly Digest of Statistics June 20039
隨本港資訊科技及電訊公司迅速增長,
《香港標準行業分類》在二零零一年十月經
已修訂,務求提供更仔細及適時的分類架
構,以便使用者編製有關統計數字。經修訂
的《香港標準行業分類》稱為《香港標準行
業分類 1.1 版》。
With the widespread establishment of informationtechnology and telecommunications companies inHong Kong in recent years, the HSIC has been revisedin October 2001 in order to provide a more refined andup-to-date classification framework for users incompiling related statistics. The revised HSIC isnamed as "Hong Kong Standard IndustrialClassification Version 1.1" (HSIC V1.1).
就業人數及職位空缺 Persons Engaged and Vacancies
機構單位數目、就業人數及職位空缺的統計
數字可顯示本港勞工市場的需求狀況。表
2.4-2.9 內的數字主要是從僱傭及職位空缺按
季統計調查 (SEV) 獲取。由於搜集資料有實
際困難,一些行業並不包括在該統計調查
內。SEV 不包括的經濟活動主要計有:
Statistics on the number of establishments, personsengaged and vacancies provide an indication of thedemand situation in the local labour market. It shouldbe noted that figures in Tables 2.4-2.9 are based mainlyon data obtained from the Quarterly Survey ofEmployment and Vacancies (SEV), which does notcover some industries for operational difficulties.Economic activities in different industry sectors notcovered by SEV :
在行業類別中不包括的
行業類別 經濟活動 Industry Economic activities in the sector notSector covered
第一類別 農業及漁業(整個行業類別)
第五類別 建造業(建築地盤工人除外)
第六類別 小販及零售攤檔(街市攤檔除
外)
第七類別 的士、公共小巴、貨車、駁船及
船上裝卸服務
第九類別 公共行政、宗教組織、作家及其
他獨立藝術工作者、家務助理及
其他康樂和個人服務
1 Agriculture and Fishing (entire sector)5 Construction (other than manual workers
at construction sites)6 Hawkers and retail pitches (other than
market stalls)7 Taxis, public light buses, goods vehicles,
barges, lighters and stevedoring services
9 Public administration, religiousorganizations, authors and otherindependent artists, domestic helpers, andmiscellaneous recreational and personalservices
因此,表 2.4-2.9 內個別行業類別及所有行業
類別的總數僅為選定行業的總數。
Figures for individual industry sectors and for the totalof all industry sectors in Tables 2.4-2.9 therefore relateonly to those selected industries covered in the survey.
在一般行業類別中(建造業除外),SEV 的訪問對象是機構單位。機構單位是指在單一
擁有權或控制權下,在單一地點從事一種或
主要從事一種經濟活動的經濟單位,例如個
別工廠、工場、零售店及辦公室。至於公務
員類別,就以政府部門為統計單位。而在建
造業中,就以建築地盤為訪問單位。建築地
盤是指一個劃定的地點,在這地點內正在進
行一個或多個階段的建造工程。
For the non-construction industry sectors covered bySEV, the unit of enquiry is an establishment, which isdefined as an economic unit which engages, under asingle ownership or control, in one or predominantlyone kind of economic activity at a single physicallocation, e.g. an individual factory, workshop, retailshop and office. For the Civil Service sector, the unitof enquiry is a government department and for theconstruction sector, a construction site. A constructionsite is defined as a demarcated locality where one ormore stages of construction work are being carried on.

香港統計月刊 二零零三年六月 Hong Kong Monthly Digest of Statistics June 200310
就一般的機構單位而言,就業人數(公務員
除外)包括:
For establishments outside the Civil Service, personsengaged include :
(a) 經常參與機構單位業務的在職東主及
股東;
(a) individual proprietors and partners activelyengaged in the work of the establishment;
(b) 在統計日期向機構單位直接支取薪酬
的全職受薪僱員,其中包括長期或臨
時聘用的,無論這些僱員正在本港或
其他地方工作或暫時缺勤(即正在放
病假、分娩假、年假、事假的工人及
罷工者)﹔及
(b) full-time salaried personnel or employees directlypaid by the establishment, both permanent andtemporary, who are either at work (whether inHong Kong or outside Hong Kong) or temporarilyabsent from work (viz. those on sick leave,maternity leave, annual vacation or casual leave,and on strike) on the survey reference date; and
(c) 在統計日期工作最少一小時的兼職僱
員及夜班或通宵班的僱員和無酬家屬
幫工。
(c) part-time employees and employees onnight/irregular shifts and unpaid family workersworking for at least one hour on the surveyreference date.
公務員是指在統計日期,按公務員聘用條件
受僱的人員。廉政公署人員和香港駐外地經
濟貿易辦事處在當地聘請的人員,以及其他
政府僱員如非公務員合約僱員,並不包括在
內。其統計定義,由一九九九年六月的統計
期起有輕微修訂,司法機構內的法官及司法
人員並不納入公務員涵蓋範圍內。
Civil Servants refer to persons who are employed oncivil service terms of appointment on the surveyreference date. Independent Commission AgainstCorruption officers, locally engaged staff working inoverseas Hong Kong Economic and Trade Offices, andother government employees like Non-Civil ServiceContract staff are excluded. A minor revision has beenmade on its statistical definition since the statisticalmonth of June 1999, whereby judges and judicialofficers in the Judiciary are excluded from the coverageof civil servants.
建築地盤工人是指在統計日期受僱於建築地
盤工作的技工、半熟練及非熟練工人。地盤
工人可以由主要承建商直接僱用或由判頭或
工頭臨時僱用。
Manual workers at the construction sites refer tocraftsmen, semi-skilled and unskilled workers workingat those sites on the survey reference date. Manualworkers are either directly employed by the maincontractors or being called upon by sub-contractors organg leaders to work on a casual basis.
職位空缺是指在統計日期正懸空並須要立刻
填補,而機構單位亦正積極進行招聘以填補
的職位空缺。
Vacancies refer to unfilled job openings which areimmediately available, and for which active recruitmentsteps are being taken on the survey reference date.
為更符合以上概念,公務員職位空缺的定義
從一九九九年六月統計期起修訂為不包括將
刪除的職位空缺及以臨時僱員或其他職級人
員暫代的職位空缺。修訂後的統計數字追溯
至一九九六年三月的統計期。
For closer conformity with the above concept, thedefinition of the civil service vacancies has beenrevised starting from the statistical month of June 1999,such that vacancies having arisen from posts pendingdeletion and posts held by temporary staff or reservedfor other staff are excluded. Revision of the statisticshas been backdated to the statistical month of March1996.

香港統計月刊 二零零三年六月 Hong Kong Monthly Digest of Statistics June 200311
由二零零零年十二月開始,關於公務員職位
空缺的統計數字已扣除二零零零年推出的自
願退休計劃所指明 59 個職系的職位空缺。這
些指明職系的職位空缺會以在職轉任方式填
補,而在職轉任安排最終引致的職位空缺將
會刪除。
Since December 2000, the vacancies of the civil serviceexclude vacancies of 59 grades designated for theVoluntary Retirement (VR) exercise introduced in2000. The vacancies of these VR designated gradeswere to be filled by in-service appointment and theconsequential vacancies would be subsequentlydeleted.
由二零零二年三月統計期開始,SEV 中社區、社會及個人服務業的範圍已涵蓋多五
個行業,包括獸醫服務、桌球中心、保齡
球中心、電子遊戲機中心及殯儀服務。
Starting from the March 2002 round of SEV, the surveycoverage has been expanded to include five moreindustries in the community, social and personalservices sector. They are veterinary services, billiardcentres, bowling centres, electronic game centres andfuneral services.
薪金及工資 Payroll and Wage
薪金總額包括直接支付予僱員的工資及薪
金、花紅及獎賞、佣金、津貼及其他形式的
現金支出。就業人士名義平均薪金指數反映
就業人士的總體平均收入(以貨幣計算)的
變動。就業人士實質平均薪金指數是從名義
指數中,按綜合消費物價指數的變幅,扣除
通脹的影響而得出,顯示僱員收入金額購買
力的轉變。
Payroll covers wages and salaries, bonuses andgratuities, commissions, allowances and cash paymentsin other forms paid directly to employees. The nominalindex of payroll per person engaged indicates theoverall movement of average labour earnings in moneyterms. The real index, obtained by deflating thenominal index by the Composite Consumer PriceIndex, indicates changes in the purchasing power oflabour earnings.
工資率顯示基本的勞工價格,指支付予僱員
在正常工作時數所賺取的金額。除基本工資
及薪金外,工資率亦包括生活津貼、膳食福
利、佣金及小費、勤工獎、輪班津貼、固定
發放的年終花紅及其他固定及定期發放的花
紅和津貼。名義工資指數量度工資率的淨變
動,不受接連兩個統計月份的行業及職業結
構轉變所影響。
Wage rate is basically the 'price' of labour and refers tothe amount of money paid for normal time of work. Itincludes, apart from basic wages and salaries, cost-of-living allowances, meal benefits, commissions and tips,good attendance bonuses, shift allowances, guaranteedyear-end bonuses, and other guaranteed and regularbonuses and allowances. The nominal wage indexmeasures the pure changes in wage rates unaffected bychanges in industrial and occupational structurebetween two successive reference months.
實質工資指數是從名義工資指數中,按甲類
消費物價指數的變幅,扣除通脹的影響而得
出,可顯示工資金額購買力的轉變。
The real wage index, obtained by deflating thenominal wage index by the Consumer Price Index(A),indicates changes in the purchasing power of theamount of wages earned.
薪金率的定義包括基本薪金、生活津貼、固
定發放的年終花紅、佣金及小費、及其他固
定及定期發放的花紅和津貼。名義薪金指數
(甲)可量度經理級與專業僱員平均薪金率
的總體變動情況。名義薪金指數(乙)則是
用來反映連續兩年均留任同一職業及同一
Salary rate is defined to include basic salaries, cost-of-living allowances, guaranteed year-end bonuses,commissions and tips and other regular and guaranteedbonuses and allowances. Nominal salary index (A)measures the overall changes in average salary rates ofmanagerial and professional employees. Nominalsalary index (B) is derived to reflect only changes insalary rates of those managerial and professional

香港統計月刊 二零零三年六月 Hong Kong Monthly Digest of Statistics June 200312
公司的經理級與專業僱員薪金率變動情況,
因此只反映因一般薪金遞增、工作表現和年
資累積而增薪的薪金率變動。實質薪金指數
(甲)及實質薪金指數(乙)是從有關名義
指數中,按丙類消費物價指數的變幅,扣除
通脹的影響而得出,可量度薪金購買力的轉
變。
employees who have been in the same occupation andin the same company in two consecutive years. It onlyaccounts for changes in salary rates due to generalincrement, meritorious increase and gain in seniority.Real salary index (A) and real salary index (B),obtained by deflating the respective nominal indices bythe Consumer Price Index (C), measure changes in thepurchasing power of the amount of salaries earned.
意外、傷亡及停工 Accidents, Injuries and Work Stoppages
職業傷亡個案是根據僱員補償條例呈報由工
作意外引致死亡或失去工作能力連續三天以
上的受傷個案(包括工業意外個案)。由一
九九八年一月一日開始,在每一時段所紀錄
得的數字乃指在所述時段內發生的傷亡個
案。
Occupational injuries are injuries (including industrialaccidents) arising from work accidents, resulting indeath or incapacity for work of over 3 consecutive daysand reported under the Employees' CompensationOrdinance. Since 1.1.1998, occupational injuries in aparticular period refer to the actual number of injurycases which occurred in that period.
工業意外指根據工廠及工業經營條例於工業
經營內由工業活動所引致之受傷及死亡個
案。由一九九八年一月一日開始,在每一時
段所紀錄得的數字乃指在所述時段內發生的
傷亡個案。
Industrial accidents refer to injuries and deaths arisingfrom industrial activities in an industrial undertaking asdefined under the Factories and Industrial UndertakingsOrdinance. Since 1.1.1998, industrial accidents in aparticular period refer to the actual number of accidentcases which occurred in that period.
工業僱員停工事件的統計數字包括因僱用條
件引起勞資糾紛所導致的僱員停工事件。
Statistics on industrial work stoppages cover stoppagesof work arising from disputes connected with terms andconditions of employment.
其他有關刊物 Further References
僱用於政府建築工程的工人每日平均工資
就業及空缺統計(詳細統計表):甲、乙、丙、丁系列
就業及空缺按季統計報告
建築地盤就業及空缺按季統計報告
綜合住戶統計調查按季統計報告書工資及薪金總額按季統計報告經理級與專業僱員薪金及僱員福利統計
報告(高層管理人員除外)
Average Daily Wages of Workers Engaged inGovernment Building and Construction Projects
Employment and Vacancies Statistics (Detailed Tables): Series A, B, C and D
Quarterly Report of Employment and VacanciesStatistics
Quarterly Report of Employment and Vacancies atConstruction Sites
Quarterly Report on General Household SurveyQuarterly Report of Wage and Payroll StatisticsReport of Salaries and Employee Benefits Statistics -
Managerial and Professional Employees (ExcludingTop Management)

圖 2.1 失業率及就業不足率Chart 2.1 Unemployment Rate and Underemployment Rate
圖 2.2 名義及實質工資指數的變動情況Chart 2.2 Movements of the Nominal and Real Wage Indices
註釋: Note: Annual year-on-year rate of change refers toSeptember of the year
全年的按年變動率指每年九月份的數字
失業率Unemployment rate
失業率(經季節性調整)Unemployment rate(seasonally adjusted)
就業不足率Underemployment rate
0
1
2
3
4
5
6
7
8
2/01 -4/01
6/01 -8/01
10/01 -12/01
2/02 -4/02
6/02 -8/02
10/02 -12/02
2/03 -4/03
%
0
1
2
3
4
5
6
7
8
1992 1994 1996 1998 2000 2002
%
名義工資指數按年變動率Year-on-year rate of changein nominal wage index
實質工資指數按年變動率Year-on-year rate of changein real wage index
-4
-2
0
2
4
6
8
10
12
12/00 6/01 12/01 6/02 12/02
%
-4
-2
0
2
4
6
8
10
12
1992 1994 1996 1998 2000 2002
%
13香港統計月刊 二零零三年六月 Hong Kong Monthly Digest of Statistics June 2003

2.1 勞動人口、失業及就業不足統計
Labour Force, Unemployment and Underemployment
期間 男 男 合計
Period Male Male Overall
2000 1 964.0 73.5 61.4
2001 1 965.2 72.9 61.4
2002 1 964.6 72.5 61.8
12/2001 - 2/2002 1 959.2 72.5 61.6
1/2002 - 3/2002 1 958.6 72.4 61.62/2002 - 4/2002 1 956.4 72.3 61.43/2002 - 5/2002 1 957.3 72.3 61.44/2002 - 6/2002 1 958.4 72.3 61.55/2002 - 7/2002 1 972.3 72.8 62.16/2002 - 8/2002 1 973.3 72.9 62.2
7/2002 - 9/2002 1 977.3 73.0 62.38/2002 - 10/2002 1 969.6 72.6 62.29/2002 - 11/2002 1 971.6 72.6 62.2
10/2002 - 12/2002 1 964.3 72.3 62.011/2002 - 1/2003 1 963.7 72.2 61.912/2002 - 2/2003 1 958.5 72.0 61.6
1/2003 - 3/2003 1 959.6 71.9 61.52/2003 - 4/2003 # N.A. N.A. N.A.
期間
Period
2000
2001
2002
12/2001 - 2/2002
1/2002 - 3/20022/2002 - 4/20023/2002 - 5/20024/2002 - 6/20025/2002 - 7/20026/2002 - 8/2002
7/2002 - 9/20028/2002 - 10/20029/2002 - 11/2002
10/2002 - 12/200211/2002 - 1/200312/2002 - 2/2003
1/2003 - 3/20032/2003 - 4/2003 #
註釋: ## Note : ##
adjustment is not applicable to annual average unemployment rates.
資料來源: 政府統計處綜合住戶統計調查組(二) Source :(查詢電話:2887 5508)
3 517.8 52.5
1 552.5 3 524.0 52.61 554.6 52.5
252.6 7.2 109.7 3.1 245.6 7.2 107.8 3.1
3.1 108.0
2.9
101.4
2.8 2.9
275.0 7.8
3.0 259.2 7.2 107.2 2.9
100.7 98.1
(千人)
失業人數
7.7 100.5
238.9
263.4
105.2
5.1
3 512.9
1 533.5 3 506.8
3 518.81 554.1
(Seasonally adjusted)Unemployment rate ##
1 548.4
Unemployed
1 501.8 3 460.1
166.9 4.9
3 518.0
1 523.3 3 495.6
1 535.6
(%)
255.5 7.3
(thousands)
174.8
7.1 7.0
6.8 227.8
2.8
(%)
(千人)
(thousands)Underemployment rate
(百分比)Underemployed
93.5
1 492.4 3 449.83 449.33 459.6
1 492.91 501.1
52.1
52.3 52.6
51.4
52.4
1 461.9
3 374.21 410.2
3 427.1
1 523.3
勞動人口(千人) Labour force (thousands)
女 總計
3 487.9
Female Total
勞動人口參與率(百分比) Labour force participation rate (%)
女Female
51.5
51.2
52.0
50.7
49.9
節性調整不適用於全年平均失業率。
General Household Survey Section (2), Census and Statistics Department(Enquiry Telephone No.: 2887 5508)
11 ARIMA) 方法就其季節性變異作出調整。季
adjusted for seasonal variations using the X-11 ARIMA method. Seasonal"Unemployment rate (seasonally adjusted)" refers to the unemployment rate經季節性調整的失業率是指計算失業率時,
已根據「X-11自迴歸─求和─移動平均」( X-
252.7 7.4 245.4
3.0 253.1 7.1 104.6
274.0 7.6
267.2 7.4
3.2
85.5 2.5
109.3
3.0
3.2 3.0
109.3
104.8
就業不足人數
1 542.6 3 501.1 52.1
(百分比) 就業不足率
(經季節性調整)
失業率 ##
255.9 7.4 101.2 2.9
259.8 7.5 100.7 2.9
N.A. 3 507.0 N.A.
1 496.4 3 455.6 51.4
1 543.8 3 503.5 52.0
51.2
274.0 7.8 113.0 3.2
14香港統計月刊 二零零三年六月 Hong Kong Monthly Digest of Statistics June 2003

2.2 按以前從事的行業劃分的曾工作的失業人數(1)
製造業 建造業
Manufacturing Construction
失業率 失業率 失業率
失業人數 (百分比) 失業人數 失業人數 (百分比) 失業人數 (百分比)
(千人) Unemploy- (千人) (千人) Unemploy- (千人) Unemploy-期間 Unemployed ment rate Unemployed Unemployed ment rate Unemployed ment rate
Period (thousands) (%) (thousands) (thousands) (%) (thousands) (%)
2000 19.0 5.4 34.3 54.5 5.3 4.02001 18.3 5.3 35.0 57.0 5.5 4.42002 22.8 7.3 53.8 83.4 7.8 5.411/2001 1/2002 23.2 7.0 43.0 70.8 6.7 5.712/2001 - 2/2002 23.3 7.0 49.4 75.9 7.1 5.41/2002 - 3/2002 23.3 7.2 53.3 79.4 7.4 5.72/2002 - 4/2002 23.9 7.5 55.6 82.0 7.6 5.33/2002 - 5/2002 23.3 7.6 55.9 87.5 8.1 5.54/2002 - 6/2002 25.4 8.2 56.2 89.2 8.3 5.35/2002 - 7/2002 24.6 7.9 55.4 88.8 8.2 5.36/2002 - 8/2002 24.6 7.7 52.2 85.5 8.0 5.57/2002 - 9/2002 22.4 7.1 53.1 81.4 7.7 5.38/2002 - 10/2002 22.0 7.0 53.3 80.6 7.7 5.29/2002 - 11/2002 21.0 6.8 51.7 80.8 7.7 5.2
10/2002 - 12/2002 20.1 6.6 52.7 83.5 7.9 5.411/2002 - 1/2003 19.7 6.3 52.8 82.9 7.8 5.712/2002 - 2/2003 21.1 6.9 63.4 83.4 7.7 6.01/2003 - 3/2003 22.9 7.3 64.2 85.8 7.9 6.1
金融、保險、 社區、社會
地產及商用服務業 及個人服務業
Financing, insurance, Community, social real estate and business services and personal services
失業率 失業率 失業率
(百分比) (百分比) 失業人數 (百分比)
Unemploy- Unemploy- (千人) Unemploy-期間 ment rate ment rate Unemployed ment rate
Period (%) (%) (thousands) (%)
2000 0.5 1.72001 0.4 1.62002 0.6 2.411/2001 - 1/2002 0.3 1.112/2001 - 2/2002 0.4 1.51/2002 - 3/2002 0.5 1.72/2002 - 4/2002 0.7 2.53/2002 - 5/2002 1.0 3.54/2002 - 6/2002 1.0 3.65/2002 - 7/2002 0.9 3.16/2002 - 8/2002 0.7 2.37/2002 - 9/2002 0.9 3.18/2002 - 10/2002 0.9 3.49/2002 - 11/2002 0.7 2.7
10/2002 - 12/2002 0.3 1.211/2002 - 1/2003 0.6 2.512/2002 - 2/2003 0.7 2.71/2003 - 3/2003 0.9 3.5
註釋: (1) 不包括首次求職人士及重新加入勞動人口的失業人士,因為 Note : (1)沒有關於他們以前從事行業的資料。
資料來源: 政府統計處綜合住戶統計調查組(二) Source :(查詢電話:2887 5508)
2.73.1
3.3
3.5
3.3
2.9
30.1 3.5
3.630.530.6
2.9
is not available.
3.0
25.524.1 4.7 27.4 3.1
21.4 4.4 25.7
19.4
15.2
18.9
(Enquiry Telephone No.: 2887 5508)
3.126.7
Not including first-time job-seekers and re-entrants into the labour force
General Household Survey Section (2),Census and Statistics Department
who were unemployed as information on previous industry of these persons
ment rate(%)
15.8
10.2
19.810.7
19.7
15.719.3
19.6
16.1
14.620.6
16.6
運輸、倉庫及通訊業
and communicationsTransport, storage
Unemployed Persons with a Previous Job(1) by Previous Industry
批發、零售、進出口
Wholesale, retail andimport/export trades,
貿易、飲食及酒店業
Unemployed
restaurants and hotels
失業人數
(百分比)
失業率
Unemploy-
14.8
(千人)
Others
(thousands)
25.622.3
16.614.012.1 2.6
15.023.2 4.7
16.4
15.6
16.916.715.8
15.4
15.5
14.8
18.6
19.820.5
18.819.4
失業人數
(thousands)
(千人)
19.7
22.221.7
18.9
Unemployed
21.8 4.527.4
1.8
2.6
3.0 2.027.0 3.2
2.524.223.421.5 4.4
24.0 4.6
4.3
28.1
22.7 4.524.122.9
24.2 4.7
21.6 4.5 25.4
21.421.54.64.3
20.422.7
21.9
2.9
13.0 21.1
4.8
26.7
4.9
4.94.7
20.7
其他
15香港統計月刊 二零零三年六月 Hong Kong Monthly Digest of Statistics June 2003

2.3 按以前從事的職業劃分的曾工作的失業人數(1)
Unemployed Persons with a Previous Job(1) by Previous Occupation 經理及行政級人員 專業人員 輔助專業人員 文員
Managers and administrators Professionals Associate professionals Clerks
失業率 失業率 失業率 失業率
失業人數 (百分比) 失業人數 (百分比) 失業人數 (百分比) 失業人數 (百分比)
(千人) Unemploy- (千人) Unemploy- (千人) Unemploy- (千人) Unemploy-期間 Unemployed ment rate Unemployed ment rate Unemployed ment rate Unemployed ment rate
Period (thousands) (%) (thousands) (%) (thousands) (%) (thousands) (%)
2000 3.9 1.7 1.1 3.5
2001 5.2 1.9 1.9 3.7
2002 8.2 2.7 2.4 5.3
11/2001 - 1/2002 7.6 2.6 2.8 4.612/2001 - 2/2002 8.6 3.0 2.8 5.1
1/2002 - 3/2002 9.9 3.5 2.6 5.22/2002 - 4/2002 9.9 3.4 2.6 5.63/2002 - 5/2002 10.4 3.4 2.6 5.54/2002 - 6/2002 9.8 3.1 2.5 5.55/2002 - 7/2002 9.4 3.0 2.7 5.36/2002 - 8/2002 8.1 2.6 2.6 5.4
7/2002 - 9/2002 7.0 2.3 2.3 5.48/2002 - 10/2002 7.0 2.3 1.9 5.49/2002 - 11/2002 6.4 2.1 2.2 5.2
10/2002 - 12/2002 5.9 1.9 2.1 5.211/2002 - 1/2003 5.7 1.9 2.3 4.912/2002 - 2/2003 5.5 1.8 2.4 4.8
1/2003 - 3/2003 5.9 2.1 2.2 5.0
服務工作及 機台及機器
商店銷售人員 操作員及裝配員
Service workers and 工藝及有關人員 Plant and machine 非技術工人 其他
shop sales workers Craft and related workers operators and assemblers Elementary occupations Others
失業率 失業率 失業率 失業率 失業率
失業人數 (百分比) 失業人數 (百分比) 失業人數 (百分比) 失業人數 (百分比) 失業人數 (百分比)
(千人) Unemploy- (千人) Unemploy- (千人) Unemploy- (千人) Unemploy- (千人) Unemploy-期間 Unemployed ment rate Unemployed ment rate Unemployed ment rate Unemployed ment rate Unemployed ment rate
Period (thousands) (%) (thousands) (%) (thousands) (%) (thousands) (%) (thousands) (%)
2000 34.1 6.9 8.9 11.5 30.3 4.9 2.7
2001 33.2 6.5 9.3 12.2 33.7 5.2 3.1
2002 47.6 9.1 14.0 15.1 51.4 7.7 3.4
11/2001 - 1/2002 39.6 7.8 11.1 16.4 45.3 6.8 2.312/2001 - 2/2002 42.2 8.3 12.0 15.5 45.4 6.8 1.9
1/2002 - 3/2002 43.9 8.5 12.6 16.3 49.1 7.4 2.42/2002 - 4/2002 46.3 8.9 14.2 14.5 48.4 7.4 2.83/2002 - 5/2002 47.9 9.3 14.8 16.1 48.6 7.4 3.94/2002 - 6/2002 48.7 9.6 15.7 16.7 50.3 7.7 2.95/2002 - 7/2002 49.8 9.7 15.2 15.9 52.4 7.9 2.66/2002 - 8/2002 49.2 9.6 14.5 14.4 54.2 8.1 1.7
7/2002 - 9/2002 47.2 9.1 14.3 13.9 52.2 7.8 4.78/2002 - 10/2002 45.5 8.6 13.7 14.0 53.4 7.8 6.89/2002 - 11/2002 48.5 9.2 13.0 13.8 52.3 7.7 6.4
10/2002 - 12/2002 50.5 9.4 13.5 13.3 54.0 7.9 3.911/2002 - 1/2003 51.6 9.6 13.7 14.7 51.0 7.5 2.612/2002 - 2/2003 50.0 9.1 16.3 16.7 53.8 8.0 2.7
1/2003 - 3/2003 51.7 9.4 16.2 17.0 54.5 8.0 4.6
註釋: (1) 不包括首次求職人士及重新加入勞動人口的失業人士,因為 Note : (1)沒有關於他們以前從事職業的資料。
資料來源: 政府統計處綜合住戶統計調查組(二) Source :(查詢電話:2887 5508)
26.6
54.1 6.8 0.4
38.5 6.3 0.2
53.4 6.5 0.2
4.9 25.8 4.3 26.9
44.9 0.3
47.4
4.8 25.7 4.3 30.2
5.9 0.3
4.5 25.9 4.3 28.3
4.2
4.6
4.3 28.0
31.7
0.3
5.35.4
5.35.1
30.531.5
25.3
4.7
26.7
3.721.8
4.325.2 4.327.3 4.7
4.5
31.4
30.3
31.4
4.2
26.7
21.3
21.6
13.4 2.4
17.0 2.9
29.323.6
32.5
4.0
24.824.425.0
4.14.94.85.0
(Enquiry Telephone No.: 2887 5508)
4.7
4.6
0.3
26.7 4.5
28.8
30.8
0.2
4.2
General Household Survey Section (2),Census and Statistics Department
43.5
53.651.9
6.6
0.6
Not including first-time job-seekers and re-entrants into the labour forcewho were unemployed as information on previous occupation of thesepersons is not available.
6.25.7
2.1
3.7
47.3
48.6
41.4
43.849.351.4
4.9
32.5
0.30.3
0.2
0.4
6.0
6.45.86.4
5.2
0.5
4.1 26.6 4.4 30.5
0.30.2
5.4
5.4
45.5 5.7 0.2
4.9 23.4 3.8 27.1
45.0 5.5 0.6
16香港統計月刊 二零零三年六月 Hong Kong Monthly Digest of Statistics June 2003

2.4 公務員人數(1)及有關職位空缺數目Number of Civil Servants(1) and Civil Service Vacancies
就業人數 職位空缺數目
Persons engaged Vacancies 年 月 男 女 總計
Year Month Male Female Total
2000 121 698 60 829 182 527 1 6012001 116 051 58 498 174 549 1 9182002 112 760 56 889 169 649 1 7042001 12 116 051 58 498 174 549 1 9182002 3 115 202 57 827 173 029 1 675
6 114 352 57 391 171 743 1 9309 113 336 57 148 170 484 1 740
12 112 760 56 889 169 649 1 704
註釋: Notes :
(1) (1)
資料來源: 政府統計處就業統計組 Source : Employment Statistics Section,(查詢電話:2582 5076) Census and Statistics Department
(Enquiry Telephone No.: 2582 5076)
For the definition of the Civil Servants, please refer to the'Concepts and Methods' on page 10 for details.
有關公務員的定義,請參閱第十頁的「概念及方法」。
按月數字是指有關月份的月終數字。按年數字是指有關年度的十二月終數字。但在二零零一年以前,則為有關年度的下一年一月初的數字。
Monthly figures refer to the end of the month. Annual figuresrefer to the end of December of the year. However, prior to2001, annual figures refer to the beginning of January of the yearfollowing the reference year.
17香港統計月刊 二零零三年六月 Hong Kong Monthly Digest of Statistics June 2003

2.5 按行業類別劃分的機構單位數目、就業人數及職位空缺數目(公務員除外)Number of Establishments, Persons Engaged and Vacancies (Other Than Those in the Civil Service) by Industry Sector
機構單位數目 就業人數 職位空缺數目
Establishments Persons engaged Vacancies 年 月 男 女 總計
Year Month Male Female Total
採礦及採石業
Mining and quarrying
2000 6 142 12 154 02001 7 171 8 179 02002 6 111 6 117 02001 12 7 171 8 179 02002 3 7 153 7 160 0
6 6 128 7 135 09 6 126 7 133 0
12 6 111 6 117 0製造業
Manufacturing
2000 21 248 128 991 97 214 226 205 1 7232001 19 977 116 490 86 494 202 984 1 1012002 19 106 106 811 77 692 184 503 9042001 12 19 977 116 490 86 494 202 984 1 1012002 3 19 114 113 113 84 272 197 385 1 419
6 20 070 115 491 84 597 200 088 1 4829 18 745 109 654 80 423 190 077 1 412
12 19 106 106 811 77 692 184 503 904電力及燃氣業
Electricity and gas
2000 19 7 075 1 128 8 203 212001 20 7 043 1 053 8 096 82002 17 7 194 1 212 8 406 42001 12 20 7 043 1 053 8 096 82002 3 21 7 096 1 122 8 218 4
6 21 7 138 1 237 8 375 69 17 7 149 1 193 8 342 8
12 17 7 194 1 212 8 406 4建築地盤 (只包括地盤工人) (1)
Construction sites (manual workers only) (1)
2000 978 78 898 5 026 83 924 1772001 931 71 182 5 419 76 601 752002 949 61 876 4 517 66 393 282001 12 931 71 182 5 419 76 601 752002 3 947 70 973 5 958 76 931 142
6 992 72 807 6 386 79 193 579 959 65 215 5 161 70 376 61
12 949 61 876 4 517 66 393 28
18香港統計月刊 二零零三年六月 Hong Kong Monthly Digest of Statistics June 2003

2.5 (續) 按行業類別劃分的機構單位數目、就業人數及職位空缺數目(公務員除外)
(Cont'd.) Number of Establishments, Persons Engaged and Vacancies(Other Than Those in the Civil Service) by Industry Sector
機構單位數目 就業人數 職位空缺數目
Establishments Vacancies 年 月 男 女 總計
Year Month Male Female Total
批發、零售、進出口貿易、飲食及酒店業 (2)
Wholesale, retail and import/export trades, restaurants and hotels (2)
2000 183 486 530 171 478 923 1 009 094 9 7752001 182 001 517 011 479 960 996 971 5 7642002 188 772 505 784 477 173 982 957 6 0092001 12 182 001 517 011 479 960 996 971 5 7642002 3 186 769 520 485 475 568 996 053 8 221
6 186 958 508 545 479 567 988 112 8 8959 196 624 527 124 486 853 1 013 977 7 135
12 188 772 505 784 477 173 982 957 6 009 運輸、倉庫及通訊業 (2)
Transport, storage and communications (2)
2000 10 411 116 720 60 229 176 949 1 4242001 10 566 119 903 61 795 181 698 1 2312002 11 083 114 400 61 293 175 693 1 0032001 12 10 566 119 903 61 795 181 698 1 2312002 3 10 673 118 784 62 516 181 300 1 242
6 11 159 119 179 63 929 183 108 1 2179 10 972 118 547 61 813 180 360 1 191
12 11 083 114 400 61 293 175 693 1 003金融、保險、地產及商用服務業
Financing, insurance, real estate and business services
2000 51 930 247 457 186 648 434 105 7 0552001 51 190 248 416 185 458 433 874 4 2832002 56 443 255 251 186 054 441 305 4 5532001 12 51 190 248 416 185 458 433 874 4 2832002 3 50 537 244 493 178 944 423 437 5 373
6 54 877 247 221 183 029 430 250 6 0289 52 734 244 923 179 575 424 498 4 817
12 56 443 255 251 186 054 441 305 4 553社區、社會及個人服務業 (2) (3)
Community, social and personal services (2) (3)
2000 29 031 136 646 217 891 354 537 5 1042001 31 255 145 563 239 490 385 053 4 6972002 33 968 150 506 252 059 402 565 3 7152001 12 31 255 145 563 239 490 385 053 4 6972002 3 31 832 148 747 243 314 392 061 4 377
6 33 129 148 698 242 147 390 845 4 1729 32 942 150 261 248 083 398 344 4 164
12 33 968 150 506 252 059 402 565 3 715
Persons engaged
19香港統計月刊 二零零三年六月 Hong Kong Monthly Digest of Statistics June 2003

2.5 (續) 按行業類別劃分的機構單位數目、就業人數及職位空缺數目(公務員除外)
(Cont'd.)Number of Establishments, Persons Engaged and Vacancies(Other Than Those in the Civil Service) by Industry Sector
機構單位數目 就業人數 職位空缺數目
Establishments Persons engaged Vacancies 年 月 男 女 總計
Year Month Male Female Total
所有上列行業類別 (2) (3)
All above industry sectors (2) (3)
2000 297 109 1 246 100 2 293 171 25 2792001 295 947 1 225 779 2 285 456 17 1592002 310 344 1 201 933 2 261 939 16 2162001 12 295 947 1 225 779 2 285 456 17 1592002 3 299 900 1 223 844 2 275 545 20 778
6 307 212 1 219 207 2 280 106 21 8579 312 999 1 222 999 2 286 107 18 788
12 310 344 1 201 933 2 261 939 16 216
註釋: 按月數字是指有關月份的月終數字。按年數字是指 Notes :有關年度的十二月終數字。 refer to the end of December of the year.
(1) 建築地盤的機構單位數目是指地盤數目,而就業 (1)
人數及職位空缺數目只包括地盤工人。
only.
(2) 統計數字所包括的行業範圍並不完整。個別行業 (2)
類別及「所有上列行業類別」的總體數字是指包
括在「僱傭及職位空缺按季統計調查」與「建築
地盤就業人數按季統計調查」的選定行業而言。
(3) 由二零零二年三月統計期開始,社區、社會及個 (3)
人服務業類別的範圍已涵蓋多五個行業。詳情請
參閱第十一頁的「概念及方法」。
資料來源: 政府統計處就業統計組 Source : Employment Statistics Section,(查詢電話:2582 5076) Census and Statistics Department
(Enquiry Telephone No.: 2582 5076)
1 059 677
covered in the Quarterly Survey of Employment and
1 060 006
refer to the 'Concepts and Methods' on page 11 for details.
1 047 071
while persons engaged and vacancies refer to manual workers
1 051 7011 060 8991 063 108
1 059 6771 060 006
Monthly figures refer to the end of the month. Annual figures
Construction Sites.
coverage has been expanded to include five more industries inthe community, social and personal services sector. Please
Starting from the March 2002 round of SEV, the industrial
Establishments in construction sites refer to number of sites,
Vacancies (SEV) and the Quarterly Employment Survey of
The industrial coverage is not complete. Aggregate figuresfor the individual industry sectors and for the 'All aboveindustry sectors' refer only to those selected industries
20香港統計月刊 二零零三年六月 Hong Kong Monthly Digest of Statistics June 2003

2.6 按主要行業組別劃分的機構單位數目、就業人數及職位空缺數目(公務員除外)Number of Establishments, Persons Engaged and Vacancies (OtherThan Those in the Civil Service) by Major Industry Group
二零零二年九月 二零零二年十二月
機構單位 機構單位
數目 就業人數 職位空缺 數目 就業人數 職位空缺
行業類別/ Industry sector/ Establish- Persons 數目 Establish- Persons 數目
主要行業組別 Major industry group ments engaged Vacancies ments engaged Vacancies
採礦及採石業 Mining and quarrying 6 133 0 6 117 0製造業 Manufacturing 18 745 190 077 1 412 19 106 184 503 904食品製造業 Food, manufacturing 736 19 601 95 739 18 895 73飲品製造業 Beverage industries 28 3 252 9 28 3 202 19煙草製品業 Tobacco manufactures 3 470 4 3 467 0服裝製品業 Wearing apparel 1 516 25 239 673 1 660 23 289 374(鞋類除外) (excl. footwear),
manufacturing
皮革製造及皮革 Leather and leather 56 267 *** 56 240 0製品業(鞋類及 products (excl. footwear服裝製品除外) and wearing apparel),
manufacturing
鞋類製造業(橡 Footwear (excl. rubber, 31 151 *** 32 144 0膠、塑膠及木 plastic and wooden質鞋類除外) footwear), manufacturing
紡織製品業 Textiles industries 1 777 26 364 42 1 812 25 416 21木材及水松製品業 Wood and cork products 204 556 2 191 450 ***(傢具除外) (excl. furniture),
manufacturing
傢具及固定裝置製 Furniture and fixtures 204 555 4 175 422 0造業(金屬傢具 (excl. primarily of metal除外,即不包括 i.e. major industry groups主要行業組別 'Fabricated metal products'),「金屬製品業」 manufacturing內的製品)
紙張及紙品製造業 Paper and paper products, 540 2 839 15 544 2 822 1manufacturing
印刷、出版及 Printing, publishing and 4 716 41 837 198 4 698 39 981 137有關行業 allied industries
化學品及化學產品 Chemicals and chemical 414 4 495 22 429 4 706 20製造業 products, manufacturing
石油及煤產品 Products of petroleum 2 108 *** 2 83 ***製造業 and coal, manufacturing
橡膠製品業 Rubber products, 62 430 *** 61 442 0manufacturing
塑膠製品業 Plastic products, 863 4 465 19 924 4 717 3manufacturing
非金屬礦產製品業 Non-metallic mineral 233 1 728 7 244 1 817 0(石油及煤產品 products (excl. products 除外) of petroleum and coal),
manufacturing
基本金屬製造業 Basic metal, manufacturing 93 1 311 5 84 1 362 1金屬製品業 Fabricated metal products 1 851 7 679 21 1 963 7 908 19(機械及設備 (excl. machinery and 除外) equipment), manufacturing
December 2002September 2002
21香港統計月刊 二零零三年六月 Hong Kong Monthly Digest of Statistics June 2003

2.6 (續) 按主要行業組別劃分的機構單位數目、就業人數及職位空缺數目(公務員除外)
(Cont'd.) Number of Establishments, Persons Engaged and Vacancies (OtherThan Those in the Civil Service) by Major Industry Group
二零零二年十二月
機構單位 機構單位
數目 就業人數 職位空缺 數目 就業人數 職位空缺
行業類別/ Industry sector/ Establish- Persons 數目 Establish- Persons 數目
主要行業組別 Major industry group ments engaged Vacancies ments engaged Vacancies
辦公室、會計及 Office, accounting and 382 3 240 38 383 2 800 27計算器材製造業 computing machinery,
manufacturing
收音機、電視機及 Radio, television & 117 2 110 14 114 1 980 8通訊設備與 communications器材製造業 equipment and apparatus,
manufacturing
電子零件製造業 Electronic parts and 142 11 291 39 137 11 006 17components, manufacturing
家庭電器用具及 Electrical appliances & 57 447 0 53 458 0電子玩具製造業 houseware and electronic
toys, manufacturing
其他機械、設備、 Machinery, equipment, 2 061 10 620 74 2 104 10 660 77儀器及零件 apparatus, parts and製造業 components, n.e.c.,
manufacturing
運輸設備製造業 Transport equipment, 579 8 646 58 546 8 532 61manufacturing
其他專業、科學、 Professional & scientific, 357 2 864 8 305 2 661 6量度及控制用的 measuring & controlling設備,與攝影及 equipment, n.e.c., and光學用品製造業 photographic & optical
goods, manufacturing
其他產品製造業 Manufacturing industries, 1 721 9 512 64 1 819 10 043 39n.e.c.
電力及燃氣業 Electricity and gas 17 8 342 8 17 8 406 4建築地盤 (1) Construction sites (1) 959 70 376 61 949 66 393 28(只包括地盤工人) (manual workers only)
公營地盤 Public sector sites
樓宇建築地盤 Building sites 141 9 638 3 145 10 724 0土木工程地盤 Civil engineering sites 240 19 007 41 246 18 086 28
私營地盤 Private sector sites
樓宇建築地盤 Building sites 491 39 022 17 477 34 562 0土木工程地盤 Civil engineering sites 87 2 709 0 81 3 021 0
批發、零售、 Wholesale, retail and 196 624 1 013 977 7 135 188 772 982 957 6 009進出口貿易、 import/export trades,飲食及酒店業 (2) restaurants and hotels (2)
批發業 Wholesale 16 096 67 398 380 15 514 65 605 444零售業 Retail 60 207 221 257 1 613 58 283 211 076 1 478進出口貿易業 Import/export 108 591 513 030 3 790 103 383 499 735 3 018飲食業 Restaurants 10 988 185 963 1 119 10 856 180 547 854酒店及旅舍業 Hotels and boarding 742 26 329 233 736 25 994 215
houses
December 2002September 2002二零零二年九月
22香港統計月刊 二零零三年六月 Hong Kong Monthly Digest of Statistics June 2003

2.6 (續) 按主要行業組別劃分的機構單位數目、就業人數及職位空缺數目(公務員除外)
(Cont'd.) Number of Establishments, Persons Engaged and Vacancies (OtherThan Those in the Civil Service) by Major Industry Group
二零零二年九月 二零零二年十二月
機構單位 機構單位
數目 就業人數 職位空缺 數目 就業人數 職位空缺
行業類別/ Industry sector/ Establish- Persons 數目 Establish- Persons 數目
主要行業組別 Major industry group ments engaged Vacancies ments engaged Vacancies
運輸、倉庫及 Transport, storage and 10 972 180 360 1 191 11 083 175 693 1 003通訊業 (2) communications (2)
陸路客運業 Land passenger 10 32 282 235 10 32 219 222transport
陸路運輸 Supporting services to 528 6 549 46 547 6 562 27輔助服務業 land transport
遠洋及沿岸 Ocean and coastal 346 7 758 8 359 7 599 12海上運輸業 water transport
港內海上運輸業 Inland water transport 5 1 180 1 5 1 162 0海上運輸 Supporting services to 3 143 19 598 106 3 114 18 633 43輔助服務業 water transport
空運業 Air transport 140 24 855 137 139 24 429 124其他與運輸有關 Services incidental to 5 154 47 652 211 5 281 48 176 266的服務業 transport
倉庫業 Storage 399 5 283 14 405 5 772 18電訊業 Telecommunications 574 24 237 348 542 20 877 164其他通訊服務 Miscellaneous 673 10 966 85 681 10 264 127(電訊服務 communications services 除外) (excl. telecommunications
services)
金融、保險、地產 Financing, insurance, real 52 734 424 498 4 817 56 443 441 305 4 553及商用服務業 estate and business services
銀行業 Banking 1 600 72 287 683 1 576 72 230 629金融及投資公司 Finance and investment 3 321 25 889 216 3 651 24 332 255
companies
證券、期貨及 Stock, commodity and 940 13 573 33 970 13 720 43金銀經紀、 bullion brokers,交易與服務業 exchanges and services
其他金融機構 Financial institutions, 1 765 14 838 67 1 772 14 289 243n.e.c.
保險業 Insurance 7 762 26 157 910 8 087 27 510 443地產業 Real estate 9 791 83 401 1 020 10 435 87 234 1 475機械及設備 Rental of machinery 208 1 120 2 196 937 4租賃業 and equipment
商用服務業 Business services 27 347 187 233 1 886 29 756 201 053 1 461(機械及設備 (excl. rental of 租賃除外) machinery and
equipment)
December 2002September 2002
23香港統計月刊 二零零三年六月 Hong Kong Monthly Digest of Statistics June 2003

2.6 (續) 按主要行業組別劃分的機構單位數目、就業人數及職位空缺數目(公務員除外)
(Cont'd.) Number of Establishments, Persons Engaged and Vacancies (OtherThan Those in the Civil Service) by Major Industry Group
二零零二年九月 二零零二年十二月
機構單位 機構單位
數目 職位空缺 數目 就業人數 職位空缺
行業類別/ Industry sector/ Establish- 數目 Establish- Persons 數目
主要行業組別 Major industry group ments Vacancies ments engaged Vacancies
社區、社會及 Community, social and 32 942 4 164 33 968 402 565 3 715個人服務業 (2) (3) personal services (2) (3)
清潔及同類 Sanitary and similar 1 543 315 1 582 52 922 228服務業 services
教育服務業 Education services 4 250 620 4 359 123 562 513研究及科學機構 Research and scientific 52 6 46 454 7
institutes
醫療、牙科、其 Medical, dental, other health 5 039 1 416 5 094 74 684 1 172他保健及獸醫 and veterinary services服務業
福利機構 Welfare institutions 2 730 663 2 830 48 216 731商會 Business associations 352 69 340 3 496 75其他社會及有關 Miscellaneous social and 609 43 615 6 079 31社區服務業 related community services
電影及其他 Motion pictures and other 2 822 199 2 857 19 701 118娛樂服務業 entertainment services
圖書館、博物館 Libraries, museums 73 2 75 454 4及文化服務業 and cultural services
其他娛樂及 Miscellaneous 1 140 320 1 138 18 149 428康樂服務業 amusement and
recreational services
維修服務業 Repair services 4 322 69 4 534 15 113 60洗熨、乾洗、 Laundry, dry cleaning 1 732 11 1 774 6 069 39衣物修補及 and garment services有關服務業
其他個人服務業 Miscellaneous personal 8 278 431 8 724 33 666 309services
所有上列行業類別 (2) (3) All above industry sectors (2) (3) 312 999 18 788 310 344 2 261 939 16 216
註釋: (1) 建築地盤的機構單位數目是指地盤數目,而就業 Notes : (1)
人數及職位空缺數目只包括地盤工人。
(2) 統計數字所包括的行業範圍並不完整。個別行業 (2)
類別及「所有上列行業類別」的總體數字是指包
括在「僱傭及職位空缺按季統計調查」與「建築
地盤就業人數按季統計調查」的選定行業而言。
Construction Sites.(3) 由二零零二年三月統計期開始,社區、社會及個 (3)
人服務業類別的範圍已涵蓋多五個行業。詳情請
參閱第十一頁的「概念及方法」。
refer to the 'Concepts and Methods' on page 11 for details.'n.e.c.' denotes not elsewhere classified.
*** 為使個別機構單位所提供的資料得以保密,數據 ***
不予公布。
資料來源: 政府統計處就業統計組 Source : Employment Statistics Section,(查詢電話:2582 5076) Census and Statistics Department
(Enquiry Telephone No.: 2582 5076)
53 728
447
information provided by individual establishment.Data are not released in order to safeguard confidentiality of
Establishments in construction sites refer to number of sites,while persons engaged and vacancies refer to manual workersonly.The industrial coverage is not complete. Aggregate figures
Starting from the March 2002 round of SEV, the industrialcoverage has been expanded to include five more industries inthe community, social and personal services sector. Please
2 286 107
for the individual industry sectors and for the 'All aboveindustry sectors' refer only to those selected industriescovered in the Quarterly Survey of Employment andVacancies (SEV) and the Quarterly Employment Survey of
31 413
123 344
15 499
3 428
74 102
5 989
20 012
5 877
418
18 113
December 2002
45 974
September 2002
就業人數
Personsengaged
398 344
24香港統計月刊 二零零三年六月 Hong Kong Monthly Digest of Statistics June 2003

2.7 按行業類別及機構規模劃分的機構單位數目及就業人數(公務員除外)Number of Establishments and Persons Engaged (Other Than Those in the Civil Service) by Industry Sector and Size of Establishment
機構規模 二零零二年九月 二零零二年十二月
(按就業人數分類)
Size of establishment行業類別 (in terms of number 機構單位數目 就業人數 機構單位數目 就業人數
Industry sector of persons engaged) Establishments Persons engaged Establishments Persons engaged
採礦及採石業 1 - 9 3 3 3 3Mining and quarrying 20 - 49 2 70 3 114
50 - 99 1 60 0 0 總計 Total 6 133 6 117
製造業 1 - 9 15 462 44 250 15 970 45 708Manufacturing 10 - 19 1 656 22 257 1 626 21 545
20 - 49 1 047 31 500 966 28 68750 - 99 336 22 633 303 20 779
100 - 199 144 19 824 142 19 347200 - 499 70 21 111 71 21 557500 - 999 22 15 404 20 13 776
≧ 1 000 8 13 098 8 13 104 總計 Total 18 745 190 077 19 106 184 503
電力及燃氣業 1 - 9 6 39 6 38Electricity and gas 10 - 19 6 87 6 86
20 - 49 2 64 2 64 ≧ 1 000 3 8 152 3 8 218 總計 Total 17 8 342 17 8 406
建築地盤 (1) 1 - 9 266 1 296 266 1 357 (只包括地盤工人) 10 - 19 174 2 265 181 2 458Construction sites (1) 20 - 49 227 7 034 228 7 016 (manual workers only) 50 - 99 134 9 263 127 8 479
100 - 199 74 10 268 65 8 781200 - 499 55 15 675 56 16 459500 - 999 23 15 887 21 13 701
≧ 1 000 6 8 688 5 8 142 總計 Total 959 70 376 949 66 393
批發、零售、進出口貿易、飲食及酒店業 (2)
Wholesale, retail and import/export trades, restaurants and hotels (2)
批發、零售、 1 - 9 78 186 214 497 76 006 208 049 飲食及酒店業 10 - 19 5 818 77 001 5 599 74 050 Wholesale, retail and 20 - 49 2 842 83 125 2 651 79 336 restaurants and hotels 50 - 99 789 54 742 741 51 077
100 - 199 309 39 538 302 38 399200 - 499 71 20 498 72 20 688500 - 999 18 11 546 18 11 623
小計 Sub-total 88 033 500 947 85 389 483 222
進出口貿易業 1 - 9 98 217 265 057 93 592 258 298 Import/export trades 10 - 19 7 091 92 305 6 402 83 200
20 - 49 2 494 72 079 2 583 74 39250 - 99 544 36 416 561 37 612
100 - 199 182 24 418 184 24 602200 - 499 53 15 344 52 14 833500 - 999 7 3 764 6 3 214
≧ 1 000 3 3 647 3 3 584 小計 Sub-total 108 591 513 030 103 383 499 735
總計 Total 196 624 1 013 977 188 772 982 957
December 2002September 2002
25香港統計月刊 二零零三年六月 Hong Kong Monthly Digest of Statistics June 2003

2.7 (續) 按行業類別及機構規模劃分的機構單位數目及就業人數(公務員除外)(Cont'd.) Number of Establishments and Persons Engaged (Other Than Those
in the Civil Service) by Industry Sector and Size of Establishment
機構規模 二零零二年十二月
(按就業人數分類)
Size of establishment行業類別 (in terms of number 機構單位數目 就業人數 機構單位數目 就業人數
Industry sector of persons engaged) Establishments Persons engaged Establishments Persons engaged
運輸、倉庫及通訊業 (2) 1 - 9 8 661 27 208 8 835 27 261Transport, storage 10 - 19 1 280 17 204 1 183 15 397 and communications (2) 20 - 49 664 19 926 701 21 044
50 - 99 188 12 875 192 13 025100 - 199 89 12 275 83 11 621200 - 499 61 17 652 61 17 410500 - 999 14 9 368 12 7 813
≧ 1 000 15 63 852 16 62 122 總計 Total 10 972 180 360 11 083 175 693
金融、保險、地產 1 - 9 46 644 112 070 49 869 118 200 及商用服務業 10 - 19 3 254 43 744 3 733 49 766Financing, insurance, 20 - 49 1 828 54 591 1 877 56 126 real estate and 50 - 99 537 36 469 491 33 219 business services 100 - 199 230 31 761 237 32 439
200 - 499 151 45 423 146 44 313500 - 999 59 41 457 54 38 172
≧ 1 000 31 58 983 36 69 070 總計 Total 52 734 424 498 56 443 441 305
社區、社會及 1 - 9 27 434 78 377 28 149 79 082 個人服務業 (2) (3) 10 - 19 2 714 37 367 3 107 42 297Community, social and 20 - 49 1 592 48 623 1 554 47 696 personal services (2) (3) 50 - 99 928 68 038 886 65 963
100 - 199 169 21 406 170 21 777200 - 499 60 17 176 58 16 779500 - 999 22 16 685 20 14 905
≧ 1 000 23 110 672 24 114 066 總計 Total 32 942 398 344 33 968 402 565
所有上列行業類別 (2) (3) 1 - 9 274 879 742 797 272 696 737 996All above industry sectors (2) (3) 10 - 19 21 993 292 230 21 837 288 799
20 - 49 10 698 317 012 10 565 314 47550 - 99 3 457 240 496 3 301 230 154
100 - 199 1 197 159 490 1 183 156 966200 - 499 521 152 879 516 152 039500 - 999 165 114 111 151 103 204
≧ 1 000 89 267 092 95 278 306 總計 Total 312 999 2 286 107 310 344 2 261 939
註釋: (1) 建築地盤的機構單位數目是指地盤數目,而就業 Notes : (1)
人數及職位空缺數目只包括地盤工人。
only.
(2) 統計數字所包括的行業範圍並不完整。個別行業 (2)
類別及「所有上列行業類別」的總體數字是指包
括在「僱傭及職位空缺按季統計調查」與「建築
地盤就業人數按季統計調查」的選定行業而言。
Construction Sites.
(3) 由二零零二年三月統計期開始,社區、社會及個 (3)
人服務業類別的範圍已涵蓋多五個行業。詳情請
參閱第十一頁的「概念及方法」。
資料來源: 政府統計處就業統計組 Source : Employment Statistics Section,(查詢電話:2582 5076) Census and Statistics Department
(Enquiry Telephone No.: 2582 5076)
refer to the 'Concepts and Methods' on page 11 for details.
Starting from the March 2002 round of SEV, the industrialcoverage has been expanded to include five more industries inthe community, social and personal services sector. Please
Vacancies (SEV) and the Quarterly Employment Survey of
The industrial coverage is not complete. Aggregate figuresfor the individual industry sectors and for the 'All aboveindustry sectors' refer only to those selected industries
二零零二年九月September 2002 December 2002
covered in the Quarterly Survey of Employment and
Establishments in construction sites refer to number of sites,while persons engaged and vacancies refer to manual workers
26香港統計月刊 二零零三年六月 Hong Kong Monthly Digest of Statistics June 2003

2.8 選定行業類別內經季節性調整及未經調整的就業人數(公務員除外)的按季變動百分率Quarter-to-quarter Percentage Change of the Seasonally Adjusted and Seasonally Unadjusted Statistics of Persons Engaged (Other Than Thosein the Civil Service) in Selected Industry Sectors
按季變動百分率
Quarter-to-quarter percentage change
2002 2002 2002 2002三月 六月 九月 十二月
選定行業類別 Selected industry sector Mar Jun Sep Dec
所有行業類別 (1) (2) All industry sectors (1) (2)
經季節性調整 Seasonally adjusted -0.7 -0.6 § +0.2未經季節性調整 Seasonally unadjusted -0.4 +0.2 +0.3 -1.1
製造業 Manufacturing
經季節性調整 Seasonally adjusted -1.7 -2.1 -3.0 -2.4未經季節性調整 Seasonally unadjusted -2.8 +1.4 -5.0 -2.9
建築地盤(只包括地盤工人) Construction sites (manual workers only)
經季節性調整 Seasonally adjusted -1.9 +2.3 -7.6 -6.3未經季節性調整 Seasonally unadjusted +0.4 +2.9 -11.1 -5.7
批發、零售、進出口貿易、 Wholesale, retail and飲食及酒店業 (1) import/export trades,
restaurants and hotels (1)
經季節性調整 Seasonally adjusted -1.0 -0.8 +0.8 -0.3未經季節性調整 Seasonally unadjusted -0.1 -0.8 +2.6 -3.1
金融、保險、地產 Financing, insurance, real 及商用服務業 estate and business services
經季節性調整 Seasonally adjusted -0.9 -0.4 -0.8 +3.8未經季節性調整 Seasonally unadjusted -2.4 +1.6 -1.3 +4.0
社區、社會及個人服務業 (1) (2) Community, social and personal services (1) (2)
經季節性調整 Seasonally adjusted +1.4 +0.4 +1.7 +0.8未經季節性調整 Seasonally unadjusted +1.8 -0.3 +1.9 +1.1
註釋: Notes: 調整。 when more up-to-date figures become available.
(1) 統計數字所包括的行業範圍並不完整。個別行業 (1)
類別及「所有上列行業類別」的總體數字是指包
括在「僱傭及職位空缺按季統計調查」與「建築
地盤就業人數按季統計調查」的選定行業而言。
Construction Sites.
(2) 由二零零二年三月統計期開始,社區、社會及個 (2)
人服務業類別的範圍已涵蓋多五個行業。詳情請
參閱第十一頁的「概念及方法」。
refer to the 'Concepts and Methods' on page 11 for details.
§ 變動在±0.05%之內。 § Change within ±0.05%.
資料來源: 政府統計處就業統計組 Source: Employment Statistics Section,(查詢電話:2582 5076) Census and Statistics Department
(Enquiry Telephone No.: 2582 5076)
-0.3-1.5
2001十二月
Dec
-2.9-3.0
+0.1-0.8
-0.8
+2.0+2.1
-0.3-3.0
-0.8
the community, social and personal services sector. Please
經季節性調整的數列會因應最新數據的趨勢而作定時
covered in the Quarterly Survey of Employment andVacancies (SEV) and the Quarterly Employment Survey of
Starting from the March 2002 round of SEV, the industrialcoverage has been expanded to include five more industries in
The seasonally adjusted data series is subject to routine revision
The industrial coverage is not complete. Aggregate figuresfor the individual industry sectors and for the 'All aboveindustry sectors' refer only to those selected industries
27香港統計月刊 二零零三年六月 Hong Kong Monthly Digest of Statistics June 2003

2.9 選定行業類別內經季節性調整及未經調整的職位空缺數目(公務員除外)的按季變動百分率Quarter-to-quarter Percentage Change of the Seasonally Adjusted and Seasonally Unadjusted Statistics of Vacancies (Other Than Thosein the Civil Service) in Selected Industry Sectors
按季變動百分率
Quarter-to-quarter percentage change
2002 2002 2002 2002三月 六月 九月 十二月
選定行業類別 Selected industry sector Mar Jun Sep Dec
所有行業類別 (1) (2) All industry sectors (1) (2)
經季節性調整 Seasonally adjusted -3.1 +12.6 -13.0 -0.3未經季節性調整 Seasonally unadjusted +21.1 +5.2 -14.0 -13.7
製造業 Manufacturing
經季節性調整 Seasonally adjusted -1.7 +4.0 +10.3 -26.9未經季節性調整 Seasonally unadjusted +28.9 +4.4 -4.7 -36.0
批發、零售、進出口貿易、 Wholesale, retail and飲食及酒店業 (1) import/export trades,
restaurants and hotels (1)
經季節性調整 Seasonally adjusted +1.4 +32.0 -27.4 +8.0未經季節性調整 Seasonally unadjusted +42.6 +8.2 -19.8 -15.8
運輸、倉庫及通訊業 (1) Transport, storage and communications (1)
經季節性調整 Seasonally adjusted -27.5 +3.8 +1.1 +6.7未經季節性調整 Seasonally unadjusted +0.9 -2.0 -2.1 -15.8
金融、保險、地產 Financing, insurance, real 及商用服務業 estate and business services
經季節性調整 Seasonally adjusted +4.5 +9.6 -12.9 +7.1未經季節性調整 Seasonally unadjusted +25.4 +12.2 -20.1 -5.5
註釋: 經季節性調整的數列會因應最新數據的趨勢而作定時 Notes: 調整。 when more up-to-date figures become available.
(1) 統計數字所包括的行業範圍並不完整。個別行業 (1)
類別及「所有上列行業類別」的總體數字是指包
括在「僱傭及職位空缺按季統計調查」與「建築
地盤就業人數按季統計調查」的選定行業而言。
Construction Sites.
(2) 由二零零二年三月統計期開始,社區、社會及個 (2)
人服務業類別的範圍已涵蓋多五個行業。詳情請
參閱第十一頁的「概念及方法」。
refer to the 'Concepts and Methods' on page 11 for details.
資料來源: 政府統計處就業統計組 Source: Employment Statistics Section,(查詢電話:2582 5076) Census and Statistics Department
(Enquiry Telephone No.: 2582 5076)
-27.5
The seasonally adjusted data series is subject to routine revision
The industrial coverage is not complete. Aggregate figuresfor the individual industry sectors and for the 'All above
+38.9+8.9
-7.7-18.5
-19.2
-7.6-19.0
-7.6
2001十二月
Dec
-6.7
Starting from the March 2002 round of SEV, the industrialcoverage has been expanded to include five more industries inthe community, social and personal services sector. Please
industry sectors' refer only to those selected industriescovered in the Quarterly Survey of Employment andVacancies (SEV) and the Quarterly Employment Survey of
28香港統計月刊 二零零三年六月 Hong Kong Monthly Digest of Statistics June 2003

按行業類別劃分的就業人士名義及實質平均薪金指數
Nominal and Real Indices of Payroll Per Person Engaged by Industry Sector(一九九九年第一季=100)
(1st Quarter 1999 = 100)
2001 2002 2002 2001 2002 2002 2002 2002第四季 第一季 第二季 第四季 第一季 第二季 第三季 第四季
行業類別 Industry sector 4th Qtr 1st Qtr 2nd Qtr 4th Qtr 1st Qtr 2nd Qtr 3rd Qtr 4th Qtr
採礦及採石業 Mining and quarrying 112.3 136.6 96.5 122.1 150.6 106.8 110.7 119.0
製造業 Manufacturing 92.4 102.8 88.4 100.4 113.3 97.9 97.5 101.1
電力及燃氣業 Electricity and gas 127.9 99.9 110.7 139.0 110.1 122.6 106.9 140.2
批發、零售、 Wholesale, retail and 88.9 99.9 82.1 96.7 110.1 90.9 91.2 97.3 進出口貿 import/export 易、飲食 trades, restaurants 及酒店業 and hotels
運輸、倉庫 Transport, storage 99.4 99.4 88.9 108.1 109.6 98.4 96.5 113.6 及通訊業 and communications
金融、保險、 Financing, insurance, 95.9 100.4 85.9 104.2 110.7 95.1 92.8 104.2 地產及商用 real estate and 服務業 business services
社區、社會 Community, social 97.6 99.9 94.8 106.1 110.1 105.0 110.3 106.4 及個人服 and personal 務業 services
所有行業 All industry 95.2 102.2 88.7 103.5 112.7 98.3 98.6 105.3 類別(1) sectors(1)
註釋: (1) Note : (1)
金總額統計所涵蓋的所有行業。
資料來源: 政府統計處工資及勞工成本統計組 Source : Wages and Labour Costs Statistics Section,(查詢電話:2582 5083) Census and Statistics Department
(Enquiry Telephone No.: 2582 5083)
Figures for 'All industry sectors' refer to all industries「所有行業類別」的數字是指勞工收入統計調查內薪covered in the payroll enquiry of the Labour EarningsSurvey.
94.1
2.10
2002
名義指數
Nominal Index2002
實質指數
Real Index
第四季
86.9
4th Qtr
106.2
90.3
125.2
93.1
101.4
95.098.9
95.9
81.8
88.5
86.6
83.3
第三季
3rd Qtr
99.3
87.4
29香港統計月刊 二零零三年六月 Hong Kong Monthly Digest of Statistics June 2003

按行業類別劃分的經季節性調整及未經季節性調整的
就業人士名義及實質平均薪金指數按季變動
Quarter-to-quarter Rates of Change in the Seasonally Adjusted and Seasonally Unadjusted Series of Nominal and Real Indices of Payrollper Person Engaged by Industry Sector
Nominal Index Real Index2001 2002 2002 2001 2002 2002 2002 2002
第四季 第一季 第二季 第四季 第一季 第二季 第三季 第四季
行業類別 Industry sector 4th Qtr 1st Qtr 2nd Qtr 4th Qtr 1st Qtr 2nd Qtr 3rd Qtr 4th Qtr
製造業 Manufacturing經季節性調整 Seasonally adjusted +0.1 -0.8 § +1.2 -1.1 +2.1 +0.4 -0.6未經季節性調整 Seasonally unadjusted +4.6 +11.3 -14.0 +5.7 +12.9 -13.7 -0.4 +3.8
批發、零售、 Wholesale, retail and進出口貿 import/export易、飲食 trades, restaurants及酒店業 and hotels經季節性調整 Seasonally adjusted -0.2 -2.1 +0.2 +0.9 -1.0 +1.0 +0.7 +0.1未經季節性調整 Seasonally unadjusted +6.5 +12.3 -17.8 +7.6 +13.9 -17.5 +0.3 +6.7
運輸、倉庫 Transport, storage及通訊業 and communications經季節性調整 Seasonally adjusted -1.6 § +2.3 -0.5 +1.0 +3.2 -2.4 +3.2未經季節性調整 Seasonally unadjusted +11.9 § -10.6 +13.1 +1.4 -10.2 -1.9 +17.6
金融、保險、 Financing, insurance,地產及商用 real estate and 服務業 business services經季節性調整 Seasonally adjusted +0.1 -0.4 -0.8 +1.3 +0.4 +0.1 +0.5 -0.9未經季節性調整 Seasonally unadjusted +13.5 +4.7 -14.4 +14.8 +6.2 -14.0 -2.4 +12.3
社區、社會 Community, social及個人服 and personal務業 services經季節性調整 Seasonally adjusted -0.7 -0.3 -0.2 +0.5 +0.6 +0.6 -0.4 -0.3未經季節性調整 Seasonally unadjusted -3.7 +2.3 -5.0 -2.7 +3.8 -4.6 +5.0 -3.5
所有行業 All industry類別(1) sectors(1)
經季節性調整 Seasonally adjusted -0.6 -0.2 -0.2 +0.6 +0.5 +0.6 +0.5 +0.4未經季節性調整 Seasonally unadjusted +5.9 +7.4 -13.2 +7.1 +9.0 -12.8 +0.4 +6.8
註釋: 經季節性調整的數列會因應最新數據的趨勢而作定時調整。 Notes :when more up-to-date figures become available.
(1) 「所有行業類別」的數字是指勞工收入統計調查內薪金總 (1)
額統計所涵蓋的所有行業。 in the payroll enquiry of the Labour Earnings Survey.§ 變動在 ±0.05%內。 § Change within ±0.05%.
資料來源: 政府統計處工資及勞工成本統計組 Source : Wages and Labour Costs Statistics Section,(查詢電話:2582 5083) Census and Statistics Department
(Enquiry Telephone No.: 2582 5083)
2.11
2002 2002第三季 第四季
名義指數
3rd Qtr 4th Qtr
-0.4 -1.0-1.1 +3.3
§ -0.4-0.3 +6.2
-3.1 +2.7-2.6 +17.1
-0.3 -1.4-3.1 +11.8
-1.2 -0.8
實質指數
-0.3 +6.3
The seasonally adjusted data series is subject to routine revision
Figures for 'All industry sectors' refer to all industries covered
+4.3 -4.0
-0.4 -0.2
30香港統計月刊 二零零三年六月 Hong Kong Monthly Digest of Statistics June 2003

按行業類別及主要職業組別劃分的工資指數
Wage Indices by Industry Sector and Broad Occupational Group(一九九二年九月=100)
(September 1992 = 100)
2002 2002 2002 2002 2002 2002 2002行業類別/ Industry sector/ 三月 六月 十二月 三月 六月 九月 十二月
主要職業組別 Broad occupational group Mar Jun Dec Mar Jun Sep Dec
製造業 Manufacturing
技工及操作工 Craftsmen and operatives 139.4 139.4 138.4 139.1 107.8 109.0 108.9 110.0督導級、技術員級、 Supervisory, technical, 158.2 159.7 160.3 157.5 122.3 124.9 126.1 124.5
文員級及其他 clerical and非生產級工人 miscellaneous non-
production workers所有選定職業 All selected occupations 147.0 147.6 147.3 146.4 113.7 115.4 115.9 115.8
批發、零售、進出口貿 Wholesale, retail and易、飲食及酒店業 import/export trades,
restaurants and hotels技工及操作工 Craftsmen and operatives - - - - - - - -督導級、技術員級、 Supervisory, technical, 150.6 151.1 148.9 149.1 116.5 118.1 117.2 117.8
文員級及其他 clerical and非生產級工人 miscellaneous non-
production workers所有選定職業 All selected occupations 150.6 151.1 148.9 149.1 116.5 118.1 117.2 117.8
運輸服務業 Transport services技工及操作工 Craftsmen and operatives 145.3 146.0 145.1 146.1 112.3 114.2 114.2 115.5督導級、技術員級、 Supervisory, technical, 157.2 156.1 153.9 155.4 121.6 122.1 121.1 122.9
文員級及其他 clerical and非生產級工人 miscellaneous non-
production workers所有選定職業 All selected occupations 151.2 151.0 149.4 150.6 116.9 118.0 117.5 119.1
金融、保險、地產及商 Financing, insurance, real用服務業 estate and business services
技工及操作工 Craftsmen and operatives 150.9 143.6 143.6 141.6 116.7 112.2 113.0 111.9督導級、技術員級、 Supervisory, technical, 154.1 157.0 157.9 155.2 119.2 122.7 124.3 122.7
文員級及其他 clerical and非生產級工人 miscellaneous non-
production workers所有選定職業 All selected occupations 154.2 156.8 157.8 155.1 119.3 122.6 124.1 122.6
個人服務業 Personal services技工及操作工 Craftsmen and operatives 150.9 141.2 150.8 145.5 116.7 110.4 118.6 115.0督導級、技術員級、 Supervisory, technical, 155.9 152.1 152.5 151.6 120.6 118.9 119.9 119.8
文員級及其他 clerical and非生產級工人 miscellaneous non-
production workers所有選定職業 All selected occupations 155.5 151.3 152.2 151.1 120.2 118.3 119.8 119.5
所有選定行業(1) All selected industries(1)
技工及操作工 Craftsmen and operatives 141.2 141.0 140.3 141.0 109.2 110.2 110.4 111.5督導級、技術員級、 Supervisory, technical, 152.7 153.3 152.1 151.5 118.1 119.9 119.7 119.8
文員級及其他 clerical and非生產級工人 miscellaneous non-
production workers所有選定職業 All selected occupations 150.3 150.9 149.7 149.3 116.3 118.0 117.8 118.0
(1) Note : (1)
政府統計處工資及勞工成本統計組 Source :(查詢電話:2582 5083)
資料來源:
力及燃氣業。 including the electricity and gas sector.
Wages and Labour Costs Statistics Section,Census and Statistics Department(Enquiry Telephone No.: 2582 5083)
註釋 : 「所有選定行業」的數字是指勞工收入統計 Figures for 'All selected industries' refer to all industries調查內工資統計所涵蓋的所有行業,包括電 covered in the wage enquiry of the Labour Earnings Survey,
2002九月
Sep
實質工資指數
Real wage index
2.12
名義工資指數
Nominal wage index
31香港統計月刊 二零零三年六月 Hong Kong Monthly Digest of Statistics June 2003

2.13 按行業類別、主要職業組別及性別劃分的二零零二年十二月份平均工資率Average Wage Rates by Industry Sector, Broad Occupational Group and Sex forDecember 2002
元
$
督導級、技術員級、
文員級及其他非生產級工人
技工及操作工 Supervisory, technical, 所有選定職業
Craftsmen and operatives clerical and miscellaneous All selected occupations non-production workers
每日平均工資 每月平均薪金 每月平均薪金
Average daily wages Average monthly salaries Average monthly salaries男 女 合計 女 合計 男 女 合計
行業類別 Industry sector Male Female Overall Female Overall Male Female Overall
製造業 Manufacturing 427 270 329 10,797 11,769 11,668 8,061 9,575
批發、零售、進 Wholesale, retail and - - - 10,835 11,717 12,862 10,835 11,717出口貿易、飲 import/export trades,食及酒店業 restaurants and hotels
運輸服務業 Transport services 507 *** 506 11,989 13,360 13,689 12,020 13,261
金融、保險、 Financing, insurance, 425 *** 424 12,364 10,564 9,656 12,364 10,572地產及商用 real estate and服務業 business services
個人服務業 Personal services 516 - 516 5,654 6,089 7,300 5,654 6,282
所有選定行業 (1) All selected industries(1) 478 279 408 10,496 11,028 11,670 10,193 10,951
註釋 : (1) 「所有選定行業」的數字是指勞工收入統計調查內 Notes : (1)
工資統計所涵蓋的所有行業,包括電力及燃氣業。
*** 為使個別公司所提供的資料得以保密,數據不予公 ***
布。 of information provided by individual firms.
資料來源: 政府統計處工資及勞工成本統計組 Source : Wages and Labour Costs Statistics Section,(查詢電話:2582 5083) Census and Statistics Department
(Enquiry Telephone No.: 2582 5083)
Figures for 'All selected industries' refer to all industriescovered in the wage enquiry of the Labour Earnings Survey,including the electricity and gas sector. Data are not released in order to safeguard confidentiality
男
Male
12,761
12,862
14,358
9,608
6,861
11,571
32香港統計月刊 二零零三年六月 Hong Kong Monthly Digest of Statistics June 2003

僱用於政府建築工程的工人每日平均工資Average Daily Wages of Workers Engaged in Government Buildingand Construction Projects
元
$
意大利批
混凝土工/ 盪及石米
砌磚工/ 木匠/ 批盪技工
渠工 鋼筋 細木工 Terrazzo男雜工 女雜工 Concretor/ 屈紮工 Carpenter 水管 機械裝配 批盪 and
年 月 Male Female bricklayer/ 石工 Steel- and 技工 技工 技工 granolithicYear Month labourer labourer drainlayer Mason bender joiner Plumber Fitter Plasterer worker
2002 1 615.6 545.1 985.9 884.4 1,281.0 863.7 1,171.2 910.2 828.4 974.9 911.2 2 616.1 535.4 994.5 930.5 1,300.9 862.4 1,187.6 914.9 817.8 965.3 911.2 3 614.5 548.1 982.9 968.4 1,292.1 852.3 1,201.1 927.8 822.5 954.3 1,000.0 4 617.4 539.0 995.2 941.2 1,296.4 864.8 1,203.4 922.4 824.0 954.9 825.0 5 616.8 549.6 992.7 943.1 1,303.9 874.2 1,228.3 923.8 828.7 951.6 822.7 6 617.5 556.4 976.0 928.7 1,297.9 871.8 1,204.3 940.1 843.0 966.8 902.9 7 619.1 566.1 974.3 936.8 1,309.2 882.6 1,219.0 915.4 829.0 933.3 880.6 8 617.1 564.8 982.3 936.1 1,304.5 883.3 1,208.0 925.3 814.3 928.7 934.2 9 611.1 555.1 999.3 936.0 1,303.6 893.8 1,221.7 927.4 802.8 938.0 970.0 10 611.4 560.9 974.5 979.9 1,290.6 881.1 1,211.0 916.9 808.1 954.4 970.0 11 607.2 557.4 948.5 813.7 1,286.8 872.1 1,215.0 924.2 820.1 944.8 822.3 12 605.8 554.8 966.7 826.4 1,292.1 872.0 1,219.6 921.6 813.9 942.5 1,043.22003 1 608.6 559.0 987.9 919.9 1,285.6 884.3 1,222.2 909.7 823.1 948.7 1,021.5 2 602.7 553.9 989.8 776.0 1,288.8 875.3 1,214.9 927.1 828.7 947.4 1,021.4 3 604.5 557.8 985.4 810.2 1,294.3 877.5 1,217.1 946.6 834.2 959.6 800.0
鋼架
竹棚 結構
重型 技工 安裝工
機動設備 車輛 風動 Bamboo Struc- 潛水員
髹漆 電氣 操作工 駕駛員 鑽機手 worker tural 幫工
年 月 玻璃工 技工 技工 Plant Truck Pneumatic and steel 潛水員 Diver'sYear Month Glazier Painter Electrician operator driver driller scaffolder erector Diver linesman
2002 1 870.9 868.5 829.9 808.1 679.2 689.8 975.5 1,215.9 937.9 1,692.4 451.1 2 843.5 860.0 817.7 813.7 677.6 670.1 974.6 1,237.9 942.1 1,877.0 448.4 3 855.0 860.1 817.9 816.3 677.6 668.0 997.5 1,221.4 992.7 1,796.8 455.1 4 888.3 863.5 827.4 820.0 678.4 692.2 1,004.1 1,205.4 1,021.8 1,788.2 488.1 5 874.5 867.4 832.1 818.2 675.5 760.0 1,008.2 1,287.1 1,017.0 1,878.9 484.9 6 845.1 862.3 833.9 816.0 680.5 847.3 1,017.3 1,319.1 1,040.7 2,017.5 503.9 7 872.5 852.8 830.8 817.8 678.3 743.8 1,006.6 1,226.3 984.1 2,068.4 473.0 8 869.8 852.7 832.8 820.4 672.5 667.2 996.1 1,216.5 982.5 1,952.8 560.7 9 897.2 863.8 829.6 808.5 676.8 634.4 986.4 1,231.9 1,067.1 1,989.0 646.3 10 890.4 864.7 830.9 800.2 666.9 638.0 983.9 1,238.7 1,064.5 1,717.9 625.3 11 928.7 857.4 826.2 799.2 670.0 632.9 954.0 1,212.5 1,037.1 1,739.2 617.9 12 922.6 862.3 829.8 801.4 665.0 645.5 906.4 1,242.8 1,065.5 2,175.3 621.42003 1 915.2 875.4 835.0 803.0 663.8 649.4 910.4 1,243.8 1,024.3 1,549.8 671.3 2 898.9 880.2 826.8 804.7 665.8 654.0 922.5 1,213.1 945.8 1,491.6 676.9 3 895.0 886.1 839.3 804.1 664.6 654.8 927.0 1,210.5 932.6 1,590.2 654.6
資料來源: 政府統計處工資及勞工成本統計組 Source : Wages and Labour Costs Statistics Section, (查詢電話:2582 4641) Census and Statistics Department
(Enquiry Telephone No.: 2582 4641)
2.14
鐵工
Black- smith
coolie
起重工
Heavyload
33香港統計月刊 二零零三年六月 Hong Kong Monthly Digest of Statistics June 2003

按主要經濟行業類別劃分的經理級與專業僱員薪金指數Salary Indices for Managerial and Professional Employeesby Major Economic Sector
薪金指數(甲) (一九九五年六月=100)Salary index (A) (June 1995=100)
名義薪金指數 實質薪金指數
Nominal salary index Real salary index 選定的主要 Selected major經濟行業類別 economic sector 2000 2001 2000 2001 2002
製造業、電力及 Manufacturing, 118.2 117.4 110.7 111.3 116.1燃氣業 electricity and gas
樓宇建築、建造 Building and construction 120.1 119.0 112.4 112.8 106.5及有關行業 and related trades
批發、零售及 Wholesale, retail and 125.7 125.5 117.7 119.0 117.5進出口貿易業 import/export trades
運輸、倉庫及 Transport, storage and 117.8 121.9 110.3 115.6 117.8通訊業 communications
金融及保險業 Financial institutions and 119.0 122.5 111.5 116.1 119.2insurance
以上全部行業類別 All sectors above 121.9 122.9 114.1 116.5 116.1
薪金指數(乙) (一九九五年六月=100) Salary index (B) (June 1995=100)
名義薪金指數 實質薪金指數
Nominal salary index Real salary index 選定的主要 Selected major經濟行業類別 economic sector 2000 2001 2000 2001 2002
製造業、電力及 Manufacturing, 137.0 139.6 128.3 132.3 137.1燃氣業 electricity and gas
樓宇建築、建造 Building and construction 129.3 134.0 121.1 127.0 124.9及有關行業 and related trades
批發、零售及 Wholesale, retail and 134.3 135.8 125.7 128.7 132.6進出口貿易業 import/export trades
運輸、倉庫及 Transport, storage and 135.8 141.9 127.2 134.5 139.1通訊業 communications
金融及保險業 Financial institutions and 132.1 138.9 123.6 131.6 136.9insurance
以上全部行業類別 All sectors above 133.2 137.2 124.7 130.0 133.4
註釋: 表中數字指有關年度六月份的數字。 Note : Figures are as at June of the year.
資料來源: 政府統計處工資及勞工成本統計組 Source : Wages and Labour Costs Statistics Section, (查詢電話:2582 5083) Census and Statistics Department
(Enquiry Telephone No.: 2582 5083)
136.7
142.6
140.4
2.15
128.0
135.9
140.5
120.5
120.7
2002
2002
122.2
119.0
119.0
109.1
34香港統計月刊 二零零三年六月 Hong Kong Monthly Digest of Statistics June 2003

按意外類別劃分的職業傷亡個案(二零零二年一月至十二月)
Occupational Injuries by Type of Accident (January - December 2002)
傷 總計意外類別 Type of Accident Non-fatal Total
受困於物件之內或物件之間 Trapped in or between objects 771 773
提舉或搬運物件時受傷 Injured whilst lifting or carrying 7 893 7 893
滑倒、絆倒或在同一高度跌倒 Slip, trip or fall on same level 9 599 9 600
人體從高處墮下 Fall of person from height 1 801 1 822
與固定或不動的物件碰撞 Striking against fixed or stationary 5 126 5 127object
被移動物件或與移動物件碰撞 Striking against or struck by 5 991 5 993moving object
踏在物件上 Stepping on object 488 488
暴露於有害物質中或接觸有 Exposure to or contact with 396 397 害物質 harmful substance
觸電或接觸放出的電流 Contact with electricity or electric 40 42discharge
受困於倒塌或翻側的物件 Trapped by collapsing or 52 55overturning object
遭墮下的物件撞擊 Struck by falling object 747 751
遭移動中的車輛撞倒 Struck by moving vehicle 2 221 2 271
觸及開動中的機器或觸及以 Contact with moving machinery 1 309 1 309 機器製造中的物件 or object being machined
遇溺 Drowning 0 14
火警燒傷 Exposure to fire 92 93
爆炸受傷 Exposure to explosion 22 22
被手工具所傷 Injured by hand tool 5 202 5 202
泥土傾瀉受傷 Injured by fall of ground 3 3
窒息 Asphyxiation 4 5
觸及灼熱表面或物質 Contact with hot surface or 3 237 3 237substance
被動物所傷 Injured by animal 395 395
於工作場所暴力事件中受傷 Injured in workplace violence 935 939
其他類別 Others 489 592
總計 Grand Total 46 813 47 023
註釋: 數字可能在日後會作出修訂。 Notes :上列意外數字為截至二零零三年三月三十一日所紀錄
的數字。
資料來源: 勞工處 Source :(查詢電話:2815 0678)
Figures are subject to revision later on.
2.16
0
210
4
0
The above figures are recorded as at 31 March 2003.
0
1
103
14
0
1
0
0
4
50
3
1
2
0
1
2
1
21
Labour Department(Enquiry Telephone No.: 2815 0678)
死
Fatal
2
0
35香港統計月刊 二零零三年六月 Hong Kong Monthly Digest of Statistics June 2003

按意外類別及行業劃分的工業意外個案(二零零二年一月至十二月)
Industrial Accidents Analysed by Type of Accident and Industry(January - December 2002)
受困於物 提舉或搬 滑倒、絆倒 與固定或 被移動物件件之內或 運物件時 或在同一高 人體從高 不動的物 或與移動物物件之間 受傷 度跌倒 處墮下 件碰撞 件碰撞
Trapped Injured Slip, Fall of Striking Strikingin or whilst trip or person against fixed against or
between lifting or fall on from or stationary struck byobjects carrying same level height object moving
行業 Industry object
食品、飲品及 Food, beverages and tobacco 15 186 142 11 127 110煙草製品業
紡織製品業 Textiles 13 127 80 9 67 141
服裝製品、皮革製品 Wearing apparel, leather 1 29 30 1 20 21及鞋類製造業 products and footwear
傢具及木材製品業 Furniture and wood products 0 8 6 2 3 8
紙品製造、印刷及 Paper products, printing and 9 95 38 11 79 66有關行業 allied industries
化學品、石油及 Products of chemicals, 1 12 10 2 10 6橡膠製品業 petroleum and rubber
塑膠製品業 Plastic products 4 21 13 4 15 21
非金屬礦產製品業 Non-metallic mineral products 2 36 11 3 18 20
基本金屬製造業 Basic metal industries 0 29 7 2 16 23
金屬製品業 Fabricated metal products 1 88 22 2 46 58
機械、運輸、科學及 Machinery, transport, scientific 20 137 81 26 100 124其他設備製造業 and other equipment
其他產品製造業 Other manufacturing industries 2 16 10 2 9 23
電力及燃氣業 Electricity and gas 0 1 4 3 0 6
建造業 Construction 160 918 1 203 652 790 1 292(2) (15) (1)
飲食業 Catering industry 75 1 128 1 454 38 1 170 597
陸路運輸及 Land transport and allied 29 157 168 71 94 197有關行業 industries
其他未予說明的 Repair services not elsewhere 16 128 74 43 143 203維修服務 specified
其他非製造業 Other non-manufacturing 7 220 138 39 74 180industries
總計 Total 355 3 336 3 491 921 2 781 3 096(2) (15) (1)
2.17
36香港統計月刊 二零零三年六月 Hong Kong Monthly Digest of Statistics June 2003
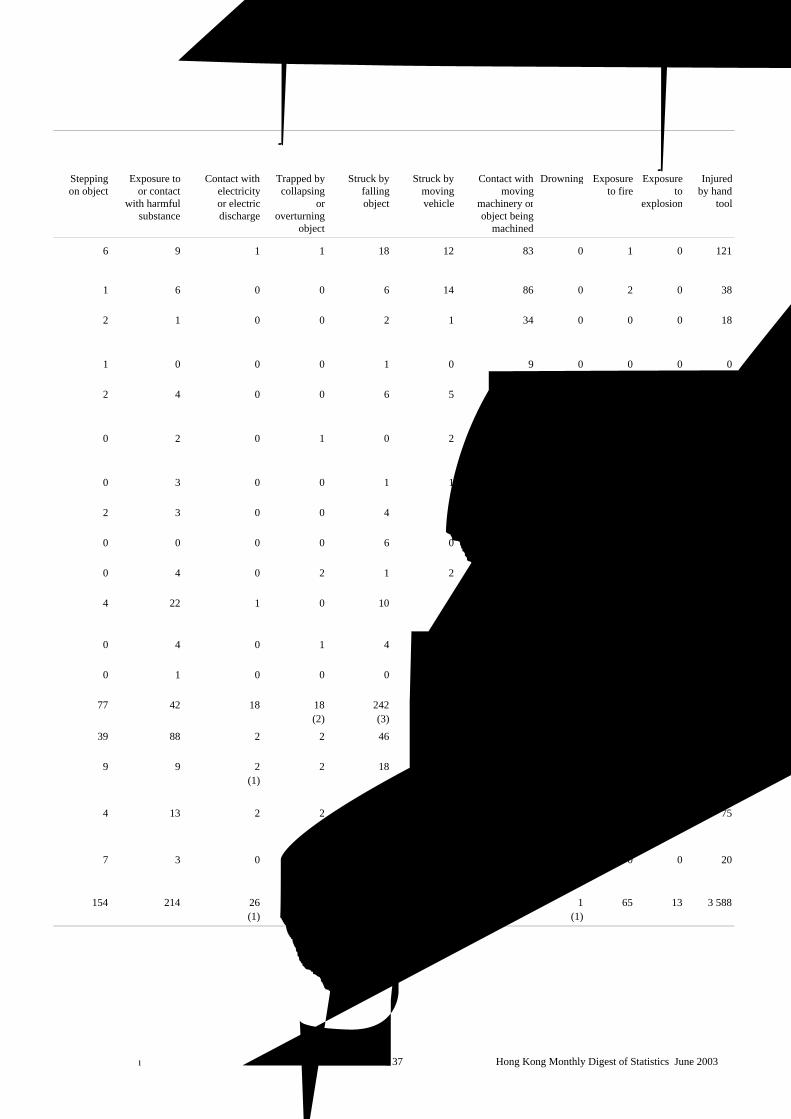
暴露於有害 受困於倒 觸及開動中的機踏在物 物質中或接 觸電或接觸 塌或翻側 遭墮下的 遭移動中的 器或觸及以機器 火警 爆炸 被手工
件上 觸有害物質 放出的電流 的物件 物件撞擊 車輛撞倒 製造中的物件 遇溺 燒傷 受傷 具所傷Stepping Exposure to Contact with Trapped by Struck by Struck by Contact with Drowning Exposure Exposure Injuredon object or contact electricity collapsing falling moving moving to fire to by hand
with harmful or electric or object vehicle machinery or explosion toolsubstance discharge overturning object being
object machined
6 9 1 1 18 12 83 0 1 0 121
1 6 0 0 6 14 86 0 2 0 38
2 1 0 0 2 1 34 0 0 0 18
1 0 0 0 1 0 9 0 0 0 0
2 4 0 0 6 5 111 0 1 0 43
0 2 0 1 0 2 8 0 0 2 6
0 3 0 0 1 1 49 0 0 0 11
2 3 0 0 4 0 4 0 0 0 6
0 0 0 0 6 0 14 0 0 0 2
0 4 0 2 1 2 21 0 3 0 12
4 22 1 0 10 4 53 0 0 0 38
0 4 0 1 4 0 11 0 0 0 11
0 1 0 0 0 0 3 0 0 0 0
77 42 18 18 242 24 372 1 17 9 315(2) (3) (1)
39 88 2 2 46 22 107 0 39 0 2 835
9 9 2 2 18 30 14 0 0 0 37(1)
4 13 2 2 14 7 39 0 2 2 75
7 3 0 1 17 18 17 0 0 0 20
154 214 26 30 396 142 1 035 1 65 13 3 588(1) (2) (3) (1)
37香港統計月刊 二零零三年六月 Hong Kong Monthly Digest of Statistics June 2003

(續) 按意外類別及行業劃分的工業意外個案(二零零二年一月至十二月)
(Cont'd.) Industrial Accidents Analysed by Type of Accident and Industry(January - December 2002)
觸及灼熱 於工作場泥土傾 表面或物 被動物 所暴力事 其他瀉受傷 窒息 質 所傷 件中受傷 類別 總計Injured Asphyxiation Contact Injured Injured Others Grand
by fall of with hot by in Totalground surface or animal workplace
substance violence行業 Industry
食品、飲品及 Food, beverages and tobacco 0 1 56 5 0 1 906 煙草製品業
紡織製品業 Textiles 0 1 25 0 0 1 617
服裝製品、皮革製品 Wearing apparel, leather 0 0 4 0 0 4 168 及鞋類製造業 products and footwear
傢具及木材製品業 Furniture and wood products 0 0 0 0 0 0 38
紙品製造、印刷及 Paper products, printing and 0 0 3 0 0 0 473 有關行業 allied industries
化學品、石油及 Products of chemicals, 0 0 2 0 0 0 64 橡膠製品業 petroleum and rubber
塑膠製品業 Plastic products 0 0 2 0 0 0 145
非金屬礦產製品業 Non-metallic mineral products 0 0 1 0 0 0 110
基本金屬製造業 Basic metal industries 0 0 15 0 0 0 114
金屬製品業 Fabricated metal products 0 0 6 0 0 1 269
機械、運輸、科學及 Machinery, transport, scientific 0 0 11 0 0 5 636 其他設備製造業 and other equipment
其他產品製造業 Other manufacturing industries 0 0 3 0 0 0 96
電力及燃氣業 Electricity and gas 0 0 2 0 0 0 20
建造業 Construction 3 0 65 0 0 21 6 239(24)
飲食業 Catering industry 0 0 2 436 60 0 11 10 149
陸路運輸及 Land transport and allied 0 0 17 0 0 1 855 有關行業 industries (1)
其他未予說明的 Repair services not elsewhere 0 0 25 0 0 7 799 維修服務 specified
其他非製造業 Other non-manufacturing 0 0 12 0 0 2 755industries
總計 Total 3 2 2 685 65 0 54 22 453(25)
註釋: 數字可能在日後會作出修訂。 Notes :上列意外數字為截至二零零三年三月三十一日所紀
錄的數字。在每一時段所記錄得之數字乃指在所述
時段內發生的傷亡個案。
數字指意外事件的總數,括號內數字為死亡人數。
資料來源: 勞工處 Source :(查詢電話:2815 0678)
2.17
Figures are subject to revision later on.
Labour Department(Enquiry Telephone No.: 2815 0678)
The above figures are recorded as at 31 March 2003. Thenumber of injury cases recorded for a period indicates caseswhich occurred in that period.Figures refer to the total number of accidents with the number offatalities given in brackets.
38香港統計月刊 二零零三年六月 Hong Kong Monthly Digest of Statistics June 2003

按行業劃分的僱員停工事件
Stoppages of Work by Industry
2000 2001 2002 2002 2002 2002 2002 2003第一季 第二季 第三季 第四季 第一季1st Qtr 2nd Qtr 3rd Qtr 4th Qtr 1st Qtr
製造業 Manufacturing 0 0 0 0 0 0 0 0
電力、燃氣及 Electricity, gas and 0 0 0 0 0 0 0 0 水務業 water
建造業 Construction 3 0 0 0 0 0 0 1
批發、零售、 Wholesale, retail and 1 0 0 0 0 0 0 0 進出口貿易、 import/export trades, 飲食及酒店業 restaurants and hotels
運輸、倉庫及 Transport, storage and 1 1 0 0 0 0 0 0 通訊業、金融、 communications, financing, 保險、地產及 insurance, real estate and 商用服務業 business services
社區、社會及 Community, social and 0 0 0 0 0 0 0 0 個人服務業 personal services
總計 Total 5 1 0 0 0 0 0 1
製造業 Manufacturing 0 0 0 0 0 0 0 0
電力、燃氣及 Electricity, gas and 0 0 0 0 0 0 0 0 水務業 water
建造業 Construction 208 0 0 0 0 0 0 150
批發、零售、 Wholesale, retail and 626 0 0 0 0 0 0 0 進出口貿易、 import/export trades, 飲食及酒店業 restaurants and hotels
運輸、倉庫及 Transport, storage and 100 780 0 0 0 0 0 0 通訊業、金融、 communications, financing, 保險、地產及 insurance, real estate and 商用服務業 business services
社區、社會及 Community, social and 0 0 0 0 0 0 0 0 個人服務業 personal services
總計 Total 934 780 0 0 0 0 0 150
資料來源: 勞工處 Source : Labour Department(查詢電話:2852 3545) (Enquiry Telephone No.: 2852 3545)
損失工作日數
Working days lost
2.18
Number of work stoppages僱員停工事件數目
39香港統計月刊 二零零三年六月 Hong Kong Monthly Digest of Statistics June 2003


香港統計月刊 二零零三年六月 Hong Kong Monthly Digest of Statistics June 200341
對外貿易
External Trade
概念及方法 Concepts and Methods
香港對外貿易包括香港對外商品貿易及服務貿
易。
Hong Kong external trade comprises merchandise tradeand trade in services of Hong Kong with externalparties.
商品貿易 Merchandise Trade
對外商品貿易統計包括香港與其貿易夥伴間的
貨品進出口,包括經陸路、航空、水路運輸及
部分郵寄貨品。豁免貨品、黃金及金幣的進出
口則不包括在內。
External merchandise trade statistics cover movementsof merchandise between Hong Kong and her tradingpartners, by land, air, water and, to some extent, by post.Movements of exempted articles, gold and specie are notincluded.
香港的對外商品貿易統計是根據進出口報關表
上的資料編製。《中華人民共和國香港特別行
政區基本法》說明,香港特別行政區為單獨的
關稅地區。香港與中國內地之間的商品貿易,
亦須辦理進出口報關。而有關的統計資料,亦
包括在香港的對外商品貿易統計數字內。
Hong Kong’s external merchandise trade statistics arecompiled based on information contained inimport/export declarations. The Hong Kong SpecialAdministrative Region is a separate customs territory, asstated in “The Basic Law of the Hong Kong SpecialAdministrative Region of the People’s Republic ofChina”. Import/export declaration is also required ofHong Kong’s merchandise trade with the mainland ofChina, and statistics relating to this are included in HongKong’s external merchandise trade statistics.
進口貨品是指在香港以外出產或製成的貨品,
輸入香港供本地使用或轉口,以及再進口的香
港產品。其貨值是以到岸價計算。
Imports of goods are goods which have been producedor manufactured in places outside the jurisdiction ofHong Kong and brought into Hong Kong for domesticuse or for subsequent re-export as well as Hong Kongproducts re-imported. Their values are recorded on c.i.f.(cost, insurance and freight) basis.
留用進口貨物是指留在香港使用,而沒有轉口
往其他地方的進口貨物。留用進口貨值的估計
方法是將進口貨值減去轉口貨物的估計進口
值。後者是把估計的轉口毛利從轉口貨值剔除
而計算出來。政府統計處定期進行一項轉口貿
易統計調查,所得資料用以估計各類貨物的轉
口毛利率,從而估算留用進口統計數字。而留
用進口統計數字會按最新估計所得的轉口毛利
率作出修訂。
Retained imports of goods refer to those imported goodswhich are retained for use in Hong Kong rather thanbeing re-exported to other places. The value of retainedimports of goods is derived by subtracting the estimatedimport value of re-exports of goods from the value ofimports of goods. The former is obtained by removingan estimated re-export margin from the value of re-exports of goods. The Census and Statistics Departmentregularly conducts a survey of re-export trade, based onwhich the rates of re-export margin for differentcategories of goods are estimated for deriving retainedimport statistics. Retained import statistics are subject torevision when the latest estimates on rates of re-exportmargin become available.
港產品出口貨物是指香港的天然產品或在本港
經過製造工序,以致其基本原料的形狀、性
質、式樣或用途受到永久改變的產品。其貨值
是以離岸價計算。
Domestic exports of goods are the natural produce ofHong Kong or the products of a manufacturing processin Hong Kong which has changed permanently theshape, nature, form or utility of the basic materials usedin manufacture. Their values are recorded on f.o.b.(free-on-board) basis.

香港統計月刊 二零零三年六月 Hong Kong Monthly Digest of Statistics June 200342
轉口貨品是指輸出曾經自外地輸入本港的貨
品,而這些貨品並沒有在本港經過任何製造工
序,以致永久改變其形狀、性質、式樣或用
途。其貨值是以離岸價計算。
Re-exports of goods are products which have previouslybeen imported into Hong Kong and which are re-exported without having undergone in Hong Kong amanufacturing process which has changed permanentlythe shape, nature, form or utility of the product. Theirvalues are recorded on f.o.b. (free-on-board) basis.
整體出口貨品包括港產品出口及轉口貨品。 Total exports of goods comprise domestic exports andre-exports.
商品貿易總額是指香港與其貿易顆伴間的所有
貨品流動,包括經陸路、航空、水路運輸及小
量郵寄的貨品。商品貿易總額包括進口貨品、
港產品出口及轉口貨品。
Total merchandise trade refers to all the movements ofmerchandise between Hong Kong and her tradingpartners, by land, air, water and, though may be to alesser extent, by post. It comprises imports, domesticexports and re-exports of goods.
貨值指數、單位價格指數及貨量指數分別量度
對外商品貿易貨值、貨品價格及貨量的變動。
由二零零二年六月開始,商品貿易指數經已更
新,新系列是以二零零零年為基期。二零零零
年以前的新系列指數是將以往發表的舊系列指
數(以一九九零年為基期)按比例換算得來,
所用的換算因子是根據新舊系列在二零零零年
重疊期間的數值而計算的。
The value index, unit value index and quantum indexmeasure the changes in value, prices and volume ofexternal merchandise trade respectively. As from June2002, the merchandise trade index numbers have beenupdated. The new series has year 2000 as the base year.In the new series, indices for periods prior to 2000 areobtained by re-scaling the previously published series,which has 1990 as the base year, using a conversionfactor derived from the levels of the old and new seriesin the overlapping period of 2000.
經季節性調整的商品貿易統計數列,由於已採
取統計方法剔除季節性因素,所以外貿數字可
以進行更有意義的短期比較。把貿易統計原來
數列的按年變動數字與經季節性調整數列的近
三個月與對上三個月的變動數字比較,有助察
覺其趨勢上可能出現的變動。
In the seasonally adjusted merchandise trade statisticsseries, seasonal effects have been removed statisticallyto enable more meaningful shorter-term comparison tobe made. When the year-on-year changes of themonthly figures in the original trade statistics series andthe change of the latest 3-month period over thepreceding 3-month period in the seasonally adjustedtrade statistics series are analysed together, the possiblevariations in trend of external trade performance can bemore clearly discerned.
服務貿易 Trade in Services
服務貿易是指服務輸出和服務輸入。服務輸出
即是向世界其他地方出售服務;而服務輸入則
是向世界其他地方購入服務。
Trade in services (TIS) refers to exports of services andimports of services. Exports of services are the sales ofservices to the rest of the world, whereas imports ofservices are the purchases of services from the rest of theworld.
服務輸入及輸出是指香港經濟體系的「居民」
與「非居民」之間進行的交易。根據國際標
準,一個經濟體系的居民是指通常在該經濟體
系內經營業務的機構,以及通常在該經濟領域
居住的人士。
Imports and exports of services represent transactionsbetween “residents” of the economy of Hong Kong and“non-residents”. According to international standards,residents refer to organizations which ordinarily operatein the economy, and persons who normally stay in theeconomic territory.

香港統計月刊 二零零三年六月 Hong Kong Monthly Digest of Statistics June 200343
服務輸入及輸出按不同服務類別分類,包括運
輸、旅遊、商貿服務及其他與貿易相關的服務
及其他服務。有關分類的詳情,請參閱《香港
服務貿易統計報告》。
Imports and exports of services are classified intodifferent types of services, including transportation,travel, merchanting and other trade-related services andother services. For details of the classification, pleaserefer to the Report on Hong Kong Trade in ServicesStatistics.
香港與中國內地之間的服務貿易視作對外交
易,並包括在香港服務貿易統計數字內。
Hong Kong’s trade in services with the mainland ofChina are treated as external transactions and included inHong Kong’s TIS statistics.
香港服務貿易統計數字是根據各項數據資料來
源編製而成的,包括從機構和住戶的統計調查
搜集所得的數據,以及從行政記錄及其他資料
來源所得的數據。
Hong Kong’s TIS statistics are compiled based on datacollected via various sources, including establishmentand household surveys, administrative records and otherdata sources.
其他有關刊物 Further References
香港對外商品貿易回顧 Annual Review of Hong Kong External MerchandiseTrade
香港對外商品貿易(月刊) Hong Kong External Merchandise Trade (Monthly)
香港進出口貨物分類表(協調制度)
二零零二年版,第一冊至第三冊
Hong Kong Imports and Exports Classification List(Harmonized System) 2002 Edition, Volume One toVolume Three
香港商品貿易指數(月刊) Hong Kong Merchandise Trade Index Numbers(Monthly)
香港商品貿易統計(月刊): Hong Kong Merchandise Trade Statistics (Monthly):
進口 Imports
港產品出口及轉口 Domestic Exports and Re-exports香港商品貿易統計:周年附刊
Hong Kong Merchandise Trade Statistics : AnnualSupplement
進口 Imports
港產品出口及轉口 Domestic Exports and Re-exports
香港商品貿易統計分類表二零零二年版 Hong Kong Merchandise Trade Statistics Classification2002 Edition
香港服務貿易統計報告(年刊) Report on Hong Kong Trade in Services Statistics(Annual)
香港國際收支平衡統計(季刊) Balance of Payments Statistics of Hong Kong(Quarterly)
香港國際收支平衡統計一九九七年至一九九九年
Balance of Payments Statistics of Hong Kong1997 to 1999
本地生產總值(季刊及年刊) Gross Domestic Product (Quarterly and Annual)本地生產總值統計特刊 Special Report on Gross Domestic Product

圖 3.1 對外商品貿易貨值Chart 3.1 External Merchandise Trade Values
圖 3.2 經季節性調整的對外商品貿易貨值近三個月與對上三個月比較的變動百分率
Chart 3.2 Change of the Lastest 3-month Period over the Preceding 3-month Period of Seasonally Adjusted Series of External Merchandise Trade Values
貿易貨值Trade value
經季節性調整的貿易貨值Seasonally adjusted trade value
-40
0
40
80
120
160
200
04/01 08/01 12/01 04/02 08/02 12/02 04/03
十億港元HK$ billion
進口Imports
轉口Re-exports
港產品出口Domestic exports
貿易差額Trade balance
-400
0
400
800
1,200
1,600
2,000
1992 1994 1996 1998 2000 2002
十億港元HK$ billion
進口Imports
轉口Re-exports
港產品出口Domestic exports
貿易差額Trade balance
-20
-15
-10
-5
0
5
10
15
20
04/01 07/01 10/01 01/02 04/02 07/02 10/02 01/03 04/03
轉口Re-exports
進口Imports
%
港產品出口Domestic exports
44香港統計月刊 二零零三年六月 Hong Kong Monthly Digest of Statistics June 2003

圖 3.3 服務輸出的變動情況Chart 3.3 Movements of Exports of Services
圖 3.4 服務輸入的變動情況Chart 3.4 Movements of Imports of Services
按年實質變動率Year-on-year rate ofchange in real terms
按季實質變動率(經季節性調整的數列)Quarter-to-quarter rate of change in real terms(seasonally adjusted series)
-6
-4
-2
0
2
4
6
8
10
12
14
16
18
20
Q1/01 Q3/01 Q1/02 Q3/02 Q1/03
%
-6
-4
-2
0
2
4
6
8
10
12
14
16
18
20
1992 1994 1996 1998 2000 2002
%
按年實質變動率Year-on-year rate ofchange in real terms
按季實質變動率(經季節性調整的數列)Quarter-to-quarter rate of change in real terms(seasonally adjusted series)
-8
-6
-4
-2
0
2
4
6
8
10
12
Q1/01 Q3/01 Q1/02 Q3/02 Q1/03
%
-8
-6
-4
-2
0
2
4
6
8
10
12
1992 1994 1996 1998 2000 2002
%
45香港統計月刊 二零零三年六月 Hong Kong Monthly Digest of Statistics June 2003

3.1 對外商品貿易統計數字
External Merchandise Trade Statistics百萬元
$ million
貿易總額 商品貿易差額 年 Total Total MerchandiseYear exports trade trade balance
2000200120022002
2003
累積總額
Cumulative totals
與上年同期 與上年同期 與上年同期
比較的變動(%) 比較的變動(%) 比較的變動(%)Change over Change over Change oversame period same period same period
年 同年累積 in preceding 同年累積 in preceding in precedingYear Year to date year (%) Year to date year (%)
2000 - +19.0 - - +6.12001 - -5.4 - - -15.22002 - +3.3 - - -14.72002 2 207,824 -8.3 18,852 -20.4 -16.3
3 342,301 -8.2 28,981 -17.5 -15.64 472,590 -8.3 39,100 -17.4 -16.15 605,662 -8.3 49,777 -19.0 -17.46 736,550 -7.3 61,219 -17.7 -17.27 887,640 -6.6 74,338 -16.3 -17.28 1,031,481 -5.3 86,400 -15.9 -16.59 1,182,355 -4.0 98,284 -15.1 -15.2
10 1,335,346 -1.4 109,720 -14.8 -14.711 1,477,075 +0.7 119,798 -14.7 -14.112 1,619,419 +3.3 130,926 -14.7 -14.7
2003 1 133,225 +5.5 9,575 -6.8 -13.82 249,184 +8.3 16,676 -11.5 -13.43 403,240 +9.5 25,957 -10.4 -13.24 544,251 +10.4 34,372 -12.1 -13.1
4
1,680,359 127,903+17.8
1,619,419 130,926
1,533,611
140,379141,818145,262
148,684
132,900
1,528,339
139,007
134,402
147,3811,531,272
2
- -
與上年同期
最近十二
year (%)
7,1039,575
98,045
Change over
154,212 9,284 133,803
進口
115,984
8,414 125,732
124,87513,187 133,228
141,22112,082 129,140
113,397131,245 11,478
-2.4 1,546,153
144,284
133,225 125,452
Imports
151,429
153,367
8,582 86,699
7
Month to date
個月累積in preceding 月
same period
比較的變動(%)
Re-exports
180,967
Imports
-85,273
港產品出口Domestic
exports
整體出口
轉口
3,230,6521,391,722 1,572,689
進口
3 134,553
月
1,619,4191,568,194
2 98,077
Month
1,657,962153,520 3,049,181130,926
1,480,9871,560,517 3,179,936
1,327,467 -87,2081,429,590
112,989
95,281
123,118
193,358124,033
-2,796-58,903
10,141 113,893
654 130,399 10,129
133,275 10,711 115,162
11,455 139,076142,180 10,093 130,938 141,031
146,415 297,845 -5,014
303,898 -2,837150,530
-6,370256,120
253,517-7,401125,873-7,281
259,148
-10,520258,586
8148,033
-3,0639 151,159 11,900 136,134 -3,125299,192
285,506
1011 283,211
最近十二
112
105,148 221,132 -10,837
-1,148135,324 277,916 -7,268
Domestic exports
135,028 +1,803
143,087 297,299 -11,124
268,253
+2.2 1,599,320
11,134 124,190
12 months
142,592
-0.5 1,562,728-1.4 1,554,026
130,230
137,230
+3.3
+15.2
+21.4 1,642,867
+0.9
128,750
136,064
-9.1 1,533,994-7.2
-4.2 1,535,711-6.2
---
134,146
-14.3
3
1,660,779+19.9
-
141,302
港產品出口
--
275,448 -7,156
1,691,080 126,199
1,580,720
12 months個月累積
-
to dateyear (%)
46香港統計月刊 二零零三年六月 Hong Kong Monthly Digest of Statistics June 2003

3.1 (續) 對外商品貿易統計數字
(Cont'd.) External Merchandise Trade Statistics百萬元
$ million
累積總額 --- 續
Cumulative totals --- cont'd.
與上年同期 與上年同期 與上年同期 與上年同期比較的變動(%) 比較的變動(%) 比較的變動(%) 比較的變動(%)
Change over 最近十二 Change over Change over 最近十二 Change oversame period 個月累積 same period same period 個月累積 same period
年 同年累積 in preceding 12 months in preceding 同年累積 in preceding 12 months in precedingYear Year to date year (%) to date year (%) Year to date year (%) to date year (%)
2000 - - +18.1 - - +16.62001 - - -4.6 - - -5.82002 - - +7.7 - - +5.42002 2 -9.6 1,308,015 -6.8 -10.7 1,456,699 -7.9
3 -5.0 1,311,980 -6.7 -6.2 1,459,361 -7.74 -2.5 1,317,103 -6.2 -4.0 1,462,366 -7.35 -1.7 1,318,289 -5.9 -3.5 1,460,106 -7.26 +0.2 1,329,006 -4.6 -1.6 1,469,386 -6.07 +2.1 1,343,342 -3.6 +0.2 1,482,349 -5.08 +2.9 1,352,733 -2.2 +0.9 1,489,962 -3.79 +4.0 1,367,229 -0.3 +2.0 1,503,294 -1.8
10 +5.3 1,386,128 +2.5 +3.2 1,520,529 +0.711 +6.6 1,408,221 +5.1 +4.4 1,541,122 +3.112 +7.7 1,429,590 +7.7 +5.4 1,560,517 +5.4
2003 1 +30.3 1,458,751 +10.9 +26.7 1,588,981 +8.42 +22.1 1,470,073 +12.4 +19.0 1,598,823 +9.83 +20.3 1,489,947 +13.6 +17.6 1,617,850 +10.94 +17.8 1,502,700 +14.1 +15.2 1,628,900 +11.4
與上年同期 與上年同期
比較的變動(%) 最近十二 比較的變動(%) 年 同年累積 Change over same period 個月累積 Change over same period Year Year to date in preceding year (%) 12 months to date in preceding year (%)
2000 - - - +17.82001 - - - -5.62002 - - - +4.32002 2 +12.6 2,990,310 -8.1
3 -7.7 2,993,355 -7.94 -5.7 2,993,638 -7.85 -4.9 2,988,445 -7.76 -3.0 3,005,097 -6.77 -1.2 3,028,502 -5.88 -0.3 3,043,989 -4.69 +0.7 3,066,021 -2.9
10 +2.0 3,101,249 -0.411 +3.2 3,140,442 +1.912 +4.3 3,179,936 +4.3
2003 1 +24.0 3,231,848 +6.92 +19.4 3,259,603 +9.03 +17.7 3,298,208 +10.24 +15.2 3,319,979 +10.9
資料來源: 政府統計處貿易統計資料發布組 Trade Statistics Dissemination Section,(查詢電話:2582 5042) Census and Statistics Department
(Enquiry Telephone No.: 2582 5042)
517,156
1,061,407
899,921
1,174,839
1,560,5171,429,590135,028240,125
125,452
383,091
182,966
699,232574,497448,773325,758
524,721
--
1,425,3181,305,520
296,777409,673
986,320
1,284,559
845,325770,987
整體出口Total exports
Month
-
轉口Re-exports
月
--
累積總額 --- 續
1,035,845 1,134,129
638,013
201,818-
786,332
268,253
Source :
Cumulative totals --- cont'd.
Total trade
2,017,801
668,059409,642
482,784
223,449
489,309
2,902,3932,619,9052,316,484
357,134
Month月
貿易總額
3,179,936
1,732,9651,435,7811,180,159
921,363
47香港統計月刊 二零零三年六月 Hong Kong Monthly Digest of Statistics June 2003
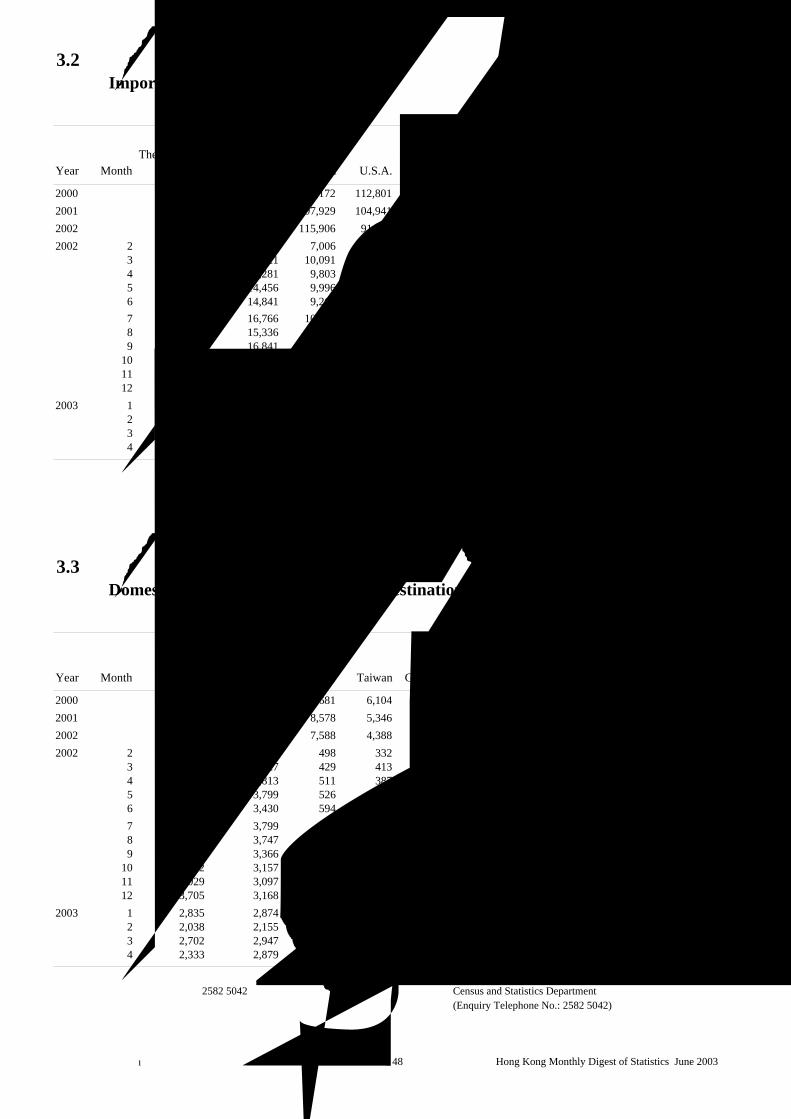
3.2 按主要供應地劃分的商品進口貨值
Imports of Goods by Main Supplier百萬元
$ million
中國內地 大韓民國
年 月 The mainland 日本 台灣 美國 Republic 新加坡 馬來西亞 德國 泰國 英國
Year Month of China Japan Taiwan U.S.A. of Korea Singapore Malaysia Germany Thailand U.K.
2000 714,987 198,976 124,172 112,801 80,600 74,998 37,906 32,215 28,001 30,7972001 681,980 176,599 107,929 104,941 70,791 72,898 39,200 33,309 27,370 28,8772002 717,074 182,569 115,906 91,478 75,955 75,740 39,729 32,997 29,556 26,0822002 2 40,276 12,122 7,006 6,140 4,682 4,261 2,576 1,931 2,027 2,001
3 56,416 15,521 10,091 8,163 6,765 6,644 3,560 2,635 2,364 2,0084 56,683 15,281 9,803 7,322 6,102 6,338 3,127 2,687 2,258 1,9535 57,851 14,456 9,996 7,882 6,683 5,551 3,386 2,782 2,578 2,1716 57,706 14,841 9,261 7,770 6,036 6,201 3,137 2,884 2,791 1,9907 67,352 16,766 10,869 8,157 7,557 6,716 3,573 3,196 2,769 2,3698 66,426 15,336 10,120 7,958 6,290 6,834 3,233 2,944 2,448 2,4079 68,572 16,841 10,473 8,097 6,862 6,396 4,303 3,206 2,776 2,280
10 69,703 17,479 10,923 7,536 7,402 7,384 3,648 2,873 2,904 2,40511 64,205 16,240 10,216 8,092 6,607 6,813 3,454 3,050 2,386 2,16012 61,763 17,574 10,067 7,883 6,564 7,234 3,111 2,918 2,517 2,198
2003 1 62,414 13,711 8,999 6,802 5,710 6,421 3,205 2,897 2,412 2,1282 42,573 15,928 7,940 7,120 5,940 6,799 2,781 2,726 2,422 2,0193 63,902 19,051 10,777 8,292 7,481 8,359 3,777 3,150 2,951 1,9664 61,299 17,747 9,796 7,508 6,754 6,574 3,266 3,606 2,359 1,935
資料來源: 政府統計處貿易統計資料發布組 Source : Trade Statistics Dissemination Section,(查詢電話:2582 5042) Census and Statistics Department
(Enquiry Telephone No.: 2582 5042)
3.3 按主要目的地劃分的港產品出口貨值
Domestic Exports of Goods by Main Destination百萬元
$ million
中國內地 荷蘭
年 月 美國 The mainland 英國 台灣 德國 Nether- 日本 馬來西亞 加拿大 新加坡
Year Month U.S.A. of China U.K. Taiwan Germany lands Japan Malaysia Canada Singapore
2000 54,438 54,158 10,681 6,104 9,294 3,910 5,084 2,668 3,210 4,7162001 47,589 49,547 8,578 5,346 5,818 4,619 4,060 1,716 3,093 2,6502002 41,908 41,374 7,588 4,388 4,273 3,470 2,969 2,637 2,411 2,1612002 2 2,583 2,586 498 332 350 254 214 135 156 160
3 2,699 3,827 429 413 298 305 322 135 132 1854 2,878 3,813 511 387 309 285 268 121 126 1715 3,137 3,799 526 393 351 363 269 152 148 1736 3,945 3,430 594 349 361 411 206 197 243 1767 4,657 3,799 793 353 456 383 243 247 298 2098 3,999 3,747 787 324 387 254 245 347 213 1899 4,389 3,366 723 391 311 207 248 301 248 190
10 4,212 3,157 777 369 327 168 248 345 235 18711 3,029 3,097 703 344 329 220 221 294 186 17412 3,705 3,168 731 326 416 310 191 233 229 187
2003 1 2,835 2,874 593 325 461 237 266 123 178 1742 2,038 2,155 483 229 286 182 196 80 139 1323 2,702 2,947 521 318 375 188 253 107 175 1474 2,333 2,879 515 284 367 150 214 88 137 137
資料來源: 政府統計處貿易統計資料發布組 Source : Trade Statistics Dissemination Section,(查詢電話:2582 5042) Census and Statistics Department
(Enquiry Telephone No.: 2582 5042)
48香港統計月刊 二零零三年六月 Hong Kong Monthly Digest of Statistics June 2003

按主要來源地劃分的商品轉口貨值
Re-exports of Goods by Main Origin百萬元
$ million
中國內地 大韓民國
年 月 The mainland 日本 台灣 美國 Republic 馬來西亞 德國 新加坡 泰國 英國
Year Month of China Japan Taiwan U.S.A. of Korea Malaysia Germany Singapore Thailand U.K.
2000 849,517 137,338 87,942 65,465 46,057 27,050 18,790 14,991 14,145 13,2202001 808,370 125,649 80,321 65,193 39,775 27,170 20,322 14,650 13,297 13,0512002 863,967 135,793 94,275 62,900 47,218 27,412 21,890 16,676 16,352 14,3842002 2 52,469 8,217 4,990 4,641 3,117 1,650 1,144 945 1,041 981
3 65,681 11,301 7,853 5,431 4,219 2,532 1,791 1,365 1,441 9954 67,715 11,156 7,474 5,293 3,782 2,247 1,606 1,269 1,213 1,3255 67,626 11,156 8,244 5,385 3,790 2,221 1,840 1,280 1,441 1,2786 68,115 10,484 7,744 5,024 3,569 2,158 1,765 1,327 1,355 1,2327 81,149 12,648 8,937 5,103 4,452 2,575 1,967 1,489 1,547 1,3088 79,068 11,974 8,327 5,491 4,053 2,112 2,037 1,475 1,410 1,4509 83,699 12,574 9,145 5,764 4,086 2,677 2,168 1,486 1,520 1,504
10 86,820 13,077 8,917 5,263 4,542 2,393 2,144 1,627 1,506 1,03311 80,115 12,589 8,651 5,600 4,304 2,544 1,865 1,681 1,412 1,22212 74,042 12,083 8,323 5,370 4,302 2,387 1,973 1,663 1,398 1,065
2003 1 75,276 12,085 8,311 5,650 4,417 2,463 2,032 1,543 1,601 1,3162 55,101 10,723 6,806 4,358 3,684 1,982 1,730 1,240 1,316 2,0343 78,136 13,424 8,989 5,472 5,431 2,802 2,053 1,902 1,815 1,3334 73,592 13,135 8,464 5,541 4,752 2,281 2,196 1,857 1,652 1,244
資料來源:政府統計處貿易統計資料發布組 Source : Trade Statistics Dissemination Section,(查詢電話:2582 5042) Census and Statistics Department
(Enquiry Telephone No.: 2582 5042)
按主要目的地劃分的商品轉口貨值
Re-exports of Goods by Main Destination百萬元
$ million
中國內地 大韓民國
年 月 The mainland 美國 日本 英國 德國 台灣 新加坡 Republic 荷蘭 加拿大
Year Month of China U.S.A. Japan U.K. Germany Taiwan Singapore of Korea Netherlands Canada
2000 488,823 311,047 82,050 52,356 50,599 33,696 32,028 26,978 20,373 21,1872001 496,574 282,189 83,551 46,764 45,774 30,021 26,929 24,640 20,693 19,7662002 571,870 291,043 80,743 46,644 44,567 30,193 29,424 29,264 22,775 21,1092002 2 32,140 16,215 5,597 3,090 2,898 1,895 1,965 2,151 1,517 1,315
3 47,645 20,055 7,324 3,187 3,198 2,547 2,716 2,854 1,820 1,4924 46,340 23,076 6,181 3,462 3,225 2,414 2,440 2,305 1,583 1,5495 47,580 23,194 5,770 3,662 3,156 2,590 2,357 2,363 1,722 1,4696 46,059 23,962 5,867 3,620 3,127 2,217 2,223 2,126 1,746 1,8127 52,798 28,692 6,984 4,452 3,758 2,898 2,594 2,467 2,061 2,1458 50,901 27,746 6,991 4,431 3,802 2,663 2,441 2,348 1,954 2,0289 53,475 30,401 7,151 4,791 4,577 2,567 2,473 2,444 1,910 2,265
10 54,293 29,539 7,964 4,858 4,868 2,743 2,745 2,763 2,269 2,25411 52,489 26,608 8,181 4,274 4,370 2,565 2,743 2,796 2,385 1,75412 51,946 22,933 6,919 3,764 4,280 2,797 2,548 2,569 2,295 1,577
2003 1 51,514 22,891 7,409 3,859 4,238 3,402 2,549 2,598 2,251 1,6792 42,828 15,313 5,957 2,722 3,219 2,362 2,118 2,488 1,745 1,1973 59,144 22,037 8,232 3,474 4,353 3,262 2,721 2,916 2,184 1,6074 57,152 21,212 6,910 3,582 3,923 3,078 2,321 2,871 1,882 1,500
資料來源:政府統計處貿易統計資料發布組 Source : Trade Statistics Dissemination Section,(查詢電話:2582 5042) Census and Statistics Department
(Enquiry Telephone No.: 2582 5042)
3.4
3.5
49香港統計月刊 二零零三年六月 Hong Kong Monthly Digest of Statistics June 2003

3.6 按貨品類別劃分的進口貨值
Imports by Commodity Section百萬元
$ million
4標準國際貿易分類
﹝第三次修訂版﹞類別 動物及植物
SITC R3 Section 油、脂肪及蠟
Animal and 年 月 vegetable oils,Year Month fats and waxes
2000 3,184 104,5592001 3,365 89,9422002 3,269 94,0932002 2 329 6,471
3 344 7,0644 202 8,3385 295 8,2136 193 7,8747 335 8,6248 252 8,4489 295 8,534
10 284 8,36111 182 8,09712 184 8,219
2003 1 252 7,4092 125 7,7243 206 9,2304 135 8,708
標準國際貿易分類
﹝第三次修訂版﹞類別
SITC R3 Section貨物合計
年 月 TotalYear Month merchandise
2000 1,657,9622001 1,568,1942002 1,619,4192002 2 98,077
3 134,5534 130,3995 133,2756 131,2457 151,4298 144,2849 151,159
10 153,36711 142,18012 142,592
2003 1 133,2252 115,9843 154,2124 141,302
資料來源: 政府統計處貿易統計資料發布組 Source : Trade Statistics Dissemination Section,(查詢電話:2582 5042) Census and Statistics Department
(Enquiry Telephone No.: 2582 5042)
24,925 67,288 31,123 73
526415,695
classified elsewhere
2,662
transactions notCommodities and
manufacturedMiscellaneous
1,791 2,473
的貨物及交易雜項製成品
未列入其他分類
1,0388923,427
720
838 1,767
主要以材料 機械及
4,508 1,779
3,499
3,084
1,8004,074 790
98
3,282
1,8411,632
6
4,296
4,351
1,787
4,056 731
4,720 888
4,584
53,682
870
57,438
2,986
and live
10,358
1,774
2,531
23,233
2,205
34,603
0
食物及
活動物
Foodand
tobaccoanimals
54,413
966
33,071
746,578688,090
45,670
75,486
29,420
39,212
66,376
4,444 772
4,339
7933,8534,477
761682
7622,677 57,934
21,809 60,235 30,349 8524,331 32,556 81
Beverages
916432,398
7
inedible,except fuels
2,649
9,836
3
礦物燃料、滑潤
劑及有關物質
1
飲料及
煙草
5
未列明在其他編號
的化學品及有關產品
2
除燃料外的非食
用未加工材料
Crude materials,
20,67420,020
10,642 35,321
1,1271,798
32,30131,489
Chemicals and related
products, n.e.s.
Mineral fuels,lubricants and
related materials
23,850 69,287 39,333
253,642
21,990 66,37113,974
58,228
1,689 3,193
962 1,718 2,914
分類的製成品
707,766282,506
Machineryand transportgoods classified
運輸設備
chiefly by material equipment
399,167259,434
Manufactured
articles
76
21,849 67,886
23,117 63,132
8771,221 37,673
4,369 801 1,754 2,890
5,130
81
79
1,599 2,847
23,545
3,946 692 1,576
86
95
20,253 61,021 34,156 8287
34,14123,002 35,984
22,305
18,400 56,495 23,679 65
4,497 743 2,099 2,992
25,676 75,809 32,880 80
50香港統計月刊 二零零三年六月 Hong Kong Monthly Digest of Statistics June 2003

3.7 按貨品類別劃分的港產品出口貨值
Domestic Exports by Commodity Section百萬元
$ million
0 4標準國際貿易分類
﹝第三次修訂版﹞類別 食物及 動物及植物
SITC R3 Section 活動物 油、脂肪及蠟
Food Animal and 年 月 and live vegetable oils,Year Month animals fats and waxes
2000 1,724 73 6,3002001 1,469 58 5,4892002 1,525 81 5,3052002 2 125 11 326
3 127 4 4664 121 3 5075 102 6 4716 107 9 4627 157 5 4388 145 5 4499 130 5 444
10 116 6 45211 134 10 43612 132 13 441
2003 1 106 15 4432 101 7 3753 118 7 5484 95 6 486
標準國際貿易分類
﹝第三次修訂版﹞類別
SITC R3 Section貨物合計
年 月 TotalYear Month merchandise
2000 180,9672001 153,5202002 130,9262002 2 8,582
3 10,1414 10,1295 10,7116 11,4787 13,1878 12,0829 11,900
10 11,45511 10,09312 11,134
2003 1 9,5752 7,1033 9,2844 8,414
資料來源: 政府統計處貿易統計資料發布組 Source : Trade Statistics Dissemination Section,(查詢電話:2582 5042) Census and Statistics Department
(Enquiry Telephone No.: 2582 5042)
844 1,398 5,162 43
59
9,135
98 169 83
47
1,133 2,007
979
98
2,046
933 1,779 7,426
920
937 1,827 6,366
2,141 7,875
60
主要以材料
110
6
87182
雜項製成品
7,666 46
85 167 5297 176
classified elsewheretransactions not
Commodities and
117
49
Miscellaneousmanufactured
136 68
的貨物及交易
50
7 8
164 102
145
153
83
210 72
136
83
156111107
110
101140 105
未列入其他分類
99
9
75
1,141 1,0411,7889231,050847
tobacco
機械及
and transport
運輸設備
Machinery
69
Chemicals and related
products, n.e.s.except fuelslubricants andMineral fuels,Beverages
and
1,8381,903
Crude materials,inedible,
1,026
1
飲料及
煙草
除燃料外的非食
用未加工材料
2 5
未列明在其他編號
的化學品及有關產品
礦物燃料、滑潤
劑及有關物質
3
related materials
12,96411,272
15,877
Manufactured
chiefly by material
83
978799 142
articles
分類的製成品
114
2,228
473107,773 597
96,44032,816
40
422,1562,747 53
6,59849
5,422
1,850
943 1,790 7,787
610655
993
5,94751
936998
114 201 78
2,023 8,066 44
5,06583,596
44,846
24,568
631 1,351 4,308 3851
goods classifiedequipment
784 6,2341,576
61
973
1,011 1,599 5,559 49
51香港統計月刊 二零零三年六月 Hong Kong Monthly Digest of Statistics June 2003

3.8 按貨品類別劃分的轉口貨值
Re-exports by Commodity Section百萬元
$ million
0 4標準國際貿易分類
﹝第三次修訂版﹞類別 食物及 動物及植物
SITC R3 Section 活動物 油、脂肪及蠟
Food Animal and 年 月 and live vegetable oils,Year Month animals fats and waxes
2000 18,515 988 74,9832001 16,445 682 66,7432002 15,196 732 70,1882002 2 1,319 62 4,495
3 1,363 56 5,6274 1,285 37 6,2605 1,326 48 6,0496 1,120 40 5,7277 1,335 85 6,3948 1,163 69 6,3279 1,190 94 6,688
10 1,134 52 5,94911 1,053 59 5,99712 1,248 74 5,905
2003 1 1,217 25 6,1202 918 12 5,1183 1,263 45 6,7444 1,137 42 6,397
標準國際貿易分類
﹝第三次修訂版﹞類別
SITC R3 Section貨物合計
年 月 TotalYear Month merchandise
2000 1,391,7222001 1,327,4672002 1,429,5902002 2 86,699
3 113,8934 112,9895 115,1626 113,3977 133,2288 129,1409 136,134
10 139,07611 130,93812 124,190
2003 1 125,4522 98,0453 133,8034 125,732
資料來源: 政府統計處貿易統計資料發布組 Source : Trade Statistics Dissemination Section, (查詢電話:2582 5042) Census and Statistics Department
(Enquiry Telephone No.: 2582 5042)
215
19,240 61,885 35,075 82
68
17,972
12,732 50,339 27,527
63,36886
16,309 60,031 39,704 8317,269 58,924 38,662
40,328
154
90
17,405 63,997 44,780 9195
18,781
386 1,274
3,357
489 1,268 266
333 1,2411,321
193
550
463
55,806 44,908
18,459 68,510 42,948
87
171
1,238 284
166
1,067
91
6
8956,33786
9
classified elsewhere
運輸設備
52,402 34,294
7
18,820 59,561 44,910
機械及
31,68016,861
19,62617,885
articles
216,264
482 1,236
214 962
414 1,303
508 1,289
1,249438
1,3611,262570
337 164197435 1,240
5,3575,6436,157
and relatedproducts, n.e.s.related materials
Chemicals
5
未列明在其他編號
的化學品及有關產品
3
礦物燃料、滑潤
劑及有關物質
Mineral fuels,lubricants and
14,53715,022 2,693
Crude materials,inedible,
except fuels
2,369
17,685
2
除燃料外的非食
用未加工材料
1
飲料及
煙草
Beveragesand
tobacco
8150,333 35,871 8548,830 37,918
分類的製成品
MachineryManufactured
主要以材料
Commodities andmanufacturedand transport
452729560,832 492,212
221
Miscellaneous雜項製成品
213
的貨物及交易
未列入其他分類
8
209167
transactions not
658,920 457,356560,060 464,613
equipmentgoods classified
203,868
16,752
195,114
chiefly by material
221 716 137
10,349 41,066 28,257 77
478 1,540 227
19,635 65,663 38,121 86
52香港統計月刊 二零零三年六月 Hong Kong Monthly Digest of Statistics June 2003

3.9 按用途類別劃分的進口及轉口貨值
Imports and Re-exports by End-use Category百萬元
$ million
消費品 資本貨品
年 月 食品 Consumer 燃料 CapitalYear Foodstuffs goods Fuels goods
進口
Imports2000 63,671 562,188 34,006 417,6222001 60,353 537,967 30,362 428,1472002 59,145 543,203 31,288 427,6952002 2 4,955 31,802 1,701 26,633
3 5,055 41,312 2,128 39,3614 4,749 41,646 2,564 35,3215 4,962 43,376 2,420 33,2076 4,244 44,278 2,897 33,5847 4,976 52,283 2,568 38,7958 4,639 52,209 3,122 34,9289 4,729 51,784 2,819 40,130
10 4,525 51,333 3,423 43,91611 4,773 47,386 2,836 37,48912 5,611 46,708 2,982 38,118
2003 1 5,208 47,189 2,768 34,7902 4,321 33,573 3,205 32,7563 4,941 47,071 2,893 40,4934 4,426 44,038 2,386 35,248
轉口
Re-exports2000 19,705 609,504 2,462 334,6822001 17,412 570,152 1,892 342,0452002 16,209 580,445 1,673 383,0122002 2 1,397 34,801 93 24,945
3 1,443 41,515 129 33,5134 1,364 43,490 134 31,1305 1,412 44,959 82 29,7506 1,181 46,592 158 29,1037 1,433 55,531 147 33,7088 1,250 56,001 115 31,3529 1,284 57,223 115 36,006
10 1,211 57,696 160 39,17011 1,130 52,739 229 35,85612 1,357 48,738 212 34,464
2003 1 1,282 50,540 111 34,7042 946 34,707 117 30,0213 1,324 49,929 174 36,0274 1,184 45,685 159 34,346
註釋: 貨品用途類別的範圍經輕微修訂,上表 Note : 有部分數字可能與以往發表的有差別 。
資料來源: 政府統計處貿易統計資料發布組 Source : Trade Statistics Dissemination Section,(查詢電話:2582 5042) Census and Statistics Department
(Enquiry Telephone No.: 2582 5042)
42,410
38,959
55,204
44,357
32,25538,81539,419
40,421
40,98440,839
52,808
58,814
36,87137,293
49,17443,270
49,696
25,462
42,130
The coverage of commodities by end-use category has been slightlymodified. Some figures in the above table may differ from previouslypublished ones.
36,363
425,369
32,985
46,119
395,966
49,309
49,386
41,505
46,241
580,475
原料及
半製成品Raw materials andsemi-manufactures
46,349
Month
448,252
558,088511,367
46,697
50,16951,696
53香港統計月刊 二零零三年六月 Hong Kong Monthly Digest of Statistics June 2003

3.10 按用途類別劃分的留用進口貨值
Retained Imports by End-use Category百萬元
$ million
消費品 資本貨品 所有用途類別 年 季 食品 Consumer 燃料 Capital All end-useYear Foodstuffs goods Fuels goods categories
2000 45,740 116,641 31,842 157,239 559,8932001 44,560 121,186 28,589 152,800 508,8762002 44,443 118,898 29,721 119,371 478,6062002 1 11,885 26,636 5,417 26,188 105,473
2 10,329 30,544 7,543 29,553 121,9423 10,709 32,794 8,158 32,372 128,3354 11,520 28,923 8,602 31,258 122,856
2003 1 11,245 29,041 8,489 26,828 118,248
資料來源: 政府統計處貿易資料分析組 Source : Trade Analysis Section,(查詢電話:2582 4918) Census and Statistics Department
(Enquiry Telephone No.: 2582 4918)
162,281
Quarter
161,729208,277
原料及半製成品Raw materials andsemi-manufactures
34,392
40,575
42,37043,85141,669
54香港統計月刊 二零零三年六月 Hong Kong Monthly Digest of Statistics June 2003

3.11 按主要貨品劃分的港產品出口貨值
Domestic Exports by Principal Commodity百萬元
$ million
84 885標準國際貿易分類 電動機械、
﹝第三次修訂版﹞段/組 服裝及衣服 器具、用具
SITC R3 Division/Group 配件 及其電動部件
Articles Electrical machin-of ery, apparatus 鐘錶
apparel and and appliances, Watches 年 月 clothing and electrical andYear Month accessories parts thereof clocks
2000 77,415 28,533 3,0122001 72,240 20,322 2,3542002 65,039 15,564 1,1642002 2 3,686 1,437 108
3 3,654 1,559 1184 4,193 1,400 1185 4,930 1,440 1316 6,232 1,307 897 7,444 1,348 928 6,524 1,315 869 6,497 1,209 84
10 6,238 1,114 7611 4,864 1,138 7912 6,076 1,115 76
2003 1 4,833 922 762 3,314 770 503 4,029 897 734 3,775 812 73
764 893標準國際貿易分類
﹝第三次修訂版﹞段/組
SITC R3 Division/Group
電訊設備
Tele- Articles 年 月 communications ofYear Month equipment plastics
2000 4,171 1,3582001 3,486 1,1402002 1,098 1,0052002 2 186 67
3 307 864 166 945 51 1026 8 977 24 948 54 889 32 70
10 25 7911 49 8512 38 77
2003 1 39 712 32 563 62 844 67 80
資料來源: 政府統計處貿易統計資料發布組 Source : Trade Statistics Dissemination Section,(查詢電話:2582 5042) Census and Statistics Department
(Enquiry Telephone No.: 2582 5042)
411 311 21
426 154
180 248 15405 290 22
28
583
9,164 5,808
3029
2723836
328 26
367 354 22551 349
462 329372 373
476 317540
precious materials
5,1554,736 4,034
240 2213,883
of precious or semi-
and silversmiths' wares,and other articles
塑膠製成品
292247
嬰兒車、玩具、
toys, games and
117
894
189
遊戲及運動貨品
171
432
Baby carriages,
670 424623
892
240
799
2,8707,6458,193 4,705
Textile yarn,fabrics, made-up articles and
related products
77 65
紡織紗、
織物、製成品
及有關產品
with office machinesand automatic data
processing machines
器的零件及附件Parts and accessoriessuitable for use solely
759適用於辦公室機器
及自動資料處理機
897
或半寶石製成品
銀器、及其他寶石
首飾、金器及
Jewellery, goldsmiths'
533 169
659
印刷品Printed
236
matters
660 211
39
sporting goods
363560
657
646 171189
650
662
401 34
375 294 23
440 411 28425
465
473 335 20
657 198
5,721 4,578 615
725 155
55香港統計月刊 二零零三年六月 Hong Kong Monthly Digest of Statistics June 2003

3.12 對外商品貿易貨值變動情況
Movement of External Merchandise Trade Values
年 月Year Month
2002 2 -19.8 -4.0 -21.5 -0.93 +0.2 +2.6 -11.4 -5.84 -2.1 +9.5 -17.4 -3.05 -2.1 +8.8 -24.3 -5.96 +6.0 +5.2 -11.0 -3.07 +7.3 +3.5 -9.1 -2.58 +5.8 +4.2 -12.9 +0.99 +6.2 +4.9 -8.9 -0.2
10 +13.4 +2.9 -12.6 -3.011 +15.2 +2.9 -12.4 -5.412 +16.2 +1.9 -15.1 -4.7
2003 1 +21.4 +3.5 -6.8 -3.62 +18.3 +0.8 -17.2 -4.93 +14.6 +4.8 -8.4 -4.04 +8.4 +0.9 -16.9 -6.6
年 月Year Month
2002 2 -7.6 -1.9 -9.1 -1.83 +3.7 +5.5 +2.2 +4.34 +4.7 +13.6 +2.5 +11.95 +1.0 +10.4 -1.8 +8.86 +10.4 +4.4 +8.0 +3.77 +12.1 +1.6 +9.8 +1.38 +7.9 +2.9 +5.7 +2.89 +12.0 +4.7 +10.0 +4.3
10 +15.7 +3.2 +12.9 +2.711 +20.5 +4.3 +17.3 +3.512 +20.7 +3.8 +16.7 +3.1
2003 1 +30.3 +5.2 +26.7 +4.52 +13.1 +1.4 +10.4 +0.93 +17.5 +4.3 +15.4 +3.64 +11.3 +1.5 +9.0 +0.9
資料來源: 政府統計處貿易統計資料發布組 Source : Trade Statistics Dissemination Section,(查詢電話:2582 5042) Census and Statistics Department
(Enquiry Telephone No.: 2582 5042)
series (%) seasonally adjusted series (%)change of original 3-month period of the3-month period of the
Year-on-year Year-on-yearchange of original
period over the preceding
原來數列的
Year-on-yearchange of originalchange of original
period over the preceding
原來數列的按年變動百分率
比較的變動百分率Change of the latest 3-month
按年變動百分率原來數列的
seasonally adjusted series (%)
Re-exports轉口
Change of the latest 3-month
近三個月與對上三個月
經季節性調整數列的近三個月與對上三個月
按年變動百分率
比較的變動百分率
經季節性調整數列的
比較的變動百分率原來數列的
經季節性調整數列的
series (%)
近三個月與對上三個月
進口Imports
港產品出口Domestic exports
近三個月與對上三個月經季節性調整數列的
series (%)
Year-on-year3-month period of the
比較的變動百分率Change of the latest 3-month
series (%) seasonally adjusted series (%)
period over the preceding3-month period of the
seasonally adjusted series (%)
period over the preceding
Total exports整體出口
按年變動百分率 Change of the latest 3-month
56香港統計月刊 二零零三年六月 Hong Kong Monthly Digest of Statistics June 2003

3.13 商品貿易指數
Merchandise Trade Index Numbers(2000=100)
年 月 貨量
Year Month Quantum
2000 100.0
2001 89.8
2002 79.7
2002 1 75.52 63.13 75.74 75.15 79.26 83.77 95.48 87.59 85.5
10 82.311 72.712 80.7
2003 1 69.52 51.83 67.2
年 月 貨值 貨量
Year Month Value Quantum
2000 100.0 100.0 100.0
2001 95.4 96.7 100.9
2002 102.7 104.9 102.1
2002 1 83.0 85.3 101.72 74.8 76.3 102.53 98.2 100.0 102.34 97.4 99.2 102.55 99.3 101.5 102.56 97.8 100.5 102.47 114.9 117.7 102.28 111.3 113.5 102.39 117.4 119.5 101.8
10 119.9 121.5 101.711 112.9 114.3 102.012 107.1 110.1 101.4
2003 1 108.2 109.5 101.42 84.5 86.0 101.43 115.4 116.1 101.5
註釋 ﹕ 貿易價格比率指數是根據整體出口單位價格指數與 Note :進口單位價格指數的比率計算出來。 index for total exports to that for imports.
資料來源: 政府統計處貿易資料分析組 Source : Trade Analysis Section,(查詢電話:2582 4918) Census and Statistics Department
(Enquiry Telephone No.: 2582 4918)
94.5
95.4
94.8 114.7 103.0
96.4 93.3
單位價格
Unit value
100.0
97.7
107.6 94.7
113.0 95.0
63.5
98.0 97.6
100.0 100.0
103.2 93.0 111.9
111.0 93.2102.9 92.8 111.6
Quantum貨量
78.9
121.193.4
93.4 117.9
93.3
122.5
86.6
104.3
103.278.0
102.3
126.6119.7114.0
116.8
94.5
96.196.3
95.3
95.695.6
95.194.9
95.6
95.6
92.2
76.1
109.2
95.6 102.7 95.395.6
123.9
120.6
95.0
100.0100.0100.0
Value
100.0 100.0
Unit value Quantum Value Unit value貨值 單位價格單位價格
72.3
68.156.9
進口
Imports
貨值
港產品出口
Domestic exports
貨量
105.1102.2 67.2
整體出口
92.2
102.771.0
67.2
87.4
92.9
Total exports
單位價格
92.7
92.2
93.0
貨值
73.8104.0
轉口
93.2
76.066.9
104.4 93.1 112.7 80.1109.4
111.6
The terms of trade index is derived from the ratio of the unit value
Value
95.1
94.8
95.2
94.2
114.9 94.8
81.3
94.672.7
108.2
95.295.1
95.695.8
92.8
Terms of trade
93.0118.2
104.4
119.8
Re-exports
93.491.3
91.5
92.4
貿易價格比率
Unit value
61.6 92.8
91.5
92.092.4
79.571.0 76.6 91.9
84.894.0 91.8
83.9 91.1
105.7
95.394.6 96.9 98.0 84.8
97.7 93.1
96.0 95.2
100.0
97.4 93.094.4 92.9
109.695.096.5
95.3107.8111.7 95.2
47.1 92.2
95.1 90.4 80.2 94.7
103.3 94.2
99.2
93.9
57香港統計月刊 二零零三年六月 Hong Kong Monthly Digest of Statistics June 2003

經季節性調整的商品貿易指數
Seasonally Adjusted Merchandise Trade Index Numbers
年 月 貨值 貨量 貨值 貨量 貨值 貨量 貨值 貨量
Year Month Value Quantum Value Quantum Value Quantum Value Quantum
2002 1 83.1 88.2 72.6 76.9 84.5 86.9 83.1 85.72 92.0 100.0 76.4 84.3 98.4 103.4 95.9 101.23 98.7 106.1 75.9 85.0 105.5 108.6 102.1 105.84 94.0 101.4 73.1 80.3 98.7 104.1 95.8 101.45 94.7 101.7 70.1 78.1 98.7 103.7 95.4 100.76 99.5 108.3 75.0 82.9 103.8 110.7 100.5 107.57 100.6 107.8 74.6 81.3 105.1 110.4 101.6 107.18 99.5 108.5 71.4 79.6 103.0 109.5 99.3 106.19 102.1 110.0 71.7 78.7 107.4 112.8 103.3 108.9
10 101.8 111.0 69.9 77.9 107.2 113.4 102.9 109.311 104.2 113.6 67.5 75.0 110.6 118.0 105.6 113.012 101.8 111.2 70.0 76.4 109.8 117.3 105.2 112.6
2003 1 107.9 115.4 67.9 73.2 113.7 120.5 108.4 115.12 100.9 109.1 61.1 66.6 106.4 113.6 101.2 108.23 113.9 123.5 70.1 75.1 121.4 128.2 115.5 122.1
年 月 貨值 貨量 貨值 貨量 貨值 貨量 貨值 貨量
Year Month Value Quantum Value Quantum Value Quantum Value Quantum
2002 1 -6.9 -5.2 -2.8 -2.5 -6.0 -5.5 -5.7 -5.22 -4.0 -2.3 -0.9 -1.8 -1.9 -1.0 -1.8 -1.13 +2.6 +4.5 -5.8 -5.6 +5.5 +5.7 +4.3 +4.54 +9.5 +11.3 -3.0 -1.1 +13.6 +14.7 +11.9 +13.05 +8.8 +9.4 -5.9 -3.5 +10.4 +10.8 +8.8 +9.36 +5.2 +5.8 -3.0 -2.0 +4.4 +6.6 +3.7 +5.87 +3.5 +3.3 -2.5 -3.0 +1.6 +2.8 +1.3 +2.38 +4.2 +5.0 +0.9 +0.1 +2.9 +4.5 +2.8 +4.19 +4.9 +4.8 -0.2 -0.7 +4.7 +4.5 +4.3 +4.0
10 +2.9 +3.7 -3.0 -2.5 +3.2 +3.3 +2.7 +2.811 +2.9 +3.0 -5.4 -5.0 +4.3 +4.1 +3.5 +3.312 +1.9 +2.9 -4.7 -4.3 +3.8 +4.7 +3.1 +4.0
2003 1 +3.5 +3.2 -3.6 -4.9 +5.2 +6.0 +4.5 +5.12 +0.8 +0.3 -4.9 -6.6 +1.4 +2.1 +0.9 +1.43 +4.8 +3.6 -4.0 -6.3 +4.3 +4.0 +3.6 +3.2
註釋 ﹕ 經季節性調整的單位價格指數並沒有製備。 Note :
資料來源: 政府統計處貿易資料分析組 Source : Trade Analysis Section,(查詢電話:2582 4918) Census and Statistics Department
(Enquiry Telephone No.: 2582 4918)
3.14
進口
Imports
指數 Index (2000=100)
港產品出口
港產品出口
整體出口
Re-exports Total exports
Re-exports Total exports Domestic exports 轉口
轉口 整體出口
Change of the latest 3-month period over the preceding 3-month period (%)
No seasonally adjusted unit value index is compiled.
Imports
最近三個月與對上三個月比較的變動百分率
進口
Domestic exports
香港統計月刊 二零零三年六月 58 Hong Kong Monthly Digest of Statistics June 2003

涉及外發中國內地加工的貿易
Trade Involving Outward Processing in the Mainland of China
輸往中國內地 輸往中國內地 由中國內地 原產地為中國內地經本港
的整體出口貨品 的港產出口貨品 進口的貨品 輸往其他地方的轉口貨品Total exports to Domestic exports Imports from Re-exports of the
年 月 the mainland to the mainland the mainland mainland of ChinaYear Month of China of China of China origin to other places
2000 282,233 39,304 567,000 647,338
2001 259,553 35,172 531,960 578,329
2002 274,349 28,627 525,333 590,834
2001 10 - 12 58,860 8,843 135,163 139,270
2002 1 - 3 56,726 6,490 106,453 128,7844 - 6 66,860 7,530 119,808 133,5687 - 9 77,384 7,795 153,395 165,203
10 - 12 73,379 6,811 145,678 163,279
2000 52.0 72.7 79.3 85.1
2001 47.5 71.0 78.0 82.2
2002 45.1 69.7 73.8 82.5
2001 10 - 12 43.9 73.0 78.2 78.4
2002 1 - 3 45.5 65.0 73.3 86.84 - 6 45.2 69.7 71.0 80.37 - 9 46.1 71.7 75.9 81.3
10 - 12 43.7 72.6 74.5 82.2
資料來源: 政府統計處貿易統計調查及研究組 Source : Trade Surveys and Research Section,(查詢電話:2565 5197) Census and Statistics Department
(Enquiry Telephone No.: 2565 5197)
66,568
43.3
42.0
3.15
輸往中國內地
的轉口貨品Re-exports tothe mainland
of China
涉及外發加工貿易的估計貨值 (百萬元)
50,236
50,016
69,588
Estimated value of outward processing trade ($ million)
242,929
224,381
59,330
245,723
43.8
41.0
44.343.3
涉及外發加工貿易的估計比重(百分比)
Estimated proportion of outward processing trade (%)
45.2
49.7
59香港統計月刊 二零零三年六月 Hong Kong Monthly Digest of Statistics June 2003

3.16 按主要服務組別劃分的服務輸出及輸入 ─ 以當時市價計算Exports and Imports of Services by Major Service Group─ At Current Market Prices
百萬港元
HK$ million
服務輸出
Exports of services
年 月 運輸 旅遊(1) 其他服務 合計
Year Month Transportation Travel(1) Other services Total
2000 99,513 61,786 58,6662001 @ 93,675 64,594 61,1732002 @ 103,003 78,046 58,8822002 1 - 3 @ 23,374 15,811 14,992
4 - 6 @ 25,275 20,033 14,272 7 - 9 @ 28,065 18,020 14,763
10 - 12 @ 26,289 24,182 14,8552003 1 - 3 @ 25,265 18,945 14,993
服務輸入
Imports of services
年 月 運輸 旅遊 其他服務 合計
Year Month Transportation Travel Other services Total
2000 48,628 97,402 34,3422001 @ 50,916 96,057 33,6782002 @ 51,670 96,846 32,7642002 1 - 3 @ 11,558 25,315 7,769
4 - 6 @ 12,675 22,656 7,800 7 - 9 @ 14,292 25,938 8,361
10 - 12 @ 13,145 22,937 8,8342003 1 - 3 @ 12,238 23,714 8,103
註釋: (1) Note : (1)
資料來源: 政府統計處國民收入統計科(一) Source : National Income Branch(1),(查詢電話:2582 5077) Census and Statistics Department
(Enquiry Telephone No.: 2582 5077)
191,543
47,08145,538
The Hong Kong Tourism Board (HKTB) is now reviewingthe receipts from visitors and per capita spending figuresand is now compiling new data. The figures of exports oftravel services are subject to revision later on when newinformation becomes available from HKTB later in theyear.
2,708 46,763
2,439
3,5123,774 48,690
2,40752,103
香港旅遊發展局現正進行檢討訪港旅客帶來之收益及每人平均消費的數據,並編製新的數字。當香港旅遊發展局於今年稍後發布新的數字後,服務輸出中旅遊服務的數字亦會作相應的修訂。
11,802 192,45312,132 193,412
相關的服務
11,170
and other trade-
94,79823,763 83,343
related services
及其他與貿易
Merchanting
35,439 100,76527,625 86,828
24,064 78,241117,216 357,147
相關的服務
and other trade-
317,580106,447 325,889
97,616
商貿服務
商貿服務
33,950
及其他與貿易
Merchanting
related services
60香港統計月刊 二零零三年六月 Hong Kong Monthly Digest of Statistics June 2003
3.17 按主要服務組別劃分的服務輸出及輸入 ─ 物量指數 (二零零零年=100)Exports and Imports of Services by Major Service Group─ Volume Indices (2000=100)
服務輸出
Exports of services
年 月 運輸 旅遊(1) 其他服務 合計
Year Month Transportation Travel(1) Other services Total
2000 100.0 100.0 100.02001 @ 98.4 107.5 109.32002 @ 109.7 130.1 108.62002 1 - 3 @ 100.6 105.6 112.0
4 - 6 @ 108.2 131.0 104.9 7 - 9 @ 116.3 126.3 107.1
10 - 12 @ 113.8 157.7 110.32003 1 - 3 @ 109.4 124.4 114.7
服務輸入
Imports of services
年 月 運輸 旅遊 其他服務 合計
Year Month Transportation Travel Other services Total
2000 100.0 100.0 100.02001 @ 103.1 100.9 101.32002 @ 106.0 100.4 97.62002 1 - 3 @ 95.9 109.2 95.8
4 - 6 @ 104.2 93.7 93.5 7 - 9 @ 116.6 105.0 98.0
10 - 12 @ 107.2 93.7 103.22003 1 - 3 @ 99.4 98.2 95.8
註釋: (1) Note : (1)
資料來源: 政府統計處國民收入統計科(一) Source : National Income Branch(1),(查詢電話:2582 5077) Census and Statistics Department
(Enquiry Telephone No.: 2582 5077)
相關的服務Merchanting
related services
116.6
相關的服務
及其他與貿易
商貿服務
119.4
117.5
104.8110.1126.9135.9
100.0113.6 106.9
100.0
The Hong Kong Tourism Board (HKTB) is now reviewingthe receipts from visitors and per capita spending figuresand is now compiling new data. The figures of exports oftravel services are subject to revision later on when newinformation becomes available from HKTB later in theyear.
香港旅遊發展局現正進行檢討訪港旅客帶來之收益及每人平均消費的數據,並編製新的數字。當香港旅遊發展局於今年稍後發布新的數字後,服務輸出中旅遊服務的數字亦會作相應的修訂。
98.4
102.5102.3
96.3108.4101.8
93.592.8
134.9
104.0145.3
102.0
Merchantingand other trade-related services
100.0 100.0109.2
商貿服務
及其他與貿易
123.2
129.0
102.0104.1
149.9159.9
and other trade-
61香港統計月刊 二零零三年六月 Hong Kong Monthly Digest of Statistics June 2003


香港統計月刊 二零零三年六月 Hong Kong Monthly Digest of Statistics June 200363
工業生產
Industrial Production
概念及方法 Concepts and Methods
製造業生產者價格指數旨在反映本地製造業生
產價格的變動。生產者價格是指製造商對其產
出所收取的銷售價格(即已扣除任何退回買家
的折扣或回佣,並加上任何附加費用),但運
輸費用和其他雜費並不包括在內。
The producer price indices for manufacturingindustries reflect changes in prices of localmanufacturing output. Producer prices are sellingprices (net of any discounts or rebates allowed tobuyers, plus any surcharges) received bymanufacturers. Transportation and other incidentalcharges are not included.
工業生產指數量度本地製造業生產的實質變動
,即扣除價格調整因素後本地生產量的變動。
The index of industrial production measures thechanges in local manufacturing output in real terms,i.e. changes in the volume of local production afterdiscounting the effect of price changes.
主要製造行業的手頭訂單價值指數,是量度廠
商在每月月底前已接獲而未將之投入生產的訂
單,與及就已投入但未完成生產的訂單而言,
尚未完成的部分。本指數可作為一項經濟預報
指標,反映本港主要製造行業的短期表現。
Value indices of orders-on-hand for majormanufacturing industries measure the orders receivedbefore the end of each month but not yet entered intoproduction and, where production of orders has beenstarted but not yet completed, those uncompletedparts of the orders. The indices can be used as aleading economic indicator of short-termperformance of the major manufacturing industries inHong Kong.
其他有關刊物 Further References
手頭訂單按月統計調查 Monthly Survey of Orders-on-hand工業生產按年統計調查報告 Report on Annual Survey of Industrial Production工業生產按季指數 Quarterly Index of Industrial Production製造業按季生產者價格指數 Quarterly Producer Price Indices for Manufacturing
Industries紡織業生產按季統計數字 Quarterly Textile Production Statistics

圖 4.1 所有製造行業的生產者價格指數的變動情況
Chart 4.1 Movements of Producer Price Index for All Manufacturing Industries
圖 4.2 所有製造行業的工業生產指數的變動情況
Chart 4.2 Movements of Index of Industrial Production for All Manufacturing Industries
按年變動百分率Year-on-year % change
-4
-3
-2
-1
0
1
Q4/00 Q2/01 Q4/01 Q2/02 Q4/02#
%
-4
-3
-2
-1
0
1
2
3
1992 1994 1996 1998 2000 2002#
%
按年變動百分率Year-on-year % change
經季節性調整數列與上季比較的變動百分率
% change of the seasonally adjusted series overthe preceding quarter
-12
-10
-8
-6
-4
-2
0
2
Q4/00 Q2/01 Q4/01 Q2/02 Q4/02#
%
-12
-9
-6
-3
0
3
1992 1994 1996 1998 2000 2002#
%
64香港統計月刊 二零零三年六月 Hong Kong Monthly Digest of Statistics June 2003

4.1 製造業生產者價格指數
Producer Price Indices for Manufacturing Industries
(2000=100)(1)
所有製造行業All 塑膠製品業
manufacturing PlasticYear industries products
2000 100.0 100.02001 98.4 99.72002 # 95.7 97.12001 10 - 12 98.1 100.02002 1 - 3 95.8 97.9
4 - 6 95.8 97.2 7 - 9 95.5 96.4 10 - 12 95.9 96.7
Year
2000200120022001 10 - 122002 1 - 3
4 - 6 7 - 9 10 - 12
註釋 : (1) 自二零零二年第三季起,製造業生產者價格指 Notes : (1)數的基期轉為二零零零年。
(2) 由於「其他製造業」包括生產不同性質產品的 (2)製造業,這行業組別的生產者價格指數或會有較大的波動。
資料來源: 政府統計處工業生產統計組 Source : Industrial Production Statistics Section,(查詢電話:2805 6643) Census and Statistics Department
(Enquiry Telephone No.: 2805 6643)
#
98.2 98.1 97.4
97.4
95.9 97.4 97.1
90.8 96.8
97.0 96.4
As from the third quarter of 2002, the base year of theProducer Price Indices for Manufacturing Industries has
100.0
96.3
100.0 100.0
and equipment) electronic products and components
#
金屬製品業 電器及電子 機械、設備、儀器
96.2
年 Paper productsMonth (except footwear) (including knitting) and printing 月 Wearing apparel Textiles
99.7100.0 100.0 100.0
99.3 97.9 99.797.0 97.895.9 97.5 97.8
年 月
(機械及設備除外) 製品製造業
Month
Machinery, equipment, Other(except machinery electrical and apparatus, parts manufacturing
Fabricated metal products Consumer
industries(2)
#
96.3 93.295.6 93.2
96.3 95.3
紙品及(鞋類除外) (包括針織) 印刷業服裝製品業 紡織製品業
97.7
97.0
99.8 98.896.2 97.4
95.7 93.6
96.8
及零件製造業 其他製造業(2)
100.097.8
96.4
92.5
94.7 92.5 94.2
92.992.0 96.7
95.4
group may tend to be more fluctuating.
96.5
As "Other manufacturing industries" comprises a combinationof industries producing manufactured products of varyingnature, the producer price index so compiled for this industry
been changed to 2000.
99.8
65香港統計月刊 二零零三年六月 Hong Kong Monthly Digest of Statistics June 2003

4.2 工業生產指數
Index of Industrial Production
(2000=100)(1)
所有 紙品及製造行業 印刷業
All Paper 塑膠製品業manufacturing products Plastic
Year industries and printing products
2000 100.0 100.0 100.02001 95.6 98.8 84.82002 86.3 98.6 75.72001 10 - 12 94.9 96.6 72.52002 1 - 3 77.4 83.1 70.2
4 - 6 89.3 105.0 89.0 7 - 9 92.2 101.8 76.0 10 - 12 86.2 104.7 67.4
機械、設備、儀器及零件
製造業Machinery, 其他產品equipment, 製造業apparatus, Miscellaneousparts, and manufacturing
Year components industries
2000 100.0 100.02001 91.5 94.92002 76.1 98.52001 10 - 12 83.5 89.42002 1 - 3 69.9 92.2
4 - 6 82.5 97.9 7 - 9 84.3 96.6 10 - 12 67.8 107.3
註釋 : 統計表除行業組別外,亦包括四個選定行業,該四 Notes :個選定行業俱佔有關組別內較大的比重,並為組別內的主要成份。該四個選定行業以斜體顯示,方便閱讀。(1) 自二零零二年第三季起,工業生產指數的基期轉 (1)
為二零零零年。
資料來源: 政府統計處工業生產統計組 Source :(查詢電話:2805 6643)
65.9
metal products products
67.3
100.0100.0
#
and equipment) optical goods
(except
基本金屬及
machinery
64.584.6
100.0
105.8
(機械及設備除外)
101.2 98.9#
101.3
98.4
96.2
Fabricated
電器及電子製品、機械、專業設備
72.6 64.3
106.2
#
95.6106.4
114.493.3
100.099.9
年
年
金屬製品業Basic metals
and fabricated
106.2
100.0
beveragesand tobacco knitting)
電器及電子
76.392.599.7 92.2
mineral products
食品、飲品及煙草製品業
Food,
服裝製品業(鞋類除外)
Wearingapparel(except
professionalmetal products
金屬製品業
electronic products,machinery,
及光學用品製造業Electrical and
footwear)
100.0
紡織製品業(包括針織)
Textiles(including
Chemical,rubber,
plastic andnon-metallic
化學產品、橡膠製品、
塑膠製品及非金屬礦產製品業
100.0
67.0
102.1
100.0
71.589.2
87.6
製品製造業Consumer
92.1
equipment and
89.8
86.671.7
100.0
92.4
#
60.9 67.3 74.9
71.5 61.9 63.8
116.8 101.9
Besides the industry groups, the table also presents 4 selectedcomponent industries which carry relatively large weights and aremajor components of the industry groups concerned. Theseselected component industries are shown in italics for easy reference.
Industrial Production Statistics Section,Census and Statistics Department(Enquiry Telephone No.: 2805 6643)
As from the third quarter of 2002, the base year of the Indexof Industrial Production has been changed to 2000.
Month月
Month月
74.566.2 63.3 77.1
63.488.4 86.859.5 97.8
110.5 77.3
61.2 70.8
electrical andelectronic
76.4
66香港統計月刊 二零零三年六月 Hong Kong Monthly Digest of Statistics June 2003

4.3 經季節性調整的所有製造行業(1)工業生產指數的變動百分率
for All Manufacturing Industries(1)
年
Year
2001 1 - 3 4 - 6 7 - 9 10 - 12
2002 1 - 3 4 - 6 7 - 9 10 - 12 #
註釋 : (1) 「所有製造行業」是指工業生產按季統計調查內所 Note : (1) "All Manufacturing Industries" refer to all industries涵蓋的所有行業。 covered in the Quarterly Survey of Industrial Production.
資料來源: 政府統計處工業生產統計組 Source : Industrial Production Statistics Section,(查詢電話:2805 6643) Census and Statistics Department
(Enquiry Telephone No.: 2805 6643)
+1.4 -0.3
Rate of Change in the Seasonally Adjusted Index of Industrial Production
月 經季節性調整的指數與上季比較的變動百分率
Month % changes of the seasonally adjusted indices over the preceding quarter
-7.3 -2.4
-2.4 -1.3
-3.8 -0.7
67香港統計月刊 二零零三年六月 Hong Kong Monthly Digest of Statistics June 2003

4.4 紡織業生產
Textile Production
機構數目
年 月 Number of establishments
紡織業(1) 紡紗及梭織業 針織業Year Month Textile industry(1) Spinning and weaving Knitting
2000 2 077 368 8482001 1 925 338 7832002 1 812 336 7322001 12 1 925 338 7832002 3 1 916 355 784
6 1 901 330 7979 1 777 328 729
12 1 812 336 732
年 月
紡織業(1) 紡紗及梭織業 針織業Year Month Textile industry(1) Spinning and weaving Knitting
2000 27 489 7 200 13 3612001 26 617 6 949 13 1312002 25 416 7 043 12 8362001 12 26 617 6 949 13 1312002 3 27 326 7 420 14 041
6 27 976 7 325 14 5029 26 364 7 151 13 710
12 25 416 7 043 12 836
Indices of textile production(2000=100)(2)
年 月 紡織業(1) 紡紗及梭織業 針織業Year Month Textile industry(1) Spinning and weaving Knitting
2000 100.0 100.0 100.02001 99.7 106.8 95.42002 # 92.5 108.0 90.02001 10 - 12 105.8 124.3 91.92002 1 - 3 64.3 95.7 45.8
4 - 6 96.2 114.6 94.2 7 - 9 110.5 97.2 128.510 - 12 # 98.9 124.6 91.5
註釋 : (1) 除紡紗、梭織及針織業外,紡織業亦包括其他紡織 Notes : (1)
生產活動,例如漂染、紡織品印刷及生產紡織製成
品等。
(2) 自二零零二年第三季起,紡織業生產指數的基期轉 (2)
為二零零零年。
資料來源: 政府統計處工業生產統計組 Source : Industrial Production Statistics Section,(查詢電話:2805 6643) Census and Statistics Department
(Enquiry Telephone No.: 2805 6643)
(期末數字)
(期末數字)As at end of
就業人數Number of persons engaged
As from the third quarter of 2002, the base year of theIndices of textile production has been changed to 2000.
manufacture of made-up textile goods.
As at end of
such as bleaching and dyeing, textile printing and
Textile industry covers, besides spinning, weavingand knitting, also other textile production activities
紡織業生產指數
68香港統計月刊 二零零三年六月 Hong Kong Monthly Digest of Statistics June 2003

4.5 主要製造行業手頭訂單價值指數
Value Indices of Orders-on-hand by Major Manufacturing Industry
(1993=100)
年 月 所有製造行業(1) 服裝製品業 紡織業 電子製品業
Year Month All manufacturing industries(1) Wearing apparel Textiles Electronic products
2000 62.9 55.9 57.4 78.02001 57.3 51.7 52.7 69.32002 50.9 48.8 51.9 54.92002 2 48.7 42.9 46.5 58.7
3 54.1 48.3 54.8 64.04 57.2 55.5 61.7 59.35 54.8 51.2 62.7 55.16 55.6 54.5 66.9 49.77 56.2 52.2 62.9 57.18 53.5 49.5 60.8 54.39 49.2 51.5 50.5 48.8
10 43.9 47.0 37.3 46.111 44.6 45.0 40.6 49.012 42.4 41.0 34.6 51.2
2003 1 43.5 43.9 39.1 49.12 42.2 43.2 41.7 42.93 45.3 43.8 48.2 46.14 # 51.4 53.9 59.2 45.2
金屬製品業 印刷及出版業
年 月 電機製品業 Fabricated 塑膠製品業 Printing andYear Month Electrical products metal products Plastic products publishing
2000 29.1 29.3 21.1 109.22001 22.2 22.1 18.4 113.12002 14.3 13.7 15.9 113.92002 2 21.1 15.5 14.5 97.5
3 20.6 14.9 17.3 102.04 22.5 15.0 19.0 116.95 15.5 15.6 16.4 124.36 13.3 14.2 16.9 140.57 11.7 15.8 17.9 138.18 9.7 14.5 17.2 128.79 8.5 12.1 14.9 113.6
10 8.7 12.2 15.9 110.311 10.4 10.9 14.7 102.312 11.0 9.9 13.8 97.7
2003 1 12.2 7.8 11.8 96.72 13.7 8.1 13.8 102.33 12.6 9.6 16.1 108.94 # 12.2 10.8 16.3 125.5
註釋 : 數字只包括供本地生產的訂單。 Notes : Figures include only orders for local production.(1) 「所有製造行業」的數字是指手頭訂單 (1) Figures for "All manufacturing industries" refer to all industries
按月統計調查內所涵蓋的所有行業。 covered in the Monthly Survey of Orders-on-hand.
資料來源:政府統計處工業生產統計組 Source : Industrial Production Statistics Section,(查詢電話:2882 4208) Census and Statistics Department
(Enquiry Telephone No.: 2882 4208)
69香港統計月刊 二零零三年六月 Hong Kong Monthly Digest of Statistics June 2003

4.6 經季節性調整的所有製造行業(1)手頭訂單價值指數的變動百分率Rates of Change in the Seasonally Adjusted Value Indices of Orders-on-handfor All Manufacturing Industries(1)
百分率
Percentage
年
Year Month
2002 2 -2.43 +0.34 +1.15 +0.46 -2.17 -1.98 +0.29 +0.7
10 -2.611 -5.612 -7.1
2003 1 -6.92 -7.13 -6.44 # -2.6
註釋 : 數字只包括供本地生產的訂單。 Notes : Figures include only orders for local production.(1) 「所有製造行業」的數字是指手頭訂單 (1) Figures for "All manufacturing industries" refer to all industries
按月統計調查內所涵蓋的所有行業。 covered in the Monthly Survey of Orders-on-hand.
資料來源: 政府統計處工業生產統計組 Source : Industrial Production Statistics Section,(查詢電話:2882 4208) Census and Statistics Department
(Enquiry Telephone No.: 2882 4208)
4.7 石礦生產Quarry Production
公噸
Tonnes
年 月 石礦產量
Year Month Quarry production
2000 7 891 7262001 6 777 0382002 5 957 4072002 2 313 530
3 527 2374 467 9725 424 4766 428 8517 422 7738 470 7989 472 353
10 566 66011 700 41212 692 278
2003 1 867 3402 488 5043 741 9554 674 862
資料來源: Source : 土木工程署 Civil Engineering Department(如有查詢,請致電政府統計處。 (For enquiries, please call Census and Statistics Department.查詢電話:2582 4738) Enquiry Telephone No.: 2582 4738)
截至所示月份的三個月與先前三個月比較的變動率
月 Changes of a three-month period ending the month concernedcompared with the preceding three-month period
70香港統計月刊 二零零三年六月 Hong Kong Monthly Digest of Statistics June 2003

香港統計月刊 二零零三年六月 Hong Kong Monthly Digest of Statistics June 200371
土地、房屋、樓宇、建造
Land, Housing, Building and Construction
概念及方法 Concepts and Methods
公營租住單位包括香港房屋委員會及香港房屋
協會轄下的租住單位。
Public rental flats comprise rental flats of the HongKong Housing Authority and the Hong KongHousing Society.
資助出售單位包括按香港房屋委員會的居者有
其屋計劃、私人機構參建居屋計劃及中等入息
家庭房屋計劃興建的居住單位及按香港房屋協
會的住宅發售計劃及夾心階層住屋計劃建成的
居住單位。
Subsidized sale flats include flats built under theHome Ownership Scheme, Private SectorParticipation Scheme and Middle Income Housing ofthe Hong Kong Housing Authority; and those builtunder the Flat for Sale Scheme and Sandwich ClassHousing Scheme of the Hong Kong Housing Society.
香港房屋協會、私人機構參建居屋計劃或私人
的住宅樓宇,獲屋宇署簽發佔用許可證後,才
算「落成」;新界區小型屋宇則須由地政總署
簽發完工證後方視為「落成」。至於香港房屋
委員會的租住屋大廈及居者有其屋計劃下興
建的樓宇,則須待房屋署總建築師證明樓宇大
致上已竣工後,始視作「落成」。
A building is said to be 'completed' upon the issuanceof an Occupation Permit by the BuildingsDepartment in the case of a Hong Kong HousingSociety building, Private Sector Participation Schemebuilding or a private residential building; and in thecase of a small house in the New Territories, aCertificate of Compliance issued by the LandsDepartment. A Hong Kong Housing Authority estateblock and Home Ownership Scheme building are'completed' when they have been certified assubstantially completed by the Chief Architects of theHousing Department.
香港房屋協會大廈或私人樓宇須由屋宇署簽發
「同意書」才可動工興建,但新界區小型屋宇
則不需此項「同意」;但該類新界區小型屋宇
須獲地政總署簽發三張豁免證明書,包括地盤
平整,建築工程及渠務工程,才可動工興建。
香港房屋委員會大廈亦毋須取得「同意書」,
而香港房屋委員會批出建築合約當日即視作為
同意動工日期。
'Consents' to commence work are issued by theBuildings Department for the Hong Kong HousingSociety buildings or private buildings (except smallhouses in the New Territories where 'Consents' arenot necessary but three certificates of exemption inrespect of site formation works, building works anddrainage works respectively for these small houses inthe New Territories have to be obtained from theLands Department prior to commencement ofconstruction work). In the case of the Hong KongHousing Authority blocks, 'Consents' are not requiredand the date of award of contracts by the Hong KongHousing Authority is taken as the consent date.
表5.4至5.5所載樓宇統計數字,只包括私營機
構的建築活動以及按香港房屋協會的市區改善
計劃建造的單位。表5.6至 5.8也包括新界小型
屋宇,但表5.4及5.5則不包括這類小型屋宇。
「商業樓宇」指辦公室大廈及多用途商業樓
宇。「工業樓宇」指分層工廠大廈、特別用途
工廠大廈及貯物用途樓宇。「其他樓宇」指酒
店及旅店,以及作教育、醫務生、社會福
利、宗教、文化、康樂等用途的樓宇。
Building statistics in Tables 5.4 to 5.5 include onlybuilding activities in the private sector and those builtunder the Urban Improvement Scheme of the HongKong Housing Society. Tables 5.6 to 5.8 alsoinclude small houses in the New Territories butTables 5.4 and 5.5 do not include these small houses.'Commercial buildings' refer to office buildings andmulti-purpose commercial premises. 'Industrialbuildings' refer to flatted factories, specialised factorybuildings and storage premises. 'Other buildings'refer to hotels and boarding houses, and

香港統計月刊 二零零三年六月 Hong Kong Monthly Digest of Statistics June 200372
premises for education, medical and health, socialwelfare, religion, culture, recreation, etc.
表5.4、5.5及5.8所載私人樓宇/樓宇單位「實
用樓面面積」是指各層樓面面積總和,但不包
括樓梯、公共通道空間、升降機等候處、盥洗
室、廁所、廚房及為該樓宇提供升降機、空調
系統、或類似服務而安裝的機器所佔用的空
間。
The 'usable floor area' for private buildings/flats inTables 5.4, 5.5 and 5.8 is defined as the aggregate ofthe areas of the floor or floors in a storey or abuilding excluding any staircases, public circulationspace, lift landings, lavatories, water-closets, kitchensand any space occupied by machinery for any lift,air-conditioning system or similar service providedfor the building.
表5.8所載公營租住單位及資助出售單位樓面
面積是分別以「室內樓面面積」及「 實用面
積」計算。「室內樓面面積」是每單位由其外
牆及/或間隔牆向內一面量度計算的面積,而
「實用面積」是每單位由其外牆表面及與毗鄰
單位之分隔牆中線起量度計算的面積。
Floor areas for public rental flats and subsidized saleflats in Table 5.8 are measured based on 'internalfloor area' and 'saleable area' respectively. 'Internalfloor area' refers to the area of a flat measured to theinternal face of the flat’s enclosing and/or partywalls, while 'saleable area' refers to the area of a flatmeasured to the external face of the flat’s enclosingwalls and to the centre line of the flat’s party walls.
表5.9-5.11所載「私人住宅單位」是指各自設
有煮食設施和浴室(及/或廁所)的獨立居住
單位,並按樓面面積細分如下:
'Private domestic units' in Tables 5.9-5.11 are definedas independent dwellings with separate cookingfacilities and bathroom (and/or lavatory). They aresub-divided by reference to floor area as follows:
A 類單位:實用面積少於40平方米。 Class A : saleable area less than 40 m2.
B 類單位:實用面積為40至69.9平方米。 Class B : saleable area of 40 m2 to 69.9 m2.
C 類單位:實用面積為70至99.9平方米。 Class C : saleable area of 70 m2 to 99.9 m2.
D 類單位:實用面積為100至159.9平方米。 Class D : saleable area of 100 m2 to 159.9 m2.
E 類單位:實用面積160平方米或以上。 Class E : saleable area of 160 m2 or above.
表5.9-5.10所載樓宇售價指數及樓宇平均售
價,是根據差餉物業估價署審查以釐定印花稅
的樓宇交易資料加以分析。凡列為「可接納」
類別的樓宇交易,都用作分析。不過,假若買
賣日期較審查時間早達十二個月以上,或有關
買賣包括不同類別的物業,或有關樓宇仍未評
估差餉,又或有關住宅單位是不交吉出售,便
不會用作分析。買賣日期以簽署買賣合約的日
期為準,通常是達成臨時協議後二至三周。
Statistics on property price indices and averageproperty prices in Tables 5.9 and 5.10 are based onan analysis made of transactions scrutinized by theRating and Valuation Department for stamp dutypurposes. Transactions which are considered"acceptable" are included in the analysis. However,those transactions, the date of sale of which is morethan 12 months prior to the date of scrutiny, areexcluded. Also excluded from the analysis are thosetransactions involving a mix of property classes,premises which have not yet been assessed to ratesand domestic premises sold subject to existingtenancies. Date of sale is the date on which anAgreement for Sale and Purchase is signed. It shouldbe borne in mind that provisional agreement isgenerally reached 2-3 weeks earlier.
表5.11及5.12所載平均租金及租金指數,是根
據差餉物業估價署記錄的租金資料加以分析。
住宅樓宇的分析資料(載於表 5.11)是根據每
Average rents and rental indices in Tables 5.11 and5.12 are based on an analysis of rental informationrecorded by the Rating and Valuation Department.For domestic premises, the figures in Table 5.11 are

香港統計月刊 二零零三年六月 Hong Kong Monthly Digest of Statistics June 200373
個月內生效的新訂租約之租金計算。非住宅樓
宇的分析資料(載於表 5.12)是根據新訂租約
及續租時議定的租金。生效日期以租賃協議的
生效日期為準。不過,租金一般是在較早的日
期議定(新訂租約是二至四周前,續訂租約是
一至三個月前)。所有租金資料是以淨額計
算,即不包括差餉、管理費及其他費用在內。
analysed on the basis of fresh lettings effective in themonth being analysed. For non-domestic premises,the figures in Table 5.12 are analysed on the basis offresh lettings and renewal lettings. The effective dateis taken as the commencement date of a tenancyagreement. However, rents are normally agreed earlier(2-4 weeks earlier for fresh lettings, and 1-3 monthsfor lease renewals). Rents are analysed on a net basis,i.e. exclusive of rates, management and other charges.
主要承建商是指直接與地產發展商或聘用機構
簽約承造工程的建築機構,其與分判承建商不
同之處,在於後者是指向其他承建商承接合約
的建築機構。
A main contractor is one who enters into a contractdirectly with a property developer or the client partyof a project, as distinct from a subcontractor whoobtains the job from another contractor.
建築地盤是指在一指定地點從事一項或多項建
築工程的主要工序的地方。
A construction site refers to a demarcated localitywhere one or more major stages or processes ofconstruction work are being carried on.
非地盤工程是指小規模新建工程及在現有樓宇
及建築物內進行的工程。
The non-site work refers to those construction workperformed at minor new construction work locationsand erected buildings and structures.
因換地權益而取得的地價的計算方法,是從發
出換地權益書時所批土地的當時價值扣除政府
收回該幅土地的價值。通過拍賣或公開投標而
取得的地價即為該幅土地的拍賣/投標價。
The realised premium of land acquired by a landexchange entitlement is calculated by deducting theGovernment's value of the resumed land from thevalue of the land to be granted prevailing at the timewhen the exchange entitlement letter was issued. Therealised premium of land acquired through auction orpublic tender is the auctioned/tendered price of theland.
用作特別低價房屋計劃、居者有其屋計劃,以
及作公用事業、學校、教堂、廟宇、診所、福
利及某種慈善用途的土地,通常以私人協約方
式批租。在這些情況下,所收取的地價,由不
向非牟利性質機構收取分文,以至向公用事業
收取十足市價不等。
Land for special low cost housing projects and HomeOwnership Schemes as well as for public utilities,schools, churches, temples, clinics, welfare andcertain charitable purposes is usually granted byprivate treaty, and in such cases, the premiumcharged varies from nothing for non-profit-makingpurposes up to the full market value for publicutilities.
其他有關刊物 Further References
香港物業報告,差餉物業估價署編製
屋宇建築、建造及地產業按年統計調查報告
建造工程完成量按季統計調查報告
Hong Kong Property Review, published by the Ratingand Valuation Department
Report on Annual Survey of Building, Constructionand Real Estate Sectors
Report on the Quarterly Survey of ConstructionOutput

圖 5.1 私人住宅單位的售價及租金指數Chart 5.1 Price and Rental Indices of Private Domestic Units
圖 5.2 私人寫字樓的售價及租金指數Chart 5.2 Price and Rental Indices of Private Office
售價指數Price Index
租金指數 (新訂及續租租約)Rental Index (Fresh and renewal lettings)
售價指數Price Index
租金指數 (新訂租約)Rental Index (Fresh lettings)
0
50
100
150
200
3/01 7/01 11/01 3/02 7/02 11/02 3/03
指數Index (1999=100)
0
50
100
150
200
1992 1994 1996 1998 2000 2002
指數Index (1999=100)
0
50
100
150
200
250
3/01 7/01 11/01 3/02 7/02 11/02 3/03
指數Index (1999=100)
0
50
100
150
200
250
1992 1994 1996 1998 2000 2002
指數Index (1999=100)
74香港統計月刊 二零零三年六月 Hong Kong Monthly Digest of Statistics June 2003

5.1 永久性屋宇單位總數
Stock of Permanent Quarters
年 季粉嶺/上水
九龍 沙田 大埔 Fanling/ 總計
Year Kowloon Sha Tin Tai Po Sheung Shui Total
2001 1 671 900 197 100 86 800 78 300 2 236 6003 688 100 203 700 86 800 78 300 2 281 500
2002 1 686 800 208 100 87 100 78 300 2 295 0003 705 200 208 200 87 100 78 300 2 332 800
2003 1 711 800 208 100 87 800 79 200 2 360 500
註釋 : 地區劃分是根據規劃署所界定的主要地區而劃分,作為規劃之用 Note :,有別於區議會分區的分界。
資料來源: 政府統計處普查策劃組 Source :(查詢電話:2716 8006)
5.2 公營租住單位總數
Stock of Public Housing Rental Flats
年 季 新界其粉嶺/上水 餘地區
九龍 沙田 大埔 Fanling/ Rest of New 總計Year Kowloon Sha Tin Tai Po Sheung Shui Territories Total
2000 242 405 56 904 23 671 21 524 68 974 639 8612001 236 565 54 491 22 035 20 883 85 761 639 9312002 238 677 50 962 22 331 20 208 87 513 639 7102002 1 236 897 53 692 21 974 20 834 85 259 639 594
2 235 572 53 327 22 345 20 656 85 742 639 3303 239 660 51 493 22 341 20 427 85 727 639 4254 238 677 50 962 22 331 20 208 87 513 639 710
2003 1 232 172 50 439 22 308 19 978 89 095 634 209
2000 11 973 3 730 0 0 2 200 32 3402001 11 973 3 730 0 0 2 173 32 3132002 11 973 3 730 0 0 2 173 32 3132002 1 11 973 3 730 0 0 2 173 32 313
2 11 973 3 730 0 0 2 173 32 3133 11 973 3 730 0 0 2 173 32 3134 11 973 3 730 0 0 2 173 32 313
2003 1 11 973 3 730 0 0 2 173 32 313
2000 60 634 23 671 21 524 71 174 672 2012001 58 221 22 035 20 883 87 934 672 2442002 54 692 22 331 20 208 89 686 672 0232002 1 57 422 21 974 20 834 87 432 671 907
2 57 057 22 345 20 656 87 915 671 6433 55 223 22 341 20 427 87 900 671 7384 54 692 22 331 20 208 89 686 672 023
2003 1 54 169 22 308 19 978 91 268 666 522
註釋 : + 包括在茵怡花園出售樓宇內的出租單位。 Note : +
資料來源: 房屋署; Sources : 香港房屋協會
(如有查詢,請致電政府統計處。
查詢電話:2582 4738)
77 021 248 870
Including purchasers at Verbena Heights, who chose to rent the flats wherethey had rescinded their purchase.
100 949
4 769 0 + 0 +
+
77 105 247 545 105 401 53 619
9 668 4 769 9 668
+ 4 769 0
166 400
4 769 0
香港房屋協會Hong Kong Housing Society
366 500372 800
Mun
353 500
164 500
160 800164 500
9 668 9 668
Quarter Island
As at end of Hong KongIsland
Census Planning Section, Census and Statistics Department
新界其餘地區
Rest of NewTerritories
屯門Tuen
397 700383 100245 100
荃灣/葵青Tsuen Wan/Kwai Tsing
236 800238 000239 400
247 000
Kwai TsingTuen
荃灣/葵青
Mun
屯門
168 200
(Enquiry Telephone No.: 2716 8006)
Tsuen Wan/
The geographical classification is by broad districts as defined by thePlanning Department for planning purposes. Broad districts are differentfrom District Council Districts.
(期末數字)
67 367 66 770
Quarter
香港房屋委員會
53 645 58 516
Hong Kong Housing Authority 101 097
99 184
(期末數字)As at end of
香港島Hong Kong
9 668 4 769
455 700
香港島
459 300458 000
451 400
460 700
4 769 +
76 438
9 668
254 378 105 866 Total stock 單位總數
0 +
53 617 67 353
75 11877 035
250 650 105 721 53 617
58 516248 538
0 9 668 4 769 0 +
65 469 100 691 53 617
65 450 100 952
75 137 251 633 105 460 53 617
67 437 100 632 53 619 52 636
65 450 100 952 53 617
75 118 250 650 105 721 53 617
103 953 53 645
Housing Department;Hong Kong Housing Society
52 636105 718
(For enquiries, please call Census and Statistics Department.Enquiry Telephone No.: 2582 4738)
65 427 101 178 53 612
9 668 4 769 0 +
75 095 244 145 105 947 53 612
75香港統計月刊 二零零三年六月 Hong Kong Monthly Digest of Statistics June 2003
5.3 公營租住單位認可居民人數
Authorized Population of Public Housing Rental Flats
粉嶺/ 新界其
年 季 香港島 荃灣/ 上水 餘地區
Hong 葵青 Fanling/ RestKong 九龍 Tsuen Wan/ 沙田 大埔 Sheung of New 總計
Year Quarter Island Kowloon Kwai Tsing Sha Tin Tai Po Shui Territories Total
2000 217 684 707 903 332 300 198 888 85 235 73 662 232 085 2 017 059
2001 213 140 691 046 321 502 181 173 76 114 71 118 270 321 1 985 414
2002 212 661 680 841 325 697 164 218 75 103 67 159 301 502 1 986 332
2002 1 213 572 697 457 325 691 178 707 75 911 71 058 284 103 2 002 8622 213 180 689 501 324 716 173 712 75 499 69 107 291 997 1 994 9093 213 225 691 259 323 946 166 976 75 445 67 973 295 864 1 993 6094 212 661 680 841 325 697 164 218 75 103 67 159 301 502 1 986 332
2003 1 212 158 676 050 326 066 162 571 75 107 66 212 304 262 1 981 895
2000 29 587 38 014 16 622 12 647 0 0 0 7 162 104 032
2001 28 228 37 413 16 145 12 369 0 0 0 7 030 101 185
2002 27 674 36 964 15 957 12 267 0 0 0 7 061 99 923
2002 1 27 917 37 267 16 086 12 352 0 0 0 7 025 100 6472 27 875 37 238 16 031 12 337 0 0 0 7 014 100 4953 27 837 37 133 16 004 12 306 0 0 0 7 047 100 3274 27 674 36 964 15 957 12 267 0 0 0 7 061 99 923
2003 1 27 515 36 849 15 781 12 162 0 0 0 6 961 99 268
2000 247 271 745 917 348 922 211 535 169 302 85 235 73 662 239 247 2 121 091
2001 241 368 728 459 337 647 193 542 161 000 76 114 71 118 277 351 2 086 599
2002 240 335 717 805 341 654 176 485 159 151 75 103 67 159 308 563 2 086 255
2002 1 241 489 734 724 341 777 191 059 156 363 75 911 71 058 291 128 2 103 5092 241 055 726 739 340 747 186 049 157 197 75 499 69 107 299 011 2 095 4043 241 062 728 392 339 950 179 282 158 921 75 445 67 973 302 911 2 093 9364 240 335 717 805 341 654 176 485 159 151 75 103 67 159 308 563 2 086 255
2003 1 239 673 712 899 341 847 174 733 159 469 75 107 66 212 311 223 2 081 163
資料來源: 房屋署; Sources : Housing Department;香港房屋協會 Hong Kong Housing Society(如有查詢,請致電政府統計處。 (For enquiries, please call Census and Statistics Department.查詢電話:2582 4738) Enquiry Telephone No.: 2582 4738)
(期末數字)As at end of
香港房屋委員會Hong Kong Housing Authority
屯門Tuen Mun
Total authorized population
157 197156 363
香港房屋協會Hong Kong Housing Society
158 921159 151
159 151
總認可居民人數
169 302
161 000
159 469
76香港統計月刊 二零零三年六月 Hong Kong Monthly Digest of Statistics June 2003
5.4 按樓宇種類劃分的新落成私人樓宇
Private Buildings Newly Completed by Type of Building
(千平方米)
Usable floor年 月 樓宇數目 area
Year Month No. of blocks ('000 sq. m.)
2000 378 822.2 104.0
2001 184 561.6 71.4
2002 876 998.4 19.6
2002 1 133 50.3 0.52 12 8.5 15.03 24 97.9 2.84 42 92.2 0.05 14 39.9 0.06 41 50.6 0.0
7 419 95.8 0.08 25 79.6 0.09 13 108.1 0.0
10 12 135.1 1.311 34 83.1 0.012 107 157.2 0.0
2003 1 10 20.5 16.72 7 10.2 0.03 108 39.1 14.7
其他用途樓宇 所有樓宇種類
Others All types of buildings
實用樓面面積(千平方米) 實用樓面面積(千平方米)
Usable floor area ('000 sq.m.) Usable floor area ('000 sq.m.)非住宅
年 月 Non-Year Month residential
2000 150.0 1 101.2
2001 148.2 963.4
2002 240.0 1 411.5
2002 1 4.0 52.02 18.8 24.63 2.8 103.54 0.7 92.25 9.2 74.56 46.8 88.2
7 62.0 96.38 31.5 209.29 0.0 229.6
10 0.3 139.211 28.8 91.912 35.2 210.3
2003 1 5.7 102.72 5.0 37.93 1.2 40.8
註釋 : (1) 包括住宅樓宇內用作非住宅用途的實用樓面面積 Note : (1),例如:會所/康樂設施、管理員辦事處/宿舍、
電機房等。
資料來源: 屋宇署 Source : Buildings Department(如有查詢,請致電政府統計處。 (For enquiries, please call Census and Statistics Department.查詢電話: 2582 4738) Enquiry Telephone No.: 2582 4738)
No. of blocks
6 27.3
154.9 34
8 0.3 23 6.8 44.6
124.7 47 32.8 7 1.7
55.9
11 3.0
69 1 0.0
22 0.1 22
61
15.7
165.3 443 69.0
247.4 30 17.8 265.0
49.7 153.2 4.3 96.5
0.5
13 9.4
37
4 18.3 4 0.0 47
43
1.1 0.8 17.1 0
82.2 3.3 1 22.0
1.6 2 2.5
1.5 2 0.3
390.8
No. of blocks
413.8
0
434 1 354.1
residential
0
2
非住宅
Total
0
12 1 0
5.4 0
Including usable floor area in residential buildings for non-domestic use,such as club house/recreational facilities, caretakers' office/quarters,transformer room etc.
49.1
23 18.0 92.5
63.4 38.8
101.0 189.2
1
1
0.0 0.0
樓宇數目
20.1 2
129.5 16
2 1.9 0.9
0.00.0
21
8 4
8
Residential
實用樓面面積實用樓面面積
(千平方米)
('000 sq. m.)No. of blocks
Usable floor樓宇數目 area
Residential
28.1
0.6 64.2
(千平方米)
area(1)
非住宅
Non-樓宇數目
Usable floor area ('000 sq.m.)
No. of blocks
商業樓宇
('000 sq. m.)
實用樓面面積(千平方米)
住宅
residential
實用樓面面積(1)
Usable floor
住宅樓宇 商住兩用樓宇
Residential/commercial Residential工業樓宇
Commercial Industrial
樓宇數目
No. of blocks
樓宇數目 住宅
2 2.4
16.2
121.5
0 3 6
0
344.41.8 0.2 6
28
83.3 27
71 362.7 78.2
271.8 42.1 117.7 26
56 378.9 87.8 14
46
1 514.9
Residential(1)
1
2
Non-
4.3 0
13.3
133
119 50.3 1 110
153
7.1
3.6
26
17.8 0 0.0
7.0
43.7
2
3.410.5
22.9
548.2 1 959.6
18210.4
住宅(1) 總計
0
43.6
9 14.20.0 148
0
101.1
3
12 0.0 128 95.9
4
10 3.2
2
150.4 29 47.7
306.2
7 53.1 22.5 2 38.2
7 0.0
7 0.0 119 17.5 58.3
2 1.6 0.4 1 1.2 1
611
77香港統計月刊 二零零三年六月 Hong Kong Monthly Digest of Statistics June 2003

5.5 按樓宇種類劃分的獲批准可動工興建私人樓宇
Private Buildings with Consent to Commence Work by Type of Building
實用樓面面積
(千平方米)
Usable floor年 樓宇數目 area
Year Month No. of blocks ('000 sq. m.)
2000 468 129.2
2001 212 45.7
2002 604 107.1
2002 8 11.57 0.0
25 2.2140 1.3234 0.3
9 16.7
11 0.02 0.4
38 0.018 35.533 39.479 0.0
2003 57 0.014 0.019 0.0
其他用途樓宇 所有樓宇種類
Others All types of buildings
實用樓面面積(千平方米) 實用樓面面積(千平方米)
Usable floor area ('000 sq.m.) Usable floor area ('000 sq.m.)
年
Year
2000
2001
2002
2002
2003
註釋 : (1) 包括住宅樓宇內用作非住宅用途的實用樓面面積 Note : (1),例如:會所/康樂設施、管理員辦事處/宿舍、
電機房等。
資料來源: 屋宇署 Source : Buildings Department(如有查詢,請致電政府統計處。 (For enquiries, please call Census and Statistics Department.查詢電話:2582 4738) Enquiry telephone No.: 2582 4738)
44 187.0 54.6 241.52 15 54.5 45.7 20.9 40.0
9.9 00.0 0
385.6 1 388.1
1 371.8
總計
1 7 0.1 10.6
46.3 114.89212 10 0.5 9.3
1 15.4
0.0
Including usable floor area in residential buildings for non-domestic use,such as club house/recreational facilities, caretakers' office/quarters,transformer room etc.
39 20.6 146.1 166.753 68.5
10 10 0.0 13.9
96.8
0.0
1
57.6
0
0.0 11.3
0.0 10
108.1
10 20.6
6 5 0.05 12
8 2
7.4
1.1 2 95.3
2
0.0 1
0.6
11.6 7.94 10 2.1 5.8
32 48.62.0
55.4
32.2
18
36 99.0156 61.4
181 6 0.0 5.8
Non-
30.81.3
住宅(1)
1
2.3
2
142.2
住宅
非住宅
4.2
7.7
0.02.2 0
42.23
1 3.659.1 15
0
404 1 002.5
9.7
1 1.5
0.3 2
1.1
36.8
51.8 9
樓宇數目
73.4 8.9 0
No. of blocks Residential(1)
54.0
13.1 2.9
2
8
3.1
69.3
2
1 3.62
月
Month
45
7
9
6
12
23
2
586.6
2.9
144.6
41.0
62.2
92.7
12.3
57.8
8
1
3
11 56.4
residential樓宇數目 Non-
Total
58.3 22 307.0
2
3
2
2.4 2
0
16.0
17
非住宅
residential
44.4 2
1.3 4
0
181.370
259 225.5 19.1 244.6 2.2
2011 20.1
49.3
128.2 13.6 58.9 45.3
63.8 11.2 74.9
67 19.1
37.4
16.9 115.8
80.8 110.7
21.5
119.3 62.1
804
240.2
75.0
1 849.5 706.8708 1 142.7
109.3 581.7 790.0
月
401.6
410.4 74 584.3
698.5
實用樓面面積
非住宅
57 98.8 32
Residential
(千平方米)
Usable floor
No. of blocks樓宇數目
工業樓宇
Industrial
樓宇數目
No. of blocks
商業樓宇
Non- area
Commercial 商住兩用樓宇
Residential/commercial
住宅樓宇數目
實用樓面面積(千平方米)
Usable floor area ('000 sq.m.)
No. of blocks
住宅樓宇
Residential
(千平方米)
實用樓面面積(1)
Usable floorarea(1)
('000 sq. m.) ('000 sq. m.)residential
1022.42
1.21
0.0 20.3
36 170.4
0.0 038.6
12.0 0.54
0
125 33.0
92 7.8
0
0
20238.7
96.1 12 168.8 14
No. of blocks Residential
2 20 5.3 8.53 6 0.0
11 14 0.0 6.4
9 23 13.5 23.4
7
14 44.3 4.8
7 0.0 13.0
131 42.6
2.0
0.0 0
3 9 2.9 8.8 42 189.4 13.6 203.0
78香港統計月刊 二零零三年六月 Hong Kong Monthly Digest of Statistics June 2003

5.6 按地區及房屋類型劃分的新落成居住單位
Residential Flats Newly Completed by Geographic Area and Type of Housing
荃灣/ 粉嶺/ 新界其
香港島 葵青 上水 餘地區
年 月 Hong Kong 九龍 Tsuen Wan/ 沙田 大埔 Fanling/ Rest of New 總計
Year Month Island Kowloon Kwai Tsing Sha Tin Tai Po Sheung Shui Territories Total
2000 256 21 187 3 624 370 5 263 0 2 526 2 594 35 8202001 2 793 14 973 7 109 2 719 0 0 0 21 792 49 3862002 0 10 558 3 158 226 0 0 0 6 212 20 1542002 1 - 3 0 2 000 1 598 226 0 0 0 0 3 824
4 - 6 0 4 366 800 0 0 0 0 306 5 472 7 - 9 0 3 393 0 0 0 0 0 0 3 39310 - 12 0 799 760 0 0 0 0 5 906 7 465
2003 1 - 3 0 0 362 0 0 0 0 1 598 1 960
2000 6 422 5 290 576 3 440 0 0 1 280 6 186 23 1942001 1 540 5 634 1 280 4 176 0 0 0 10 232 22 8622002 0 11 018 0 640 1 152 0 0 0 12 8102002 1 - 3 0 776 0 640 0 0 0 0 1 416
4 - 6 0 3 900 0 0 0 0 0 0 3 900 7 - 9 0 6 342 0 0 1 152 0 0 0 7 49410 - 12 0 0 0 0 0 0 0 0 0
2003 1 - 3 0 500 0 0 0 0 0 0 500
2000 3 873 6 657 2 838 3 943 4 483 614 1 260 2 606 26 2742001 6 982 7 139 1 224 1 576 154 252 413 6 246 23 9862002 2 171 6 999 3 206 81 2 722 1 032 781 15 754 32 7462002 1 - 3 821 272 8 3 29 325 30 1 406 2 894
4 - 6 204 493 1 140 43 455 62 26 3 480 5 903 7 - 9 745 1 360 864 21 1 964 430 34 7 333 12 75110 - 12 401 4 874 1 194 14 274 215 691 3 535 11 198
2003 1 - 3 1 570 374 3 4 22 67 66 2 424 4 530
2000 10 551 33 134 7 038 7 753 9 746 614 5 066 11 386 85 2882001 11 315 27 746 9 613 8 471 154 252 413 38 270 96 2342002 2 171 28 575 6 364 947 3 874 1 032 781 21 966 65 7102002 1 - 3 821 3 048 1 606 869 29 325 30 1 406 8 134
4 - 6 204 8 759 1 940 43 455 62 26 3 786 15 275 7 - 9 745 11 095 864 21 3 116 430 34 7 333 23 63810 - 12 401 5 673 1 954 14 274 215 691 9 441 18 663
2003 1 - 3 1 570 874 365 4 22 67 66 4 022 6 990
資料來源: 屋宇署; Sources : 房屋署;
地政總署;
香港房屋協會
(如有查詢,請致電政府統計處。
查詢電話:2582 4738)
Private flats
Buildings Department;
資助出售單位
私人樓宇單位
All types of flats 所有房屋類型單位
Housing Department;
Enquiry Telephone No.: 2582 4738)
Hong Kong Housing Society(For enquiries, please call Census and Statistics Department.
Lands Department;
Subsidized sale flats
屯門
Tuen Mun
公營租住單位
Public rental flats
79香港統計月刊 二零零三年六月 Hong Kong Monthly Digest of Statistics June 2003

5.7 按地區及房屋類型劃分的獲批准可動工興建居住單位
Residential Flats with Consent to Commence Work by Geographic Areaand Type of Housing
荃灣/ 粉嶺/ 新界其
香港島 葵青 上水 餘地區
年 月 Hong Kong 九龍 Tsuen Wan/ 沙田 大埔 Fanling/ Rest of New 總計
Year Month Island Kowloon Kwai Tsing Sha Tin Tai Po Sheung Shui Territories Total
2000 442 1 826 1 669 0 0 0 0 10 081 14 0182001 3 168 759 6 635 0 0 0 3 127 5 408 19 0972002 0 2 413 6 445 799 0 0 3 127 2 577 15 3612002 1 - 3 0 0 1 878 799 0 0 0 0 2 677
4 - 6 0 0 4 567 0 0 0 0 0 4 567 7 - 9 0 0 0 0 0 0 3 127 2 577 5 70410 - 12 0 2 413 0 0 0 0 0 0 2 413
2003 1 - 3 0 0 0 0 0 0 0 0 0
2000 1 216 3 190 2 072 0 1 152 0 0 4 406 12 0362001 317 6 310 510 0 0 0 0 3 729 10 8662002 0 2 000 0 0 0 0 0 320 2 3202002 1 - 3 0 2 000 0 0 0 0 0 0 2 000
4 - 6 0 0 0 0 0 0 0 0 0 7 - 9 0 0 0 0 0 0 0 320 32010 - 12 0 0 0 0 0 0 0 0 0
2003 1 - 3 0 0 0 0 0 0 0 0 0
2000 2 283 7 983 1 965 61 1 188 771 828 16 287 31 3662001 2 501 16 453 1 278 971 631 248 254 4 938 27 2742002 5 076 5 128 5 007 609 72 299 331 1 749 18 2712002 1 - 3 229 1 804 0 1 16 144 41 930 3 165
4 - 6 3 596 2 575 210 1 12 58 116 280 6 848 7 - 9 1 038 119 2 331 603 22 54 119 92 4 37810 - 12 213 630 2 466 4 22 43 55 447 3 880
2003 1 - 3 163 2 087 3 529 26 3 711 80 179 2 576 12 351
2000 3 941 12 999 5 706 61 2 340 771 828 30 774 57 4202001 5 986 23 522 8 423 971 631 248 3 381 14 075 57 2372002 5 076 9 541 11 452 1 408 72 299 3 458 4 646 35 9522002 1 - 3 229 3 804 1 878 800 16 144 41 930 7 842
4 - 6 3 596 2 575 4 777 1 12 58 116 280 11 415 7 - 9 1 038 119 2 331 603 22 54 3 246 2 989 10 40210 - 12 213 3 043 2 466 4 22 43 55 447 6 293
2003 1 - 3 163 2 087 3 529 26 3 711 80 179 2 576 12 351
資料來源: 屋宇署; Sources : 房屋署;
地政總署;
香港房屋協會
(如有查詢,請致電政府統計處。
查詢電話:2582 4738)
Buildings Department;
所有房屋類型單位 All types of flats
私人樓宇單位 Private flats
Enquiry Telephone No.: 2582 4738)
Hong Kong Housing SocietyLands Department;Housing Department;
(For enquiries, please call Census and Statistics Department.
Subsidized sale flats
屯門
Tuen Mun
公營租住單位
Public rental flats
資助出售單位
80香港統計月刊 二零零三年六月 Hong Kong Monthly Digest of Statistics June 2003

5.8 按房屋類型及樓面面積劃分的新落成或獲批准可動工興建居住單位
Residential Flats Newly Completed or with Consent to Commence Work byType of Housing and Floor Area
私人樓宇單位
Private flats少於 40至69.9 少於 40至69.9 少於 40至69.9 70至99.9 100至159.9 160平方米
40平方米 平方米 40平方米 平方米 40平方米 平方米 平方米 平方米 或以上
年 月 Less than 40-69.9 Less than 40-69.9 Less than 40-69.9 70-99.9 100-159.9 160 sq.m.Year Month 40 sq.m. sq.m. 40 sq.m. sq.m. 40 sq.m. sq.m. sq.m. sq.m. or above
2000 20 690 15 130 8 598 14 596 14 704 9 041 1 102 278 1 1492001 24 848 24 538 5 464 17 398 14 133 7 933 424 427 1 0692002 9 458 8 846 5 884 6 926 19 885 9 936 1 224 716 9852002 1 - 3 1 758 2 066 134 1 282 1 253 712 462 229 238
4 - 6 3 375 2 097 1 560 2 340 4 093 1 483 74 25 228 7 - 9 2 708 685 4 190 3 304 7 183 4 654 282 352 28010 - 12 1 617 5 848 0 0 7 356 3 087 406 110 239
2003 1 - 3 1 614 346 0 500 3 293 592 194 129 322
2000 10 101 3 917 9 603 2 433 23 452 5 392 818 258 1 4462001 15 376 3 721 5 403 5 463 19 922 5 691 654 136 8712002 11 730 3 331 800 1 520 11 241 4 397 1 246 113 1 2742002 1 - 3 2 203 474 800 1 200 1 661 1 089 93 11 311
4 - 6 2 949 1 618 0 0 4 203 1 288 833 24 500 7 - 9 4 627 1 077 0 320 2 636 1 283 144 64 25110 - 12 1 951 462 0 0 2 741 737 176 14 212
2003 1 - 3 0 0 0 0 10 871 1 108 56 24 292
註釋 : Note:
資料來源: 屋宇署; Sources : Buildings Department;房屋署; Housing Department;地政總署; Lands Department;香港房屋協會 Hong Kong Housing Society(如有查詢,請致電政府統計處。 (For enquiries, please call Census and Statistics Department.查詢電話:2582 4738) Enquiry Telephone No.: 2582 4738)
Floor areas for public rental flats and subsidized sale flats aremeasured based on 'internal floor area' and 'saleable area'respectively, while those for private flats are measured based on'usable floor area'. Please refer to the 'Concepts and Methods' onpages 71 and 72 for details.
公營租住單位及資助出售單位的樓面面積是分別以「室內樓面面積」及「實用面積」計算;而私人樓宇
單位則以「實用樓面面積」計算。詳情請參閱第71及72頁的「概念及方法」。
公營租住單位 資助出售單位
Public rental flats Subsidized sale flats
新落成居住單位 Residential flats newly completed
獲批准可動工興建居住單位Residential flats with consent to commence work
81香港統計月刊 二零零三年六月 Hong Kong Monthly Digest of Statistics June 2003

5.9 按樓宇種類劃分的樓宇售價指數
Property Price Indices by Type of Premises(1999=100)
私人 私人寫字樓 私人分層
零售業樓宇 (甲級,乙級 工廠大廈(3)
少於 40至69.9 70至99.9 100至159.9 160平方米 Private 及丙級)(2) Private40平方米 平方米 平方米 平方米 或以上 retail Private office flatted
年 Less than 40-69.9 70-99.9 100-159.9 160 sq. m. 所有類別 (Grades A, B factories(3)
Year 40 sq. m. sq. m. sq. m. sq. m. or above Overall and C)(2)
2000 88.3 89.5 91.2 94.2 98.7 89.6 93.6 89.9 91.22001 77.2 78.8 80.8 83.2 87.8 78.7 86.8 78.7 82.02002 # 68.0 70.1 71.8 76.7 81.8 69.9 85.0 68.5 74.82002 1 72.6 74.5 75.7 78.2 84.0 74.1 85.0 70.6 75.7
2 73.4 73.7 74.3 78.2 86.2 73.9 84.7 71.8 75.1 3 71.9 73.6 74.3 78.0 85.2 73.3 83.5 71.3 75.3 4 70.4 72.7 74.3 77.9 84.9 72.3 85.3 69.4 75.5 5 69.4 73.7 73.9 77.7 84.4 72.4 86.7 68.7 77.0
6 69.4 72.6 74.3 77.3 83.2 71.9 87.7 68.2 78.17 69.0 71.4 72.3 77.2 80.8 70.9 87.1 69.2 77.18 66.9 68.1 70.6 76.4 79.2 68.3 86.9 68.7 73.49 64.1 67.5 68.4 75.3 76.9 66.7 84.2 67.8 72.6
10 # 64.0 64.5 68.3 75.1 77.2 65.2 84.3 66.7 72.011 # 63.0 64.6 68.3 75.1 79.4 64.9 83.5 65.7 72.612 # 62.1 64.4 67.2 74.0 79.6 64.4 80.9 63.7 72.7
2003 1 # 60.9 62.7 67.0 72.4 80.2 63.0 80.5 62.6 72.12 # 60.3 62.5 65.6 71.6 78.0 62.5 79.5 61.8 70.93 # 58.6 59.1 63.1 68.7 75.1 59.9 77.1 61.1 71.8
註釋: Notes :
(1) 按實用面積分類。 (1)(2) (2)
(3) 指數祇計算樓上單位。 (3)
資料來源: 差餉物業估價署 Source : Rating and Valuation Department (查詢電話:2150 8903) (Enquiry Telephone No.: 2150 8903)
5.10 按樓宇種類劃分的樓宇平均售價
Average Property Prices by Type of Premises元(每平方米計)
$/sq. m.
私人住宅(1)
Private domestic(1)
少於 40 平方米 40 至 69.9 平方米
Less than 40 sq. m. 40-69.9 sq. m.
年 香港 九龍 新界 香港 九龍 新界
Year Hong Kong Kowloon New Territories Hong Kong Kowloon New Territories
2000 35,975 30,990 31,444 43,656 31,711 31,3582001 31,922 26,560 27,883 38,783 28,317 27,8412002 # 29,012 23,301 24,435 34,176 24,695 24,6102002 1 31,248 25,122 25,881 36,588 26,590 25,167
2 31,350 25,496 26,055 34,514 26,555 25,704 3 30,280 24,173 25,502 35,859 25,852 24,835 4 30,433 24,138 24,984 35,584 26,254 24,962 5 30,071 23,886 25,047 34,911 25,792 26,347
6 30,196 23,173 25,570 34,531 25,287 25,5117 29,128 23,111 24,728 33,724 24,990 25,0998 27,738 23,070 23,964 33,470 24,370 23,7319 26,773 22,266 23,275 33,324 22,697 24,223
10 # 26,037 21,760 22,686 32,038 22,426 23,05511 # 26,221 21,703 22,015 31,266 21,896 22,66112 # 25,914 21,117 21,996 31,624 22,272 22,368
2003 1 # 26,252 21,040 21,346 31,735 22,094 21,5152 # 24,558 20,678 20,849 30,181 22,682 21,2293 # 24,691 20,270 20,548 27,013 20,180 20,607
Month
月
Month
月
The number and location of transactions analysed may vary from month tomonth, consequently the price indices should be regarded as broadindicators of price trends only.
The indices are not restricted to the main office districts. Since 2000,price indices for private office have been compiled in respect of unitsgraded according to revised grading criteria. Hence, the indices from2000 onwards are not strictly comparable to earlier indices.
Classified by saleable area.
The indices are in respect of upper floor units only.
指數並非限於主要寫字樓地區。由二零零零年起,私人寫字樓售價指數均就重新界定級別的寫字樓編製。因此,由二零零零年起的指數不能直接與較早前的指數相比。
每月分析的交易數目及樓宇地點各有不同。因此,樓宇售價指數祇可視為一個概略的售價趨勢。
私人住宅(1)
Private domestic(1)
82香港統計月刊 二零零三年六月 Hong Kong Monthly Digest of Statistics June 2003

5.10 (續) 按樓宇種類劃分的樓宇平均售價
(Cont'd.) Average Property Prices by Type of Premises元(每平方米計)
$/sq. m.
私人住宅(1) --- 續
Private domestic(1) --- cont'd.
70至99.9平方米 100至159.9平方米
70-99.9 sq. m. 100-159.9 sq. m.
香港 新界 香港 新界
年 Hong 九龍 New Hong 九龍 NewYear Kong Kowloon Territories Kong Kowloon Territories
2000 54,957 38,515 37,324 63,194 46,639
2001 49,358 33,792 32,685 56,904 40,968
2002 # 42,089 30,663 29,501 51,748 37,861
2002 1 41,930 31,094 30,097 47,563 42,541 2 45,290 33,524 30,889 50,845 39,722 3 41,590 31,090 28,614 49,398 37,940 4 44,198 29,650 29,022 54,226 35,547 5 44,152 32,565 30,964 54,564 38,830
6 45,505 32,402 31,648 52,225 36,463
7 41,528 32,072 29,105 51,299 41,824 8 40,592 29,072 27,211 49,339 35,098 ++9 38,916 30,375 28,789 48,872 34,566 ++
10 # 41,232 28,999 29,486 55,278 34,792 ++11 # 38,100 30,231 28,501 52,033 35,901 12 # 40,260 26,699 28,949 52,944 34,095
2003 1 # 40,204 29,170 27,918 49,159 33,796 2 # 39,157 26,259 25,242 52,901 37,846 ++3 # 37,755 25,342 25,392 42,366 32,301 ++
私人住宅(1) --- 續 私人零售業樓宇
Private domestic(1) --- cont'd. Private retail
160平方米或以上
160 sq. m. or above
香港 新界 香港
年 Hong 九龍 New Hong 九龍
Year Kong Kowloon Territories Kong Kowloon
2000 80,222 70,992 44,589 121,920 152,9952001 70,312 58,686 35,676 109,710 125,402
2002 # 65,673 49,840 35,332 123,653 120,310
2002 1 68,014 48,743 ++ 38,444 ++ 109,905 113,451 2 71,540 38,674 ++ 34,801 ++ 109,661 114,342 3 71,745 53,416 ++ 32,982 ++ 93,931 129,542 4 63,272 45,062 ++ 35,427 129,094 146,688 5 70,221 46,094 ++ 41,927 161,389 153,789
6 69,572 54,835 ++ 35,891 ++ 104,094 130,090
7 67,674 50,385 ++ 32,363 ++ 118,727 127,162 8 61,565 38,841 ++ 33,759 ++ 130,344 112,581 9 59,100 46,571 ++ 34,596 ++ 104,190 136,765
10 # 63,298 47,268 ++ 27,461 151,843 100,347 11 # 61,951 98,749 ++ 34,433 ++ 101,531 82,971 12 # 60,709 48,057 ++ 37,683 136,257 94,103
2003 1 # 65,302 56,170 ++ 36,468 86,282 101,849 2 # 67,296 N.A. 40,133 ++ 105,634 109,951 3 # 65,252 46,349 ++ 35,355 ++ 78,060 103,777
28,00230,037
28,67431,59529,76629,533
32,086
35,07930,40934,546
月
新界
New
29,26330,765
31,987
35,77931,484
33,225
月
Month
41,38934,812
TerritoriesMonth
90,01393,928
108,085141,865118,602
95,584113,116105,649129,913
90,34793,43375,67185,352
105,122119,299
92,80277,08174,674
83香港統計月刊 二零零三年六月 Hong Kong Monthly Digest of Statistics June 2003

5.10 (續) 按樓宇種類劃分的樓宇平均售價
(Cont'd.) Average Property Prices by Type of Premises元(每平方米計)
$/sq. m.
私人寫字樓(2)
Private office(2)
甲級 乙級
Grade A Grade B
尖沙咀 尖沙咀
上環 北角 (4) Tsim 上環 北角 (4) Tsim 年 Sheung 中區 North Sha Sheung 中區 North ShaYear Wan Central Point (4) Tsui Wan Central Point (4) Tsui
2000 50,582 82,489 51,350 38,969 48,787 + 32,696 60,539 34,892 29,140 35,525 31,7192001 40,977 73,237 52,242 34,156 45,804 27,830 46,124 34,420 22,475 32,084 25,076
2002 # 19,673 54,337 39,643 27,648 39,510 20,800 40,214 30,305 20,092 30,033 24,584
2002 1 N.A. 73,282 + 32,560 + 29,250 + 39,581 + N.A. N.A. 34,864 + N.A. 26,307 + 25,360
2 24,330 + 58,443 + N.A. N.A. 47,713 + 22,195 + 39,697 + 30,596 + N.A. 31,020 21,844 + 3 N.A. 54,519 55,629 + N.A. 43,480 12,903 + N.A. 32,197 + 17,849 + 33,254 27,112 4 18,785 + 51,906 + 50,667 + N.A. 41,680 24,376 + N.A. 25,792 + 20,030 + 28,203 24,315 5 N.A. 58,706 + 45,884 + 19,940 + 40,152 + 17,978 + 46,160 + 24,424 + 22,045 + 29,739 26,435
6 18,000 + 48,954 N.A. 21,674 + 42,576 23,403 + N.A. 30,736 + 21,669 + 31,968 22,059
7 N.A. 65,007 + 29,336 + 35,023 + 36,186 + 25,084 + N.A. 31,905 18,401 + 30,929 21,675
8 N.A. 44,695 + N.A. 33,085 + 28,173 + 22,847 + 30,000 + 35,423 + N.A. 29,906 23,916 9 N.A. 66,667 + 29,379 + 37,594 + 43,725 20,831 + N.A. 36,298 18,072 + 30,724 25,792
10 # N.A. N.A. N.A. N.A. 39,171 20,872 + 34,142 + 26,974 + N.A. 30,058 18,660 +11 # 21,242 + 50,709 + 24,946 + N.A. 38,895 17,226 + N.A. 25,248 + 20,992 + 26,492 + 24,949 12 # 17,680 + 41,802 + 49,828 + N.A. 29,049 29,085 + N.A. 22,954 + 19,270 + 30,328 23,773
2003 1 # 19,430 + 53,389 + 26,373 + N.A. 30,680 + 18,342 + N.A. 29,813 N.A. 27,227 21,138 +
2 # N.A. N.A. N.A. 30,098 + 37,818 21,572 + N.A. N.A. 19,010 26,076 + 23,844 +3 # 15,033 + 65,283 + 32,266 + N.A. 38,300 + 17,064 + N.A. 26,299 19,760 + 29,514 20,191
私人寫字樓(2) --- 續 私人分層工廠大廈(3)
Private office(2) --- cont'd. Private flatted factories(3)
丙級
Grade C
尖沙咀 油麻地/
上環 Wan Chai/ 北角 (4) Tsim 旺角 香港 新界 年 Sheung 中區 Causeway North Sha Yau Ma Tei/ Hong 九龍 NewYear Wan Central Bay Point (4) Tsui Mong Kok Kong Kowloon Territories
2000 25,588 28,000 30,753 32,732 24,884 9,817 9,3082001 21,785 28,178 27,794 26,571 24,001 8,321 8,521
2002 # 19,245 29,656 23,377 24,581 22,514 8,051 8,271
2002 1 19,432 25,325 + 26,037 28,326 24,356 6,474 8,398
2 19,018 41,907 + 23,268 + 22,038 + 18,543 + 7,722 8,733
3 20,789 29,041 + 27,795 22,425 + 19,332 8,543 ++ 7,852
4 20,091 29,091 + 23,217 27,111 + 25,473 + 8,780 8,053
5 19,210 29,373 + 22,809 29,164 + 24,802 9,260 8,809
6 22,867 28,241 + 22,838 24,055 + 19,915 9,550 9,329
7 17,210 N.A. 24,336 23,298 + 23,314 8,146 8,434
8 17,839 29,308 + 24,085 + 22,538 + 22,506 7,275 7,702
9 20,099 36,111 + 22,211 25,770 + 23,130 7,535 8,278
10 # 21,555 N.A. 18,329 + 21,651 17,932 + 8,208 ++ 7,880
11 # 19,353 30,303 + 23,324 21,310 + 21,342 7,687 7,904
12 # 15,394 27,792 + 20,757 28,040 + 24,383 6,924 ++ 7,911
2003 1 # 19,000 21,886 + 18,963 23,400 + 20,045 + 7,099 ++ 8,020
2 # 13,826 + N.A. 17,670 + 23,779 22,206 9,573 ++ 8,153
3 # 18,617 26,136 + 19,703 22,538 + 18,484 7,191 8,087
註釋: Notes :
(1) (1)(2) (2)
(3) 平均售價祇計算樓上單位。 (3)(4) 包括魚涌。 (4)+ 表示少於五宗交易。 +
++ 表示少於二十宗交易。 ++
資料來源:差餉物業估價署 Source : Rating and Valuation Department (查詢電話:2150 8903) (Enquiry Telephone No.: 2150 8903)
21,305 4,699
20,107 4,888
21,014
18,745 4,953
17,483 5,359
4,52223,356 4,665
N.A.N.A.N.A.
27,869
N.A.N.A.N.A.N.A.
18,394 5,022
23,506 5,17924,684 5,11324,407
4,920
21,210 4,954
21,047 4,889
22,15322,249 4,948
N.A.N.A.
灣仔/銅鑼灣
Wan Chai/
N.A.N.A.
油麻地/
旺角
N.A.
灣仔/銅鑼灣
Wan Chai/Causeway
油麻地/
旺角
Yau Ma Tei/
44,508
月
MonthCauseway Yau Ma Tei/
Mong KokBayBay Mong Kok
由二零零零年起,私人寫字樓平均售價均就重新界定級別的寫字樓編製。因此,由二零零零年起的平均售價不能直接與較早前的數字相比。
每月分析的交易數目及樓宇地點各有不同。因此,樓宇平均售價祇可視為一個概略的售價趨勢。
The number and location of transactions analysed may vary from month to month, consequentlythe average prices should be regarded as broad indicators of price trends only.
Since 2000, average prices for private office have been compiled in respect of units gradedaccording to revised grading criteria. Hence, the average prices from 2000 onwards are notstrictly comparable to earlier figures.
按實用面積分類。
月
Month
灣仔/銅鑼灣
4,882
4,95922,169
Indicates fewer than 20 transactions.
Classified by saleable area.
Average prices are in respect of upper floor units only.Including Quarry Bay.Indicates fewer than 5 transactions.
22,264 5,028
N.A.
23,008 5,6416,215
N.A.N.A.N.A.N.A.
84香港統計月刊 二零零三年六月 Hong Kong Monthly Digest of Statistics June 2003

5.11 私人住宅樓宇新訂租約平均租金及租金指數
Average Rents and Rental Indices of Fresh Lettings ofPrivate Domestic Premises
元(每平方米每月計)
$/sq. m. per month平均租金
Average rents
少於40平方米 40至69.9平方米
Less than 40 sq. m. 40-69.9 sq. m.
香港 新界 香港 新界
年 月 Hong 九龍 New Hong 九龍 NewYear Month Kong Kowloon Territories Kong Kowloon Territories
2000 192 166 130 198 149
2001 187 153 120 191 146
2002 # 165 135 105 168 132
2002 1 177 147 112 180 134 2 176 135 106 177 136 3 173 137 106 170 135 4 167 135 106 175 135 5 166 134 105 169 132
6 169 131 107 169 135
7 168 138 104 166 132 8 162 132 105 171 131 9 161 135 103 164 130
10 # 155 128 104 163 127 11 # 153 129 101 161 122 12 # 153 132 104 154 122
2003 1 # 153 121 102 156 123 2 # 159 117 105 156 130 3 # 152 130 102 152 122
平均租金 --- 續
Average rents --- cont'd.
70至99.9平方米 100至159.9平方米
70-99.9 sq. m. 100-159.9 sq. m.
香港 新界 香港
年 月 Hong 九龍 New Hong 九龍
Year Month Kong Kowloon Territories Kong Kowloon
2000 252 172 144 276 195
2001 254 184 141 282 233
2002 # 226 164 123 248 196
2002 1 244 166 136 274 188 ++ 2 236 193 139 253 190 3 251 172 123 260 211 4 242 162 119 253 195 5 228 182 124 248 209
6 230 171 116 235 222
7 209 172 122 240 182 8 220 162 123 247 203 9 212 153 119 235 188
10 # 214 140 120 252 196 ++11 # 219 153 127 246 168 12 # 194 147 115 238 166 ++
2003 1 # 196 153 110 235 150 ++2 # 196 159 116 224 157 ++3 # 199 136 108 219 155 ++ 147
98
99103
150
101
10799
102
104102101
99
97
117
112
184
177
Territories
新界
100
9695
102
New
168157145
157
178167164
147
162
145
150149164134
85香港統計月刊 二零零三年六月 Hong Kong Monthly Digest of Statistics June 2003

5.11 (續) 私人住宅樓宇新訂租約平均租金及租金指數
(Cont'd.) Average Rents and Rental Indices of Fresh Lettings ofPrivate Domestic Premises
平均租金 --- 續
Average rents --- cont'd.
160平方米或以上
160 sq. m. or above
年 月 香港 九龍 新界
Year Month Hong Kong Kowloon New Territories
2000 197 174
2001 207 186
2002 # 191 169
2002 1 157 ++ 173 ++
2 275 ++ 187 3 184 ++ 168 4 117 ++ 175 5 154 ++ 158
6 159 ++ 140
7 180 ++ 188
8 181 ++ 174 9 175 ++ 158 ++
10 # 293 ++ 167 ++11 # 188 ++ 161 12 # 209 ++ 182 ++
2003 1 # 197 ++ 175
2 # 132 ++ 184 ++3 # 156 ++ 173 ++
租金指數
Rental indices(1999=100)
少於 40至69.9 70至99.9 100至159.9 160平方米
40平方米 平方米 平方米 平方米 或以上
年 月 Less than 40-69.9 70-99.9 100-159.9 160 sq. m. 所有類別
Year Month 40 sq. m. sq. m. sq. m. sq. m. or above Overall
2000 97.2 97.4 100.7 101.8
2001 93.0 93.9 101.9 104.5
2002 # 81.3 81.8 89.8 94.4
2002 1 86.5 85.8 95.3 99.3 2 84.9 85.3 94.8 98.0 3 83.8 84.9 94.4 97.4 4 83.3 84.8 93.4 96.0 5 81.8 83.5 92.3 93.6
6 81.5 82.5 89.6 94.2
7 80.8 81.7 89.4 93.98 80.4 81.3 88.1 94.29 80.3 79.4 86.8 93.5
10 # 77.8 78.7 86.5 92.711 # 77.6 77.5 84.1 92.312 # 76.9 76.5 83.3 87.5
2003 1 # 76.7 75.7 81.6 86.62 # 75.5 75.6 80.5 85.93 # 74.9 73.9 77.7 84.8
註釋: 每月租出樓宇數目及地點各有不同。因此,平均 Notes :租金統計數字祇可視為概略的租金趨勢。
數字按實用面積分類。
++ 表示少於二十宗交易。 ++
資料來源: 差餉物業估價署 Source :(查詢電話:2150 8903)
99.3
74.7 75.3
328
元(每平方米每月計)
$/sq. m. per month
316
324
306
(Enquiry Telephone No.: 2150 8903)
Figures are classified by saleable area.Indicates fewer than 20 transactions.
Rating and Valuation Department
The number and location of lettings may vary from month to month, consequentlythe average rental statistics should be regarded as broad indicators of rentaltrends only.
98.1
97.4 95.4
292322306301
314323298
307
276
271306296
86.084.6
259275
83.9
83.282.7
86.8
81.480.179.2
85.784.9
77.9
77.276.5
80.579.7
87.9
75.474.8
76.8
81.9
86.2
90.9 87.488.4 86.5
85.1 83.4
91.3 88.3
86香港統計月刊 二零零三年六月 Hong Kong Monthly Digest of Statistics June 2003

5.12 按私人非住宅樓宇類別劃分的新訂及續租租約平均租金及租金指數 Average Rents and Rental Indices of Fresh and Renewal Lettings by Type of Private Non-domestic Premises
元(每平方米每月計)
$/sq. m. per month平均租金
Average rents
私人零售業樓宇Private retail
香港 新界 年 月 Hong 九龍 New
Year Month Kong Kowloon Territories
2000 798 969 7482001 858 932 6872002 # 792 863 6472002 1 780 772 691
2 764 829 525 3 852 950 647 4 743 853 733 5 920 890 616
6 798 815 6627 750 889 6088 725 789 5779 762 765 584
10 # 757 876 67011 # 847 918 77312 # 791 1 066 630
2003 1 # 692 723 5522 # 938 907 6883 # 762 910 574
平均租金Average rents
私人寫字樓(1)Private office(1)
甲級 乙級Grade A Grade B
灣仔/ 油麻地/ 灣仔/ 油麻地/銅鑼灣 尖沙咀 旺角 銅鑼灣 尖沙咀 旺角
上環 Wan Chai/ 北角 (4) Tsim Yau 上環 Wan Chai/ 北角 (4) Tsim Yau 年 月 Sheung 中區 Causeway North Sha Ma Tei/ Sheung 中區 Causeway North Sha Ma Tei/
Year Month Wan Central Bay Point (4) Tsui Mong Kok Wan Central Bay Point (4) Tsui Mong Kok
2000 324 411 301 220 266 262 180 288 212 168 224 2092001 331 474 329 257 261 308 177 319 218 163 244 2072002 # 252 343 241 203 224 234 149 241 185 141 209 1932002 1 319 385 278 230 241 N.A. 171 268 190 160 221 198
2 372 + 364 275 188 + 230 N.A. 154 256 187 150 207 192 3 156 + 339 254 246 + 240 N.A. 144 258 199 137 209 201 4 218 357 238 191 + 216 206 + 144 247 180 127 210 185 5 196 323 236 174 + 229 N.A. 154 252 179 121 210 193
6 325 + 349 231 221 224 N.A. 145 223 194 155 200 1897 204 + 331 248 199 225 N.A. 155 246 178 160 207 2018 281 + 349 224 261 + 220 274 + 143 242 181 150 209 1879 263 + 331 214 202 + 218 228 + 139 237 186 140 211 184
10 # 251 331 259 N.A. 217 N.A. 157 223 179 142 + 200 20211 # 277 315 222 178 216 233 + 144 230 183 139 203 21112 # 212 + 328 212 150 + 214 N.A. 149 212 190 144 219 182
2003 1 # 313 + 305 217 169 + 208 N.A. 146 211 181 144 211 2022 # 248 + 305 244 148 + 205 N.A. 159 210 169 155 201 1973 # 354 + 321 201 167 + 190 N.A. 146 208 166 145 224 180
87香港統計月刊 二零零三年六月 Hong Kong Monthly Digest of Statistics June 2003
5.12 (續) 按私人非住宅樓宇類別劃分的新訂及續租租約平均租金及租金指數(Cont'd.) Average Rents and Rental Indices of Fresh and Renewal Lettings by
Type of Private Non-domestic Premises元(每平方米每月計)
$/sq. m. per month平均租金 --- 續
Average rents --- cont'd.私人寫字樓(1) --- 續 私人分層工廠大廈(2)
Private office (1)--- cont'd. Private flatted factories(2)
丙級Grade C
上環 灣仔/銅鑼灣 北角 (4) 尖沙咀 油麻地/旺角 香港 新界 年 月 Sheung 中區 Wan Chai/ North Tsim Yau Ma Tei/ Hong 九龍 New
Year Month Wan Central Causeway Bay Point (4) Sha Tsui Mong Kok Kong Kowloon Territories
2000 166 235 215 205 226 207 96 98 672001 164 248 211 201 235 202 88 91 642002 # 146 212 187 180 206 184 81 87 592002 1 151 237 189 192 189 194 90 89 60
2 155 199 194 181 206 182 85 91 61 3 150 213 200 184 210 181 87 94 64 4 147 217 198 174 195 193 78 83 58 5 151 203 190 175 212 184 81 86 58
6 148 201 184 174 200 189 75 85 58
7 139 213 182 180 237 176 79 87 60 8 145 215 184 188 219 175 79 88 59 9 147 203 177 175 214 185 80 87 60
10 # 147 220 173 171 186 179 80 84 5911 # 135 224 189 197 199 184 81 83 5912 # 130 214 171 175 198 184 81 89 60
2003 1 # 132 208 181 176 186 165 75 80 532 # 134 202 184 199 180 172 74 77 573 # 126 197 178 170 + 185 179 77 87 55
租金指數Rental indices(1999=100)
私人寫字樓私人零售 (甲級,乙級及丙級) (1)(3) 私人分層
年 月 業樓宇 Private office 工廠大廈 (2)Year Month Private retail (Grades A, B and C) (1)(3) Private flatted factories (2)
2000 101.3 98.5 95.42001 99.4 101.0 90.32002 # 93.0 85.6 82.8 2002 1 95.2 92.0 86.3
2 93.6 89.5 85.2 3 93.3 87.4 84.9 4 93.0 85.9 84.6 5 92.6 85.3 83.1
6 92.3 85.1 81.27 92.9 84.5 81.0 8 92.4 83.7 80.89 93.0 83.7 81.5
10 # 92.7 83.9 82.011 # 92.7 83.1 81.512 # 92.3 82.5 81.7
2003 1 # 90.9 81.9 82.2 2 # 90.4 81.0 81.63 # 90.7 78.5 79.1
註釋: Notes :
(1) (1)
(2) 數字祇計算樓上單位。 (2) Figures are in respect of upper floor units only(3) 指數並非限於主要寫字樓地區。 (3) Indices are not restricted to the main office districts.(4) 包括魚涌。 (4) Including Quarry Bay.+ 表示少於五宗交易。 + Indicates fewer than 5 transactions.
資料來源:差餉物業估價署 Source : Rating and Valuation Department (查詢電話:2150 8903) (Enquiry Telephone No.: 2150 8903)
每月租出樓宇數目及地點各有不同。因此,平均租金統計數字祇可視為概略的租金趨勢。
由二零零零年起,私人寫字樓平均租金和租金指數均就重新界定級別的寫字樓編製。因此,由二零零零年起的數字不能直接與較早前的數字相比。
The number and location of lettings may vary from month to month, consequently the averagerental statistics should be regarded as broad indicators of rental trends only.
Since 2000, average rents and rental indices for private office have been compiled inrespect of units graded according to revised grading criteria. Hence, the figures from 2000onwards are not strictly comparable to earlier figures.
88香港統計月刊 二零零三年六月 Hong Kong Monthly Digest of Statistics June 2003

5.13 送達市區及新界土地註冊處登記的文件數目和涉及的價值
Number and Considerations of Documents Received for Registration in theUrban and New Territories Land Registries
樓宇轉讓契約Assignments ofbuilding units
價值(百萬元) 年 月 數目 數目 ConsiderationYear Month No. No. ($ million)
2000 85 744 152 022 19,9212001 88 190 144 037 22,9642002 85 921 119 734 12,0142002 3 6 503 11 118 508
4 8 456 9 190 9155 8 470 8 932 7706 8 311 11 716 8367 6 166 12 660 1,9138 6 053 10 361 1,0739 7 178 7 977 3,256
10 6 807 10 301 70411 5 808 9 039 30312 6 111 8 046 267
2003 1 7 293 10 895 4992 4 622 9 283 1,1613 5 800 8 379 4254 6 382 8 748 1,1785 5 090 8 597 1,709
年 月Year Month
2000200120022002 3
456789
101112
2003 12345 7 119 7629 6 8 481 1,361
232
47 270 12,550
12,961 86 421 14,220
87 726
3 70 11 036 7,462
14,939
8136 804 914
8 7 9 097 1,7741 1 7 550
12,093
438 15,198
2,5736 264
184
230
82
19,043 88
17,264
21,052
5 701 8311
2 980
56 3,570 121 791 68,336 93 048 13,317
1 7 738 4,619
156
10 884 5,326
1,184
8 254
7 066 7945 38 8 064 6,588
12 405
146 263 802
13
2 1
3 26
120
數目 Consideration
7
($ million)
1,302
22,878 255
4,171 8 1208 622
2,357
1,162
226
legal charges
7 843
157 064 16,747
1,1129 347 11,299
數目 ConsiderationNo. ($ million)
building legal charges
13,474 74 436
建築按揭/抵押 Building mortgages/
14,290
12,97579
9,395
183 307 93,951
16,177
discharges/releases
68 409 176
Other mortgages/
1 128 10,363
25,587 117 84,835
857,518
11,292110 009137 656
1 396 20,476192,808 1 419222,520 4 006273,040
3 56416,719 243,524198,110185,399
價值(百萬元) 價值(百萬元) 價值(百萬元)Consideration 數目 Consideration Consideration
($ million)($ million) No. ($ million)數目
No.
地段買賣合約 Agreements for sale and purchase of land
Assignments of land 地段轉讓契約
977
199
樓宇按揭/抵押
257 13,54773 1,293
380 22,102
162
10,447
7,969
12,846
724
71 526
599
297
14,980 80 2,650 11,825
29413,978
13,439 95
264 265
價值(百萬元)
數目 Consideration
16,232
16,129 226
撤銷按揭/抵押 Receipts/
No. ($ million)
價值(百萬元)價值(百萬元)
No.
樓宇買賣合約
purchase of building unitsAgreements for sale and
20,341 103
15,768 108
8 278 1,2662 120 8 982 8,291
4 1,058 7 595
8,039
2,6959 932
14,638 72
7 110 898 1 12
6 883 871
3 31
462 16,927
6 544 813
10 294 2,072
227
13 194 1,2168 694
13 12 8 288 1,305
89香港統計月刊 二零零三年六月 Hong Kong Monthly Digest of Statistics June 2003
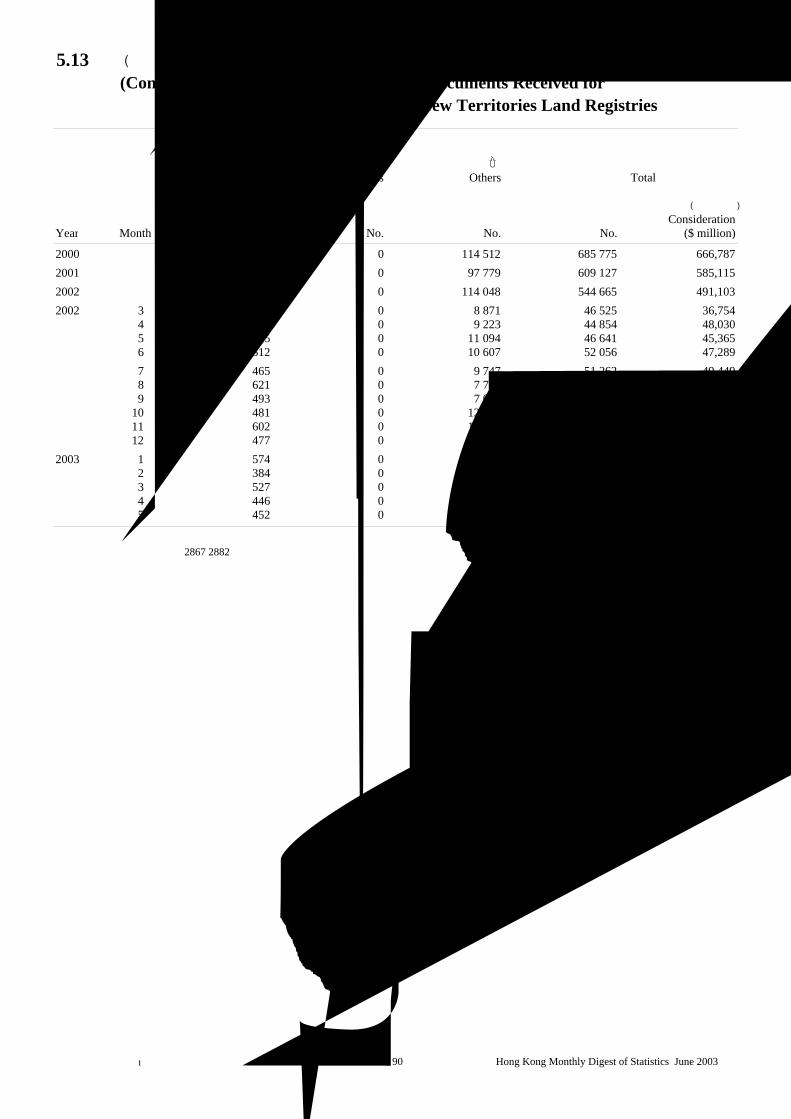
5.13 (續) 送達市區及新界土地註冊處登記的文件數目和涉及的價值
(Cont'd.) Number and Considerations of Documents Received forRegistration in the Urban and New Territories Land Registries
戰前樓宇租約 重建豁免管制令 其他 總計
Leases/tenancy Exclusion orders Others Totalagreements
價值(百萬元) 年 月 數目 數目 數目 數目 ConsiderationYear Month No. No. No. No. ($ million)
2000 7 047 0 114 512 685 775 666,7872001 6 948 0 97 779 609 127 585,1152002 5 959 0 114 048 544 665 491,1032002 3 422 0 8 871 46 525 36,754
4 447 0 9 223 44 854 48,0305 515 0 11 094 46 641 45,3656 512 0 10 607 52 056 47,2897 465 0 9 747 51 262 49,4498 621 0 7 793 43 786 33,9279 493 0 7 089 37 498 37,335
10 481 0 12 195 48 076 43,62611 602 0 10 073 40 159 31,98212 477 0 7 104 35 407 32,079
2003 1 574 0 8 931 45 397 35,0752 384 0 7 848 37 750 28,3103 527 0 8 396 37 666 31,0234 446 0 8 061 38 779 32,8095 452 0 8 297 38 316 28,898
資料來源: 土地註冊處 Source : Land Registry(查詢電話:2867 2882) (Enquiry Telephone No.: 2867 2882)
90香港統計月刊 二零零三年六月 Hong Kong Monthly Digest of Statistics June 2003
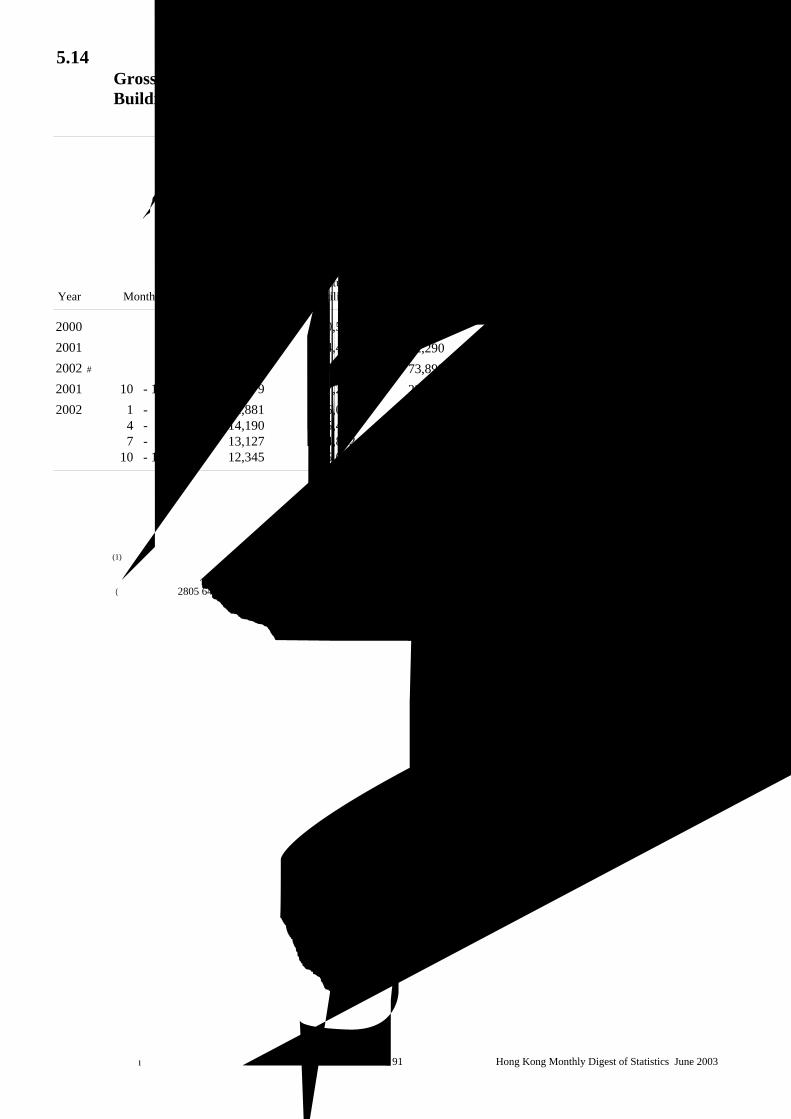
5.14 屋宇建造及土木工程機構單位所完成工程名義總值Gross Value of Construction Work, in Nominal Terms, Performed byBuilding and Civil Engineering Establishments
百萬元
$ million
主要承建商所完成工程名義總值 Gross value of construction work, in nominal terms, performed by main contractors
於建築地盤 於非地盤 總值 經季節性
At construction sites At locations Total 調整總值(1)
other than sites Seasonallyadjusted total(1)
其他建築物
及設施
年 月 樓宇 StructuresYear Month Buildings & facilities
2000 69,327 20,583 32,161 122,071 -2001 57,799 24,491 31,696 113,986 -2002 # 52,543 21,356 31,602 105,501 -2001 10 - 12 15,379 7,245 7,917 30,540 30,0382002 1 - 3 12,881 6,027 7,981 26,888 26,811
4 - 6 14,190 5,417 7,809 27,416 28,1017 - 9 13,127 4,832 7,780 25,740 26,276
10 - 12 # 12,345 5,080 8,032 25,457 24,394
註釋: 主要承建商所完成工程名義總值是指該等建築機構 Notes :作為主要承建商時所完成的工程總值,而不包括其
作為分判承建商時所完成的工程總值。
(1) 只適用於按季統計數字。 (1) Applicable to quarterly statistics only.
資料來源: 政府統計處屋宇建築、建造及地產業統計組 Source : Building, Construction and Real Estate Statistics Section,(查詢電話:2805 6426) Census and Statistics Department
(Enquiry Telephone No.: 2805 6426)
The gross value of construction work, in nominal terms,performed by main contractors refers to the construction outputof projects in which they take the role of main contractors, anddoes not include the construction output of projects in which theytake the role of subcontractors.
22,624
19,60717,960
Sub-total小計
89,910
73,89982,290
18,907
17,425
91香港統計月刊 二零零三年六月 Hong Kong Monthly Digest of Statistics June 2003

5.15 政府土地拍賣及批租
Disposals of Government Land
公開拍賣/投標
Public auction/tender
市區
Urban area
工業/貨倉 商業 商業/住宅
Industrial/godown Commercial Commercial/residential
已徵收的地價 已徵收的地價 已徵收的地價(百萬元) (百萬元) (百萬元)
Realised Realised Realised 年 面積(平方米) premium 面積(平方米) premium 面積(平方米) premiumYear Area (sq. m.) ($ million) Area (sq. m.) ($ million) Area (sq. m.) ($ million)
2000 5 480 128 0 0 0 02001 0 0 30 304 1,745 0 02002 # 0 0 0 0 675 832002 1 - 3 # 0 0 0 0 0 0
4 - 6 # 0 0 0 0 0 07 - 9 # 0 0 0 0 675 83
10 - 12 # 0 0 0 0 0 02003 1 - 3 # 0 0 0 0 0 0
公開拍賣/投標 --- 續Public auction/tender --- cont'd.
市區 --- 續
Urban area --- cont'd.住宅 其他用途 總計
Residential Other uses Total
已徵收的地價 已徵收的地價 已徵收的地價(百萬元) (百萬元) (百萬元)
Realised Realised Realised 年 面積(平方米) premium 面積(平方米) premium 面積(平方米) premiumYear Area (sq. m.) ($ million) Area (sq. m.) ($ million) Area (sq. m.) ($ million)
2000 129 233 12,589 7 110 128 141 823 12,8452001 9 169 280 0 0 39 473 2,0252002 # 32 575 2,910 0 0 33 250 32,5752002 1 - 3 # 0 0 0 0 0 0
4 - 6 # 30 270 2,620 0 0 30 270 2,6207 - 9 # 2 305 290 0 0 2 980 373
10 - 12 # 0 0 0 0 0 02003 1 - 3 # 0 0 0 0 0 0
月
Month
月
Month
92香港統計月刊 二零零三年六月 Hong Kong Monthly Digest of Statistics June 2003

5.15 (續) 政府土地拍賣及批租
(Cont'd.) Disposals of Government Land
公開拍賣/投標 --- 續Public auction/tender --- cont'd.
新界
New Territories
工業/貨倉 商業 商業/住宅
Industrial/godown Commercial Commercial/residential
已徵收的地價 已徵收的地價 已徵收的地價(百萬元) (百萬元) (百萬元)
Realised Realised Realised 年 面積(平方米) premium 面積(平方米) premium 面積(平方米) premiumYear Area (sq. m.) ($ million) Area (sq. m.) ($ million) Area (sq. m.) ($ million)
2000 0 0 0 0 0 02001 0 0 0 0 390 412002 # 0 0 0 0 0 02002 1 - 3 # 0 0 0 0 0 0
4 - 6 # 0 0 0 0 0 07 - 9 # 0 0 0 0 0 0
10 - 12 # 0 0 0 0 0 02003 1 - 3 # 0 0 0 0 0 0
公開拍賣/投標 --- 續Public auction/tender --- cont'd.
新界 --- 續
New Territories --- cont'd.
住宅 其他用途 總計
Residential Other uses Total
已徵收的地價 已徵收的地價 已徵收的地價(百萬元) (百萬元) (百萬元)
Realised Realised Realised 年 面積(平方米) premium 面積(平方米) premium 面積(平方米) premiumYear Area (sq. m.) ($ million) Area (sq. m.) ($ million) Area (sq. m.) ($ million)
2000 139 816 2,950 14 600 18 154 416 2,9682001 44 078 951 3 900 7 48 368 9992002 # 30 949 1,073 0 0 30 949 1,0732002 1 - 3 # 10 290 301 0 0 10 290 301
4 - 6 # 20 659 772 0 0 20 659 7727 - 9 # 0 0 0 0 0 0
10 - 12 # 0 0 0 0 0 02003 1 - 3 # 0 0 0 0 0 0
月
Month
月
Month
93香港統計月刊 二零零三年六月 Hong Kong Monthly Digest of Statistics June 2003

5.15 (續) 政府土地拍賣及批租
(Cont'd.) Disposals of Government Land
私人協約方式批地
Private treaty grant
公用事業/團體用途
工業/貨倉 住宅 Public utilities/ 其他用途 總計
Industrial/godown Residential institutional uses Other uses Total
年 面積(平方米) 面積(平方米) 面積(平方米) 面積(平方米)
Year Area (sq. m.) Area (sq. m.) Area (sq. m.) Area (sq. m.)
2000 120 839 184 073 328 2432001 # 83 103 0 87 2332002 # 229 822 0 243 0852002 1 - 3 # 210 500 ++ 0 210 500
4 - 6 # 0 0 7 2457 - 9 # 19 322 0 19 322
10 - 12 # 0 0 6 0182003 1 - 3 # 0 0 0
Private treaty grant --- cont'd.
公用事業/團體用途
工業/貨倉 住宅 Public utilities/ 其他用途 總計
Industrial/godown Residential institutional uses Other uses Total
年 面積(平方米) 面積(平方米) 面積(平方米) 面積(平方米)
Year Area (sq. m.) Area (sq. m.) Area (sq. m.) Area (sq. m.)
2000 387 290 1 161 532 3052001 496 894 0 751 9572002 # 598 623 0 605 0552002 1 - 3 # 137 619 ## 0 137 619
4 - 6 # 410 706 0 410 7067 - 9 # 17 964 0 17 964
10 - 12 # 0 32 334 0 38 7662003 1 - 3 # 0 0 1 670
註釋 : ++ Notes : ++
作租置其屋用途。 Scheme use.## ##
資料來源: 地政總署 Source :(查詢電話:2525 6694)
0 0
6 432
0 0 6 432 0
私人協約方式批地 --- 續
0
63 854
新界
0 6 018
80 000
7 245 0 0
面積(平方米)
0 0
New Territories
(Enquiry Telephone No.: 2525 6694)
6 413 with total area of 210 500 sq. m. for Tenant Purchase
Including the Private Treaty Grant of KCTL 489 and STTL531 with total area of 122 105 sq. m. for Tenant Purchase
Lands Department
包括以私人協約方式批出的葵涌市地段第 489 號及
0
市區
Urban area
Area (sq. m.)面積(平方米)
4 130 0 0 229 822
月
Month
23 331 0
Including the Private Treaty Grant of KTIL 754 and NKIL
0 0 0 0
0 1 670
其屋用途。 Scheme use.沙田市地段第 531 號共 122 105 平方米供作租置
月
Month
包括以私人協約方式批出的觀塘內地段第 754 號
及新九龍內地段第 6 413 號共 210 500 平方米供
255 043
Area (sq. m.)
94香港統計月刊 二零零三年六月 Hong Kong Monthly Digest of Statistics June 2003

香港統計月刊 二零零三年六月 Hong Kong Monthly Digest of Statistics June 200395
運輸、通訊、旅遊
Transport, Communications and Tourism
概念及方法 Concepts and Methods
以下的流動及交易統計數字包括香港特別行政
區與中國內地的相關數據:
(i) 進出香港的飛機、船隻、車輛、火車
及貨物;
(ii) 訪港旅客數字;
(iii) 本港居民離港人數;
(iv) 發出對外電訊通訊量;及
(v) 郵遞服務
Data on the following types of statistics include thecorresponding flows/transactions between the HongKong Special Administrative Region and themainland of China:(i) Inward and outward movements of aircraft,
vessels, motor vehicles, trains and cargoes;(ii) Visitor arrivals;(iii) Hong Kong resident departures;(iv) Outgoing external telecommunications services;
and(v) Postal service
在一九九三年以前,遠洋輪船是指在海事處的
船隻出入境手續辦事處辦理出入境申報的船
隻,而並非以船隻的貿易航線來劃分。自一九
九三年開始,遠洋輪船及內河船隻的定義已作
修訂,是根據所停靠港口是否已超越內河航
限。
Prior to 1993, ocean vessels referred to vesselsdeclaring entry and clearance at the Port FormalitiesOffice of the Marine Department, irrespective of theirtrade routes. Starting from 1993, ocean vessels andriver vessels have been redefined according towhether or not their ports of call are beyond the rivertrade limits.
表 6.2 內的統計數字不包括過境貨物。卸貨量
包括進口貨物及抵港的轉運貨物;而裝貨量則
包括出口(港產品出口及轉口)貨物及離港的
轉運貨物。
Statistics in Table 6.2 do not include transit cargo.Cargo discharged includes imports and inwardtranshipment, and cargo loaded includes exports(domestic exports and re-exports) and outwardtranshipment.
持牌小輪服務是根據渡輪服務條例(香港法例
第一○四章)發出牌照經營的任何渡輪服務。
A licensed ferry service is any ferry service operatedunder a licence granted under the Ferries Ordinance,Cap. 104.
一部車輛通常只要登記一次,由運輸署編配車
輛登記號碼(車牌),並將車輛予以適當分
類。發出車輛牌照,即給予車輛在道路上行駛
的權利。牌照有效期分一年及四個月兩種。
Motor vehicle registration, which is normally a one-off matter, means giving the vehicle a registrationmark and putting it into its appropriate class.Licensing, which is annually or four-monthly,conveys the right for a vehicle to be driven on a road.
車輛領牌及登記總數指期末數字,新登記指該
期間所登記的車輛數字。
Total vehicles licensed and registered figures refer toend of period position whereas new registrationfigures refer to registrations during the period.
交通意外的統計數字,並不包括只涉及損毀的
意外。
Statistics on traffic accidents exclude accidentsinvolving damages only.
抵港及離港旅客以及本港居民離港的統計數
字,只包括進出香港的出入境旅客及本港居
民。被拒入境者不包括在內。
Statistics on passenger arrivals and departures as wellas Hong Kong resident departures refer exclusively toinward and outward movements of passengers orHong Kong residents. Refused landing passengersare excluded.

香港統計月刊 二零零三年六月 Hong Kong Monthly Digest of Statistics June 200396
酒店使用情況及房間數目統計數字在取得酒店
業的最新情況資料後會不時作出修訂。
Statistics of hotels and number of rooms are revisedfrom time to time as information on latest situation ofthe hotel industry becomes available.
房間入住率是根據有回應香港旅遊發展局每月
進行的「酒店房間入住率統計調查」所提供的
資料計算。
Room occupancy rate is compiled based on datareported by those hotels and tourist guest houseswhich have responded to the Hong Kong TourismBoard's monthly 'Hotel Room Occupancy Survey'.
其他有關刊物 Further References
香港旅遊業統計回顧,香港旅遊發展局編製 A Statistical Review of Tourism, published by theHong Kong Tourism Board
運輸資料年報,運輸署編製 Annual Transport Digest, published by the TransportDepartment
香港酒店業務統計,香港旅遊發展局編製 Hong Kong Hotel Industry, published by the HongKong Tourism Board
香港船務統計(季刊) Hong Kong Shipping Statistics (Quarterly)酒店入住率報告,香港旅遊發展局編製 Hotel Room Occupancy Report, published by the
Hong Kong Tourism Board酒店供應情況,香港旅遊發展局編製 Hotel Supply Situation, published by the Hong Kong
Tourism Board交通運輸資料月報,運輸署編製 Monthly Traffic and Transport Digest, published by
the Transport Department倉庫、通訊、金融、保險及商用服務按年統計
調查報告Report on Annual Survey of Storage,
Communication, Financing, Insurance &Business Services
運輸及有關行業按年統計調查報告 Report on Annual Survey of Transport and RelatedServices
旅遊業收益統計,香港旅遊發展局編製 Tourism Receipts, published by the Hong KongTourism Board
訪港旅客統計,香港旅遊發展局編製 Visitor Arrival Statistics, published by the HongKong Tourism Board
訪港旅客分析報告,香港旅遊發展局編製 Visitor Profile Report, published by the Hong KongTourism Board

圖 6.1 空運貨物吞吐量Chart 6.1 Air Cargo Throughput
圖 6.2 港口貨櫃吞吐量Chart 6.2 Port's Container Throughput
0
40
80
120
160
200
240
280
4/01 7/01 10/01 1/02 4/02 7/02 10/02 01/03 04/03
千公噸'000 tonnes
0
400
800
1200
1600
2000
2400
2800
1992 1994 1996 1998 2000 2002
千公噸'000 tonnes
0.0
0.5
1.0
1.5
2.0
2/01 6/01 10/01 2/02 6/02 10/02 2/03
百萬個標準貨櫃單位Million TEUs
0
2
4
6
8
10
12
14
16
18
20
1992 1994 1996 1998 2000 2002
百萬個標準貨櫃單位Million TEUs
97香港統計月刊 二零零三年六月 Hong Kong Monthly Digest of Statistics June 2003

圖 6.3 訪港旅客人數Chart 6.3 Visitor Arrivals
0.0
0.2
0.4
0.6
0.8
1.0
1.2
1.4
1.6
1.8
2.0
4/01 7/01 10/01 1/02 4/02 7/02 10/02 1/03 4/03
百萬人次Million persons
0
2
4
6
8
10
12
14
16
18
1992 1994 1996 1998 2000 2002
百萬人次Million persons
98香港統計月刊 二零零三年六月 Hong Kong Monthly Digest of Statistics June 2003

6.1 進出香港的飛機、船隻、車輛及火車
Inward and Outward Movements of Aircraft, Vessels, Motor Vehicles and Trains
年 月 抵港
Year Month Arrivals
2000 90 953 90 9742001 98 423 98 4102002 103 357 103 3482002 2 7 687 7 682
3 8 340 8 3484 8 375 8 3695 8 509 8 5126 8 308 8 3027 8 803 8 8148 9 163 9 1629 8 796 8 799
10 9 361 9 34611 8 997 8 99912 9 097 9 090
2003 1 9 074 9 0732 8 315 8 3183 9 049 9 0594 6 037 # 6 038 # #
抵港
Arrivals
年 月 千淨註冊噸位 千淨註冊噸位
Year Month '000 N.R.T. '000 N.R.T.
2000 4 377 4 388 4 5762001 4 427 4 432 4 7612002 4 710 4 710 4 9902002 2 376 376 409
3 388 387 4024 380 380 4085 387 386 4156 371 371 3917 381 381 4268 395 395 4459 377 377 390
10 392 393 42411 393 393 43712 503 503 456
2003 1 498 515 4502 405 448 4453 N.A. N.A. N.A.4 N.A. N.A. N.A.
3.10 2.25 2.26 3.10 445 3.08 2.36 2.36 3.09 451
4 759 33.71
2.39 2.39 3.15
2.77
2.97
2.27 2.27
2.32
3.16
4 991
389 2.77
456
22 0632.88 22 919 2.83
2.34 2.34 3.03
22 238
離港 抵港
River passenger ferries to/from Macao
2.782.86 22 796
22 678
千淨註冊噸位
Departures
千船次
N.A.
2.7223 527
內河船隻(1)
River passenger ferries to/from Pearl River ports
River vessels(1)
23 25924 176 2.7322 91223 014 2.71
25 831 3.153.03 25 294 2.97 24 552
25 994
千船次
內河客輪往/來自珠江口岸
千淨註冊噸位
3.06
內河客輪往/來自澳門
離港
23 774
N.A.
千船次
18 147
'000 N.R.T.
N.A.N.A. N.A.12 075 N.A. N.A. N.A.18 108
Departures
飛機(班次) Aircraft (numbers)
遠洋輪船(1)
Ocean vessels(1)
離港Departures
總計Total
抵港 Arrivals
千船次千淨註冊噸位 千船次
離港Departures
千淨註冊噸位'000 N.R.T.'000 No.
241 419 37.15 37.35 275 211196 833
181 927
'000 No. '000 N.R.T.
243 256 37.68 36.93 272 015 34.91 288 331
'000 No. '000 No.
27 88416 688 3.43 28 362 3.37
'000 No.
24 194 2.99
26.98 34.26
2.38 2.37 2.31
26.95 26.16
2.31 27.87 27.87
26.09
千船次
Arrivals
16 633
18 187
206 705 35.62
18 707
16 744 3.19
2.83
2.88 2.7517 617
18 325
15 369 2.70
2.79
17 02116 610
17 595
2.93 409
295 285 2.6824 314
2.93 35.47
23 814
'000 N.R.T.
2.98 2.92 409
415 391
402
2.36 2.36 2.982.92
2.27 2.81 2.26
2.32
2.40 2.41 3.15 445
3.00
35.47
424
24 344 2.78
3.02
23 020
3.15 3.03
2.97
2.23 2.23 3.00 437 2.38 2.39 3.02
'000 No.
2.81
33.72 34.27
4 575
427
N.A. N.A. N.A. N.A. N.A.
17 996
3.04 24 525 3.06 24 0052.57 21 596 2.50 21 219
N.A.N.A. N.A. N.A. N.A.
99香港統計月刊 二零零三年六月 Hong Kong Monthly Digest of Statistics June 2003

6.1 (續) 進出香港的飛機、船隻、車輛及火車
(Cont'd.) Inward and Outward Movements of Aircraft, Vessels, Motor Vehiclesand Trains
內河船隻(1) --- 續 車輛(數量) River vessels(1) --- cont'd. Motor vehicles (numbers)
貨運車輛 River cargo vessels Goods vehicles
年 月 千船次 千淨註冊噸位 千船次 千淨註冊噸位 抵港 離港 總計
Year Month '000 No. '000 N.R.T. '000 No. '000 N.R.T. Arrivals Departures Total
2000 119.18 48 397 119.61 50 139 4 688 738 4 691 055 9 379 7932001 116.19 55 630 116.73 58 955 4 560 745 4 568 041 9 128 7862002 119.52 67 429 120.28 74 542 4 871 889 4 883 177 9 755 0662002 2 7.09 3 759 7.14 4 191 255 023 254 517 509 540
3 10.44 5 763 10.41 5 966 411 412 410 898 822 3104 10.25 5 619 10.37 6 054 407 211 409 833 817 0445 10.17 5 619 10.28 6 312 408 964 411 230 820 1946 10.16 5 568 10.15 6 264 414 307 412 735 827 0427 10.26 5 835 10.39 6 286 435 557 438 681 874 2388 10.50 5 966 10.53 6 965 455 786 454 588 910 3749 9.83 5 489 9.87 6 517 439 374 440 650 880 024
10 9.91 6 052 10.03 6 747 423 999 425 751 849 75011 10.38 6 122 10.39 6 837 421 611 420 334 841 94512 10.50 6 387 10.62 6 891 407 915 407 897 815 812
2003 1 10.66 6 515 10.78 7 115 424 233 422 020 846 2532 7.49 4 813 7.43 5 253 262 885 266 575 529 4603 N.A. N.A. N.A. N.A. 419 965 420 488 840 4534 N.A. N.A. N.A. N.A. 405 623 407 507 813 130
內河貨船
離港 Departures
抵港 Arrivals
100香港統計月刊 二零零三年六月 Hong Kong Monthly Digest of Statistics June 2003

6.1 (續) 進出香港的飛機、船隻、車輛及火車
(Cont'd.) Inward and Outward Movements of Aircraft, Vessels, Motor Vehiclesand Trains
車輛(數量) --- 續 火車
Motor vehicles (numbers) --- cont'd. Trains
年 抵港 離港 總計 抵港 離港 總計 抵港 離港 總計
Year Arrivals Departures Total Arrivals Departures Total Arrivals Departures Total
2000 922 076 924 331 1 846 407 21 694 7 386 29 080 2 925 2 925 5 8502001 1 094 716 1 093 911 2 188 627 17 960 6 513 24 473 3 001 3 001 6 0022002 1 324 894 1 320 447 2 645 341 19 144 7 945 27 089 3 080 3 080 6 1602002 2 88 172 88 084 176 256 1 032 411 1 443 239 239 478
3 109 428 109 190 218 618 1 635 670 2 305 258 258 5164 110 517 109 968 220 485 1 612 614 2 226 253 253 5065 108 009 107 877 215 886 1 683 669 2 352 262 262 5246 106 883 105 859 212 742 1 657 633 2 290 254 254 5087 113 138 113 254 226 392 1 848 846 2 694 261 261 5228 115 245 115 226 230 471 1 653 752 2 405 262 262 5249 111 268 110 075 221 343 1 750 765 2 515 253 253 506
10 116 109 116 432 232 541 1 529 650 2 179 261 261 52211 116 013 115 632 231 645 1 520 582 2 102 254 254 50812 123 281 123 294 246 575 1 658 726 2 384 262 262 524
2003 1 126 679 125 951 252 630 1 476 587 2 063 275 275 5502 104 169 105 616 209 785 1 167 477 1 644 249 249 4983 126 853 126 383 253 236 1 679 646 2 325 274 274 5484 114 238 112 215 226 453 1 597 652 2 249 267 267 534
註釋 : (1) 二零零三年的數據是初步數字。 Notes : (1) Figures for 2003 are preliminary.N.R.T. = Net Register Tonnage
資料來源: 民航處; Sources : Civil Aviation Department;入境事務處; Immigration Department;九廣鐵路公司; Kowloon-Canton Railway Corporation;海事處 Marine Department(如有查詢,請致電政府統計處。 (For enquiries, please call Census and Statistics Department.查詢電話:2582 4738) Enquiry Telephone No.: 2582 4738)
月Month
Cargo trains (no. of laden wagons) 客運火車(班次)
Passenger trains (numbers)客運車輛
Passenger vehicles 貨運火車(載有貨物車卡)
101香港統計月刊 二零零三年六月 Hong Kong Monthly Digest of Statistics June 2003

6.2 進出香港貨物
Inward and Outward Movements of Cargo千公噸
'000 Tonnes
年 卸下 裝上 總計 卸下 裝上 總計
Year Discharged Loaded Total Discharged Loaded Total
2000 953 1 288 2 241 88 003 42 934 130 9372001 894 1 180 2 074 88 506 42 170 130 676
2002 1 004 1 475 2 479 93 444 44 857 138 3012002 67 82 149 5 563 2 671 8 234
86 125 212 7 797 3 548 11 34581 116 197 8 155 3 741 11 89685 114 198 7 896 3 436 11 33287 118 205 8 445 3 697 12 14285 124 209 7 765 4 103 11 86883 124 208 8 390 4 006 12 39585 132 218 7 968 4 203 12 17191 158 249 8 113 3 976 12 08992 160 252 7 490 4 105 11 59589 126 215 8 482 3 985 12 467
2003 81 117 198 7 734 # 4 074 # 11 808 #
72 88 160 7 409 # 2 834 # 10 242 #
93 144 236 N.A. N.A. N.A.81 # 122 # 203 # N.A. N.A. N.A.
河運(1) 道路運輸
By road年 月 卸下 裝上 總計 卸下 裝上 總計
Year Discharged Loaded Total Discharged Loaded Total
2000 18 932 24 773 43 706 22 142 17 791 39 9332001 21 966 25 568 47 534 20 853 17 030 37 8822002 26 284 27 925 54 210 21 178 18 432 39 6102002 1 464 1 576 3 040 1 120 935 2 054
2 157 2 513 4 669 1 773 1 720 3 4932 195 2 567 4 763 1 780 1 699 3 4792 125 2 552 4 677 1 726 1 599 3 3262 213 2 249 4 462 1 783 1 579 3 3622 274 2 478 4 752 1 894 1 632 3 5272 325 2 204 4 528 2 052 1 634 3 6862 477 2 287 4 765 2 016 1 535 3 5512 256 2 188 4 444 1 869 1 499 3 3682 371 2 269 4 641 1 804 1 543 3 3472 392 2 771 5 164 1 654 1 541 3 195
2003 2 467 # 2 279 # 4 745 # 1 758 1 519 3 2771 746 # 2 264 # 4 010 # 965 1 102 2 067N.A. N.A. N.A. 1 667 1 656 3 323N.A. N.A. N.A. 1 638 1 574 3 211
2
1
1
9
7
2
5
Month
海運 (1)
Month
空運
By air By ocean(1)
月
3
1211
8
4
8
By river(1)
6
910
234
5
4
2
3
6
12
3
1110
7
4
102香港統計月刊 二零零三年六月 Hong Kong Monthly Digest of Statistics June 2003

6.2 (續) 進出香港貨物
(Cont'd.) Inward and Outward Movements of Cargo千公噸
'000 Tonnes
總計
Total年 卸下(2) 裝上 總計 卸下 裝上 總計
Year Discharged(2) Loaded Total Discharged Loaded Total
2000 318 133 451 86 919 217 2672001 273 97 370 86 045 218 5372002 283 102 385 92 791 234 9842002 13 5 19 5 269 13 496
26 6 32 7 913 19 75227 8 35 8 131 20 36926 6 32 7 706 19 56525 10 34 7 653 20 20526 12 37 8 349 20 39221 10 32 7 978 20 84925 8 33 8 166 20 73821 10 31 7 831 20 18123 8 31 8 086 19 86626 11 36 8 434 21 077
2003 19 9 28 # 7 998 # 20 057 #
16 7 23 # 6 294 # 16 503 #
27 10 37 N.A. N.A.23 10 33 N.A. N.A.
註釋 : (1) 海運是指越過內河航限操作的船隻運輸,而河運 Notes : (1)
是指僅於內河航限內操作的船隻運輸。
(2) 不包括家畜在內。 (2) Livestock excluded.
資料來源: 民航處; Sources : Civil Aviation Department; 香港海關; Customs and Excise Department; 九廣鐵路公司; Kowloon-Canton Railway Corporation; 政府統計處船隻及貨運統計組 Shipping and Cargo Statistics Section, (如有查詢,請致電政府統計處。 Census and Statistics Department 查詢電話:2582 4738) (For enquiries, please call
Census and Statistics Department. Enquiry Telephone No.: 2582 4738)
8 227
7
11 859
2
12 23811 839
5
34
12 043
3 N.A.
鐵路運輸
By rail月
Month
6 12 552
12 349
river trade limits.transport by vessels operating exclusively within thebeyond the river trade limits, while river refers toOcean refers to transport by vessels operating
130 349132 492142 193
11 11 780
112
8
10
12 8719 12 571
N.A.4
10 208
12 64412 059
2
103香港統計月刊 二零零三年六月 Hong Kong Monthly Digest of Statistics June 2003

6.3 按主要貨物裝卸地點劃分的貨櫃吞吐量
Container Throughput by Main Cargo Handling Location 千個標準貨櫃單位
Thousand TEUs 貨櫃碼頭
Container terminals
年 月 載貨貨櫃 空貨櫃 載貨貨櫃 空貨櫃
Year Month Laden Empty Laden Empty
2000 3 862 1 644 5 747 3492001 3 802 1 575 5 591 3172002 4 096 1 610 5 833 3532001 12 328 140 450 272002 1 312 104 436 23
2 254 102 349 183 358 88 452 314 356 101 488 305 347 105 457 286 347 124 504 287 347 146 529 308 349 167 539 289 360 212 569 30
10 343 154 520 3511 346 151 497 3212 377 157 491 40
2003 1 355 150 499 322 299 115 341 30
年 月 載貨貨櫃 空貨櫃 載貨貨櫃 空貨櫃
Year Month Laden Empty Laden Empty
2000 1 528 171 1 128 2052001 1 537 132 1 185 1562002 1 672 103 1 431 1202001 12 127 9 98 82002 1 147 8 104 8
2 94 11 77 63 136 7 105 104 150 6 108 105 137 9 107 136 147 11 119 127 149 8 145 118 155 6 128 109 133 11 130 10
10 147 7 130 1111 135 8 139 1012 142 11 138 8
2003 1 137 12 143 92 115 8 88 7
貨櫃碼頭以外Other than container terminals
海運Ocean
抵港 離港
Inward Outward
抵港 Inward
離港
Outward
104香港統計月刊 二零零三年六月 Hong Kong Monthly Digest of Statistics June 2003

6.3 (續) 按主要貨物裝卸地點劃分的貨櫃吞吐量
(Cont'd.) Container Throughput by Main Cargo Handling Location 千個標準貨櫃單位 Thousand TEUs
貨櫃碼頭以外Other than container terminals
河運 River
年 月 載貨貨櫃 空貨櫃 載貨貨櫃 空貨櫃
Year Month Laden Empty Laden Empty
2000 861 912 1 121 5682001 986 802 1 088 6552002 1 153 858 1 137 7792001 12 90 48 82 562002 1 80 55 91 57
2 69 63 60 453 85 68 96 594 94 77 108 755 96 71 102 676 99 71 92 587 101 76 98 708 99 71 93 709 119 84 97 72
10 107 77 95 6611 100 70 93 6612 104 74 110 73
2003 1 116 80 99 772 75 51 81 51
貨櫃總數
Total 年 月 載貨貨櫃 空貨櫃 載貨貨櫃 空貨櫃
Year Month Laden Empty Laden Empty
2000 6 252 2 727 7 996 1 122 18 0982001 6 325 2 508 7 864 1 129 17 8262002 6 921 2 571 8 400 1 252 19 1442001 12 544 197 630 91 1 4632002 1 539 167 630 89 1 425
2 418 175 486 69 1 1483 579 163 654 100 1 4964 600 184 704 115 1 6045 580 185 666 108 1 5396 593 206 716 98 1 6127 597 230 773 112 1 7118 603 244 760 108 1 7159 612 307 797 112 1 827
10 597 239 746 112 1 69411 580 229 730 108 1 64812 624 243 739 121 1 727
2003 1 608 242 742 117 1 7092 489 175 510 87 1 261
註譯: 標準貨櫃單位是廿呎x八呎x八呎的標準貨櫃 Note :為根據。
資料來源: 海事處 Source :(查詢電話:2873 8371)
抵港
Inward 離港
Outward
Marine Department(Enquiry Telephone No.: 2873 8371)
總吞吐量
Total throughput
TEU refers to Twenty-Foot Equivalent Units (based on astandardised container size of 20 ft. x 8 ft. x 8 ft. ).
離港
Outward 抵港
Inward
105香港統計月刊 二零零三年六月 Hong Kong Monthly Digest of Statistics June 2003

6.4 公共交通 : 按營辦商劃分的乘客人數
Public Transport : Passenger Journeys by Operator千次
Thousands九廣鐵路
新 Mass Transit Railway Kowloon-Canton Railway 大嶼山 龍運 機場
九巴 巴士 巴士 快線 香港
Kowloon New Long 本地線(1) Airport 東鐵 電車
年 月 Motor Lantao 城巴 Win Local Express East HongkongYear Month Bus Bus Citybus Bus Line(1) Line Rail Tramways
2000 1 089 176 5 507 213 310 17 251 767 416 10 349 289 3372001 1 111 171 6 827 216 480 18 999 758 421 9 022 292 7032002 1 134 354 8 960 220 375 20 311 777 210 8 457 296 4372002 97 593 630 18 531 1 581 65 680 692 25 063
87 695 749 16 686 1 555 57 330 653 23 003 97 666 739 18 600 1 681 64 327 736 25 553 94 860 713 18 130 1 636 60 612 713 24 377 97 740 745 18 628 1 691 63 051 669 24 328 93 044 668 17 822 1 660 60 378 651 23 315 95 745 788 18 655 1 841 64 929 730 24 776 94 402 849 18 839 1 871 67 364 752 25 471 91 406 712 18 119 1 667 66 467 684 24 076 95 349 814 19 096 1 756 68 627 739 25 338 93 866 768 18 567 1 655 67 767 680 25 208 94 987 785 18 703 1 716 70 678 757 25 929
2003 95 820 725 18 790 1 654 70 090 715 25 542 85 343 870 16 628 1 600 59 500 612 22 692 90 760 716 17 722 1 628 63 882 611 23 532
持牌
山頂 專線 天星 小輪
纜車 小巴 小輪 Licensed 年 月 Peak Green Residents' Star Ferry 的士(4) 總計
Year Month Tramways Minibus Services Ferry Services Taxi(4) Total
2000 3 476 386 333 48 622 28 579 13 407 478 325 3 973 1472001 3 504 402 204 55 995 28 462 12 436 476 892 4 020 5462002 3 714 414 453 # 58 897 # 28 677 11 428 476 906 4 082 665 #
2002 267 34 883 # 4 808 # 2 440 1 008 40 539 347 537 # 307 31 304 # 4 246 # 2 193 899 36 637 311 219 # 256 34 947 # 4 705 # 2 440 1 052 40 643 346 813 # 292 34 162 # 4 683 # 2 405 978 39 308 334 709 # 298 35 595 # 4 840 # 2 333 1 021 40 562 345 282 # 251 34 580 # 4 852 # 2 153 908 39 265 330 820 #
318 36 553 # 5 021 # 2 388 917 40 476 345 948 # 405 30 309 # 5 076 # 2 473 871 40 375 340 853 # 277 34 494 # 4 982 # 2 174 886 39 075 335 702 # 342 35 955 # 5 224 # 2 468 971 40 395 349 546 # 335 35 202 # 5 121 # 2 428 960 39 129 342 787 # 364 36 467 # 5 339 # 2 781 957 40 502 351 449 #
2003 309 36 668 # 5 314 # 2 419 976 40 545 351 520 # 332 32 754 # 4 744 # 2 234 921 36 607 310 450 # 240 34 954 # 5 026 # 2 309 1 023 40 530 332 500 #
註釋 : (1) Notes : (1)
(2) (2)
(3) (3)(4) (4)
資料來源: Source :
14 885
3 - 1 163 15 096
3 1 973 6 4262 14 105 8 234
6 94215 198 8 954 2 215
2 - 1 169 13 705
1 263
15 793 1 263 15 926
14 1741 288 15 772
21
-
---
-
----
----
12
1011
1 27165
1 156
89
7
-- 1 272
34
7 328 2 254
9 391
9 462 10 081 7 477
9 506 2 160 6 909
2 305
1 774 6 916 7 672 1 989
7 703
2 125 7 099
2 145 2 134
9
13 619
185 029
2 258 2 190
Services(3)
9 695 2 204
9 400 9 687
地下鐵路
87 439
輕鐵
接駁巴士
118 104
輕鐵
Light
86 106 15 510 20 106
7
小輪(2)
1112 15 951
新世界油地
1 16 076
3
6
45
9 8332
194 489
16 8081 195 450
116 610
9 986
新巴
WorldNew
186 521
FirstBus
25 535 87 123
TransitRail
114 465
Light Rail
Feeder Bus
MTR Local Line includes Kwun Tong Line, Tsuen Wan Line, Island Line, TungChung Line and Tseung Kwan O Line. Tseung Kwan O Line was introduced on18.8.2002.
渡輪(3)
15 292
194 254
16 136
New World
201 662
1 215
(Enquiry Telephone No: 3150 8212)
The ferry service licences of the Hongkong and Yaumati Ferry Co.Ltd. weretransferred to the New World First Ferry Services Ltd. starting from 15.1.2000.Starting from February 2000, the passenger journeys do not include estimatednumber of passenger journeys in vehicles carried by the vehicular ferry services.The New World First Ferry Services Ltd. was introduced on 15.1.2000.Estimated figure is based on the Taxi Surveys, having regard to the number oftaxis licensed and the number of days in the months.
Transport Department
居民巴士
Yaumati
16 72716 34316 884
15 081
10
8 17 007
15 814
1 300
1 222 14 942
1 1461 259 15 462
15 116
7 238 2 252
7 491
14 534
小巴
7 428
第一
(查詢電話:3150 8212)
地鐵本地線包括觀塘線、荃灣線、港島線、東涌線及將軍澳線。將軍澳線在二零零二年八月十八日開辦。
香港油地小輪船有限公司的渡輪服務牌照由二零零零年一月十五日起轉交新世界第一渡輪服務有限公司。由二零零零年二月起,乘客人次不包括汽車渡輪所運載汽車內的估計乘客人次。
新世界第一渡輪服務有限公司在二零零零年一月十五日開辦。
估計數字是按的士業務統計調查的資料、該月領有牌照的的士數目和該月份的日數計算。
9 85815 904 9 544
運輸署
Hongkong
MinibusRedFirst Ferry
紅色
and
16 251
15 607
8 751
7 280
7 160 2 002 8 9586 913
16 582
16 307
1 1 166 15 279
Ferry(2)
535
1 230
15 300
15 300
106香港統計月刊 二零零三年六月 Hong Kong Monthly Digest of Statistics June 2003

6.5 領牌及新登記車輛數字
Motor Vehicles Licensed and Newly Registered
電單車(1) 私家車 的士
Motor cycles(1) Private cars Taxis 市區 新界 大嶼山
Urban New Territories Lantau
領牌 新登記 領牌 新登記 領牌 新登記 領牌 新登記 領牌 新登記
總數 New 總數 New 總數 New 總數 New 總數 New 年 月 Total regis- Total regis- Total regis- Total regis- Total regis-Year Month licensed tration licensed tration licensed tration licensed tration licensed tration
2000 25 500 3 582 332 379 34 630 15 157 3 474 2 776 536 50 1
2001 27 116 4 314 340 568 34 943 15 193 8 371 2 802 1 520 50 26
2002 28 350 4 387 340 855 29 657 15 189 2 264 2 801 385 50 12
2002 2 27 005 287 341 090 2 649 15 198 159 2 817 41 50 13 26 968 357 339 968 2 239 15 218 306 2 821 49 50 04 27 244 443 340 908 2 749 15 182 190 2 811 33 50 15 27 297 422 340 852 2 693 15 184 192 2 805 26 50 46 27 397 371 340 801 2 282 15 198 193 2 806 39 50 1
7 27 557 437 340 840 2 438 15 111 224 2 791 32 50 08 27 698 440 341 053 2 912 15 125 219 2 789 32 50 09 27 851 351 340 422 2 603 15 115 163 2 790 24 50 1
10 28 052 390 340 805 2 351 15 127 191 2 802 33 50 111 28 239 306 340 678 2 064 15 135 141 2 804 25 49 112 28 350 296 340 855 2 028 15 189 127 2 801 10 50 1
2003 1 28 565 380 341 912 2 480 15 173 99 2 804 27 50 02 28 712 290 341 676 2 070 15 172 89 2 804 20 50 03 28 726 304 340 120 1 544 15 183 158 2 795 12 50 04 28 790 278 339 248 1 330 15 178 123 2 780 6 50 7
公共巴士
Public buses
領牌 新登記 領牌 新登記 領牌 新登記 領牌 新登記 領牌 新登記
總數 New 總數 New 總數 New 總數 New 總數 New 年 月 Total regis- Total regis- Total regis- Total regis- Total regis-Year Month licensed tration licensed tration licensed tration licensed tration licensed tration
2000 730 73 4 238 314 960 21 84 5 159 1
2001 757 48 4 371 311 957 8 75 6 160 0
2002 769 * 37 4 430 238 956 0 78 3 145 0
2002 2 757 7 4 401 1 957 0 76 0 160 03 753 0 4 421 26 957 0 75 0 160 04 759 0 4 433 22 957 0 76 0 160 05 766 0 4 440 27 956 0 76 0 160 06 762 1 4 429 8 957 0 75 0 160 0
7 769 4 4 427 33 957 0 75 0 160 08 769 10 4 438 40 957 0 76 3 160 09 769 2 4 428 25 955 0 78 0 160 0
10 769 3 4 420 17 957 0 78 0 160 011 769 3 4 406 13 956 0 78 0 160 012 769 0 4 430 25 956 0 78 0 145 0
2003 1 769 0 4 432 24 957 0 79 1 145 02 769 0 4 414 0 953 0 78 0 145 03 769 0 4 411 12 952 0 80 2 145 04 769 0 4 382 9 954 0 82 6 145 0
New World First Bus Motor Bus
九巴 新巴 龍運巴士 Long Win Bus
Bus Motor Bus New Lantao Citybus(2) Kowloon
新大嶼山巴士 城巴(2)
107香港統計月刊 二零零三年六月 Hong Kong Monthly Digest of Statistics June 2003

6.5 (續) 領牌及新登記車輛數字
(Cont'd.) Motor Vehicles Licensed and Newly Registered
領牌 新登記 領牌 新登記 領牌 新登記 領牌 新登記
總數 New 總數 New 總數 New 總數 New 年 月 Total regis- Total regis- Total regis- Total regis-Year Month licensed tration licensed tration licensed tration licensed tration
2000 5 918 529 434 38 4 340 156 2 051 104
2001 6 244 684 469 65 4 340 180 2 012 89
2002 6 579 509 479 43 4 343 338 1 983 83
2002 2 6 266 27 476 4 4 341 13 2 012 23 6 282 42 473 5 4 338 14 2 004 64 6 309 59 471 3 4 334 40 2 010 95 6 332 55 470 3 4 334 44 2 010 86 6 341 27 473 3 4 342 32 2 012 5
7 6 347 36 471 2 4 344 20 1 995 98 6 439 126 472 8 4 344 25 1 987 129 6 461 32 478 5 4 345 30 1 985 6
10 6 492 27 480 2 4 340 50 1 978 711 6 542 28 479 3 4 343 39 1 979 1112 6 579 23 479 1 4 343 18 1 983 6
2003 1 6 595 17 478 1 4 347 23 1 987 82 6 604 22 475 0 4 329 29 1 984 33 6 620 22 476 6 4 332 64 1 980 34 6 601 30 473 1 4 345 42 1 970 3
貨車
Goods vehicles
領牌 新登記 領牌 新登記 領牌 新登記 領牌 新登記
總數 New 總數 New 總數 New 總數 New 年 月 Total regis- Total regis- Total regis- Total regis-Year Month licensed tration licensed tration licensed tration licensed tration
2000 72 429 5 232 38 945 2 674 2 903 239 487 81
2001 70 891 4 498 38 513 1 698 3 181 283 550 97
2002 69 132 2 581 38 565 989 3 328 90 696 70
2002 2 70 585 193 38 321 26 3 198 0 561 03 70 310 298 38 165 132 3 195 18 563 14 70 438 303 38 321 202 3 232 29 559 15 70 197 291 38 405 198 3 249 20 587 316 70 053 151 38 458 56 3 267 0 599 1
7 69 926 240 38 426 39 3 284 0 618 48 69 802 309 38 480 183 3 306 21 631 179 69 614 202 38 498 35 3 317 1 641 5
10 69 533 144 38 561 47 3 325 1 656 411 69 367 152 38 623 28 3 338 0 683 212 69 132 105 38 565 17 3 328 0 696 4
2003 1 68 956 98 38 491 14 3 329 0 718 102 68 934 152 38 552 44 3 351 0 724 13 68 797 79 38 531 34 3 358 1 733 14 68 552 111 38 522 34 3 361 1 745 2
重型貨車 Heavy
goods vehicles
特別用途車輛
Special purpose vehicles 輕型貨車
Light goods vehicles
中型貨車
Medium goods vehicles
light buses
私家小型巴士
Private light buses
私家巴士
Private buses 公共小型巴士
Public 其他
Others
Public buses 公共巴士
108香港統計月刊 二零零三年六月 Hong Kong Monthly Digest of Statistics June 2003

6.5 (續) 領牌及新登記車輛數字
(Cont'd.) Motor Vehicles Licensed and Newly Registered
政府車輛 (不包括軍用車輛) 總計 已登記總數
Government vehicles Grand total Total registered (excluding military vehicles)
電單車 其他車輛
Motor cycles Other vehicles領牌 新登記 領牌 新登記 領牌 新登記
總數 New 總數 New 總數 New 所有車輛 私家車
年 月 Total regis- Total regis- Total regis- All PrivateYear Month licensed tration licensed tration licensed tration vehicles cars
2000 1 201 158 6 041 598 516 782 52 446 582 141 374 013
2001 1 240 335 5 887 420 525 376 57 896 589 808 381 757
2002 1 243 204 5 580 739 525 551 * 42 592 593 551 384 864
2002 2 1 247 9 5 925 94 525 443 3 513 590 492 382 4513 1 224 8 5 802 56 523 747 3 557 590 055 382 2044 1 248 89 5 677 60 525 179 4 233 590 850 382 8245 1 231 68 5 682 106 525 083 4 188 591 584 383 3566 1 232 11 5 699 85 525 111 3 266 592 003 383 665
7 1 224 9 5 695 61 525 067 3 588 592 360 383 8868 1 221 0 5 667 17 525 464 4 374 593 001 384 2569 1 217 0 5 651 27 524 825 3 512 592 975 384 204
10 1 246 1 5 631 54 525 462 3 323 593 611 384 69011 1 243 0 5 632 71 525 503 2 887 593 953 384 93512 1 243 0 5 580 14 525 551 2 675 593 551 384 864
2003 1 1 244 4 5 578 19 526 609 3 205 594 163 385 4712 1 245 1 5 590 81 526 561 2 802 594 124 385 5043 1 239 0 5 548 75 524 845 2 317 594 124 385 5044 1 235 1 5 585 82 523 767 2 066 592 515 384 125
註釋: (1) 包括機動三輪車。 Notes : (1) Including motor tricycles.(2) 包括城巴(二)公司的公共巴士。 (2) Including public bus of Citybus (2) Company.
資料來源: 運輸署 Source : Transport Department(查詢電話:3150 8212) (Enquiry Telephone No.: 3150 8212)
109香港統計月刊 二零零三年六月 Hong Kong Monthly Digest of Statistics June 2003

6.6 隧道汽車流量、青嶼幹線汽車流量及汽車渡輪服務
Vehicular Traffic Through Tunnels, Lantau Link and Vehicular Ferry Services千次
Thousands 海底隧道
年 月
Year Month
2000 30 537 9 262 44 051
2001 30 569 9 069 43 962
2002 30 076 9 250 43 803
2002 1 2 541 801 3 7152 2 387 613 3 3393 2 602 782 3 7664 2 510 770 3 6435 2 540 787 3 7106 2 445 756 3 558
7 2 491 803 3 6718 2 495 814 3 6879 2 436 763 3 559
10 2 562 790 3 72811 2 488 786 3 66712 2 579 785 3 761
2003 1 2 604 799 3 7892 2 367 617 3 3353 2 537 794 3 722
東區海底隧道 西區海底隧道
Eastern Harbour Crossing Western Harbour Crossing貨車 貨車
私家車、的士 巴士及 及其他 私家車、的士 及其他
及電單車 小型巴士 Goods 及電單車 Goods 年 月 Private cars, taxis Buses and vehicles 總計 Private cars, taxis vehicles 總計
Year Month and motor cycles light buses and others Total and motor cycles and others Total
2000 19 252 1 588 5 592 26 433 11 548 1 863 15 663
2001 20 017 1 621 5 590 27 227 10 548 1 692 14 491
2002 19 777 1 574 5 439 26 790 10 564 1 681 14 614
2002 1 1 693 137 467 2 296 900 148 1 2442 1 552 121 341 2 014 763 111 1 0463 1 688 137 453 2 278 905 141 1 2424 1 639 131 454 2 225 875 136 1 1995 1 691 139 468 2 299 891 143 1 2296 1 616 133 445 2 194 857 139 1 187
7 1 655 138 484 2 276 892 149 1 2448 1 652 133 484 2 269 895 149 1 2499 1 606 124 452 2 182 863 140 1 202
10 1 661 130 462 2 252 906 141 1 25511 1 647 128 466 2 241 903 143 1 25412 1 675 126 463 2 264 914 140 1 264
2003 1 1 688 127 462 2 276 901 141 1 2532 1 479 112 325 1 917 699 93 9753 1 650 126 442 2 219 798 124 1 127
210
183
351
190
2 254
Buses and
195
208
198 205
巴士及
204
小型巴士
2 252
189
397
391
393
385
195
197
2 369
172
light buses
4 251
376
4 324
360
私家車、的士
及電單車
巴士及
Private cars, taxisand motor cycles
Buses andlight buses
210
207
Cross Harbour Tunnel
總計
Total
貨車
及其他
Goods vehiclesand others
小型巴士
205
4 477
373339382364383357
377378
110香港統計月刊 二零零三年六月 Hong Kong Monthly Digest of Statistics June 2003

6.6 隧道汽車流量、青嶼幹線汽車流量及汽車渡輪服務Vehicular Traffic Through Tunnels, Lantau Link andVehicular Ferry Services
千次
Thousands
獅子山隧道 香港仔隧道 城門隧道 將軍澳隧道 大老山隧道
年 Lion Rock Aberdeen Shing Mun Tseung Kwan O Tate's CairnYear Tunnel Tunnel Tunnel Tunnel Tunnel
2000 33 710 21 163 19 835 25 031 23 158
2001 33 169 21 373 19 635 26 353 23 367
2002 32 773 21 279 19 914 25 253 22 899
2002 2 816 1 811 1 678 2 283 1 9572 544 1 612 1 469 2 031 1 7792 827 1 810 1 694 2 216 1 9572 707 1 753 1 656 2 128 1 8952 797 1 820 1 697 2 210 1 9442 675 1 749 1 626 2 151 1 861
2 714 1 767 1 702 2 232 1 9202 719 1 804 1 720 2 123 1 9222 668 1 752 1 658 1 923 1 8942 745 1 818 1 673 1 975 1 9182 738 1 783 1 656 1 959 1 9022 823 1 801 1 684 2 022 1 951
2003 2 864 1 807 1 714 2 043 1 9712 464 1 588 1 425 1 772 1 6852 728 1 764 1 654 2 011 1 885
香港油地小輪
愉景灣隧道及 汽車渡輪服務
機場隧道 大欖隧道 連接道路(1) Hongkong and 年 Airport Tai Lam 青嶼幹線 Discovery Bay Yaumati FerryYear Tunnel Tunnel Lantau Link Tunnel Link(1) vehicular services
2000 21 985 16 528 13 853 96 24
2001 21 893 15 988 13 878 194 25
2002 21 697 16 226 15 030 223 27
2002 1 873 1 345 1 174 18 21 607 1 171 1 085 15 21 873 1 364 1 258 18 21 827 1 320 1 234 17 21 829 1 369 1 222 17 21 784 1 329 1 207 17 2
1 836 1 388 1 298 18 21 853 1 424 1 315 18 21 760 1 371 1 244 22 21 817 1 379 1 337 21 21 805 1 373 1 305 21 21 832 1 393 1 350 21 2
2003 1 813 1 426 1 336 21 21 535 1 156 1 131 17 21 809 1 356 1 270 20 2
註釋: (1) 愉景灣隧道及連接道路於二零零零年五月 Note : (1)
二十七日通車。
資料來源: 運輸署 Source :(查詢電話:3150 8212)
2
12
10
12
11
9
6
7
6
11
4
21
(Enquiry Telephone No.: 3150 8212)
Month月
Discovery Bay Tunnel Link was opened to traffic on 27.5.2000.
Transport Department
8
5
3
123
10
(續)(Cont'd.)
月
Month
9
1
7
4
3
1
8
23
5
111香港統計月刊 二零零三年六月 Hong Kong Monthly Digest of Statistics June 2003

6.7 交通意外及傷亡
Traffic Accidents and Casualties
意外
Accidents
年 輕微
Year Slight
2000 3 1552001 3 3102002 3 1272002 205
347234256258 243238270294257257
2003 283255242198
九龍 總計
Total 年 致命
Year Fatal
2000 68 1 0612001 70 1 1812002 55 1 0682002 4 85
4 98 3 91 2 82 5 75 5 77 5 93 8 85 6 106 3 105 4 78
2003 12 93 8 86 5 101 3 42
註釋 : 二零零三年的數字乃臨時數字,會經常修訂。 Note : Figures for 2003 are provisional, and are revised from time to time.
資料來源: Source : Hong Kong Police Force(Enquiry Telephone No.: 2186 1286)
453 1 342
2
2 406 5 91
234 392
1 8581 597
14015 122
7 131 694 554
114
7
1 7221 578
632 496
1 6182 024
259 523 536
1 518 6
92 78
3 044 6 037 6 495 15 576 24 688
1 245 3 60
2 60
01 367
12 532 11 137
8
8
6 573
月
Month
1
9
輕微
Serious嚴重
Slight
12 249 501 495
580
67614 94915 631
32 25 739
(查詢電話:2186 1286)
43
56
香港警務處
7
640
538
516
新界
Island Kowloon TotalTerritories總計
傷亡
Casualties港島
Hong Kong Island嚴重
Fatal Serious致命New九龍
6 2015 905 5 988
6 259
港島
Hong Kong
3 0563 171
月
Month
6
4
23
5
1
31 251
1 3051 368
37
新界
SlightSerious致命
Fatal
953 1 33
406
1 447
20 3186 5466 745
456
10 58 260
輕微 New Territories
嚴重
1 318 4 601 032
19 429
Kowloon
傷亡 --- 續
20 6001 597
6 402 71
511 4 141
514
1 418
7
1 422
Casualties --- cont'd.
1 670
11
9
532
517
185
488 508
7 269
146
6
4
10 651 9 149
148
1 684 675
1 736
1 9431 633
6011 775
682
133
678 574
6 607
543558
11
6
531 747
261 581
8 106
487 504
12
247
42 1 66 2 65
11 285
589 258 521
230 478 248 511
577546
53 257 461 593 1 311 1 51 266 535 566
57 299 503 550 250 496 534
209 439 421
4
1 069 1 50
1 243 3 49
1 352 1 621 280
3 523 11 117 552 1 603
3
4 376 3 68 430 1 154
2
4 198 350 405
112香港統計月刊 二零零三年六月 Hong Kong Monthly Digest of Statistics June 2003

6.8 按出入境管制站劃分的抵港人數
Passenger Arrivals by Control Point
機場 港口管制(1) 中國客運碼頭(1) 內河碼頭
Airport Harbour China Ferry River TradeControl(1) Terminal(1) Terminal
年 所有地方 所有地方 直升機 所有地方 所有地方
Year Month All places All places Helicopters All places All places
2000 11 565 696 284 799 42 414 3 943 757 273
2001 11 532 568 351 047 49 116 4 543 371 331
2002 11 841 203 356 588 44 765 4 689 739 411
2002 959 303 38 154 3 347 381 787 471 038 646 28 475 3 949 430 566 39
942 874 30 115 3 814 365 858 37 890 322 29 008 3 411 331 616 84
1 020 933 32 960 3 776 416 305 171 120 933 32 300 3 787 485 633 19
892 713 25 827 2 973 356 901 161 060 954 28 022 4 434 401 023 31
974 803 25 659 4 073 371 590 291 084 066 24 675 3 696 423 389 31
2003 889 369 22 208 4 249 350 614 311 019 169 24 869 3 524 429 883 35
801 764 28 275 3 146 310 441 52 278 757 18 121 1 867 165 217 13 211 328 20 707 2 661 167 757 27
文錦渡 沙頭角
紅磡車站 羅湖車站 管制站 管制站
年 Hung Hom Lo Wu Man Kam To Sha Tau Kok 總計
Year Station Control Point Control Point Control Point Total
2000 955 045 43 840 290 478 138 600 912 72 034 542
2001 1 040 895 45 399 877 511 243 623 688 74 869 468
2002 1 157 877 48 520 465 544 541 787 581 81 122 205
2002 89 402 4 001 367 42 390 55 211 6 621 786 110 578 4 186 482 52 558 75 227 7 075 390
86 423 3 924 746 43 563 61 556 6 492 676 80 152 3 814 327 40 355 61 271 6 253 190
97 656 4 252 260 48 421 67 876 7 119 549 112 769 4 440 388 52 157 73 624 7 594 542
93 090 3 890 770 40 648 68 279 6 433 729 109 929 4 138 944 44 231 77 399 7 002 555
94 239 4 055 418 40 651 70 925 6 766 193 103 464 4 308 122 55 538 79 072 7 305 437
2003 101 420 3 989 269 59 194 70 634 6 604 300 95 618 3 742 316 66 332 70 439 6 758 628 79 989 3 707 982 61 297 69 828 6 316 860 41 906 2 634 558 44 254 54 362 4 143 283 38 635 2 827 678 45 899 50 965 4 336 505
註釋: 數字不包括被拒入境者及司機。 Notes : Figures exclude refused landing passengers and drivers.(1) 包括以公海為目的地的郵船旅客。 (1) Including passengers by cruises to high seas.
資料來源: 入境事務處 Source : Immigration Department(查詢電話: 2829 3407) (Enquiry Telephone No: 2829 3407)
364 692 451 146
Control PointLok Ma Chau
管制站
262 416
落馬洲
625 623
715 9834
10
5 173 376
5 981 786
8 222 853
739 757
642 4025
682 849
6
12
9
1 368 473
379 663
373 0041011
397 831
出入境管制站
Control point
港澳碼頭
Macao Ferry Terminal
月 輪船
Ferry
5 149 842
3
4 956 182
419 858 432 887 391 288
494 727
4 835 546
45
出入境管制站 --- 續
Control point --- cont'd.
7
377 021
427 086
6
459 5558
7 719 790
9 778 205
755 802
23
12 796 298
4
234
11
Month月
1
8
5 269 173
5 701 675
3 630 920
748 839 855 297 889 394 641 812
113香港統計月刊 二零零三年六月 Hong Kong Monthly Digest of Statistics June 2003

6.9 按出入境管制站劃分的離港人數
Passenger Departures by Control Point
機場 港口管制(1) 中國客運碼頭(1) 內河碼頭
Airport Harbour China Ferry River TradeControl(1) Terminal(1) Terminal
年 所有地方 所有地方 直升機 所有地方 所有地方
Year All places All places Helicopters All places All places
2000 11 458 347 269 583 51 447 4 454 909 138
2001 11 488 076 316 718 58 006 5 092 231 210
2002 11 721 759 318 912 55 100 5 492 999 130
2002 1 054 108 29 771 4 237 490 241 18 954 619 26 893 4 867 469 168 15 933 390 28 684 4 674 436 215 20 911 404 26 980 4 194 406 356 10
1 039 561 32 445 4 413 473 557 191 053 084 31 409 4 698 558 656 6
933 030 25 191 3 771 409 284 51 000 587 26 289 5 302 454 010 5
949 705 24 079 4 873 463 285 81 060 335 23 108 4 549 505 356 2
2003 1 032 311 20 431 5 079 437 662 4 843 425 24 256 4 508 460 643 4 853 172 26 624 4 148 391 155 11 332 125 17 487 2 364 206 396 1 214 326 21 180 3 401 185 063 5
文錦渡 沙頭角
紅磡車站 羅湖車站 管制站 管制站
年 Hung Hom Lo Wu Man Kam To Sha Tau Kok 總計
Year Station Control Point Control Point Control Point Total
2000 1 064 070 42 632 073 539 007 642 456 71 937 978
2001 1 148 562 44 105 563 559 511 691 668 74 806 158
2002 1 205 019 47 194 060 596 284 909 702 81 038 955
2002 104 170 4 134 705 49 739 65 116 7 100 969 107 274 3 809 216 49 983 76 817 6 599 147
92 827 3 799 704 46 239 69 721 6 489 991 90 598 3 855 687 47 491 73 969 6 494 381
104 693 4 082 674 51 218 78 107 7 048 766 108 513 4 282 162 56 157 90 951 7 478 762
91 914 3 771 294 42 693 76 271 6 394 806 111 086 4 027 019 48 659 92 987 6 938 390
94 782 4 002 184 50 162 87 831 6 834 112 103 598 4 188 144 69 835 96 241 7 301 765
2003 106 741 4 144 586 77 247 81 588 7 093 129 90 115 3 313 998 71 965 75 216 6 191 524 83 706 3 606 468 76 605 79 280 6 385 857 48 550 2 592 725 55 172 57 885 4 237 584 44 243 2 769 772 56 184 55 089 4 343 374
註釋: 數字不包括司機。 Notes :(1) 包括以公海為目的地的郵船旅客。 (1)
資料來源: 入境事務處 Source : Immigration Department(查詢電話: 2829 3407) (Enquiry Telephone No: 2829 3407)
Lok Ma Chau
660 259
1
1
771 116 768 238 815 869
8 497 183
12
730 915
45
504 535 372 761
Figures exclude drivers.Including passengers by cruises to high seas.
出入境管制站 --- 續
Control point --- cont'd.
6 574 641
管制站
落馬洲
Control Point
684 162
788 591
出入境管制站
Control point
Month
港澳碼頭
Macao Ferry Terminal
輪船
Ferry月
5 041 919
4 770 972
5 047 807
411 509 416 133
9
Month
6 681 156
5 784 029
7
3
5
8
1110
4
月
23
396 536
451 164
6
401 330 388 965 434 728
4
89
1110
2
5
3 450 472
3
4
12
7
668 592
718 392
667 008
5 731 614
387 450 442 917 379 495 264 620 262 497
800 030 864 477 885 193
114香港統計月刊 二零零三年六月 Hong Kong Monthly Digest of Statistics June 2003

6.10 按目的地劃分的本港居民離港人數
Hong Kong Resident Departures by Destination
年 月 菲律賓
Year Month Philippines
2000 286 210
2001 283 174
2002 271 790
2002 3 33 1714 21 3195 21 3636 22 483
7 27 0428 22 9569 17 311
10 17 86411 14 83812 29 646
2003 1 18 9862 16 7713 19 8304 19 6235 13 913
年 月 美國
Year Month U.S.A.
2000 217 551
2001 218 175
2002 187 119
2002 3 14 0674 11 9765 15 3706 16 836
7 19 5838 20 5439 15 057
10 12 41211 12 35012 15 648
2003 1 21 1002 11 9523 12 3164 7 6715 3 425
註釋 : 本港居民離港後,除所申報的目的地外, Notes :亦可能到其他的地方。
(1) 不包括司機。 (1)
資料來源: 入境事務處 Source : Immigration Department(查詢電話: 2829 3407) (Enquiry Telephone No: 2829 3407)
101 630 3 924 507
4 779 192 312 047 43 000 42 640 47 756 27 1044 057 599 370 080
8 885 5 567 7 890 704
23 011 6 451
4 990 191 378 642 57 027 56 326 48 315 30 660
51 857 49 502
3 454 981 253 750 42 681 1 619
26 912
11 672 2 677
40 211
4 803 886
2 719 142 222 122 186 11 837
15 289 13 591 15 166 9 885
20 895
15 344 15 862
20 168
14 561 9 072 12 621
26 762 16 660 8 142
21 399
136 343
41 336
16 449 3 903 15 231 3 675
3 895
4 394 3 995
2 845
130 701
27 615
Total
1 791 475
172 254
142 720
1 677 048
Others
151 183
22 872
132 711
157 563
180 251
GermanyU.K.
174 174
172 083
德國
36 508
F RAustralia and 總計英國加拿大
澳洲及
紐西蘭
55 648 363 4 182 402
4 543 484
559 985
40 547
5 046 056
4 595 204
435 7994 842 461
52 002 944 4 293 622 525 526
528 12550 083 105 4 206 853
38 082
41 101
42 585 50 414 38 757
62 384 65 526
50 153
泰國 新加坡
Singapore台灣
Taiwan日本
Thailand
中國內地(1)
The mainlandof China(1)
460 283
澳門
Macao Japan
5 043 010
331 909
468 688
484 510
339 333
58 901 071
5 226 973
5 952 4245 719 500
5 811 191
Excluding drivers.other places apart from the destination claimed.On departing from Hong Kong, a resident may also be travelling to
158 241 1 691 707
3 628 12 366 12 702
2 026
18 835
314 284 521 200
35 174 22 852
28 372
22 987 36 900 24 433 35 883
20 980
223 201
231 576
237 493
18 290 14 155
18 186
13 393 16 430 17 603
320 078
336 150
43 380
571 098
42 123 35 222
296 584
538 232
44 280
4 461 861 327 629 45 630 44 334 39 205
344 695
347 547
Canada
11 723
37 436
185 540
New Zealand
391 262
311 465
4 654 077 310 349
3 228 092
4 378 2544 680 467
4 364 754
4 890 307
31 591 53 143
40 536
57 271 26 950
22 664 44 116 32 185 43 894 34 094
19 919 26 290
64 540 132
61 095 895
191 159
其他
32 375 19 986
56 321 50 735
4 993 315 119 779
43 108
4 335
5 151 7355 320 659
118 622
13 608
5 487 978
11 796 2 664
18 022
10 123 15 720
9 144
130 374
22 248 18 637 25 399 8 001 250 179
133 732 2 033 12 616
85 114 3 702 524 15 258 6 947 13 764 1 591
5 349 6335 282 5165 649 591
115香港統計月刊 二零零三年六月 Hong Kong Monthly Digest of Statistics June 2003

6.11 按居住國家/地區劃分的訪港旅客人數
Visitor Arrivals by Country/Territory of Residence
中國 澳洲及
內地 紐西蘭
The Australia 年 mainland and New 加拿大
Year of China Zealand Canada
2000 3 785 845 410 594 253 095
2001 4 448 583 381 657 249 707
2002 6 825 199 405 181 264 967
2002 2 471 528 22 574 17 6633 465 230 36 298 25 8264 525 498 36 674 24 5415 544 163 34 244 21 0206 423 763 32 088 17 764
7 565 322 30 996 20 6518 659 726 28 143 19 0409 593 509 35 447 17 065
10 669 828 38 716 26 67311 697 841 35 102 28 14712 753 974 39 445 24 713
2003 1 750 929 39 217 22 6132 713 489 26 977 18 7563 666 343 31 128 21 8234 322 216 6 862 5 351
資料來源: 香港旅遊發展局 Source : Hong Kong Tourism Board(查詢電話:2807 6543) (Enquiry Telephone No. : 2807 6543)
按居住國家/地區劃分的訪港旅客帶來之收益(1)
Receipts from Visitors(1) by Country/Territory of Residence百萬元
$ million
澳洲及
紐西蘭
Australia 年 歐洲 and New 總計
Year Europe Zealand Total
1999 4,818 1,717 54,276
2000 4,644 1,601 59,283
2001 4,683 1,716 62,210
2000 2,302 792 30,252
2001 2,456 898 31,2612,227 818 30,949
註釋: (1) Note: (1)
資料來源: 香港旅遊發展局 Source : Hong Kong Tourism Board(查詢電話:2807 6543) (Enquiry Telephone No. : 2807 6543)
58 438 105 187 1 115 853
119 841 1 408 139
95 803 129 155
141 567
1 570 1921 584 563
13 918
191 475 93 815 86 433 68 740
13 276 35 558 493 666
192 557 99 453 97 558 78 064
67 149 15 546 13 790
195 465 131 023 146 199 111 457 152 501
196 415 130 013 119 010 84 074 215 486 109 610 133 171 134 398
131 320 1 368 693
72 027 122 719 1 370 279 159 292
189 600 129 040 134 663 100 225
2,5801 - 6 10,013 6,069 3,056 2,751 2,925 513
總計
Total
13 725 332
13 059 477
U.S.A.歐洲
Europe其他
Others
東南亞
國家
S.E. Asiancountries
Month月
月
Month
6.12
台灣
Taiwanof Chinamainland
中國
東南亞國家
Other S.E.內地
The其他加拿大日本 Asian
日本
Japan台灣
Taiwan美國
2,3107 - 12 9,452 5,456 3,507 3,433 2,428 572
1,048
5,760 4,896 997
6,452 4,401
U.S.A.
985 3,963
Others
4,869
14,012 11,294 6,716
122 853 1 297 219
116 829 1 332 248 146 903 1 403 041
122 733 1 174 202
18,288 11,432 6,548
1 501 078
6,168 4,603
93 484
80 860
美國
其他
61 444
Japan countries
92 560 81 826
125 173 79 624 79 066 84 516
Canada
966 008 1 267 469
85 601 128 584 72 847
125 746
136 988
2 385 739
1 336 538 1 493 445 1 440 9641 019 894 935 717
1 382 417 1 539 473 1 068 837
2 418 827
22,994 10,696 5,513
3,009 1,971 484 2,3757 - 12 12,981 4,627 2,457
218 416 107 378 136 781 114 290 193 141 114 744 145 797 80 484 181 972 108 850
232 388 121 978 220 867 110 209
217 826 81 919
75 714
80 401
104 180
1 668 474
2 428 776 1 395 020 1 593 395 1 083 888 1 000 844 1 569 112 16 566 382
204 841 128 367
1 545 978 200 258 123 019 103 792 83 723
The Hong Kong Tourism Board (HKTB) is now reviewing thereceipts from visitors and per capita spending figures and is nowcompiling new data. The new information will be availablefrom the HKTB later in the year.
香港旅遊發展局現正進行檢討訪港旅客帶來之收益及每人平均消費的數據,並編製新的數字。香港旅遊發展局於今年稍後時間會發布新的資料。
161 885 102 959 91 643 92 506
4,955
70 274 108 825 1 347 386
116香港統計月刊 二零零三年六月 Hong Kong Monthly Digest of Statistics June 2003

6.13 按居住國家/地區劃分的訪港旅客每人平均消費(1)及留港時間
Per Capita Spending(1) and Length of Stay of Visitors by Country/Territoryof Residence
中國 澳洲及
內地 東南亞 紐西蘭
The 國家 Australia 年 mainland 台灣 日本 S.E. Asian 歐洲 美國 and New 加拿大 其他 合計
Year of China Taiwan Japan countries Europe U.S.A. Zealand Canada Others Overall
每人平均消費(元)
Per capita spending ($)
1999 4,370 5,475 5,720 4,621 4,719 5,359 4,822 4,356 3,581 4,791
2000 4,831 4,792 4,736 4,191 4,344 5,040 3,899 4,139 3,472 4,539
2001 5,169 4,422 4,125 3,857 4,591 5,232 4,495 3,994 3,439 4,532
2000 4,785 4,357 4,772 4,257 4,146 4,795 3,754 4,256 3,315 4,402
2001 4,971 5,016 4,395 3,808 4,883 5,960 4,592 4,045 3,734 4,7015,333 3,828 3,832 3,903 4,309 4,430 4,398 3,940 3,167 4,374
留港時間(晚)
Length of stay (nights)
1999 3.91 2.60 2.78 3.32 4.00 3.18 3.67 3.74 3.13 3.36
2000 3.33 2.32 2.42 3.01 3.62 3.26 3.51 3.62 N.A. 3.00
2001 3.46 2.31 2.32 3.12 3.97 3.26 3.92 3.44 N.A. 3.08
2000 3.32 2.28 2.52 3.08 3.48 3.38 3.30 3.59 N.A. 2.99
2001 3.44 2.25 2.39 3.19 4.14 3.52 4.15 3.35 N.A. 3.113.47 2.37 2.25 3.05 3.81 2.98 3.69 3.54 N.A. 3.05
註釋: (1) Note: (1)
資料來源: 香港旅遊發展局 Source : Hong Kong Tourism Board(查詢電話:2807 6543) (Enquiry Telephone No. : 2807 6543)
1 - 6
7 - 12
月
Month
The Hong Kong Tourism Board (HKTB) is now reviewing thereceipts from visitors and per capita spending figures and is nowcompiling new data. The new information will be available fromthe HKTB later in the year.
香港旅遊發展局現正進行檢討訪港旅客帶來之收益及每人平均消費的數據,並編製新的數字。香港旅遊發展局於今年稍後時間會發布新的資料。
7 - 12
1 - 6
7 - 12
7 - 12
117香港統計月刊 二零零三年六月 Hong Kong Monthly Digest of Statistics June 2003

6.14 香港酒店統計數字
Hotel Statistics of Hong Kong
高價甲級酒店 高價乙級酒店 中價酒店
High tariff A hotels High tariff B hotels Medium tariff hotels
入住率 入住率 入住率
酒店 房間 (百分比) 酒店 房間 (百分比) 酒店 房間 (百分比)
數目 數目 Room 數目 數目 Room 數目 數目 Room 年 月 No. of No. of occupancy No. of No. of occupancy No. of No. of occupancyYear Month hotels rooms rate(%) hotels rooms rate(%) hotels rooms rate(%)
2000 18 9 999 82 28 14 314 84 35 10 365 842001 17 9 391 74 29 14 850 81 33 9 999 812002 17 9 473 80 31 15 897 86 41 11 389 852002 2 17 9 473 68 31 15 552 78 44 11 624 76
3 17 9 473 82 31 15 552 89 44 11 624 884 17 9 473 81 31 15 879 90 43 11 502 895 17 9 473 78 31 15 879 85 43 11 502 846 17 9 473 74 31 15 879 82 43 11 502 797 17 9 473 73 31 15 879 85 42 11 430 868 17 9 473 78 31 15 879 89 42 11 430 899 17 9 473 80 31 15 879 84 41 11 398 81
10 17 9 473 88 31 15 879 85 41 11 398 8211 17 9 473 90 31 15 879 91 41 11 389 9612 17 9 473 83 31 15 897 92 41 11 389 90
2003 1 17 9 473 79 30 15 790 85 42 11 444 822 17 9 473 76 30 15 790 85 42 11 444 813 17 9 473 70 30 15 790 80 42 11 456 834 17 9 473 14 30 15 790 24 42 11 456 25
所有酒店(1) 旅客賓館 所有類別
All hotels(1) Tourist guest houses All categories
入住率 入住率 酒店/旅客 入住率
酒店 房間 (百分比) 房間 (百分比) 賓館數目 房間 (百分比)
數目 數目 Room 數目 Room No. of hotels/ 數目 Room 年 月 No. of No. of occupancy No. of occupancy tourist guest No. of occupancyYear Month hotels rooms rate(%) rooms rate(%) houses rooms rate(%)
2000 81 34 678 83 1 760 82 92 36 438 832001 79 34 240 79 1 759 74 90 35 999 792002 98 38 949 84 4 675 78 495 43 634 842002 2 98 37 132 75 4 702 67 505 41 834 75
3 98 37 132 87 4 697 78 505 41 829 864 99 38 039 87 4 719 81 508 42 758 875 99 38 039 83 4 710 75 506 42 749 836 99 38 039 79 4 708 72 505 42 747 797 95 37 882 82 4 633 77 490 42 515 828 95 37 882 86 4 629 81 489 42 511 869 96 38 088 82 4 607 78 493 42 758 82
10 96 38 088 85 4 690 83 495 42 778 8511 97 38 809 93 4 675 90 494 43 484 9212 98 38 949 89 4 675 85 495 43 634 89
2003 1 95 38 131 82 4 682 78 493 42 813 822 95 38 131 82 4 702 73 495 42 833 813 95 38 108 79 4 684 75 494 42 792 794 94 37 277 22 4 699 27 496 41 976 22
註釋 : Notes :
(1) (1)
資料來源:香港旅遊發展局 Source : Hong Kong Tourism Board(查詢電話: 2807 6543) (Enquiry Telephone No.: 2807 6543)
409
400 398
402 399
397
399
407
397
397
旅客賓
館數目
No. oftourist guest
394
houses
11 11
397 407
由二零零二年開始,「高價甲級酒店」、「高價乙級酒店」及「中價酒店」數字的合計可能少於「所有酒店」的數字,這是由於沒有足夠的資料把一些新涵蓋的酒店按不同的房租價格歸類。
Figures before 2002 in this table refer to member hotels and memberhostels/guest houses of the previous Hong Kong Tourist Association. Figuresfrom 2002 onwards cover all hotels and tourist guest houses with licences foroperation issued by the Office of the Licensing Authority of the Home AffairsDepartment.
407
Starting from 2002, the sum of the figures for 'High tariff A hotels', 'Hightariff B hotels' and 'Medium tariff hotels' may be less than the figure for 'Allhotels'. This is because there is not sufficient information for some of thenewly covered hotels to be classified into different tariff categories of hotels.
本表內二零零二年前的數字指前香港旅遊協會會員酒店及旅舍/賓館。由二零零二年開始,數字包括所有獲民政事務總署牌照事務處發牌經營的酒店及旅客賓館。
406 395
118香港統計月刊 二零零三年六月 Hong Kong Monthly Digest of Statistics June 2003

6.15 電訊服務
Telecommunications Services
交換機有效 圖文傳真(2)
負載量(2) (以千條 公共無線電傳呼
(以千條線路計) 線路計) 接收器(2)
年 月 Effective exchange capacity(2) Fax(2) Public radioYear Month (thousand lines) (thousand lines) paging receivers(2)
2000 4 480 404 4 173 318 (5 234 370)2001 4 512 411 4 256 422 (5 701 686)2002 4 762 546 4 207 465 (6 218 984)2002 1 4 506 410 4 253 221 (5 702 851)
2 4 514 408 4 246 067 (5 732 938)3 4 545 407 4 248 077 (5 776 360)4 4 553 406 4 241 151 (5 763 613)5 4 550 407 4 237 943 (5 808 089)6 4 545 408 4 237 012 (5 827 208)7 4 645 456 4 236 215 (5 909 378)8 4 681 515 4 234 135 (5 892 588)9 4 669 564 4 229 350 (5 912 100)
10 4 710 559 4 216 617 (5 974 999)11 4 710 553 4 209 429 (6 054 415)12 4 762 546 4 207 465 (6 218 984)
2003 1 4 740 542 4 198 980 (6 297 541)2 4 704 538 4 192 093 (6 348 708)3 4 717 533 4 194 633 (6 395 725)
商用 住宅 本港電報
Business Residential Inlandtelegrams
專用自動
年 月 電鍵 電話交換 其他 總計 發出 收到
Year Month Keylines PABX Others Total Outward Inward
2000 340 170 1 226 2 210 3 946 21 035 8 021 8442001 388 194 1 182 2 161 3 926 12 169 5 316 3 1292002 294 147 1 267 2 134 3 842 7 313 3 517 502002 1 323 161 1 273 2 158 3 915 761 419 1
2 321 161 1 270 2 152 3 904 738 365 13 319 160 1 269 2 150 3 898 799 411 134 316 158 1 270 2 148 3 893 734 325 15 314 157 1 269 2 145 3 885 688 301 76 312 156 1 270 2 138 3 876 614 229 37 310 155 1 272 2 146 3 883 646 298 98 307 153 1 271 2 143 3 874 497 241 29 303 152 1 267 2 140 3 862 428 223 2
10 300 150 1 264 2 137 3 853 509 220 611 297 149 1 268 2 138 3 853 494 225 112 294 147 1 267 2 134 3 842 405 260 4
2003 1 291 145 1 272 2 135 3 843 448 261 72 289 144 1 270 2 134 3 837 417 200 43 268 143 1 273 2 130 3 832 430 206 3
193 395
197 405
197 405
200 887 204 606 209 458 212 752
225 074 219 422
公共流動無線電話用戶系統(2)(3)
Public mobileradio-telephone
253 215
190 269
subscriber units(2)(3)
327 768
225 643
233 843
245 813 239 833
229 133
188 995
Telephone lines(1)(2) (thousand lines) 電話線路(1)(2)(以千條線路計)
Major telecommunications services主要電訊服務
電報 Public telegram traffic
119香港統計月刊 二零零三年六月 Hong Kong Monthly Digest of Statistics June 2003

6.15 (續) 電訊服務
(Cont'd.) Telecommunications Services
香港撥出
本港電報 對外電話通訊量
機電訊 (以千 (千分鐘計)(4)
分鐘計) Outward externalInternal telephone traffic
年 收到 轉接 telex traffic volume (thousandYear Inward Transit (thousand minutes) minutes) (4)
2000 3 231 3 629 6 989 3 074 8852001 2 471 3 036 5 307 3 487 2912002 2 291 2 122 2 950 3 950 8972002 1 209 208 311 327 519
2 176 183 242 279 3373 222 203 287 329 6294 229 210 277 316 3805 215 197 295 334 9706 194 173 231 332 3137 200 178 250 351 7778 192 172 237 347 4009 180 164 209 358 102
10 169 156 212 354 02611 158 135 207 303 69912 147 142 193 315 745
2003 1 155 142 199 314 0852 128 117 163 295 6373 147 115 189 356 935
註釋 : (1) Notes : (1)
(2) (2)
(3) (3)
(4) (4)
資料來源: 電訊管理局 Source : Office of the Telecommunications Authority(查詢電話:2961 6652) (Enquiry Telephone No.: 2961 6652)
1 5001 7571 954
2 6862 189
3 047
No. of telex
主要電訊服務 --- 續
Major telecommunications services ---cont'd
對外專用電報機電訊 (以千分鐘計)
External telex traffic (thousand minutes)專用電報機用戶(2)
subscribers (2)
月Month
發出Outward
SIM cards are presented in brackets.Estimated figures.
1 823 117
於括號內展示。
1 726 85
估計數字。
年底或月底數字。
1 757 104
Excluding pre-paid SIM cards. Figures including pre-paid
包括直通內線式電話線、圖文傳真線及電文線路
的直撥服務。
數字不包括儲值智能咭。包括儲值智能咭的數字
End-of-period figures.lines.Include direct dailing in lines, facsimile lines and datel
1 738 104
1161 852 1271 889
2 173 140 1132 142
2 059 1402 114 144
1 693 87
1 968 1361 923 122
1 801 114
127
1 854
120香港統計月刊 二零零三年六月 Hong Kong Monthly Digest of Statistics June 2003

6.16 互聯網服務
Internet Services
持牌互聯網
服務供應商
數目
No. of licensed Internet Service 以撥號接駁 客戶透過
Providers 的已登記 公共電話
(ISPs) 客戶戶口 以私人租用 寬頻互聯網 網絡接駁(5) 客戶透過
(不包括互聯 作撥號接駁 線路接駁 接駁客戶 (千分鐘) 寬頻網絡
網儲值卡)(2) 用途的互聯 的已登記 戶口(2)(3)(4) Customer 接駁(4)(6)
Registered 網儲值卡 客戶戶口(2) Registered access via (兆兆比特)
customer accounts Internet pre- Registered broadband public Customerwith dial-up paid calling customer Internet switched access via
access (excluding cards for accounts access telephone broadband 年 月 Internet pre-paid dial-up with leased customer networks(5) networks(4)(6)
Year Month calling cards)(2) access line access(2) accounts(2)(3)(4) ('000 minutes) (terabits)
2000 235 2 283 047 38 708 11 527 392 118 14 988 592 2 909
2001 258 2 018 238 18 569 7 066 623 302 11 055 810 73 607
2002 235 1 371 705 14 978 3 439 989 115 5 550 228 215 296
2002 1 260 1 984 687 11 168 6 093 648 744 624 238 11 3732 257 1 931 836 10 812 5 469 673 256 477 016 11 1923 255 1 887 311 10 999 5 720 716 435 555 088 12 7054 256 1 829 291 11 375 5 273 756 555 525 303 13 5835 256 1 848 172 12 041 5 345 790 088 491 417 14 9806 256 1 788 670 12 304 5 033 816 200 428 642 15 485
7 256 1 711 295 14 152 4 020 843 560 488 031 17 5218 254 1 646 154 14 260 3 219 868 753 452 707 19 7189 254 1 624 667 14 319 2 766 909 579 392 851 21 019
10 234 1 602 595 14 647 3 743 940 315 387 219 24 07911 234 1 583 908 14 792 3 697 969 355 372 573 25 70412 235 1 371 705 14 978 3 439 989 115 355 143 27 937
2003 1 233 1 361 420 15 219 3 486 1 009 426 332 405 31 1432 234 1 347 627 15 373 3 511 1 024 137 294 680 28 3723 234 1 330 340 15 614 3 368 1 038 995 343 984 38 258
註釋: (1) Notes: (1)
(2) (2)
(3) (3)
(4) (4)
(5) (5)
(6) (6)
資料來源: Source: Office of the Telecommunications Authority(Enquiry Telephone No.: 2961 6652)
Internet Service Providers (ISPs) (1)
No. of customers of licensed 互聯網使用量(1)
Internet traffic volume(1)
持牌互聯網服務供應商客戶數目(1)
Broadband Internet access refers to services with downloading speed of 1Mbps or above using cable modem, ATM (asynchronous transfer mode),ADSL (asymmetric digital subscriber line), DSL (digital subscriber line)or other technologies.Figures do not include customer access via leased circuits and broadbandservices.Figures were first available in November 2000.
電訊管理局
寬頻互聯網接駁指利用導線解調器、異步傳輸模式(ATM)、非對稱數碼用戶線路 (ADSL) 、數碼用戶線路 (DSL) 或其他技術而下載速度達每秒一兆比特或以上的服務。
數字為根據互聯網服務供應商申報的估計數字,並不包括不屬於持牌互聯網服務供應商客戶的使用者。
已登記客戶戶口指互聯網服務供應商的客戶戶口(包括免費的客戶戶口)。擁有超過一個客戶登入識別碼的登記客戶戶口只算作一個已登記的客戶戶口。數字不包括只獲提供電郵地址的客戶戶口。
Estimated figures are based on the return from the ISPs and do notinclude users who are not customers on the licensed ISPs.
Figures were first available in February 2000.
Registered customer accounts refer to the customer accounts of ISPs(including those free-of-charge customer accounts). For a registeredcustomer account which has more than one user login ID, it is counted asone registered customer account only. Figures do not include customeraccounts which are provided with e-mail addresses only.
(查詢電話:2961 6652)
數字自二零零零年二月開始提供。
數字不包括透過私人租用線路接駁及使用寬頻服務的客戶。
數字自二零零零年十一月開始提供。
121香港統計月刊 二零零三年六月 Hong Kong Monthly Digest of Statistics June 2003

6.17 郵遞服務
Postal Services
信件郵件 (百萬件物品) 包裹 (千件) Letter mail (million articles) Parcels (thousands)
本地派遞 本地派遞
寄往香港 的從外地 寄往香港 的從外地
以外地方 寄出物品 以外地方 寄出包裹的物品 Articles 的包裹 Parcels
本地 Articles from outside 轉運 本地 Parcels from outside 轉運
物品 posted to Hong Kong 物品 包裹 posted to Hong Kong 包裹
年 Local places outside for local Articles Local places outside for local ParcelsYear articles Hong Kong delivery in transit parcels Hong Kong delivery in transit
2000 1 121.8 133.6 85.1 0.7 54 568 327 262001 1 151.0 130.6 78.0 0.7 42 533 319 292002 1 084.4 * 116.1 72.9 0.7 36 556 305 312002 259.8 29.7 18.0 0.2 9 137 75 9
280.3 27.3 18.8 0.2 9 133 76 6 271.9 26.9 15.4 0.1 9 130 74 8 272.5 * 32.2 20.7 0.2 9 155 80 7
2003 243.4 27.1 18.9 0.2 8 140 72 6
資料來源: 香港郵政 Source : Hongkong Post(查詢電話:2921 2231) (Enquiry Telephone No.: 2921 2231)
1 - 3
月Month
4 - 6 1 - 3
10 - 12 7 - 9
122香港統計月刊 二零零三年六月 Hong Kong Monthly Digest of Statistics June 2003

香港統計月刊 二零零三年六月 123 Hong Kong Monthly Digest of Statistics June 2003
政府收支、貨幣、金融
Public Accounts, Money and Finance
概念及方法 Concepts and Methods
認可機構(AIs)包括持牌銀行、有限制牌照
銀行(RLBs)及接受存款公司(DTCs)。
Authorized institutions (AIs) include licensed banks,restricted licence banks (RLBs) and deposit-takingcompanies (DTCs).
貨幣及銀行體系的統計數字(表 7.1 - 7.11)會根據認可機構所提交的修訂資料而作出按
月修訂。
Money and banking statistics (Tables 7.1 - 7.11) arerevised on a monthly basis to take into account anysubsequent amendments submitted by AIs.
儲蓄及定期存款利率是指香港銀行公會《利
率規則》定出的利率上限,是持牌銀行所支
付給存戶的最高利率。一九九四年十月起,
《利率規則》開始逐步放寬,至二零零一年
七月三日完成最後階段。
Savings and time deposit rates refer to the maximuminterest rates offered by licensed banks under theHong Kong Association of Banks' “Interest RateRules”. Deregulation of the “Interest Rate Rules” hastaken place in phases since October 1994 and wastotally completed on 3 July 2001.
有限制牌照銀行可接受金額不少於五十萬港
元的任何期限的定期存款,而存款利率並無
任何限制。
RLBs can accept time deposits in amounts of not lessthan HK$500,000 with any term of maturity. Thereis no restriction on interest rate payable.
接受存款公司可接受金額不少於十萬港元而
期限不少於三個月的定期存款,而存款利率
並無任何限制。
DTCs can accept time deposits in amounts of not lessthan HK$100,000 with a term of maturity of at leastthree months. There is no restriction on interest ratepayable.
貨幣供應量M1是指市民持有的法定紙幣和硬
幣加上持牌銀行的活期存款。
M1 refers to the sum of legal tender notes and coinsheld by the public plus customers' demand depositsplaced with licensed banks.
貨幣供應量M2是指貨幣供應量M1所包括的項
目,加上持牌銀行客戶的儲蓄及定期存款,
再加上持牌銀行發行而由非認可機構持有的
可轉讓存款證(NCDs)。
M2 refers to the sum of M1 plus customers' savingsand time deposits with licensed banks, plusnegotiable certificates of deposit (NCDs) issued bylicensed banks held by non-authorized institutions.
貨幣供應量M3是指貨幣供應量M2所包括的各
項,再加上有限制牌照銀行(RLBs)及接受
存款公司(DTCs)客戶的存款,再加上以上
兩類認可機構發行而由非認可機構持有的可
轉讓存款證(NCDs)。
M3 refers to the sum of M2 plus customer depositswith restricted licence banks (RLBs) and deposit-taking companies (DTCs) plus negotiable certificatesof deposit (NCDs) issued by RLBs and DTCs held bynon-authorized institutions.
在各項貨幣總體數字中,於港元貨幣供應
M1、公眾持有的貨幣及活期存款存在季節性
模式。這三項經季節性調整的數據序列已編
製及追溯至一九九零年一月。已剔除季節性
因素的數據有助分析基本經濟趨勢。有關詳
情,請參閱《金融管理局季報》二零零零年
十一月號。
Among the various monetary aggregates, seasonalpatterns are found in Hong Kong dollar M1, currencyheld by the public, and demand deposits. Seasonallyadjusted data on the three series backdated to January1990 have been compiled. The deseasonalised datafacilitate the analysis of underlying trends. Fordetails, please see the November 2000 issue of theHong Kong Monetary Authority Quarterly Bulletin.
外幣兌換率的統計數字,指外幣以電匯/現鈔
形式於每日收市時兌港元買賣的平均價。以
Statistics of exchange rates between the Hong KongDollar (HKD) and other selected currencies refer tothe averages of the daily closing middle-market

香港統計月刊 二零零三年六月 124 Hong Kong Monthly Digest of Statistics June 2003
港元計算特別提款權(SDR)的兌換率,是
把國際貨幣基金(IMF)所發表以美元計算
特別提款權的匯率乘以美元兌換港元的兌換
率而計算出來。
telegraphic transfer/notes rates. The exchange ratesof the special drawing right (SDR) are derived bymultiplying the U.S. Dollar (USD) value of the SDRas published by the International Monetary Fund(IMF) by the appropriate exchange rates of HKDagainst USD.
歐元是歐洲的統一貨幣,於一九九九年一月
一日推出。現時,歐洲聯盟其中十二國家採
用歐元,該十二國家為奧地利、比利時、芬
蘭、法國、德國、希臘、愛爾蘭、意大利、
盧森堡、荷蘭、葡萄牙及西班牙。歐元鈔票
與硬幣於二零零二年一月一日開始流通。
Euro is a unified European currency launched on1 January 1999. At present, twelve European nationsof the European Union have adopted the euro. Theyare Austria, Belgium, Finland, France, Germany,Greece, Ireland, Italy, Luxembourg, the Netherlands,Portugal and Spain. Euro notes and coins enteredinto circulation on 1 January 2002.
港匯指數是量度港元相對其他主要貿易夥伴
貨幣匯率變動加權平均值的指數,作為反映
港元相對各種選定貨幣強弱的整體指標。由
二零零二年一月一日開始,歐元的紙幣及硬
幣已取代各參與國家的貨幣成為法定貨幣。
因此,港匯指數的貨幣籃子亦已更新。由二
零零二年一月二日起,新系列港匯指數(包括
十四種貨幣及以二零零零年一月 = 100)已取
代舊港匯指數系列。有關詳情,請參閱刊載
於本月刊二零零一年十二月號題為「新系列
港幣匯率指數」的專題文章。
The effective exchange rate index (EERI) for theHKD is an index which measures movements in theweighted average of the exchange rate of the HKDagainst the currencies of major trading partners ofHong Kong. It serves as an indicator for measuringthe overall strength of the HKD relative to selectedcurrencies. As from 1 January 2002, Euro notesand coins have replaced notes and coins in nationalcurrencies of participating countries of the Euro.Hence, the currency basket for compiling EERI hasbeen updated. A new series of EERI, which includesfourteen currencies and is based on January 2000 as100, has replaced the old series as from2 January 2002. For details, please see the featurearticle entitled “New Series of Effective ExchangeRate Index for the Hong Kong Dollar” in theDecember 2001 issue of this publication.
《中華人民共和國香港特別行政區基本法》
說明,港元是香港特別行政區的法定貨幣。
外幣指港元以外的其他貨幣,因而人民幣亦
視作外幣。
Hong Kong dollar is the legal tender in the HongKong Special Administrative Region, as stated in“The Basic Law of the Hong Kong SpecialAdministrative Region of the People’s Republic ofChina”. Foreign currency refers to any currencyother than the Hong Kong currency. Accordingly,Chinese Renminbi is also treated as foreign currency.
「直接稅」包括入息稅、利得稅及遺產稅。
「間接稅」包括應課稅品稅項、一般差餉、
車輛稅、專利稅及特權稅、博彩及彩票稅、
娛樂稅、酒店房租稅、印花稅、飛機旅客離
境稅及海底隧道通過稅。「撥入其他基金」
包括對資本投資基金、貸款基金及賑災基金
(於一九九三年十二月一日成立)的轉撥款
項。「期間實際開支」乃指除對基金的無償
轉讓外的開支。
'Direct taxes' include earnings and profits tax andestate duty. 'Indirect taxes' include duties, generalrates, motor vehicle taxes, royalties and concessions,bets and sweeps tax, entertainments and hotelaccommodation tax, stamp duties, air passengerdeparture tax and Cross-Harbour Tunnel passage tax.'Transfers to other Funds' include transfers to CapitalInvestment Fund, Loan Fund and Disaster ReliefFund (established on 1 December 1993). 'Actualexpenditure during the period' refers to expenditureother than transfers to funds.
本節刊載下列一些常用的股票市場指數以量
度不同類別股票的表現。這些指數由恒指服
務有限公司、香港交易及結算所有限公司及
標準普爾編製。
A number of stock market indices, which are in wideuse for gauging the performance of stocks in themarket, are included in this section. They arecompiled by the HSI Services Limited, the HongKong Exchanges and Clearing Limited and theStandard & Poor's.

香港統計月刊 二零零三年六月 125 Hong Kong Monthly Digest of Statistics June 2003
由恒指服務有限公司編製股票市場(主板)
的指數有:
Indices compiled by the HSI Services Limited, whichrefer to the equity market (Main Board), include:
a. 恒生指數 a. Hang Seng Index
「恒生指數」於一九六九年十一月二十四日
推出,是股票市場的主要指標。
Launched on 24 November 1969, this index is thekey barometer of the Hong Kong stock market.
「恒生指數」由三十三隻成份股所組成,涵
蓋香港聯合交易所有限公司主板上市公司市
值總數約70%。為了進一步反映市場上各類別
股票的價格走勢,三十三隻成份股分別納入
四個分類指數,包括工商業、金融、地產和
公用事業。
The constituent stocks of this index are 33 stocksrepresentative of the market. The aggregate marketvalue of these stocks accounts for about 70% of thetotal market capitalization on the Stock Exchange ofHong Kong Limited. To better reflect the pricemovements of the major sectors of the market, the 33constituent stocks are grouped under 4 sub-indices,viz. Commerce and Industry, Finance, Properties andUtilities.
b. 恒生綜合指數系列 b. Hang Seng Composite Index Series
「恒生綜合指數系列」於二零零一年十月三
日推出,並提供一個香港股票市場表現的全
面指標。指數系列由十七隻指數組成,反映
香港股票市場不同層面的表現。
Launched on 3 October 2001, this index seriesprovides a comprehensive benchmark of theperformance of the Hong Kong stock market. Itcomprises 17 indices to gauge the performance ofHong Kong stock market from different aspects.
「恒生綜合指數系列」是由兩個獨立指數系
列組成:地域指數及行業指數系列。除「恒
生綜合指數」外,整個系列包括七隻以地域
及成份股的市值劃分的指數及九隻以行業劃
分的指數。指數系列內的每個指數均以二零
零零年一月三日為基日及以2 000點為基值。
有關指數的編製亦追溯至二零零零年一月三
日。
This index series is composed of two distinct series-the geographical series and the industry series. Inaddition to the Hang Seng Composite Index, there areseven indices based on the geographical status andmarket capitalization of the constituent stocks, andnine indices based on industry classification. Eachindex in the series has been backdated to 3 January2000, with a base value of 2 000.
(i) 恒生綜合指數 (i) Hang Seng Composite Index
「恒生綜合指數」是選取在過去十二個月
平均市值最高的首二百間公司作為成份
股,目標是涵蓋在香港聯合交易所有限公
司主板上市股票市值的 95%。
Comprising the top 200 companies selected asconstituents in terms of average marketcapitalization in the past 12 months, this indexaims to cover 95% of the market capitalization ofstocks listed on the Main Board of the StockExchange of Hong Kong.
(ii) 地域指數 (ii) Geographical Indices
(1) 恒生香港綜合指數 (1) Hang Seng Hong Kong Composite Index
「恒生香港綜合指數」用以反映那些在
本港上市,而大部分營業銷售額是來自
香港或中國內地以外地區業務的公司表
現。指數是由「恒生香港大型股指數」
(市值最大的十五間公司)、「恒生香
港中型股指數」(以市值計算名列第十
六至五十的公司)及「恒生香港小型股
指數」(以市值計算名列第五十一或以
後的公司)組成。
This index tracks performance of the listedcompanies which derive the majority of theirsales revenue from Hong Kong or placesoutside the mainland of China. It comprisesthe Hang Seng HK LargeCap Index (for the top15 companies by market capitalization), theHang Seng HK MidCap Index (for companiesranked 16th to 50th by market capitalization)and the Hang Seng HK SmallCap Index (forcompanies ranked 51st and below by marketcapitalization).

香港統計月刊 二零零三年六月 126 Hong Kong Monthly Digest of Statistics June 2003
(2) 恒生中國內地綜合指數 (2) Hang Seng Mainland Composite Index
「恒生中國內地綜合指數」用以反映那
些在本港上市,而大部分營業銷售額是
來自中國內地業務的公司表現。指數主
要是由「恒生中國企業指數」及「恒生
香港中資企業指數」組成。
This index tracks performance of the listedcompanies which derive the majority of theirsales revenue from the mainland of China. Itcomprises mainly the Hang Seng ChinaEnterprises Index and the Hang Seng China-Affiliated Corporations Index.
「恒生中國企業指數」於一九九四年八
月八日推出。在「恒生綜合指數系列」
推出後,指數的成份股已作出修訂,而
指數亦以二零零零年一月三日為基日從
新編製。指數用以監察「恒生中國內地
綜合指數」成員中的國企 H股的變動。
The 'Hang Seng China Enterprises Index' waslaunched on 8 August 1994. Following thelaunch of the Hang Seng Composite IndexSeries, its constituents have been revised andthe index has been re-based to 3 January 2000.It monitors the movements of all H-shares inthe Hang Seng Mainland Composite Index.
「恒生香港中資企業指數」於一九九七
年六月十六日推出。在「恒生綜合指
數」系列推出後,指數的成份股已作出
修訂,而指數亦以二零零零年一月三日
為基日從新編製。指數用以反映「恒生
中國內地綜合指數」成員中的非國企 H
股,而又有相當股權由中國內地機構持
有的公司表現。
The 'Hang Seng China-Affiliated CorporationsIndex' was launched on 16 June 1997.Following the launch of the Hang SengComposite Index Series, its constituents havebeen revised and the index has been re-based to3 January 2000. It tracks the performance ofnon-H-share companies in the Hang SengMainland Composite Index, which have asignificant equity interest held by entities in themainland of China.
(iii) 行業指數 (iii) Industry Indices
「恒生綜合行業指數」用以反映「恒生綜
合指數」的二百隻成份股根據恒生股票分
類法劃分為九個行業的表現。其九種行業
為資源礦產業、工業製品業、消費品製造
業、服務業、公用事業、金融業、地產建
築業、資訊科技業及綜合企業。
The 'Hang Seng Composite Industry Indices' trackthe performance of the 200 constituent stocks byclassifying them into nine industries using theHang Seng Stock Classification System accordingto their major business activities. These industriesare Oil & Resources, Industrial Goods, ConsumerGoods, Services, Utilities, Financials, Properties& Construction, Information Technology andConglomerates.
由香港交易及結算所有限公司編製的指數
有:
Indices compiled by the Hong Kong Exchanges andClearing Limited:
a. 所有普通股指數 a. All Ordinaries Index
「所有普通股指數」已於二零零三年四月十
四日停止編製及被「標準普爾/香港交易所大
型股指數」取代。「所有普通股指數」原由
一九八九年二月一日起編製,涵蓋所有於香
港聯合交易所有限公司主板上市的普通股,
比重則按股份的市值而定,並為市場人士提
供一個股票市場(主板)總指標。
The 'All Ordinaries Index' was ceased to be compiledon 14 April 2003 and replaced by the 'S&P/ HKExLargeCap Index'. Compiled since 1 February 1989,the 'All Ordinaries Index' was a market value-weighted index which included all the ordinary shareslisted on the Main Board of the Stock Exchange ofHong Kong Limited. It provided market watcherswith an overall market indicator (Main Board).
b. 創業板指數 b. Growth Enterprise Index
「創業板指數」已於二零零三年四月十四日
停止編製及被「標準普爾/香港交易所創業板
指數」取代。「創業板指數」原由二零零零
年三月二十日起編製,涵蓋所有在創業板上
市的股票,比重則按股份的市值而定,並為
The 'Growth Enterprise Index' was ceased to becompiled on 14 April 2003 and replaced by the'S&P/HKEx GEM Index'. Compiled since 20 March2000, the 'Growth Enterprise Index' was a marketvalue-weighted index. All Growth Enterprise Market

香港統計月刊 二零零三年六月 127 Hong Kong Monthly Digest of Statistics June 2003
投資者提供評估創業板市場走勢的指標。 stocks were included in the index. It providedinvestors with an indicator to assess the movement ofthe Growth Enterprise Market.
由香港交易及結算所有限公司及標準普爾編
製的指數有:
Indices compiled by the Hong Kong Exchanges andClearing Limited and the Standard & Poor’s:
a. 標準普爾/香港交易所大型股指數 a. S&P/HKEx LargeCap Index
「標準普爾/香港交易所大型股指數」由二十
五隻股票組成,約佔香港股票市場總市值的
75%。該指數的市值按加權計算,比重會根據
股份流通量調整,並均衡地代表十個經濟界
別。其十個界別為消費者非必需品、消費者
常用品、能源、金融、保健產品、工業、資
訊科技、原料、電訊服務及公用事業。該指
數於二零零三年三月三日推出,並由二零零
三年四月十四日起取代「所有普通股指
數」。
The 'S&P/HKEx LargeCap Index' comprises 25stocks, covering approximately 75% of the HongKong market. The index is market-capitalizationweighted, with weight adjusted for available sharefloat, and is balanced across 10 economic sectors.These sectors are Consumer Discretionary, ConsumerStaples, Energy, Financials, Health Care, Industrials,Information Technology, Materials,Telecommunication Services and Utilities. The indexwas launched on 3 March 2003 and replaced the 'AllOrdinaries Index' with effect from 14 April 2003.
b. 標準普爾/香港交易所創業板指數 b. S&P/HKEx GEM Index
「標準普爾/香港交易所創業板指數」專為創
業板而設,其成份股均符合嚴格的流通量要
求。該指數按流通市值加權計算,成立時包
括四十六間公司的股份。該指數於二零零三
年三月三日推出,並由二零零三年四月十四
日起取代「創業板指數」。
The 'S&P/HKEx GEM Index' is designed to representthe Growth Enterprise Market and consists of stocksthat meet strict liquidity guidelines. The index is floatcapitalization weighted and, at its inception, includes46 companies. The index was launched on 3 March2003 and replaced the 'Growth Enterprise Index' witheffect from 14 April 2003.
其他有關刊物 Further References
恒生指數日報表,刊載於恒指服務有限
公司的網站(http://www.hsi.com.hk)
Hang Seng Indices Daily Bulletin, published on thewebsite of the HSI Services Limited(http://www.hsi.com.hk)
日報表,刊載於香港交易及結算所有限
公司的網站(http://www.hkex.com.hk)
Daily Quotation, published on the website of theHong Kong Exchanges and Clearing Limited(http://www.hkex.com.hk)
經濟報告,財經事務及庫務局編製 Economic Report, published by the Financial Servicesand the Treasury Bureau
金融數據月報,刊載於香港金融管理局
的網站(http://www.info.gov.hk/hkma/)Monthly Statistical Bulletin, published on the website
of the Hong Kong Monetary Authority(http://www.info.gov.hk/hkma/)

圖 7.1 港元貨幣供應的變動情況Ch t
M1 M2* M3*
-4
-2
0
2
4
6
8
10
12
Q3/00 Q1/01 Q3/01 Q1/02 Q3/02 Q1/03
與對上一季度比較的變動率Quarter-to-quarter rate of change%
-10
0
10
20
30
1992 1994 1996 1998 2000 2002
按年變動率Year-on-year rate of change%
最優惠貸款利率Best lending rate
儲蓄存款利率Savings deposit rate
0
2
4
6
8
10
12
5/01 9/01 1/02 5/02 9/02 1/03 5/03
年率% per annum
0
2
4
6
8
10
12
1992 1994 1996 1998 2000 2002
年率% per annum
128香港統計月刊 二零零三年六月 Hong Kong Monthly Digest of Statistics June 2003

圖 7.3 恒生指數及主板成交金額Chart 7.3 Hang Seng Index and Main Board Market Turnover
成交金額 (期內總數)Turnover (period total)
恒生指數 (期末數字)HSI (end of period)
0
5 000
10 000
15 000
20 000
05/01 09/01 01/02 05/02 09/02 01/03 05/030
100
200
300
400
指數Index (31.7.1964=100)
十億港元HK$ billion
0
5 000
10 000
15 000
20 000
1992 1994 1996 1998 2000 20020
1,000
2,000
3,000
4,000
指數Index (31.7.1964=100)
十億港元HK$ billion
129香港統計月刊 二零零三年六月 Hong Kong Monthly Digest of Statistics June 2003

7.1 流通貨幣及貨幣供應Currency in Circulation and Money Supply
百萬港元
HK$ million 法定紙幣及硬幣的流通量 由認可機構持有
Legal tender notes and coins in circulation 的法定紙幣及硬幣Authorized institutions'holdings of legal tender
notes and coins由政府發行
年 季 Governmentissues港元 港元
Year Quarter HK$ HK$
2000 6,170 13,6742001 5,943 11,8612002 6,143 11,3842002 1 5,967 14,182
2 5,833 11,8343 6,068 10,8744 6,143 11,384
2003 1 6,568 9,957
由公眾持有的 貨幣供應量M1法定紙幣及硬幣 M1
Legal tender notes and年 季 coins in hands of public
外幣港元(1) 港元(1) Foreign 總計
Year Quarter HK$(1) HK$(1) currency Total
2000 91,761 (91,867) (199,926) 39,881 243,8472001 101,627 (101,809) (224,442) 28,215 258,0562002 113,234 (113,413) (252,989) 36,239 295,6502002 1 107,810 (102,180) (225,590) 32,110 261,826
2 107,284 (107,662) (237,746) 34,575 268,1283 109,429 (110,042) (244,744) 32,196 273,8724 113,234 (113,413) (252,989) 36,239 295,650
2003 1 118,536 (115,785) (259,935) 39,463 299,885
貨幣供應量M2 貨幣供應量M3
M2 M3年 季
外幣(2) 外幣(2)
港元(2) Foreign 總計 港元(2) Foreign 總計
Year Quarter HK$(2) currency(2) Total HK$(2) currency(2) Total
2000 1,983,637 1,665,856 3,649,492 1,998,032 1,694,721 3,692,7532001 1,996,138 1,553,923 3,550,060 2,013,998 1,580,132 3,594,1302002 1,982,142 1,536,184 3,518,326 2,002,318 1,559,534 3,561,8522002 1 1,976,807 1,463,896 3,440,703 1,994,504 1,487,840 3,482,344
2 2,000,462 1,498,103 3,498,564 2,018,132 1,524,578 3,542,7103 1,973,433 1,497,578 3,471,011 1,992,407 1,524,501 3,516,9084 1,982,142 1,536,184 3,518,326 2,002,318 1,559,534 3,561,852
2003 1 1,967,374 1,539,977 3,507,352 1,986,212 1,560,989 3,547,201註釋 : 數字指所有認可機構。 Notes : Figures refer to all authorized institutions.
(1) 括號內的數字是經季節性調整。 (1) Figures in brackets are seasonally adjusted. (2) 所列數字並未就外幣掉期存款作出調整,
調整後的數字刊於表 7.3。 figures are published in Table 7.3.資料來源: 香港金融管理局 Source : Hong Kong Monetary Authority
(查詢電話:2878 8222) (Enquiry Telephone No.: 2878 8222)
260,422
203,966229,841259,411229,715233,553241,676259,411
總計
114,235113,285116,025
HK$HK$
99,265107,545118,475
105,435
由商業銀行發行Commercialbank issues
港元(期末數字)As at end of
Total港元
(期末數字)As at end of
(期末數字)As at end of
(2) Unadjusted for foreign currency swap deposits, adjusted
118,475121,925
113,488124,618121,992
128,493
119,118120,303124,618
130香港統計月刊 二零零三年六月 Hong Kong Monthly Digest of Statistics June 2003

7.2 按類別劃分的客戶存款 (1)
Customer Deposits by Type(1)
百萬港元
HK$ million
持牌銀行
Licensed banks活期存款 儲蓄存款
Demand Savings 年 季
(期末數字) 外幣 外幣
As at end of 港元(2) Foreign 總計 港元 Foreign 總計
Year Quarter HK$(2) currency Total HK$ currency Total
2000 112,205 (108,059) 39,881 152,086 492,577 203,331 695,909
2001 128,214 (122,633) 28,215 156,429 613,931 237,522 851,454
2002 146,177 (139,577) 36,239 182,416 674,309 272,191 946,500
2002 1 121,905 (123,410) 32,110 154,015 616,716 236,071 852,7872 126,270 (130,084) 34,575 160,845 640,679 249,444 890,1223 132,246 (134,702) 32,196 164,443 634,845 257,511 892,3564 146,177 (139,577) 36,239 182,416 674,309 272,191 946,500
2003 1 141,885 (144,150) 39,463 181,348 689,368 288,307 977,675
持牌銀行 --- 續
Licensed banks --- cont'd.定期存款 各類存款總計
Time Total 年 季
(期末數字) 外幣 外幣
As at end of 港元 Foreign 總計 港元 Foreign 總計
Year Quarter HK$ currency Total HK$ currency Total
2000 1,229,572 1,413,089 2,642,660 1,834,354 1,656,301 3,490,655
2001 1,093,412 1,265,334 2,358,747 1,835,557 1,531,072 3,366,629
2002 983,502 1,163,338 2,146,840 1,803,988 1,471,768 3,275,756
2002 1 1,073,008 1,168,058 2,241,066 1,811,629 1,436,240 3,247,8682 1,062,623 1,174,040 2,236,662 1,829,571 1,458,059 3,287,6293 1,034,071 1,153,418 2,187,489 1,801,162 1,443,125 3,244,2884 983,502 1,163,338 2,146,840 1,803,988 1,471,768 3,275,756
2003 1 952,052 1,133,122 2,085,175 1,783,305 1,460,893 3,244,198
131香港統計月刊 二零零三年六月 Hong Kong Monthly Digest of Statistics June 2003

7.2 (續) 按類別劃分的客戶存款 (1)
(Cont'd.) Customer Deposits by Type(1)
百萬港元
HK$ million
有限制牌照銀行 接受存款公司 所有認可機構
Restricted licence banks Deposit-taking companies All authorized institutions 年 季
(期末數字) 外幣 外幣 外幣
As at end of 港元 Foreign 總計 港元 Foreign 總計 港元 Foreign 總計
Year Quarter HK$ currency Total HK$ currency Total HK$ currency Total
2000 9,117 22,315 31,432 3,380 2,380 5,760 1,846,851 1,680,996 3,527,847
2001 12,015 21,392 33,408 4,441 2,024 6,466 1,852,014 1,554,489 3,406,502
2002 15,072 20,820 35,892 3,944 1,950 5,895 1,823,004 1,494,538 3,317,542
2002 1 12,335 20,068 32,403 4,094 1,920 6,014 1,828,058 1,458,227 3,286,2852 12,433 23,395 35,828 4,053 1,781 5,834 1,846,057 1,483,235 3,329,2923 13,978 24,592 38,570 3,925 1,782 5,708 1,819,066 1,469,500 3,288,5654 15,072 20,820 35,892 3,944 1,950 5,895 1,823,004 1,494,538 3,317,542
2003 1 14,168 18,345 32,512 3,599 1,885 5,484 1,801,072 1,481,122 3,282,194
註釋: (1) 所列數字並未就外幣掉期存款作出調整, Notes : (1) Unadjusted for foreign currency swap deposits, adjusted調整後的數字刊於表7.3。 figures are published in Table 7.3.
(2) 括號內的數字是經季節性調整。 (2) Figures in brackets are seasonally adjusted.
資料來源: 香港金融管理局 Source : Hong Kong Monetary Authority(查詢電話:2878 8222) (Enquiry Telephone No.: 2878 8222 )
132香港統計月刊 二零零三年六月 Hong Kong Monthly Digest of Statistics June 2003

7.3 就外幣掉期存款作出調整的貨幣供應及客戶存款(1)
Money Supply and Customer Deposits Adjusted for ForeignCurrency Swap Deposits(1)
百萬港元
HK$ million
貨幣供應量M2
M2 年 季
(期末數字)
As at end of Year Quarter
2000200120022002 1
234
2003 1
貨幣供應量M3
M3 年 季
(期末數字)
As at end of 港元(2) 總計
Year Quarter HK$(2) Total
2000 2,002,358 3,527,8472001 2,016,635 3,406,5022002 2,004,225 3,317,5422002 1 1,996,958 3,286,285
2 2,020,389 3,329,2923 1,994,495 3,288,5654 2,004,225 3,317,542
2003 1 1,987,959 3,282,194註釋 : (1) 外幣掉期存款是指顧客在現貨市場購買外幣,然後 Notes : (1)
存入認可機構,但同時立下遠期合約,將該筆外幣
「本金加利息」在存款到期時售予認可機構。作為 大多數分析用途,這類掉期存款應當作港元存款。
(2) 包括外幣掉期存款。 (2)
(3) 已扣除外幣掉期存款。 (3)
資料來源: 香港金融管理局 Source : Hong Kong Monetary Authority(查詢電話:2878 8222) (Enquiry Telephone No.: 2878 8222)
1,830,511 1,455,7741,522,321 3,542,710 1,848,314 1,480,9771,485,386 3,482,344
1,854,651 1,551,8523,561,852 1,824,911 1,492,6313,594,130
Foreigncurrency(3)
總計Total
1,975,521
外幣掉期存款 Foreign currency
swap deposits
4,3262,6371,907 1,984,049
2,088
外幣(3)
1,984,0491,9071,747 1,969,122
外幣(3)
Foreigncurrency(3)
港元(2)
HK$(2)
1,998,7741,987,963
總計Total
3,550,0603,518,326
3,649,4921,661,5291,551,2861,534,277
1,495,490 3,471,011
所有認可機構客戶存款
1,534,277 3,518,3261,538,230 3,507,352
外幣(3)
Customer deposits with allauthorized institutions
Foreigncurrency(3)
港元(2)
HK$(2)
maturity of such deposits. For most analytical purposes,these should be regarded as Hong Kong dollar deposits.Adjusted to include foreign currency swap deposits.Adjusted to exclude foreign currency swap deposits.
sell such foreign currencies (principal plus interest) upon
customers buying foreign currencies in the spot market
1,467,412
Foreign currency swap deposits are deposits involving
and placing them as deposits with authorized institutions,
1,824,911 1,492,631
while at the same time entering into a forward contract to
1,821,153
1,559,242 3,547,201 1,802,819 1,479,375
1,676,670
3,516,9081,557,627 3,561,8521,522,413
1,557,627
3,692,7531,690,3941,577,495
1,851,177
2,454 1,979,260 1,461,443 3,440,7032,257 2,002,719 1,495,846 3,498,564
133香港統計月刊 二零零三年六月 Hong Kong Monthly Digest of Statistics June 2003

7.4 資產負債表Balance Sheet
百萬港元
HK$ million
港元 外幣 總計
HK$ Foreign currency Total
2002 2003 2003 2002 2003 2003 2002 2003 2003月底數字 四月 三月 四月 四月 三月 四月 四月 三月 四月
As at end of month Apr Mar Apr Apr Mar Apr Apr Mar Apr
負債 Liabilities香港銀行 Amount due to 276,927 250,617 246,001 163,177 145,185 150,433 440,103 395,803 396,434
同業借款 authorizedinstitutionsin Hong Kong
境外銀行同業 Amount due to 139,462 135,276 121,597 1,276,467 1,207,887 1,216,013 1,415,930 1,343,163 1,337,610借款 banks aboard
客戶 Deposits from 1,837,361 1,801,072 1,798,125 1,469,791 1,481,122 1,501,086 3,307,152 3,282,194 3,299,211存款(1) customers(1)
未償還可轉讓 Negotiable 136,320 140,614 137,935 49,515 88,912 92,764 185,835 229,526 230,699存款證 certificates of
deposit outstanding其他 Other 516,337 535,339 519,511 175,443 189,657 211,601 691,780 724,995 731,112
負債 liabilities負債總額 Total liabilities 2,906,407 2,862,918 2,823,170 3,134,393 3,112,763 3,171,896 6,040,800 5,975,681 5,995,066
資產 Assets紙幣及 Notes and 11,203 9,957 10,666 1,771 1,533 1,780 12,974 11,489 12,446
硬幣 coins香港銀行 Amount due from 277,790 249,424 248,824 164,445 145,342 145,530 442,236 394,766 394,354
同業貸款 authorizedinstitutionsin Hong Kong
境外銀行同業 Amount due from 107,295 101,227 102,969 1,931,306 1,768,554 1,776,496 2,038,601 1,869,782 1,879,465貸款 banks aboard
客戶貸款 Loans and 1,657,599 1,609,845 1,596,233 493,676 449,858 448,163 2,151,275 2,059,704 2,044,396及墊款 advances
to customers可轉讓 Negotiable 89,372 91,633 86,123 42,797 52,171 53,295 132,169 143,804 139,419
存款證 certificateof deposit held
其他可轉讓 Negotiable debt 400,352 416,685 412,340 580,110 731,393 746,138 980,461 1,148,078 1,158,477債務工具 instrument(可轉讓存 held (Other款證除外) than NCDs)
政府票據 Government 248,025 251,132 249,714 87,600 89,044 91,073 335,625 340,176 340,786 及債券 bills, notes
and bonds其他債務 Other debt 152,327 165,554 162,626 492,509 642,349 655,065 644,836 807,902 817,691 工具 instruments
其他資產 Other assets 215,903 242,539 234,040 67,180 105,519 132,471 283,083 348,058 366,509
資產總額 Total assets 2,759,514 2,721,310 2,691,194 3,281,286 3,254,372 3,303,872 6,040,800 5,975,681 5,995,066
已運作的認可機構數目 - - - - - - 234 219 219Number of authorized institutions in operation本地分行數目 - - - - - - 1 466 1 387 1 382Number of local branches
註釋 : 數字指所有認可機構。 Notes : Figures refer to all authorized institutions.(1) 所列數字並未就外幣掉期存款作出調整,
調整後的數字刊於表 7.3。 are published in Table 7.3.資料來源: Source : Hong Kong Monetary Authority
(Enquiry Telephone No.: 2878 8222)(查詢電話:2878 8222)
香港金融管理局
(1) Unadjusted for foreign currency swap deposits, adjusted figures
134香港統計月刊 二零零三年六月 Hong Kong Monthly Digest of Statistics June 2003

7.5 對其他認可機構的負債Liabilities due to Other Authorized Institutions
百萬港元
HK$ million
即期及通知存款 三個月內償還或提取的存款
Payable on demand and money at call Repayable or callable within 3 months 年 季(期末數字) 外幣 外幣As at end of 港元 Foreign 總計 Foreign 總計
Year HK$ currency Total currency Total
2000 11,611 1,311 12,922 146,325 482,2462001 11,431 1,471 12,903 163,294 411,1622002 12,037 4,960 16,997 142,695 344,8522002 1 20,041 6,315 26,356 161,714 409,631
2 12,998 8,523 21,521 123,075 368,6863 13,023 8,100 21,123 126,137 329,2064 12,037 4,960 16,997 142,695 344,852
2003 1 20,383 11,095 31,479 119,134 325,371
超過三個月償還或提取的存款 總計
Repayable or callable later than 3 months Total 年 季(期末數字) 外幣 外幣As at end of 港元 Foreign 總計 Foreign 總計
Year HK$ currency Total currency Total
2000 32,113 15,541 47,654 163,177 542,8222001 30,704 15,065 45,769 179,830 469,8342002 22,372 9,678 32,050 157,333 393,8992002 1 21,755 17,068 38,823 185,097 474,810
2 25,584 15,537 41,121 147,135 431,3283 24,443 12,850 37,293 147,086 387,6224 22,372 9,678 32,050 157,333 393,899
2003 1 23,997 14,956 38,953 145,185 395,803註釋 : 數字指所有認可機構。 Note : Figures refer to all authorized institutions.
資料來源: 香港金融管理局 Source : Hong Kong Monetary Authority(查詢電話:2878 8222) (Enquiry Telephone No.: 2878 8222)
245,611203,069
Quarter
Quarter
202,157
港元HK$
202,157
206,237
335,921
250,617
290,004236,566289,713
236,566
284,193240,535
379,645
247,868
247,917
港元HK$
135香港統計月刊 二零零三年六月 Hong Kong Monthly Digest of Statistics June 2003

7.6 按用途劃分的貸款及墊款 Loans and Advances by Type
百萬港元
HK$ million 香港貨物的出入口 香港境外的商品 在香港使用
及轉口融資 貿易融資 的貸款及墊款
To finance imports to and To finance merchandising trade Loans and advances exports and re-exports not touching Hong Kong for use in Hong Kong
from Hong Kong年 季
外幣 外幣 外幣
港元 Foreign 總計 港元 Foreign 總計 港元 Foreign 總計
Year HK$ currency Total HK$ currency Total HK$ currency Total
2000 42,784 50,985 93,769 1,478 8,577 10,055 1,581,581 279,884 1,861,4652001 38,871 41,791 80,662 1,437 6,516 7,953 1,585,969 204,094 1,790,0632002 36,730 45,015 81,744 1,438 7,692 9,130 1,552,462 190,407 1,742,8692002 1 37,065 41,141 78,207 1,365 6,756 8,121 1,596,142 198,344 1,794,486
2 39,353 44,408 83,760 1,458 7,394 8,853 1,580,279 198,439 1,778,7193 39,800 45,181 84,981 1,544 7,807 9,351 1,556,784 190,370 1,747,1534 36,730 45,015 81,744 1,438 7,692 9,130 1,552,462 190,407 1,742,869
2003 1 37,303 46,262 83,565 1,501 7,789 9,289 1,544,014 188,559 1,732,573
其他在香港境外 其他使用地區 貸款及墊款總額
使用的貸款 不明確的貸款 Total loans and advances Other loans Other loans
for use outside Hong Kong where the place of use is not known
年 季外幣 外幣 外幣
港元 Foreign 總計 港元 Foreign 總計 港元 Foreign 總計
Year HK$ currency Total HK$ currency Total HK$ currency Total
2000 22,490 454,726 477,216 3,859 15,087 18,946 1,652,191 809,259 2,461,4502001 18,997 277,691 296,688 2,410 7,209 9,619 1,647,684 537,301 2,184,9862002 22,663 210,071 232,735 2,373 7,474 9,847 1,615,667 460,659 2,076,3252002 1 22,369 244,285 266,655 2,419 7,869 10,287 1,659,361 498,396 2,157,757
2 22,900 242,250 265,150 2,563 6,893 9,456 1,646,553 499,385 2,145,9383 25,278 222,121 247,399 2,552 6,514 9,066 1,625,957 471,992 2,097,9504 22,663 210,071 232,735 2,373 7,474 9,847 1,615,667 460,659 2,076,325
2003 1 22,713 196,618 219,332 4,315 10,631 14,946 1,609,845 449,858 2,059,704註釋 : 數字指所有認可機構。 Note : Figures refer to all authorized institutions.
資料來源: 香港金融管理局 Source : Hong Kong Monetary Authority(查詢電話:2878 8222) (Enquiry Telephone No.: 2878 8222)
Quarter As at end of
(期末數字)
As at end of
(期末數字)
Quarter
136香港統計月刊 二零零三年六月 Hong Kong Monthly Digest of Statistics June 2003

7.7 按經濟行業劃分在香港使用的貸款及墊款(1)
Loans and Advances for Use in Hong Kong by Economic Sector(1)
百萬港元
HK$ million
季末數字
As at end of quarter2002 2002 2003
第一季 第四季 第一季
經濟行業 Economic Sector 1st Qtr 4th Qtr 1st Qtr
製造業 Manufacturing 72,042 70,668 71,673
農業及漁業 Agriculture and fisheries 842 412 477
運輸及運輸設備 Transport and transport equipment 102,792 104,129 101,898
電力、氣體燃料及電訊 Electricity, gas and telecommunications 54,755 56,233 55,764
建造業及物業發展與投資 Building, construction, propertydevelopment and investment
物業發展與投資 Property development and investment工業 Industrial 7,097 7,229 6,825住宅 Residential 169,552 168,975 168,506商業 Commercial 105,020 111,430 108,485其他物業 Other properties 84,599 72,439 74,566小計 Sub-total 366,268 360,073 358,382
其他 Others 20,528 18,873 19,611總額 Total 386,796 378,945 377,993
批發及零售業 Wholesale and retail trade 102,582 100,328 102,657
採礦及採石業 Mining and quarrying 108 182 173
其他經濟行業 Miscellaneous
酒店、旅舍及飲食業 Hotels, boarding houses and catering 40,713 42,593 41,551與財務及金融有關公司 Financial concerns (other than all 142,448 125,465 125,545 (認可機構除外)(2) authorized institutions)(2)
證券經紀 Stockbrokers 9,059 8,360 8,715專業人士及個人 Professionals and private individuals
購買「居者有其屋計 to purchase flats under the Home 105,062 99,214 96,339 劃」、「私人機構 Ownership Scheme, the Private 參建居屋計劃」及 Sector Participation Scheme 「租者置其屋計劃 and the Tenants Purchase Scheme 」單位
購買其他住宅樓宇 to purchase other residential properties 541,933 542,431 536,876信用卡墊款 for credit card advances 53,213 51,361 47,418其他商業用途 for other business purposes 13,434 12,002 12,265其他私人用途 for other private purposes 85,040 80,053 79,079小計 Sub-total 798,682 785,060 771,977
其他 All others 83,666 70,493 74,149總額 Total 1,074,569 1,031,971 1,021,936
所有經濟行業 Overall 1,794,486 1,742,869 1,732,573
註釋 : Notes :(1) Excluding loans and advances for trade financing.(2)
資料來源: Source :
Figures refer to all authorized institutions.
Excluding loans and advances to purchase shares, which areincluded in item "All others" under "Miscellaneous".
數字指所有認可機構。 (1) 不包括貿易融資的貸款及墊款。
(2) 不包括買股票的貸款及墊款,此項貸款及墊款
列入其他經濟行業內的其他項目。
香港金融管理局 (查詢電話:2878 8222)
Hong Kong Monetary Authority (Enquiry Telephone No.: 2878 8222)
137香港統計月刊 二零零三年六月 Hong Kong Monthly Digest of Statistics June 2003

7.8 外匯頭寸Foreign Currency Positions
百萬港元
HK$ million 年
(期末數字) 現貨資產 未平倉淨額As at end of Spot Open
Year assets position
2000 4,090,855 +54,2232001 3,699,675 +78,2032002 3,742,703 +89,7172002 1 3,478,525 +54,378
2 3,611,161 +67,4093 3,540,466 +78,7824 3,742,703 +89,717
2003 1 3,503,636 +88,041註釋 : 數字指所有認可機構。 Notes : Figures refer to all authorized institutions.
(+) 代表淨資產。 (+) Denotes net assets.(-) 代表淨負債。 (-) Denotes net liabilities.
資料來源: 香港金融管理局 Source : Hong Kong Monetary Authority(查詢電話:2878 8222) (Enquiry Telephone No.: 2878 8222)
7.9 港元利率Hong Kong Dollar Interest Rates
年率
% per annum
儲蓄存款
年 利率 最優惠
Savings 貸款利率
一星期 一個月 三個月 六個月 十二個月 deposits Best lendingYear 1 week 1 month 3 months 6 months 12 months rate rate
2000 4.39 5.40 4.47 9.222001 2.10 2.53 2.16 7.002002 0.16 0.74 0.14 5.112002 0.21 1.39 0.16 5.13
0.17 1.41 0.16 5.13 0.17 1.02 0.16 5.13 0.17 0.74 0.16 5.13 0.17 0.56 0.16 5.13 0.16 0.44 0.16 5.13 0.16 0.43 0.16 5.13 0.17 0.48 0.16 5.13 0.10 0.30 0.07 5.03 0.09 0.25 0.03 5.00
2003 0.08 0.21 0.03 5.00 0.08 0.19 0.03 5.00 0.08 0.17 0.03 5.00 0.08 0.17 0.03 5.00 0.08 0.14 0.03 5.00
註釋: 期內平均數字。 Note : Period average figures.
資料來源: 香港金融管理局 Source : Hong Kong Monetary Authority(查詢電話:2878 8222) (Enquiry Telephone No.: 2878 8222)
0.08 0.09 0.09 0.08
0.31 0.32 0.33 0.37
0.55 0.45 0.34 0.29
4.80 2.36 0.34
4.97
20.12
0.62 0.84
0.36
0.16
0.20 0.24
0.38
0.46
11
1 0.11
0.40
0.16 0.13 0.10
8 0.399
10
76
3
Month
4
-93,373
6,663,5496,626,7996,485,376
-90,981-33,965-52,154
+147,751+158,390
+141,871
6,711,283
6,574,6456,584,999 6,678,372
6,642,867 3,507,298
3,330,7746,845,069 3,452,771
3,600,832
遠期未平倉現貨未平倉淨額
Net spotposition
淨額Net forward
3,890,630 +200,2256,857,285+192,377
2.39 5.13
+141,871
6,936,050
6,757,0416,626,799
+112,747
Time and savings deposit rates on deposits of less than HK$100,000
季遠期沽出額
ForwardsalesQuarter
Spotliabilities
現貨負債遠期買入額Forward
-52,154
purchases position
-146,002-114,174
6,629,584 3,427,719
少於十萬港元的定期及儲蓄存款利率
6,574,6456,468,467
3,600,832
0.130.120.09
0.50
0.090.09
0.40
0.14
0.37
0.82
54 0.10
0.43 0.58 0.36
0.41
0.43 0.44
3
2.36
12
50.56
0.19 0.15
(期內數字)During
-16,909
月
3,398,686 +104,950
138香港統計月刊 二零零三年六月 Hong Kong Monthly Digest of Statistics June 2003

7.10 香港銀行同業拆息及票據交換Hong Kong Interbank Offered Rates and Clearing House Transactions
數目 數額
一個月 六個月 (以千張計) (百萬港元)
年 季 隔夜 One Six Items ValueYear Overnight month months (thousand) (HK$ million)
2000 7.13 6.06 5.692001 2.69 1.94 1.942002 1.50 1.41 1.472002 1 2.06 2.00 2.47
2 1.75 1.72 1.883 1.81 1.81 1.724 1.50 1.41 1.47
2003 1 1.25 1.31 1.25註釋 : (1) 是指中間利率,即借入利率和拆出利率的平均數。 Note : (1) It refers to the middle rate which is the average of bid rate and
offered rate.
資料來源: 香港金融管理局; Sources : Hong Kong Monetary Authority;香港銀行同業結算有限公司 Hong Kong Interbank Clearing Limited(如有查詢,請致電政府統計處。 (For enquiries, please call Census and Statistics Department.查詢電話:2582 4738) Enquiry Telephone No.: 2582 4738)
7.11 對外負債及債權External Liabilities and Claims
百萬港元
HK$ million
Liabilities to non-bank customers non-bank customers
年 季 outside Hong Kong (期末數字) 外幣 外幣 外幣
港元 Foreign Foreign ForeignYear HK$ currencies currencies currencies
2000 231,970 1,558,463 2,535,442 684,5722001 175,440 1,313,528 2,320,041 579,3402002 161,215 1,270,879 2,212,255 583,5522002 1 146,974 1,307,900 2,190,221 549,179
2 151,208 1,320,393 2,184,663 614,1553 154,310 1,263,289 2,131,998 595,9514 161,215 1,270,879 2,212,255 583,552
2003 1 149,816 1,241,301 2,177,887 580,563註釋 : 數字指所有認可機構。 Note : Figures refer to all authorized institutions.
資料來源: 香港金融管理局 Source : Hong Kong Monetary Authority(查詢電話:2878 8222) (Enquiry Telephone No.: 2878 8222)
407,894 95,334413,798 94,302
1.31
6.38 2.00
Quarter
一星期
Oneweek
5.75 1.88 1.41
三個月
Threemonths
192 680
199 115195 552
香港銀行同業拆息(1)(年率)
Hong Kong interbank offered rate(1)(% per annum) 期末息率
Rates at end of period
票據交換
Articles cleared by clearing house
外幣
80,969
105,683,06398,349,05792,300,408
Claims on
outside Hong Kong
24,049,23348 906
396,915 94,238
90,73690,143
616,725495,291169,988
185,601
港元
HK$
77,15979,466
201,199
Foreigncurrencies HK$
港元
Quarter
Claims on banks
港元
HK$As at end of
outside Hong Kong outside Hong Kong Liabilities to banks
所持債權
對香港境外銀行
所負債務
1.31 1.25 1.28
1.41
對香港境外非銀行
客戶所負債務 客戶所持債權
1.78
對香港境外銀行
1.81
對香港境外非銀行
48 76221,509,30246 10522,667,748
21,696,412 1.63 23,887,014 1.94
48 290 2.191.75
46 721
401,643 95,049396,915 94,238406,589202,361 81,985 88,828
79,466
190,074192,311185,601
171,838 77,55077,82578,950
139香港統計月刊 二零零三年六月 Hong Kong Monthly Digest of Statistics June 2003

7.12 外幣兌換率及港匯指數Exchange Rates and the Effective Exchange Rate Indices
(每單位外幣兌換港元)
(HKD per unit of foreign currency)
南韓圓
澳元 加拿大元 日圓 Republic 新加坡元 瑞士法郎
年 月 Australian Canadian Japanese of Korea Singapore SwissYear Month Dollar Dollar Yen Won Dollar Franc
2000 4.53 5.25 0.0723 0.0069 4.52 4.622001 4.04 5.04 0.0643 0.0060 4.36 4.632002 4.25 4.97 0.0625 2.04 0.229 0.156 11.73 0.0063 4.36 5.032002 3 4.08 4.92 0.0595 0.0059 4.27 4.65
4 4.18 4.94 0.0597 0.0059 4.27 4.725 4.29 5.03 0.0617 0.0062 4.33 4.916 4.44 5.10 0.0633 0.231 0.162 11.57 0.0064 4.38 5.077 4.32 5.05 0.0661 0.235 0.162 12.13 0.0066 4.45 5.298 4.23 4.97 0.0656 0.234 0.158 11.99 0.0065 4.45 5.219 4.27 4.96 0.0647 0.229 0.155 12.13 0.0064 4.42 5.22
10 4.29 4.94 0.0629 0.227 0.152 12.14 0.0063 4.37 5.2211 4.38 4.97 0.0642 0.227 0.149 12.26 0.0064 4.42 5.3212 4.39 5.00 0.0640 2.04 0.228 0.150 12.37 0.0065 4.45 5.42
2003 1 4.54 5.06 0.0657 2.04 0.229 0.150 12.59 0.0066 4.49 5.672 4.64 5.16 0.0653 2.04 0.229 0.148 12.56 0.0065 4.47 5.733 4.70 5.28 0.0657 2.04 0.228 0.145 12.34 0.0063 4.45 5.734 4.75 5.35 0.0651 2.04 0.224 0.145 12.28 0.0064 4.39 5.665 5.05 5.64 0.0664 2.04 0.219 0.150 12.66 0.0065 4.50 5.95
貿易總值
(進口及整體 進口貨值 整體出口
泰銖 美元 出口)加權 加權 貨值加權
年 月 Thai U.S. 歐元 Trade (import and Import- Export-Year Month Baht Dollar Euro export) - weighted weighted weighted
2000 0.194 7.791 7.20 101.7 101.5 101.92001 0.175 7.799 6.99 104.7 105.1 104.32002 0.182 7.799 7.38 105.84 104.0 104.7 103.32002 3 0.180 7.799 6.84 105.9 106.6 105.2
4 0.180 7.799 6.91 105.7 106.5 104.95 0.182 7.799 7.15 104.6 105.2 103.96 0.185 7.799 7.45 103.5 104.1 102.97 0.189 7.799 7.74 102.3 102.7 101.88 0.185 7.799 7.63 102.7 103.2 102.39 0.182 7.799 7.65 105.82 103.0 103.6 102.4
10 0.179 7.799 7.64 105.82 103.5 104.3 102.711 0.180 7.799 7.81 105.82 102.9 103.6 102.212 0.180 7.798 7.95 105.82 102.7 103.4 101.9
2003 1 0.182 7.799 8.28 105.82 101.7 102.4 100.92 0.182 7.799 8.41 105.82 101.7 102.5 100.83 0.182 7.798 8.42 105.82 101.8 102.6 100.94 0.182 7.799 8.47 105.82 101.9 102.9 100.95 0.185 7.798 9.03 105.82 100.7 101.8 99.6
註釋: Notes :
(1) (1)
資料來源: 政府統計處貿易資料分析組 Sources : Trade Analysis Section, Census and Statistics Department(查詢電話:2582 4918); (Enquiry Telephone No.: 2582 4918 );香港金融管理局 Hong Kong Monetary Authority (查詢電話:2878 8222) (Enquiry Telephone No.: 2878 8222)
10.96336
9.74945
2.04
10.3754810.14424
10.10470
2.04
0.228 0.159
(per HK$100)
人民幣
DrawingChinese
(January 2000 = 100)
(二零零零年一月=100)
0.225
(每百港元)
11.39
9.9283610.27532
港匯指數(1)
2.04
特別
提款權
Effective exchange rate indices for HK dollar(1)(每單位外幣兌換港元)
11.25
11.240.1800.157
11.10
11.810.248
英鎊
PoundSterling
新台幣
NewTaiwanDollar
菲律賓
披索
PhilippinePeso
0.1560.156
(HKD per unit of foreign currency)
105.82
106.17
Special
9.80108
106.04
2.04
2.04
0.226
Right
2.04
2.04
2.04
0.232
Renminbi
2.04
2.04
馬來西亞元
MalaysianRinggit
2.04
Figures are the averages of the daily closing middle-market rates for therespective period. They are based on the telegraphic transfer rates except thosefor the New Taiwan Dollar and Philippine Peso which are based on notes rates.
數字是指期內每日收市中間價的平均值。除新台幣及菲律賓披索的數字是基於現鈔價外,其餘的都是基於電匯價。
105.82
105.82
105.82
10.3077810.30638
9.96041105.82105.82
由二零零二年一月二日起公布的新系列。詳情請參閱刊載於本月刊二零零一年十二月號題為「新系列港幣匯率指數」的專題文章。
New series released since 2 January 2002. For details, please see the featurearticle entitled "New Series of Effective Exchange Rate Index for the HongKong Dollar" in the December 2001 issue of this publication.
10.3812510.27635
10.68814
10.4498710.64860
10.6838810.67753
香港統計月刊 二零零三年六月 140 Hong Kong Monthly Digest of Statistics June 2003

7.13 二零零三年五月份外幣兌換率及港匯指數Exchange Rates and the Effective Exchange Rate Indices inMay 2003
(HKD per unit of foreign currency)
菲律賓
新台幣 披索 南韓圓
當日收市 澳元 加拿大元 日圓 馬來西亞元 New Philip- 英鎊 Republic 新加坡元 瑞士法郎
As at end Australian Canadian Japanese Malaysian Taiwan pine Pound of Korea Singapore Swissof day Dollar Dollar Yen Ringgit Dollar Peso Sterling Won Dollar Franc
五月 May
2 4.92 5.49 0.0657 2.04 0.219 0.150 12.55 0.0064 4.41 5.793 4.92 5.49 0.0655 2.04 0.218 0.150 12.50 0.0064 4.40 5.80
5 4.92 5.50 0.0656 2.04 0.218 0.150 12.50 0.0064 4.42 5.796 4.97 5.54 0.0658 2.04 0.218 0.150 12.54 0.0065 4.47 5.827 5.00 5.60 0.0663 2.04 0.218 0.150 12.58 0.0065 4.48 5.879 5.03 5.59 0.0664 2.04 0.218 0.150 12.53 0.0065 4.49 5.94
10 5.02 5.60 0.0664 2.04 0.218 0.150 12.52 0.0065 4.49 5.93
12 5.07 5.63 0.0669 2.04 0.218 0.150 12.57 0.0065 4.50 5.9913 5.02 5.60 0.0667 2.04 0.220 0.150 12.52 0.0065 4.50 5.9314 5.02 5.62 0.0668 2.04 0.220 0.150 12.53 0.0065 4.50 5.9015 5.03 5.66 0.0673 2.04 0.220 0.150 12.61 0.0065 4.53 5.9016 5.00 5.64 0.0670 2.04 0.220 0.150 12.64 0.0065 4.52 5.9017 5.08 5.71 0.0672 2.04 0.220 0.150 12.64 0.0065 4.52 5.96
19 5.12 5.76 0.0677 2.04 0.220 0.150 12.73 0.0065 4.53 6.0220 5.11 5.74 0.0665 2.04 0.220 0.150 12.74 0.0065 4.50 6.0121 5.14 5.80 0.0668 2.04 0.220 0.150 12.81 0.0065 4.53 6.0522 5.11 5.73 0.0662 2.04 0.220 0.150 12.74 0.0065 4.52 6.0023 5.12 5.67 0.0665 2.04 0.220 0.150 12.74 0.0065 4.53 6.0024 5.15 5.68 0.0667 2.04 0.220 0.150 12.75 0.0065 4.53 6.05
26 5.14 5.67 0.0667 2.04 0.220 0.150 12.78 0.0065 4.53 6.0427 5.15 5.68 0.0667 2.04 0.220 0.150 12.79 0.0065 4.52 6.0628 5.12 5.67 0.0665 2.04 0.220 0.150 12.79 0.0065 4.52 6.0529 5.03 5.62 0.0656 2.04 0.220 0.150 12.75 0.0065 4.50 5.9930 5.10 5.70 0.0659 2.04 0.220 0.150 12.89 0.0065 4.51 6.0631 5.09 5.70 0.0655 2.04 0.220 0.151 12.76 0.0065 4.50 6.01
(每單位外幣兌換港元)
香港統計月刊 二零零三年六月 141 Hong Kong Monthly Digest of Statistics June 2003

7.13 (續) 二零零三年五月份外幣兌換率及港匯指數(Cont'd.) Exchange Rates and the Effective Exchange Rate Indices in
May 2003
港匯指數(1)
(二零零零年一月=100)
(每單位外幣兌換港元) Effective exchange rate indices for HK dollar(1)
(HKD per unit of foreign currency) (January 2000 = 100)
特別 貿易總值
提款權 (進口及整體 進口貨值 整體出口
當日收市 泰銖 美元 Special 出口)加權 加權 貨值加權
As at end Thai U.S. 歐元 Drawing Trade (import and Import- Export-of day Baht Dollar Euro Right export) - weighted weighted weighted
五月 May
2 0.182 7.798 8.75 10.85341 105.82 101.4 102.5 100.33 0.182 7.798 8.75 - 105.82 101.5 102.6 100.3
5 0.183 7.799 8.75 10.85831 105.82 101.4 102.5 100.36 0.183 7.799 8.82 10.88631 105.82 101.2 102.3 100.17 0.184 7.798 8.90 10.91658 105.82 101.0 102.1 99.99 0.184 7.798 8.96 10.94286 105.82 100.9 102.0 99.8
10 0.184 7.798 8.95 - 105.82 100.9 102.0 99.8
12 0.184 7.798 9.04 10.98941 105.82 100.7 101.8 99.613 0.184 7.797 8.96 10.95673 105.82 100.8 101.9 99.714 0.185 7.799 8.95 10.95674 105.82 100.8 101.8 99.715 0.185 7.798 8.93 10.96835 105.82 100.7 101.7 99.616 0.185 7.799 8.89 10.95253 105.82 100.8 101.8 99.717 0.185 7.797 9.03 - 105.82 100.6 101.7 99.5
19 0.186 7.798 9.12 11.05842 105.82 100.3 101.4 99.220 0.186 7.799 9.08 11.02490 105.82 100.6 101.7 99.421 0.186 7.799 9.13 11.05493 105.82 100.4 101.5 99.222 0.185 7.798 9.08 11.03589 105.82 100.6 101.7 99.423 0.186 7.798 9.11 11.07581 105.82 100.5 101.7 99.424 0.186 7.797 9.22 - 105.82 100.4 101.5 99.2
26 0.187 7.798 9.21 10.67008 105.82 100.4 101.5 99.227 0.187 7.798 9.25 11.12151 105.82 100.4 101.5 99.128 0.187 7.798 9.21 11.03394 105.82 100.4 101.6 99.229 0.187 7.798 9.16 11.03986 105.82 100.7 101.9 99.530 0.187 7.797 9.26 11.07135 105.82 100.5 101.7 99.231 0.187 7.797 9.19 - 105.82 100.6 101.8 99.4
註釋: 數字是指當日收巿的中間價。除新台幣及菲律賓披索 Notes :的數字是基於現鈔價外,其餘的都是基於電匯價。若
某日為非交易日,例如公眾假期,則沒有數字列出。
(1) 由二零零二年一月二日起公布的新系列。詳情請 (1)
參閱刊載於本月刊二零零一年十二月號題為「新
系列港幣匯率指數」的專題文章。
資料來源: 政府統計處貿易資料分析組 Sources : Trade Analysis Section, Census and Statistics Department(查詢電話:2582 4918); (Enquiry Telephone No.: 2582 4918);香港金融管理局 Hong Kong Monetary Authority (查詢電話:2878 8222) (Enquiry Telephone No.: 2878 8222)
New series released since 2 January 2002. For details, please see thefeature article entitled "New Series of Effective Exchange Rate Index forthe Hong Kong Dollar" in the December 2001 issue of this publication.
Figures are the closing middle-market rates for the respective day. 'Theyare based on the telegraphic transfer rates except those for the NewTaiwan Dollar and Philippine Peso which are based on notes rates. 'Fornon-trading days such as public holidays, no figures are quoted.
(per HK$100)
人民幣
(每百港元)
ChineseRenminbi
香港統計月刊 二零零三年六月 142 Hong Kong Monthly Digest of Statistics June 2003

7.14 股票價格指數、成交金額及市場總值Index of Share Prices, Turnover and Market Capitalisation
主板
Main Board恒生指數 - 分類指數
Hang Seng Index - Sectoral Sub-indices(31.7.1964=100)
恒生指數 工商
年 月 日 Hang Seng Index 金融 公用 地產 CommerceYear Month Day (31.7.1964=100) Finance Utilities Properties and industry
2000 15 095.53 24 041.66 21 704.53 18 362.44 8 151.692001 11 397.21 19 497.67 20 498.86 15 554.75 5 508.822002 9 321.29 18 231.16 21 970.53 11 103.88 4 043.952002 3 11 032.92 19 298.93 21 981.71 14 165.37 5 278.08
4 11 497.58 19 873.54 21 555.34 15 785.88 5 473.505 11 301.94 20 132.65 22 461.13 14 834.55 5 295.126 10 598.55 19 080.83 21 938.30 14 006.68 4 882.337 10 267.36 18 985.65 21 694.84 13 463.03 4 623.718 10 043.87 18 891.59 22 408.98 12 039.81 4 550.569 9 072.21 17 342.58 23 300.70 10 765.42 3 963.25
10 9 441.25 18 261.79 22 646.33 11 349.16 4 117.8211 10 069.87 19 420.12 22 310.25 12 404.48 4 430.7912 9 321.29 18 231.16 21 970.53 11 103.88 4 043.95
2003 1 9 258.95 17 783.00 21 767.25 10 866.22 4 108.252 9 122.66 18 051.47 21 873.38 10 613.84 3 927.953 8 634.45 17 360.55 22 277.22 9 508.43 3 664.974 8 717.22 17 999.09 21 962.01 9 329.46 3 644.435 9 487.38 19 526.50 22 723.32 10 224.61 4 012.81
2003 5 2 8 808.18 18 097.30 22 130.61 9 487.19 3 699.375 8 916.49 18 240.61 22 213.38 9 665.22 3 763.436 8 889.22 18 253.25 21 861.19 9 654.32 3 742.787 8 901.05 18 393.76 21 856.11 9 541.22 3 734.869 9 084.16 18 822.03 22 233.29 9 669.56 3 809.62
12 9 155.57 18 798.95 22 374.89 9 846.78 3 870.6613 9 119.04 18 702.17 22 271.26 9 803.88 3 861.3614 9 103.69 18 825.92 22 385.85 9 829.44 3 807.7015 9 126.07 18 907.16 22 492.55 9 850.66 3 807.2416 9 093.18 18 828.94 22 393.74 9 795.68 3 798.7019 9 087.37 18 957.83 22 501.76 9 635.27 3 775.3620 9 050.40 18 775.91 22 715.16 9 575.63 3 777.4121 9 059.80 18 859.27 22 797.93 9 555.33 3 767.3422 9 131.49 18 846.94 22 953.82 9 650.03 3 834.8023 9 303.73 19 083.01 23 006.51 9 935.78 3 937.0326 9 492.71 19 307.52 22 995.54 10 257.39 4 058.9027 9 420.81 19 214.89 22 939.79 10 143.66 4 015.3128 9 510.62 19 523.24 22 860.09 10 231.02 4 034.3529 9 508.55 19 596.19 22 807.83 10 208.77 4 018.6430 9 487.38 19 526.50 22 723.32 10 224.61 4 012.81
143香港統計月刊 二零零三年六月 Hong Kong Monthly Digest of Statistics June 2003

7.14 (續) 股票價格指數、成交金額及市場總值(Cont'd.) Index of Share Prices, Turnover and Market Capitalisation
主板 --- 續Main Board --- cont'd恒生綜合指數系列(1)
Hang Seng Composite Index Series(1)
恒生香港綜合指數
Hang Seng Hong Kong Composite Index恒生 恒生香港 恒生香港 恒生香港 恒生香港
綜合指數 綜合指數 大型股指數 中型股指數 小型股指數
Hang Seng Hang Seng Hong Kong Hang Seng HK Hang Seng HK Hang Seng HK 年 月 日 Composite Index Composite Index LargeCap Index MidCap Index SmallCap IndexYear Month Day (3.1.2000=2 000) (3.1.2000=2 000) (3.1.2000=2 000) (3.1.2000=2 000) (3.1.2000=2 000)
2000 - - - - -2001 1 346.16 1 420.52 1 442.51 1 461.54 1 025.012002 1 130.24 1 215.84 1 211.09 1 345.87 956.932002 3 1 326.22 1 411.36 1 407.07 1 568.61 1 079.56
4 1 384.17 1 473.27 1 461.37 1 680.19 1 119.465 1 370.93 1 457.51 1 439.13 1 671.22 1 171.816 1 291.34 1 371.56 1 350.85 1 598.83 1 083.897 1 239.06 1 325.68 1 321.89 1 489.35 972.858 1 205.89 1 284.89 1 280.99 1 448.43 934.159 1 095.45 1 176.46 1 175.38 1 303.39 878.11
10 1 132.35 1 223.59 1 225.49 1 349.24 889.4411 1 205.19 1 302.40 1 308.66 1 407.49 960.7312 1 130.24 1 215.84 1 211.09 1 345.87 956.93
2003 1 1 134.58 1 210.19 1 195.16 1 378.43 991.932 1 121.90 1 209.90 1 193.39 1 374.79 1 018.613 1 066.64 1 154.32 1 132.73 1 341.84 971.174 1 070.77 1 167.22 1 150.66 1 339.87 957.425 1 171.92 1 265.66 1 243.58 1 458.47 1 079.21
2003 5 2 1 081.46 1 179.41 1 160.48 1 362.32 975.915 1 096.46 1 193.01 1 173.23 1 378.32 994.816 1 093.33 1 191.00 1 170.54 1 378.83 995.777 1 093.53 1 190.48 1 172.63 1 364.48 994.249 1 111.51 1 211.00 1 197.50 1 369.04 996.01
12 1 121.22 1 219.07 1 205.45 1 378.33 1 002.5513 1 119.77 1 215.84 1 199.36 1 386.00 1 010.6714 1 117.97 1 217.34 1 201.96 1 382.61 1 009.5715 1 121.08 1 221.33 1 206.74 1 381.70 1 015.0616 1 118.45 1 217.90 1 200.99 1 386.03 1 023.3019 1 119.27 1 221.52 1 203.67 1 390.66 1 036.9920 1 116.47 1 215.20 1 195.44 1 392.44 1 036.3721 1 120.31 1 218.35 1 198.01 1 395.18 1 048.2322 1 130.81 1 223.26 1 201.93 1 403.41 1 058.1523 1 149.48 1 242.58 1 221.85 1 426.36 1 060.5226 1 173.96 1 263.17 1 241.17 1 454.86 1 078.3127 1 163.98 1 254.23 1 232.38 1 443.64 1 073.2028 1 173.99 1 266.66 1 246.56 1 452.02 1 072.0129 1 172.01 1 266.17 1 246.50 1 451.42 1 066.1630 1 171.92 1 265.66 1 243.58 1 458.47 1 079.21
144香港統計月刊 二零零三年六月 Hong Kong Monthly Digest of Statistics June 2003

7.14 (續) 股票價格指數、成交金額及市場總值(Cont'd.) Index of Share Prices, Turnover and Market Capitalisation
主板 --- 續Main Board --- cont'd
恒生綜合指數系列(1) --- 續Hang Seng Composite Index Series(1) --- cont'd
恒生中國內地綜合指數 恒生綜合行業指數
Hang Seng Mainland Composite Index Hang Seng Composite Industry Indices恒生中國 恒生中國 恒生香港
內地綜合指數 企業指數 中資企業指數
Hang Seng Hang Seng China Hang Seng China- 資源礦產業 工業製品業 消費品製造業
Mainland Enterprises Affiliated Oil & Industrial Consumer 年 月 日 Composite Index Index Corp. Index Resources Goods GoodsYear Month Day (3.1.2000=2 000) (3.1.2000=2 000) (3.1.2000=2 000) (3.1.2000=2 000) (3.1.2000=2 000) (3.1.2000=2 000)
2000 - 1 624.13 1 641.24 - - -2001 1 198.31 1 757.75 1 340.45 1 549.61 1 462.32 1 238.262002 950.62 1 990.44 1 011.13 1 966.08 1 472.18 1 353.602002 3 1 151.25 2 034.69 1 252.44 1 945.61 1 846.54 1 376.47
4 1 200.99 2 054.71 1 309.82 2 008.80 1 924.56 1 507.145 1 193.52 2 130.60 1 282.82 2 059.21 1 861.87 1 661.206 1 127.44 2 167.39 1 192.15 2 068.17 1 709.07 1 593.277 1 058.69 2 046.50 1 124.44 2 027.10 1 560.56 1 478.368 1 042.78 1 923.63 1 125.12 2 041.97 1 471.82 1 387.959 925.87 1 890.20 983.09 2 042.63 1 327.83 1 290.02
10 939.72 1 830.95 1 010.71 1 871.64 1 390.93 1 270.3411 999.91 1 907.97 1 084.95 1 859.01 1 497.39 1 354.8612 950.62 1 990.44 1 011.13 1 966.08 1 472.18 1 353.60
2003 1 978.15 2 161.61 1 028.18 2 023.46 1 572.03 1 471.702 936.61 2 197.43 972.97 2 130.03 1 580.99 1 484.943 881.02 2 187.04 904.66 2 080.97 1 546.77 1 476.394 864.58 2 204.85 889.49 2 083.66 1 509.72 1 439.635 975.36 2 460.23 1 003.66 2 246.54 1 717.84 1 632.01
2003 5 2 871.89 2 199.60 898.78 2 090.93 1 539.76 1 462.125 890.77 2 224.00 920.26 2 077.94 1 572.21 1 501.106 884.79 2 202.36 914.33 2 051.07 1 587.88 1 487.087 886.80 2 191.01 919.46 2 072.41 1 547.54 1 464.789 899.02 2 153.79 938.93 2 072.93 1 530.38 1 449.52
12 913.05 2 192.07 954.19 2 094.89 1 556.96 1 466.7213 915.97 2 209.91 954.98 2 107.31 1 567.88 1 492.8314 905.97 2 206.87 941.43 2 114.82 1 569.32 1 500.1115 907.01 2 218.94 941.17 2 120.06 1 568.89 1 509.4216 906.29 2 221.08 938.90 2 121.51 1 586.20 1 527.3719 900.24 2 244.17 927.36 2 113.59 1 612.11 1 542.2420 906.01 2 255.69 932.82 2 134.80 1 606.35 1 553.0521 911.64 2 325.30 933.71 2 133.53 1 625.18 1 566.7922 936.23 2 397.99 958.76 2 219.79 1 639.67 1 583.4723 953.83 2 397.63 982.27 2 258.19 1 668.57 1 597.4726 988.61 2 504.81 1 017.09 2 361.98 1 706.58 1 630.6927 975.77 2 457.59 1 004.03 2 279.28 1 711.12 1 601.1928 980.12 2 474.51 1 008.85 2 270.70 1 719.40 1 609.7929 974.39 2 441.20 1 005.62 2 257.18 1 700.02 1 617.3830 975.36 2 460.23 1 003.66 2 246.54 1 717.84 1 632.01
145香港統計月刊 二零零三年六月 Hong Kong Monthly Digest of Statistics June 2003

7.14 (續) 股票價格指數、成交金額及市場總值(Cont'd.) Index of Share Prices, Turnover and Market Capitalisation
主板 --- 續Main Board --- cont'd
恒生綜合指數系列(1) --- 續Hang Seng Composite Index Series(1) --- cont'd
恒生綜合行業指數 --- 續Hang Seng Composite Industry Indices --- cont'd
地產建築業 資訊科技業
服務業 公用事業 金融業 Properties & Information 綜合企業
年 月 日 Services Utilities Financials Construction Technology ConglomeratesYear Month Day (3.1.2000=2 000) (3.1.2000=2 000) (3.1.2000=2 000) (3.1.2000=2 000) (3.1.2000=2 000) (3.1.2000=2 000)
2000 - - - - - -2001 906.09 2 241.51 1 748.35 1 529.18 1 113.28 1 417.442002 671.11 2 418.23 1 627.98 1 100.01 753.39 1 027.472002 3 872.70 2 411.36 1 732.68 1 402.78 1 049.18 1 344.41
4 919.45 2 382.14 1 784.17 1 551.00 1 020.61 1 372.115 893.03 2 489.89 1 806.57 1 468.56 1 000.39 1 335.286 828.65 2 440.53 1 710.51 1 386.79 890.04 1 234.557 767.45 2 406.02 1 691.47 1 321.36 849.91 1 179.938 752.80 2 462.73 1 679.28 1 190.54 831.91 1 136.909 646.09 2 554.97 1 543.85 1 065.45 770.02 1 004.16
10 676.81 2 470.42 1 623.63 1 115.15 784.38 1 051.5311 735.41 2 449.46 1 721.96 1 218.02 818.78 1 125.1212 671.11 2 418.23 1 627.98 1 100.01 753.39 1 027.47
2003 1 680.36 2 407.76 1 589.35 1 086.39 807.63 1 057.052 634.13 2 425.85 1 613.20 1 069.67 789.41 1 040.463 586.36 2 468.65 1 552.20 962.49 729.90 981.214 588.64 2 444.44 1 601.66 951.37 681.68 951.795 656.39 2 546.34 1 739.41 1 043.59 769.49 1 043.63
2003 5 2 595.99 2 457.55 1 609.52 970.15 699.78 964.735 610.23 2 469.13 1 622.48 987.63 715.93 982.896 608.04 2 431.78 1 624.16 986.57 710.37 978.847 608.72 2 429.91 1 635.68 980.17 695.94 970.749 621.03 2 466.25 1 672.40 991.71 702.06 989.06
12 631.48 2 486.98 1 671.40 1 007.14 704.02 1 006.5713 630.22 2 480.86 1 664.18 1 004.14 719.74 1 004.3414 619.38 2 492.89 1 674.09 1 004.99 717.78 992.5415 617.89 2 506.57 1 680.83 1 007.75 712.43 998.2716 615.58 2 498.74 1 674.85 1 003.21 711.54 994.9019 610.67 2 512.16 1 686.24 990.85 720.06 992.8820 612.35 2 532.81 1 671.24 986.16 710.24 991.4321 613.22 2 546.74 1 679.99 985.39 709.56 992.7822 625.60 2 571.77 1 679.70 994.47 706.06 1 004.8423 638.06 2 576.83 1 700.88 1 018.74 732.48 1 031.1426 660.15 2 581.67 1 721.30 1 047.99 757.40 1 054.8327 654.86 2 569.59 1 713.16 1 039.21 761.11 1 042.4528 660.38 2 562.95 1 738.72 1 045.80 751.70 1 048.3629 656.60 2 553.74 1 744.26 1 042.89 758.37 1 038.6630 656.39 2 546.34 1 739.41 1 043.59 769.49 1 043.63
146香港統計月刊 二零零三年六月 Hong Kong Monthly Digest of Statistics June 2003

7.14 (續) 股票價格指數、成交金額及市場總值(Cont'd.) Index of Share Prices, Turnover and Market Capitalisation
標準普爾/ 標準普爾/ 巿價總值(5)
香港交易所大型股(3) 成交金額 香港交易所創業板(4) 成交金額 (百萬港元)
S&P/HKEx (百萬港元) S&P/HKEx (百萬港元) Market 年 日 LargeCap Index(3) Turnover GEM Index(4) Turnover Capitalisation(5)
Year Day (28.2.2003=10 000) (HK$ million) (HK$ million) (28.2.2003=1 000) (HK$ million) (HK$ million)
2000 (6 107.89) 3,047,565.32 ( 309.42) 84,287.13 67,290.062001 (4 885.63) 1,949,943.56 ( 199.42) 39,416.83 60,964.092002 (4 113.06) 1,598,953.31 ( 110.40) 43,979.17 52,220.062002 (4 831.65) 142,566.35 ( 204.49) 4,402.21 69,082.23
(5 038.44) 145,596.53 ( 205.75) 3,689.89 69,956.10(5 010.43) 198,452.38 ( 202.77) 6,400.06 70,423.43(4 716.35) 132,226.85 ( 177.70) 3,106.52 60,520.52(4 507.23) 147,841.02 ( 155.49) 5,720.75 67,448.56(4 389.11) 116,154.70 ( 142.31) 2,671.33 63,077.44(3 996.14) 109,953.96 ( 118.16) 1,638.68 53,398.08(4 117.70) 119,784.64 ( 111.73) 2,263.10 51,096.73(4 370.09) 127,665.98 ( 114.70) 2,111.76 53,569.05(4 113.06) 96,663.63 ( 110.40) 1,423.49 52,220.06
2003 (4 121.07) 122,835.31 ( 115.79) 2,004.20 54,151.5610 000.00 107,672.79 1 000.00 1,330.68 53,834.61(4 088.57) ( 114.28)
9 442.09 134,479.62 926.52 1,451.11 51,356.92(3 895.62) ( 108.30)
9 464.40 144,274.49 927.95 1,142.89 51,591.8610 242.05 159,048.15 1 121.15 3,596.80 61,791.47
2003 2 9 581.11 7,277.55 942.57 70.125 9 702.36 6,906.68 975.82 97.216 9 646.97 6,738.67 980.80 112.347 9 632.10 8,797.00 998.85 137.419 9 804.77 10,281.49 1 002.18 127.94
12 9 927.77 8,331.83 1 001.94 91.9713 9 882.57 6,859.43 1 058.07 278.9314 9 858.51 7,609.77 1 049.69 195.8015 9 882.53 6,770.37 1 061.98 220.5516 9 842.69 6,587.61 1 064.20 198.6619 9 816.78 5,885.50 1 068.81 221.2620 9 795.09 6,233.82 1 060.58 124.4321 9 804.14 7,000.76 1 068.88 113.8722 9 909.44 7,897.13 1 099.86 295.9523 10 096.73 10,430.15 1 110.29 228.1626 10 322.42 10,665.04 1 131.69 205.7727 10 225.23 8,716.13 1 122.79 297.5128 10 296.01 9,991.73 1 135.34 188.6929 10 268.30 8,279.59 1 113.49 248.7330 10 242.05 7,787.87 1 121.15 141.49
註釋 : 按年及按月指數代表期內最後一個交易日的收市指數。 Notes :
(1) (1)(2) (2)
(3) (3)
(4) (4)
(5) 期末數字。 (5) End period figures.資料來源:恒指服務有限公司; Sources : HSI Services Limited;
香港交易及結算所有限公司;
標準普爾 Standard & Poor's(如有查詢,請致電政府統計處。 (For enquiries, please call Census and Statistics Department.查詢電話:2582 4738) Enquiry Telephone No.: 2582 4738)
5
Hong Kong Exchanges and Clearing Limited;
3,823,222.54
於二零零三年三月三日推出。由二零零三年四月十四日起取代所有普通股指數。括號內數字是指所有普通股指數(2.4.1986=1 000)。
於二零零三年三月三日推出。由二零零三年四月十四日起取 代 創 業 板 指 數 。 括 號 內 數 字 是 指 創 業 板 指 數(17.3.2000=1 000)。
於二零零一年十月三日推出。
於一九九九年十一月二十五日推出。創業板指數自二零零零年三月二十日起開始編製。
5
Launched on 3 March 2003 and replaced the Growth Enterprise Indexwith effect from 14 April 2003. Figures in brackets refer to the GrowthEnterprise Index (17.3.2000=1 000).
9101112
678
345
3,537,351.61
3,791,697.473,724,476.583,650,493.253,327,120.51
3,855,291.104,025,395.964,010,364.12
3,559,099.08
Month
巿價總值(5)
(百萬港元)
MarketCapitalisation(5)月
3,772,015.51
主板
Main Board創業板(2)
Growth Enterprise Market(2)
4,795,150.073,885,342.08
Launched on 25 November 1999. Growth Enterprise Index has beencompiled since 20 March 2000.Launched on 3 March 2003 and replaced the All Ordinaries Index witheffect from 14 April 2003. Figures in brackets refer to the All OrdinariesIndex (2.4.1986=1 000).
indices as at end of the period.Annual and monthly indices refer to the last trading day closing
Launched on 3 October 2001.
4
12
3
3,559,099.08
3,495,731.36
3,377,574.60
3,547,730.063,567,857.48
147香港統計月刊 二零零三年六月 Hong Kong Monthly Digest of Statistics June 2003

7.15 二零零三年五月份恒生指數成份股每日收市價Daily Closing Prices of the Hang Seng Index Constituent Stocks inMay 2003
元
$
金融 公用事業
Finance Utilities當日收市 東亞銀行 恒生銀行 豐控股 中電控股 香港中華煤氣 香港電燈
As at end Bank of Hang Seng HSBC 中銀香港 CLP HK & China HKof day East Asia Bank Holdings BOC HK Holdings Gas Electric
五月 May2 14.90 78.00 85.50 7.75 xd 32.20 9.30 31.405 14.75 78.75 86.25 7.75 xd 32.30 9.35 31.506 14.95 78.75 86.25 7.80 xd 32.00 9.30 30.50 xd7 14.90 78.50 87.00 7.95 xd 32.10 9.40 30.10 xd9 15.00 80.00 89.25 8.00 xd 32.70 9.55 30.60 xd
12 14.80 80.50 89.00 8.05 xd 32.90 9.65 30.70 xd13 14.55 80.50 88.50 8.00 xd 32.90 9.60 30.40 xd14 14.55 80.75 89.25 7.95 xd 33.00 9.70 30.50 xd15 14.80 80.50 89.75 7.95 xd 33.10 9.75 30.70 xd16 14.65 80.50 89.25 8.00 xd 33.00 9.75 30.4019 14.55 81.00 90.00 7.95 33.40 9.75 30.4020 14.50 80.50 89.00 7.95 33.60 9.85 30.8021 14.55 80.75 89.50 7.90 33.70 9.90 30.9022 14.50 81.50 89.25 7.95 34.10 9.90 31.1023 14.75 82.00 90.50 8.00 34.00 9.95 31.3026 14.95 83.00 91.50 8.15 33.90 9.90 31.5027 14.85 82.75 91.00 8.15 33.90 9.85 31.4028 14.95 83.00 92.75 8.20 33.90 9.80 31.2029 14.90 83.25 93.25 8.10 33.50 xd 9.85 31.3030 14.70 83.00 93.00 8.00 33.60 xd 9.75 31.10
地產
Properties恒隆 恒基 新鴻基
長江 地產 發展 恒基 信和 地產
當日收市 實業 Hang Henderson 地產 置業 SHKAs at end Cheung Lung Invest- Henderson Sino Proper- 會德豐
of day Kong Properties ment Land Land ties Wheelock
五月 May2 43.60 6.85 6.65 19.95 2.075 37.40 5.605 44.30 6.90 6.75 20.50 2.125 38.20 5.706 44.00 7.00 6.80 20.80 2.100 38.00 5.707 43.60 7.00 6.75 20.35 2.050 37.40 5.759 44.40 7.20 6.85 20.35 2.100 37.70 5.85
12 45.70 7.25 6.90 20.50 2.025 38.50 5.9013 44.90 xd 7.20 7.05 20.50 2.075 38.50 5.9514 45.20 xd 7.20 7.05 20.40 2.075 38.60 5.9515 45.60 xd 7.15 7.05 20.45 2.050 38.50 6.0016 45.30 xd 7.25 7.10 20.15 2.050 38.10 6.0519 44.80 xd 7.25 7.20 19.55 2.025 36.90 6.1020 44.40 xd 7.25 7.10 19.50 2.050 36.70 6.0521 44.60 xd 7.15 7.10 19.50 2.025 36.50 5.9522 45.50 xd 7.15 7.15 19.65 2.025 36.60 6.0023 46.90 7.10 7.15 20.70 2.075 37.90 6.1526 48.60 7.30 7.30 21.30 2.100 39.20 6.3527 47.60 7.35 7.40 21.35 2.150 38.50 6.3028 48.00 7.30 7.30 21.85 2.250 38.90 6.2529 47.90 7.35 7.30 21.85 2.225 38.70 6.2530 47.50 7.30 7.40 21.95 2.225 38.90 6.55
148香港統計月刊 二零零三年六月 Hong Kong Monthly Digest of Statistics June 2003

7.15 (續) 二零零三年五月份恒生指數成份股每日收市價(Cont'd.) Daily Closing Prices of the Hang Seng Index Constituent Stocks in
May 2003元
$
工商業
Commerce and industry長江基建
當日收市 國泰航空 集團 中國移動 華潤創業 中國聯通 中信泰富 中國 思捷環球
As at end Cathay CKI China China China Citic 海洋石油 Esprit 和記黃埔
of day Pacific Air Holdings Mobile Resources Unicom Pacific CNOOC Holdings Hutchison
五月 May2 xd 15.405 xd xd 15.706 xd xd xd 15.657 xd xd xd 15.359 xd xd xd 14.70
12 xd xd 14.5013 xd xd 14.85 xd14 xd xd 14.65 xd15 xd 15.00 xd16 15.10 xd
19 15.00 xd20 14.80 xd21 xd 14.95 xd22 xd 15.25 xd23 xd 16.2026 xd 16.6027 xd 16.2028 xd 16.1529 xd xd 16.8030 xd 16.50
工商業 --- 續
Commerce and industry --- cont'd.德昌電機控股 聯想 地鐵 新世界 上海實業控股 太古
當日收市 Johnson 集團 利豐 公司 發展 電訊 Shanghai 股份'A' 電視 九龍倉
As at end Electric Legend Li & MTR New World 盈科 Industrial Swire 廣播 Wharfof day Holdings Group Fung Corporation Development PCCW Holdings Pacific 'A' TVB Holdings
五月 May2 8.60 xd 13.905 8.80 xd xd 14.006 8.95 xd xd 14.157 8.75 xd xd xd 14.009 8.60 xd xd xd 14.05
12 8.75 xd xd xd 14.0513 8.75 xd xd 14.0014 8.70 xd xd 13.7515 8.65 xd xd 13.7516 8.75 xd 13.9019 8.85 xd 14.0520 8.80 xd 14.1521 8.70 xd 13.80 xd22 8.65 xd xd 14.05 xd23 8.80 xd xd 14.30 xd
26 8.95 xd xd 14.80 xd27 9.10 xd xd 14.65 xd28 9.25 xd xd 14.80 xd29 9.25 14.75 xd30 9.20 14.95 xd
註釋: xd 除息。 Note : xd Ex-dividend.
資料來源: 香港交易及結算所有限公司 Source : Hong Kong Exchanges and Clearing Limited(如有查詢,請致電政府統計處。 (For enquiries, please call Census and Statistics Department. 查詢電話:2582 4738) Enquiry Telephone No.: 2582 4738)
5.100 10.70 33.40 24.952.425 9.65 9.00 2.800
4.625 14.30 10.90 47.409.85 16.10 17.80 6.50
9.65
9.509.208.90
9.009.009.209.459.40
9.25
47.30
45.7047.2048.4047.50
45.5045.1045.30
47.70
47.0046.0046.2045.80
44.10
44.7044.7046.0047.40
8.45
45.00
9.109.00
8.558.608.75
9.50
24.2524.50
24.6524.4524.3524.45
24.3024.8025.05
24.4024.5025.10
24.9024.3024.25
24.3524.0524.2524.85
31.00
6.006.106.256.306.35
9.709.65
9.659.809.909.35
9.909.859.75
9.359.409.359.50
14.95
14.4014.30
9.95
9.408.959.009.15
9.60 14.3514.5014.6514.6515.0515.0015.1015.1015.2015.6015.8515.8015.8015.9015.90
15.8516.3016.2016.4016.9017.1517.0516.6016.6516.5516.2016.3016.3016.7017.1517.7517.7017.9517.90
6.306.206.356.406.406.406.456.456.506.706.956.706.756.55
4.2504.3004.2504.1754.3254.4754.4004.3754.2504.2754.2754.2504.3004.5004.6004.7754.6504.6254.600
13.3513.5513.3513.1513.3013.3013.5013.7013.8513.7513.7013.9013.9013.8014.0514.4514.5014.6014.45
10.4010.5010.55
10.1510.30
10.30
11.70
10.5510.6010.5010.6510.4510.9011.25
2.2502.175
2.250
2.2002.2002.2752.2752.2252.2252.2502.2002.1752.1502.2752.4002.4502.3002.375
8.908.608.908.908.858.808.759.008.858.708.658.809.109.05
8.808.808.958.908.958.958.90
9.60
2.4502.5502.6502.6002.7002.5002.5502.4752.4502.4002.4252.5002.5252.5752.5752.6752.7752.7252.700
5.1005.1005.1005.0005.1005.3505.3505.250
5.1505.300
5.4005.3505.3505.250
5.150
9.909.959.809.85
10.0010.05
5.0505.150
5.2505.250
10.85
10.3010.3510.2510.70
10.0510.10
31.1031.90
10.7010.85
31.7031.6031.3032.2033.3033.70
10.55
31.8031.8031.5031.9010.20
10.30
33.90
33.7034.00
32.0030.50
14.75 10.1510.00
32.30
11.2011.0011.00
2.275
149香港統計月刊 二零零三年六月 Hong Kong Monthly Digest of Statistics June 2003

7.16 二零零三年五月份恒生指數期貨及期權Hang Seng Index Futures and Options in May 2003
恒生指數期貨
Hang Seng Index Futures
結算價
Settlement prices 總成交量 未平倉合約
(張數) (張數)
2003 2003 Total Open五月 六月 volume interest
(a) (b) (a) (b) May Jun (Contracts) (Contracts)
五月
2 20 951 4 512 65 014 3 015 8 745 8 742 9 165 95 898
5 16 429 3 827 65 039 3 338 8 877 8 887 7 492 97 7516 21 032 4 552 66 342 3 589 8 873 8 886 8 343 101 0347 22 231 4 913 66 119 3 596 8 890 8 890 9 072 103 3989 24 376 5 893 67 009 4 038 9 062 9 063 15 036 109 285
12 20 878 4 656 67 625 4 256 9 141 9 141 8 919 111 01913 18 504 4 662 67 714 4 221 9 140 9 150 6 667 111 79314 22 322 5 608 67 715 4 170 9 140 9 140 10 678 114 24315 19 790 4 846 67 585 4 163 9 151 9 161 6 082 115 92716 19 170 5 111 67 831 3 950 9 101 9 107 9 613 120 110
19 16 372 3 621 66 396 3 926 9 085 9 091 4 490 120 84720 20 077 4 637 66 450 3 871 9 069 9 070 5 657 121 91221 18 713 4 436 64 562 3 598 9 033 9 035 6 567 123 83822 21 337 4 024 66 425 3 778 9 162 9 166 6 590 126 72323 36 155 5 543 69 266 3 751 9 317 9 320 13 593 129 354
26 43 920 4 574 77 661 4 168 9 533 9 540 15 086 130 89227 47 990 4 148 81 498 3 841 9 465 9 468 11 378 131 82528 78 673 5 235 88 096 3 666 9 519 9 540 15 067 136 40529 24 109 4 951 85 500 4 075 9 531 9 540 7 361 79 08030 20 266 4 903 71 770 3 163 9 555 9 560 9 340 83 959
註釋 : (a) 恒生指數期貨。 Notes : (a) Hang Seng Index Futures.(b) 小型恒生指數期貨。 (b) Mini-Hang Seng Index Futures.
資料來源: 香港交易及結算所有限公司 Source : Hong Kong Exchanges and Clearing Limited(如有查詢,請致電政府統計處。 (For enquiries, please call Census and Statistics Department.查詢電話:2582 4738) Enquiry Telephone No.: 2582 4738)
當日收市
恒生指數期權 Hang Seng Index Options
未平倉合約(張數)Open interest(Contracts)
May
of dayAs at end
總成交量(張數)Total volume(Contracts)
150香港統計月刊 二零零三年六月 Hong Kong Monthly Digest of Statistics June 2003

7.17 金銀買賣報價Gold and Silver Trading Prices
99黃金(以每兩港元計)(1) 公斤條黃金(以每克港元計)(2) 銀(以每十安士港元計)
Tael Gold Bar (HK$/tael)(1) Kilo Gold Bar (HK$/gram)(2) Silver (HK$/10 oz.) 年 開市 收市 最高 最低 開市 收市 最高 最低 開市 收市 最高 最低Year Month Opening Closing High Low Opening Closing High Low Opening Closing High Low
2000 2,675 2,537 2,908 2,457 - - - - 419 358 419 3562001 2,538 2,572 2,742 2,377 - - - - 358 354 374 3162002 2,582 3,199 3,284 2,576 75.68 86.45 88.05 75.68 357 365 396 3312002 3 2,752 2,813 2,814 2,674 - - - - 351 365 365 349
4 2,810 2,873 2,893 2,763 75.68 77.68 77.93 75.68 365 362 370 3455 2,859 3,037 3,042 2,852 77.20 81.70 81.70 77.06 354 387 387 3546 3,029 2,924 3,059 2,922 81.85 78.80 82.60 78.80 390 376 396 3767 2,930 2,838 3,013 2,808 79.00 76.60 81.30 75.80 380 364 396 3628 2,813 2,903 2,942 2,803 75.90 78.40 79.40 75.85 358 348 365 3449 2,899 2,993 3,028 2,892 78.25 80.65 81.65 78.20 348 351 362 348
10 2,977 2,939 3,009 2,886 80.40 79.45 81.00 78.00 349 350 351 33411 2,949 2,961 3,007 2,939 79.60 79.95 81.15 79.45 351 347 358 34512 2,954 3,199 3,284 2,948 79.70 86.45 88.05 79.60 347 365 371 347
2003 1 3,218 3,423 3,458 3,192 86.80 92.50 93.30 86.50 372 379 381 371 2 3,438 3,236 3,584 3,184 93.00 87.30 96.80 86.00 378 358 386 350
3 3,250 3,115 3,305 3,019 87.80 84.20 89.30 81.70 358 347 365 3394 3,128 3,113 3,129 2,969 84.50 84.20 84.50 80.30 349 357 362 3425 3,168 3,375 3,445 3,156 85.70 91.40 93.10 85.40 370 353 378 353
註釋: (1) 「99黃金」是成色99黃金(重量5兩)。 Notes : (1) Tael Gold Bar refers to 99 fineness gold (weight 5 taels).(2) (2)
資料來源: 金銀業貿易場 Source :(如有查詢,請致電政府統計處。 (For enquiries, please call Census and Statistics Department. 查詢電話:2582 4738)
7.18 二零零三年五月份金銀買賣報價Gold and Silver Trading Prices in May 2003
99黃金(以每兩港元計)(1) 公斤條黃金(以每克港元計)(2) 銀
Tael Gold Bar (HK$/tael)(1) Kilo Gold Bar (HK$/gram)(2) (以每十安士港元計)
日 開市 收市 最高 最低 開市 收市 最高 最低 SilverDay Opening Closing High Low Opening Closing High Low (HK$/10 oz.)
五月 May 2 3,168 3,160 3,169 3,156 85.70 85.40 85.70 85.40 3703 3,158 3,159 3,159 3,158 85.45 85.45 85.45 85.45 3725 3,159 3,169 3,169 3,159 85.40 85.65 85.65 85.40 3726 3,169 3,183 3,183 3,165 85.70 86.00 86.00 85.60 3737 3,192 3,179 3,195 3,179 86.30 86.00 86.30 86.00 3739 3,213 3,229 3,230 3,213 86.85 87.30 87.30 86.85 373
10 3,228 3,220 3,228 3,220 87.20 87.05 87.20 87.05 37312 3,239 3,250 3,251 3,231 87.65 87.95 87.95 87.40 37313 3,241 3,246 3,251 3,239 87.65 87.85 87.90 87.65 37714 3,245 3,238 3,246 3,231 87.70 87.70 87.70 87.55 37615 3,264 3,268 3,268 3,256 88.25 88.30 88.30 88.05 37816 3,259 3,272 3,272 3,258 88.20 88.40 88.40 88.15 37317 3,287 3,291 3,291 3,287 88.90 88.90 88.90 88.90 37319 3,321 3,333 3,333 3,320 89.80 90.05 90.05 89.80 37620 3,383 3,409 3,412 3,375 91.50 92.15 92.15 91.30 37721 3,395 3,399 3,413 3,394 91.85 91.80 92.30 91.80 37322 3,437 3,418 3,439 3,416 93.00 92.40 93.00 92.40 36823 3,406 3,406 3,406 3,385 92.15 91.80 92.15 91.55 36324 3,414 3,411 3,414 3,408 92.35 92.25 92.35 92.20 36226 3,415 3,420 3,427 3,413 92.30 92.60 92.60 92.30 36327 3,445 3,442 3,445 3,426 93.10 92.65 93.10 92.65 36528 3,392 3,373 3,395 3,371 91.80 91.20 91.80 91.20 36029 3,359 3,353 3,363 3,350 90.90 90.75 90.90 90.75 36030 3,401 3,388 3,413 3,385 92.10 92.00 92.30 91.60 35631 3,380 3,375 3,380 3,375 91.40 91.40 91.40 91.40 353
註釋: (1) 「99黃金」是成色99黃金(重量5兩)。 Notes : (1) Tael Gold Bar refers to 99 fineness gold (weight 5 taels).(2) (2)
資料來源: 金銀業貿易場 Source :(如有查詢,請致電政府統計處。 (For enquiries, please call Census and Statistics Department. 查詢電話:2582 4738) Enquiry Telephone No.: 2582 4738)
Enquiry Telephone No.: 2582 4738)
The Chinese Gold and Silver Exchange Society
「公斤條黃金」是成色999.9黃金(重量1 000克),於
The Chinese Gold and Silver Exchange Society
月
月
Month
1 kilogram) which started trading on 19 April 2002.Kilo Gold Bar refers to 999.9 fineness gold (weight
「公斤條黃金」是成色999.9黃金(重量1 000克),於 Kilo Gold Bar refers to 999.9 fineness gold (weight二零零二年四月十九日起開始買賣。 1 kilogram) which started trading on 19 April 2002.
二零零二年四月十九日起開始買賣。
151香港統計月刊 二零零三年六月 Hong Kong Monthly Digest of Statistics June 2003

7.19 政府一般收入帳目的收入和開支Government Revenue and Expenditure under the General Revenue Account
百萬港元
HK$ million
收入 開支
Revenue Expenditure撥入基本 一般收入
從基本工程 工程 帳目總
儲備基金 期內實際 儲備基金 開支
撥回的款項 開支 Transfers 撥入其他 TotalTransfer Actual to Capital 基金(2) expenditure
直接稅 間接稅 其他收入 from Capital expenditure Works Transfers on General年 Direct Indirect Other Works during the Reserve to other Revenue
Year taxes taxes revenue Reserves Fund period Fund Funds(2) Account
1999-2000(1) 68,186 43,531 45,387 5,000 178,247 0 13,031 191,2782000-2001(1) 75,373 50,814 46,547 6,000 188,551 0 3,629 192,1802001-2002(1) 79,677 45,342 31,520 0 200,687 0 26 200,7132001 10 - 12 32,394 12,044 9,706 0 50,020 0 0 50,0202002 1 - 3 38,677 10,281 7,616 0 51,383 0 0 51,383
4 - 6 7,548 9,913 7,093 0 49,164 0 19 49,183 7 - 9 756 7,553 6,102 0 52,558 0 0 52,55810 - 12 29,117 10,352 8,330 0 49,537 0 4,000 53,537
註釋: (1) 財政年度由四月一日至三月三十一日。 Notes : (1)
(2) 包括對資本投資基金、貸款基金、賑災基金、公務員 (2)
退休金儲備基金及創新及科技基金(於一九九九年六
月成立)的轉撥款項。
資料來源: 政府總部財經事務及庫務局 Source :(查詢電話:2810 3659) (Enquiry Telephone No.: 2810 3659)
7.20 外匯儲備資產Foreign Currency Reserve Assets
人均外匯 按留用進口貨物計算
儲備資產 的外匯儲備資產(1) 外匯儲備資產對
外匯儲備資產 (美元) (月數) 流通貨幣的比率
年 季 (百萬美元) Foreign currency Foreign currency reserve Ratio of(期末數字) Foreign currency reserve assets assets in terms of months of foreign currencyAs at end of reserve assets per capita retained imports of goods(1) reserve assets to
Year Quarter (US$ million) (US$) (No. of months) currency in circulation
2000 107,583 16,030 18.0 8.02001 111,159 16,446 20.4 7.62002 111,919 16,421 # 21.9 7.02002 110,180 16,268 21.2 7.0
112,356 16,555 22.1 7.4111,223 16,353 # 22.1 7.2111,919 16,421 # 21.9 7.0
2003 113,565 16,662 # 21.6 6.9註釋: (1) 數字是根據過去十二個月的留用進口貨物平均數計算。 Note : (1)
資料來源: 香港金融管理局 Source : Hong Kong Monetary Authority(查詢電話:2878 8222) (Enquiry Telephone No.: 2878 8222)
1
1234
月Month
54,144156,539
162,104178,734
14,411
總收入Total
revenue
24,55456,574
Figures are calculated based on past 12 months average of retainedimports of goods.
47,799
Reserve Fund and Innovation and Technology Fund
Fiscal year from 1 April to 31 March.These include transfers to Capital Investment Fund,Loan Fund, Disaster Relief Fund, Civil Service Pension
(established in June 1999).
Financial Services and the Treasury Bureau, Government Secretariat
香港統計月刊 二零零三年六月 152 Hong Kong Monthly Digest of Statistics June 2003

香港統計月刊 二零零三年六月 153 Hong Kong Monthly Digest of Statistics June 2003
物價
Prices
概念及方法 Concepts and Methods
消費物價指數量度住戶一般所購買的消費商
品及服務的價格水平隨時間而變動的情況。消
費物價指數的按年變動率是廣泛地用作消費
者所面對的通貨膨脹的指標。
The Consumer Price Index (CPI) measures thechanges over time in the price level of consumergoods and services generally purchased byhouseholds. The year-on-year rate of change in theCPI is widely used as an indicator of the inflationaffecting consumers.
政府統計處編製不同的消費物價指數數列,以
反映消費物價轉變對不同開支組別的住戶的
影響。甲類、乙類及丙類消費物價指數分別根
據較低、中等及較高開支範圍的住戶的開支模
式編製而成。綜合消費物價指數是根據以上所
有住戶的整體開支模式而編製,反映消費物價
轉變對整體住戶的影響。
Different series of CPIs are compiled by the Censusand Statistics Department (C&SD) to reflect theimpact of consumer price changes on households indifferent expenditure ranges. The CPI(A), CPI(B)and CPI(C) are compiled based on the expenditurepatterns of households in the relatively low, mediumand relatively high expenditure ranges respectively.A Composite CPI is compiled based on the overallexpenditure pattern of all the above households takentogether to reflect the impact of consumer pricechanges on the household sector as a whole.
現時採用以一九九九至二零零零年為基期的
消費物價指數的開支權數,是根據在一九九九
年十月至二零零零年九月間進行的住戶開支
統計調查所得的住戶開支模式計算出來的。消
費物價指數數列的開支範圍臚列如下:
The expenditure weights of the 1999/2000-based CPIseries currently in use are derived based on thehousehold expenditure patterns obtained from theHousehold Expenditure Survey (HES) conductedduring October 1999 to September 2000. Theexpenditure brackets for the CPI series are as follows:
指數
約佔住戶
的
百分比
住戶於
一九九九年十月至
二零零零年九月期間
的每月平均開支 Index
Approximatepercentage ofhouseholds
covered
Average monthlyhousehold expenditureduring October 1999 to
September 2000
甲類消費物價指數 50% $ 4,500-$18,499 CPI(A) 50% $ 4,500-$18,499乙類消費物價指數 30% $18,500-$32,499 CPI(B) 30% $18,500-$32,499丙類消費物價指數 10% $32,500-$65,999 CPI(C) 10% $32,500-$65,999
綜合消費物價指數 90% $ 4,500-$65,999 Composite CPI 90% $ 4,500-$65,999
上述的開支範圍是以一九九九年十月至二零
零零年九月基期內的物價計算。將自基期起的
物價轉變的影響計算在內,調整至二零零二年
的價格水平計算,甲類、乙類及丙類消費物價
指數住戶的每月平均開支,分別大約在4,300元至17,500元之間、17,500元至30,900元之間及
30,900元至62,700元之間,而綜合消費物價指
數的範圍大約在4,300元至62,700元之間。
It should be noted that the above expenditure rangesrelate to prices in the base period from October 1999to September 2000. Taking into account the impactof price changes since the base period, the monthlyhousehold expenditure ranges of the CPI(A), CPI(B),and CPI(C) adjusted to the price level of 2002 arebroadly equivalent to $4,300-$17,500, $17,500-$30,900 and $30,900-$62,700 respectively, and thatof the Composite CPI is broadly equivalent to$4,300-$62,700.

香港統計月刊 二零零三年六月 154 Hong Kong Monthly Digest of Statistics June 2003
住戶開支水平會受收入和物價變動等因素的
影響而改變,但計算消費物價指數所採用的住
戶開支模式(即各項商品及服務的相對開支),相對上較為穩定,隨時間只會有輕微改變。再
者,輕微更改編製消費物價指數的權數,對消
費物價指數變動的影響並不顯著。因此,每次
重訂基期後,採用固定的開支權數編製數年的
消費物價指數是恰當的做法。
The expenditure levels of households change inresponse to factors such as changes in income leveland prices. However, the household expenditurepatterns (i.e. relative expenditure among variousitems of goods and services), which are used in thecomputation of the CPIs, are relatively stable andchange only gradually over time. Furthermore,slight changes in the weightings for compiling CPIswould have insignificant impact on the movements ofCPIs. Hence, it is appropriate to adopt fixedexpenditure weights for compiling CPIs for severalyears after each round of rebasing.
基於以上原因,政府統計處跟隨國際慣例,每
五年進行一輪新的住戶開支統計調查,以更新
計算消費物價指數所用的開支模式。
Based on the above consideration, the C&SD, in linewith international practice, conducts a new round ofHES once every five years to update the expenditurepattern used in the computation of the CPI.
除開支權數外,編製消費物價指數時所需的另
一類資料是個別項目的價格數據。政府統計處
持續地進行一項按月零售物價統計調查,每月
從大約四千間位於香港各地區的零售商店及
提供服務的機構,搜集約共四萬五千個價目。
至於一些主要服務如公共交通及郵遞服務的
價格數據,則直接從有關機構搜集或從行政紀
錄中獲得。至於私人房屋租金方面,有關新訂
租約、續訂租約及現時租戶的租金資料,是透
過一項以私人房屋租戶為對象的按月抽樣統
計調查搜集得來。公營房屋租金資料,則由香
港房屋委員會及香港房屋協會定期提供。
In addition to the expenditure weights, price data forindividual items are also required in the compilationof the CPI. A Monthly Retail Price Survey iscontinuously conducted by the C&SD for thispurpose. Each month, some 45 000 price quotationsare collected from about 4 000 retail outlets andservice providers throughout Hong Kong. Pricedata for such principal services as public transportand postal services are either collected directly fromthe companies concerned or obtained fromadministrative records. Data on private housingrentals for new, renewed and continued lettings arecollected from a monthly sample survey on renterhouseholds residing in private housing. Data onpublic housing rentals are regularly provided by theHong Kong Housing Authority and the Hong KongHousing Society.
將消費物價指數原來數列的按年變動數字和
經季節性調整數列的按月變動數字一起研
究,有助分析消費物價的最新趨勢。由於經季
節性調整的數列已透過統計方法剔除季節性
變異,可更有意義地比較相連月份數字。
For analyzing the latest trend in consumer prices, it isuseful to study the year-on-year changes in theoriginal CPI series and the month-to-month changesin the seasonally adjusted series together. In theseasonally adjusted series, seasonal variations havebeen eliminated by statistical methods, thus enablingfigures for consecutive months to be compared moremeaningfully.
其他有關刊物 Further References
一九九九至二零零零年住戶開支統計
調查及重訂消費物價指數基期報告1999/2000 Household Expenditure Survey and the
Rebasing of the Consumer Price Indices消費物價指數年報 Annual Report on the Consumer Price Index消費物價指數月報 Monthly Report on the Consumer Price Index

圖 8.1 綜合消費物價指數的變動情況Chart 8.1 Movements of the Composite Consumer Price Index
按年變動率Year-on-year rate of change
最近三個月內的平均每月變動率 (經季節性調整的指數數列)Average monthly rate of change during the latest 3months (seasonally adjusted index series)
-6
-4
-2
0
2
4
6
4/01 7/01 10/01 1/02 4/02 7/02 10/02 1/03 4/03
%
-6
-4
-2
0
2
4
6
8
10
12
14
1992 1994 1996 1998 2000 2002
%
155香港統計月刊 二零零三年六月 Hong Kong Monthly Digest of Statistics June 2003

8.1 以一九九九至二零零零年為基期的綜合消費物價指數
食品(不包括外出用膳) 電力、
外出用膳 Food, 私人房屋 公營房屋 燃氣及水 煙酒
Meals excluding meals 租金 租金 Electricity, Alcoholic 年 月 總指數 食品 bought away bought away 住屋(1) Private Public gas and drinks andYear Month All items Food from home from home Housing(1) housing rent housing rent water tobacco
權數 Weight2000 99.72001 98.92002 96.82002 2
3456789
101112
2003 1234
電話及其他通訊服務
Telephone and衣履 耐用物品 雜項物品 雜項服務(2) 教育服務 other 醫療服務
年 月 Clothing and Durable Miscellaneous 交通 Miscellaneous Educational communications MedicalYear Month footwear goods goods Transport services(2) services services services
權數 Weight2000200120022002 2
3456789
101112
2003 1234
註釋: (1) Notes : (1)
(2) 「雜項服務」包括「教育服務」、「電話及其他通訊服務」、 (2)
「醫療服務」及其他雜項服務。
and other miscellaneous services.資料來源: 政府統計處消費物價指數組 Source : Consumer Price Index Section,
(查詢電話:2805 6403) Census and Statistics Department(Enquiry Telephone No.: 2805 6403)
96.2 104.1 79.7 103.496.7 80.5 104.0 100.0
99.2
86.1 99.7 103.5
91.4
89.3 87.6 99.4 78.1
88.3
106.3
83.3 82.0 106.2 100.1 98.3 104.1 81.8 102.5
101.3
93.5 96.3 97.7 94.1
106.088.1
96.9 104.0 82.299.9 84.2 104.1 99.095.4 84.4 103.9 99.3
95.4 97.0
96.6 104.0
101.7
100.4
91.0 84.8 104.0 99.7
91.6
87.1 87.1 102.1
100.3
100.1
97.2
103.3
103.6100.1
100.7
100.6
89.2 92.4
90.1
90.4 89.6
89.290.1
89.289.2 92.7
106.3
106.492.7105.8
92.5
(1.71)
88.1
106.087.5 89.2 92.8 106.3
105.9
(3.67)
89.2
93.199.4 76.9
90.8
91.789.289.2 92.7
89.2 89.2
99.9 98.5
84.6
99.6 98.789.188.9
89.298.297.0
94.8
95.495.7
96.9
95.5 98.3
94.2
94.7
95.7 91.190.7
90.0
88.9 105.799.4
105.9
105.4
100.4
86.0101.1100.298.6
89.9 106.2
(3.27)
90.4
103.3
"Miscellaneous services" section includes "Educational services",
90.3
97.598.5
102.4
98.6 103.1
101.9
94.0
89.389.2
95.2
93.894.495.1
88.6
89.7
9.01 14.42
94.5
93.6
93.9
92.9
包括「管理費及其他住屋雜費」和「保養住所工具及材料」。
除「私人房屋租金」及「公營房屋租金」外,「住屋」類別還
93.4 87.1 102.986.9 100.0100.5
88.6 82.9
1999/2000-based Composite Consumer Price Index(一九九九年十月至二零零零年九月=100)
(October 1999 - September 2000=100)
97.8
(10.28)99.497.7
100.1103.495.3
99.4(2.07) 2.98100.00 26.67 (24.59)(16.39) 29.91
98.2 99.80.94
105.991.995.5 91.6
100.7
96.5
94.9 96.6
94.2 96.8
95.194.9 96.4
105.0 100.2
85.986.0 104.0
98.3
101.4
96.9 103.9
81.9
92.9 105.0
97.5 103.2
88.8
101.7
99.9
98.1 103.5
106.1
102.0
99.0
"Telephone and other communications services", "Medical services"
housing charges" and "Tools and materials for house maintenance"."Housing" section also includes "Management fee and other
104.1 82.7
101.6
100.3 90.3
Apart from "Private housing rent" and "Public housing rent", the
86.0 101.6103.2 85.9 101.9
102.5
101.582.0101.3
101.8
97.9 100.593.4 91.794.1 85.9 103.6
101.898.7
99.6 86.9
98.7
97.896.5
98.598.1
97.8
97.6
5.70
98.0
95.8
94.2
97.397.4
97.997.9
94.1 96.2 97.6
6.24
94.5
93.8 95.893.7
96.8
95.8
4.13
93.793.7
99.9
87.8 85.5 103.3 100.8
86.8 104.9 100.1104.2
97.7
101.5
93.3 88.1 86.9 89.293.2 89.9 88.3
97.5
87.0
94.2 83.5 104.1 99.8
99.4 96.4
97.9 104.0 83.1
98.4 103.2 84.7
103.2 90.0
106.3
90.6 81.2 105.6 99.9 96.4 104.1 81.4 102.4
88.8
香港統計月刊 二零零三年六月 156 Hong Kong Monthly Digest of Statistics June 2003

8.2 以一九九九至二零零零年為基期的甲類消費物價指數
食品(不包括外出用膳) 電力、
外出用膳 Food, 私人房屋 公營房屋 燃氣及水 煙酒
Meals excluding meals 租金 租金 Electricity, Alcoholic 年 月 總指數 食品 bought away bought away 住屋(1) Private Public gas and drinks andYear Month All items Food from home from home Housing(1) housing rent housing rent water tobacco
權數 Weight
2000200120022002 2
3456789
101112
2003 1234
電話及其他通訊服務
Telephone and衣履 耐用物品 雜項物品 雜項服務(2) 教育服務 other 醫療服務
年 月 Clothing and Durable Miscellaneous 交通 Miscellaneous Educational communications MedicalYear Month footwear goods goods Transport services(2) services services services
權數 Weight
2000200120022002 2
3456789
101112
2003 1234
(1) Notes : (1)
(2) 「雜項服務」包括「教育服務」、「電話及其他通訊服務」、 (2)「醫療服務」及其他雜項服務。
and other miscellaneous services.資料來源: 政府統計處消費物價指數組 Source : Consumer Price Index Section,
(查詢電話:2805 6403) Census and Statistics Department(Enquiry Telephone No.: 2805 6403)
106.5
91.8 81.7 105.7 99.4 95.2 103.7 82.9 103.0
90.094.0 95.2 96.6 93.5
96.9 103.7 84.2 102.991.5 83.3 105.2 100.096.6 103.6 84.5 103.196.3 84.0 104.9 99.9
103.6 83.6 100.6101.3 84.5 104.9 99.2 95.3103.6 83.6 100.696.9 84.9 104.7 99.4 95.5
97.0 102.9 85.9 101.191.1 85.9 104.4 100.7
93.5
93.6
87.1 101.3101.4105.5 100.1105.0
87.1 99.4
94.5 96.6 97.5
95.7 97.1
97.3
86.4 104.795.9
97.6103.6100.9
91.993.498.7
91.4
87.3 101.3
94.1 96.1 97.2
100.1 101.5
70.893.6
91.1 101.8102.8
87.9 104.6 100.3 101.9
87.1 101.896.5
"Telephone and other communications services", "Medical services""Miscellaneous services" section includes "Educational services",
Apart from "Private housing rent" and "Public housing rent", the"Housing" section also includes "Management fee and otherhousing charges" and "Tools and materials for house maintenance".
90.3 89.7
87.988.4 87.2
102.8
90.490.0
89.0
102.9
100.2
94.6
90.5
103.5
96.5
98.4
97.3 102.8102.8
90.5
3.99(5.08)100.00
97.0
5.25
93.9
8.23
91.096.9
99.7
88.9
97.5
87.9
1999/2000-based Consumer Price Index (A)(一九九九年十月至二零零零年九月=100)
(October 1999 - September 2000=100)
1.50(21.76)(13.94) 29.13
包括「管理費及其他住屋雜費」和「保養住所工具及材料」。
除「私人房屋租金」及「公營房屋租金」外,「住屋」類別還註釋:
103.7
95.2 96.9
95.7
106.689.2 91.3
98.3
89.2 91.3
100.7 100.3
86.5 89.2 91.888.393.0 106.3
95.8 97.2 94.0 99.4 72.0 106.587.7
(3.94)
95.2
95.1
90.8
89.290.093.9
94.493.8
91.0
101.5
91.2
88.0
106.2106.4
99.090.3
100.2
91.0
99.4
95.5 91.6
88.589.289.2
88.989.2
106.289.2
94.4
11.70
95.289.489.0
93.1
95.489.7
98.4 99.898.8
(3.35)
101.8
100.1100.798.0
89.2
95.296.494.7 97.8 106.289.089.894.7 89.1 90.0
99.498.6 97.6
99.999.4
99.7(17.94)
4.963.36
31.88
95.2
99.5
94.1
93.9
96.4
97.8
94.797.694.7
96.196.0
95.8
94.9 96.0 97.798.2
97.2 98.496.5
80.0
91.5 105.3
106.5
106.0
106.4
91.3 106.2
89.2
106.5106.3
103.1 87.3
100.3 98.6
(1.27)
86.2 99.7
94.8100.1 87.4100.0 87.3
98.0
93.8 86.4
104.8105.2 100.0
87.198.8
95.492.8 85.3 104.7 99.9
86.1 82.4 106.0 99.7 96.9 103.7 83.3 103.0
83.3 101.1
95.4 98.1 98.9 97.1 91.1 90.8 88.9
100.1
103.194.1 94.9 96.4 92.8 106.2
90.2 87.9 104.0 100.7 99.6 102.9 91.3 101.9
89.4
97.4 81.0 104.7 99.4 95.1 103.7 81.3 104.8
香港統計月刊 二零零三年六月 157 Hong Kong Monthly Digest of Statistics June 2003

8.3 以一九九九至二零零零年為基期的乙類消費物價指數
食品(不包括外出用膳) 電力、
外出用膳 Food, 私人房屋 公營房屋 燃氣及水 煙酒
Meals excluding meals 租金 租金 Electricity, Alcoholic 年 月 總指數 食品 bought away bought away 住屋(1) Private Public gas and drinks andYear Month All items Food from home from home Housing(1) housing rent housing rent water tobacco
權數 Weight
2000200120022002 2
3456789
101112
2003 1234
電話及其他通訊服務
Telephone and衣履 耐用物品 雜項物品 雜項服務(2) 教育服務 other 醫療服務
年 月 Clothing and Durable Miscellaneous 交通 Miscellaneous Educational communications MedicalYear Month footwear goods goods Transport services(2) services services services
權數 Weight
2000200120022002 2
3456789
101112
2003 1234
(1) Notes : (1)
(2) 「雜項服務」包括「教育服務」、「電話及其他通訊服務」、 (2)「醫療服務」及其他雜項服務。
and other miscellaneous services.資料來源: 政府統計處消費物價指數組 Source : Consumer Price Index Section,
(查詢電話:2805 6403) Census and Statistics Department(Enquiry Telephone No.: 2805 6403)
102.7
103.6 82.0 102.7
91.4 80.2 105.1 99.9 96.4 103.6 80.6
94.0 88.6
91.2 82.0 104.5 100.2 98.3
87.8 99.4 80.5 106.4
96.7 82.7 103.7 99.8 97.8 103.6 82.4 102.8
89.2
85.1 103.2 100.1 98.1101.8
100.3
6.93
95.496.7
101.695.9 83.696.6 103.6 81.096.9 103.6 81.7
101.6101.8 83.3 103.6 99.2103.5 99.5
88.7 87.6
97.597.4
102.8
100.2
94.4
98.5 102.0
89.2 92.9 106.3
102.489.7 102.4
106.5
79.389.2
103.5 101.498.7 85.8 104.4 100.2
93.796.4
5.58
96.4
9.05
95.9 93.5
93.9
94.696.0
89.3
95.5
90.2
102.8102.8
98.6
95.1 89.3
86.988.1
103.0 85.6
93.088.2
88.5 99.4
87.2 99.4 96.899.8
88.4
89.2 93.193.4
89.292.6
"Telephone and other communications services", "Medical services""Miscellaneous services" section includes "Educational services",
Apart from "Private housing rent" and "Public housing rent", the"Housing" section also includes "Management fee and otherhousing charges" and "Tools and materials for house maintenance".
89.2
102.190.0
102.1
90.0
85.485.5
102.4
102.1
106.0
29.6825.94
103.5 106.1
105.1
106.1
89.2 93.0
106.4
106.0
96.9
97.2
1999/2000-based Consumer Price Index (B)(一九九九年十月至二零零零年九月=100)
(October 1999 - September 2000=100)
2.81 0.86(25.48) (1.03)(8.74)
95.1
94.094.194.0
95.5
96.295.9
95.596.0
96.4
93.7
93.7
95.5
93.6
97.9
4.47
93.493.493.4
102.7 99.0100.2
100.1 86.1 103.294.1 86.3
包括「管理費及其他住屋雜費」和「保養住所工具及材料」。
除「私人房屋租金」及「公營房屋租金」外,「住屋」類別還註釋:
100.199.8 86.1 103.8 100.1
93.3 85.1
89.5 86.2 101.8 100.5
90.3 84.5 102.8 98.5
106.4
14.68
99.9100.4
89.8
(3.36)
98.8 100.2
106.4
105.8
(3.82)
101.7 97.6 101.5100.3
(1.74)
102.8
102.8
102.8
97.899.4
95.3
89.3
91.2
90.2
103.5100.199.8
91.6100.7
99.098.395.5
98.5
89.189.290.195.8
92.4 106.0
91.0 100.6
94.5
100.5
97.1
98.5
96.896.6
(17.20)
99.299.4 99.7
98.899.9
100.00
97.796.794.7 97.4
95.0
98.2
94.8 96.496.2
95.0 89.790.0
91.597.590.4
95.4 98.6
106.3
94.5 96.7 97.1 95.8
94.594.8
96.9 97.9 94.9
89.2 93.2
89.2 92.0
88.9 86.499.3 105.988.9
105.595.695.3
90.8
90.690.8
96.4
96.297.4 98.1
97.3
84.4
89.8 89.2 92.788.889.4
102.7 85.4
87.9 86.3
102.091.9 84.0 103.5 99.9 96.9 103.4 81.6 101.9
100.7
86.0 81.1 105.6 100.0 98.1 103.6 81.1 102.8
97.6 79.6 103.6 99.9 96.5 103.6 78.8 103.8
香港統計月刊 二零零三年六月 158 Hong Kong Monthly Digest of Statistics June 2003

食品(不包括
外出用膳) 電力、
外出用膳 Food, 私人房屋 燃氣及水 煙酒
Meals excluding meals 租金 Electricity, Alcoholic 年 月 總指數 食品 bought away bought away 住屋(1) Private gas and drinks andYear Month All items Food from home from home Housing(1) housing rent water tobacco
權數 Weight
2000200120022002 2
3456789
101112
2003 1234
電話及其他通訊服務
Telephone and衣履 耐用物品 雜項物品 雜項服務(2) 教育服務 other 醫療服務
年 月 Clothing and Durable Miscellaneous 交通 Miscellaneous Educational communications MedicalYear Month footwear goods goods Transport services(2) services services services
權數 Weight
2000 100.52001 100.72002 99.82002 2 100.4
3 99.84 99.75 99.56 99.878 101.09 99.2
10 98.811 98.612 99.6
2003 12 100.53 100.54 100.6
(1) Notes : (1)
(2) 「雜項服務」包括「教育服務」、「電話及其他通訊服務」、 (2)
「醫療服務」及其他雜項服務。
and other miscellaneous services.
資料來源: 政府統計處消費物價指數組 Source : Consumer Price Index Section,(查詢電話:2805 6403) Census and Statistics Department
(Enquiry Telephone No.: 2805 6403)
105.3 78.3 101.8
87.8 100.680.4
93.7 97.1 100.1
93.190.4 86.7
92.4
101.281.0 86.6 102.8 99.6 104.1 82.8
100.5
6.43
92.1
101.3
98.9102.6
103.8
100.3
100.4
98.2
93.2100.494.4100.5
97.7
94.1
98.898.24.55
93.8
98.297.7
6.73
97.597.8 100.6
(13.28) (8.10)
93.4
100.7100.4
97.3 100.2 92.7
101.2101.288.6
88.3
100.00 21.38
99.197.999.6
95.197.8 99.9
94.995.5 94.9
89.2
0.39
100.297.893.8
101.8
31.22 (26.67) 2.02
104.190.2
104.397.5 100.4
96.2 102.8
94.1103.495.1
91.7 90.8
103.9
100.4100.2
95.0 105.0
104.9
Apart from "Private housing rent", the "Housing" section also
101.1
101.2
98.4 105.3
17.34
100.5
86.8 85.787.5
95.094.8
104.3
94.7
95.0
105.0
90.4 89.4103.588.9
88.1
87.8
90.0
88.4
87.3
98.2
89.7
95.2
88.3
87.3
104.2
88.4
87.2 87.2
註釋:
101.599.195.0
他住屋雜費」和「保養住所工具及材料」。
86.9 103.8
87.9 85.5
除「私人房屋租金」外,「住屋」類別還包括「管理費及其
105.3 100.5
101.4
94.594.694.594.2
95.7
100.8
97.6 100.1
95.7
95.4
98.495.6
95.2
100.1
90.7
89.4
97.797.4 92.9
97.8
95.394.7
以一九九九至二零零零年為基期的丙類消費物價指數1999/2000-based Consumer Price Index (C)
(一九九九年十月至二零零零年九月=100)(October 1999 - September 2000=100)
8.4
93.492.7
100.5
"Miscellaneous services" section includes "Educational services",
90.0
103.8
105.2
89.489.0
90.3
"Telephone and other communications services", "Medical services"
84.4
105.1 80.3 101.280.6 101.3
101.3
includes "Management fee and other housing charges" and "Toolsand materials for house maintenance".
91.391.8
100.390.3
94.9 81.6 104.1
98.0
103.9 99.082.1 83.7
96.8
100.4 93.2 88.8
98.0
105.0 98.499.8
98.9
100.3
99.3
84.6 101.3104.3
93.5 89.3
86.5
(2.19)(2.32)
95.1
105.0
92.7 88.8 88.0 86.1100.1
102.9101.8
100.1100.2
93.0 85.3 103.8
93.8
103.0
87.088.1
87.887.6
91.0
104.6
97.6
84.4 101.3
105.3
(3.81)
80.2 101.3105.3
104.1
98.2 97.9 100.6
88.6 84.4
95.3
9.94
93.3
95.9 85.3
99.3 99.8 99.9 99.6
84.5
95.9104.6104.3104.3
104.3
88.6
104.3
81.2 101.6105.3 81.7 101.6
80.4 101.676.6 82.8 107.0 99.6
97.6 100.4 92.9
105.3105.3
99.5 105.3
104.1
103.9
103.9
79.9 101.688.1 82.3 106.1 97.3
香港統計月刊 二零零三年六月 159 Hong Kong Monthly Digest of Statistics June 2003

8.5 消費物價指數的按年變動率Year-on-year Rates of Change in the Consumer Price Indices
百分率
Percentage
綜合消費物價指數 甲類消費物價指數 乙類消費物價指數 丙類消費物價指數 年 月 Composite Consumer Consumer Price Consumer Price Consumer PriceYear Month Price Index Index (A) Index (B) Index (C)
2000 -3.8 -3.0 -3.9 -4.52001 -1.6 -1.7 -1.6 -1.52002 -3.0 -3.2 -3.1 -2.82002 2 -2.3 -2.4 -2.3 -2.0
3 -2.2 -2.0 -2.3 -2.54 -3.1 -3.3 -3.0 -2.95 -3.1 -3.5 -3.0 -2.96 -3.3 -3.9 -3.2 -2.87 -3.4 -4.1 -3.3 -2.78 -3.3 -3.7 -3.2 -2.89 -3.7 -4.2 -3.7 -3.0
10 -3.6 -4.0 -3.5 -3.211 -3.6 -4.1 -3.6 -3.112 -1.5 1.0 -2.6 -2.8
2003 1 -1.6 -1.6 -1.7 -1.42 -2.0 -2.0 -2.2 -1.93 -2.1 -1.9 -2.3 -1.94 -1.8 (-1.9) -1.2 (-1.7) -2.0 (-2.0) -2.1 (-1.8)
註釋: 括弧內數字為二零零三年一月至四月的平均數與 Note :上一年同期的平均數比較。
資料來源: 政府統計處消費物價指數組 Source : Consumer Price Index Section,(查詢電話:2805 6403) Census and Statistics Department
(Enquiry Telephone No.: 2805 6403)
8.6 經季節性調整的消費物價指數在最近三個月內的平均每月變動率
Average Monthly Rates of Change during the Latest 3 Monthsin the Seasonally Adjusted Consumer Price Indices
百分率
Percentage
綜合消費物價指數 甲類消費物價指數 乙類消費物價指數 丙類消費物價指數
年 月 Composite Consumer Consumer Price Consumer Price Consumer PriceYear Month Price Index Index (A) Index (B) Index (C)
2002 2 -0.7 -0.9 -0.73 +0.3 +1.2 -0.14 -§ +§ -0.15 -0.2 -0.1 -0.26 -0.4 -0.5 -0.37 -0.2 -0.3 -0.28 -0.2 -0.2 -0.29 -0.3 -0.3 -0.3
10 -0.2 -0.2 -0.311 -0.2 -0.2 -0.212 -0.1 -0.1 -0.1
2003 1 -0.1 -0.2 -0.12 -0.1 -0.1 -0.13 +§ +0.2 -§ -0.14 -0.1 +0.2 -0.1 -0.4
註釋: § 少於0.05%。 Note : § Less than 0.05%資料來源: 政府統計處消費物價指數組 Source : Consumer Price Index Section,
(查詢電話:2805 6403) Census and Statistics Department(Enquiry Telephone No.: 2805 6403)
to the average for the same period in the preceding year.
-0.4-0.3
Figures in brackets refer to the average for January to April 2003 as compared
-0.1-0.2-0.3-0.1-0.1
-§ -§
-0.2-0.2-0.2-0.1
香港統計月刊 二零零三年六月 160 Hong Kong Monthly Digest of Statistics June 2003

8.7 選定食品的平均批發價格Average Wholesale Prices of Selected Food Items
元(除另有註明外,以每公斤計)
$ per kg, unless otherwise specified
米(每公噸)(1)
Rice (per tonne)(1)
泰國香米 生豬
中國絲苗 澳洲絲苗 泰國大米 Thai (每公噸)
年 月 Chinese Australian Thai 100% 100% whole Live pigYear Month See Mew long grain whole (Fragrant) (per tonne)
2000 5,245 4,861 3,842 6,450 12,9602001 5,162 4,861 3,081 5,385 12,6972002 5,031 4,861 2,956 5,097 12,5982002 2 4,994 4,861 2,765 5,139 12,530
3 5,060 4,861 2,816 4,973 12,7104 5,060 4,861 2,827 5,051 12,7105 5,060 4,861 2,827 5,064 12,6306 5,060 4,861 2,910 5,100 12,6707 5,060 4,861 2,969 5,218 12,6808 4,720 4,861 3,126 5,168 12,6609 5,060 4,861 3,024 5,195 12,630
10 5,060 4,861 3,077 5,541 12,55011 5,060 4,861 2,937 4,872 12,48012 5,060 4,861 2,997 4,809 12,520
2003 1 N.A. N.A. N.A. N.A. 12,5902 N.A. N.A. N.A. N.A. 12,5003 N.A. N.A. N.A. N.A. 12,6104 N.A. N.A. N.A. N.A. 12,560
鹹水魚
Marine fish, fresh
紅衫魚 菜心 白菜
年 月 Golden 鮫魚 石斑 Flowering WhiteYear Month thread Mackerel Garoupa cabbage cabbage
2000 20.37 20.34 37.53 4.08 2.412001 20.97 20.59 47.44 4.01 2.432002 19.71 21.91 47.15 3.41 2.172002 2 21.16 23.63 45.03 2.45 1.77
3 20.14 23.00 52.22 3.73 2.384 18.05 19.81 46.80 2.01 1.725 19.11 21.09 48.53 2.80 1.546 20.00 21.95 50.87 2.79 1.817 21.67 21.48 49.57 4.25 2.718 19.23 21.64 45.92 5.39 4.059 18.60 22.16 44.19 4.52 3.09
10 18.77 22.09 45.91 3.33 2.0511 20.20 21.17 46.64 3.09 1.6612 18.76 22.32 43.62 3.25 1.72
2003 1 20.37 23.34 39.48 3.08 1.632 18.87 24.53 45.50 2.82 2.353 17.79 24.35 49.65 3.55 2.774 17.89 20.86 46.19 2.69 1.74
註釋 : (1) 數字不包括小型膠袋裝的進口米 Note : (1) Figures do not cover rice imported in the package of small plastic(即2公斤、5公斤及8公斤的袋裝米)。 bags (in 2kg, 5kg & 8kg bags).
資料來源: 漁農自然護理署; Sources : Agriculture, Fisheries and Conservation Department;政府統計處消費物價指數組 Consumer Price Index Section,(如有查詢,請致電政府統計處。 Census and Statistics Department查詢電話:2582 4738) (For enquiries, please call Census and Statistics Department.
Enquiry Telephone No.: 2582 4738)
2.111.97
1.931.68
1.98
2.19
1.66
2.102.42
2.03
2.48
2.03
2.46
18,950
17,840
蕃茄
17,75017,490
18,78018,980
18,920
生牛
(每公噸)Live cattle(per tonne)
18,070
17,610
18,39218,257
18,480
18,780
Tomato
19,140
18,540
18,289
18,770
2.14
2.22
2.032.18
Fresh vegetables新鮮蔬菜
2.21
18,310
161香港統計月刊 二零零三年六月 Hong Kong Monthly Digest of Statistics June 2003

8.8 選定食品的平均零售價格Average Retail Prices of Selected Food Items
元(除另有註明外,以每公斤計)
$ per kg, unless otherwise specified
肉類及家禽 鹹水魚
Meat and poultry Marine fish, fresh
絲苗 油粘 上等豬肉 紅衫魚
年 月 Long Short Pork, Golden 石斑
Year Month grain grain best cut thread Garoupa
2000 7.76 7.24 37.75 45.90 55.81 34.78 41.84 80.262001 7.66 7.17 35.18 43.23 55.82 35.81 40.35 79.952002 7.24 7.02 32.99 39.94 55.64 35.09 36.18 76.502002 2 6.91 6.93 34.29 42.33 55.66 40.68 41.58 81.75
3 7.59 6.98 34.29 42.15 55.66 38.20 35.27 80.064 7.24 6.89 34.29 42.15 55.66 35.76 33.73 78.145 7.32 7.03 32.95 40.06 55.66 35.96 32.08 79.806 7.28 6.99 32.47 39.21 55.56 35.42 33.65 76.547 7.29 6.98 32.27 38.83 55.56 34.61 35.75 73.918 7.52 7.49 32.36 38.74 55.56 33.48 35.22 76.049 7.31 7.01 32.37 38.59 55.37 33.65 38.15 72.27
10 7.11 6.98 32.11 38.37 55.66 33.02 36.53 74.7011 7.08 7.29 32.20 38.28 55.84 32.61 39.19 75.4812 7.23 6.88 31.95 38.28 55.84 32.24 36.53 69.84
2003 1 6.50 6.66 31.95 38.28 55.84 32.47 40.28 67.412 7.26 7.23 32.04 38.28 55.84 33.48 36.34 73.913 7.18 6.89 32.04 38.28 55.84 32.01 36.06 72.014 6.94 6.66 31.95 38.21 55.84 31.66 34.06 71.17
Fresh fruit 雞蛋
鯇魚 大魚 白菜 橙(每個) (每隻)
年 月 Grass Big White Orange Hen eggs 沙糖
Year Month carp head cabbage (each) (each) Sugar
2000 31.16 27.79 8.63 2.10 2.46 0.72 9.162001 30.31 27.31 9.61 2.06 2.55 0.74 9.842002 28.33 25.75 8.55 2.25 2.60 0.77 9.942002 2 28.54 25.78 8.02 2.17 2.74 0.73 9.79
3 28.42 25.63 8.07 2.18 2.62 0.78 9.904 28.92 26.42 7.79 2.00 2.61 0.74 10.065 28.46 26.24 7.87 1.96 2.64 0.75 9.466 28.42 25.98 8.37 2.08 2.65 0.76 9.617 27.73 25.48 8.70 2.05 2.48 0.78 10.128 28.13 25.51 10.85 2.42 2.47 0.82 10.329 28.13 25.45 10.43 2.32 2.63 0.80 9.95
10 28.14 25.51 9.29 2.83 2.63 0.77 10.1811 28.06 25.46 7.94 2.56 2.51 0.79 10.1012 28.11 25.48 7.75 2.31 2.55 0.81 9.92
2003 1 28.29 25.43 8.07 2.51 2.41 0.83 9.942 28.57 25.61 7.66 2.54 2.58 0.81 10.323 28.04 25.27 8.95 2.39 2.52 0.84 10.204 28.31 25.28 8.25 2.19 2.78 0.84 10.20
資料來源:政府統計處消費物價指數組 Source : Consumer Price Index Section, (查詢電話:2805 6403) Census and Statistics Department
(Enquiry Telephone No.: 2805 6403)
19.4642.23
9.21 7.82
cabbage
10.15
Tomato
9.04 7.80
9.44 7.82
8.76 7.72
7.81
42.23
Apple蘋果(每個)
42.23
鮮果
20.6820.75
20.90
42.1542.23
41.52
蕃茄
7.87
12.32 8.10
9.94
7.74
Live chicken,上等米鴨
Duck,top gradetop gradechop
牛腩Beef,
belly fleshbest quality
41.57 21.45
米 Rice
上等牛肉Beef,
豬扒Pork
上等活雞
41.57
42.23
22.4121.69
41.67
41.57 22.11
41.41
41.5741.57
Fresh-water fish 淡水魚
41.77
Fresh vegetables
41.70 21.0020.8320.4741.57
41.57
22.2121.16
20.9520.2920.68
20.8019.69
新鮮蔬菜
7.57
11.06
(each)Flowering
8.38 7.32
菜心
10.53
8.90
9.76 8.1210.60 8.20
7.94
8.20
7.64
10.04 7.67
13.01 7.92
9.16 7.74
9.23 7.56
香港統計月刊 二零零三年六月 162 Hong Kong Monthly Digest of Statistics June 2003

香港統計月刊 二零零三年六月 Hong Kong Monthly Digest of Statistics June 2003163
商業
Commerce
概念及方法 Concepts and Methods
零售業銷貨額及食肆的收益的統計數字,是
根據零售業銷貨額按月統計調查及食肆的收
入及購貨額按季統計調查所搜集的資料編製
而成。這些統計調查包括的零售業及飲食業
商號,是從稅務局商業登記處、食物環境
生署和房屋署登記的商號中抽選出來。表 9.1與 9.2 內的價值指數量度價值的變動。數量指
數則是價值指數用一個特別編製的平減價格
指數調整後得出,以量度實質的變動。
Statistics on retail sales and restaurant receipts arecompiled from the results of a Monthly Survey ofRetail Sales and a Quarterly Survey of RestaurantReceipts and Purchases respectively. The surveysinclude sampled establishments drawn from all theretail and catering establishments registered with theBusiness Registration Office of the Inland RevenueDepartment, the Food and Environmental HygieneDepartment and the Housing Department. In Tables9.1 and 9.2, the value indices measure the changes invalue terms, while the volume indices, obtained bydeflating the value indices by specially constructedprice indices, measure the changes in real terms.
零售業銷貨額數字主要是用來量度本地零售
業機構單位銷售貨品的收益,以評估本地零
售業短期的業務表現。數據雖然包括消費者
在貨品方面的開支,但不包括消費者在服務
方面的開支。此外,數據包括訪港旅客在貨
品方面的開支,但不包括香港居民在外地在
貨品方面的開支,故不應視為消費者整體開
支的一個全面指標。
Retail sales statistics are primarily intended to measurethe sales receipts of goods sold by local retailestablishments, for gauging the short-term businessperformance of the local retail sector. While theycover consumer spending on goods, they do notencompass consumer spending on services. Moreover,they include spending on goods by visitors in HongKong, but do not include spending on goods by HongKong residents outside Hong Kong. Hence they shouldnot be regarded as a comprehensive indicator ofoverall consumer spending.
對消費者整體開支趨勢有興趣的人士,應參
考作為本地生產總值一個主要組成部分的私
人消費開支的按季數列。根據廣泛資料來源
編製的私人消費開支統計數字,涵蓋了香港
居民不論在本地或外地在貨品(從所有途徑
購買的貨品)和服務兩方面的開支。本地生
產總值的統計數字載於第12節「國民收入及
國際收支平衡」。
Users interested in the trend of overall consumerspending should refer to the quarterly series of privateconsumption expenditure (PCE), which is a majorcomponent of the Gross Domestic Product (GDP).Compiled from a wide range of data sources, PCEcovers consumer spending on both goods (purchasedfrom all channels) and services by Hong Kongresidents whether domestically or abroad. Statistics onGDP are available in Section 12 "National Income andBalance of Payments".
編製表 9.3 內各業務收益指數(零售、食肆和
銀行業以及旅遊、會議及展覽服務界別的指
數除外)所用的資料,主要來自政府統計處
於一九九三年開始進行的一項服務行業按季
統計調查。該統計調查包括約四千七百間機
構,從在稅務局商業登記處登記並僱用五人
或以上的有關業務機構中抽選出來。
The major source of the data used for compiling thebusiness receipts indices presented in Table 9.3(except those for the retail, restaurants and bankingindustries and the tourism, convention and exhibitionservices domain) is a Quarterly Survey of ServiceIndustries (QSSI) launched by the Census andStatistics Department in 1993. The survey coverssome 4 700 establishments drawn from BusinessRegistration Office of the Inland Revenue Departmentand are engaging 5 or more persons in the industries.
銀行業的業務收益指數是根據香港金融管理
局提供的數據編製而成。零售及食肆業指數
的編製則如以上第一段所述。
Business receipts index for banking is compiled basedon data obtained from the Hong Kong MonetaryAuthority. Retail and restaurants indices are obtainedas described above in the first paragraph.

香港統計月刊 二零零三年六月 Hong Kong Monthly Digest of Statistics June 2003164
至於旅遊、會議及展覽服務界別方面,部分
的數據是來自香港旅遊發展局。
Regarding the tourism, convention and exhibitionservices domain, part of the data is obtained from theHong Kong Tourism Board.
早年前,政府統計處只為十二個服務行業編
製以一九九二年第一至第四季為基期的業務
收益指數。但由一九九六年第一季起,服務
行業按季業務收益指數的範圍經已擴大,以
便加編十一個新的指數,涵蓋兩個新增的服
務行業和兩個服務界別,以及就部分現時已
包括的服務行業編製更詳細的服務行業業務
收益指數。
In earlier years, business receipts indices werecompiled for twelve service industries only, by takingthe four quarters in 1992 as the base period. Startingfrom the first quarter of 1996, the coverage of thequarterly business receipts index is expanded so thateleven more indices covering two additionalindustries, two service domains and providing moredetailed breakdowns for some of the existingindustries are compiled.
服務界別有別於服務行業,它包括由不同行
業所從事而與一個主題相關的經濟活動部
分。一個與某服務界別關係密切的行業內的
所有機構都可能與該服務界別有關。但在另
外一些情況下,只有部分的機構或甚至只是
部分機構的部分經濟活動,是與該界別有關
的。旅遊服務界別便是一個好的例子。它包
括旅行社所有服務,還包括了酒樓食肆、零
售店、運輸業等的部分但非全部服務(只包
括以旅客為對象的服務)。
A service domain differs from a service industry inthat a domain comprises those parts of economicactivities straddling different industries but somehowrelated to a common purpose. It may include allactivities carried out by all establishments in a serviceindustry that is closely related to the domain. In someother cases, however, only a portion of theestablishments in an industry or even only part of theestablishments’ activities are related to the domain.Tourism is a good example. It includes all activities oftravel agents; and some (those involving visitors ascustomers) but not all of the activities of restaurants,retailers and transport operators.
服務業生產者價格指數旨在量度本地服務業
生產者對其產品及服務所收取價格的平均變
動。生產者價格是指本地生產者對其產出所
收取的實際交易價格,即已扣除任何退回買
家的折扣、賞金、回佣或津貼,但包括附加
費用。
Producer price indices for service industries measurethe average change in prices received by producers ofgoods and services. Producer prices are transactedprices received by local producers for their output, netof any discounts, premiums, rebates or allowancesgiven to buyers but including surcharges.
表 9.4 的選定服務業生產者價格指數,主要是
根據「服務行業按季統計調查」所搜集得的
服務產品生產者價格數據編製而成。某些服
務產品的價格數據現已由消費物價指數系統
搜集。在此情況下,有關的數據不需經「服
務行業按季統計調查」搜集,而是直接自消
費物價指數系統中摘錄。
The producer price indices in respect of selectedservice industries in Table 9.4 are compiled mainlyfrom data on producer prices of service productscollected through the Quarterly Survey of ServiceIndustries (QSSI). For some service products whereprice data are currently collected through theConsumer Price Index (CPI) system, relevant data areextracted from the CPI system instead of beingcollected through the QSSI.
其他有關刊物 Further References
服務行業按季業務收益指數 Quarterly Business Receipts Indices for ServiceIndustries
倉庫、通訊、財務、保險及商用服務按年統計調查報告
Report on Annual Survey of Storage, Communication,Financing, Insurance and Business Services
批發、零售、進口與出口貿易、食肆及酒店按年統計調查報告
Report on Annual Survey of Wholesale, Retail andImport and Export Trades, Restaurants and Hotels
零售業銷貨額按月統計調查報告 Report on Monthly Survey of Retail Sales食肆的收入及購貨額按季統計調查報告 Report on Quarterly Survey of Restaurant Receipts
and Purchases
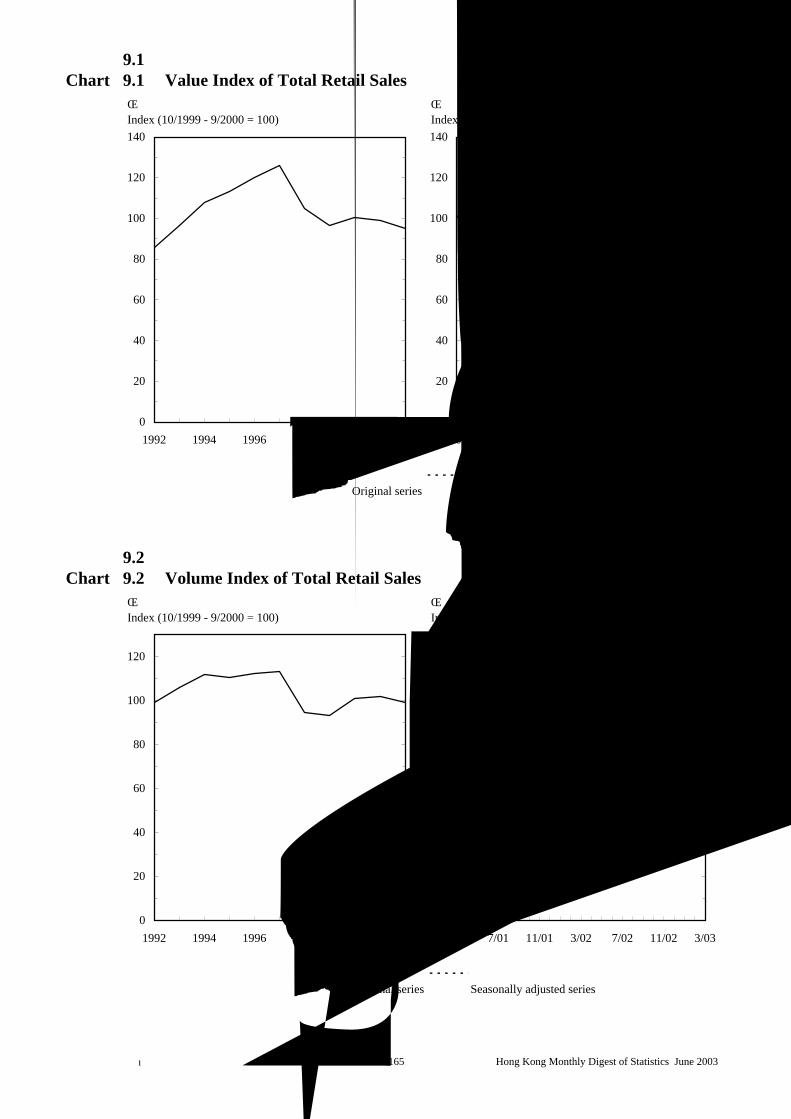
圖 9.1 總零售價值指數Chart 9.1 Value Index of Total Retail Sales
圖 9.2 總零售量指數Chart 9.2 Volume Index of Total Retail Sales
原來數列Original series
經季節性調整數列Seasonally adjusted series
原來數列Original series
經季節性調整數列Seasonally adjusted series
0
20
40
60
80
100
120
140
3/01 7/01 11/01 3/02 7/02 11/02 3/03
指數
Index (10/1999 - 9/2000 = 100)
0
20
40
60
80
100
120
140
1992 1994 1996 1998 2000 2002
指數
Index (10/1999 - 9/2000 = 100)
0
20
40
60
80
100
120
3/01 7/01 11/01 3/02 7/02 11/02 3/03
指數
Index (10/1999 - 9/2000 = 100)
0
20
40
60
80
100
120
1992 1994 1996 1998 2000 2002
指數
Index (10/1999 - 9/2000 = 100)
165香港統計月刊 二零零三年六月 Hong Kong Monthly Digest of Statistics June 2003

圖 9.3 選定服務行業的業務收益指數Chart 9.3 Business Receipts Indices of Selected Service Industries
通訊Communications
保險Insurance
商用服務Business services
0
20
40
60
80
100
120
140
160
180
200
Q4/00 Q2/01 Q4/01 Q2/02 Q4/02
指數 (一九九六年按季平均指數 = 100)Index (Quarterly average of 1996 = 100)
0
20
40
60
80
100
120
140
160
180
200
1993 1996 1999 2002
指數 (一九九六年按季平均指數 = 100)Index (Quarterly average of 1996 = 100)
166香港統計月刊 二零零三年六月 Hong Kong Monthly Digest of Statistics June 2003

9.1 零售業銷貨額 Retail Sales
年 月 價值 數量 價值 數量 價值 數量 價值 數量Year Month Value Volume Value Volume Value Volume Value Volume
2000200120022002 1
23456789
101112
2003 123 #
年 月 價值 數量 價值 數量 價值 數量 價值 數量 價值 數量Year Month Value Volume Value Volume Value Volume Value Volume Value Volume
2000200120022002 1
23456789
101112
2003 123 # 68.9 62.392.6 92.6 102.2 100.8100.1 104.8 92.8 97.8
104.6 114.7 129.1 61.014,180 91.3 98.1 97.1
79.2 73.7118.6 120.0 116.2 115.1134.4 140.7 126.2 132.8
63.717,484 112.6 119.7 120.7 70.0
71.1
75.0
75.872.2
88.9
87.2
67.2
65.6
98.7
111.6 73.6
76.8103.2
86.4
64.7
78.6101.8102.1
92.1
101.3131.6 136.8 119.1 125.2 100.0 101.2 103.8100.0 105.799.1
77.6
105.5
105.2106.5 105.6 86.1100.8
162.3 167.9 91.2 95.2
89.3101.7
91.4103.3104.0 102.4 106.3108.9
98.4
106.7 87.6107.2 114.2 98.7
109.1
107.9
Food, alcoholic drinks and tobacco (other than supermarkets)食品、酒類飲品及煙草(超級市場除外)
70.9
73.3
98.0 100.5 88.7 93.2 101.3 103.8 105.9
66.6103.0117.4 122.4 105.5 110.9 110.8 112.3 105.3
124.2 107.0100.597.2
115.8 118.497.4 100.6 111.6
119.6
106.6
118.8108.6106.7
103.0 103.3
96.793.9
103.3
97.2
Other foodstuffs
105.3109.1
100.8
81.7 87.7 84.7
107.9
14,049 90.5 94.788.6
117.667.5
113.673.1
100.7
114.8 83.9
114.647.8
122.0100.4102.5
105.4103.8
93.593.3
104.4111.3 73.1121.0
84.3
81.993.9
89.4
43.6
麵包、糕餅、糖果及餅乾
96.8
100.0
酒類飲品及煙草
14,540 93.7
15,532129.8
101.4
12,680
100.2
71.7
47.0
72.0
超級市場(1)
Supermarkets(1)
零售指數(一九九九年十月至二零零零年九月期內每月平均指數=100)
93.4
99.8 113.6104.7
90.7 95.1 105.9131.4 147.5
87.9108.9103.6
125.3101.9 112.0 70.9
60.5115.5
99.2 100.2184,387186,700 100.2 100.8 101.0
88.899.0 102.0
All retail outlets
poultry, fresh or frozen
100.1
Fish, livestock and
Food, alcoholic drinks and tobacco(other than supermarkets)
112.8 64.6
100.6104.094.9
91.699.3
109.0
99.0
49.7
80.4
Alcoholic drinks and
93.2
101.7
109.298.7
80.397.5
100.1
confectionery and biscuits
102.9
15,506
101.3
tobacco
Index of retail sales (Monthly average of October 1999 - September 2000=100)
其他食品
Bread, pastry,
82.0
108.3
13,756
93.0
105.2
15,006
食品、酒類飲品及煙草
(超級市場除外)
97.2 103.2
100.4
107.5
106.8
Value of total retailsales ($ million)
所有零售商
類別
零售業總銷貨價值
(百萬元)
零售指數(一九九九年十月至二零零零年九月期內每月平均指數=100)
Index of retail sales (Monthly average of October 1999 - September 2000=100)
食品、酒類飲品及煙草(超級市場除外)
Food, alcoholic drinks and tobacco(other than supermarkets)
vegetables, fresh
新鮮蔬果新鮮及急凍魚類
及禽畜肉類 Fruits and
106.2101.4 101.9103.5
106.2
100.1116.5 119.9
105.289.6 98.2
104.1 104.0
96.7
99.9 98.2115.9
101.7 104.4 94.4 98.9 97.6 100.2 106.2 104.7
99.4 98.1
14,551 93.7
113.0 118.4
106.3121.7
101.6
97.6 98.0 106.3 103.9109.2 112.5 96.8 102.3
100.2
80.1
79.4 75.4
85.280.881.2
91.4
74.863.2
15,914 102.5 107.1176,859 94.9 99.3
14,502 98.893.4
99.8
14,995 96.6 100.515,085 101.9
99.9
70.4
74.6
66.3
59.1 63.0
78.9 74.3
101.0
燃料
Fuels
75.8
111.6 115.1 102.9 107.4 105.1 107.5 103.7
13,423 86.5
98.9 99.9 98.6 96.2108.0 113.2 115.5 121.3
98.8 103.2 80.2 84.5 55.8 51.191.0 92.2 86.2 84.3
香港統計月刊 二零零三年六月 167 Hong Kong Monthly Digest of Statistics June 2003

9.1 零售業銷貨額
(Cont'd.) Retail Sales
年 月 價值 數量 價值 數量 價值 數量 價值 數量 價值 數量 價值 數量Year Month Value Volume Value Volume Value Volume Value Volume Value Volume Value Volume
2000200120022002 1
23456789
101112
2003 123 #
年 月 價值 數量 價值 數量 價值 數量 價值 數量 價值 數量Year Month Value Volume Value Volume Value Volume Value Volume Value Volume
2000200120022002 1
23456789
101112
2003 123 #
114.1 116.2131.4 142.1 106.8 96.4
77.2 108.0
92.5
120.9
耐用消費品
95.8 133.5
85.9 86.1
78.3
103.1 107.2 73.2 105.1
107.4
79.9
goods
98.8
98.2
135.9
95.0
Index of retail sales (Monthly average of October 1999 - September 2000=100)
151.9 172.1
83.3 84.3
107.4
94.2 97.6 75.2
106.8
88.6 94.2 78.270.4
95.1
92.9 97.7 95.5 100.2 77.8 82.9 87.8
95.4 98.3
121.8
97.7
97.8
94.8
98.2
Other consumer
101.4
114.2 108.5108.4
130.7
136.2 115.7 130.1
102.5
傢具及固定裝置
fixtures
73.1 79.1
98.098.8
88.7
98.5
75.9
104.1
92.7
107.3
73.8 97.1
77.4 86.8
114.085.1
84.9
not elsewhere classified
81.0
139.996.7 133.1
94.9136.3 144.6 94.2 87.4 93.977.0 108.886.6 90.578.6 81.668.4 71.0
102.6109.6
115.7
91.1106.0101.599.0
123.6 101.598.7
130.5129.6
125.0 104.2
94.586.9
90.7 99.183.5
and allied products
衣物、鞋類及有關製品
Clothing, footwear and allied products耐用消費品
Consumer durable有關製品
Clothing, footwear goods
109.1
89.189.5 107.7
90.7
145.2112.0 136.3116.6
106.1
其他消費品
93.276.2 98.2 80.9 100.8 87.0
87.0
零售指數(一九九九年十月至二零零零年九月期內每月平均指數=100)
100.7 99.3
百貨公司
Jewellery, watches andDepartment stores
Furniture and Other consumer durable goods,
clocks, and valuable giftsConsumer durable goods
101.4
91.1112.7
101.1 121.0102.3 101.9
78.8 86.4
93.1
105.7 115.4
108.1
102.4 112.4 124.978.7
128.9123.2
95.4 109.6
105.1
103.3 102.881.4
96.4 102.4
83.0
96.0 94.5
(續)
99.9
鞋類、有關製品及 服裝
Wearing apparel 其他衣物配件
Footwear, allied
Index of retail sales (Monthly average of October 1999 - September 2000=100)
耐用消費品衣物、鞋類及
103.4 105.2
零售指數(一九九九年十月至二零零零年九月期內每月平均指數=100)
products and otherclothing accessories
103.8102.4101.8 103.8 101.5104.2 96.6 104.2 110.0103.9 100.5
103.697.1
Consumer durable goods
電器及攝影器材汽車及汽車零件
and partsElectrical goods
and photographicMotor vehicles
103.7 104.298.5 104.8
82.7
93.297.6
110.1
equipment
101.7 103.2102.0 113.5
96.3 117.4
81.2112.1
93.991.4
102.1
73.989.2
118.3104.3
83.5 107.287.4
107.0
74.4
125.5
91.2 97.2 81.0
95.0 95.4
111.1 90.8
108.1109.8 116.9100.0109.4 118.693.0
80.5
106.1
95.1
106.5 105.4
94.2
81.9105.7
98.5
133.1 103.8106.3
130.2 134.0
87.2 86.8 86.5
138.1113.3
84.4 101.7
88.4 100.1 83.8114.0 101.3
86.6 89.5 90.9
88.6
101.5
111.8
117.7
121.5
91.1
95.8
100.2
珠寶首飾、鐘錶及名貴禮物
97.8
91.6 93.5 95.978.7
98.597.7 99.7 101.1 136.6 88.6
85.388.3
96.2
78.9 80.1 57.1 75.4
85.3 87.1 102.7
101.8
99.0
87.5 105.1
105.8 105.794.6 95.3
92.7
98.8
103.3 90.7
106.7 116.8
101.1 93.6
101.4 93.795.3
113.6
80.7 82.3 110.2 152.5 93.8 94.798.2
115.6
81.5
98.1 105.0 92.9
76.8 93.2
116.0 129.2 95.6
96.4
114.6
94.9 100.6 94.4 99.8 111.3
99.5 85.4 103.1
117.2116.4 107.2
109.2 92.8
98.6
88.7 90.9 87.4 119.7
104.4 92.8 124.3
105.4
100.8 106.5 87.4 83.7 93.1
88.5
79.5 87.3 78.7 86.5
82.6 88.5 86.0
84.0 92.3 99.3 131.0
104.7 106.9 76.9
89.2 94.7 90.3 133.4 77.8 93.9 95.8
111.1 110.8 158.3
76.5
93.6
71.7 75.9
89.2
77.7 95.1 71.6 81.8
68.9 97.0
其他未分類耐用消費品
107.9 77.7
90.7
117.4
59.8 61.6 56.2 81.9 84.5 92.2 82.0 72.4
香港統計月刊 二零零三年六月 168 Hong Kong Monthly Digest of Statistics June 2003

9.1 零售業銷貨額
(Cont'd.) Retail Sales
年 月 價值 數量 價值 數量 價值 數量 價值 數量 價值 數量 價值 數量Year Month Value Volume Value Volume Value Volume Value Volume Value Volume Value Volume
2000200120022002 1
23456789
101112
2003 123 #
註釋: (1) 不包括百貨公司內的超級市場部門。 Note : (1) Not including supermarket sections of department stores.
資料來源: 政府統計處經銷及服務業統計組(一)甲 Source : Distribution and Services Statistics Section (1)A,(查詢電話:2802 1258) Census and Statistics Department
(Enquiry Telephone No.: 2802 1258)
91.8102.177.8 80.5 85.7 87.2 104.274.8 78.593.7 85.3 91.3 97.1
84.3 76.7 87.6 92.3
105.1
sections ofdepartment stores
105.8 105.7106.1
96.3
95.991.4
100.3
82.6 85.4
109.9112.1107.1
86.2 88.0110.0
69.9 72.397.3 88.3 93.9 99.5 85.3 89.0
87.3
61.6
66.5 68.6
64.678.374.9
零售指數(一九九九年十月至二零零零年九月期內每月平均指數=100)
Index of retail sales (Monthly average of October 1999 - September 2000=100)
100.2103.2
超級市場及
百貨公司內的
Supermarkets超級市場部門
其他消費品
Medicines and
102.4
105.8
105.5
109.399.098.0
99.6
97.7
105.2
100.7
107.4
100.399.0
109.1
99.8
107.1
106.8
and supermarket書報、文具及禮品 中藥 其他未分類消費品
Other consumer眼鏡店 藥物及化粧品
Optical shops
Other consumer goods
and herbs
102.0102.598.9 99.0
96.198.8 98.7
96.496.2
76.0 68.9 88.3 93.5 96.2
101.4 103.6108.896.0
100.8 114.5 116.7
106.0 107.5
104.786.1
93.3
103.1
102.3
(續)
Chinese drugs
94.7 95.794.1
Books, newspapers,
99.1 97.4
stationery and gifts
101.9
goods, not elsewhereclassified
cosmetics
95.699.2 99.2 97.497.5
96.4
88.7
87.1
91.1111.093.6
110.0108.2
93.5
101.1110.5
101.9
109.0 83.7106.7
95.597.2
118.2 119.2101.8
106.889.5106.4
100.0 90.7 95.191.396.4106.5
81.891.5 82.8 85.6
74.1 101.8110.7 100.5 102.4 106.7
107.3 102.1
84.1 88.5
107.3111.8 101.7 102.4 109.9 107.6
102.9 102.2
95.0 95.5 101.5 106.490.6108.3 111.0 105.6
97.5 88.4 93.3 98.6 104.4 103.2
100.7 104.8106.3
101.9 103.295.790.086.3
76.6 81.3
82.4 85.298.5
93.1106.6
102.5
106.095.7
84.7
107.1 97.1 120.7 128.0 104.2 109.2 130.9
79.8 72.6
86.2133.7 101.4 106.7
90.489.6 93.8 99.4 101.582.3 74.7 75.3 79.9 87.4 86.1118.3118.6
香港統計月刊 二零零三年六月 169 Hong Kong Monthly Digest of Statistics June 2003

9.2 食肆的收益
Restaurant Receipts
年 月 價值 數量 價值 數量 數量 價值 數量
Year Month Value Volume Value Volume Volume Value Volume
2000 100.1 100.2 100.2 99.6 100.9 105.6
2001 97.6 97.9 96.9 97.6 99.7 124.4
2002 92.3 93.8 89.1 94.8 96.0 142.7
2002 1 - 3 95.0 95.8 94.4 93.1 98.5 123.2 4 - 6 90.4 91.8 86.7 90.9 95.7 143.6 7 - 9 92.6 94.3 87.6 99.8 94.9 147.810 - 12 91.3 93.3 87.6 95.6 95.0 156.2
2003 1 - 3 # 86.8 88.8 81.1 93.8 92.9 128.8
資料來源: 政府統計處經銷及服務業統計組(一)甲 Distribution and Services Statistics Section (1)A,(查詢電話:2123 1040) Census and Statistics Department
(Enquiry Telephone No.: 2123 1040)
98.1 89.5 126.112,548.9 83.9 91.7 93.7
98.9 92.7 146.313,378.4 90.1 98.3 95.6
其他飲食場所
Other eating anddrinking places
快餐店
Fast food shops
酒吧
Bars
96.1 108.5 102.0 141.7
Source :
13,726.0
13,200.3 90.5 93.7
13,066.2 88.9 89.8
食肆收益指數
(一九九九年十月至二零零零年九月期內按季平均指數=100)Index of restaurant receipts
(Quarterly average of October 1999 - September 2000=100)
所有食肆類別
All restaurants
中式餐館 非中式餐館
Chinese Non-Chineserestaurants restaurants
Valueof
totalrestaurant
食肆
總收益
價值
(百萬元)
receipts($ million)
數量
53,371.0
價值
Volume
93.5
Value
91.3 96.5 140.991.797.8
價值
ValueVolume
96.0 96.8 105.6
Value數量價值
88.1 86.7
121.995.8 92.2 98.3 94.0 89.5
90.0 82.7 153.895.8
57,873.8 100.4 99.5 100.9
124.156,441.3 97.5 97.4 99.5
香港統計月刊 二零零三年六月 170 Hong Kong Monthly Digest of Statistics June 2003

9.3 業務收益指數
Business Receipts Indices(一九九六年按季平均指數=100)
(Quarterly average of 1996=100)2001 2002 2002 2002 2002
第四季 第一季 第二季 第三季 第四季
2000 2001 2002 Q4 Q1 Q2 Q3 Q4
甲部 : 服務行業統計數字Part A : Statistics for Service Industries
批發/零售 Wholesale/Retail 80.4 77.3 72.9 74.0 73.9 74.1 71.9 71.5細分: breakdown :批發 Wholesale 74.6 65.7 58.6 63.3 56.6 59.2 59.4 59.4零售 Retail 83.4 82.3 79.0 78.7 81.3 80.5 77.4 76.8
進出口貿易 Import/Export trade 87.3 75.0 72.9 72.0 64.2 71.2 80.5 75.9
食肆 Restaurants 104.6 102.0 96.4 101.4 99.2 94.4 96.7 95.4
酒店 Hotels 74.9 69.2 67.6 70.8 63.5 67.0 60.1 79.7
運輸 Transport 115.4 112.6 115.2 114.1 101.4 111.4 121.9 126.3其中: within which :航空運輸 Air transport 153.6 136.0 151.9 144.5 128.0 146.2 156.1 177.3陸上運輸 Land transport 103.5 106.0 103.0 106.9 100.3 102.9 104.2 104.6海運 Maritime transport 111.1 122.7 119.1 121.5 99.4 113.6 134.6 128.7
倉庫 Storage 74.7 63.6 51.1 55.9 51.0 49.6 51.7 52.1
通訊 Communications 107.5 93.4 90.9 92.7 88.6 91.4 90.4 93.2其中: within which :電訊 Telecommunications 104.6 89.4 84.9 87.8 84.3 85.4 84.1 85.6
銀行 Banking 104.8 107.6 106.7 111.6 98.7 106.5 101.7 119.8
金融 Financing 125.2 109.4 93.8 101.1 92.8 102.8 89.6 89.9(銀行除外)(1) (except banking)(1)
其中: within which :金融市場及 Financial markets and 132.9 106.4 91.3 97.2 90.6 101.8 89.9 83.0基金管理服務 fund management services
保險 Insurance 136.3 155.7 171.7 175.2 148.4 171.1 165.9 201.5
地產(2) Real estate(2) 74.1 61.6 60.0 61.6 59.4 65.4 56.8 58.4
商用服務 Business services 93.8 84.8 79.9 84.2 77.9 81.7 78.8 81.3其中: within which :專業服務 Professional services 91.9 90.8 85.4 87.7 84.6 87.2 85.0 84.8
電影 Film entertainment 106.1 122.3 111.2 118.1 112.3 108.4 108.1 116.0
Part B : Supplementary Statistics for Service Domains
旅遊、會議及 Tourism, convention and 72.5 71.4 76.8 74.2 66.2 78.3 72.0 90.8展覽服務 exhibition services
電腦及有關 Computer and information 141.8 125.3 132.4 122.7 125.3 129.7 135.8 138.7服務 services
註釋: (1) 不包括投資及控股公司。 Notes : (1) Not including investment and holding companies.(2) 不包括地產發展。 (2) Not including real estate development.
資料來源: 政府統計處經銷及服務業統計組(二)甲 Source : Distribution and Services Statistics Section (2)A,(查詢電話:2802 1269) Census and Statistics Department
(Enquiry Telephone No.: 2802 1269)
乙部 : 服務界別補充統計數字
香港統計月刊 二零零三年六月 171 Hong Kong Monthly Digest of Statistics June 2003

9.4 選定服務業生產者價格指數(1)
Producer Price Indices of Selected Service Industries(1)
(2001=100)酒店及旅舍業
Hotels and 陸上運輸業 海上運輸業Boarding Land Maritime
Year Houses Transport Transport
2000 99.0 98.7 100.5 105.92001 100.0 100.0 100.0 100.02002 98.9 103.9 98.1 97.02001 10 - 12 98.9 99.8 99.9 95.72002 1 - 3 95.4 100.4 98.5 95.6
4 - 6 98.0 100.4 98.0 96.6 7 - 9 93.9 105.0 98.1 99.310 - 12 108.2 109.6 97.8 96.6
地產保養管理、經紀及代理服務 法律、會計、
機械及設備 Real Estate 證券、期貨及 核數及簿記服務租賃業 Maintenance 金銀經紀服務 Legal, Accounting,
Rental of Management, Stock, Commodity Auditing and倉庫業 Machinery and Brokerage and and Bullion Bookkeeping
Year Storage Equipment Agency Services Brokerage Services Services
2000 N.A. N.A. N.A. N.A.2001 100.0 100.0 100.0 100.02002 91.3 97.5 99.1 98.82001 10 - 12 96.5 100.0 99.5 99.82002 1 - 3 92.9 98.9 100.1 98.9
4 - 6 90.8 98.5 99.2 98.7 7 - 9 89.7 97.5 98.4 99.010 - 12 91.9 94.8 98.5 98.5
註釋 : Notes : (1)
(2)
資料來源: 政府統計處經銷及服務業統計組(二)乙 Source : Distribution and Services Statistics Section (2)B,(查詢電話:2123 1038) Census and Statistics Department
(Enquiry Telephone No.: 2123 1038)
年 AirMonth communications Services(2) Transport月 Tele- Communication
106.3
98.8
其他通訊服務(2)
電訊業 Miscellaneous 航空運輸業
109.2100.0100.0
89.384.7
81.2 100.3
98.2
The Producer Price Indices from 2002 onwards are compiledwith year 2001 as the base year. Indices for periods prior to2002 are obtained by re-scaling the previously published serieswhich used 1999 as the base year.
二零零二年起的服務業生產者價格指數是以二零零一年為基期編製。二零零二年以前的指數,是把先前刊載以一九九九年為基期的舊數列按比例換算得來。
"Miscellaneous communication services" mainly compriselocal and international courier services.
「其他通訊服務」主要包括本地及國際際速遞服務。
#
94.0
(1)
(2)
年 月
N.A.100.0
Month
#
78.7 105.9#79.5 100.281.9
#
96.9
87.789.6
89.798.0
87.4
香港統計月刊 二零零三年六月 172 Hong Kong Monthly Digest of Statistics June 2003

9.5 本地公司及在本港以外註冊成立公司:登記、清盤及解散數目Local Companies and Companies Incorporated Outside Hong Kong :Number Registered, Wound-up and Dissolved
解散總數(1) 登記冊上的公司數目(2)
Total dissolved(1) Companies on register(2)
公眾 私人 公眾 私人
公司 公司 公司 公司
年 Public Private 總數 Public Private 總數
Year Month companies companies Total companies companies Total
2000 388 42 971 43 359 22 826 6 310 505 193 511 5032001 347 37 911 38 258 39 495 6 576 503 804 510 3802002 466 46 088 46 554 53 918 6 922 496 189 503 1112002 2 24 2 646 2 670 3 759 6 629 502 534 509 163
3 30 3 679 3 709 4 828 6 644 501 408 508 0524 35 4 478 4 513 3 872 6 670 502 033 508 7035 34 4 699 4 733 5 246 6 693 501 504 508 1976 50 3 782 3 832 3 906 6 742 501 386 508 1287 40 4 223 4 263 4 344 6 769 501 286 508 0558 50 3 908 3 958 5 122 6 800 500 101 506 9019 42 3 664 3 706 4 218 6 830 499 565 506 395
10 46 3 685 3 731 4 416 6 868 498 850 505 71811 39 3 964 4 003 5 485 6 895 497 352 504 24712 33 3 656 3 689 4 834 6 922 496 189 503 111
2003 1 29 4 369 4 398 5 131 6 938 495 450 502 3882 28 3 385 3 413 4 881 6 952 493 977 500 9293 42 9 268 9 310 5 999 6 976 497 270 504 2464 27 1 804 1 831 5 928 6 988 493 168 500 156
本港公司
月
註冊成立(1)
Incorporated(1)
Local companies
173香港統計月刊 二零零三年六月 Hong Kong Monthly Digest of Statistics June 2003

9.5 (續) 本地公司及在本港以外註冊成立公司:登記、清盤及解散數目 (Cont'd.) Local Companies and Companies Incorporated Outside Hong Kong :
Number Registered, Wound-up and Dissolved
本港公司 --- 續Local companies --- cont'd.
清盤(1)
Liquidation(1)
強制清盤
Compulsory winding-up 清盤開始 公司解散
Commencement Dissolution股東 債權人 股東 債權人 登記冊上
自動清盤 自動清盤 自動清盤 自動清盤 遞交的 註冊 停業 的公司
Members' Creditors' Members' Creditors' 呈請書 總數(1) 總數(1) 數目(2)
年 voluntary voluntary voluntary voluntary Petitions Total Total ceased Total onYear winding-up winding-up winding-up winding-up presented registered(1) business(1) register(2)
2000 1 581 164 2 641 219 1 241 814 350 6 0932001 1 178 229 1 512 148 1 401 812 448 6 4572002 1 085 267 1 264 156 1 430 700 447 6 7102002 88 16 80 10 100 43 30 6 454
116 17 127 10 105 99 33 6 520 106 23 124 10 135 55 37 6 538
62 21 77 18 106 50 27 6 561 79 26 102 17 124 52 32 6 581
109 45 118 7 139 58 41 6 598 88 23 111 14 152 61 34 6 625 74 19 94 10 103 61 49 6 637 75 23 86 15 109 73 40 6 670 84 18 107 15 107 75 32 6 713 87 13 95 19 120 39 42 6 710
2003 99 22 114 33 142 71 35 6 746 66 14 83 23 112 44 29 6 761 74 16 90 27 123 102 59 6 804 92 29 96 30 97 41 27 6 818
註釋: (1) 在期內的數目。 Notes : (1) Number during the period.(2) 在期末的數目。 (2) Number at end of the period.
資料來源: 公司註冊處 Sources : Company Registry(查詢電話:2867 2593); (Enquiry Telephone No.: 2867 2593);破產管理署 Official Receiver's Office(查詢電話:2867 2453) (Enquiry Telephone No.: 2867 2453)
68 95
133138
12890
125151
676284
148
1 0661 292
7067
3
2
9
78
3
1
101112
4 110
發出的
910
清盤令Winding-up
Orders made
4
2
在香港以外註冊成立公司
自動清盤Voluntary winding-up
Companies incorporatedoutside Hong Kong
月Month
65
174香港統計月刊 二零零三年六月 Hong Kong Monthly Digest of Statistics June 2003

香港統計月刊 二零零三年六月 Hong Kong Monthly Digest of Statistics June 2003175
社會狀況
Social Conditions
概念及方法 Concepts and Methods
有關舉報的罪案統計數字,被捕人數的計算
方法是按罪犯被捕的次數而定。若某人在兩
宗或以上事件中被捕,會於每次事件中分別
記錄為一個人。若某人在一宗事件中因數項
罪名被捕,則只選其中可被判最重刑罰的一
項罪名作統計之用。
For statistics of reported crime, counting of personsarrested is based on the number of occasions onwhich the offenders are arrested. If a person isarrested on two or more occasions, each occasion iscounted as a 'separate' person. If a person is arrestedon one occasion for several offences, the offence withthe heaviest maximum permissible penalty is chosenfor tabulation purposes.
按照檢疫及防疫條例,所有醫生如發現任何
在該條例第一附表內列明的傳染病,都必須
向生署署長報告。每一宗報告代表一宗個
案。由於一宗食物中毒個案可能會涉及多於
一人,受影響的人數亦須向生署呈報。
Under the Quarantine and Prevention of DiseaseOrdinance, all medical practitioners are required tonotify the Director of Health any infectious diseaseencountered, as stipulated in the First Schedule of theOrdinance. One notification is counted as a case oran outbreak. As a food poisoning case may involvemore than one person, the number of persons affectedis reported as well.
因傳染病而死亡的人數,乃根據國際疾病、
傷害及死因統計分類計算。
Statistics on deaths caused by infectious disease arecompiled according to the International StatisticalClassification of Diseases, Injuries and Cause ofDeaths.
住院病人病床住用率,是指住院病人的實際
住用病床日數目在可供住用病床日總數中所
佔的百分率。
The in-patient bed occupancy rate refers to thenumber of bed-days occupied by in-patientsexpressed as a percentage of the total number of bed-days available.
社會保障計劃的個案數目,代表財政年度/
月份完結時的情況及包括所有在運作程序中
而未發放款項的個案。發放款項是指整個財
政年度/月份內所發放的款項。
For statistics on social security schemes, number ofcases refer to those as at end of financial year/monthand include those under processing for whichpayment has not been made, and amount of paymentrefers to the payment made for the financialyear/month.
綜合社會保障援助計劃的個案,可指一個單
身受助人士或一個受助家庭。個案的性質是
基於參考個案中合資格成員的資料,並依據
一套既定準則而分類。
For the Comprehensive Social Security Assistance(CSSA) Scheme, a case may refer to a single personor a family. The nature of a case is classified inaccordance with a prescribed set of rules and criteriawhich make reference to the particulars of the eligiblemember(s) in the case.
公共福利金計劃的一宗個案指一位受助人
士。
For the Social Security Allowance (SSA) Scheme, acase refers to an individual recipient.
家庭個案工作服務是由分布全港的家庭服務
中心提供。此項服務的目的是維繫及鞏固家
庭單位,包括協助個人和家庭防止問題及困
難產生,及在發生困難期間給予協助及實際
支持。
Family casework services are provided throughFamily Services Centres distributed throughout theterritory. It aims to preserve and strengthen thefamily as a unit by helping individuals and families toprevent problems or crises and by providingassistance and practical support during crisis periods.

香港統計月刊 二零零三年六月 Hong Kong Monthly Digest of Statistics June 2003176
長者宿舍為能夠照顧自己但在日常生活中需
要心理支援和指導的長者提供群體的住宿環
境。
Hostels for the elderly provide communal livingaccommodation for elders who, though capable ofself-care, are in need of psychological support andsupervision in their daily life.
安老院為長者提供住宿照顧服務,包括居
所、膳食、洗衣、有限度的起居照顧及社交
活動。
Homes for the aged provide residential care for eldersin the form of accommodation, meals, laundryservice, limited personal care and social activities.
護理安老院為健康欠佳或有殘障的長者提供
居所,給予一般的起居照顧及有限度的護理
服務。
Care and attention homes provide accommodationwith general personal care and limited nursing care tothe elders with poor health or physical/mentaldisabilities.
護養院為健康欠佳或有殘障的長者提供居所
並給予日常醫療護理和康復服務,以及起居
照顧服務。
Nursing homes provide accommodation, regularmedical, nursing and rehabilitative services, andpersonal care to elders who suffer from poor health orphysical/mental disabilities.
長者綜合服務中心在地區層面為長者提供各
式各樣的服務,包括輔導、教育及發展性活
動、社交與康樂活動、家務助理服務、飯
堂、洗衣及沐浴設施、社區教育服務,以及
長者支援服務隊提供的網絡服務和長者義工
服務。
Multi-service centres for the elderly provide a fullrange of services on a district basis to eldersincluding counselling, educational anddevelopmental, social and recreational activities,home help, canteen, laundry and bathing facilities,community education, and social networking servicesas well as promotion of senior volunteerism providedby support teams for the elderly.
長者活動中心在鄰舍層面提供服務,以滿足
區內長者對社交及康樂活動,與教育及發展
性活動的需求。
Social centres for the elderly are designed to meetsocial and recreational, educational anddevelopmental needs of elders on a neighbourhoodbasis.
長者日間護理中心為經過統一評估機制評定
在身體機能上有中度或以上受損,需倚賴家
人照顧,但家人無法在日間給予照料的長者
而設。中心會提供家居及照顧服務,例如起
居照顧、復康運動及有限度的護理、膳食、
康樂活動等。
Day care centres for the elderly provide services forelders who are assessed to be suffering frommoderate level of impairment or above by theStandardized Care Need Assessment Mechanism anddependent on family members in their daily livingactivities but whose families have difficulty inlooking after them during the day. The servicesprovided by the centres include personal care,rehabilitative exercises, limited nursing care, mealsand recreational activities.
其他有關刊物 Further References
生署年報,生署編製 Department of Health Annual Report, published bythe Department of Health
香港統計年刊 Hong Kong Annual Digest of Statistics香港警察年報,香港警務處編製 Hong Kong Police Force Review, published by the
Hong Kong Police Force香港社會及經濟趨勢 Hong Kong Social and Economic Trends醫院管理局統計年報,醫院管理局編製 Hospital Authority Statistical Report, published by
the Hospital Authority

圖 10.1 綜合社會保障援助(綜援)計劃 (1)
Chart 10.1 Comprehensive Social Security Assistance (CSSA) Scheme (1)
(甲) 個案數目 (2)
(a) Number of Cases (2)
(乙) 發放款項 (3)
(b) Amount of Payment (3)
註釋: (1) 由1993年7月1日起,綜合社會保障援助
計劃已取代公共援助計劃。此計劃包括
發放給受助人士的傷殘津貼和高齡津貼
款項。因此,1993/94年度及以後的數字
,不能與以前的數字作嚴格比較。
Notes: (1)
(2) 全年的個案數目指財政年度終結時的數
字。
(2)
(3) 綜援發放款項包括預發的下月款項及 /
或已撇除上月已預發的款項。
(3)
As from 1.7.1993 onwards, the Public AssistanceScheme has been replaced by the ComprehensiveSocial Security Assistance (CSSA) Scheme whichincludes payments of Disability Allowance and OldAge Allowance to CSSA recipients. Hence, figures asfrom 1993/94 and those of previous periods are notstrictly comparable.Annual number of cases is as at end of the financialyear.Amount of payment for CSSA includes advancepayments for next month and / or excludes advancepayments covered in preceding month.
0
50
100
150
200
250
300
4/01 8/01 12/01 4/02 8/02 12/02 4/03
千宗Thousands
0
50
100
150
200
250
300
92/93 94/95 96/97 98/99 00/01 02/03
千宗
Thousands
0
200
400
600
800
1,000
1,200
1,400
1,600
1,800
4/01 8/01 12/01 4/02 8/02 12/02 4/03
百萬元
$ million
0
2,000
4,000
6,000
8,000
10,000
12,000
14,000
16,000
18,000
92/93 94/95 96/97 98/99 00/01 02/03
百萬元$ million
177香港統計月刊 二零零三年六月 Hong Kong Monthly Digest of Statistics June 2003

10.1 罪案統計數字Statistics of Crimes
舉報個案數目
Cases reported
2000 2002 2002 2002 2002 2002 2003第一季 第二季 第三季 第四季 第一季
罪案 Crime 1st Qtr 2nd Qtr 3rd Qtr 4th Qtr 1st Qtr
暴力罪案 Violent crime 強姦 Rape 104 95 25 26 27 18 15 非禮 Indecent assault 1 124 991 212 283 259 239 230 謀殺及誤殺 Murder and manslaughter 43 69 14 17 20 18 13 意圖謀殺 Attempted murder 7 13 2 5 3 4 0 傷人 Wounding 1 810 1 858 472 485 492 409 417 嚴重毆打 Serious assault 5 093 4 987 1 112 1 307 1 275 1 299 1 328 襲警 Assault on police 547 399 83 99 119 98 135 綁架及拐帶兒童 Kidnapping and child stealing 4 3 2 0 1 0 0 虐待兒童 Cruelty to child 178 201 33 66 45 58 53 刑事恐嚇 Criminal intimidation 1 135 845 200 209 212 225 267 使用槍械行劫 Robbery with firearms/arms 8 6 2 0 1 3 1 使用類似手槍 Robbery with pistol- 76 56 15 16 14 11 9 物體行劫 like objects 其他行劫 Other robberies 3 349 3 431 767 930 875 857 683 嚴重爆竊 Aggravated burglary 5 9 2 5 1 1 1 勒索 Blackmail 550 557 124 157 129 147 151 縱火 Arson 779 620 184 141 142 152 236
暴力罪案合計 Total violent crime 14 812 14 140 3 249 3 746 3 615 3 539 3 539
非暴力罪案 Non-violent crime 爆竊 Burglary 8 964 8 202 1 990 1 969 2 140 2 104 2 028 搶掠 Snatching 1 032 1 088 206 264 334 285 260 扒竊 Pickpocketing 865 859 187 183 236 252 430 店鋪盜竊 Shop theft 6 973 8 122 2 150 2 052 1 931 1 988 2 229 車輛內盜竊 Theft from vehicle 3 228 2 647 513 608 805 723 1 054 擅自取去 Taking conveyance without 2 862 2 432 619 591 633 591 592 交通工具 authority 其他盜竊 Other thefts 15 610 16 877 3 637 4 068 4 318 4 871 5 521 接贓 Handling stolen goods 116 140 38 41 30 31 34 行騙及偽造 Deception, fraud and forgery 5 090 6 041 1 560 1 513 1 471 1 523 1 662 色情罪行(強姦 Sexual offences other than 938 773 188 220 171 194 231 及非禮除外) rape and indecent assault 嚴重毒品罪行(1) Serious narcotics offences(1) 2 312 2 243 530 623 573 525 478 嚴重非法入境 Serious immigration 2 008 1 074 291 325 239 218 185 罪行 offences 刑事毀壞 Criminal damage 7 022 6 192 1 488 1 521 1 528 1 659 1 989 非法會社罪行 Unlawful society offences 1 014 854 221 265 189 179 177 藏有槍械/彈藥/ Possession of arms/ammunition/ 567 613 167 142 139 167 151 攻擊性武器 offensive weapon 其他罪行 Other crimes 3 832 3 580 820 909 975 869 1 087非暴力罪案合計 Total non-violent crime 62 433 61 737 14 605 15 294 15 712 16 179 18 108
總計(警方案件) Grand total (Police cases) 77 245 75 877 17 854 19 040 19 327 19 718 21 647
賄賂及貪污 Bribery and corruption 3 348 3 252 787 885 874 706 778(廉署案件)(2) (ICAC cases)(2)
2001
95
661 007
31 7014 771
4316
181888
556
3 1065
556674
13 551
8 637845717
7 4702 8812 573
15 056124
5 351753
2 4731 654
59 457
73 008
3 499
5 904919598
3 502
178香港統計月刊 二零零三年六月 Hong Kong Monthly Digest of Statistics June 2003

10.1 (續) 罪案統計數字(Cont'd.) Statistics of Crimes
被捕人數
Persons arrested
2000 2001 2002 2002 2002 2002 2003第一季 第二季 第三季 第四季 第一季
罪案 Crime 1st Qtr 2nd Qtr 3rd Qtr 4th Qtr 1st Qtr
暴力罪案 Violent crime 強姦 Rape 99 85 26 24 32 14 12 非禮 Indecent assault 745 658 153 185 180 167 155 謀殺及誤殺 Murder and manslaughter 64 47 10 20 20 14 23 意圖謀殺 Attempted murder 3 2 1 2 3 0 0 傷人 Wounding 1 357 1 240 291 358 383 334 301 嚴重毆打 Serious assault 3 741 3 495 695 929 878 926 914 襲警 Assault on police 367 259 60 66 79 63 88 綁架及拐帶兒童 Kidnapping and child stealing 7 15 5 0 16 0 0 虐待兒童 Cruelty to child 168 164 31 57 41 50 47 刑事恐嚇 Criminal intimidation 652 513 151 134 135 141 157 使用槍械行劫 Robbery with firearms/arms 3 1 0 0 3 0 0 使用類似手槍 Robbery with pistol- 21 33 4 0 2 4 6 物體行劫 like objects 其他行劫 Other robberies 1 497 1 338 337 402 277 355 279 嚴重爆竊 Aggravated burglary 2 3 0 1 1 0 0 勒索 Blackmail 590 484 126 130 139 147 174 縱火 Arson 181 98 30 19 33 16 36
暴力罪案合計 Total violent crime 9 497 8 435 1 920 2 327 2 222 2 231 2 192
非暴力罪案 Non-violent crime 爆竊 Burglary 976 869 184 193 195 177 153 搶掠 Snatching 249 213 40 61 87 68 69 扒竊 Pickpocketing 408 387 111 124 96 90 101 店鋪盜竊 Shop theft 6 852 7 201 2 115 1 986 1 768 1 884 2 126 車輛內盜竊 Theft from vehicle 532 443 91 65 136 83 122 擅自取去 Taking conveyance without 208 185 41 42 41 76 78 交通工具 authority 其他盜竊 Other thefts 5 487 5 103 1 113 1 211 1 339 1 447 1 397 接贓 Handling stolen goods 146 166 51 50 34 43 39 行騙及偽造 Deception, fraud and forgery 2 040 2 063 493 572 667 681 579 色情罪行(強姦 Sexual offences other than 911 777 175 240 145 179 207 及非禮除外) rape and indecent assault 嚴重毒品罪行(1) Serious narcotics offences(1) 2 859 3 064 639 776 794 708 598 嚴重非法入境 Serious immigration 1 929 1 574 284 312 217 203 168 罪行 offences 刑事毀壞 Criminal damage 1 730 1 430 333 399 330 364 424 非法會社罪行 Unlawful society offences 673 702 155 212 333 119 101 藏有槍械/彈藥/ Possession of arms/ammunition/ 584 634 178 146 172 175 167 攻擊性武器 offensive weapon 其他罪行 Other crimes 5 849 5 583 1 330 1 402 1 556 1 399 1 476非暴力罪案合計 Total non-violent crime 31 433 30 394 7 333 7 791 7 910 7 696 7 805
總計(警方案件) Grand total (Police cases) 40 930 38 829 9 253 10 118 10 132 9 927 9 997
賄賂及貪污 Bribery and corruption 605 530 125 202 161 114 142(廉署案件)(2)(3) (ICAC cases)(2)(3)
Notes :
quarterly figures.(1) (1)(2) (2)
(3) (3)
Sources :
821673
2 903
1 425
1 022
179
5 73630 884
Quarterly figures do not add up to annual figures due to further
602
四季數字之和與全年數字不合,是因某些罪案經
深入調查後被重新界定分類。
39 665
註釋:
(查詢電話:2860 8448);
facilitated by, suspected corruption offences, and offences
(Enquiry Telephone No.: 2860 8448);
(Enquiry Telephone No.: 2826 3267)廉政公署(查詢電話:2826 3267)
括由警方辦理的案件。只包括被檢控人數。
香港警務處
listed in ICAC Ordinance Section 10(5). These figures include
只包括向警方舉報的案件/被警方拘捕的人數。這包括與涉嫌貪污罪行有關或由其直接或間接
促成的罪行,以及列於廉政公署條例第 10(5)條的罪行。數字包括有關選舉的個案但並不包
Independent Commission Against Corruption
Refer to persons prosecuted only.
Hong Kong Police Force
reports and reclassification of crimes after the compilation of
Refer to cases reported to/persons arrested by Police only.
election related cases, but exclude cases handled by the Police.
These include offences connected with, or directly or indirectly
7 766
2 452753
376204
5 144
3
752257421
2002
97687
666
1 3713 465
26921
資料來源:
186566
5
54999
8 781
10
1 381
179香港統計月刊 二零零三年六月 Hong Kong Monthly Digest of Statistics June 2003

10.2 留院及門診服務In-patient and Out-patient Services(甲) 生署
(A) Department of Health
住院及日間
病人出院及
死亡數字(1)
In-patient 急症
and day-patient Accident年 月 discharges 敷藥 and
Year Month and deaths(1) Dressings emergency attendances(3)(4)
2000 35 20 0.0 699 033 15 6002001 32 20 0.0 713 358 14 8402002 # 47 20 0.0 697 243 12 9912002 1 - 3 7 20 0.0 161 275 3 242
4 - 6 # 14 20 0.0 177 094 3 646 7 - 9 # 17 20 0.0 187 751 3 471 10 - 12 # 9 20 0.0 171 123 2 632
2003 1 - 3 # 11 20 0.0 152 600 2 906註釋: (1) 日間病人指入院而於同日出院的病人。 Notes: (1)
discharged in the same day.(2) 指年底/季末數字。 (2) Refer to the end of year/quarter figures.(3) 數字包括懲教機構。 (3) Figures include Correctional Institutions.(4) 由於學生健康服務及學童牙科保健服務的每年 (4)
數字是指該學年內的到診/到訪人次,所以按
季數字的總和不等於按年數字。 Care Service are reported on school year basis.資料來源: 生署 Source: Department of Health
(查詢電話:2961 8568) (Enquiry Telephone No.: 2961 8568)
(乙) 醫院管理局
(B) Hospital Authority
年 月
Year Month
200020012002 #
2002 1 - 3 4 - 6 #
7 - 9 #
10 - 12 #
2003 1 - 3 #
註釋: (1) 日間病人指入院而於同日出院的病人。 Notes : (1)
discharged in the same day.(2) 住院病人包括經由急症室入院而於同日出院的病人。 (2) In-patients include accidents and emergency day admissions(3) 僅指由醫生診視的人次。 (3) Refer to doctor consultations.(4) 包括專職醫療門診人次。 (4) Include allied health out-patient attendances.(5) 到診人次包括首次及覆診個案。 (5) Attendances figures include first and follow-up cases.
資料來源: 醫院管理局 Source : Hospital Authority(查詢電話:2300 6515) (Enquiry Telephone No.: 2300 6515)
Day-patients refer to patients who are admitted and
醫生診視Doctor
consultations
Day-patients refer to patients who are admitted and
1 276 3971 312 7981 348 7561 336 182
5 652 895
40 848
Specialistout-patient
專科門診到診人次(4)
General診人次(3)
病床住用率
rate (%)
830 831
Accident andemergency total
attendances(5)
2 423 0792 521 359
8 112 043 813 013
attendances(3) attendances(4)
out-patient
(百分比)
1 885 7271 960 948
普通科門診到診人次(3)
General out-patient attendances (3)
44 130
注射Injections
5 575 250 171 615
1 319 174
7 410 8617 390 2937 567 5871 794 822 41 178
5 257 125
bed
rate (%)
178 505
171 059
住院病人
病床住用率
(百分比)In-patient
84.3 298 705 264 4381 205 554 1 206 716
2 030 667
2 223 6772 140 293
319 611 2 169 792 315 898
322 645
306 769
291 237 82.8
299 633 83.9
301 193 82.3 306 023 83.6
available(2)
occupancy
83.5
住院及日間
1 209 753 84.5
病人出院及
In-patient
住院病人(2)
死亡數字(1)
beds
2 086 440
and day-patient In-patient(2)
dischargesand deaths(1)
1 151 807
bed occupancy
85.2
40 208
其他門診到診人次 (3)(4)
Otherout-patient
可供住用
的留醫病床(2)
In-patient
576 116
急症
室總求診人次(5)
621 496 615 801 599 679 588 468
1 947 2651 860 449
2 425 4448 620 202
attendances of the Student Health Service and School Dental
44 903
Quarterly figures do not add up to annual figures as the annual
普通科
門診到
8 379 236
180香港統計月刊 二零零三年六月 Hong Kong Monthly Digest of Statistics June 2003

10.3 已呈報的傳染病
Notified Infectious Diseases2000 2001 2002# 2002 2002 2002 2002 2003
第一季# 第二季# 第三季# 第四季# 第一季#
病類 Disease 1st Qtr# 2nd Qtr# 3rd Qtr# 4th Qtr# 1st Qtr#
急性脊髓灰質炎 Acute 宗 Cases 1 0 0 0 0 0 0 0(小兒麻痺)(1) poliomyelitis(1) 死亡 Deaths 0 0 0 0 0 0 0 N.A.
阿米巴痢疾 Amoebic dysentery 宗 Cases 3 6 4 0 0 3 1 3死亡 Deaths 0 0 0 0 0 0 0 N.A.
桿菌痢疾 Bacillary dysentery 宗 Cases 310 390 285 32 55 135 63 28死亡 Deaths 0 0 0 0 0 0 0 N.A.
水痘 Chickenpox 宗 Cases 8 556 16 472 16 792 6 264 4 132 2 554 3 842 3 258死亡 Deaths 1 0 0 0 0 0 0 N.A.
霍亂 Cholera 宗 Cases 12 38 4 0 1 3 0 0死亡 Deaths 0 1 0 0 0 0 0 N.A.
登革熱 Dengue fever 宗 Cases 11 17 44 2 4 21 17 10死亡 Deaths 0 0 0 0 0 0 0 N.A.
食物中毒 Food poisoning 宗 Outbreaks 618 671 671 107 147 295 122 92(受影響 (Persons (2 452) (2 707) (2 647) (404) (635) (1 158) (450) (467)人數) affected)死亡 Deaths 0 0 0 0 0 0 0 N.A.
退伍軍人病 Legionnaires' 宗 Cases 2 3 4 1 0 2 1 1 disease 死亡 Deaths 0 0 0 0 0 0 0 N.A.
麻風 Leprosy 宗 Cases 11 10 6 2 3 0 1 2死亡 Deaths 0 0 0 0 0 0 0 N.A.
瘧疾 Malaria 宗 Cases 35 47 54 8 10 17 19 7死亡 Deaths 1 2 0 0 0 0 0 N.A.
麻疹 Measles 宗 Cases 61 179 61 15 29 12 5 13死亡 Deaths 0 0 0 0 0 0 0 N.A.
腦膜炎雙球菌 Meningococcal 宗 Cases 14 10 6 3 3 0 0 1感染 infections 死亡 Deaths 1 1 1 0 1 0 0 N.A.
流行性腮腺炎 Mumps 宗 Cases 77 67 90 16 18 30 26 30死亡 Deaths 0 0 0 0 0 0 0 N.A.
副傷寒 Paratyphoid fever 宗 Cases 13 21 21 0 7 5 9 8死亡 Deaths 0 0 0 0 0 0 0 N.A.
狂犬病 Rabies 宗 Cases 0 1 0 0 0 0 0 0死亡 Deaths 1 1 0 0 0 0 0 N.A.
風疹(德國麻疹) Rubella 宗 Cases 2 338 51 36 14 12 5 5 6死亡 Deaths 0 0 0 0 0 0 0 N.A.
猩紅熱 Scarlet fever 宗 Cases 123 147 121 33 34 21 33 39死亡 Deaths 0 0 0 0 0 0 0 N.A.
嚴重急性呼吸 Severe acute 宗 Cases N.A. N.A. N.A. N.A. N.A. N.A. N.A. 592系統綜合症(2) respiratory 死亡 Deaths N.A. N.A. N.A. N.A. N.A. N.A. N.A. N.A.
syndrome(2)
破傷風 Tetanus 宗 Cases 7 4 2 0 0 1 1 2死亡 Deaths 2 1 0 0 0 0 0 N.A.
結核病 Tuberculosis 宗 Cases 7 578 7 262 6 665 1 497 1 652 1 816 1 700 1 547死亡 Deaths 299 311 221 57 55 60 49 N.A.
傷寒 Typhoid fever 宗 Cases 105 67 67 5 16 22 24 22死亡 Deaths 1 0 0 0 0 0 0 N.A.
斑疹傷寒 Typhus 宗 Cases 4 7 13 0 3 7 3 0死亡 Deaths 0 0 0 0 0 0 0 N.A.
病毒性肝炎 Viral hepatitis 宗 Cases 683 677 431 190 118 69 54 68死亡 Deaths 4 5 6 1 3 1 1 N.A.
百日咳 Whooping cough 宗 Cases 11 15 23 3 14 3 3 4死亡 Deaths 0 0 0 0 0 0 0 N.A.
總計 Total 宗 Cases 20 573 26 162 25 400 8 192 6 258 5 021 5 929 5 733死亡 Deaths 310 322 228 58 59 61 50 N.A.
註釋 : Notes :
傳染病宗數為生署所知悉的個案。
資料來源: 生署 Source : Department of Health(查詢電話:2961 8566) (Enquiry Telephone No.: 2961 8566)
在上述時期內,並沒有接獲呈報白喉、瘟疫、回歸熱或黃熱病的個案。
死亡數字代表期內在入境事務處登記的死亡人數,而不依據個案呈報生署的日期。
No case of diphtheria, plague, relapsing fever or yellow fever was reportedduring the specified periods.Number of cases refers to notifications of infectious disease cases known tothe Department of Health.
A case of vaccine-associated acute poliomyelitis occurred in 1995 but wasreported in August 2000.
(1)
Severe acute respiratory syndrome has been made notifiable since 27March 2003.
(2)
Number of deaths refers to deaths registered at the Immigration Department inthe period, irrespective of the date of notification to the Department of Health.
(2) 嚴重急性呼吸系統綜合症於二零零三年三月二十七 日列為須呈報的傳染病。
(1) 一宗由脊髓灰質炎疫苗病毒而引發的急性脊髓灰質 炎個案於一九九五年發生,但於二零零零年八月才
呈報。
香港統計月刊 二零零三年六月 181 Hong Kong Monthly Digest of Statistics June 2003

10.4 綜合社會保障援助計劃Comprehensive Social Security Assistance Scheme
年(1) 月 年老
Year(1) Month Old age
2000-2001 135 4092001-2002 139 2882002-2003 143 5852002 2 138 712
3 139 2884 139 8405 140 2886 140 5767 141 2238 141 6479 141 897
10 142 22011 142 59012 142 762
2003 1 142 9312 143 2113 143 5854 143 809
申請
個案數目
單親家庭 低收入 Number 年(1) 月 Single Low Unemploy- ofYear(1) Month parent family earnings applications
2000-2001 26 078 8 319 59 3132001-2002 29 534 9 140 71 2492002-2003 34 249 10 982 84 8672002 2 29 079 9 082 4 766
3 29 534 9 140 *** 6 9844 30 025 9 333 ***+ 7 3925 30 350 9 557 + 7 3836 30 710 9 670 *** 6 8437 31 191 9 934 + 7 8768 31 728 10 101 *** 7 4749 32 262 10 234 ***+ 7 273
10 32 592 10 412 + 7 41111 32 883 10 498 *** 6 94712 33 156 10 607 ***+ 6 001
2003 1 33 568 10 674 ***+ 6 4112 33 881 10 730 + 6 1803 34 249 10 982 7 6764 34 591 11 396 *** 8 690
(1) 財政年度由四月一日至三月三十一日。 Notes : (1) Fiscal year from 1 April to 31 March.*** 包括預發的下月款項。 *** Including the advance payments for the next month.+ 不包括上月已預發的款項。 + Excluding the advance payments made in the preceding month.
社會福利署 Source : Social Welfare Department(查詢電話:2892 5232) (Enquiry Telephone No.: 2892 5232)
20 929
45 855 4 019 275 644 1,588,952
267 609 1,533,503
3 935 264 285
3 942 266 571 1,369,9513 986 265 655 1,544,982
14,404,602247 192
1,195,955
4 282 9 720
260 7173 944
3 888
1,227,176
20 926
1,362,721
1,125,522
3 934258 085
252 675
1,496,308
20 793
290 4 183
9 649
9 553
4 235
302 4 322
20 711
299
271 893 16,130,851
247 1921,258,7031,359,763
250 284
20 874
19 948
20 26720 35820 534
20 08220 241
4 19620 904
4 336 9 783
發放款項Number of cases --- cont'd.
20 842
3 48520 0829 2083 94818 917
Temporary肢體傷殘
個案數目Number of cases
健康欠佳
DeafBlind
294 278 295 253 8 584
失明Ill healthdisabled
聽覺受損 精神病患 disability/PhysicallyMentally ill
38 27037 038
31 60233 100
35 63934 382
309
9 605
10 0484 370
3 859
3 818
319 308
295
289
30 368
ment
31 602
294
297
298
297
305
9 208
283
3 925278 3 948
4 025283 3 981282
288
292
4 0959 5179 475
4 120
40 51340 974 3 916
資料來源:
註釋 :
23 250
43 237 4 012
40 170
39 375 3 979
43 237 4 012
39 742262 987 1,300,258
Total
296
13,559,853
($ thousand)
(千元)
payment
20 852
291
3 869 254 972 1,431,894
3 818
Amount of
個案數目 --- 續
其他
4 359 9 992
3 673
244 6533 799
228 263
Others
4 359 9 992
20 8084 329 9 896
20 852
9 820
9 176
9 3689 298
271 893 1,410,508
305
失業
41 966 269 391 1,100,546
總計
3 954
313 312
313 312
300
311
305
300
301
275
182香港統計月刊 二零零三年六月 Hong Kong Monthly Digest of Statistics June 2003

10.5 公共福利金計劃Social Security Allowance Scheme
個案數目
發放款項 申請
(千元) 個案數目
傷殘津貼 高齡津貼 Amount of Number 年(1) 月 Disability Old Age payment ofYear(1) Month Allowance Allowance ($ thousand) applications
2000-2001 96 851 453 734 5,129,653 61 6242001-2002 103 167 458 041 5,240,655 58 4372002-2003 105 282 454 933 5,281,472 57 3362002 2 102 587 457 562 440,135 3 791
3 103 167 458 041 494,987 *** 5 0124 103 596 458 059 444,194 ***+ 4 6455 104 035 457 815 387,817 + 4 6816 104 271 457 226 500,291 *** 4 0827 104 625 457 420 387,190 + 4 7528 105 084 457 573 500,426 *** 4 8499 105 274 457 157 443,637 ***+ 4 763
10 105 161 456 191 388,322 + 5 61411 105 329 456 001 503,042 *** 5 41112 105 338 455 740 445,258 ***+ 4 881
2003 1 105 380 454 957 477,129 ***+ 4 7112 105 126 455 009 358,805 + 4 3573 105 282 454 933 445,362 4 5904 104 834 454 367 501,902 *** 3 284
(1) Notes : (1)
*** ***+ +
社會福利署 Source : Social Welfare Department(查詢電話:2892 5232) (Enquiry Telephone No.: 2892 5232)
562 045
561 352561 330561 078
註釋 :
562 657
Fiscal year from 1 April to 31 March.
562 431
560 337
559 201
包括預發的下月款項。
不包括上月已預發的款項。
Including the advance payments for the next month.財政年度由四月一日至三月三十一日。
資料來源:
Excluding the advance payments made in the precedingmonth.
Number of cases
總計Total
560 149560 215
560 215
550 585561 208
561 208
560 135
561 655561 850561 497
183香港統計月刊 二零零三年六月 Hong Kong Monthly Digest of Statistics June 2003

10.6 家庭服務中心處理中的個案Active Cases of Family Services Centres
個案數目
Number of cases
年(1) 月
(期末數字) 社會福利署
As at end of Social Welfare 總計
Year(1) Month Department Total
1999-2000 12 554 35 575 48 1292000-2001 38 230 50 9492001-2002 39 416 51 8672001 12 12 672 39 065 51 7372002 3 12 451 39 416 51 867
6 33 825 44 1599 10 334 33 111 43 445
12 10 191 32 413 42 604
註釋 : (1) 財政年度由四月一日至三月三十一日。 Note : (1) Fiscal year from 1 April to 31 March.
資料來源: 社會福利署 Source : Social Welfare Department(查詢電話:2892 5208) (Enquiry Telephone No.: 2892 5208)
10.7 安老服務Services for the Elderly
長者綜合 長者活動
服務中心 中心
Multi-service Social centre長者宿舍 安老院 護理安老院 護養院 centre for for theHostel for Home for Care and Nursing the elderly elderlythe elderly the aged attention home home
年(1) 月 住院人數 住院人數 住院人數 住院人數
(期末數字) Number of Number of Number of Number of 會員人數 會員人數
As at end of persons persons persons persons Number of Number ofYear(1) Month enrolled enrolled enrolled enrolled members members
1999-2000 285 7 176 8 675 1 354 47 346 121 4682000-2001 232 7 271 9 394 1 372 52 106 127 0872001-2002 149 7 183 10 172 1 394 54 159 132 0932001 12 219 7 265 9 911 1 372 52 536 130 6102002 3 149 7 183 10 172 1 394 54 159 132 093
6 151 7 164 10 471 1 425 49 316 123 2519 156 7 215 10 579 1 461 52 837 130 750
12 157 7 194 10 681 1 451 54 529 135 338註釋 : (1) 財政年度由四月一日至三月三十一日。 Note : (1) Fiscal year from 1 April to 31 March.
資料來源: 社會福利署 Source : Social Welfare Department(查詢電話:2892 5230) (Enquiry Telephone No.: 2892 5230)
住院宿舍 Residential care home
服務類別Type of services
長者日間
護理中心Day care
centre for
受資助非政府機構Subvented non-governmental
organizations
12 45112 719
1 529
the elderly
登記人數Number of
10 334
1 6341 609
1 5951 5971 5951 607
personsenrolled
1 407
184香港統計月刊 二零零三年六月 Hong Kong Monthly Digest of Statistics June 2003

10.8 主要文化場地的使用率
Usage Rates of Major Cultural Venues百分比
Percentages
大會堂 高山劇場 伊利沙伯 香港
City Hall Ko Shan Theatre 體育館 體育館
Queen Elizabeth Hong KongStadium Coliseum
音樂廳 音樂廳 大劇院 劇場(1)
年 月 Concert 劇院 Concert Grand Studio 劇院 表演場 表演場
Year Month hall Theatre hall theatre theatre(1) Theatre Arena Arena
2000 83.4 90.0 95.3 85.9 68.3 83.22001 97.8 96.6 99.7 94.4 78.3 89.22002 100.0 92.4 99.1 98.1 72.4 96.22002 2 100.0 57.1 100.0 100.0 67.9 100.0
3 100.0 100.0 96.7 100.0 48.4 93.64 100.0 100.0 100.0 100.0 56.7 83.35 100.0 93.5 100.0 100.0 53.6 100.06 100.0 96.7 100.0 100.0 100.0 91.77 100.0 90.3 100.0 100.0 74.2 100.08 100.0 96.7 100.0 100.0 100.0 100.09 100.0 89.7 100.0 100.0 79.2 100.0
10 100.0 100.0 100.0 86.7 78.3 87.111 100.0 100.0 100.0 100.0 66.7 96.712 100.0 100.0 93.3 100.0 90.3 100.0
2003 1 96.1 92.3 90.5 - 51.9 100.02 89.3 83.3 70.4 100.0 57.9 100.03 96.8 100.0 96.8 100.0 71.4 64.54 31.0 82.8 83.3 75.9 27.6 13.3
展覽廳(3) 陶瓷室
年 月 Exhibition CeramicYear Month hall(3) studio
2000 96.0 86.02001 95.4 97.42002 100.0 95.7 98.42002 2 100.0 90.9 90.9
3 100.0 100.04 100.0 100.05 100.0 100.06 96.2 100.07 92.3 100.08 77.8 100.09 100.0 100.0
10 100.0 96.211 100.0 92.312 100.0 100.0
2003 1 100.0 96.22 95.2 100.03 - 100.04 100.0 100.0
100.0 100.0 100.0
100.0
84.0 22.2 75.9 48.3
100.0
100.073.0 92.9 66.8 100.0
100.096.7 100.0
92.6
100.0
100.0100.0
100.0 96.8 -96.0 96.8 -
96.8
95.1 78.9
100.0 96.8 100.0
94.1
80.0 85.1 78.0
100.0100.0
-
- 100.0
100.0100.0
100.0100.0
98.7100.0100.0
100.0
Theatre
100.0
86.6 97.9
100.0
100.0
81.8
100.0
84.6
演講廳Lecture hall
劇院
香港文化中心 Hong Kong Cultural Centre
84.6
Civic Centre(2)
Theatre
96.8
Museum
演講廳Lecture hall
Visual Arts Centre牛池灣文娛中心(2)
Ngau Chi Wan科學館Science
西灣河文娛中心
100.095.048.2
視覺藝術中心
42.3
93.5
96.7
Space上環文娛中心
Sheung Wan太空館
Sai Wan Ho
100.0100.0
100.096.696.696.6
93.5100.0
100.0
MuseumCivic Centre
92.1 91.1 93.0
Theatre劇院
Civic Centre
95.0 97.9
100.0 100.0
91.7 92.9
100.0
96.0
100.0
96.2
92.6 100.0
100.0
劇院
95.1
100.0 96.7 100.0
96.2 100.0 92.6
96.2 100.088.9 100.0
100.0
100.088.9 100.0 88.9 100.0
83.374.0 100.0 67.9
90.7 90.9 95.9
100.096.296.786.6 90.0
96.7100.0 96.8 96.7
185香港統計月刊 二零零三年六月 Hong Kong Monthly Digest of Statistics June 2003

10.8 (續) 主要文化場地的使用率
(Cont'd.) Usage Rates of Major Cultural Venues百分比
Percentages
荃灣大會堂 屯門大會堂 聿修堂(4) 北區大會堂
Tsuen Wan Town Hall Tuen Mun Town Hall Lut Sau Hall(4) North DistrictTown Hall
文娛廳
年 月 演奏廳 演奏廳 Cultural 演奏廳 演奏廳
Year Month Auditorium Auditorium activities hall Auditorium Auditorium
2000 71.5 78.3 61.7 90.3 55.72001 84.9 82.6 66.0 - 77.22002 95.7 71.9 54.6 - 74.02002 2 100.0 71.4 46.2 - 62.5
3 100.0 91.7 80.7 - 79.24 100.0 29.6 20.7 - 53.35 92.9 48.3 45.2 - 67.76 91.3 56.7 26.7 - 63.37 100.0 77.4 58.1 - 64.58 100.0 62.1 66.7 - 96.89 80.9 86.7 27.6 - 66.7
10 91.3 94.4 65.2 - 83.311 90.0 100.0 93.8 - 80.012 96.8 100.0 83.3 - 88.9
2003 1 80.8 100.0 60.7 - 95.82 82.1 100.0 53.9 - 78.63 100.0 100.0 81.5 - 85.24 26.0 27.3 34.5 - 66.7
大埔文娛中心 葵青劇院 元朗劇院
Tai Po Civic Centre Kwai Tsing Theatre Yuen Long Theatre
文娛廳
年 月 演奏廳 演奏廳(5) Cultural 演藝廳 演藝廳
Year Month Auditorium Auditorium(5) activities hall Auditorium Auditorium
2000 76.92001 88.02002 89.62002 2 78.6
3 87.14 73.35 96.76 96.77 90.98 65.29 96.7
10 96.811 96.712 87.1
2003 1 90.32 96.43 96.84 46.7
註釋: (1) 香港文化中心劇場於二零零三年一月一日至 Notes : (1)
二月十六日關閉以進行維修工程。 for maintainence from 1 January to 16 February 2003.(2) 牛池灣文娛中心於二零零二年一月十四日至 (2)
六月十三日關閉以進行翻新工程。 14 January to 13 June 2002.(3) 視覺藝術中心展覽廳於二零零三年三月一日 (3) Exhibition hall of Visual Arts Centre was closed for renovation
至四月二十一日關閉以進行翻新工程。 from 1 March to 21 April 2003.(4) 聿修堂於二零零零年九月關閉。 (4) Lut Sau Hall was closed in September 2000.(5) 沙田大會堂演奏廳於二零零二年九月至十月 (5)
關閉以進行維修工程。 in September and October 2002.資料來源: 康樂及文化事務署 Source : Leisure and Cultural Services Department
(查詢電話:2601 8673) (Enquiry Telephone No.: 2601 8673)
38.5
100.091.369.671.4
90.0
81.880.061.975.0
79.585.082.6
100.0
50.048.3
58.6
71.6 70.867.987.1
92.9
100.0
100.0
100.0-
96.8
100.0 100.0
100.0
沙田大會堂Sha Tin Town Hall
100.0100.0
95.3
71.0
94.1 94.2
84.0
文娛廳Cultural
activities hall
66.2
53.3
46.7
95.1
78.6
93.3
77.4
99.6100.0
100.0
-
73.4 56.7
100.0
100.0
100.0
82.7
86.493.5
100.0 100.0
67.7
70.9
100.0
96.086.4 87.2
67.739.3
90.3
100.0
96.5 97.0 99.3
93.3 93.6
96.8100.0100.0100.0
73.3100.0
93.5 100.078.690.3
The studio theatre of Hong Kong Cultural Centre was closed
Auditorium of Sha Tin Town Hall was closed for maintenance
99.3 100.0
95.8
80.879.365.546.4
Ngau Chi Wan Civic Centre was closed for renovation from
186香港統計月刊 二零零三年六月 Hong Kong Monthly Digest of Statistics June 2003

10.9 按種類劃分的康樂設施使用率
Usage Rates of Recreation Facilities by Type百分比(另有註明除外)
Percentages, unless otherwise specified
網球場 障礙高爾 草地 曲棍球場 欖球場
Tennis 夫球 滾球場 Hockey Rugbycourt - 球賽數目 Bowling pitch pitch
greenObstacle 人造 天然
golf 草地 草地
年 月 - number 天然 人造 Artificial NaturalYear Month of games Natural Artificial turf turf
2000 44.0 3 869 17.6 48.8 99.62001 44.4 3 504 *** 16.1 48.4 98.62002 42.2 2 592 17.9 53.9 105.5 ***
2002 1 - 3 40.8 742 *** 15.2 55.9 116.6 *** 4 - 6 41.2 616 18.1 49.0 99.1 7 - 9 41.6 446 19.3 45.8 100.0 10 - 12 45.3 788 *** 19.2 62.3 100.0
2003 1 - 3 43.5 848 *** 17.0 61.5 100.0
體育館(1)
Sports centres(1)
宿營
年 月 主場 日營 Resi- 日營 露營
Year Month Arena Day dential Day Tent
2000 58.7 95.3 68.5 63.8 61.52001 62.9 100.1 ++ 74.1 64.9 61.82002 64.0 94.8 71.1 75.5 55.32002 1 - 3 57.0 77.0 62.3 41.9 44.6
4 - 6 64.1 75.5 75.7 71.1 42.8 7 - 9 71.5 87.8 85.3 110.4 ++ 85.2 10 - 12 62.9 137.4 ++ 58.7 77.4 51.0
2003 1 - 3 62.0 69.9 56.5 45.9 30.5
註釋 : Notes :
*** ***
++ ++
(1) (1)
資料來源: 康樂及文化事務署 Source : Leisure and Cultural Services Department(查詢電話:2601 8673) (Enquiry Telephone No.: 2601 8673)
23.8
26.0
就每個體育館類別而定,一個主場通常可當作四個羽毛球場、一個籃球場或一個排球場使用。除主場外,其他設施有舞蹈室、健身室、遊戲室或乒乓球室等。
Figures more than 100 percent denote actual utilization exceeding theavailable sessions assigned for booking.
Depending on the type of each sports centres, one arena normally can beused as 4 badminton courts, 1 basketball court or 1 volleyball court.Facilities also include dance room, fitness room, games room, or tabletennis room, etc.
After the re-organization of the municipal services on 1.1.2000, the newLeisure and Cultural Services Department was set up to promote and deliverleisure and cultural services in Hong Kong. Owing to changes in theclassification and coverage of the recreation facilities, figures presented abovecannot be compared with those presented before the June 2000 issue.
Figures more than 100 percent denote actual utilization exceedingcapacity.
高於100%的數字表示場地實際使用人數超過其可容納人數。
高於100%的數字表示場地實際使用量超過限定可供使用的場數。
市政服務於二零零零年一月一日重整後,由新成立的康樂及文化事務署提供及推廣全港的康樂及文化服務。由於康樂設施的分類和涵蓋範圍經已改變,上列刊載的數字不能與二零零零年六月號以前刊載的數字互相比較。
草地球場
Turf pitch
100.5
99.0101.0
99.6
75.274.677.877.1
97.291.1
106.1101.8
運動場
Sportsground
水上活動中心
Water sports centre
78.983.387.088.9
21.6
81.585.991.390.8
度假營
Holiday camp
78.674.581.179.1
25.8
壁球場
Squash court
24.220.124.828.5
187香港統計月刊 二零零三年六月 Hong Kong Monthly Digest of Statistics June 2003

10.10 按類別劃分的有效市政牌照及許可證
Municipal Services Licences and Permits in Force by Type
牌照
Licences食物業
Food business
烘製麵包 新鮮糧食店
年 月 餅食店 凍房 工廠食堂 食物製造廠 Fresh provisionYear Month Bakery Cold store Factory canteen Food factory shop2000 1 033 31 463 2 621 2 9722001 1 030 30 466 2 793 2 9792002 1 037 28 479 3 060 3 0322002 2 1 028 30 469 2 841 2 979
3 1 029 30 468 2 861 2 9854 1 025 30 471 2 873 2 9745 1 040 30 469 2 903 2 9586 1 039 29 473 2 937 2 9667 1 041 29 474 2 970 2 9668 1 037 29 471 2 991 2 9659 1 038 29 472 3 010 2 972
10 1 033 28 476 3 026 2 98711 1 037 28 477 3 041 3 01512 1 037 28 479 3 060 3 032
2003 1 1 032 28 482 3 092 3 033 2 1 030 28 476 3 136 3 046
3 1 025 28 478 3 175 3 0514 1 026 28 480 3 210 3 076
牌照 --- 續
Licences --- cont'd.食物業 --- 續
Food business --- cont'd.
普通食肆 小食食肆 水上食肆 奶品廠 燒味及鹵味店
年 月 General Light refreshment Marine Milk Siu Mei andYear Month restaurant restaurant restaurant factory Lo Mei shop
2000 6 864 2 250 3 7 4032001 7 036 2 367 2 7 4082002 7 206 2 452 2 7 4232002 2 7 032 2 347 2 7 410
3 7 063 2 348 2 7 4104 7 095 2 361 2 7 4185 7 145 2 384 2 7 4236 7 155 2 393 2 7 4267 7 182 2 406 2 7 4318 7 193 2 410 2 7 4299 7 187 2 404 2 7 424
10 7 180 2 409 2 7 42311 7 186 2 424 2 7 42612 7 206 2 452 2 7 423
2003 1 7 209 2 448 2 7 434 2 7 239 2 459 2 7 443
3 7 294 2 465 2 7 4474 7 330 2 473 2 7 449 18 613
18 25918 29918 40418 505
18 06318 07418 10118 172
17 79617 901 17 96618 044
17 654 18 25917 68217 743
538 533 532
17 136
小計Sub-total
530 529 533 532
539 536 529 529
537 540 540 540
冰凍甜點
製造廠Frozen confection
factory 489 536 533
188香港統計月刊 二零零三年六月 Hong Kong Monthly Digest of Statistics June 2003

10.10 (續) 按類別劃分的有效市政牌照及許可證
(Cont'd.) Municipal Services Licences and Permits in Force by Type
牌照 --- 續
Licences --- cont'd.其他行業
Other business
商業浴室 殯儀館 殮葬商 厭惡性行業 泳池
年 月 Commercial 屠房 Funeral Undertaker Offensive SwimmingYear Month bathhouse Slaughter house parlour of Burial trade pool2000 96 3 6 78 21 7352001 98 3 6 78 19 7772002 101 3 7 82 17 8142002 2 100 3 6 77 18 787
3 100 3 6 77 18 7894 100 3 6 77 18 7915 98 3 7 79 18 7966 98 3 7 79 18 7987 100 3 7 81 18 7988 99 3 7 80 17 8059 100 3 7 80 17 806
10 101 3 7 82 17 80711 101 3 7 82 17 81012 101 3 7 82 17 814
2003 1 103 3 7 82 17 816 2 101 3 7 82 17 820
3 101 3 7 83 17 8244 101 3 7 83 17 828
牌照 --- 續
Licences --- cont'd. 其他行業
Other business
公眾娛樂場所 桌球室 公眾保齡球場 公眾溜冰場
年 月 會所酒牌 Places of public Billiard Public Public 小計
Year Month Club liquor entertainment establishment bowling alley skating rink Sub-total2000 381 198 98 9 4 5 6472001 407 206 103 10 4 5 8632002 395 203 88 9 4 5 9952002 2 403 207 103 10 4 5 863
3 400 208 101 10 4 5 8924 397 209 98 10 4 5 8735 397 208 99 10 4 5 8706 402 206 98 10 4 5 9017 398 199 96 10 4 5 9358 397 205 91 10 4 5 9329 401 208 90 10 4 5 958
10 402 205 89 10 4 5 98211 394 206 89 8 4 5 98212 395 203 88 9 4 5 995
2003 1 396 206 88 9 4 6 002 2 401 205 89 9 4 6 003
3 403 207 86 8 4 6 0184 405 207 86 8 4 6 006
24 30124 40724 52324 619
24 03224 08324 154 24 254
23 771 23 86723 97923 995
24 25423 54523 63523 669
4 2754 257
22 783 23 517
4 261 4 2724 2714 265
4 2214 2144 2324 255
4 1764 1604 151 4 178
酒牌Liquor
Totallicences
牌照
總計
4 018 4 152 4 2724 145
189香港統計月刊 二零零三年六月 Hong Kong Monthly Digest of Statistics June 2003

10.10 (續) 按類別劃分的有效市政牌照及許可證
(Cont'd.) Municipal Services Licences and Permits in Force by Type
許可證 許可證
Permits 總計
食物業 TotalFood business permits
涼茶 冰凍甜點 非瓶裝飲品 食物售賣機
年 月 Chinese Frozen 奶類 Non-bottled Food vending 其他
Year Month herb tea confections Milk drinks machine Others
2000 356 1 928 1 252 934 75 550 5 0952001 355 1 879 1 143 923 59 593 4 9522002 380 1 885 1 166 961 106 709 5 2072002 2 360 1 893 1 134 930 56 619 4 992
3 364 1 888 1 133 938 57 621 5 0014 366 1 873 1 128 942 66 631 5 0065 370 1 872 1 123 936 78 631 5 0106 371 1 876 1 119 941 87 633 5 0277 374 1 869 1 127 946 96 636 5 0488 382 1 885 1 138 966 97 646 5 1149 379 1 890 1 148 965 98 654 5 134
10 377 1 880 1 158 965 99 671 5 15011 376 1 876 1 163 959 104 684 5 16212 380 1 885 1 166 961 106 709 5 207
2003 1 378 1 890 1 174 972 112 724 5 250 2 379 1 883 1 181 968 115 720 5 246
3 377 1 885 1 176 967 114 726 5 2454 374 1 899 1 174 958 112 723 5 240
註釋: Note:
資料來源: 食物環境生署 Sources : Food and Environmental Hygiene Department(查詢電話:2923 5302); (Enquiry Telephone No.: 2923 5302);康樂及文化事務署 Leisure and Cultural Services Department(查詢電話:2601 8673) (Enquiry Telephone No.: 2601 8673)
29 65329 76829 859
29 23329 316 29 46129 551
28 89429 02729 10929 166
28 53728 63628 67528 781
市政服務於二零零零年一月一日重整後,康樂及
文化事務署是負責簽發及延續桌球室、公眾保齡
球場及公眾溜冰場的牌照;上表所列其餘的牌照
/許可證由食物環境生署負責。
After the re-organization of the municipal services on 1.1.2000, theLeisure and Cultural Services Department is responsible for issueand renewal of the licences for billiard establishment, publicbowling alley and public skating rink while the rest of thelicences/permits presented in the above table are under theresponsibility of the Food and Environmental Hygiene Department.
牌照及
許可證總計
Total licencesand permits
27 878 28 469 29 461
190香港統計月刊 二零零三年六月 Hong Kong Monthly Digest of Statistics June 2003

香港統計月刊 二零零三年六月 Hong Kong Monthly Digest of Statistics June 2003191
能源
Energy
概念及方法 Concepts and Methods
由於香港沒有出產一次能源,該等能源均由
外地進口。部分入口的一次能源會被轉化為
電力及煤氣等二次能源,以供運用。
Since Hong Kong does not have its own indigenousproduction, different forms of primary energy are allimported. Part of such primary energy may beconverted to secondary energy for final use.
一次能源是指由地下礦源開採而未經轉化的
天然資源(如煤、原油、天然氣)。
Primary energy refers to natural resources extractedfrom a stock of reserves in the ground (e.g. coal,crude oil, natural gas) without undergoing anytransformation processes.
二次能源(如電力)是由一次能源轉化而成
的能源。
Secondary energy (e.g. electricity) is obtained fromtransformation of primary energy.
油產品及煤產品進口數字包括從中國內地進
口產品的數據。有關進口及出口數字的概念
及定義,請參閱第四十一頁的註釋。
Imports of oil products and coal products includethose imported from the mainland of China. Forconcepts and definitions of imports and exportsfigures, please see page 41.
其他有關刊物 Further References
香港能源統計 - 季刊及年刊 Hong Kong Energy Statistics - quarterly andannual reports

圖 11.1 電力及煤氣耗用
Chart 11.1 Electricity and Gas Consumption
電力耗用Electricity consumption
煤氣耗用Gas consumption
0
2 000
4 000
6 000
8 000
10 000
12 000
14 000
16 000
4/01 8/01 12/01 4/02 8/02 12/02 4/03
兆焦耳
Terajoules
0
20 000
40 000
60 000
80 000
100 000
120 000
140 000
160 000
1992 1994 1996 1998 2000 2002
兆焦耳
Terajoules
192香港統計月刊 二零零三年六月 Hong Kong Monthly Digest of Statistics June 2003

11.1 油產品進口留用數量
Quantity of Retained Imports of Oil Products千升(另有註明除外)
Kilolitres, unless otherwise specified
年 月
Year Month
2000200120022002 1
23456789
101112
2003 1 373 805 32 160 267 071 120 8812 294 375 48 110 336 560 121 6823 384 053 32 735 229 488 132 963
註釋: (1) 主要是航空煤油。 Note : (1)
資料來源: 政府統計處工業生產統計組 Source : Industrial Production Statistics Section,(查詢電話:2805 6167) Census and Statistics Department
(Enquiry Telephone No.: 2805 6167)
11.2 主要煤產品進口留用數量
Quantity of Retained Imports of Major Coal Products公噸
Tonnes
年 月 蒸餾煤及其他煤產品 木炭
Year Month Steam coal and other coal Wood charcoal
2000200120022002 1
23456789
101112
2003 1 8212 3393 639
資料來源: 政府統計處工業生產統計組 Source : Industrial Production Statistics Section,(查詢電話:2805 6167) Census and Statistics Department
(Enquiry Telephone No.: 2805 6167)
1087
469 790
703
738 059 651 658
839581
715 462906 408
4 315 798 473 441 6 810 838
539 183
42 333 679 619
47 426
555 784
352 416
31 175
316 303 30 077 591 427 363 025
6 057 8028 033 097
344 398144 020
Mainly aviation kerosene.
561 647
6 050
190 032179 997154 953
6 920 4604 198 740 2 394 450 524 5884 011 029 486 087 7 802 247
車用汽油
(不含鉛)
航空汽油及煤油(1)
Aviation gasolineand kerosene(1) (Unleaded petrol)
Motor gasolineGas oil,
diesel oiland naphtha
輕質柴油、
重質柴油 Fuel oil及石腦油
(tonnes)
LPG andnatural gas
天然氣
石油氣及燃油
(公噸)
2 363 434
2 973 785
2 140 655
196 377 211 028199 490
238 217
2 459 050
359 037459 824
356 895
305 451
342 369 41 497
352 117 28 050
243 750
215 213
349 801
197 172190 125 215 878
329 501 131 052
225 896218 339635 162
545 374451 114
90 756284 334
32 576
308 060 33 430 481 750
264 728 479 804
902 501 5401 040 222 436
905
609
2 420 756
446 802 34 321 588 924 287 091 194 096
431 816 60 358
8 142
538 921 760
-4 7648 717 699
373
897 644
471 863
552 178
945 468
1 138 302779 613
654 333
39 152
578 289
513 697
696 566
751 602
53 046 470 961
香港統計月刊 二零零三年六月 193 Hong Kong Monthly Digest of Statistics June 2003

11.3 電力耗用
Electricity Consumption兆焦耳
Terajoules
年 月 住宅 工業 總計
Year Month Domestic Industrial Total
2000 32 234 17 769 134 9282001 32 799 16 759 139 8302002 33 394 16 112 144 9422002 2 1 849 1 062 8 811
3 1 714 1 098 9 3504 2 147 1 422 11 6795 2 630 1 456 12 8146 3 510 1 460 13 8457 4 489 1 545 15 5628 4 412 1 511 15 1889 3 868 1 430 14 085
10 3 210 1 414 12 93511 2 011 1 304 10 63312 1 808 1 246 10 206
2003 1 1 884 1 117 9 8102 1 960 5 795 996 9 3433 1 811 6 212 1 121 641 9 8164 1 986 6 674 1 313 30 571 10 575
資料來源: 政府統計處工業生產統計組 Source : Industrial Production Statistics Section,(查詢電話:2805 6167) Census and Statistics Department
(Enquiry Telephone No.: 2805 6167)
11.4 煤氣耗用
Gas Consumption兆焦耳
Terajoules
年 月
Year Month
2000200120022002 2
3456789
101112
2003 1 1 484 995 86 2 5652 1 512 989 76 2 5783 1 611 956 83 2 6504 1 576 877 79 2 532
資料來源: 政府統計處工業生產統計組 Source : Industrial Production Statistics Section,(查詢電話:2805 6167) Census and Statistics Department
(Enquiry Telephone No.: 2805 6167)
14 794
365 87 241
30 7 947
13 86611 06014 49310 860
7 830
8 490 29 746
5 9217 202
29 889
3155 555
1 898 985 879 82 1 946
92952
930 885 83
1 285 921 86
861 4531 464 1 005
58730
26 057
35 632
982
30
987
59033 330
工業
32
901
562
30 878
2 075
7 799
30
8 610
6 478 33 641
總計
28
323
6 142
84 214
1 146 852 77
27 835
TotalIndustrial
8 014
11 209
6 962 32
8 167
出口往
中國內地Exports to the
of Chinamainland
80 347
街燈
商業Commercial
Streetlighting
5 6924 253
367 325
Domestic Commercial住宅 商業
2 001847 80
1 011 26 564
2 5612 491
26 641
2 2922 185
2 215
1 941
1 468 969 83 2 520
1 070 852 80
1 261 877 77
1 258
1 008 856 77
香港統計月刊 二零零三年六月 194 Hong Kong Monthly Digest of Statistics June 2003

香港統計月刊 二零零三年六月 Hong Kong Monthly Digest of Statistics June 2003195
國民收入及國際收支平衡
National Income and Balance of Payments
概念及方法 Concepts and Methods
「本地生產總值」及「本地居民生產總值」
同是「國民經濟核算」的核心統計數字。它
們同是分析一個國家或地區的經濟情況的重
要經濟指標。前者對反映生產水平尤其有
用,而後者則反映本地居民的總體收入。
Gross Domestic Product (GDP) and Gross NationalProduct (GNP) are core statistics in NationalAccounts. They are both important economicindicators and useful for analysing the economicsituation of a country or territory, with the formerparticularly useful for reflecting the level ofproduction, and the latter for aggregate income ofresidents.
除了本地生產總值及本地居民生產總值的統
計數字外,完整的國際收支平衡表已自一九
九七統計年開始編製。國際收支平衡統計數
字對於分析一個經濟體系的對外交易非常有
用。這對香港作為一個主要的國際金融中心
及其高度外向型的經濟體系,尤為重要。
Apart from statistics on GDP and GNP, completeBalance of Payments (BoP) account is compiled asfrom the reference year of 1997. BoP data are usefulfor analysis of the external transactions of aneconomy. This is of particular importance for HongKong as a major international financial centre and ahighly externally oriented economy.
為增加香港對外債務情況的透明度及為更及
時的金融監察提供資料,香港在編製和發布
對外債務統計數據的工作上已取得重要的發
展。香港已自二零零二年第一季統計季度開
始編製按季的對外債務統計數據。
To make the situation on External Debt (ED) of HongKong more transparent and to support a more timelyfinancial surveillance initiative, Hong Kong hadundertaken major development in the compilation anddissemination of statistics on ED. Hong Kong’squarterly ED statistics are compiled as from thereference quarter of Q1 2002.
居民的概念,在計算本地生產總值、本地居
民生產總值、國際收支平衡及對外債務統計
數據時均非常重要。具體而言,一個國家或
地區的居民包括個人及機構。根據國際標
準,以個人而言,居民是指通常在該國家或
地區的經濟領域居住的人士,與其國籍無
關。以機構而言,居民是指常在該國家或地
區的經濟領域內經營業務的機構。一個國家
或地區的經濟領域,是指該國家或地區的政
府所管治的地域,而在該領域內的人士、貨
物及資本均可自由流動。在概念上,個人或
機構的居民身分主要是以其經濟利益中心為
依據。
The concept of "resident" is crucial to the compilationof GDP, GNP, BoP and ED statistics. Practically,residents of a country or territory include individualsand organizations. According to internationalstandards, for individuals, residents refer to thosewho normally stay in the economic territory of thecountry or territory, irrespective of their nationality.For organizations, residents refer to those whichordinarily operate in the economic territory of thecountry or territory. The economic territory of acountry or territory is the geographic territoryadministered by the government of the country orterritory within which persons, goods and capitalcirculate freely. Conceptually, the residence status ofindividuals and organizations depends on their centreof economic interest.
香港特別行政區與中國內地之間的經濟交
易、資產與負債數據,視作對外交易及對外
頭寸。對外交易的例子有貨物貿易、服務貿
易、及對外要素收益流動。對外頭寸的例子
有按主要投資者國家/地區劃分的外來及向
外直接投資存量。
Data on transactions and assets and liabilities vis-à-vis the mainland of China are treated as externaltransactions and external positions respectively.Examples of external transactions are trade in goods,trade in services and external factor income flows.Examples of external positions are stocks of inwardand outward direct investments by majorcountries/territories.

香港統計月刊 二零零三年六月 Hong Kong Monthly Digest of Statistics June 2003196
本地生產總值 Gross Domestic Product
本地生產總值是指一個國家或地區的所有常
住生產單位,在一個指定的期間內,未扣除
固定資本消耗的生產總值。
GDP is a measure of the total value of production ofall resident producing units of a country or territoryin a specified period, before deducting allowance forconsumption of fixed capital.
一個國家或地區的「按人口平均計算的本地生
產總值」是指把該國家或地區在某統計年的
「本地生產總值」除以該國家或地區在該年的
人口總數而得的數字。
Per capita GDP of a country or territory is obtained bydividing total GDP in a year by the population of thatcountry or territory in the same year.
本地生產總值可由不同層面計算。香港的本地
生產總值分別以「開支」面和「生產」面編
製。
GDP can be measured using different approaches.For Hong Kong, GDP is compiled using theexpenditure approach and the production approach.
按開支組成部分劃分的本地生產總值有以「當
時市價」計算及以「固定(二零零零年)市
價」計算的數字。後者是扣除價格變動的影響
而計算的。
GDP by expenditure component in current marketprices and constant (2000) market prices arecompiled. In the latter, the effect of price changes isremoved.
以當時市價計算的數列,其變動反映在不同期
間以下兩種變動的結果:(甲)價格水平的變
動及(乙)貨物和服務的實質生產量的變動。
Changes in current market price series reflect thecombined result of changes in : (a) price level and (b)real production of goods and services from one periodto another.
以固定(二零零零年)市價計算的數列,其變
動反映在扣除價格變動的影響後,不同期間所
生產的貨物和服務的實質變動。
Changes in constant (2000) market price series reflectchanges in real production of goods and services fromone period to another. The effect of changes in priceis removed.
本地生產總值內含平減物價指數(或簡稱本地
生產總值平減物價指數)通常會用作概括地量
度一個經濟體系的整體通貨膨脹。這個指數涵
蓋有關消費、投資和進出口的價格變動。
The implicit price deflator of GDP (or GDP deflatorin short) is generally used as a broad measure ofoverall inflation in the economy. It takes account ofall price changes relating to consumption, investment,exports and imports.
編製以固定市價計算按開支組成部分劃分的本
地生產總值時,會採用一個標準的平減物價方
法。每個開支組成部分固定價格數值的計算方
法,是把經平減物價的各個分項組成部分加起
來;而這些分項組成部分固定價格數值的編
製,是採用適當的物價指數平減以當時價格計
算的數值,或是根據基年的價格而將現時數量
重新計算而得。把以固定價格計算的各個開支
組成部分進一步相加起來,便取得以固定價格
計算的本地生產總值。然後,將以當時價格計
算的本地生產總值,除以以固定價格計算的本
地生產總值,便可以隱含方式計算出本地生產
總值平減物價指數。使用類似方法,將每個以
當時價格計算的本地生產總值組成部分,除以
In compiling the GDP by expenditure component atconstant market prices, a standard deflation approachis adopted. The constant price measure of eachexpenditure component is obtained by adding up therespective deflated sub-components, each of the latteris compiled either by deflating the current price valueusing an appropriate price index, or by revaluing thecurrent period quantities at base year prices. Theconstant price expenditure components are furtheraggregated to arrive at the constant price GDP. Then,the GDP deflator is implicitly obtained by dividingthe current price GDP by the constant price GDP.Similarly, by dividing each of the GDP components atcurrent prices with each of the corresponding constantprice figures, the respective implicit price deflators forindividual expenditure components are implicitlyobtained. Hence as it stands, the implicit pricedeflators of GDP and its expenditure components are

香港統計月刊 二零零三年六月 Hong Kong Monthly Digest of Statistics June 2003197
相應的固定價格數值,便可以隱含方式計算出
個別開支組成部分的相關內含平減物價指數。
因此,本地生產總值及其開支組成部分的內含
平減物價指數,並不是用以計算有關的固定價
格數值的。
not used as input for compiling the correspondingconstant price measures.
經季節性調整的本地生產總值數列,由於季
節性效果就統計方法而言已被剔除,所以相
連兩個季度的數字可以進行更有意義的比
較。將本地生產總值原來數列的按年變動數
字與經季節性調整數列的相連季度變動數字
一起進行分析,能更清楚看到本地生產總值
的趨勢。
In the seasonally adjusted GDP series, seasonaleffects have been removed statistically, thus enablingfigures for consecutive quarters to be compared moremeaningfully. When the year-on-year changes forthe quarterly figures in the original GDP series andthe quarter-to-quarter changes for the quarterlyfigures in the seasonally adjusted GDP series areanalysed together, the trend of the GDP can be moreclearly discerned.
按經濟活動劃分的本地生產總值有以「當時
價格」計算及以「固定(二零零零年)價
格」計算的數字。以「當時價格」計算的數
列,是由一九八零年起按年發布;以「固定
(二零零零年)價格」計算的數列,則是由
二零零零年起按季發布。
GDP by economic activity is compiled at current andconstant (2000) prices. Current price series iscompiled on an annual basis as from 1980, whileconstant (2000) price series on a quarterly basis asfrom 2000.
按經濟活動劃分的本地生產總值提供數據,
以助對各行業進行各方面的分析。首先,以
當時價格計算按經濟活動劃分的按年本地生
產總值,可以用來分析各類經濟活動較長期
趨勢的相對重要性,有助展示經濟根本結構
的變化。第二,以固定價格計算按經濟活動
劃分的本地生產總值按年變動百分率可提供
數據,幫助評估不同經濟活動的相對表現。
而以固定價格計算的數列已剔除價格變動引
起的影響。第三,以固定價格計算按經濟活
動劃分的本地生產總值,可以用來分析各類
經濟活動對整體經濟增長的貢獻,有助了解
經濟增長的來源。
GDP by economic activity provides data to supportsectoral analyses from various perspectives. Firstly ,annual current price GDP by economic activityprovides data for analysing the longer-term trend inthe relative importance of economic activities. Thishelps to depict changes in the underlying economicstructure. Secondly, the year-on-year percentagechange of constant price GDP by economic activityprovides data for assessing the relative performanceof different economic activities. In the constant priceseries, the effect of price changes has been removed.Thirdly, constant price GDP by economic activityprovides data for analysing the contribution ofeconomic activities to overall economic growth. Thisfacilitates analysis of the source of growth of aneconomy.
按經濟活動劃分的本地生產總值中的經濟活
動,是採用《香港標準行業分類1.1版》(HSICV1.1)分類。為編製國民經濟核算,還需包括
兩個經濟活動,即樓宇業權及非直接計算的
金融中介服務調整。
Economic activities covered by GDP by economicactivity are classified according to the Hong KongStandard Industrial Classification Version 1.1 (HSICV1.1). According to national account purpose, twoadditional economic activities are also covered, viz.Ownership of premises and adjustment for financialservices indirectly measured.
表 12.1 至 12.5 的本地生產總值數字,是在二
零零三年五月三十日發表的最新數字。
GDP figures given in Tables 12.1 to 12.5 are thelatest figures released on 30 May 2003.

香港統計月刊 二零零三年六月 Hong Kong Monthly Digest of Statistics June 2003198
本地居民生產總值 Gross National Product
本地居民生產總值是指一個經濟體系內的居
民,由從事各項經濟活動而賺取的收益,不
論該等經濟活動是否在該經濟體系內進行。
換言之,編製本地居民生產總值應包括本地
居民在經濟領域內或外從事各類經濟活動的
收益,而扣除非本地居民在經濟領域內從事
經濟活動的收益。
GNP is a measure of the total income earned byresidents of an economy from engaging in variouseconomic activities, irrespective of whether theeconomic activities are carried out within theeconomic territory or outside. In other words, incompiling GNP, earnings of residents from variouseconomic activities within or outside the economicterritory are included, whereas earnings of non-residents from economic activities within theeconomic territory are excluded.
計算本地居民生產總值,可用以下方程式:
本地居民生產總值 = 本地生產總值
+ 本地居民從經濟領域
外所賺取的要素收益
- 非本地居民從經濟領
域內所賺取的要素收益
GNP is computed by the following formula:
GNP = GDP+ Factor income earned by residents from
outside the economic territory- Factor income earned by non-residents
from within the economic territory
一個國家或地區的「按人口平均計算的本地
居民生產總值」是指把該國家或地區在某統
計年的「本地居民生產總值」除以該國家或
地區在該年的人口總數而得的數字。
Per capita GNP of a country or territory is obtainedby dividing GNP in a year by the population of thatcountry or territory in the same year.
要素收益組成部分主要分為投資收益及僱員
報酬,而投資收益包括了直接投資收益、有
價證券投資收益及其他投資收益。
Factor income is mainly classified into investmentincome and compensation of employees (CE).Investment income includes direct investment income(DII), portfolio investment income (PII) and otherinvestment income (OII).
直接投資收益是指本地居民從直接投資經濟
領域以外業務所賺取的收益,而對該業務有
持久利益或在管理方面具有相當程度的影響
力和控制權。這些收益屬於公司間債務的淨
利息收益、派發紅利的收益、應佔的未派盈
利及租金。
DII refers to earnings of residents from directinvestment outside the economic territory, in whichthey have a lasting interest and a degree of influenceor control over the management. These earnings arein the form of net interest receipts on inter-companydebts, receipts of distributed dividends, share ofundistributed profits and gross rentals.
有價證券投資收益是指本地居民從投資非本
地股本(即股票)及債券(例如可轉讓存款
證、債券、票據)所得的收益。
PII refers to earnings of residents from investment innon-resident equities (i.e. stocks and shares) and debtsecurities (e.g. negotiable certificates of deposits,bonds, bills).
其他投資收益是指從其他非本地財務債權及
負債所得的對外利息收益流動,而這些收益
並不屬於直接投資收益或有價證券投資收
益。該等非本地財務債權及負債包括短期及
長期非市場上買賣的貸款、存款、財務租
約、貿易信貸等。
OII refers to external flows of interest incomesderived from other financial claims on and liabilitiesto non-residents that are not classified as DII or PII.Examples of these claims and liabilities include short-term and long-term non-marketable loans, deposits,financial leases and trade credit.

香港統計月刊 二零零三年六月 Hong Kong Monthly Digest of Statistics June 2003199
僱員報酬是指非本地居民從香港經濟領域內
作短期受僱及本地居民從經濟領域外作短期
受僱所賺取的勞工收益,包括工資、薪金及
其他現金或實物報酬。
CE refers to labour income earned by non-residentsfrom their short-term employment within theeconomic territory of Hong Kong and labour incomeearned by residents from their short-term employmentoutside the economic territory. It comprises wages,salaries and other remuneration whether paid in cashor in kind.
國際收支平衡表 Balance of Payments Account
國際收支平衡表是有系統地載錄,在指定期
間內,某經濟體系與世界其他各地的各類經
濟交易的統計表。
A Balance of Payments (BoP) account is a statisticalstatement that systematically summarizes, for aspecific time period, the economic transactions of aneconomy with the rest of the world.
香港國際收支平衡表的編製,是採用符合國
際貨幣基金組織出版的國際收支平衡手冊
﹙第五版﹚所訂定的國際標準。完整的國際
收支平衡表包括以下兩個主要核算帳:
﹙甲﹚經常帳;及﹙乙﹚資本及金融帳。
The BoP accounts of Hong Kong are compiled inaccordance with international standards and practicesas stipulated in the Fifth Edition of the Balance ofPayments Manual (BPM5) published by theInternational Monetary Fund (IMF). A complete BoPaccount comprises the following two broad accounts:(a) current account; and (b) capital and financialaccount.
經常帳 Current Account
經常帳是主要量度實質資源的流動,包括貨
物的進出口、服務的輸入及輸出、從外地應
收及應付予外地的收益,以及從外地及往外
地的經常轉移。經常帳的交易按總額記錄,
反映一個經濟體系向世界各地提供,或從世
界各地獲取實質資源的情況。
Current account largely measures flow of realresources including exports and imports of goods andservices, income receivable and payable abroad, andcurrent transfers from and to abroad. Current accounttransactions are recorded on a gross basis, reflectingthe provision and acquisition of real resources by aneconomy to and from other economies.
貨物包括所有可移動的貨物,其擁有權由本
地居民轉至非本地居民﹙出口﹚及由非本地
居民轉至本地居民﹙進口﹚。貨物包括一般
商品、用作加工的物資、各種運輸工具在港
口購買的貨物、貨物修理,以及非貨幣黃
金。
Goods comprise all movable goods that changeownership from residents to non-residents (exports)and from non-residents to residents (imports). Goodscover general merchandise, goods for processing,goods procured in ports by carriers, repairs on goods,and non-monetary gold.
服務包括由本地居民向非本地居民(出口)
和由非本地居民向本地居民(進口)所提供
的服務。服務交易是按服務類別分類,分別
為運輸、旅遊、保險服務、金融服務及其他
服務。
Services include services rendered by residents to non-residents (exports) and by non-residents to residents(imports). Service transactions are classified by typeof services, namely transportation, travel, insuranceservices, financial services and other services.
收益是提供生產要素而賺取的所得,包括本
地居民從非本地居民(應收收益)或非本地
居民從本地居民(應付收益)所賺取的所
得。收益組成部分主要分為僱員報酬及投資
收益,而投資收益包括了直接投資收益、有
價證券投資收益及其他投資收益。
Income consists of earnings by residents from non-residents (income receivable) and by non-residentsfrom residents (income payable) for the provision offactors of production. Income is mainly classified intocompensation of employees and investment incomewhich includes direct investment income, portfolioinvestment income and other investment income.

香港統計月刊 二零零三年六月 Hong Kong Monthly Digest of Statistics June 2003200
經常轉移是指一個經濟體系,在無同等經濟
價值回報的情況下,對其他經濟體系所提供
的實質及金融資源,兼且該等資源在轉移後
會被立刻或於短時間內消耗。例如某經濟體
系的居民收取或支付予非居民的職工匯款,
及該經濟體系的政府或居民給予或接受其他
政府或非居民的捐贈,均屬此項的例子。
Current transfers are those transactions in which aneconomy provides to other economies real andfinancial resources, that are immediately or shortlyconsumed, without receiving equivalent values inreturn. Examples are workers’ remittances sent orreceived by residents to or from non-residents, anddonations or gifts given or received by the governmentto or from other government or non-residents.
資本及金融帳 Capital and Financial Account
資本帳是用來量度資本轉移及非生產/非金
融資產的對外交易。
Capital account measures external transactions incapital transfers, and in acquisition or disposal of non-produced, non-financial assets.
資本轉移是指在無報償下,固定資產的轉移
或債務的減免。與收買或放棄固定資產相連
或作為條件的現金轉移亦屬資本轉移。資本
轉移主要是債務減免及移民轉移。移民轉移
是個人因移民而產生的兩個經濟體系之間的
貨物流動及金融項目變動之互相抵銷帳目。
Capital transfers are transfers of ownership of a fixedasset or the forgiveness of a liability without receivingany economic value in return. Cash transfers that arelinked to, or conditional on, the acquisition or disposalof a fixed asset are also capital transfers. Capitaltransfers consist mainly of debt forgiveness andmigrants’ transfers. Migrants’ transfers are contra-entries to flows of goods and changes in financialitems that arise from the migration of individualsbetween two economies.
收買或放棄非生產、非金融資產包括非由生
產而生的有形及無形資產的對外交易。非生
產、非金融資產包括土地及地下資產、專
利、版權及專營權等。
Acquisition or disposal of non-produced, non-financialassets comprises transactions associated with tangibleassets that are not actually produced and transactionsassociated with non-produced intangible assets. Non-produced, non-financial assets include land and subsoilassets, patents, copyrights and franchises etc.
金融帳記錄本地居民與非本地居民之間的金
融資產及負債交易。它顯示某經濟體系如何
融資以進行其對外交易。金融帳內的交易可
歸類為直接投資、有價證券投資、金融衍生
工具、其他投資及儲備資產。
Financial account records transactions in financialassets and liabilities between residents and non-residents. It shows how an economy’s externaltransactions are financed. Transactions in thefinancial account are classified into direct investment,portfolio investment, financial derivatives, otherinvestment and reserve assets.
﹙甲﹚ 直接投資 (a) Direct Investment
直接投資是指一個經濟體系內的某投
資者購買設立在另一經濟體系內的企
業,兼且對該企業有持久利益和在管
理方面具有效的控制權。為達統計目
的,在某企業具有效的控制權是指持
有該企業百分之十或以上的股份。
Direct investment refers to external investmentin which an investor of an economy acquires alasting interest and an effective control over themanagement of an enterprise located in anothereconomy. For statistical purpose, an effectivecontrol is taken as equivalent to a holding of10% or more of the equity in an enterprise.
直接投資包括股本資本、再投資收益
及其他資本。股本資本是指在分行的
股本,以及在附屬公司和聯營公司所
持的股票。再投資收益是指投資者在
Direct investment comprises equity capital,reinvested earnings and other capital. Equitycapital means equity in branches, stock andshares in subsidiaries and associates.Reinvested earnings consist of the investors’share of earnings of their subsidiaries or

香港統計月刊 二零零三年六月 Hong Kong Monthly Digest of Statistics June 2003201
附屬公司及聯營公司所應佔而未獲以
股息形式派發的利潤。其他資本包括
總公司與其附屬公司、聯營公司和分
行間之債務交易。
associates not distributed as dividends. Othercapital includes inter-company debttransactions between parent companies andtheir subsidiaries, associates and branches.
﹙乙﹚ 有價證券投資 (b) Portfolio Investment
有價證券投資是指對非居民的股本證
券及債務證券(例如中長期債券、貨
幣市場工具)所作的投資。與直接投
資者相比,有價證券投資者在投資非
居民企業所發行的股票及債券時,對
該等企業並無持久的利益或在管理方
面具影響力。凡持有一間公司不足10%的股份,均視為有價證券投資。
Portfolio investment refers to investment innon-resident equity securities and debtsecurities (e.g. bonds and notes, money marketinstruments). Compared with direct investors,portfolio investors in equity and debt securitiesof non-resident enterprises have no lastinginterest or influence in the management of thecompanies they invest. A holding of less than10% equity in an enterprise is regarded asportfolio investment.
﹙丙﹚ 金融衍生工具 (c) Financial Derivatives
金融衍生工具是一種與某種特定的金
融工具、指標或商品有連繫的金融工
具,使特定的金融風險本身能透過這
種工具而進行交易(包括在交易所內
及場外)。金融衍生工具包括期權類
合約(如認股權證和期權)及遠期類
合約(如期貨、利率掉期、貨幣掉
期、遠期利率協議、遠期外匯合
約)。
Financial derivatives are financial instrumentsthat are linked to a specific financial instrumentor indicator or commodity, and through whichspecific financial risks can be traded infinancial markets (including on Exchange andover the counter) in their own right. Financialderivatives include option-type contracts (e.g.warrant and option) and forward-type contracts(e.g. future, interest rate swap, currency swap,forward rate agreement, forward foreignexchange contract).
﹙丁﹚ 其他投資 (d) Other Investment
其他投資是指不屬於直接投資、有價
證券投資、金融衍生工具或儲備資
產,而對非居民的其他金融申索及負
債,包括非作銷售的貸款、貨幣和存
款、貿易信貸及財務租賃等。
Other investment refers to other financialclaims on and liabilities to non-residents thatare not classified as direct investment, portfolioinvestment, financial derivatives or reserveassets. Other investment includes non-marketable loans, currency and deposits, tradecredits and financial leases.
﹙戊﹚ 儲備資產 (e) Reserve Assets
儲備資產是指一個經濟體系的金融當
局﹙在香港是指香港金融管理局﹚可
直接用來支付對外收支赤字,兼且可
用於干預外匯市場以影響匯率從而間
接調節該等赤字的外幣資產。
Reserve assets consist of foreign currencyassets that are readily available to andcontrolled by monetary authorities of aneconomy (in the case of Hong Kong, the HongKong Monetary Authority) for directlyfinancing payment imbalances and forindirectly regulating the magnitude of suchimbalances through intervention in foreignexchange markets to affect the currencyexchange rate of that economy.

香港統計月刊 二零零三年六月 Hong Kong Monthly Digest of Statistics June 2003202
非儲備性質的資本及金融資產變動淨值是指
資本轉移的交易及非儲備資產性質的對外投
資交易,即直接投資、有價證券投資、金融
衍生工具和其他投資等的交易。非儲備性質
的金融資產變動淨值是指非儲備資產性質的
對外投資交易。
Net change in capital and financial non-reserve assetsrefer to transactions in capital transfers andtransactions in external investments other thanreserve assets, viz. transactions in direct investment,portfolio investment, financial derivatives and otherinvestment. Net change in financial non-reserveassets refer to transactions in external investmentsother than reserve assets.
在一個特定期間內,如果一個經濟體系在進
行貨物、服務、收益及資產的對外交易,以
及在對外轉移及匯款中,所收取的外匯總額
比支付的多,該體系便有國際收支盈餘,其
金額相等於其從世界各地的淨流入資金總
額。相反地,便有國際收支赤字,其金額相
等於它的淨流出資金總額。
For a reference period, if an economy receives moreforeign currencies than it pays in external transactionsin goods, services, income and assets, as well as inexternal transfers and remittances, then it is said tohave a BoP surplus, which is equal to its overall netinflow of funds from the rest of the world.Conversely, there will be a BoP deficit which is equalto its net outflow of funds.
對外債務統計數字 External Debt Statistics
對外債務總額是指在任何一個時點上,一個
經濟體系的本地居民對非本地居民尚未償還
且屬非或有的實際現有負債數額,而負債人
須於將來償還本金及/或利息。
Gross External Debt (ED), at any time, is theoutstanding amount of those actual current, and notcontingent, liabilities that are owed to nonresidentsby residents of an economy, and require payment(s)of principal and/or interest by the debtor at somepoint(s) in the future.
對外債務並不包括或有的負債。或有的負債
是指那些因作出承諾而會在發生某些清楚界
定的情況時可能出現的責任。一項負債要被
包括於對外債務內必須是實際存在且尚未償
還的。債務包括逾期未收的本金及利息。在
一般情況下於將來提供經濟價值的承諾並不
足以構成申索,直至及除非發生了項目擁有
權的轉換、服務的提供或收益的待付。
Contingent liabilities are not included in ED.Contingent liabilities are commitments to undertakecertain responsibilities in case some well definedconditions are fulfilled. For a liability to be includedit must be actually existing and be outstanding. Debtincludes arrears of principal and interest.Commitments to provide economic value in thefuture generally do not establish claims until andunless ownership of items are changed, services arerendered, or income accrues.
香港的對外債務統計數據是根據以國際貨幣
基金組織為首的跨組織金融統計數據專責小
組出版的《對外債務統計數據:編製人員及
數據使用者指南》編製而成。
ED statistics of Hong Kong are compiled based onthe “External Debt Statistics: Guide for Compilersand Users” published by the Inter-Agency Task Forceon Finance Statistics chaired by the IMF.
對於對外債務頭寸的發布格式,數據分類為
四個不同界別(政府機構、金融當局、銀行
及其他界別),接著再以原訂期限(長期及
短期)及以工具(中長期債券、貨幣市場工
具、貸款、貨幣和存款、及其他債務負債)
分項。而有直接投資關係的實體之間的公司
間借貸則是分開列出的。
In presenting the ED position, the data are classifiedby four sectors (general government, the monetaryauthority, banks and other sectors), followed by termof original maturity (long- and short-term), and byinstrument (bonds and notes, money marketinstruments, loans, currency and deposits, and otherdebt liabilities). Inter-company lending betweenentities in a direct investment relationship isseparately presented.

香港統計月刊 二零零三年六月 Hong Kong Monthly Digest of Statistics June 2003203
長期債務是指原訂期限為多於一年或無期限
的債務,而短期債務是指即期或以一年或以
下為期限的債務。
Long-term debt is defined as debt with a maturity ofmore than one year or with no stated maturity. Short-term debt is debt payable on demand or with amaturity of one year or less.
根據國際定義,欠非本地居民的股票及其他
的股本參與,以及欠非本地居民的金融衍生
工具,由於不需付本金或利息,所以均不包
括於對外債務內。但因逾期結算金融衍生工
具而產生未償還的債項,則與其他逾期債項
一樣,因終需付款而被視為債務負債。
According to international definition, shares andother equity participation, and financial derivativesthat are owed to nonresidents are excluded from EDas they do not require the payment of principal orinterest. Nonetheless, an overdue obligation to settlea financial derivatives contract would, like anyarrears, be a debt liability because a payment isrequired.
國際收支平衡表記錄了在一段期間內所產生
的經濟交易,而對外債務則反映在期末的非
股本負債的水平。前者是一個流動的概念,
而後者則是存量。
While a BoP account records economic transactionsoccurred during a period, ED reflects the level ofnon-equity liabilities at the end of the period. Theformer is a flow concept whilst the latter is a stockone.
交易是在指定時間內的經濟流動。另一方
面,存量是指資產和負債在某個時點的頭寸
或持有量。存量是由先前的交易(亦即流
動)累積而成,然而其他變動例如價格變動
亦會影響在某個特定時點的存量頭寸。
Transactions are economic flows during a specifictime period. On the other hand, stocks are positionsin, or holdings of, assets and liabilities at a point intime. While stocks are resulted from theaccumulation of prior transactions (i.e. flows), otherchanges such as valuation changes also affect thestock position at a particular time point.
至於對外債務,在一段時間內債務存量的變
動也可能不等於期內所發生的債務流動,因
前者可能只涉及不牽涉流動的存量變動。該
等變動的例子包括:撇賬、當一實體由一機
構界別轉至另一界別所產生的債務重新分
類,及市場外力引致的其他計價變動。
For ED, changes on debt stocks in a period may alsodiffer from that implied by debt flows during theperiod as the former may involve changes in stocksthat do not entail flows. Examples on such changesinclude: write-off of bad debts, reclassifications ofexternal debt such as when entities switch from oneinstitutional sector to another, and other valuationchanges resulted from market or external forces.
其他有關刊物 Further References
二○○二年經濟概況,財經事務及庫務
局編製
2002 Economic Background, published by theFinancial Services and the Treasury Bureau
二○○三年經濟展望,財經事務及庫務
局編製
2003 Economic Prospects, published by theFinancial Services and the Treasury Bureau
香港國際收支平衡統計(季刊) Balance of Payments Statistics of Hong Kong(Quarterly)
香港國際收支平衡統計一九九七年至一九九九年
Balance of Payments Statistics of Hong Kong1997 to 1999
香港對外直接投資統計(年刊) External Direct Investment Statistics of Hong Kong(Annual)
本地生產總值統計特刊 Special Report on Gross Domestic Product二○○二年本地生產總值 2002 Gross Domestic Product香港服務貿易統計報告(年刊) Report on Hong Kong Trade in Services Statistics
(Annual)本地生產總值(季刊) Gross Domestic Product (Quarterly)

香港統計月刊 二零零三年六月 Hong Kong Monthly Digest of Statistics June 2003204
國民收入及國際收支平衡統計
小冊子系列(免費)
Pamphlet Series on National Income and Balance ofPayments Statistics (free)
� 本地生產總值、本地居民生產總值和國際收支平衡統計簡介
� Introduction to Gross Domestic Product, GrossNational Product and Balance of PaymentsStatistics
� 理解本地生產總值及本地居民生產總值的概念
� Understanding the Concepts of Gross DomesticProduct and Gross National Product
� 國際收支平衡表概念簡介 � A Brief Guide to Concepts of Balance ofPayments
� 國際收支平衡統計的用途 � Uses of Balance of Payments Statistics� 淺述國際收支平衡核算法 � Introduction to Balance of Payments
Accounting� 編製香港特別行政區國際收支平衡
表的資料來源� Data Sources for Compiling the Balance of
Payments Account of the Hong Kong SpecialAdministrative Region
� 闡釋國際收支平衡經常帳 � Interpreting the Current Account of Balance ofPayments
� 闡釋國際收支平衡的資本及金融帳 � Interpreting the Capital and Financial Accountof Balance of Payments
� 國際投資頭寸、對外債務與國際收支平衡的關係
� International Investment Position, ExternalDebt and their Relationships with Balance ofPayments

圖 12.1 本地生產總值的實質變動百分率Chart 12.1 Percentage Change in GDP in Real Terms
圖 12.2 國際收支平衡表Chart 12.2 Balance of Payments Account
按年變動百分率
Year-on-year % change與對上季度比較的實質變動百分率(經季節性調整的數列)Quarter-to-quarter % change (seasonally adjusted series)
-2
0
2
4
6
8
10
12
Q1/01 Q3/01 Q1/02 Q3/02 Q1/03
%
-6
-4
-2
0
2
4
6
8
10
12
14
1992 1994 1996 1998 2000 2002
%
經常帳差額
Current account balance非儲備性質的金融資產變動淨值
Net change in financialnon-reserve assets
整體的國際收支
Overall Balance of Payments
-80
-60
-40
-20
0
20
40
60
80
100
120
Q4/00 Q2/01 Q4/01 Q2/02 Q4/02
十億港元
HK$ billion
-200-180-160-140-120-100
-80-60-40-20
020406080
100120140
1998 1999 2000 2001 2002
十億港元
HK$ billion
205香港統計月刊 二零零三年六月 Hong Kong Monthly Digest of Statistics June 2003

12.1 按開支組成部分劃分的本地生產總值 ─ 以當時市價計算Gross Domestic Product (GDP) by Expenditure Component─ At Current Market Prices
百萬港元
HK$ million
本地生產總值的組成部分
GDP components
貨物出口
私人消費開支 政府消費開支 (離岸價)
Private Government 存貨增減 Exports 年 consumption consumption Changes in of goods Year expenditure expenditure inventories (f.o.b.)
2000 744,401 120,148 14,3992001 @ 746,856 128,863 -4,0602002 @ 709,231 131,199 2,4172002 @ 178,740 34,201 -2,598
@ 179,112 31,546 1,089@ 175,614 33,428 1,265@ 175,765 32,024 2,661
2003 @ 170,301 33,712 2,319
本地生產總值的組成部分 --- 續 按開支組成部分劃分 按人口平均計算
GDP components --- cont'd. 的本地生產總值 的本地生產總值
GDP by expenditure (港元)
減 : component Per capita GDP貨物進口 (HK$)(離岸價)
Less: 服務輸出
年 Imports of ExportsYear goods (f.o.b.) of services
2000 1,636,711 317,580 1,288,3382001 @ 1,549,222 325,889 1,269,9752002 @ 1,601,527 357,147 1,259,7712002 @ 338,531 78,241 298,319
@ 390,072 83,343 306,223@ 440,498 94,798 324,677@ 432,427 100,765 330,551
2003 @ 399,421 86,828 297,177
Source :
10 - 12 73,629 426,824
10 - 12 48,690 N.A.
1 - 3 66,765 383,436
45,538
1 - 3 46,763 N.A.
1 - 3 47,081 N.A.
7 - 9 52,103 N.A.4 - 6
資料來源: 政府統計處國民收入統計科(一)(查詢電話:2582 5077) Census and Statistics Department
National Income Branch(1),
(Enquiry Telephone No.: 2582 5077)
193,299
N.A.
192,453 188,847193,412 185,615
Month of services
191,543
服務輸入Less:
月 Imports
373,691435,519
減 :
7 - 9 4 - 6 73,052
76,654
1 - 3292,595 1,562,121
69,260 326,087
333,115 1,480,987347,375 1,572,689
月 domestic fixedMonth
本地固定資本
形成總額Gross
capital formation
香港統計月刊 二零零三年六月 206 Hong Kong Monthly Digest of Statistics June 2003

12.2 按開支組成部分劃分的本地生產總值 ─ 物量指數 (二零零零年=100)Gross Domestic Product (GDP) by Expenditure Component─ Volume Indices (2000=100)
本地固定資本 貨物出口 貨物進口
私人消費開支 形成總額 (離岸價) (離岸價)
Government Gross Exports Imports 年 consumption domestic fixed of goods of goodsYear expenditure capital formation (f.o.b.) (f.o.b.)
2000 100.0 100.0 100.0 100.02001 @ 106.1 102.7 -34.0 98.12002 @ 108.6 98.2 20.0 105.92002 @ 112.8 91.3 -78.8 89.0
@ 103.6 97.5 34.7 103.4@ 110.2 103.6 41.2 116.4@ 107.8 100.4 83.0 114.7
2003 @ 114.1 94.9 75.6 105.7
按人口平均 本地生產總值計算的本地 內含平減
生產總值 物價指數component Per capita Implicit price
GDP deflator of GDP
服務輸入 年 ImportsYear of services
2000 100.0 100.0 100.02001 @ 102.0 99.6 98.12002 @ 102.3 100.9 95.22002 @ 102.5 N.A. 96.4
@ 96.3 N.A. 96.3@ 108.4 N.A. 94.7@ 101.8 N.A. 93.6
2003 @ 98.4 N.A. 91.9
資料來源: 政府統計處國民收入統計科(一) Source : National Income Branch(1),(查詢電話:2582 5077) Census and Statistics Department
(Enquiry Telephone No.: 2582 5077)
10 - 12 100.5 115.4
10 - 12 135.9 109.7
1 - 3 97.8 103.9
96.1
100.5
4 - 6 110.1 98.7 7 - 9 126.9 106.5
100.0
GDP components
119.4 102.7
1 - 3 117.5
1 - 3 104.8
100.0
月 ExportsMonth of services
106.9 100.5
GDP by expenditure --- cont'd.
服務輸出
本地生產總值的組成部分 按開支組成部分劃分 --- 續 的本地生產總值
117.0
1 - 3 100.0
7 - 9 99.8100.4
87.3 4 - 6 100.7
100.3
100.0
105.0101.6 96.7100.0
月 consumption Changes inMonth expenditure inventories
本地生產總值的組成部分GDP components
政府消費開支Private 存貨增減
香港統計月刊 二零零三年六月 207 Hong Kong Monthly Digest of Statistics June 2003

本地生產總值及個別開支組成部分的按季實質變動百分率Percentage Change in Real Terms of Quarterly Gross Domestic Product (GDP)and Selected Expenditure Components
本地固定資本
本地 政府 形成總額
生產總值 消費開支 Gross 貨物出口 貨物進口 服務輸出 服務輸入
Gross Government domestic fixed Exports Imports Exports Imports年 月 domestic consumption capital of of of of
Year Month product expenditure formation goods goods services services
2002 @ -0.6 +2.3 -2.4 -4.0 +6.0 -0.7@ +0.8 +3.0 +5.9 +6.0 +7.7 -3.8@ +3.4 +3.5 +11.5 +10.8 +13.9 +2.0@ +5.1 +0.8 +18.4 +18.2 +18.1 +3.4
2003 @ +4.5 +1.1 +19.1 +18.8 +12.2 -4.0
貨物出口 貨物進口 服務輸出 服務輸入
Exports Imports Exports Imports年 月 of of of of
Year Month goods goods services services
2002 @ +4.6 +4.6 +1.9 +0.4@ +5.7 +5.9 +4.3 -1.6@ +4.1 +4.6 +6.1 +3.8@ +3.9 +3.0 +5.1 +1.1
2003 @ +3.1 +3.7 -3.7 -7.0註釋: (1) Notes : (1)
§ 變動在±0.05%之內。 §
政府統計處國民收入統計科(一) Source : National Income Branch(1),(查詢電話:2582 5077) Census and Statistics Department
(Enquiry Telephone No.: 2582 5077)
10 - 12 -1.8 -0.7
10 - 12 +1.7 -0.9 -1.2
-2.1 +3.9 1 - 3
1 - 3 4 - 6
本地固定資本形成總額並無經季節性調整數字是因為該開支組成部分並無顯示明顯的季節性模式。
7 - 9 +2.0
1 - 3 -0.3 -0.3
+0.3 +0.5
There are no seasonally adjusted figures in respect ofgross domestic fixed capital formation as no clearseasonal pattern is displayed in this expenditurecomponent.
資料來源:
Change within ±0.05%.
§
+2.3
domestic consumption consumptionproduct expenditure expenditure
+0.4
-0.3
生產總值 消費開支 消費開支Gross Private Government
1 - 3 -0.1 -11.8
-1.2 -4.3 4 - 6 -2.2 -0.2
7 - 9
consumptionexpenditure
Percentage change over the same period of the preceding year
私人
消費開支Private
12.3
變動百分率
% change
與上年同期比較的變動百分率
經季節性調整數列與對上季度比較的變動百分率(1)
+1.1 -0.7 -0.2
Quarter-to-quarter percentage change in the seasonally adjusted series(1)
本地 私人 政府
香港統計月刊 二零零三年六月 208 Hong Kong Monthly Digest of Statistics June 2003

按經濟活動劃分的本地生產總值 ___ 以當時價格計算Gross Domestic Product (GDP) by Economic Activity ___ At Current Prices
2001@
百萬港元 百分比 百萬港元 百分比
經濟活動 Economic activity HK$ million % HK$ million %
農業及漁業 Agriculture and fishing 920 0.1 1,003 0.1採礦及採石業 Mining and quarrying § 241 § 174 §
製造業 Manufacturing 71,655 5.8 63,519 5.2電力、燃氣及水務業 Electricity, gas and water 38,853 3.2 40,126 3.3建造業 Construction 64,026 5.2 58,971 4.8
服務業 Services 1,053,202 85.7 1,052,449 86.5
批發、零售、 Wholesale, retail and 324,622 26.4 324,652 26.7進出口貿易、 import/export trades,飲食及酒店業 restaurants and hotels
批發及零售業 Wholesale and retail trades 45,505 3.7 45,283 3.7進出口貿易業 Import/export trade 240,521 19.6 244,148 20.1飲食及酒店業 Restaurants and hotels 38,596 3.1 35,221 2.9
運輸、倉庫及 Transport, storage and 125,724 10.2 124,260 10.2通訊業 communications
運輸及倉庫業 Transport and storage 98,298 8.0 94,900 7.8通訊業 Communications 27,426 2.2 29,360 2.4
金融、保險、 Financing, insurance, 291,062 23.7 274,919 22.6地產及商用 real estate and服務業 business services
金融及保險業 Financing and insurance 156,258 12.7 146,898 12.1地產業 Real estate 77,652 6.3 71,936 5.9商用服務業 Business services 57,152 4.7 56,085 4.6
社區、社會及 Community, social and 252,435 20.5 265,081 21.8個人服務業 personal services
樓宇業權 Ownership of premises 155,303 12.6 159,118 13.1減:非直接計算 Less :Adjustment for financial 95,945 7.8 95,582 7.9
的金融中介 intermediation services服務調整 indirectly measured
本地生產總值 1,228,897 100.0 1,216,241 100.0(以要素成本計算)
生產及入口稅 Taxes on production and 57,908 53,917imports
統計差額(1) Statistical discrepancy(1) 0.1% §
以當時市價計算的 1,288,338 1,269,975本地生產總值
(1) (1)
§ §
2000
296,318
37,21167,232
1,004,335 85.3
百分比
%
11.9
資料來源:
GDP at factor cost
281,439
140,41487,314
12.4
1,171307
67,540
百萬港元
HK$ million
1999
0.1
45,992213,853
36,473112,667
註釋:
GDP at current market prices
少於 0.05%。
1,246,134
統計差額是以開支面編製的本地生產總值與以生產面編製的本地生產總值的差額。這差額是由於使用不同資料來源及估算方法而引起的。統計差額是以佔本地生產總值的百分比形式作表達。
89,63223,035
5.73.2
7.6
5.7
3.918.2
3.1
2.0
162,48894,580
53,711
25.2
8.013.8
20.9
23.9
9.6
246,003
7.44.6
Statistical discrepancy refers to the difference in values of GDPcompiled using the expenditure and production approaches, as aresult of the adoption of different data sources and estimationmethods. It is expressed as a percentage to GDP.
100.0
(Enquiry Telephone No.: 2116 5115)
Less than 0.05%.
Notes :
National Income Branch(2),Census and Statistics Department
1,177,796
53,474
1.2%
(查詢電話:2116 5115)Source :政府統計處國民收入統計科(二)
香港統計月刊 二零零三年六月 209 Hong Kong Monthly Digest of Statistics June 2003

按經濟活動劃分的本地生產總值 ___ 以固定(二零零零年)價格計算Gross Domestic Product (GDP) by Economic Activity ___ At Constant (2000) Prices
百萬港元(另有註明除外)HK$ million, unless otherwise specified
2001 2002 2002 2002 2002第四季@ 第一季@ 第二季@ 第三季@ 第四季@
經濟活動 Economic activity 2002@ 4th Qtr@ 1st Qtr@ 2nd Qtr@ 3rd Qtr@ 4th Qtr@
農業及漁業 Agriculture and fishing 255 246 262 226 264採礦及採石業 Mining and quarrying 50 40 40 38 60製造業 Manufacturing 16,248 13,477 15,031 16,108 15,072電力、燃氣及水務業 Electricity, gas and water 9,673 8,506 10,632 12,157 9,736建造業 Construction 17,646 14,876 14,128 15,156 16,516
服務業 Services 257,084 264,713 286,422 295,783
批發、零售、 Wholesale, retail and 73,724 76,012 94,063 98,035進出口貿易、 import/export trades,飲食及酒店業 restaurants and hotels
批發及零售業 Wholesale and retail trades 12,110 10,289 10,605 10,968 11,870進出口貿易業 Import/export trade 64,716 54,757 57,321 74,903 77,660飲食及酒店業 Restaurants and hotels 8,818 8,678 8,087 8,192 8,506
運輸、倉庫及 Transport, storage and 33,053 31,263 31,988 35,141 35,106通訊業 communications
運輸及倉庫業 Transport and storage 25,075 23,432 24,098 26,757 26,818通訊業 Communications 7,978 7,831 7,890 8,384 8,288
金融、保險、 Financing, insurance, 73,714 70,361 73,282 73,417 75,579地產及商用 real estate and服務業 business services
金融及保險業 Financing and insurance 37,976 36,250 39,323 37,589 39,502地產業 Real estate 20,716 19,901 19,957 20,845 20,428商用服務業 Business services 15,022 14,210 14,002 14,982 15,650
社區、社會及 Community, social and 68,231 63,886 66,359 65,450 68,570個人服務業 personal services
樓宇業權 Ownership of premises 41,032 40,889 40,228 41,535 41,816減:非直接計算 Less :Adjustment for financial 23,709 23,040 23,156 23,184 23,325
的金融中介 intermediation services服務調整 indirectly measured
生產及入口稅 Taxes on production and 15,002 15,403 12,531 14,833imports
統計差額(1) Statistical discrepancy(1) 0.1% -0.7% 0.1% 0.3%
以固定(二零零零年) GDP at constant (2000) 309,548 317,857 342,983 353,262市價計算的 market prices本地生產總值
(1) Note : (1)
資料來源: 政府統計處國民收入統計科(二) Source : National Income Branch(2),(查詢電話:2116 5115) Census and Statistics Department
(Enquiry Telephone No.: 2116 5115)
Statistical discrepancy refers to the difference in values ofGDP compiled using the expenditure and productionapproaches, as a result of the adoption of different datasources and estimation methods. It is expressed as apercentage to GDP.
152,66481,131
32,394
-0.1%
85,645
1,104,002 277,965
335,996
-0.1%
1,323,650
264,266
164,46892,705
14,452
12.5
41,03059,688
179
57,768
60,677
997
341,835
註釋:
43,731264,642
33,463133,498
101,104
292,640
58,845
統計差額是以開支面編製的本地生產總值與以生產面編製的本地生產總值的差額。這差額是由於使用不同資料來源及估算方法而引起的。統計差額是以佔本地生產總值的百分比形式作表達。
香港統計月刊 二零零三年六月 210 Hong Kong Monthly Digest of Statistics June 2003

二零零三年本地生產總值及其主要開支組成項目的預測增長率及主要物價指標的預測增減率Forecast Growth Rates of the Gross Domestic Product and its Main Expenditure Components and Forecast Rates of Change in the Main Price Indicators for 2003
二零零三年與二零零二年比較的預測
[ 於二零零三年五月三十日公布 ]
Forecast for 2003 as compared with 2002[ released on 30.5.2003 ]
(%)
實質增長率: Growth rate in real terms of :
私人消費開支 Private Consumption Expenditure -3
政府消費開支 Government Consumption Expenditure 4
本地固定資本形成總額 Gross Domestic Fixed Capital Formation -5.5其中: of which :樓宇及建造 Buildings and construction -7.4機器、設備及電腦軟件 Machinery, equipment and computer software -3.6
整體貨物出口 Total Exports of Goods 5.5轉口 Re-exports 7.5港產品出口 Domestic exports -15
貨物進口 Imports of Goods 2.9
服務輸出 Exports of Services -2
服務輸入 Imports of Services -13.5
本地生產總值 Gross Domestic Product (GDP) 1.5
增減率: Rate of change in :
本地生產總值平減物價指數 GDP Deflator -3.5
綜合消費物價指數 Composite Consumer Price Index -2.5
名義本地生產總值增減百分率 Rate of change in Nominal GDP -2
註釋 : Note:
資料來源:政府總部財經事務及庫務局經濟分析部 Source: Economic Analysis Division, (查詢電話:2529 0172) Financial Services and the Treasury Bureau,
Government Secretariat(Enquiry Telephone No.: 2529 0172)
12.6
上表摘錄自財經事務及庫務局經濟分析部的新聞稿「二零零三年第一季經濟情況及二零零三年本地生產總值和物價修訂預測」。有關香港經濟最近發展的詳細分析,請參閱《二○○三年第一季經濟報告》。
The above table is extracted from the press release on the"Economic Situation in the First Quarter of 2003 and UpdatedGDP and Price Forecasts for 2003" issued by the EconomicAnalysis Division of the Financial Services and the TreasuryBureau. For a detailed analysis of recent developments in the HongKong economy, please refer to the First Quarter Economic Report2003.
香港統計月刊 二零零三年六月 211 Hong Kong Monthly Digest of Statistics June 2003

本地居民生產總值及按收益組成部分和交易者類別劃分的對外要素收益流動(以當時市價計算)Gross National Product (GNP) and External Factor Income Flows (EFIF)by Income Component by Type of Transactor (At Current Market Prices)
百萬港元(另有註明除外)
HK$ million, unless otherwise specified
2002 2002 2002 2002收益組成部分類別 Type of Income Component 第四季 第一季@ 第二季@ 第三季@ 第四季@
交易者類別 Type of Transactor 2002@ 4th Qtr 1st Qtr@ 2nd Qtr@ 3rd Qtr@ 4th Qtr@
直接投資收益 Direct investment income流入總計 Inflow total 165,164 39,744 38,871 49,463 37,086
銀行 Banking 8,539 1,683 2,233 2,315 2,309其他(1) Others(1) 156,625 38,061 36,639 47,148 34,777
流出總計 Outflow total 230,854 52,818 55,775 66,561 55,699銀行 Banking 61,322 16,581 16,984 13,560 14,197其他(1) Others(1) 169,532 36,237 38,792 53,001 41,502
流動淨值總計 Net flow total -65,689 -13,074 -16,904 -17,098 -18,614銀行 Banking -52,783 -14,898 -14,751 -11,245 -11,888其他(1) Others (1) -12,907 1,824 -2,153 -5,853 -6,725
有價證券投資收益 Portfolio investment income流入總計 Inflow total 93,499 25,160 22,622 24,723 20,995
銀行 Banking 26,394 5,769 6,626 6,704 7,296其他(1) Others(1) 67,105 19,391 15,996 18,019 13,699
流出總計 Outflow total 27,014 4,838 10,215 5,563 6,398銀行 Banking 4,195 1,700 749 1,363 382其他(1) Others(1) 22,820 3,138 9,466 4,200 6,016
流動淨值總計 Net flow total 66,485 20,322 12,406 19,160 14,597銀行 Banking 22,199 4,068 5,877 5,340 6,914其他(1) Others (1) 44,285 16,253 6,529 13,819 7,683
其他投資收益 Other investment income流入總計 Inflow total 65421 17,502 16,613 15,638 15,669
銀行 Banking 56,255 15,142 14,208 13,304 13,602其他(1) Others(1) 9,166 2,360 2,405 2,334 2,067
流出總計 Outflow total 38,793 9,971 9,978 9,600 9,244銀行 Banking 32,180 8,748 8,280 8,094 7,058其他(1) Others(1) 6,613 1,223 1,698 1,506 2,186
流動淨值總計 Net flow total 26,628 7,531 6,634 6,038 6,424銀行 Banking 24,075 6,394 5,928 5,210 6,543其他(1) Others (1) 2,553 1,137 707 828 -119
僱員報酬 Compensation of employees流入總計 Inflow total 15 6 4 3 2流出總計 Outflow total 15 6 4 3 2流動淨值總計 Net flow total 0 0 0 0 0
對外要素收益流動總額 Total EFIF流入總計 Inflow total 324,099 82,412 78,110 89,826 73,751流出總計 Outflow total 296,676 67,633 75,973 81,726 71,344流動淨值總計 Net flow total 27,423 14,779 2,137 8,099 2,408
本地生產總值@ GDP@ 1,271,082 301,482 308,443 326,417 334,740按人口平均計算的 Per capita GDP (HK$)@ 187,282 N.A. N.A. N.A. N.A.
本地生產總值(港元)@
本地居民生產總值@ GNP@ 1,298,505 316,261 310,580 334,516 337,148按人口平均計算的 Per capita GNP (HK$)@ 191,322 N.A. N.A. N.A. N.A.
本地居民生產總值(港元)@
(1) 包括住戶、政府單位、非牟利機構及經營銀行業務以外的公司。 Note: (1)
資料來源: 政府統計處國際收支平衡統計科(二) Source: Balance of Payments Branch (2),(查詢電話:2116 5102) Census and Statistics Department
(Enquiry Telephone No.: 2116 5102)
12.7
註釋 :
companies other than those in the banking business.
2001
Including households, government units, non-profit institutions and
34,3662,243
32,12351,28814,67936,609
-16,922-12,436
-4,485
21,1016,147
14,9545,215
4304,785
15,8875,717
10,170
21,51118,559
2,95313,27211,697
1,5768,2396,8621,377
660
76,98569,7817,204
331,276N.A.
338,480N.A.
香港統計月刊 二零零三年六月 212 Hong Kong Monthly Digest of Statistics June 2003

12.8 按主要收益來源地/目的地國家/地區劃分的對外要素收益流動
External Factor Income Flows (EFIF) by Major Source/Destination Country/Territory
百萬港元
HK$ million
2001 2002 2002 2002 2002收益來源地/目的地 Source/Destination 第四季 第一季@ 第二季@ 第三季@ 第四季@
收益流動 Income Flow 2002@ 4th Qtr 1st Qtr@ 2nd Qtr@ 3rd Qtr@ 4th Qtr@
所有國家/地區 All countries/territories流入 Inflow 324,099 76,985 82,412 78,110 89,826 73,751流出 Outflow 296,676 69,781 67,633 75,973 81,726 71,344流動淨值 Net Flow 27,423 7,204 14,779 2,137 8,099 2,408
中國內地 The mainland of China流入 Inflow 74,460 15,855 17,146 19,427 21,407 16,479流出 Outflow 52,321 12,526 13,233 13,081 15,823 10,184流動淨值 Net Flow 22,139 3,329 3,913 6,347 5,584 6,296
日本 Japan流入 Inflow 10,717 3,834 3,443 2,908 2,112 2,254流出 Outflow 23,137 6,328 4,771 6,638 6,358 5,371流動淨值 Net Flow -12,420 -2,494 -1,328 -3,729 -4,246 -3,116
美國 United States流入 Inflow 40,392 11,581 11,305 10,175 9,681 9,230流出 Outflow 38,640 8,400 7,781 11,478 9,427 9,955流動淨值 Net Flow 1,753 3,181 3,525 -1,302 255 -725
英國 United Kingdom流入 Inflow 27,817 5,509 9,421 5,340 7,847 5,210流出 Outflow 21,612 5,795 4,685 6,522 5,471 4,934流動淨值 Net Flow 6,205 -286 4,735 -1,182 2,376 276
英屬維爾京群島 British Virgin Islands流入 Inflow 64,786 12,139 15,654 13,935 21,866 13,330流出 Outflow 51,941 14,085 12,868 10,584 16,542 11,947流動淨值 Net Flow 12,844 -1,946 2,786 3,351 5,324 1,383
其他國家/地區 Other countries/territories 流入 Inflow 105,927 28,067 25,443 26,324 26,912 27,248流出 Outflow 109,025 22,647 24,295 27,671 28,106 28,954流動淨值 Net Flow -3,098 5,420 1,148 -1,347 -1,193 -1,706
資料來源: 政府統計處國際收支平衡統計科(二) Source : Balance of Payments Branch (2), (查詢電話:2116 5102) Census and Statistics Department
(Enquiry Telephone No.: 2116 5102)
213香港統計月刊 二零零三年六月 Hong Kong Monthly Digest of Statistics June 2003

12.9 國際收支平衡表Balance of Payments Account
百萬港元
HK$ million
2001 2002 2002 2002 2002
第四季@ 第一季@ 第二季@ 第三季@ 第四季@
標準組成部分 Standard Components 2002@ 4th Qtr@ 1st Qtr@ 2nd Qtr@ 3rd Qtr@ 4th Qtr@
經常帳(1) Current Account(1) 137,277 38,443 30,034 19,943 41,993 45,306
貨物 Goods -39,406 -5,004 -12,444 -16,381 -4,979 -5,603
服務 Services 163,735 39,635 31,160 37,805 42,695 52,075
收益 Income 27,423 7,204 14,779 2,137 8,099 2,408
經常轉移 Current transfers -14,475 -3,392 -3,461 -3,618 -3,822 -3,573
資本及金融帳(1) Capital and Financial Account(1) -191,417 -24,810 -46,809 -30,363 -57,056 -57,189
非儲備性質的資本及 Capital and financial non-reserve -209,958 -32,842 -42,948 -33,483 -64,756 -68,771金融資產(變動淨值)(2) assets (net change)(2)
資本轉移 Capital transfers -15,725 -1,590 -2,998 -7,586 -1,912 -3,229
非儲備性質的金融 Financial non-reserve assets -194,233 -31,252 -39,950 -25,897 -62,844 -65,542資產(變動淨值)(2) (net change)(2)
直接投資 Direct investment -31,007 -5,928 -10,139 15,254 -32,735 -3,387
有價證券投資 Portfolio investment -290,749 -92,904 7,056 -117,765 -82,478 -97,561
金融衍生工具 Financial derivatives 10,616 8,642 12,316 6,054 -5,706 -2,048
其他投資 Other investment 116,906 58,938 -49,183 70,560 58,075 37,454
儲備資產(變動淨值)(2) Reserve assets (net change)(2) 18,541 8,032 -3,861 3,120 7,700 11,582
淨誤差及遺漏(3) Net errors and omissions(3) 54,140 -13,632 16,775 10,420 15,063 11,883
整體的國際收支 Overall Balance of Payments -18,541 -8,032 3,861 -3,120 -7,700 -11,582(赤字) (赤字) (盈餘) (赤字) (赤字) (赤字)
(in deficit) (in deficit) (in surplus) (in deficit) (in deficit) (in deficit)
註釋: Notes: (1)
(2)
(3)
Source: Balance of Payments Branch (1),Census and Statistics Department(Enquiry Telephone No.: 2116 8677)
資料來源:
(1)
(2)
政府統計處國際收支平衡統計科(一)
根據國際收支平衡表的會計常規,經常帳差額的正數顯示盈餘而負數則顯示赤字。在資本及金融帳方面,正數顯示淨資金流入而負數則顯示淨資金流出。由於對外資產的增加是屬於借方帳目而減少則屬貸方帳目,因此負數的儲備資產變動淨值顯示儲備資產的增加,而正數則顯示減少。
在國際收支平衡架構下儲備及非儲備資產變動淨值的估計是指交易數字。因計價方式改變(包括價格變動及匯率變動)及分類重組所導致的影響並不包括在內。
(3) 原則上,貸方和借方各項帳目的淨總和應相等於零。但實際上,貸方和借方帳目的資料是透過不同的來源搜集,基於各種原因會有差異。為了令貸方和借方帳目的總和相等,便須加進一個餘額項目,以反映平衡表的「淨誤差及遺漏」。
In principle, the net sum of credit entries and debit entries is zero. Inpractice, discrepancies between the credit and debit entries may howeveroccur for various reasons as the data are collected from many sources.Equality between the sum of credit entries and debit entries is broughtabout by the inclusion of a balancing item which reflects net errors andomissions.
In accordance with the Balance of Payments accounting rules, a positivevalue for the balance figure in the current account represents a surpluswhereas a negative value represents a deficit. For the capital andfinancial account, a positive value indicates a net capital and financialinflow and a negative value indicates a net outflow. As increases inexternal assets are debit entries and decreases are credit entries, anegative value for net change in reserve assets represents a net increaseand a positive value represents a net decrease.
The estimates on net change in reserve and non-reserve assets under theBalance of Payments framework are transaction figures. Effects fromvaluation changes (including price changes and exchange rate changes)and reclassifications are excluded.
(查詢電話:2116 8677)
香港統計月刊 二零零三年六月 214 Hong Kong Monthly Digest of Statistics June 2003

12.10 國際收支平衡表分項:經常帳Balance of Payments Sub-account Components:Current Account
百萬港元
HK$ million
2001 2002 2002 2002 2002
第四季@ 第一季@ 第二季@ 第三季@ 第四季@
標準組成部分 Standard Components 2002@ 4th Qtr@ 1st Qtr@ 2nd Qtr@ 3rd Qtr@ 4th Qtr@
經常帳(1) Current Account(1) 137,277 38,443 30,034 19,943 41,993 45,306
貸方(2) Credit(2) 2,248,723 535,521 487,815 537,317 621,174 602,416借方(2) Debit(2) -2,111,446 -497,078 -457,782 -517,375 -579,181 -557,110
貨物 Goods -39,406 -5,004 -12,444 -16,381 -4,979 -5,603
貸方 Credit 1,562,121 371,497 326,087 373,691 435,519 426,824借方 Debit -1,601,527 -376,501 -338,531 -390,072 -440,498 -432,427
服務 Services 163,735 39,635 31,160 37,805 42,695 52,075
貸方 Credit 357,147 85,772 78,241 83,343 94,798 100,765借方 Debit -193,412 -46,137 -47,081 -45,538 -52,103 -48,690
運輸,貸方 Transportation, credit 103,003 22,238 23,374 25,275 28,065 26,289運輸,借方 Transportation, debit -51,670 -11,764 -11,558 -12,675 -14,292 -13,145
旅遊,貸方 § Travel, credit § 78,046 17,499 15,811 20,033 18,020 24,182旅遊,借方 Travel, debit -96,846 -22,087 -25,315 -22,656 -25,938 -22,937
保險服務,貸方 Insurance services, credit 3,739 991 818 949 907 1,065保險服務,借方 Insurance services, debit -4,024 -1,087 -851 -977 -1,038 -1,158
金融服務,貸方 Financial services, credit 20,906 5,120 5,488 5,283 5,140 4,995金融服務,借方 Financial services, debit -5,348 -1,300 -1,303 -1,338 -1,320 -1,387
其他服務,貸方 Other services, credit 151,453 39,924 32,750 31,803 42,666 44,234其他服務,借方 Other services, debit -35,524 -9,899 -8,054 -7,892 -9,515 -10,063
收益 Income 27,423 7,204 14,779 2,137 8,099 2,408
貸方 Credit 324,099 76,985 82,412 78,110 89,826 73,751借方 Debit -296,676 -69,781 -67,633 -75,973 -81,726 -71,344
投資收益,貸方 Investment income, credit 324,084 76,979 82,406 78,106 89,823 73,749
直接投資收益 Direct investment income 165,164 34,366 39,744 38,871 49,463 37,086
股息及 Dividends and 116,430 18,251 10,996 10,934 50,896 43,604已分發的分行利潤 distributed branch profits
再投資收益及 Reinvested earnings and 46,651 15,478 28,193 27,474 -1,899 -7,117未分發的分行利潤 undistributed branch profits
債務收益(利息) Income on debt (interest) 2,083 637 554 463 467 600
有價證券投資收益 Portfolio investment income 93,499 21,101 25,160 22,622 24,723 20,995
股本收益 Income on equity 22,151 3,114 7,569 4,382 7,084 3,115
中長期債券收益 Income on bonds and notes 66,710 16,807 16,449 17,104 16,496 16,660
貨幣市場工具收益 Income on money market instruments 4,638 1,180 1,141 1,136 1,142 1,219
其他投資收益 Other investment income 65,421 21,511 17,502 16,613 15,638 15,669
投資收益,借方 Investment income, debit -296,661 -69,774 -67,627 -75,969 -81,724 -71,341
直接投資收益 Direct investment income -230,854 -51,288 -52,818 -55,775 -66,561 -55,699
股息及 Dividends and -80,485 -64,694 -15,028 -23,424 -17,829 -24,204已分發的分行利潤 distributed branch profits
再投資收益及 Reinvested earnings and -145,740 15,148 -36,674 -31,156 -47,505 -30,405未分發的分行利潤 undistributed branch profits
債務收益(利息) Income on debt (interest) -4,629 -1,742 -1,116 -1,195 -1,227 -1,091
香港統計月刊 二零零三年六月 215 Hong Kong Monthly Digest of Statistics June 2003

12.10 (續) 國際收支平衡表分項:經常帳(Cont'd.) Balance of Payments Sub-account Components:
Current Account百萬港元
HK$ million
2001 2002 2002 2002 2002
第四季@ 第一季@ 第二季@ 第三季@ 第四季@
標準組成部分 Standard Components 2002@ 4th Qtr@ 1st Qtr@ 2nd Qtr@ 3rd Qtr@ 4th Qtr@
有價證券投資收益 Portfolio investment income -27,014 -5,215 -4,838 -10,215 -5,563 -6,398
股本收益 Income on equity -22,412 -3,959 -3,633 -9,077 -4,345 -5,358
中長期債券收益 Income on bonds and notes -3,968 -1,059 -1,035 -931 -1,064 -938
貨幣市場工具收益 Income on money market instruments -635 -197 -170 -208 -154 -102
其他投資收益 Other investment income -38,793 -13,272 -9,971 -9,978 -9,600 -9,244
僱員報酬,貸方 Compensation of employees, credit 15 6 6 4 3 2
僱員報酬,借方 Compensation of employees, debit -15 -6 -6 -4 -3 -2
經常轉移 Current transfers -14,475 -3,392 -3,461 -3,618 -3,822 -3,573
貸方 Credit 5,357 1,268 1,076 2,174 1,031 1,076
政府機構 General government 0 0 0 0 0 0
其他界別 Other sectors 5,357 1,268 1,076 2,174 1,031 1,076
借方 Debit -19,831 -4,660 -4,537 -5,792 -4,853 -4,649
政府機構 General government -1,342 -330 -353 -331 -329 -328
其他界別 Other sectors -18,489 -4,330 -4,184 -5,460 -4,524 -4,321
註釋: Notes: (1)
(2)
§
資料來源: 政府統計處國際收支平衡統計科(一) Source: Balance of Payments Branch (1),(查詢電話:2116 8677) Census and Statistics Department
(Enquiry Telephone No.: 2116 8677)
§ 香港旅遊發展局現正進行檢討訪港旅客帶來之收益及每人平均消費的數據,並編製新的數字。當香港旅遊發展局於今年稍後發布新的數字後,服務輸出中旅遊服務的數字亦會作相應的修訂。
The Hong Kong Tourism Board (HKTB) is now reviewing the receiptsfrom visitors and per capita spending figures and is now compiling newdata. The figures of exports of travel services are subject to revision lateron when new information becomes available from HKTB later in theyear.
In accordance with the Balance of Payments accounting rules, a positivevalue for the balance figure in the current account represents a surpluswhereas a negative value represents a deficit.
In a Balance of Payments account, every external transaction ispresented by two entries, a credit and a debit. In the current account,exports of goods and services, income inflows and transfers from abroadare all credit entries, while imports of goods and services, incomeoutflows and transfers to abroad are debit entries.
(1)
(2)
根據國際收支平衡表的會計常規,經常帳差額的正數顯示盈餘而負數則顯示赤字。
在國際收支平衡表內,每項對外交易均由兩項帳目(貸方和借方)作記錄。在經常帳中,貨物及服務的輸出、從外地流入的收益及轉移均屬貸方帳目,而借方帳目是指貨物及服務的輸入、收益流出以及往外地的轉移。
香港統計月刊 二零零三年六月 216 Hong Kong Monthly Digest of Statistics June 2003

12.11 國際收支平衡表分項:資本及金融帳Balance of Payments Sub-account Components:Capital and Financial Account
百萬港元
HK$ million
2001 2002 2002 2002 2002
第四季 第一季@ 第二季@ 第三季@ 第四季@
標準組成部分 Standard Components 2002@ 4th Qtr 1st Qtr@ 2nd Qtr@ 3rd Qtr@ 4th Qtr@
資本及金融帳(1) Capital and Financial Account(1) -191,417 -24,810 -46,809 -30,363 -57,056 -57,189非儲備性質的資本及 Capital and financial non-reserve -209,958 -32,842 -42,948 -33,483 -64,756 -68,771
金融資產(變動淨值)(2) assets (net change)(2)
資本帳 Capital Account -15,725 -1,590 -2,998 -7,586 -1,912 -3,229資本轉移 Capital transfers -15,725 -1,590 -2,998 -7,586 -1,912 -3,229
政府機構 General government 0 0 0 0 0 0其他界別 Other sectors -15,725 -1,590 -2,998 -7,586 -1,912 -3,229
非生產及非金融資產 Non-produced and non-financial assets *** *** *** *** *** ***
金融帳 Financial Account -175,692 -23,220 -43,811 -22,777 -55,144 -53,960非儲備性質的金融 Financial non-reserve assets -194,233 -31,252 -39,950 -25,897 -62,844 -65,542
資產(變動淨值)(2) (net change)(2)
直接投資 Direct investment -31,007 -5,928 -10,139 15,254 -32,735 -3,387在外地的直接投資 Direct investment abroad -137,993 -22,711 -40,923 -29,503 -62,429 -5,138股本資本 Equity capital -79,976 150 -5,840 -9,149 -54,592 -10,394對有聯繫企業的申索 Claims on affiliated enterprises -79,976 150 -5,840 -9,149 -54,592 -10,394對有聯繫企業的負債 Liabilities to affiliated enterprises *** *** *** *** *** ***
再投資收益 Reinvested earnings -46,651 -15,478 -28,193 -27,474 1,899 7,117其他資本 Other capital -11,366 -7,383 -6,890 7,121 -9,735 -1,862對有聯繫企業的申索 Claims on affiliated enterprises 938 1,382 -5,845 8,721 -8,771 6,832對有聯繫企業的負債 Liabilities to affiliated enterprises -12,304 -8,765 -1,045 -1,601 -964 -8,694
在香港的直接投資 Direct investment in HK 106,986 16,783 30,784 44,757 29,694 1,751股本資本 Equity capital 24,192 38,174 7,817 7,936 4,782 3,657對直接投資者的申索 Claims on direct investors *** *** *** *** *** ***對直接投資者的負債 Liabilities to direct investors 24,192 38,174 7,817 7,936 4,782 3,657
再投資收益 Reinvested earnings 145,740 -15,148 36,674 31,156 47,505 30,405其他資本 Other capital -62,945 -6,243 -13,707 5,665 -22,593 -32,311對直接投資者的申索 Claims on direct investors -3,043 -797 5,109 861 -4,590 -4,424對直接投資者的負債 Liabilities to direct investors -59,902 -5,446 -18,816 4,804 -18,003 -27,887
有價證券投資 Portfolio investment -290,749 -92,904 7,056 -117,765 -82,478 -97,561資產 Assets -283,684 -117,299 -13,435 -126,842 -60,200 -83,208股本證券 Equity securities -120,157 -46,509 -22,373 -41,229 -43,178 -13,376銀行 Banks -154 85 -72 -65 -17 ***其他界別 Other sectors -120,003 -46,594 -22,301 -41,165 -43,161 -13,376
債務證券 Debt securities -163,527 -70,790 8,938 -85,612 -17,022 -69,832中長期債券 Bonds and notes -171,793 -31,475 -18,467 -58,032 -28,505 -66,789銀行 Banks -158,628 -479 -27,286 -65,720 -22,998 -42,624其他界別 Other sectors -13,165 -30,996 8,819 7,688 -5,507 -24,165
貨幣市場工具 Money market instruments 8,266 -39,315 27,405 -27,581 11,484 -3,043銀行 Banks 6,686 -19,603 24,887 -28,773 13,638 -3,067其他界別 Other sectors 1,580 -19,712 2,518 1,192 -2,155 24
負債 Liabilities -7,065 24,395 20,491 9,076 -22,279 -14,353股本證券 Equity securities 13,577 32,056 20,841 1,228 -10,117 1,626銀行 Banks 3,873 -1,752 2,450 474 1,251 -303其他界別 Other sectors 9,704 33,808 18,390 754 -11,368 1,928
債務證券 Debt securities -20,642 -7,661 -350 7,848 -12,161 -15,979中長期債券 Bonds and notes -1,865 -8,436 -2,324 7,829 -4,186 -3,184銀行 Banks -2,286 -51 -1,661 -397 -98 -130其他界別 Other sectors 421 -8,386 -663 8,226 -4,088 -3,054
貨幣市場工具 Money market instruments -18,776 776 1,974 19 -7,975 -12,795銀行 Banks -424 370 -509 386 -1,065 763其他界別 Other sectors -18,352 405 2,484 -367 -6,911 -13,558
香港統計月刊 二零零三年六月 217 Hong Kong Monthly Digest of Statistics June 2003

12.11 (續) 國際收支平衡表分項:資本及金融帳(Cont'd.) Balance of Payments Sub-account Components:
Capital and Financial Account百萬港元
HK$ million
2001 2002 2002 2002 2002
第四季 第一季@ 第二季@ 第三季@ 第四季@
標準組成部分 Standard Components 2002@ 4th Qtr 1st Qtr@ 2nd Qtr@ 3rd Qtr@ 4th Qtr@
金融衍生工具 Financial derivatives 10,616 8,642 12,316 6,054 -5,706 -2,048資產 Assets 107,530 21,798 42,239 23,266 15,343 26,683銀行 Banks 101,682 16,775 41,692 22,816 13,051 24,123其他界別 Other sectors 5,848 5,023 547 451 2,291 2,559
負債 Liabilities -96,914 -13,156 -29,923 -17,212 -21,049 -28,731銀行 Banks -89,455 -11,419 -29,638 -13,497 -19,270 -27,050其他界別 Other sectors -7,459 -1,737 -285 -3,715 -1,779 -1,681
其他投資 Other investment 116,906 58,938 -49,183 70,560 58,075 37,454資產 Assets 324,054 159,718 96,784 50,015 126,936 50,318貿易信貸 Trade credits -22,427 13,033 -5,107 -4,412 -8,588 -4,320貸款 Loans 12,426 21,715 24,050 -61,368 26,845 22,899銀行 Banks -14,942 27,059 22,020 -34,725 4,756 -6,994其他界別 Other sectors 27,368 -5,343 2,030 -26,643 22,088 29,892
貨幣和存款 Currency and deposits 352,317 120,321 102,051 118,633 105,179 26,454銀行 Banks 320,413 116,319 97,676 89,617 118,941 14,179其他界別 Other sectors 31,904 4,002 4,375 29,015 -13,762 12,275
其他資產 Other assets -18,262 4,649 -24,210 -2,838 3,500 5,286銀行 Banks 878 1,554 676 -3,798 3,374 627其他界別 Other sectors -19,139 3,095 -24,885 961 126 4,659
負債 Liabilities -207,147 -100,780 -145,967 20,545 -68,862 -12,863貿易信貸 Trade credits 429 -760 -2,645 736 1,658 680貸款 Loans -109,825 5,697 -59,634 9,567 -21,063 -38,695銀行 Banks -43,601 -9,077 -46,068 928 376 1,162其他界別 Other sectors -66,224 14,774 -13,566 8,639 -21,439 -39,858
貨幣和存款 Currency and deposits -103,082 -99,106 -85,964 10,692 -51,120 23,310銀行 Banks -103,542 -99,133 -86,236 10,291 -51,763 24,166其他界別 Other sectors 461 27 272 402 643 -856
其他負債 Other liabilities 5,330 -6,612 2,276 -451 1,663 1,842銀行 Banks 459 -1,561 2,139 -711 -366 -603其他界別 Other sectors 4,871 -5,051 137 259 2,029 2,445
儲備資產(變動淨值)(2) Reserve assets (net change)(2) 18,541 8,032 -3,861 3,120 7,700 11,582
註釋: Notes: (1)
(2)
*** 數據不顯著(少於一千萬港元)。 *** Value is relatively insignificant (less than HK$10 million).
資料來源: 政府統計處國際收支平衡統計科(一) Source: Balance of Payments Branch (1),(查詢電話:2116 8677) Census and Statistics Department
(Enquiry Telephone No.: 2116 8677)
In accordance with the Balance of Payments accounting rules, a positivevalue for the balance figure in the current account represents a surpluswhereas a negative value represents a deficit. For the capital andfinancial account, a positive value indicates a net capital and financialinflow and a negative value indicates a net outflow. As increases inexternal assets are debit entries and decreases are credit entries, anegative value for net change in reserve assets represents a net increaseand a positive value represents a net decrease.
The estimates on net change in reserve and non-reserve assets under theBalance of Payments framework are transaction figures. Effects fromvaluation changes (including price changes and exchange rate changes)and reclassifications are excluded.
(1)
(2)
根據國際收支平衡表的會計常規,經常帳差額的正數顯示盈餘而負數則顯示赤字。在資本及金融帳方面,正數顯示淨資金流入而負數則顯示淨資金流出。由於對外資產的增加是屬於借方帳目而減少則屬貸方帳目,因此負數的儲備資產變動淨值顯示儲備資產的增加,而正數則顯示減少。
在國際收支平衡架構下儲備及非儲備資產變動淨值的估計是指交易數字。因計價方式改變(包括價格變動及匯率變動)及分類重組所導致的影響並不包括在內。
香港統計月刊 二零零三年六月 218 Hong Kong Monthly Digest of Statistics June 2003

12.12 對外債務統計數字 (期末頭寸)External Debt Statistics (position as at end of period)
百萬港元
HK$ million
2002 2002 2002 2002
第一季@ 第二季@ 第三季@ 第四季@
對外債務頭寸總額 Gross External Debt Position 2002@ 1st Qtr@ 2nd Qtr@ 3rd Qtr@ 4th Qtr@
政府機構 General government 0 0 0 0 0短期 Short-term 0 0 0 0 0貨幣市場工具 Money market instruments 0 0 0 0 0貸款 Loans 0 0 0 0 0貿易信貸 Trade credits 0 0 0 0 0其他債務負債 Other debt liabilities 0 0 0 0 0
長期 Long-term 0 0 0 0 0中長期債券 Bonds and notes 0 0 0 0 0貸款 Loans 0 0 0 0 0貿易信貸 Trade credits 0 0 0 0 0其他債務負債 Other debt liabilities 0 0 0 0 0
金融當局 Monetary authority 1,654 28,917 17,161 25,858 1,654短期 Short-term 1,654 28,464 16,889 25,858 1,654貨幣市場工具 Money market instruments *** 630 *** *** ***貸款 Loans 1,552 27,772 16,829 25,766 1,552貨幣和存款 Currency and deposits 0 0 0 0 0其他債務負債 Other debt liabilities 102 62 61 92 102
長期 Long-term *** 453 272 *** ***中長期債券 Bonds and notes *** 453 272 *** ***貸款 Loans 0 0 0 0 0其他債務負債 Other debt liabilities 0 0 0 0 0
銀行 Banks 1,741,863 1,719,035 1,761,461 1,706,839 1,741,863短期 Short-term 1,694,625 1,675,031 1,716,105 1,659,275 1,694,625貨幣市場工具 Money market instruments 24,576 23,429 24,985 24,019 24,576貸款 Loans 38,863 43,823 46,373 42,221 38,863貨幣和存款 Currency and deposits 1,627,560 1,604,943 1,641,155 1,589,586 1,627,560其他債務負債 Other debt liabilities 3,626 2,836 3,592 3,449 3,626
長期 Long-term 47,238 44,004 45,356 47,564 47,238中長期債券 Bonds and notes 33,996 27,732 32,601 34,567 33,996貸款 Loans 11,894 12,713 10,799 11,426 11,894其他債務負債 Other debt liabilities 1,348 3,559 1,956 1,571 1,348
其他界別 Other sectors 214,887 238,014 271,384 242,368 214,887短期 Short-term 69,009 78,002 115,885 82,929 69,009貨幣市場工具 Money market instruments 5,152 24,780 26,203 18,202 5,152貸款 Loans 21,133 27,123 52,948 25,878 21,133貨幣和存款 Currency and deposits 918 521 1,173 1,705 918貿易信貸 Trade credits 29,876 15,762 24,854 26,952 29,876其他債務負債 Other debt liabilities 11,930 9,817 10,706 10,192 11,930
長期 Long-term 145,878 160,012 155,499 159,440 145,878中長期債券 Bonds and notes 45,385 47,994 40,228 48,234 45,385貸款 Loans 87,749 101,155 104,032 98,861 87,749貿易信貸 Trade credits 612 602 663 850 612其他債務負債 Other debt liabilities 12,131 10,261 10,576 11,495 12,131
直接投資:公司間借貸 Direct investment: inter-company lending 781,186 821,898 825,295 822,153 781,186對有聯繫企業的債務負債 Debt liabilities to affiliated enterprises 233,734 231,078 233,125 242,645 233,734對直接投資者的債務負債 Debt liabilities to direct investors 547,452 590,819 592,170 579,508 547,452
對外債務負債總額 Gross external debt 2,739,590 2,807,864 2,875,301 2,797,219 2,739,590
註釋: *** 數據不顯著(少於一千萬港元)。 Note: *** Value is relatively insignificant (less than HK$10 million).
資料來源: 政府統計處國際收支平衡統計科(一) Source: Balance of Payments Branch (1),(查詢電話:2116 8694) Census and Statistics Department
(Enquiry Telephone No.: 2116 8694)
香港統計月刊 二零零三年六月 219 Hong Kong Monthly Digest of Statistics June 2003


香港統計月刊 二零零三年六月 Hong Kong Monthly Digest of Statistics June 2003221
雜項統計
Miscellaneous Statistics
概念及方法 Concepts and Methods
消防統計數字指有關行動及防火工作。 The fire services statistics refer to operational andpreventive work.
供水的數據僅指食水的供應,不包括沖廁用
的鹹水。現時十七個水塘的最高儲存量為五
億八千六百零五萬立方米。由於計算範圍略
有不同,自廣東省輸入的水量數字與刊載於
香港貿易統計的數字有輕微差異。
Statistics on water supplies refer to fresh watersupply only. Salt water for flushing is excluded. Themaximum capacity of the existing seventeen storagereservoirs is 586.05 million cubic metres. Figures forwater imported from Guangdong are slightly differentfrom those published in Hong Kong Trade Statisticsbecause of slight difference in coverage.
氣象觀測的統計數字是根據香港天文台、京
士柏和橫瀾島的天氣記錄匯編而成。各氣象
要素的各月份平均值乃根據一九六一年至一
九九零年期間錄得的數據編製。根據世界氣
象組織的定義,標準氣候平均值為一九零一
年一月一日至一九三零年十二月三十一日、
一九三一年一月一日至一九六零年十二月三
十一日、一九六一年一月一日至一九九零年
十二月三十一日、一九九一年一月一日至二
零二零年十二月三十一日等指定三十年期的
氣象數據平均值。
Statistics of meteorological observations are takenfrom the records of the Hong Kong Observatory,King's Park and Waglan Island stations. The monthlynormals for the various meteorological elements arebased on data recorded during the period 1961-1990.According to the World Meteorological Organization(WMO), climatological standard normals are definedas averages of climatological data computed for thefollowing consecutive periods of 30 years: 1 January1901 to 31 December 1930, 1 January 1931 to31 December 1960, 1 January 1961 to 31 December1990, 1 January 1991 to 31 December 2020 etc.
其他有關刊物 Further References
每月天氣摘要,香港天文台編製 Monthly Weather Summary, published by the HongKong Observatory
香港地面觀測年報,香港天文台編製 Surface Observations in Hong Kong, published bythe Hong Kong Observatory

13.1 消防服務Fire Services(甲) 火警、特別服務、救護召喚及人數統計
(A) Fire, Special Services, Ambulance Calls and Persons Involved
火警召喚 總計
Fire calls Totalcalls
火警召喚
總計
大火 Total 一般特別
年 月 Major fire 服務召喚
Year Month fire calls General2000 25 44 789 9 598 65 3682001 21 44 564 9 951 65 8212002 9 41 204 8 925 61 6172002 1 - 3 1 11 534 2 125 16 354
4 - 6 1 10 316 2 203 15 386 7 - 9 2 9 879 2 366 15 27910 - 12 5 9 475 2 231 14 598
2003 1 - 3 5 9 206 2 003 13 900
涉及人數
Persons involved
特別服務 特別服務
年 月 火警 Special 火警 SpecialYear Month Fire services Fire services 2000 618 2 201 5 404 23 9582001 468 1 847 3 881 24 4902002 515 2 076 3 422 21 4122002 1 - 3 128 527 892 5 010
4 - 6 103 414 461 5 133 7 - 9 112 546 968 5 90910 - 12 172 599 1 101 5 360
2003 1 - 3 129 539 900 4 548
死亡Fatalities
9 149
571
7 186
125 047 12 388
受傷 Injuries
14 398
獲救 Rescues
126 106
Emergency
505 980
救護車召喚 Ambulance calls
servicescalls
5 400 5 123
10 981 21 257
required/ambulance case
20 579 11 306
7 999
20
1 877
特別服務Special
8 000
services 火警
Fire
2 369
特別服務召喚Special services calls
False alarm/service not
特別服務
召喚總計
Totalspecial
虛報/毋須服務/
救護車個案
Removal 459 658 484 501 56 475
13 585
虛報/誤鳴及
受控下之燃燒
False/unwantedalarm and
20 413
5 070 4 820
緊急召喚
2 867
一般
火警
General control burning 10 468
9 475 31 720
34 296 10 542 34 001
11 4882 695
2 691 4 694
3 034 2 892
14 315
2 316
60 502 32 575
7 201 128 593
載送召喚
54 686
126 234 2 192
2 913 8 620
7 1012 498 6 703
25 728
7 168 128 036 12 792
222香港統計月刊 二零零三年六月 Hong Kong Monthly Digest of Statistics June 2003

13.1 (續) 消防服務(Cont'd.) Fire Services
(乙) 防火統計數字
(B) Fire Prevention Statistics
防火視察
Fire inspections
年 月 投訴 學校
Year Month Complaints Schools
2000 79 072 9 0952001 92 572 7 1222002 123 683 5 6872002 1 - 3 17 836 1 541
4 - 6 20 590 1 549 7 - 9 33 572 1 324
10 - 12 51 685 1 2732003 1 - 3 42 171 1 213
防火事務
Fire prevention
審核圖則 檢控個案
Plans finalised Prosecutions undertaken
年 月
Year Month
2000200120022002 1 - 3
4 - 6 (1)
7 - 910 - 12
2003 1 - 3
註釋 : (1) Note: (1)
資料來源: 消防處 Source : Fire Services Department(查詢電話:2733 7717) (Enquiry Telephone No.: 2733 7717)
goods, timber
消防裝置、
霓虹招牌等
Fire
危險品倉庫
及木圍
Dangerousinstallations,
公眾娛樂
neon signs,etc.
entertain-ment
場所
Places ofpublic
Full building/ New Ventilation
2 345 2 253
通風
系統
area surveys projects
1 709
14 164 15 006 12 009
3 936 3 463 2 238 2 372
食肆及
夜總會
Restau-rants
and nightclubs
雜項
Miscel-laneoussystems
通風
系統
Ventila-tionyards and
storage
視察整幢樓宇/
整個範圍 新建設
8 907 7 688 9 3021 849
2 279
systems
簽發牌照/
牌照續期
Licencesissued/
renewed notices issued
個案
數目
Cases
1 714 1 281
Fire hazardabatement
危險通知書
發出消除火警
1 449 6 5697 688
1 504
7 712
6 3451 5801 591
7 444
2 6462 528 1 1641 460
7 8066 193
1 391 1 643 1 707
28 775 28 712 27 323
6 755
6 519 4 904 5 013 1 119
6 682 6 457 6 382 1 528
1 688 522 462
85
2,498,7001,746,683
921,665226,600
(元)
Finesimposed ($)
50 186 68 73560 109
罰款額
1 339
360 328 388 340
1 0221 260
437 441
169 905 195 744
36 14440 679
總計
Total
160 926
174,565249,400271,100364,600
104 133 140 141
9 547 20 259 10 812
3 1511 2592 572 3 8303 016
1 3491 173
4 696 4 720 4 7341 190
514 477
9 715 9 551
10 374 2 383
1 929 2 142 1 901
473
在二零零零年七月十七日,消防處成立一支專責「樓宇消防安全巡查隊」作為中期措施,以提升私人樓宇的消防安全標準。巡查隊在成功履行有關預期職務後,在二零零二年二月二十八日解散。
On 17.7.2000, a dedicated inspection force known asthe 'Building Fire Safety Inspection Force' wasestablished as an interim measure for stepping up firesafety inspection in private buildings. This InspectionForce was eventually disbanded upon accomplishmentof its duties on 28.2.2002.
3 435 13 015
3 303 2 227
2 477 2 844 2 670 2 307
223香港統計月刊 二零零三年六月 Hong Kong Monthly Digest of Statistics June 2003

13.2 食水供應Water Supplies
百萬立方米
Million cubic metres
期初存水量 水塘集水量 耗水量
Storage at Natural Consumption 年 月 beginning of yield in 總計 每日平均數
Year Month period reservoirs Total Daily mean
2000 501.05 260.76 706.36 924.13 2.522001 480.36 301.46 728.63 939.55 2.572002 444.37 252.40 743.84 948.65 2.602002 3 420.31 2.69 71.25 76.98 2.48
4 417.22 - 1.86 65.98 76.47 2.555 404.88 24.36 68.22 80.90 2.616 416.56 21.99 66.00 79.35 2.647 425.19 36.14 68.22 82.43 2.668 447.11 87.57 68.21 82.58 2.669 516.37 64.39 66.00 80.74 2.69
10 542.29 14.47 68.19 82.70 2.6711 533.06 4.13 63.80 78.98 2.6312 521.93 0.46 + 80.24 2.59
2003 1 442.18 - 0.63 75.39 81.70 2.642 412.04 0.25 68.11 70.98 2.543 409.40 2.04 68.20 84.24 2.724 395.45 3.76 72.90 83.08 2.775 389.01 44.11 73.04 87.19 2.81
註釋: + 工程維修保養期間,廣東省暫停供水。 Note : + The supply from Guangdong was shutdown for maintenance.
資料來源: 水務署 Source : Water Supplies Department(查詢電話:2829 4463) (Enquiry Telephone No.: 2829 4463)
廣東省供水量
Importsfrom
Guangdong
224香港統計月刊 二零零三年六月 Hong Kong Monthly Digest of Statistics June 2003

13.3 氣象觀測
Meteorological Observations
氣象觀測站
Meteorological observation station 香港天文台 京士柏 橫瀾島
Hong Kong Observatory King's Park Waglan Island
氣溫
Air temperature平均
平均 平均 平均 相對 總日照 總 盛行 平均
平均 最高 最低 露點 濕度 時間 蒸發量 風向 風速
氣壓 Mean 每月 Mean Mean Mean 總雨量 Total Total Prevail- Mean年 Mean maxi- 平均 mini- dew relative Total bright evapo- ing wind wind
Year pressure mum Mean mum point humidity rainfall sunshine ration direction speed(百帕斯卡) (攝氏 (攝氏 (攝氏 (攝氏 (百分比) (毫米) (小時) (毫米) (度) (公里/
hectopascals) 度) 度) 度) 度) (%) (mm) (hours) (mm) (degrees) 小時)
(℃) (℃) (℃) (℃) (km/h)
2000 1 011.9 25.5 23.3 21.5 19.1 78 2 752.3 1 864.9 1 285.3 070 24.1
2001 1 012.2 25.8 23.6 21.8 19.3 78 3 091.8 1 784.8 1 240.7 070 22.3
2002 1 012.9 26.0 23.9 22.1 19.9 79 2 490.0 1 869.8 1 211.7 070 21.3
2002 1 015.6 23.5 21.5 20.0 17.8 81 238.7 104.4 85.5 070 19.51 013.0 26.9 24.6 22.8 21.2 82 12.4 176.8 100.7 080 18.41 009.0 29.3 27.0 25.2 23.4 81 275.6 160.2 126.0 090 18.61 006.4 31.0 28.8 27.0 24.9 80 237.6 181.2 132.7 210 22.2
1 002.8 31.3 28.9 26.7 25.4 82 320.8 165.5 133.2 220 17.91 005.1 30.7 28.4 26.6 24.8 81 365.9 189.3 129.9 230 22.41 009.5 29.1 27.2 25.5 23.3 80 723.0 146.1 113.9 090 21.51 014.0 26.8 25.2 23.7 20.7 77 199.0 136.8 98.5 080 23.41 018.1 23.4 21.5 19.7 16.0 72 23.3 176.0 94.2 060 24.71 019.8 20.2 18.2 16.4 14.7 80 64.1 125.8 61.2 010 24.3
2003 1 021.2 18.3 16.1 14.2 10.6 71 21.7 191.8 72.5 060 24.41 018.5 20.7 18.5 16.9 15.2 82 15.1 105.5 62.1 050 21.31 017.0 21.0 19.0 17.3 15.9 82 38.6 88.8 74.0 050 22.71 012.2 26.1 23.9 22.4 20.8 83 84.5 122.9 94.9 070 22.31 008.5 29.0 26.9 25.4 23.3 81 249.0 150.0 117.9 080 19.9
五月平均值(1)
Normals for 1 009.1 28.7 25.9 23.9 22.6 83 316.7 153.8 137.7 090 19.2May(1)
註釋: (1) 一九六一年至一九九零年的標準氣候平均值。 Note : (1) Climatological standard normals for 1961-1990.
資料來源: 香港天文台 Source : Hong Kong Observatory(查詢電話:2926 8444) (Enquiry Telephone No.: 2926 8444)
月 Month
平均
雲量Mean
amountof cloud(百分比)
(%)
34
1112
5
10
6
78
5
9
21
43
69
69
70
77 73 77 77
79 68 71 71 56 76
50 73 78 79 77
74
225香港統計月刊 二零零三年六月 Hong Kong Monthly Digest of Statistics June 2003


香港統計月刊 二零零三年六月 Hong Kong Monthly Digest of Statistics June 2003FA1
二零零二年按區議會分區劃分的香港人口概況剖析
A Profile of Hong Kong PopulationAnalysed by District Council District, 2002
政府統計處根據綜合住戶統計調查獲取的數據,每年編製按區議會分區劃分的有
關人口及其社會經濟特徵的統計數字。本文旨在分析二零零二年年中按區議會分
區劃分的香港人口概況。
The Census and Statistics Department annually compiles statistics on thedemographic and socio-economic characteristics of the population at the DistrictCouncil district level based on data collected from the General HouseholdSurvey. This article provides an analysis on the profile of the population ofHong Kong at the District Council district level in mid-2002.
如對本文有任何查詢,請致電政府統計處綜合住戶統計調查組(一) (電話:2887 5130)。
If you have any enquiries on this article, please call General Household Survey Section (1), Census and Statistics Department (Tel. : 2887 5130).

香港統計月刊 二零零三年六月 Hong Kong Monthly Digest of Statistics June 2003FA2
二零零二年按區議會分區劃分的香港人口概況剖析
A Profile of Hong Kong PopulationAnalysed by District Council District, 2002
1. 引言 1. Introduction
1.1 政府統計處定期編製每年年中及年底的
全港人口估計數字。為顯示人口的地區分布情
況,政府統計處亦與一個跨部門的工作小組,
共同編製按區議會分區劃分的年中人口估計數
字。
1.1 The Census and Statistics Department (C&SD)compiles mid-year and end-year territorial populationestimates regularly. To give an indication of thegeographical distribution of the population,breakdown of the mid-year population estimate byDistrict Council (DC) district is also compiled jointlyby the C&SD and an inter-departmental workinggroup.
1.2 區議會分區人口估計數字,基本上是根
據每區屋宇單位數量以及每個屋宇單位的平均
人數編製而成。前者是基於政府統計處所保存
的屋宇單位清單和各政府部門有關屋宇單位興
建及拆卸的最新資料,而後者是基於綜合住戶
統計調查的結果、最新人口普查/中期人口統計
結果,以及行政記錄而編製。由於綜合住戶統
計調查的統計範圍並不包括一些公共機構/社
團院舍的住院人士及水上人口,故不能從該統
計調查的結果得知這些人口組別的人數及其按
區分布。除水上人口外,上述人口組別的人數
及按區分布,乃基於行政記錄而估計。水上人
口的數目,則基於過往趨勢而估計。
1.2 The population estimate of each DC district isbasically compiled by taking into account the numberof quarters (based on the frame of quarters maintainedby C&SD and up-to-date information from variousgovernment departments on new completion anddemolition) and the average number of persons perunit of quarters (based on the results of the GeneralHousehold Survey (GHS) and the latest PopulationCensus/By-census as well as administrative records)in each district. As inmates of some institutions andthe marine population are not covered in the GHS, thesize of these groups of the population and theirdistribution by district cannot be estimated from theGHS results. Except for marine population, theabove groups of the population and their distributionby district are estimated from administrative records.The marine population is estimated based on pasttrends.
1.3 至於有關各區議會分區內的人口及社會
經濟特徵的統計數字,則根據綜合住戶統計調
查所搜集的資料編製。這項統計調查涵蓋陸上
非住院人口,佔全港總人口的 99% 。
1.3 Statistics on the demographic and socio-economic characteristics of the population in each DCdistrict are compiled based on the informationcollected in the GHS. The survey covers the land-based non-institutional population which constitutesabout 99% of the total population of Hong Kong.
1.4 本文載列近數年按區議會分區劃分的全
港人口估計數字,及就二零零二年年中按區議
會分區劃分的陸上非住院人口的選定特徵作出
分析,從而令讀者對按區議會分區劃分的香港
人口的概況有更清楚的了解。
1.4 This article presents the territorial populationestimates by DC district in recent years, and alsoprovides an analysis on selected characteristics of theland-based non-institutional population in mid-2002by DC district. It aims to give a better understandingon the profile of the population of Hong Kong at theDC district level.

香港統計月刊 二零零三年六月 Hong Kong Monthly Digest of Statistics June 2003FA3
1.5 根據現時用以編製人口數字的「居住人
口」方法,某年年中的臨時人口估計數字於該
年的八月公布,而於翌年的二月作出修訂。本
文所載列的統計數字,是以經修訂後的二零零
二年年中按區議會分區劃分的人口估計數字為
基礎,與二零零二年十二月出版的《2002 年按
區議會分區劃分的人口及住戶統計資料》報告
書內所載列的統計數字有輕微的差異(後者的
統計數字是以當時已公布的二零零二年年中按
區議會分區劃分的臨時人口估計數字為基
礎)。
1.5 Under the 'resident population' approachcurrently adopted for compiling population figures,the provisional mid-year population estimate of agiven year will be released in August of that year,which is subject to revision in February of thefollowing year. In this connection, the statisticscontained in this article, which are based on therevised mid-2002 population estimates by DC district,are slightly different from those included in the reportPopulation and Household Statistics Analysed byDistrict Council District 2002 published in December2002 (the latter statistics being based on theprovisional mid-2002 population estimates by DCdistrict available at that time).
2. 人口的地區分布情況 2. Geographical Distribution ofPopulation
2.1 按區議會分區劃分的二零零二年年中的
全港人口估計數字載列於表一。該些數字是根
據不同資料來源而編製(參閱第 1.2 段) ,其涵
蓋的人口範圍,較本文內根據綜合住戶統計調
查結果而編製的所有其他統計表(包括表二至
表四)的更為廣泛。前者涵蓋所有人口,而後
者則只涵蓋陸上非住院人口。然而,兩者的地
區分布情十分近似。
2.1 The mid-2002 territorial population estimatesby DC district are shown in Table 1. Theseestimates are based on data from various sources (seeparagraph 1.2) and refer to a wider populationcoverage than that of all other tables (Tables 2 to 4) inthis article, which are based on the GHS results.Specifically, the former cover the entire populationwhile the latter refer only to the land-based non-institutional population. Nevertheless, thegeographical distribution of the land-based non-institutional population is very close to that of theentire population.
2.2 在二零零二年年中香港的人口數目為
6 787 000,其中約 3 458 800 人(佔 51.0%)居於
新界,2 026 500 人(佔 29.9%)居於九龍,
1 296 500 人(佔 19.1%)則居於香港島。 (表一)
2.2 As at mid-2002, the total population amountedto 6 787 000. Of them, 3 458 800 (51.0%) wereliving in the New Territories, 2 026 500 (29.9%) inKowloon and 1 296 500 (19.1%) on Hong KongIsland. (Table 1)
2.3 在所有區議會分區中,沙田的人口最
多,佔全港總人口約 9.3%,其次是東區,佔全
港總人口約 9.0%。 (表一)
2.3 Sha Tin had the largest population among allDC districts, accommodating about 9.3% of the totalpopulation of Hong Kong. Eastern was the nextlargest district in terms of population, accommodatingabout 9.0% of the total population of Hong Kong.(Table 1)
2.4 在一九九六年至二零零二年期間,香港
人口由 6 435 500 增至 6 787 000,增幅約為
351 400 人 , 而 按 年 的 平 均 增 長 率 為
0.9%。 (表一)
2.4 Between 1996 and 2002, the population ofHong Kong increased from 6 435 500 to 6 787 000,by around 351 400 or at an average growth rate of0.9% per annum. (Table 1)

香港統計月刊 二零零三年六月 Hong Kong Monthly Digest of Statistics June 2003FA4
2.5 在一九九六年至二零零二年期間,各區
議會分區當中,以西貢及元朗的人口增長最
大,約分別增加 151 300 人及 148 500 人。
(表一)
2.5 Between 1996 and 2002, Sai Kung and YuenLong had the largest gain in population among the DCdistricts. The gain was around 151 300 and 148 500respectively. (Table 1)
表一@ 按區議會分區劃分的年中人口
Table 1@ Mid-year Population by District Council District數目(千人) No. (’000)
區議會分區 # District Council District # 1996 1997 1998 1999 2000 2001 2002
香港島 Hong Kong Island 1 387.6 1 391.4 1 370.2 1 371.6 1 348.4 1 326.9 1 296.5中西區 Central & Western 282.3 287.1 279.7 276.7 271.1 260.3 245.9灣仔 Wan Chai 191.8 191.0 193.2 191.8 185.1 165.4 156.5東區 Eastern 621.5 621.4 613.8 617.5 611.9 614.4 610.0南區 Southern 292.0 291.9 283.4 285.5 280.2 286.8 284.2
九龍 Kowloon 2 023.1 2 012.5 2 022.0 2 032.6 2 038.2 2 023.0 2 026.5油尖旺 Yau Tsim Mong 273.6 273.6 272.0 289.8 289.7 281.8 282.8深水 Sham Shui Po 376.4 372.0 364.4 364.8 363.9 351.1 360.2九龍城 Kowloon City 393.8 391.2 392.3 397.4 402.9 379.1 365.9黃大仙 Wong Tai Sin 396.7 399.3 413.5 413.7 424.8 446.3 448.3觀塘 Kwun Tong 582.6 576.4 579.8 566.9 557.0 564.8 569.4
新界 New Territories 2 997.9 3 073.1 3 141.3 3 192.8 3 271.2 3 369.3 3 458.8葵青 Kwai Tsing 473.0 470.2 453.1 454.4 461.9 479.6 494.7荃灣 Tsuen Wan 280.4 285.3 290.7 290.7 282.0 272.0 268.9屯門 Tuen Mun 470.3 475.6 477.9 480.1 471.7 493.6 502.7元朗 Yuen Long 356.0 383.1 395.4 401.4 440.4 459.5 504.6北區 North 253.7 265.6 273.8 272.5 287.9 298.8 290.5大埔 Tai Po 298.1 294.2 308.0 305.7 317.3 309.5 306.3沙田 Sha Tin 590.5 606.0 612.2 613.7 610.7 626.4 633.7西貢 Sai Kung 206.8 223.4 245.0 287.4 313.7 334.2 358.1離島 Islands 69.2 69.8 85.1 86.9 85.5 95.6 99.5
陸上總計 Land total 6 408.5 6 477.1 6 533.4 6 596.9 6 657.8 6 719.2 6 781.8
加:水上人口 plus: Marine population 9.9 8.9 8.0 7.1 6.4 5.7 5.1
加:越南難民^ plus: Vietnamese migrants^ 17.1 3.3 2.3 2.4 0.7 - -
總人口 Total Population 6 435.5 6 489.3 6 543.7 6 606.5 6 665.0 6 724.9 6 787.0
註釋﹕@ 表一所載的人口估計數字,與載於本文其他統計表的相應數字有輕微差異。前者涵蓋所有人口,而後者則
只涵蓋陸上非住院人口。
# 區議會的英文名稱自二零零零年起由 'District Board' 改為 'District Council',而中文名稱則保持不變。
^ 自二零零一年起,沒有越南難民的獨立數字。
Notes: @ The population estimates in Table 1 are slightly different from those corresponding figures in other tables in thisarticle. The former cover the entire population while the latter refer only to the land-based non-institutionalpopulation.
# 'District Board' has been renamed as 'District Council' starting from 2000, while the Chinese name remainsunchanged.
^ Starting from 2001, separate figure for Vietnamese migrants is not available.

香港統計月刊 二零零三年六月 Hong Kong Monthly Digest of Statistics June 2003FA5
3. 有關按區議會分區劃分的人口特徵
的分析
3. Analysis on DemographicCharacteristics by DistrictCouncil District
3.1 下文載列的統計數字,基本上乃根據二
零零二年年中按區議會分區劃分的人口數字及
二零零二年五月至八月進行的綜合住戶統計調
查獲取的數據而編製。由於二零零二年年中為
上述期間的中間點,故這些統計數字可視為反
映有關二零零二年年中時的數字。此外,它們
只涵蓋陸上非住院人口。
3.1 The statistics presented in the following partsare based primarily on the mid-2002 populationfigures by DC district, together with data collectedfrom the GHS in May to August of 2002, which arecentred at mid-2002. Therefore, these statistics maybe regarded as referring to the position as at mid-2002. Besides, they cover only the land-based non-institutional population.
性別 Sex
3.2 性別比率可用作量度人口的性別結構。
性別比率是指在人口中相對每一千名女性的男
性數目。在二零零二年年中,男性數目較女性
略少(整體性別比率為每千名女性對 945 名男
性)。 (表二)
3.2 The sex composition of the population can bemeasured by the sex ratio, which is defined as thenumber of males per 1 000 females in the population.In mid-2002, men were slightly out-numbered bywomen (the overall sex ratio being 945 males per1 000 females). (Table 2)
3.3 在各區議會分區中,以中西區的人口的
性別比率為最低(每千名女性對 856 名男性),其次為灣仔(每千名女性對 869 名男性)。事實
上,香港島的人口的性別比率較九龍及新界的
相應比率為低。比較之下,葵青的人口的性別
比率最高(每千名女性對 1 015 名男性),其次是
屯門(每千名女性對 993 名男性)及油尖旺(每
千名女性對 980 名男性)。 (表二)
3.3 Among the DC districts, the sex ratio for thepopulation in Central & Western was the lowest(being 856 males per 1 000 females), followed by thatin Wan Chai (being 869 males per 1 000 females).In fact, the sex ratio for the population on Hong KongIsland was lower than that in Kowloon and the NewTerritories. In comparison, the sex ratio was thehighest in Kwai Tsing (being 1 015 males per 1 000females), followed by Tuen Mun (being 993 malesper 1 000 females) and Yau Tsim Mong (being 980males per 1 000 females). (Table 2)

香港統計月刊 二零零三年六月 Hong Kong Monthly Digest of Statistics June 2003FA6
表二 二零零二年年中按區議會分區及性別劃分的陸上非住院人口數目Table 2 Land-based Non-institutional Population by District Council District and Sex, Mid-2002
性別
Sex區議會分區 男 女 總計 性別比率
District Council District Male Female Total Sex Ratio
香港島 數目 No. 611 800 674 700 1 286 400 907Hong Kong Island 百分比 % 47.6 52.4 100.0
中西區 數目 No. 113 000 132 100 245 100 856Central & Western 百分比 % 46.1 53.9 100.0
灣仔 數目 No. 72 500 83 400 155 900 869Wan Chai 百分比 % 46.5 53.5 100.0
東區 數目 No. 291 200 316 900 608 100 919Eastern 百分比 % 47.9 52.1 100.0
南區 數目 No. 135 100 142 300 277 400 949Southern 百分比 % 48.7 51.3 100.0
九龍 數目 No. 983 400 1 033 900 2 017 300 951Kowloon 百分比 % 48.7 51.3 100.0
油尖旺 數目 No. 140 000 142 900 282 800 980Yau Tsim Mong 百分比 % 49.5 50.5 100.0
深水 數目 No. 175 100 181 600 356 700 964Sham Shui Po 百分比 % 49.1 50.9 100.0
九龍城 數目 No. 171 400 193 800 365 200 885Kowloon City 百分比 % 46.9 53.1 100.0
黃大仙 數目 No. 219 800 225 800 445 500 973Wong Tai Sin 百分比 % 49.3 50.7 100.0
觀塘 數目 No. 277 100 289 900 566 900 956Kwun Tong 百分比 % 48.9 51.1 100.0
新界 數目 No. 1 679 600 1 755 400 3 435 000 957New Territories 百分比 % 48.9 51.1 100.0
葵青 數目 No. 247 700 244 000 491 700 1 015Kwai Tsing 百分比 % 50.4 49.6 100.0
荃灣 數目 No. 128 500 139 700 268 200 919Tsuen Wan 百分比 % 47.9 52.1 100.0
屯門 數目 No. 248 500 250 300 498 800 993Tuen Mun 百分比 % 49.8 50.2 100.0

香港統計月刊 二零零三年六月 Hong Kong Monthly Digest of Statistics June 2003FA7
表二(續) 二零零二年年中按區議會分區及性別劃分的陸上非住院人口數目
Table 2 (Cont’d) Land-based Non-institutional Population by District CouncilDistrict and Sex, Mid-2002
性別
Sex區議會分區 男 女 總計 性別比率
District Council District Male Female Total Sex Ratio
元朗 數目 No. 246 800 255 800 502 600 965Yuen Long 百分比 % 49.1 50.9 100.0
北區 數目 No. 137 800 150 600 288 400 915North 百分比 % 47.8 52.2 100.0
大埔 數目 No. 149 600 155 300 304 800 963Tai Po 百分比 % 49.1 50.9 100.0
沙田 數目 No. 302 600 327 700 630 300 924Sha Tin 百分比 % 48.0 52.0 100.0
西貢 數目 No. 172 500 182 600 355 100 945Sai Kung 百分比 % 48.6 51.4 100.0
離島 數目 No. 45 600 49 400 95 000 923Islands 百分比 % 48.0 52.0 100.0
合計 數目 No. 3 274 700 3 463 900 6 738 700 945Overall 百分比 % 48.6 51.4 100.0
年齡 Age
3.4 在各區議會分區中,二十歲以下的人士
在人口中所佔的比例以元朗為最大 ( 佔29.3%),其次為北區(佔 27.2%)、大埔及離島(各佔 26.0%)。這些分區均在新界。事實上,新界
的人口較香港島和九龍的年輕,新界的人口的
年齡中位數為 35 歲,而香港島和九龍的人口的
年齡中位數均為 38 歲。 (表三)
3.4 Among the DC districts, Yuen Long had thelargest proportion of persons aged below 20 (29.3%),followed by North (27.2%), Tai Po and Islands (both26.0%). These districts are all in the NewTerritories. In fact, the population in the NewTerritories were younger than that on Hong KongIsland and in Kowloon. The median age of thepopulation in the New Territories was 35, ascompared to 38 for both Hong Kong Island andKowloon. (Table 3)
3.5 比較之下,在各區的人口中六十歲及以
上的人士所佔的比例以黃大仙(19.7%)為最
大,其次是深水(19.2%)、觀塘(18.9%)及油尖
旺(18.5%)。 (表三)
3.5 In comparison, the proportion of persons aged60 and over was the largest in Wong Tai Sin (19.7%),followed by Sham Shui Po (19.2%), Kwun Tong(18.9%) and Yau Tsim Mong (18.5%). (Table 3)

香港統計月刊 二零零三年六月 Hong Kong Monthly Digest of Statistics June 2003FA8
表三 二零零二年年中按區議會分區及年齡劃分的陸上非住院人口數目Table 3 Land-based Non-institutional Population by District Council District
and Age, Mid-2002
年齡組別
區議會分區 Age GroupDistrict Council 總計 年齡中位數
District 0-19 20-39 40-59 ≥60 Total Median Age
香港島 數目 No. 253 800 427 000 401 400 204 300 1 286 400 38Hong Kong Island 百分比 % 19.7 33.2 31.2 15.9 100.0
中西區 數目 No. 45 500 84 400 75 700 39 500 245 100 38Central & Western 百分比 % 18.6 34.4 30.9 16.1 100.0
灣仔 數目 No. 25 100 55 400 51 700 23 700 155 900 39Wan Chai 百分比 % 16.1 35.5 33.2 15.2 100.0
東區 數目 No. 122 000 196 300 189 200 100 600 608 100 38Eastern 百分比 % 20.1 32.3 31.1 16.5 100.0
南區 數目 No. 61 100 90 900 84 900 40 400 277 400 37Southern 百分比 % 22.0 32.8 30.6 14.6 100.0
九龍 數目 No. 415 100 642 800 579 800 379 500 2 017 300 38Kowloon 百分比 % 20.6 31.9 28.7 18.8 100.0
油尖旺 數目 No. 51 400 93 800 85 400 52 300 282 800 39Yau Tsim Mong 百分比 % 18.2 33.2 30.2 18.5 100.0
深水 數目 No. 67 900 113 800 106 500 68 500 356 700 39Sham Shui Po 百分比 % 19.0 31.9 29.9 19.2 100.0
九龍城 數目 No. 71 700 123 700 106 300 63 400 365 200 38Kowloon City 百分比 % 19.6 33.9 29.1 17.4 100.0
黃大仙 數目 No. 97 600 134 700 125 400 88 000 445 500 39Wong Tai Sin 百分比 % 21.9 30.2 28.1 19.7 100.0
觀塘 數目 No. 126 600 176 900 156 200 107 300 566 900 38Kwun Tong 百分比 % 22.3 31.2 27.6 18.9 100.0
新界 數目 No. 861 600 1 141 200 1 020 000 412 200 3 435 000 35New Territories 百分比 % 25.1 33.2 29.7 12.0 100.0
葵青 數目 No. 105 500 163 900 139 300 83 000 491 700 37Kwai Tsing 百分比 % 21.5 33.3 28.3 16.9 100.0
荃灣 數目 No. 62 100 93 300 75 800 37 000 268 200 36Tsuen Wan 百分比 % 23.2 34.8 28.3 13.8 100.0
屯門 數目 No. 129 300 169 800 148 300 51 400 498 800 35Tuen Mun 百分比 % 25.9 34.0 29.7 10.3 100.0
元朗 數目 No. 147 200 164 000 139 400 52 000 502 600 34Yuen Long 百分比 % 29.3 32.6 27.7 10.4 100.0

香港統計月刊 二零零三年六月 Hong Kong Monthly Digest of Statistics June 2003FA9
表三(續) 二零零二年年中按區議會分區及年齡劃分的陸上非住院人口數目Table 3 (Cont’d) Land-based Non-institutional Population by District Council District
and Age, Mid-2002
年齡組別
區議會分區 Age GroupDistrict Council 總計 年齡中位數
District 0-19 20-39 40-59 ≥60 Total Median Age
北區 數目 No. 78 500 90 200 86 200 33 600 288 400 35North 百分比 % 27.2 31.3 29.9 11.7 100.0
大埔 數目 No. 79 400 93 000 99 900 32 500 304 800 36Tai Po 百分比 % 26.0 30.5 32.8 10.6 100.0
沙田 數目 No. 146 700 207 000 200 700 75 900 630 300 36Sha Tin 百分比 % 23.3 32.8 31.8 12.0 100.0
西貢 數目 No. 88 100 128 600 103 400 34 900 355 100 35Sai Kung 百分比 % 24.8 36.2 29.1 9.8 100.0
離島 數目 No. 24 700 31 500 27 000 11 800 95 000 35Islands 百分比 % 26.0 33.1 28.4 12.4 100.0
合計 數目 No. 1 530 400 2 211 000 2 001 300 996 000 6 738 700 37Overall 百分比 % 22.7 32.8 29.7 14.8 100.0
4. 有關按區議會分區劃分的勞動人口
的分析
4. Analysis on Labour Force by DistrictCouncil District
4.1 二零零二年年中勞動人口的數目為
3 498 900 ,其中男性有 1 969 800 人 ( 佔56.3%),而女性則有 1 529 100 人(佔 43.7%)。按區議會分區分析,沙田的男性勞動人口數目
最大,有 187 700 人(佔所有男性勞動人口的
9.5%)。另一方面,東區的女性勞動人口數目最
大,有 148 200 人(佔所有女性勞動人口的
9.7%)。 (表四)
4.1 The size of the labour force in mid-2002 was3 498 900, comprising 1 969 800 males (56.3%) and1 529 100 females (43.7%). Analysed by DCdistrict, the size of the male labour force was thelargest in Sha Tin, being 187 700 (or 9.5% of the malelabour force). On the other hand, the size of thefemale labour force was the largest in Eastern, being148 200 (or 9.7% of the labour force). (Table 4)
4.2 在各區議會分區中,以西貢的勞動人口
參與率為最高(66.9%),其次為灣仔(涵蓋跑馬
地、銅鑼灣和大坑等地區) (66.8%)。 (表四)
4.2 Among the DC districts, Sai Kung had thehighest labour force participation rate (LFPR)(66.9%), while Wan Chai (covering areas like HappyValley, Causeway Bay and Tai Hang, etc.) came next(66.8%). (Table 4)

香港統計月刊 二零零三年六月 Hong Kong Monthly Digest of Statistics June 2003FA10
4.3 男性整體的勞動人口參與率(72.7%)遠高
於女性勞動人口參與率(52.1%)。按區議會分
區進一步分析,男性的勞動人口參與率介乎深
水的 67.3%與西貢的 78.2%,而女性的勞動
人口參與率則介乎黃大仙的 47.2%與灣仔的
61.9%。 (表四)
4.3 The overall LFPR for males (72.7%) was muchhigher than that for females (52.1%). Furtheranalysed by DC district, the LFPRs for males rangedfrom 67.3% in Sham Shui Po to 78.2% in Sai Kung,while those for females ranged from 47.2% in WongTai Sin to 61.9% in Wan Chai. (Table 4)
表四 二零零二年年中按區議會分區及性別劃分的勞動人口數目及勞動人口參與率Table 4 Labour Force and Labour Force Participation Rates by District Council
District and Sex, Mid-2002
性別
區議會分區 SexDistrict Council 男 女 合計
District Male Female Overall
香港島 數目 No. 370 800 328 900 699 700Hong Kong Island 比率 1(%) Rate1(%) 71.9 56.0 63.4
中西區 數目 No. 68 700 68 100 136 800Central & Western 比率 1(%) Rate1(%) 72.0 58.1 64.3
灣仔 數目 No. 46 000 45 500 91 500Wan Chai 比率 1(%) Rate1(%) 72.5 61.9 66.8
東區 數目 No. 174 400 148 200 322 600Eastern 比率 1 (%) Rate1(%) 71.3 53.9 62.1
南區 數目 No. 81 700 67 100 148 800Southern 比率 1 (%) Rate1(%) 72.7 55.2 63.6
九龍 數目 No. 576 800 440 200 1 017 100Kowloon 比率 1 (%) Rate1(%) 69.3 49.4 59.0
油尖旺 數目 No. 87 100 63 400 150 500Yau Tsim Mong 比率 1 (%) Rate1(%) 71.6 50.6 61.0
深水 數目 No. 102 300 77 500 179 700Sham Shui Po 比率 1 (%) Rate1(%) 67.3 48.5 57.6
九龍城 數目 No. 101 900 90 100 192 000Kowloon City 比率 1 (%) Rate1(%) 70.8 53.6 61.6
黃大仙 數目 No. 125 800 90 700 216 500Wong Tai Sin 比率 1(%) Rate1(%) 69.0 47.2 57.8
觀塘 數目 No. 159 900 118 600 278 500Kwun Tong 比率 1(%) Rate1(%) 68.8 48.3 58.3

香港統計月刊 二零零三年六月 Hong Kong Monthly Digest of Statistics June 2003FA11
表四(續) 二零零二年年中按區議會分區及性別劃分的勞動人口數目及勞動人口參與率
Table 4 (Cont’d) Labour Force and Labour Force Participation Rates by DistrictCouncil District and Sex, Mid-2002
性別
區議會分區 SexDistrict Council 男 女 合計
District Male Female Overall
新界 數目 No. 1 022 200 759 900 1 782 100New Territories 比率 1(%) Rate1(%) 75.0 52.1 63.2
葵青 數目 No. 148 600 109 700 258 300Kwai Tsing 比率 1(%) Rate1(%) 71.1 51.9 61.4
荃灣 數目 No. 77 000 63 700 140 700Tsuen Wan 比率 1(%) Rate1(%) 73.7 54.2 63.3
屯門 數目 No. 153 600 103 800 257 400Tuen Mun 比率 1(%) Rate1(%) 76.2 51.0 63.5
元朗 數目 No. 147 300 99 200 246 500Yuen Long 比率 1(%) Rate1(%) 76.4 49.0 62.4
北區 數目 No. 81 500 63 500 144 900North 比率 1(%) Rate1(%) 73.8 51.3 61.9
大埔 數目 No. 89 600 67 400 157 100Tai Po 比率 1(%) Rate1(%) 74.8 52.0 62.9
沙田 數目 No. 187 700 147 600 335 300Sha Tin 比率 1(%) Rate1(%) 75.6 52.6 63.4
西貢 數目 No. 109 600 83 700 193 300Sai Kung 比率
1(%) Rate1(%) 78.2 56.3 66.9
離島 數目 No. 27 400 21 300 48 800Islands 比率 1(%) Rate1(%) 75.6 53.5 64.1
合計 數目 No. 1 969 800 1 529 100 3 498 900Overall 比率 1(%) Rate1(%) 72.7 52.1 62.0
註釋 : 1比率是指在某一特定的區議會分區/性別組別的人士的勞動人口參與率。
Note : 1Labour force participation rate in respect of persons in the specified District Council district/sex group.
5. 可供參考有關刊物 5. Further Reference
5.1 有關按區議會分區劃分的人口及其社會
經濟特徵的更詳細統計數字,載於《按區議會
分區劃分的人口及住戶統計資料》報告書。
5.1 More detailed socio-economic statisticspertaining to the population by DC district arecontained in the report Population and HouseholdStatistics Analysed by District Council District.


香港統計月刊 二零零三年六月 FB1 Hong Kong Monthly Digest of Statistics June 2003
香港的資訊科技及電訊業 The Information Technology and Telecommunications Sector
in Hong Kong
在這資訊年代,資訊及通訊科技的急速發展對社會有很大影響。為了反映這方
面的最新發展,政府統計處近年開始編製有關的統計數字。本文目的是就資訊
科技及電訊業的行業結構及營運特徵,提供最新的分析。 The rapid development of information and telecommunications technologies has been affecting society significantly in this information age. To reflect the latest development in this area, the Census and Statistics Department started compiling relevant statistics in recent years. This article aims to provide an up-to-date analysis of the structural and operating characteristics of the information technology and telecommunications (IT&T) sector in Hong Kong.
如對本文有任何查詢,請致電政府統計處資訊科技及電訊統計組 (電話:2887 5559)。
If you have any enquiries on this article, please call Information Technology and Telecommunications Statistics Section, Census and Statistics Department (Tel.: 2887 5559).

香港統計月刊 二零零三年六月 FB2 Hong Kong Monthly Digest of Statistics June 2003
香港的資訊科技及電訊業 The Information Technology and Telecommunications Sector
in Hong Kong
1. 緒言 1. Introduction 1.1 在這資訊年代,資訊及通訊科技的急
速發展對社會有很大影響。為了反映這方面
的最新發展,政府統計處近年開始編製有關
的統計數字。本文目的是就資訊科技及電訊
業的行業結構及營運特徵,提供最新的分析。
1.1 The rapid development of information and telecommunications technologies has been affecting society significantly in this information age. To reflect the latest development in this area, the Census and Statistics Department started compiling relevant statistics in recent years. This article aims to provide an up-to-date analysis of the structural and operating characteristics of the information technology and telecommunications (IT&T) sector in Hong Kong.
2. 資訊科技及電訊業的涵蓋範圍 2. Coverage of the IT&T Sector 2.1 電子經濟的出現對資訊科技及電訊
產品及服務的需求帶來一個新浪潮。各工商
業也紛紛利用新科技所帶來的優勢,捕捉這
新興市場。在嶄新經濟活動出現的同時,很
多現有的公司亦把相關業務轉移至資訊科技
及電訊產品。就編製統計數字而言,這些主
要生產和經銷資訊科技及電訊產品以及提供
資訊科技及電訊服務的行業,可統稱為「資
訊科技及電訊業」。
2.1 Emergence of the “e-economy” brings a new wave of demand for IT&T products and services. Industries taking advantage of the new technologies come forth to capture this emerging market. New economic activities take form, while many existing companies shift their focus from related lines of business towards IT&T products and services. These industries which mainly engage in the production and distribution of IT&T products and provision of services related to IT&T may be grouped together as the “IT&T sector” for statistical compilation purposes.
2.2 直至現時為止,國際間對「資訊科技
及電訊業」尚未有一致的定義。不同的經濟
體系採用各自的一套定義。就本港而言,資
訊科技及電訊業包括五個組別的行業,分別
從事以下的經濟活動(請參閱附件內資訊科
技及電訊業所涵蓋的行業):
(1) 資訊科技及電訊產品的製造; (2) 通訊系統安裝及保養; (3) 資訊科技及電訊產品的經銷; (4) 電訊服務; (5) 資訊科技服務。
2.2 So far, there is no international standard definition on IT&T sector. Different economies adopt their own definitions. In the case of Hong Kong, the IT&T sector covers five groups of industries engaged in the following economic activities respectively (please see the Annex for the complete list of industries covered in the IT&T sector):
(1) Manufacturing of IT&T products; (2) Communication system installation and maintenance; (3) Distribution of IT&T products; (4) Telecommunications services; (5) Information technology (IT) services.

香港統計月刊 二零零三年六月 FB3 Hong Kong Monthly Digest of Statistics June 2003
3. 資訊科技及電訊業的行業結構 3. Industry Structure of the IT&T Sector
3.1 在一九九八年,資訊科技及電訊業約
有5 800間機構單位,就業人數共66 500人。
有關機構單位數目在二零零一年增加至約
9 000間,就業人數增加至76 500人,較一九
九八年分別上升56%及15%。讀者須注意資
訊科技及電訊業就業人數的統計數字,包括
從事資訊科技的僱員及從事其他職業的僱
員。同樣理由,資訊科技及電訊業的機構單
位只要是以生產及提供資訊科技及電訊產品
及服務為主,亦可能同時生產及提供少量非
資訊科技及電訊產品及服務。(表一)
3.1 In 1998, there were some 5 800 establishments and 66 500 persons engaged in the IT&T sector. The numbers increased to about 9 000 and 76 500 respectively in 2001, representing increases of 56% and 15% respectively over 1998. It should be noted that statistics on the number of persons engaged in the IT&T sector include IT personnel and personnel in other occupations. By the same token, establishments in the IT&T sector may also produce small amount of non-IT&T products and services so long as IT&T products and services are their main line of business. (Table 1)
表一 Table 1
有關資訊科技及電訊業的主要統計數字 Key statistics pertaining to the information technology and telecommunications sector
1998 1999 2000 2001
機構單位數目 No. of establishments
5 751 6 579 (+14)
8 141 (+24)
8 971 (+10)
就業人數 No. of persons engaged
66 500 70 800 (+6)
78 800 (+11)
76 460 (-3)
平均每間機構單位的就業人數 Average no. of persons engaged per establishments
11.6 10.8 (-7)
9.7 (-10)
8.5 (-12)
生產總額(十億港元) Gross output (HK$ billion)
96.5 96.7 (#)
99.2 (+3)
93.4 (-6)
平均每間機構單位的生產總額(百萬港元) Average gross output per establishments (HK$ million)
16.8 14.7 (-13)
12.2 (-17)
10.4 (-15)
增加價值(十億港元) Value added (HK$ billion)
38.1 32.9 (-14)
38.6 (+17)
42.1 (+9)
在以要素成本計算的 本地生產總值內所佔比率 (%) Contribution to GDP at factor cost (%)
3.2 2.8
3.1
3.5
僱員薪酬(十億港元) Compensation of employees (HK$ billion)
N.A. N.A. N.A. 23.5
盈餘總額(十億港元) Gross surplus (HK$ billion)
N.A. N.A. N.A. 16.8
固定資產的買賣淨值(十億港元) Gross additions to fixed assets (HK$ billion)
N.A. N.A. N.A. 11.4
資料來源: 按年經濟統計調查計劃 Source: Programme of Annual Economic Surveys 註釋: 括號內的數字是與上年比較的變動百分
率。 Notes: Figures in brackets denote percentage changes over
the preceding year. # 表示變動百分率在增減 0.5%以內。 # Denotes change within ± 0.5%.

香港統計月刊 二零零三年六月 FB4 Hong Kong Monthly Digest of Statistics June 2003
3.2 在二零零一年,資訊科技及電訊業
中有46.3%的機構單位從事提供資訊科技服
務,例如軟件開發及保養服務,而有43.4%的機構單位則從事資訊科技及電訊產品的經
銷業務。(圖一)
3.2 In 2001, 46.3% of the establishments in the IT&T sector were engaged in provision of IT services, such as software development and maintenance services, while 43.4% were engaged in distribution of IT&T products. (Chart 1)
圖一 二零零一年按經濟活動劃分的資訊科技及電訊業機構單位數目的分布 Chart 1 Distribution of number of establishments in the IT&T Sector by Economic activities in 2001
3.3 以就業人數而言,從事資訊科技及
電訊產品經銷業務的機構單位在資訊科技及
電訊業佔最大的比重(34.4%),其次是提供
電訊服務的機構單位(31.7%)。後者雖然就
機構單位數目而言,所佔的比重較小,但卻
佔就業人數很大的比重,因為當中有數間規
模很大的機構單位。另一方面,由於大部分
從事提供資訊科技服務的機構單位的規模較
小,所以該組別行業的就業人數,只佔整體
資訊科技及電訊業的25.4%。(表二及圖二)
3.3 In terms of persons engaged however, establishments engaged in the distribution of IT&T products had the largest share (34.4%), followed by those engaged in provision of telecommunications services (31.7%). The latter took up such a large share of the total number of persons engaged despite its relatively small share in terms of number of establishments, because there were a few very large establishments in this group of industries. On the other hand, as establishments engaged in the provis ion of IT services were dominated by small ones, they only took up 25.4% of the total number of persons engaged in the IT&T sector. (Table 2 and Chart 2)
電訊服務 Telecommunications
services (3.9%)
通訊系統安裝及保養 Communication system
installation and maintenance
(3.3%)
資訊科技及電訊 產品的經銷
Distribution of IT&T products
(43.4%)
資訊科技及電訊 產品的製造
Manufacturing of IT&T products
(3.1%)
資訊科技服務 IT services
(46.3%)

香港統計月刊 二零零三年六月 FB5 Hong Kong Monthly Digest of Statistics June 2003
表二 Table 2
二零零一年資訊科技及電訊業每間機構單位的平均就業人數 Average number of persons engaged per establishment in the IT&T sector in 2001
每間機構單位的就業人數
Number of persons engaged per establishment
資訊科技及電訊產品的製造 Manufacturing of IT&T products
13.4
通訊系統安裝及保養 Communication system installation and maintenance
9.2
資訊科技及電訊產品的經銷 Distribution of IT&T products
6.8
電訊服務 Telecommunications services
69.7
資訊科技服務 Information technology services
4.7
資料來源: 按年經濟統計調查計劃 Source: Programme of Annual Economic Surveys
圖二 二零零一年按經濟活動劃分的資訊科技及電訊業就業人數的分布 Chart 2 Distribution of number of persons engaged in the IT&T Sector by economic activities in 2001
電訊服務 Telecommunications
services (31.7%)
通訊系統安裝及保養 Communication system
installation and maintenance
(3.5%)
資訊科技及電訊 產品的經銷
Distribution of IT&T products
(34.4%)
資訊科技及電訊 產品的製造
Manufacturing of IT&T products
(4.9%)
資訊科技服務 IT services
(25.4%)

香港統計月刊 二零零三年六月 FB6 Hong Kong Monthly Digest of Statistics June 2003
3.4 以增加價值而言,從事提供電訊服
務的機構單位佔整體資訊科技及電訊業的
增加價值的比重超過一半(54.4%),其次是從
事資訊科技及電訊產品經銷業務的機構單
位(29.6%)。(圖三)
3.4 In terms of value added in 2001, establishments engaged in the provision of telecommunications services accounted for over half (54.4%) of the total value added of the IT&T sector, followed by those engaged in the distribution of IT&T products (29.6%). (Chart 3)
圖三 二零零一年按經濟活動劃分的資訊科技及電訊業增加價值的分布 Chart 3 Distribution of value added of the IT&T Sector by economic activities in 2001
4. 資訊科技及電訊業的業務表現 4. Business Performance of the IT&T Sector
4.1 雖然相關的市場急劇擴展,但資訊
科技及電訊業的生產總額卻只由一九九八
年的965億港元輕微上升至二零零零年的
992億港元,並於二零零一年輕微下降至934億港元。這主要是由於長途電話收費大幅調
低以及流動電話網絡商降低服務收費,抵消
了使用量增加所造成的增長。(表一)
4.1 Despite a rapid expansion in the related market, total gross output of the IT&T sector only increased marginally from $96.5 billion in 1998 to $99.2 billion in 2000 and registered a drop to $93.4 billion in 2001. This was due to the marked reduction in charges for international calls and competitive pricing packages offered by mobile phone operators, which offset the increase due to increased transaction volume. (Table 1)
電訊服務 Telecommunications
services (54.4%)
通訊系統安裝及保養 Communication system
installation and maintenance
(2.3%)
資訊科技及電訊 產品的經銷
Distribution of IT&T products
(29.6%)
資訊科技服務 IT services
(11.9%)
資訊科技及電訊 產品的製造
Manufacturing of IT&T products
(1.7%)

香港統計月刊 二零零三年六月 FB7 Hong Kong Monthly Digest of Statistics June 2003
4.2 資訊科技及電訊業的增加價值,由
一九九八年的381億港元微升1.3%至二零零
零年的386億港元。於二零零一年,增加價
值上升至421億港元,與二零零零年比較升
幅達9.1%。鑑於同期的生產總額下降,顯示
生產成本有相當幅度的減少。在一九九八年
至二零零一年間,資訊科技及電訊業的增加
價值佔本地生產總值的百分比,約為2.8%至
3.5%。(表一)
4.2 The value added for the IT&T sector increased slightly by 1.3% from $38.1 billion in 1998 to $38.6 billion in 2000. In 2001, the value added rose to $42.1 billion, representing 9.1% increase over 2000. This, against the backdrop of falling gross output, implied a substantial drop in costs of input. During 1998 to 2001, the contribution of the IT&T sector to GDP ranged from 2.8% and 3.5%. (Table 1)
5. 資訊科技及電訊業的營運特徵 5. Operating Characteristics of the IT&T Sector
5.1 資訊科技及電訊業每間機構單位的
平均就業人數持續下降,由一九九八年的
11.6下降26.7%至二零零一年的8.5。這縮小
規模的趨勢,可能由機構單位採用辦公室自
動化及其他資訊科技應用系�s所帶動。(表
一)
5.1 Average number of persons engaged per establishment in the IT&T sector dropped consistently by 26.7% from 11.6 in 1998 to 8.5 in 2001. This trend of downsizing was probably made possible by office automation and other IT applications. (Table 1)
5.2 資訊科技及電訊業每間機構單位的
平均生產總額,亦由一九九八年的168億港
元減少至二零零一年的104億港元,下降
38%。這情況與該行業機構單位縮小規模的
趨勢一致。(表一)
5.2 Average gross output per establishment in the IT&T sector also decreased by 38%, from $16.8 million in 1988 to $10.4 million in 2001, largely in line with the downsizing of establishments in the IT&T sector. (Table 1)
5.3 由二零零一年統計年度開始,本處
亦編製有關資訊科技及電訊業整體僱員薪
酬、盈餘總額及固定資產的買賣淨值的統計
數字。(表一)
5.3 Starting from the reference year 2001, statistics on compensation of employees, gross surplus and gross additional to fixed assets for the IT&T sector were also compiled. (Table 1)
5.4 作為量度經濟活動淨產出的數據,
增加價值會被分配到各項生產因素作為回
報,包括勞工、資金及企業才能。它們分別
獲取以僱員薪酬、利息支付及盈餘總額作為
回報。
5.4 Value added, being a measure of the net output of economic activities, is distributed as a return to the various factors of production, viz. labour, capital and entrepreneurship , in the form of compensation of employee, interest payments and gross surplus respectively.
5.5 在二零零一年,資訊科技及電訊業
的僱員薪酬佔增加價值的比重為55.8%, 而
盈餘總額則佔39.9%。至於其他經濟行業方
面,僱員薪酬佔增加價值的比重,則由地產
發展及有關服務業的低於20%,至建築及建
造業的高於80%。(表一)
5.5 For the IT&T sector in 2001, compensation of employees amounted to 55.8% of value added while gross surplus amounted to 39.9%. For the other economic sectors, the share of compensation of employees in 2001 ranged from less than 20% for the real estate development and related services sector to over 80% for the building and construction sector. (Table 1)

香港統計月刊 二零零三年六月 FB8 Hong Kong Monthly Digest of Statistics June 2003
5.6 在二零零一年,資訊科技及電訊業
的整體固定資產的買賣淨值與僱員薪酬比
例是0.49。相對於整體經濟的0.20,資訊科
技及電訊業較為資本密集。(表一)
5.6 Ratio of gross additions to fixed assets to compensation of employees for the IT&T in 2001 is 0.49. Compared with 0.20 for the whole economy, the IT&T sector is a relatively capital intensive sector. (Table 1)
6. 資訊科技及電訊業的未來發展 6. Future Development of the IT&T Sector
6.1 現時香港資訊科技及電訊業機構單
位的經濟活動,主要集中於提供電訊服務。
由於全球電訊服務的競爭劇烈,資訊科技及
電訊業的盈利能力無可避免會受到影響,從
而導致該行業的生產總額及增加價值面對
一定的壓力。
6.1 Currently, telecommunications services account for the main bulk of the economic activities of the establishments in the IT&T sector in Hong Kong. Given the growing competition in telecommunications services on a global scale , profitability of the IT&T sector as a whole would definitely be affected. This might in turn lead to a pressure on the gross output and even value added of the sector.
6.2 另一方面,當工商業及住��更多採
用資訊科技時,可預期帶領新資訊科技及電
訊產品的開發,進一步導致商業活動及產品
更多元化。這些都對資訊科技及電訊業的發
展有利。
6.2 On the other hand, it is expected that as adoption of IT in business and household sectors increases, new IT&T products would be developed, leading to greater variety in business activities and products offered. This is conducive to the development of the IT&T sector.
7. 其他參考資料 7. Further Reference 7.1 本文內的統計數字是經由按年經濟
統計調查計劃所搜集的數據編製而成。有關
統計調查的結果及名詞釋義載於下列的統
計調查報告內。
- 工業生產按年統計調查報告; - 屋宇建築、建造及地產業按年統計
調查報告; - 批發、零售、進出口貿易、食肆及
酒店按年統計調查報告; 及 - 倉庫、通訊、財務、保險及商用服
務按年統計調查報告。
7.1 Statistics in this feature article are compiled from data collected in the Programme of Annual Economic Surveys. Results of the surveys concerned and the definitions of terms are available from the following survey reports.
- Report on Annual Survey of Industrial Production;
- Report on Annual Survey of Building, Construction and Real Estate Sectors;
- Report on Annual Survey of wholesale, Retail and Import and Export Trades, Restaurants and Hotels;
- Report on Annual Survey of Storage, Communication, Financing, Insurance and Business Services.
7.2 本刊末載有如何購買政府統計處刊
物的資料和郵購表格。
7.2 Information on how to purchase publications of the Census and Statistics Department together with a mail order form is available at the end of this publication.

香港統計月刊 二零零三年六月 FB9 Hong Kong Monthly Digest of Statistics June 2003
附件 Annex
資訊科技及電訊業所涵蓋的行業 Industries covered in the IT&T Sector (I) 資訊科技及電訊產品的製造 (I) Manufacturing of IT&T products 計算及會計器材的製造 Computing machinery and equipment, manufacturing 電話及其他通訊設備的製造 Telephone and communications equipment, manufacturing 電腦及電訊設備用電子零件的製造 Electronic parts and components for computer and
telecommunications equipment, manufacturing (II) 通訊系統安裝及保養 (II) Communication system installation and maintenance 閉路通訊系統安裝及保養 Intercommunication system, installation and maintenance 電訊系統安裝及保養 Telecommunications system, installation and maintenance (III) 資訊科技及電訊產品的經銷 (III) Distribution of IT&T products 電話系統批發 Telephone system, wholesale 電訊設備批發(電話系統除外) Telecommunications equipment (excl. telephone system),
wholesale 電腦、電腦周邊設備及套裝軟件批發 Computer, computer peripherals and software packages,
wholesale 電話系統零售 Telephone system, retail 電訊設備零售(電話系統除外) Telecommunications equipment (excl. telephone system), retail 電腦、電腦周邊設備及套裝軟件零售 Computer, computer peripherals and software packages, retail 電話系統進出口貿易 Telephone system, import & export 電訊設備進出口貿易(電話系統除外) Telecommunications equipment (excl. telephone system),
import & export 電腦、電腦周邊設備及套裝軟件進出口貿易 Computer, computer peripherals and software packages,
import & export (IV) 電訊服務 (IV) Telecommunications services 有線固定電訊網絡服務 Wireline based fixed telecommunications network services 其他固定電訊網絡服務 Fixed telecommunications network services, n.e.c. 傳呼服務 Radio paging services 流動通訊服務 Mobile communications services 互聯網接駁服務 Internet access services ��星通訊服務 Satellite communications services 其他電訊服務 Telecommunications services, n.e.c. (V) 資訊科技服務 (V) Information technology services 軟件開發及保養服務 Software development and maintenance services 資料處理及製表服務 Data processing and tabulating services 其他資訊科技相關服務 Information technology related services, n.e.c. 與電腦及電訊設備有關的工程及技術服務 Engineering and technical services related to computer and
telecommunications equipment


香港統計月刊 二零零三年六月 FC1 Hong Kong Monthly Digest of Statistics June 2003
香港服務貿易的發展 Development of Trade in Services of Hong Kong
隨着香港經濟的轉型,香港的服務業日趨重要。作為一個外向型及以服務業為
主的經濟體系,香港不僅是重要的貨物貿易中心,同時亦是重要的服務貿易中
心。 這篇文章分析香港服務貿易的最新發展及統計數字的趨勢,特別是與離岸貿易
有關的服務輸出統計數字。本文並介紹香港因應全球在服務貿易統計方面的發
展而對有關統計系統所作出的改進,以及香港在全球服務貿易中所佔的比重。 With the structural change in the Hong Kong economy, the service industries of Hong Kong are increasing in significance. Being an externally oriented and service-based economy, Hong Kong is an important centre not only for the trading in goods, but also for the trading in services. This article analyses the latest development and statistical trend of trade in services of Hong Kong, particularly the statistics on exports of services relating to offshore trade. It also introduces the enhancements made in the related statistical system in Hong Kong in response to the global development in trade in services statistics, and the shares of Hong Kong’s trade in services in the world.
如對本文有任何查詢,請致電政府統計處經銷及服務業統計組(一)乙
(電話:2802 1350)。
If you have any enquiries on this article, please call Distribution and Services Statistics Section (1)B, Census and Statistics Department (Tel. : 2802 1350).

香港統計月刊 二零零三年六月 FC2 Hong Kong Monthly Digest of Statistics June 2003
香港服務貿易的發展 Development of Trade in Services of Hong Kong
1. 引言 1. Introduction
1.1 隨着香港經濟的轉型,香港的服務業日
趨重要。作為一個外向型及以服務業為主的經
濟體系,香港不僅是重要的貨物貿易中心,同
時亦是重要的服務貿易中心。
1.1 With the structural change in the Hong Kong economy, the service industries of Hong Kong areincreasing in significance. Being an externally oriented and service-based economy, Hong Kong is an important centre not only for the trading in goods, but also for the trading in services.
1.2 在過去二十年,香港的服務業愈趨重
要。在本地生產總值所佔的比重,由一九八零
年的 67.3%,顯著增加至二零零一年的 86.5%。
1.2 The service industries of Hong Kong have been increasing in significance in the past two decades, with the share of contribution to the Gross Domestic Product increased significantly from 67.3% in 1980 to 86.5% in 2001.
1.3 作為一個外向型的經濟體系,香港向世
界其他地方輸出及輸入服務。而與貨物貿易不
同,服務貿易錄得的盈餘正在增加。
1.3 Being an externally oriented economy, Hong Kong is exporting services to and importing services from other places. There is an increasing surplus in the balance of trade in services (TIS), as distinguished from trade in goods.
1.4 服務貿易包括服務輸出及輸入,所涉及
的服務根據國際標準及按本地需要分為六個
主要服務組別,即運輸、旅遊、保險服務、金
融服務、商貿服務及其他與貿易相關的服
務,以及其他服務。
1.4 TIS includes both exports and imports of services and the services involved are categorized,based on international standards with local adaptation, into six major service groups, i.e. transportation, travel, insurance services, financial services, merchanting and other trade-related services, and other services.
1.5 在各主要服務組別中,運輸以及商貿服
務及其他與貿易相關的服務為最重要的組
別。特別是與「離岸貿易」有密切關係的商貿
服務及其他與貿易相關的服務對香港的服務
貿易的重要性正日益增加。
1.5 Amongst the major service groups, transportation and merchanting and other trade-related services are the most important groups. In particular, merchanting and other trade-related services, which is closely related to “offshore trade”,is gaining importance in the TIS of Hong Kong.
2. 全球服務貿易的發展 2. Development of TIS worldwide 2.1 在國際方面,鑑於全球意識到服務貿易
日趨重要,聯合國、世界貿易組織及國際貨幣
基金組織以及其他國際組織在二零零二年聯
合出版第一本《國際服務貿易手冊》,作為因
應各政府、商業機構及分析者對更切合需要、
更詳盡和可供跨國/地區比較的統計數據的需
求,而邁進的第一步。該手冊內的建議基本上
2.1 On the international front, there has been global recognition of the growing importance of TIS. In 2002, the United Nations, World Trade Organization, International Monetary Fund, and other international organizations jointly published the first “Manual on Statistics of International Trade in Services”, as a first step in addressing the growing demand from governments, business and analysts for more relevant, detailed and internationally

香港統計月刊 二零零三年六月 FC3 Hong Kong Monthly Digest of Statistics June 2003
與作為服務貿易統計數字編製藍本的一九九
三年《國際收支平衡手冊》(第五版)所載列
的一致。
comparable statistics on TIS. The recommendations are basically consistent with those in the “Balance of Payments Manual” (Fifth Edition) of 1993, which has been the basis for TIS statistics compilation.
2.2 為符合服務貿易統計編製及發布的國際
指引,香港主動檢討與服務貿易的數據搜集及
編製有關的統計調查方法及統計系統。由一九
九五統計年度起,已開始籌劃發表更詳細的服
務貿易統計數字。加上一九九九統計年度對有
關統計調查所作的改進,二零零二年七月首次
發表按服務種類及國家/地區劃分的二零零零
年的詳細服務貿易統計數字。
2.2 To comply with the international recommendations on TIS statistics compilation and dissemination, Hong Kong has taken the initiative to review the survey methodology and statistical system pertaining to the data collection and statistics compilation of TIS. Since 1995 round of statistical surveys, plan for the release of more detailed TIS statistics has been started. With further enhancements made in the 1999 round of statistical surveys, detailed TIS statistics for 2000 were first published by type of services and country/territory breakdown in July 2002.
3. 香港的服務貿易統計系統及分類 3. Statistical system and classification of
Hong Kong’s TIS 3.1 香港的服務貿易統計數字自一九八零統
計年度開始,主要根據「服務輸入及輸出按年
統計調查」所搜集的資料以及其他來源的資料
而編製。然而,當時的服務分類只按香港的商
業機構所從事的主要行業而劃分。例如銀行業
錄得的服務輸出及輸入,基於數據的局限而列
入金融服務。
3.1 Hong Kong’s TIS statistics can be traced back to 1980 reference year, when the Annual Survey of Imports and Exports of Services was used, amongst other data sources, as the major vehicle for collecting data related to TIS. The classification of services was based on the major industries in which the Hong Kong businesses were engaged. For instance, the exports and imports of services recorded for the banking sector were mainly classified as financial services due to data limitation.
3.2 隨着服務分類的最新發展,特別是服務
貿易的分類,由一九九五統計年度開始,香港
的服務輸出及輸入可根據實際的服務交易種
類而劃分。例如銀行業可輸出金融服務以及其
他服務(例如電腦及資訊服務),同時亦可輸
入金融服務及其他服務(例如通訊以及電腦及
資訊服務)。一九九五統計年度以前的統計數
列亦已按改進的基準數據更新。
3.2 With the latest development in services classification, particularly for TIS, exports and imports of services of Hong Kong are classified according to the actual type of services transacted since 1995 reference year. For instance, banking sector can export financial services as well as other services such as computer and information services. At the same time, banking sector can import financialservices as well as other services such as communications or computer and information services. Statistical series prior to 1995 reference year has also been updated using the enhanced benchmark data.

香港統計月刊 二零零三年六月 FC4 Hong Kong Monthly Digest of Statistics June 2003
4. 香港的服務貿易統計數字 4. Statistics on Hong Kong’s TIS 4.1 表一載列近年按主要服務組別劃分的香
港服務輸出及輸入的總額。在二零零一年,服
務輸出及輸入的總額分別上升 2.6%及 0.5%,
達 3,259 億元及 1,925 億元。
4.1 Table 1 presents the values of exports and imports of services of Hong Kong in recent years by major service group. In 2001, the values of total exports and total imports of services rose by 2.6% and 0.5% respectively to $325.9 billion and $192.5 billion.
4.2 較重要的輸出服務,包括商貿服務及其
他與貿易相關的服務,以及運輸服務,輸出總
額分別為 1,064 億元及 937 億元。這些服務的
輸出在扣除輸入的服務後為整體的服務貿易
帶來盈餘。近年服務貿易的盈餘,更足以抵銷
貨物貿易錄得的赤字。在二零零一年,服務貿
易錄得 1,334 億元盈餘而貨物貿易則錄得 682億元赤字,使整體對外貿易錄得 652 億元的盈
餘。
4.2 The more important services exported include merchanting and other trade-related services (at $106.4 billion) and transportation services (at $93.7 billion), which also brought about the surplus in total TIS after netting out the total imports of services. The surpluses in TIS had effectively offset the deficits in trade in goods in recent years. In 2001, a surplus of $133.4 billion was recorded in TIS and a deficit of $68.2 billion was recorded in trade in goods, resulting in an overall external trade surplus of $65.2 billion.
按主要目的地劃分的服務輸出 Exports of services by main destination 4.3 在香港服務輸出當中,中國內地及美國
是最主要的目的地,其次是日本、台灣及英
國。圖一展示二零零一年按主要目的地劃分的
香港服務輸出比重。
4.3 On exports of services of Hong Kong, the mainland of China and the United States of America were the most important destinations, followed by Japan, Taiwan and the United Kingdom. Chart 1shows the shares of exports of services of Hong Kong by main destination in 2001.
圖一 二零零一年按主要目的地劃分的
香港服務輸出比重 圖二 二零零一年按主要來源地劃分的
香港服務輸入比重 Chart 1 Percentage shares of Hong
Kong’s exports of services by main destination in 2001
Chart 2 Percentage shares of Hong Kong’s imports of services by main source in 2001
英國United Kingdom
5.6%
台灣Taiwan8.6% 日本
Japan8.7%
美國United Statesof America
21.8%
中國內地The mainland
of China25.2%
其他地區Other places
30.1%其他地區
Other places34.6%
澳大利亞Australia
5.9%英國
United Kingdom6.1%
日本Japan 6.7%
美國United Statesof America
15.7%
中國內地The mainland
of China31.0%

香港統計月刊 二零零三年六月 FC5 Hong Kong Monthly Digest of Statistics June 2003
4.4 表二載列近年香港按主要目的地劃分的
服務輸出總額,以及它們在各主要服務組別中
所佔的比重。中國內地及美國是香港的服務輸
出最重要的目的地,特別在運輸、商貿服務及
其他與貿易相關的服務,以及其他服務,兩地
合計在商貿服務及其他與貿易相關的服務以
及其他服務的主要服務輸出組別中均佔多於
一半的比重。
4.4 Table 2 presents the values of Hong Kong’s exports of services by main destination, together with their shares of exports of services in various major service groups in recent years. The mainland of China and the United States of America were the most important destinations of Hong Kong’s exports of services, particularly in transportation, merchanting and other trade-related services, and other services. They together took up more than half of the shares in the major exported service groups of merchanting and other trade-related services, and other services.
按主要來源地劃分的服務輸入 Imports of services by main source 4.5 在香港服務輸入當中,中國內地及美國
亦是最主要的來源地,其次是日本、英國及澳
大利亞。圖二展示二零零一年按主要來源地劃
分的香港服務輸入比重。
4.5 On imports of services of Hong Kong, the mainland of China and the United States of America were again the most important sources, followed by Japan, the United Kingdom and Australia. Chart 2shows the shares of imports of services of Hong Kong by main source in 2001.
4.6 表三載列近年香港按主要來源地劃分的
服務輸入總額,以及它們在各主要服務組別中
所佔的比重。中國內地及美國為香港的服務輸
入最重要的來源地,特別在運輸、旅遊、商貿
服務及其他與貿易相關的服務,以及其他服
務。兩地合計在商貿服務及其他與貿易相關的
服務以及其他服務的主要服務輸入組別中均
佔多於一半的比重。
4.6 Table 3 presents the values of Hong Kong’s imports of services by main source, together with their shares of imports of services in various major service groups in recent years. The mainland of China and the United States of America were the most important sources of Hong Kong’s imports of services, particularly in transportation, travel, merchanting and other trade-related services, and other services. They together took up more than half of the shares in the major imported service groups of merchanting and other trade-related services, and other services.
5. 按主要目的地劃分與離岸貿易有關
的服務輸出 5. Exports of services relating to
offshore trade by main destination 5.1 在香港各主要服務組別當中,商貿服務
及其他與貿易相關的服務對服務輸出最為重
要,佔 32.7%的比重。而這組別中的 86.4%與
所謂「離岸貿易」(即是「商貿服務」及「與
離岸交易有關的商品服務」)有關。在與「離
岸貿易」有關的服務輸出中,香港的商業機構
提供服務予外地公司/人士向另一外地公司/
人士出售貨物,而所涉及的貨物不會進出香
港。
5.1 Amongst the major service groups of Hong Kong, merchanting and other trade-related servicescontributed most significantly to the exports of services, accounting for a share of 32.7%. Among such services, 86.4% were related to the so called “offshore trade”, i.e. “merchanting” and “merchandising services for offshore transactions”. In exports of services relating to “offshore trade”, the Hong Kong businesses provided the services in relation to the sales of goods from a party outside Hong Kong to another party outside Hong Kong without the goods entering and leaving Hong Kong.

香港統計月刊 二零零三年六月 FC6 Hong Kong Monthly Digest of Statistics June 2003
5.2 值得注意的是「離岸貿易」並非香港貨
物貿易的一部分,因此所涉及的貨物價值沒有
及不應包括在本地產品出口及貨物轉口統計
數字內。然而,從「商貿服務」所賺取的毛利
及從「與離岸交易有關的商品服務」所賺取的
佣金則應計算並包括在香港的商貿服務及其
他與貿易相關的服務輸出數字當中。
5.2 It is worth noting that the “offshore trade” is not part of the trade in goods of Hong Kong and hence the value of goods is not and should not be included in the statistics on domestic exports and re-exports of goods of Hong Kong. However, only the gross margin from “merchanting” and the commission from “merchandising services for offshore transactions” should be counted as and included in the statistics on exports of merchanting and other trade-related services of Hong Kong.
5.3 表四載列香港按主要目的地劃分的與
「離岸貿易」有關的服務輸出總額。中國內地
及美國是最主要的目的地,二零零一年比二零
零零年分別大幅增長 17.9%及 8.4%。其中主要
為「商貿服務」的增長,增幅分別為 18.8%及
13.2%。
5.3 Table 4 presents the values of Hong Kong’s exports of services relating to “offshore trade” by main destination. The mainland of China and the United States of America were the most important destinations, with substantial growths of 17.9% and 8.4% respectively in 2001 compared with 2000.Such growths were mainly brought about by the growths in “merchanting”, at 18.8% and 13.2% respectively.
6. 香港在全球服務貿易所佔的比重 6. Shares of Hong Kong’s TIS in the
world 6.1 根據世界貿易組織於二零零二年七月出
版的《二零零二年國際貿易統計數字》,在二
零零一年全球服務貿易總額當中,香港是第 12大的服務貿易總額地區、第 10 大的服務輸出
地區及第 15 大的服務輸入地區。
6.1 According to the “International Trade Statistics 2002” published by the World Trade Organization in July 2002, Hong Kong was the 12th
largest in total TIS, the 10th largest exporter of services, and the 15th largest importer of services worldwide in 2001.
6.2 表五載列香港的服務輸出、輸入以及服
務貿易總和(輸出數字及輸入數字的總和)在
全球服務貿易統計數字中所佔的比重及排名。
6.2 Table 5 presents the shares and rankings of Hong Kong’s exports, imports and total sum of trade (the sum of exports and imports) in respect of services in world TIS.

香港統計月刊 二零零三年六月 FC7 Hong Kong Monthly Digest of Statistics June 2003
表一 按主要服務組別劃分的服務輸出、輸入及輸出淨額 Table 1 Exports, imports and net exports of services by major service group
服務輸出 Exports of services
服務輸入
Imports of services
服務輸出淨額
Net exports of services
主要服務組別 Major service group
年 Year
十億港元 HK$ billion
比重
Share (%)
按年變動
百分率
Year-on-year% change
十億港元
HK$ billion
比重
Share (%)
按年變動 百分率
Year-on-year % change
十億港元
HK$ billion
運輸 1997 87.3 30.0 - 50.2 25.6 - 37.1Transportation 1998 85.1 31.3 -2.6 42.9 22.1 -14.7 42.2 1999 89.2 32.0 4.9 39.2 21.3 -8.5 50.0 2000 99.5 31.3 11.5 48.6 25.4 23.9 50.9 2001 93.7 28.7 -5.9 50.9 26.5 4.7 42.8 旅遊 1997 78.0 26.8 - 98.2 50.0 - -20.2Travel 1998 58.7 21.6 -24.8 104.4 53.9 6.3 -45.7 1999 56.5 20.2 -3.7 101.9 55.4 -2.4 -45.4 2000 61.8 19.5 9.4 97.4 50.9 -4.4 -35.6 2001 64.6 19.8 4.5 96.1 49.9 -1.4 -31.5 保險服務 1997 2.7 0.9 - 4.5 2.3 - -1.8Insurance 1998 3.1 1.1 16.4 4.6 2.4 2.2 -1.5services 1999 3.1 1.1 -1.2 5.0 2.7 8.2 -1.9 2000 3.5 1.1 12.6 4.1 2.1 -17.4 -0.7 2001 3.6 1.1 3.0 4.0 2.1 -2.0 -0.5 金融服務 1997 19.0 6.5 - 5.8 2.9 - 13.2Financial 1998 16.3 6.0 -13.9 6.7 3.5 16.4 9.6services 1999 19.2 6.9 17.7 5.7 3.1 -15.0 13.5 2000 20.9 6.6 8.6 5.5 2.9 -3.4 15.3 2001 21.8 6.7 4.6 5.2 2.7 -5.3 16.6 商貿服務及其他 1997 73.4 25.2 - 9.9 5.0 - 63.6與貿易相關的服務 1998 76.9 28.2 4.7 8.5 4.4 -13.7 68.4Merchanting and 1999 81.5 29.2 6.1 10.5 5.7 23.6 71.0other trade-related 2000 97.6 30.7 19.7 11.2 5.8 6.3 86.4services 2001 106.4 32.7 9.0 11.8 6.1 5.7 94.6 其他服務 1997 30.7 10.5 - 27.8 14.2 - 2.9Other services 1998 32.1 11.8 4.5 26.5 13.7 -4.8 5.6 1999 29.7 10.6 -7.5 21.7 11.8 -18.0 8.0 2000 34.4 10.8 15.8 24.7 12.9 13.7 9.7 2001 35.8 11.0 4.2 24.4 12.7 -1.2 11.4 所有服務 1997 291.1 100.0 - 196.4 100.0 - 94.7All services 1998 272.1 100.0 -6.5 193.6 100.0 -1.4 78.6 1999 279.2 100.0 2.6 184.1 100.0 -4.9 95.1 2000 317.6 100.0 13.8 191.5 100.0 4.1 126.0 2001 325.9 100.0 2.6 192.5 100.0 0.5 133.4
註釋: 比重及按年變動百分率數字是以未經進位數字計算。
Note : Share and year-on-year % change figures are derived from unrounded figures.

香港統計月刊 二零零三年六月 FC8 Hong Kong Monthly Digest of Statistics June 2003
表二 按主要目的地及主要服務組別劃分的香港服務輸出 Table 2 Hong Kong’s exports of services by main destination and major service
group
中國內地 The mainland
of China
美國 United States of America
日本 Japan
台灣
Taiwan
英國
United Kingdom
其他地區
Other places
所有目的地
All destinations
年
Year
十億港元 HK$
billion
比重 Share
(%)
十億港元 HK$
billion
比重 Share
(%)
十億港元
HK$ billion
比重
Share (%)
十億港元
HK$ billion
比重
Share (%)
十億港元
HK$ billion
比重
Share (%)
十億港元 HK$
billion
比重 Share
(%)
十億港元
HK$ billion
比重
Share (%)
運輸 Transportation
1997 16.0 18.3 17.1 19.5 12.0 13.8 6.0 6.9 3.6 4.1 32.7 37.4 87.3 100.01998 17.5 20.5 14.6 17.2 10.9 12.8 5.9 7.0 3.1 3.7 33.0 38.8 85.1 100.01999 17.1 19.2 13.8 15.5 12.3 13.8 6.8 7.6 3.8 4.3 35.4 39.6 89.2 100.02000 17.6 17.7 18.0 18.1 12.4 12.4 10.6 10.6 5.2 5.2 35.8 36.0 99.5 100.02001 17.3 18.5 16.3 17.4 12.8 13.7 11.6 12.3 4.1 4.4 31.6 33.7 93.7 100.0
旅遊 Travel
1997 16.6 21.2 6.3 8.1 11.1 14.3 13.9 17.8 2.4 3.1 27.6 35.4 78.0 100.01998 15.3 26.1 5.3 9.0 6.2 10.6 11.5 19.7 2.0 3.3 18.3 31.3 58.7 100.01999 14.7 26.0 4.8 8.4 6.9 12.2 11.7 20.7 1.6 2.8 16.9 29.9 56.5 100.02000 19.2 31.0 5.1 8.2 6.7 10.9 11.8 19.1 1.6 2.7 17.4 28.1 61.8 100.02001 24.0 37.1 5.1 7.8 5.7 8.8 11.0 17.1 1.7 2.6 17.2 26.6 64.6 100.0
保險服務 Insurance services
1997 0.4 13.7 0.2 9.1 0.3 12.2 0.1 4.8 0.3 13.1 1.3 47.0 2.7 100.01998 0.6 18.5 0.2 5.7 0.3 11.2 0.1 1.7 0.8 27.3 1.1 35.7 3.1 100.01999 0.6 19.1 0.3 10.6 0.5 15.9 § 1.4 0.6 19.5 1.0 33.6 3.1 100.02000 0.6 18.2 0.2 4.7 0.4 11.9 0.1 2.8 0.6 17.7 1.5 44.6 3.5 100.02001 0.8 21.4 0.2 5.8 0.5 13.2 0.1 3.9 0.7 19.0 1.3 36.8 3.6 100.0
金融服務 Financial services
1997 0.8 4.1 3.7 19.7 1.9 10.0 0.4 2.3 3.3 17.3 8.8 46.5 19.0 100.01998 0.9 5.4 2.9 18.0 2.8 17.1 0.6 3.5 2.0 12.1 7.2 43.9 16.3 100.01999 1.0 5.1 4.4 23.1 1.8 9.6 0.7 3.6 3.8 19.8 7.5 38.8 19.2 100.02000 0.5 2.2 6.3 30.4 1.1 5.5 0.6 2.9 4.4 21.2 7.9 37.9 20.9 100.02001 0.5 2.5 7.3 33.4 1.2 5.3 0.6 2.7 4.5 20.5 7.8 35.6 21.8 100.0
商貿服務及其他與貿易相關的服務 Merchanting and other trade-related services
1997 13.3 18.1 31.1 42.3 4.8 6.6 3.3 4.5 2.4 3.3 18.5 25.2 73.4 100.01998 23.9 31.2 19.5 25.4 6.5 8.4 2.3 3.0 1.8 2.3 22.9 29.8 76.9 100.01999 24.6 30.2 22.5 27.6 4.4 5.4 1.4 1.7 2.5 3.1 26.1 32.0 81.5 100.02000 29.0 29.7 26.3 26.9 7.0 7.1 2.9 3.0 3.6 3.7 29.0 29.7 97.6 100.02001 32.3 30.3 29.9 28.1 6.5 6.1 3.0 2.8 3.4 3.2 31.3 29.4 106.4 100.0
其他服務 Other services
1997 9.0 29.2 7.4 24.2 1.1 3.7 1.6 5.0 2.2 7.3 9.4 30.7 30.7 100.01998 9.5 29.7 6.4 19.9 1.8 5.5 1.3 4.2 2.1 6.5 11.0 34.2 32.1 100.01999 8.4 28.4 8.7 29.4 1.0 3.4 1.4 4.8 2.1 7.1 8.0 26.9 29.7 100.02000 5.8 16.9 13.3 38.7 1.7 5.0 1.8 5.4 3.6 10.4 8.1 23.6 34.4 100.02001 7.2 20.1 12.3 34.4 1.7 4.7 1.9 5.3 3.7 10.3 9.1 25.3 35.8 100.0
所有服務 All services
1997 56.0 19.2 65.8 22.6 31.3 10.8 25.3 8.7 14.3 4.9 98.3 33.8 291.1 100.01998 67.7 24.9 48.9 18.0 28.5 10.5 21.7 8.0 11.8 4.3 93.5 34.3 272.1 100.01999 66.5 23.8 54.6 19.5 26.9 9.6 22.0 7.9 14.4 5.2 94.8 34.0 279.2 100.02000 72.6 22.9 69.1 21.8 29.4 9.2 27.8 8.8 19.0 6.0 99.7 31.4 317.6 100.02001 82.0 25.2 71.1 21.8 28.3 8.7 28.2 8.6 18.1 5.6 98.2 30.1 325.9 100.0
註釋: 比重數字是以未經進位數字計算。 Notes : Share figures are derived from unrounded figures.
§ 表示數字在正負 5 千萬之間。 § Denotes figure within ±0.05 billion.

香港統計月刊 二零零三年六月 FC9 Hong Kong Monthly Digest of Statistics June 2003
表三 按主要來源地及主要服務組別劃分的香港服務輸入 Table 3 Hong Kong’s imports of services by main source and major service group
中國內地 The mainland
of China
美國 United States of America
日本 Japan
英國
United Kingdom
澳大利亞 Australia
其他地區
Other places
所有來源地 All sources
年
Year
十億港元 HK$
billion
比重 Share
(%)
十億港元 HK$
billion
比重 Share
(%)
十億港元
HK$ billion
比重
Share (%)
十億港元
HK$ billion
比重
Share (%)
十億港元
HK$ billion
比重
Share (%)
十億港元 HK$
billion
比重 Share
(%)
十億港元
HK$ billion
比重
Share (%)
運輸 Transportation
1997 9.6 19.1 9.2 18.3 6.2 12.4 2.3 4.5 2.1 4.1 20.9 41.6 50.2 100.01998 8.3 19.5 6.6 15.4 4.7 11.0 2.2 5.2 2.7 6.3 18.3 42.7 42.9 100.01999 10.3 26.3 7.0 18.0 3.0 7.7 1.7 4.4 2.0 5.2 15.1 38.4 39.2 100.02000 11.1 22.9 8.3 17.1 4.4 9.0 2.8 5.9 2.3 4.8 19.6 40.4 48.6 100.02001 12.4 24.4 8.2 16.2 4.3 8.3 3.2 6.3 2.4 4.7 20.4 40.1 50.9 100.0
旅遊 Travel
1997 39.6 40.3 9.1 9.3 5.1 5.2 6.7 6.9 6.1 6.2 31.5 32.1 98.2 100.01998 42.5 40.7 9.2 8.8 6.0 5.7 6.6 6.3 6.5 6.2 33.7 32.3 104.4 100.01999 41.6 40.8 9.8 9.6 5.0 4.9 6.1 6.0 6.8 6.7 32.7 32.0 101.9 100.02000 36.4 37.4 10.0 10.3 5.0 5.1 6.3 6.5 7.5 7.7 32.2 33.0 97.4 100.02001 34.5 36.0 10.6 11.0 5.1 5.3 5.8 6.1 8.2 8.5 31.8 33.1 96.1 100.0
保險服務 Insurance services
1997 0.4 8.6 2.2 48.5 0.5 10.1 0.2 4.9 § 1.0 1.2 26.9 4.5 100.01998 § 0.8 1.8 39.3 0.3 6.6 1.4 31.4 § 0.7 1.0 21.2 4.6 100.01999 § -0.4 2.4 48.2 0.3 7.0 0.9 18.0 § 1.0 1.3 26.3 5.0 100.02000 -0.1 -3.4 2.4 59.1 0.3 7.9 0.6 13.6 § 0.7 0.9 22.2 4.1 100.02001 0.2 5.6 2.1 53.0 0.3 6.3 0.5 13.6 § 0.9 0.8 20.5 4.0 100.0
金融服務 Financial services
1997 § 0.7 1.0 17.8 0.8 14.2 0.7 12.4 0.1 2.1 3.1 52.8 5.8 100.01998 0.1 2.2 1.9 28.0 1.5 21.6 0.3 5.2 0.1 1.9 2.8 41.2 6.7 100.01999 0.2 3.1 1.2 21.8 0.8 14.5 0.4 7.6 § 0.5 3.0 52.5 5.7 100.02000 0.2 3.3 1.3 23.7 1.0 18.5 0.5 9.6 0.1 1.0 2.4 44.0 5.5 100.02001 0.1 2.6 1.5 28.9 0.7 13.1 0.6 10.9 § 0.4 2.3 44.0 5.2 100.0
商貿服務及其他與貿易相關的服務 Merchanting and other trade-related services
1997 3.3 33.2 1.4 14.6 0.6 5.8 0.1 1.3 § 0.5 4.4 44.6 9.9 100.01998 3.7 43.3 1.1 12.7 0.5 5.8 0.2 1.9 § 0.3 3.1 36.0 8.5 100.01999 3.5 33.6 0.9 8.3 0.6 5.7 0.3 2.5 § 0.4 5.2 49.4 10.5 100.02000 4.7 42.3 1.3 11.3 0.7 6.4 0.3 2.9 0.1 0.5 4.1 36.6 11.2 100.02001 5.5 46.5 1.4 11.5 0.9 7.8 0.2 1.5 § 0.3 3.8 32.4 11.8 100.0
其他服務 Other services
1997 8.2 29.5 7.5 27.1 1.4 5.0 2.2 7.8 0.9 3.1 7.6 27.4 27.8 100.01998 7.2 27.3 5.8 22.0 1.3 4.9 1.6 6.0 0.9 3.3 9.7 36.5 26.5 100.01999 6.6 30.5 4.6 21.2 1.4 6.6 1.3 5.8 0.8 3.7 7.0 32.3 21.7 100.02000 7.1 28.7 6.8 27.5 1.8 7.2 1.6 6.4 0.6 2.6 6.8 27.6 24.7 100.02001 6.8 27.9 6.4 26.2 1.7 7.2 1.5 6.1 0.6 2.4 7.4 30.3 24.4 100.0
所有服務 All services
1997 61.1 31.1 30.5 15.5 14.6 7.4 12.3 6.2 9.2 4.7 68.7 35.0 196.4 100.01998 61.9 32.0 26.4 13.6 14.3 7.4 12.3 6.4 10.2 5.3 68.5 35.4 193.6 100.01999 62.2 33.8 25.9 14.1 11.2 6.1 10.7 5.8 9.8 5.3 64.2 34.9 184.1 100.02000 59.4 31.0 30.1 15.7 13.2 6.9 12.2 6.4 10.6 5.5 66.1 34.5 191.5 100.02001 59.6 31.0 30.2 15.7 13.0 6.7 11.8 6.1 11.3 5.9 66.5 34.6 192.5 100.0
註釋: 比重數字是以未經進位數字計算。
§ 表示數字在正負 5 千萬之間。
Notes : Share figures are derived from unrounded figures. § Denotes figure within ±0.05 billion.

香港統計月刊 二零零三年六月 FC10 Hong Kong Monthly Digest of Statistics June 2003
表四 按主要目的地劃分與離岸貿易有關的香港服務輸出 Table 4 Hong Kong’s exports of services relating to offshore trade by main
destination
商貿服務
Merchanting
貨物銷售價值 Sales of goods
(a)
毛利 Gross margin
(b)
與離岸交易有關的 商品服務所賺取的佣金
Commission from merchandising services for offshore transactions
(c)
與離岸貿易有關 的服務輸出總額
Total exports of services relating to offshore trade
(d) = (b) + (c)
目的地
Destination
年 Year
十億港元
HK$ billion
比重 Share
(%)
按年 變動
百分率
Year- on-year
% change
十億港元
HK$billion
比重
Share (%)
按年
變動
百分率
Year-on-year
% change
十億港元
HK$billion
比重
Share (%)
按年 變動
百分率
Year- on-year
% change
十億港元
HK$ billion
比重
Share (%)
按年
變動
百分率
Year-on-year
% change
中國內地 2000 343.4 41.6 - 25.3 35.8 - 1.4 9.8 - 26.7 31.5 -The mainland 2001 356.9 40.3 3.9 30.0 37.8 18.8 1.4 11.0 1.2 31.4 34.2 17.9of China
美國 2000 133.7 16.2 - 16.6 23.5 - 5.9 42.7 - 22.6 26.7 -United States of 2001 164.4 18.6 23.0 18.8 23.7 13.2 5.6 45.1 -5.1 24.4 26.6 8.4America
日本 2000 63.6 7.7 - 5.7 8.0 - 0.8 5.7 - 6.4 7.6 -Japan 2001 62.0 7.0 -2.5 5.8 7.2 1.6 0.5 4.4 -30.1 6.3 6.9 -2.3
德國 2000 24.8 3.0 - 2.3 3.2 - 0.9 6.2 - 3.1 3.7 -Germany 2001 24.9 2.8 0.3 2.5 3.1 8.7 0.6 4.7 -31.0 3.1 3.4 -2.1
英國 2000 28.6 3.5 - 2.6 3.6 - 0.4 3.0 - 3.0 3.5 -United Kingdom 2001 29.3 3.3 2.3 2.7 3.4 5.2 0.2 1.7 -48.0 2.9 3.2 -2.4
其他 2000 231.5 28.0 - 18.3 25.9 - 4.5 32.6 - 22.8 27.0 -Others 2001 248.0 28.0 7.1 19.7 24.8 7.5 4.1 33.0 -8.6 23.8 25.9 4.3
所有目的地 2000 825.7 100.0 - 70.7 100.0 - 13.9 100.0 - 84.6 100.0 -All destinations 2001 885.5 100.0 7.2 79.4 100.0 12.4 12.5 100.0 -9.9 92.0 100.0 8.7
註釋: 比重及按年變動百分率數字是以未經進位數字計算。 Note : Share and year-on-year % change figures are derived from unrounded figures.

香港統計月刊 二零零三年六月 FC11 Hong Kong Monthly Digest of Statistics June 2003
表五 香港服務貿易在全球服務貿易所佔的比重(1) Table 5 Percentage shares of Hong Kong’s trade in services in the trade in services
of the world(1)
香港
Hong Kong 服務貿易 Trade in services
年
Year 全球排名
Ranking in the world
(1)
十億港元 HK$ billion
相對全球比重
Share in the world(%)
(1)
(a) 服務輸出 1997 9 291.1 2.9 Exports of services 1998 10 272.1 2.7 1999 10 279.2 2.7 2000 10 317.6 2.8 2001 10 325.9 2.9 (b) 服務輸入 1997 15 196.4 1.8 Imports of services 1998 14 193.6 2.0 1999 15 184.1 1.8 2000 16 191.5 1.8 2001 15 192.5 1.7 (c) = (a) + (b) 1997 11 487.5 2.3 服務貿易總和 Total sum of trade 1998 11 465.7 2.3
in services 1999 11 463.2 2.2 2000 11 509.1 2.3 2001 12 518.3 2.3
註釋:(1) 全球排名及比重數字是根據國際貿易組織出
版的《二零零二年國際貿易統計數字》中的統
計數字計算所得。
Note : (1) Ranking and share figures in the world are derived based on statistics published in the “International Trade Statistics 2002” of World Trade Organization.


香港統計月刊 二零零三年六月 FL1 Hong Kong Monthly Digest of Statistics June 2003
二零零三年一月至六月刊載的專題文章目錄
List of Feature Articles Published during January to June 2003
月份 文章題目 Month Title of Article1 (i) 對外直接投資統計 1 (i) External direct investment statistics
(ii) 一九九三至二零零二年中層經理級與專業僱員薪
金統計數字
(ii) Salary statistics of middle-level managerial and professionalemployees 1993-2002
(iii) 一九九一至二零零一年的香港專利統計數字 (iii) Patent statistics for Hong Kong, 1991-2001(iv) 勞動人口推算 2002-2021 (iv) Labour force projections for 2002-2021
2 (i) 從事製造業相關活動的貿易公司 2 (i) Trading firms with manufacturing-related activities(ii) 服務業的生產者價格指數 (ii) Producer price indices of service industries(iii) 電子產品及電子行業統計數字 (iii) Statistics on electronic products and the electronics industry
3 (i) 經季節性調整的消費物價指數 3 (i) Seasonally adjusted Consumer Price Indices(ii) 香港水務概覽 (ii) An overview of water supplies in Hong Kong(iii) 一九八一年至二零零二年職位空缺統計數字 (iii) Statistics on job vacancies from 1981 to 2002(iv) 一九九八至二零零一年香港的研究及發展統計數
字
(iv) Research and development statistics of Hong Kong, 1998-2001
4 (i) 二零零二年就業綜合估計數字 4 (i) Composite employment estimates 2002(ii) 一九九三至二零零二年綜合社會保障援助計劃的
統計數字
(ii) Statistics on comprehensive social security assistancescheme, 1993-2002
(iii) 二零零二年失業率的走勢 (iii) The movement of the unemployment rate in 2002(iv) 二零零二年香港的中醫藥業 (iv) The Chinese medicine sector in Hong Kong, 2002
5 (i) 香港進口貿易分析 5 (i) Analysis of Hong Kong’s imports(ii) 本港居民到中國內地旅行的消費開支 (ii) Consumption expenditure of Hong Kong residents travelling to
the mainland of China(iii) 一九九二至二零零二年香港的高科技產品貿易 (iii) Trade in high technology products in Hong Kong, 1992-2002(iv) 一九九八/九九至二零零二/零三年幼稚園學
費統計
(iv) Statistics on school fees of kindergartens, 1998/99-2002/03
6 (i) 二零零二年按區議會分區劃分的香港人口概況剖
析
5 (i) A profile of Hong Kong population analysed by District CouncilDistrict, 2002
(ii) 香港的資訊科技及電訊業 (ii) The information technology and telecommunications sector inHong Kong
(iii) 香港服務貿易的發展 (iii) Development of trade in services of Hong Kong


A1
二零零三年七月至十月
政府統計處定期性統計數據發布日期一覽表
Schedule for Issuing Regular Releases of Statistical Data bythe Census and Statistics Department, July - October 2003
每年九月底,本處會向傳媒公布翌年定期性統計數據新聞發布的詳細時間表。本附錄載列
未來四個月的發布日期。數據於發布日期下午四時十五分向傳媒公布。有關的新聞公布於
稍後時間列載於政府統計處的網站上,網址是 http://www.info.gov.hk/censtatd/ 。發布日期
下午四時十五分後致電本處,亦可查詢有關統計數據。
The date schedule for issuing regular press releases of statistical data in the ensuing year is issuedto the mass media in end September of each year. This Annex gives the schedule for the comingfour months. Data are issued to the media at 4:15 p.m. on the date of release. The pressreleases are posted shortly afterwards on the Department’s website (Address-http://www.info.gov.hk/censtatd/ ). Telephone enquiries may also be made to the Departmentafter 4:15 p.m. on the release date.
統計數據
Statistical Data發布日期(日/月/年)
Release Date(Day/Month/Year)
人口統計
Population Statistics1. 二零零三年年中人口數字 Mid-year Population for 2003 14.08.2003
查詢電話
Enquiry Telephone Number 2716 8044
勞工統計Labour Statistics1. 失業及就業不足統計 Unemployment and Underemployment Statistics
‧二零零三年四月至六月 April - June 2003 17.07.2003‧二零零三年五月至七月 May - July 2003 18.08.2003‧二零零三年六月至八月 June - August 2003 18.09.2003‧二零零三年七月至九月 July - September 2003 20.10.2003
查詢電話
Enquiry Telephone Number 2887 5506
2. 就業及空缺統計 Employment and Vacancies Statistics‧二零零三年六月 June 2003 22.09.2003
查詢電話
Enquiry Telephone Number 2582 4751
3. 薪金總額及工資統計 Payroll and Wage Statistics‧二零零三年第二季 2nd Quarter 2003 26.09.2003
查詢電話
Enquiry Telephone Number 2582 4746

A2
統計數據
Statistical Data發布日期(日/月/年)
Release Date(Day/Month/Year)
對外貿易統計
External Trade Statistics
1. 對外商品貿易總計數字 External Merchandise Trade Aggregate Figures‧二零零三年六月 June 2003 25.07.2003‧二零零三年七月 July 2003 26.08.2003‧二零零三年八月 August 2003 26.09.2003‧二零零三年九月 September 2003 27.10.2003
查詢電話
Enquiry Telephone Number 2582 5041
2. 按國家/地區及貨品分析的對外商
品貿易統計
External Merchandise Trade Statistics Classified byCountry/Territory and Commodity
‧二零零三年五月 May 2003 04.07.2003‧二零零三年六月 June 2003 04.08.2003‧二零零三年七月 July 2003 04.09.2003‧二零零三年八月 August 2003 07.10.2003
查詢電話
Enquiry Telephone Number 2582 5041
3. 對外商品貿易貨量及價格統計 Volume and Price Statistics of External MerchandiseTrade
‧二零零三年五月 May 2003 24.07.2003‧二零零三年六月 June 2003 22.08.2003‧二零零三年七月 July 2003 25.09.2003‧二零零三年八月 August 2003 24.10.2003
查詢電話
Enquiry Telephone Number 2582 4914
4. 按產品所屬工業劃分的本港製造業
產品出口統計
Domestic Export Statistics Classified by IndustrialOrigin
‧二零零三年第二季 2nd Quarter 2003 11.08.2003
查詢電話
Enquiry Telephone Number 2805 6641
5. 船隻、港口貨物及貨櫃統計 Statistics on Vessels, Port Cargo and Containers‧二零零三年第二季 2nd Quarter 2003 09.09.2003
查詢電話
Enquiry Telephone Number 2582 4889
6. 涉及外發中國內地加工貿易統計 Statistics on Trade Involving Outward Processing inthe Mainland of China
‧二零零三年第二季 2nd Quarter 2003 23.09.2003
查詢電話
Enquiry Telephone Number 2565 7446

A3
統計數據
Statistical Data發布日期(日/月/年)Release Date(Day/Month/Year)
對外貿易統計(續)External Trade Statistics (Cont'd.)7. 按運輸方式分析的對外商品貿易統計 Analysis of External Merchandise Trade Statistics by
Mode of Transport‧二零零三年上半年 First half of 2003 07.08.2003
查詢電話
Enquiry Telephone Number 2582 5041
物價統計
Price Statistics1. 消費物價指數 Consumer Price Index
‧二零零三年六月 June 2003 22.07.2003‧二零零三年七月 July 2003 21.08.2003‧二零零三年八月 August 2003 23.09.2003‧二零零三年九月 September 2003 23.10.2003
查詢電話
Enquiry Telephone Number 2805 6401
國民收入及國際收支平衡統計
National Income and Balance of Payments Statistics
1. 本地生產總值 Gross Domestic Product‧二零零三年第二季(1) 2nd Quarter 2003(1) 29.08.2003
查詢電話
Enquiry Telephone Number 2582 4787
註: (1) 財經事務及庫務局經濟分析部發布有關二零零三年半年經濟報告及二零零三年全年本地生產總值暨物
價預測第二次修訂的新聞稿時,二零零三年第二季本地生產總值亦於該新聞稿中發布。政府統計處不會
在當日就本地生產總值另發新聞稿。
Note : (1) The Economic Analysis Division of the Financial Services and the Treasury Bureau will issue a press releaseon the Half-yearly Economic Report 2003 and second update of GDP and prices forecasts for 2003 as a whole.The GDP for the second quarter of 2003 will also be released there. No separate press release on the GDP willbe issued by the Census and Statistics Department on that day.
2. 以固定價格計算按經濟活動劃分的
按季本地生產總值
Quarterly Constant Price Gross Domestic Product byEconomic Activity
‧二零零三年第二季 2nd Quarter 2003 26.09.2003
查詢電話
Enquiry Telephone Number 2116 5188
3. 本地居民生產總值及對外要素收益
流動數字
Gross National Product and External Factor IncomeFlows
‧二零零三年第二季 2nd Quarter 2003 19.09.2003
查詢電話
Enquiry Telephone Number 2116 5101
4. 國際收支平衡統計 Balance of Payments Statistics‧二零零三年第二季 2nd Quarter 2003 29.09.2003
查詢電話
Enquiry Telephone Number 2116 8660

A4
統計數據
Statistical Data發布日期(日/月/年)
Release Date(Day/Month/Year)
其他各類統計
Various Other Types of Statistics
1. 手頭訂單按月統計 Orders-on-hand Statistics‧二零零三年五月 May 2003 04.07.2003‧二零零三年六月 June 2003 04.08.2003‧二零零三年七月 July 2003 04.09.2003‧二零零三年八月 August 2003 02.10.2003
查詢電話
Enquiry Telephone Number 2582 5041
2. 零售業銷貨額統計 Retail Sales Statistics‧二零零三年五月 May 2003 07.07.2003‧二零零三年六月 June 2003 07.08.2003‧二零零三年七月 July 2003 08.09.2003‧二零零三年八月 August 2003 07.10.2003
查詢電話
Enquiry Telephone Number 2802 1367
3. 工業生產指數和製造業生產者
價格指數
Quarterly Index of Industrial Production andQuarterly Producer Price Indices for ManufacturingIndustries
‧二零零三年第二季 2nd Quarter 2003 19.09.2003
查詢電話
Enquiry Telephone Number 2805 6641
4. 建造工程完成量統計 Construction Output Statistics‧二零零三年第二季 2nd Quarter 2003 18.09.2003
查詢電話
Enquiry Telephone Number 2805 6424
5. 食肆的收入及購貨額統計 Restaurant Receipts and Purchases Statistics‧二零零三年第二季 2nd Quarter 2003 15.08.2003
查詢電話
Enquiry Telephone Number 2802 1367
6. 服務行業按季業務收益指數 Quarterly Business Receipts Indices for ServiceIndustries
‧二零零三年第二季 2nd Quarter 2003 19.09.2003
查詢電話
Enquiry Telephone Number 2802 1269

政府統計處刊物及唯讀光碟產品一覽 (截至二零零三年六月一日)List of Publications and CD-ROM Products of the Census and Statistics Department (as at 1.6.2003)
A5
名稱 Title
售價不包括
郵費(港元)Price NotIncluding
Postage (HK$)
售價連本地
郵費(港元)Price
Including LocalPostage (HK$)
(一) 刊物 (A) Publications綜合性統計刊物 General Statistical Digests香港經濟趨勢 (半月刊) Hong Kong Economic Trends (half-monthly) 13.0 16.0香港統計月刊 ** Hong Kong Monthly Digest of Statistics ** 60.0 76.5香港統計年刊,二零零二年版 Hong Kong Annual Digest of Statistics, 2002 Edition 72.0 100.0香港社會及經濟趨勢,二零零一年版 (雙年刊) Hong Kong Social and Economic Trends, 2001 Edition (biennial) 84.0 100.4香港統計數字一覽,二○○三年版 (年刊) ++ Hong Kong in Figures, 2003 Edition (annual) ++ 免費 Free -
對外貿易 External Trade商品貿易統計 Merchandise Trade Statistics香港商品貿易統計: Hong Kong Merchandise Trade Statistics :
進口 (月刊) Imports (monthly) 208.0 236.0港產品出口及轉口 (月刊) Domestic Exports and Re-exports (monthly) 208.0 236.0二零零二年周年附刊,按國家及貨品劃分: Annual Supplement 2002, Country by Commodity :
- 進口 - Imports 198.0 226.0- 港產品出口及轉口 - Domestic Exports and Re-exports 198.0 245.0
上述商品貿易統計刊物亦備電腦輸出縮微膠片
(COM)+:
The above merchandise trade statistics publications are also availablein Computer Output Microfiche (COM) +:
進口 (月刊) Imports (monthly) 52.5 ##港產品出口 (月刊) Domestic Exports (monthly) 33.0 ##轉口 (月刊) Re-exports (monthly) 70.0 ##周年附刊 Annual Supplement
- 進口 - Imports 93.5 ##- 港產品出口 - Domestic Exports 70.5 ##- 轉口 - Re-exports 146.5 ##
香港對外商品貿易 (月刊) Hong Kong External Merchandise Trade (monthly) 55.0 71.5二零零二年香港對外商品貿易回顧 (年刊) Annual Review of Hong Kong External Merchandise Trade 2002
(annual)56.0 64.2
香港商品貿易指數 (月刊) Hong Kong Merchandise Trade Index Numbers (monthly) 13.0 17.0對外商品貿易數字 (月刊) External Merchandise Trade Figures (monthly) 免費 Free -按產品所屬工業劃分的本港製造業產品出口
統計數字 (季刊)Domestic Exports of Manufactured Goods Classified by Industrial
Origin (quarterly)免費 Free -
船務統計 Shipping Statistics香港船務統計 (季刊) Hong Kong Shipping Statistics (quarterly) 42.0 50.5服務貿易統計 Trade in Services Statistics二零零一年香港服務貿易統計報告 (年刊) Report on Hong Kong Trade in Services Statistics for 2001 (annual) 30.0 34.4
國民收入 National Income本地生產總值 (季刊) Gross Domestic Product (quarterly) 30.0 34.5二○○二年本地生產總值 (年刊) ++ 2002 Gross Domestic Product (annual) ++ 47.0 55.2本地生產總值特刊,二零零二年八月 (特刊) Special Report on Gross Domestic Product, August 2002 (ad hoc) 46.0 54.2
國際收支平衡 Balance of Payments香港國際收支平衡統計
一九九七年至一九九九年 (特刊)Balance of Payments Statistics of Hong Kong
1997 to 1999 (ad hoc)14.0 18.0
香港國際收支平衡統計 (季刊) Balance of Payments Statistics of Hong Kong (quarterly) 23.0 27.0
勞工 Labour勞動人口、就業及空缺統計 Labour Force, Employment and Vacancy Statistics綜合住戶統計調查按季統計報告書 Quarterly Report on General Household Survey 40.0 48.5就業及空缺按季統計報告 Quarterly Report of Employment and Vacancies Statistics 30.0 34.5建築地盤就業及空缺按季統計報告 Quarterly Report of Employment and Vacancies at
Construction Sites21.0 25.0
就業及空缺統計(詳細統計表) (年刊): Employment and Vacancies Statistics (Detailed Tables) (annual):甲系列 (服務業),2002 Series A (Services Sectors), 2002 67.0 83.4乙系列 (批發、零售、飲食及酒店業),2002 Series B (Wholesale and Retail Trades, Restaurants and Hotels),
200232.0 36.4
丙系列 (工業),2002 Series C (Industrial Sectors), 2002 80.0 96.4丁系列 (進出口貿易業),2002 Series D (Import/Export Trades), 2002 30.0 34.0

政府統計處刊物及唯讀光碟產品一覽 (截至二零零三年六月一日)List of Publications and CD-ROM Products of the Census and Statistics Department (as at 1.6.2003)
A6
名稱 Title
售價不包括
郵費(港元)Price NotIncluding
Postage (HK$)
售價連本地
郵費(港元)Price
Including LocalPostage (HK$)
(一) 刊物 (續) (A) Publications (Cont'd.)勞工(續) Labour (Cont'd.)工資及勞工收入統計 Wages and Labour Earnings Statistics工資及薪金總額按季統計報告 Quarterly Report of Wage and Payroll Statistics 32.0 40.5二零零二年經理級與專業僱員薪金及
僱員福利統計報告
(高層管理人員除外) (年刊)
2002 Report of Salaries and Employee Benefits StatisticsManagerial and Professional Employees(Excluding Top Management) (annual)
22.0 26.4
僱用於政府建築工程的工人每日平均工資 (月刊) Average Daily Wages of Workers Engaged inGovernment Building and Construction Projects (monthly)
免費 Free -
人力統計 Manpower Statistics二零零零年人力培訓及工作技能需求機構單位
統計調查報告 (特刊)Report on 2000 Establishment Survey on Manpower
Training and Job Skills Requirements (ad hoc)50.0 58.2
消費物價及住戶開支 Consumer Prices and Household Expenditure
消費物價指數月報 Monthly Report on the Consumer Price Index 35.0 39.5二零零二年消費物價指數年報 Annual Report on the Consumer Price Index 2002 36.0 44.2一九九九至二零零零年住戶開支統計調查
及重訂消費物價指數基期 (特刊)1999/2000 Household Expenditure Survey and the Rebasing
of the Consumer Price Indices (ad hoc)28.0 36.2
工商業 Commerce and Industry工業生產 Industrial Production二零零一年工業生產按年統計調查報告 Report on 2001 Annual Survey of Industrial Production 48.0 56.2工業生產按季指數 Quarterly Index of Industrial Production 9.0 12.0製造業按季生產者價格指數 Quarterly Producer Price Indices for Manufacturing Industries 8.0 11.0紡織業生產按季統計數字 Quarterly Textile Production Statistics 2.0 4.5經銷及服務業 Distribution and Services二零零一年批發、零售、進口與出口貿易、
食肆及酒店按年統計調查報告
Report on 2001 Annual Survey of Wholesale, Retail andImport and Export Trades, Restaurants and Hotels
44.0 52.2
食肆的收入及購貨額按季統計調查報告 Report on Quarterly Survey of Restaurant Receiptsand Purchases
5.0 8.0
零售業銷貨額按月統計調查報告 Report on Monthly Survey of Retail Sales 8.0 11.0二零零一年運輸及有關服務按年統計調查報告 Report on 2001 Annual Survey of Transport and Related Services 34.0 38.0二零零一年倉庫、通訊、財務、保險及
商用服務按年統計調查報告
Report on 2001 Annual Survey of Storage, Communication,Financing, Insurance and Business Services
34.0 42.2
服務行業按季業務收益指數 Quarterly Business Receipts Indices for Service Industries 6.0 9.0服務業統計摘要,二零零二年版 (年刊) Statistical Digest of the Services Sector, 2002 Edition (annual) 96.0 112.4服務業統計摘要按季補充資料 Quarterly Supplement to Statistical Digest of the Services Sector 68.0 77.0屋宇建築及建造 Building and Construction二零零一年屋宇建築、建造及地產業按
年統計調查報告Report on 2001 Annual Survey of Building, Construction
and Real Estate Sectors32.0 36.4
建造工程完成量按季統計調查報告 Report on the Quarterly Survey of Construction Output 11.0 15.0特選建築材料平均批發價格 (月刊) Average Wholesale Prices of Selected Building Materials (monthly) 免費 Free -政府合約的工資及材料成本指數 (月刊) Index Numbers of the Costs of Labour and Selected
Materials Used in Government Contracts (monthly)免費 Free -
公營建築工程的工資及材料成本指數 (月刊) Index Numbers of the Costs of Labour and Materials Usedin Public Sector Construction Projects (monthly)
免費 Free -
能源 Energy香港能源統計 (季刊) Hong Kong Energy Statistics (quarterly) 19.0 23.0香港能源統計,二零零二年版 Hong Kong Energy Statistics, 2002 Edition 24.0 28.0其他經濟及工商業統計 Other Economic and Business Statistics業務展望按季統計調查報告 Report on Quarterly Business Tendency Survey 9.0 12.0手頭訂單按月統計調查 Monthly Survey of Orders-on-hand 8.0 11.0二零零一年香港對外直接投資統計 (年刊) External Direct Investment Statistics of Hong Kong 2001 (annual) 24.0 28.0二零零二年海外公司駐香港的地區代表
按年統計調查報告 (年刊)Report on 2002 Annual Survey of Regional Offices Representing
Overseas Companies in Hong Kong (annual)26.0 30.0
二零零二年資訊科技在工商業的使用情況和普及程度按年統計調查報告 (年刊)
Report on 2002 Annual Survey on Information TechnologyUsage and Penetration in the Business Sector (annual)
68.0 76.2
二零零一年工商業創新活動按年統計調查
報告 (年刊)Report on 2001 Annual Survey of Innovation Activities
in the Business Sector (annual)32.0 40.2
香港-資訊社會,二零零二年版 (特刊) Hong Kong as an Information Society, 2002 Edition (ad hoc) 42.0 50.2

政府統計處刊物及唯讀光碟產品一覽 (截至二零零三年六月一日)List of Publications and CD-ROM Products of the Census and Statistics Department (as at 1.6.2003)
A7
名稱 Title
售價不包括
郵費(港元)Price NotIncluding
Postage (HK$)
售價連本地
郵費(港元)Price
Including LocalPostage (HK$)
(一) 刊物 (續) (A) Publications (Cont'd.)人口 Population香港二零零一年人口普查 Hong Kong 2001 Population Census二零零一年人口普查 (特刊) 2001 Population Census (ad hoc)
簡要報告 Summary Results 38.0 46.2主要報告-第一冊 Main Report - Volume I 84.0 100.4主要報告-第二冊 Main Report - Volume II 66.0 82.4主要統計表 Main Tables 70.0 86.4統計圖解 Graphic Guide 30.0 38.2有關各區議會分區的基本統計表 Basic Tables for District Council Districts 34.0 42.2有關香港島各選區的基本統計表 Basic Tables for Constituency Areas : Hong Kong Island 40.0 56.4有關九龍各選區的基本統計表 Basic Tables for Constituency Areas : Kowloon 48.0 64.4有關新界各選區的基本統計表 Basic Tables for Constituency Areas : New Territories 74.0 102.0區議會分區及選區統計表的附件-
區域分界地圖Boundary Maps Complementary to Tables for District
Council Districts and Constituency Areas122.0 150.0
有關各規劃統計小區的基本統計表 Basic Tables for Tertiary Planning Units 82.0 110.0規劃統計小區統計表的附件-區域分界地圖 Boundary Maps Complementary to Tables for Tertiary Planning
Units42.0 50.2
主題性報告-青年 Thematic Report - Youths 36.0 44.2主題性報告-女性及男性 Thematic Report - Women and Men 40.0 48.2主題性報告-長者 Thematic Report - Older Persons 36.0 44.2主題性報告-少數族裔人士 Thematic Report - Ethnic Minorities 44.0 52.2主題性報告-內地來港定居未足七年人士 Thematic Report - Persons from the Mainland Having Resided in
Hong Kong for Less Than 7 Years38.0 46.2
主題性報告-單親人士 Thematic Report - Single Parents 36.0 44.2
其他與人口有關的刊物 Other Publications relating to Population香港人口推算 2002-2031 (特刊) Hong Kong Population Projections 2002-2031 (ad hoc) 12.0 16.4香港人口生命表 1996-2031 (特刊) Hong Kong Life Tables 1996-2031 (ad hoc) 20.0 24.4香港人口趨勢 1981-2001 (特刊) Demographic Trends in Hong Kong 1981-2001 (ad hoc) 28.0 36.2
社會資料 Social Data從綜合住戶統計調查搜集所得的社會資料 Social Data Collected via the General Household Survey
第三十三號專題報告書 (特刊):臨時僱員就業情況
從事部分時間制工作僱員的就業情況在中國內地工作的香港居民
Special Topics Report No. 33 (ad hoc):Casual employmentPart-time employmentHong Kong residents working in the mainland of China
45.0 53.2
主題性住戶統計調查第十一號報告書 (特刊): Thematic Household Survey Report No. 11 (ad hoc): 36.0 40.4受供養父母的特徵 Characteristics of Dependent Parents對改善居所的冀望 Aspiration for Improvement in Accommodation居所按揭利息款項 Home Mortgage Interest Payment
按區議會分區劃分的人口及住戶統計資料
2002 (年刊)Population and Household Statistics Analysed by District Council
District 2002 (annual)22.0 25.7
一九九八年在香港發生的罪案及罪案事主 (特刊) Crime and Its Victims in Hong Kong in 1998 (ad hoc) 38.0 54.4香港的女性及男性 - 主要統計數字,二零零二年
版 (年刊)Women and Men in Hong Kong - Key Statistics, 2002 Edition
(annual)36.0 44.2
統計分類表 Classification Lists香港進出口貨物分類表(協調制度)
二零零二年版 (特刊)Hong Kong Imports and Exports Classification List
(Harmonized System) 2002 Edition (ad hoc)第一冊:第一至第十類貨物 Volume One: Commodity Section I - X 24.0 40.4第二冊:第十一至第二十二類貨物 Volume Two: Commodity Section XI - XXII 26.0 42.4第三冊:按字母次序排列的貨物目錄 Volume Three: Alphabetical List of Articles 28.0 44.4
香港貨物名稱及編號協調制度手冊一九九二年版 (特刊) ++
Hong Kong Harmonized Commodity Description andCoding System Handbook 1992 Edition (ad hoc) ++
10.0 13.8
香港商品貿易統計分類表二零零二年版 (特刊) Hong Kong Merchandise Trade Statistics Classification 2002 Edition(ad hoc)
62.0 78.4
香港標準行業分類 (第一冊) (特刊)++ Hong Kong Standard Industrial Classification (Volume One)(ad hoc)++
135.0 163.0

政府統計處刊物及唯讀光碟產品一覽 (截至二零零三年六月一日)List of Publications and CD-ROM Products of the Census and Statistics Department (as at 1.6.2003)
A8
名稱 Title
售價不包括
郵費(港元)Price NotIncluding
Postage (HK$)
售價連本地
郵費(港元)Price
Including LocalPostage (HK$)
(一) 刊物 (續) (A) Publications (Cont'd.)
統計發展報告 Report on Statistical Development統計發展概要,二零零三年版 (年刊) An Outline of Statistical Development, 2003 Edition (annual) 44.0 52.2
(二) 唯讀光碟產品 (B) CD-ROM Products二零零一年人口普查 2001 Population Census- 統計表唯讀光碟 (非定期性產品) ++
載有372個常用統計表。有關統計表涉及的主題
廣泛,包括人口、住戶、教育、經濟、房屋、
內部遷移及人口分組等本港住戶及人口特徵。
選定統計表亦載列按區議會分區/選區及規劃
統計小區/街段劃分的統計數字。
- TAB on CD-ROM (ad hoc) ++Contains 372 commonly used statistical tables. The tables cover awide range of topics including demographic, household,education, economic, housing, internal migration and homemoving, and population sub-group characteristics of thehouseholds and population in Hong Kong. There are alsogeographical breakdown of the statistics by District CouncilDistrict/Constituency Area and Tertiary Planning Unit/StreetBlock in selected tables.
1,690.0 1,711.2
- 地圖唯讀光碟 (非定期性產品)以常用的格式提供一套數碼化的香港地圖,內
載的地域分界數碼地圖包括香港海岸線、區議
會分區/選區分界、規劃統計小區 (及其合併
組) 分界、街段-小合併組分界及新市鎮分
界。配合適當的電腦軟件,這套數碼地圖可把
載於《二零零一年人口普查-統計表唯讀光碟》
內的統計數據作地理顯示之用。
- MAP on CD-ROM (ad hoc)Contains a set of digital maps of Hong Kong in commonly usedformats. The digital maps for geographical delineation includedtherein are Coastline of Hong Kong, District CouncilDistrict/Constituency Area Boundary, Tertiary Planning Unit (andGroupings) Boundary, Small Street Block Group Boundary andNew Town Boundary. When used with suitable computersoftware, the digital maps can be used for geographicalpresentation of the statistical data contained in the 2001Population Census - TAB on CD-ROM.
840.0 857.0
關於購買以上兩套光碟事宜,請致電普查資料
組 (電話:(852) 2716 8025)。Please call the Census Data Section at (852) 2716 8025 formatters relating to the purchase of the above two sets of CD-ROM.
- 普查易2001 (非定期性產品)普查易2001人口普查光碟套裝是一套功能強大
的知識為本產品,它能幫助使用者有效地進行
客戶資訊分析和客戶關係管理的工作。普查易
2001光碟內載有超過400個由政府統計處提供
的香港二零零一年人口普查統計表,分區數碼
地圖及功能超卓的地理訊息系統,當中包含了
全香港居民的人口特徵、經濟、教育、住戶、
房屋等統計數據,使用者可以透過簡單和容易
使用的功能介面,來選擇和提取資料。
- Hong Kong CensusPro 2001 (ad hoc)CensusPro 2001 GIS CD-ROM Package is a powerfulknowledge-based product that enables users to perform customerprofiling and Customer Relationship Management (CRM) easilyand efficiently. CensusPro 2001 includes over 400 statisticaltables of the Hong Kong 2001 Population Census provided by theCensus and Statistics Department, digital boundary maps, and thesuperb Geographical Information System (GIS) functions andfeatures. Statistical data on the demographic, economic,education, household and housing characteristics of thepopulation are included and can be easily selected and retrievedthrough intuitive and easy-to-use application interface.
普查易2001共有4種資料輸出模式:主題性地
圖、預設格式報表、統計圖表、及檔案匯出 (支援數據庫/試算表/純文字等格式)。普查易2001光碟可應用於規劃業務策略、直接市場推廣或
宣傳、客戶資料分析、以及作其他的商業性分
析等。
CensusPro 2001 provides output in mainly 4 ways: thematicmaps, formatted reports, bar/pie charts, and export files indbf/Excel files/text files. CensusPro 2001 can be used in areaslike strategic business/service planning, direct marketing andpromotion, customer analysis and profiling, and many otherbusiness analysis purposes and applications.
))))))))))))))))))
這光碟產品由Info Mapping(Hong Kong) Limited生產
及銷售。有關查詢及訂購,
請直接與該公司聯絡。
(電話:(852) 2779 6088))。
This CD-ROM is producedand marketed by the InfoMapping (Hong Kong)Limited. For enquiries andpurchase, please contact thecompany direct at (852)2779 6088.

政府統計處刊物及唯讀光碟產品一覽 (截至二零零三年六月一日)List of Publications and CD-ROM Products of the Census and Statistics Department (as at 1.6.2003)
A9
名稱 Title
售價不包括
郵費(港元)Price NotIncluding
Postage (HK$)
售價連本地
郵費(港元)Price
Including LocalPostage (HK$)
(二) 唯讀光碟產品(續) (B) CD-ROM Products (Cont’d.)
二零零一年人口普查(續) 2001 Population Census (Cont’d)- SUPERMAP Hong Kong 2001 (非定期性產品)
• 涵蓋全面的人口普查數據,配合最新數碼地
圖 作介面
• 採用具世界領導地位之地理信息系統進行處
理及分析
• 可作多重圖像化分析人口普查數據
• 有助機構進行深入的市場及客戶資訊分析
對外商品貿易
- 香港對外商品貿易唯讀光碟
列載過去二十四個月的按月貿易統計數字及過
往八年的按年貿易統計數字(按年數字只載於
周年報),並包括按貨品類別 (標準國際貿易
分類第三次修訂或協調制度)、國家/地區及運輸
方式劃分的詳細貿易統計數字。
- 香港船務統計唯讀光碟 (按季產品)列載自一九九三年以來,按運輸方式、裝運種
類、裝貨/卸貨國家/地區及港口、貨品、貨
物種類、貨物裝卸地點及與中國內地有關的轉
運劃分的貨物及載貨貨櫃吞吐量統計數字。
- SUPERMAP Hong Kong 2001 (ad hoc)• Covering comprehensive population census datasets and using
the latest digital maps as interface• Manipulation and analysis through employing world leading
Geographical Information System (GIS) technology• Multiple views of population census data• Help organizations with in-depth market analysis or customer
profiling through data linkage
External Merchandise Trade- Hong Kong External Merchandise Trade CD-ROM
Contains monthly trade data for past 24 months and annual trade datafor past 8 years (annual figures are only available in the annualedition). Detailed statistics classified by commodity (using theStandard International Trade Classification Revision 3 or theHarmonized System), by country/territory and by mode of transportare also included.
- Hong Kong Shipping Statistics CD-ROM (quarterly)Contains data back-dated to 1993 on cargo and laden containerthroughput statistics analysed by mode of transport, shipment type,country/territory and port of loading/discharge, commodity cargotype, cargo handling location and transhipment related to themainland of China.
)))))))))))))))))))))))
這些光碟產品由數碼門有
限公司生產及銷售。有關查
詢及訂購,請直接與該公司
聯絡 (電話: (852) 28110079))。
These CD-ROMs areproduced and marketed bySmartal Solutions Limited.For enquiries and purchase,please contact the companydirect at (852) 2811 0079.
註釋: 除另有註明外,所有刊物均以中、英文對照形式出版。 Notes: Unless otherwise specified, all publications are published in bilingualformat.
** 由二零零三年五月號起,《香港統計月刊》的五個選定
章節(目前只提供下載版)可在網上「香港統計數據書店」(網址 : http://www.statisticalbookstore.gov.hk)購買。有關
詳情,請瀏覽該書店內「《香港統計月刊》的選定章節」一節。
** As from the May 2003 issue, five selected sections of the Hong KongMonthly Digest of Statistics, currently available in softcopy only, canbe purchased at the online “Statistical Bookstore, Hong Kong”(Address : http://www.statisticalbookstore.gov.hk). For details,please visit the “Selected Sections of Hong Kong Monthly Digest ofStatistics (HKMDS)” section of the Bookstore.
++ 分別備有中文版和英文版。 ++ Available in separate Chinese and English versions.
+ 祇有英文版。 + Available in English version only.
## 期刊的郵費不相同,請致電政府統計處貿易統計資料發布組查詢(電話:(852) 2582 4917)。
## Postage varies among issues, please call the Trade StatisticsDissemination Section of the Census and Statistics Department at(852) 2582 4917.
所列售價及郵費日後或有修訂。外地郵費將於收到訂購要求
後另行通知。
All quoted prices and postages are subject to revision. Postage forexternal mailings will be advised upon receipt of orders.
有關政府統計處刊物及其他統計產品的最新資料和銷售途
徑,請瀏覽本處網站內「刊物及其他統計產品」一節(網址:http://www.info.gov.hk/censtatd/chinese/public/index.html)或致
電刊物出版組查詢(電話:(852) 2582 3025)。
For up-to-date information of the publications and other statisticalproducts of the Census and Statistics Department as well as their purchasechannels, please visit the "Publications and Other Statistical Products"section on the website of the department (Address:http://www.info.gov.hk/censtatd/eng/public/index.html) or call thePublications Unit of the department at (852) 2582 3025.

A10
購買政府統計處刊物
Purchase of Publications of the Census and Statistics Department
網上銷售服務 Online Purchase
互聯網用戶可在「香港統計數據書店」(網址:
http://www.statisticalbookstore.gov.hk) 網 上 購 買 刊
物,並即時付款。購買刊物的下載版可即時在網上
下載,而購買印刷版則會以郵遞送達。用戶亦可於
網上安排訂閱期刊或行將出版的刊物。除刊物外,
一些較刊物所載統計數據更詳細的統計表亦於網上
書店有售。「香港統計數據書店」與其他公共服務集
中設於「公共服務電子化」計劃(ESD)的入門網站中
(網址:http://www.esd.gov.hk)。
Internet users may purchase the publications online atthe “Statistical Bookstore, Hong Kong” (Address :http://www.statisticalbookstore.gov.hk) with paymentmade instantly. Softcopies of the publicationspurchased are available for immediate downloadingwhile hardcopies purchased will be delivered by mail.Subscription to regular publications and advanceordering of upcoming releases are also available. Apartfrom publications, softcopies of statistical tablescontaining more detailed statistics than those inpublications are also available for sale. The StatisticalBookstore is hosted on the ESD portal (Address :http://www.esd.gov.hk) together with other publicservices.
郵購服務 Mail Order Service
大部分政府統計處的刊物均附有郵購表格,供訂購
或按期訂閱刊物的印刷版。填妥的郵購表格可連同
支付所需費用和郵費的支票或匯票寄回。郵購表格
亦 可 從 政 府 統 計 處 網 站 下 載 ( 網 址 :
http://www.info.gov.hk/censtatd/chinese/service_desk/forms_index.html)。
A mail order form for ordering or arranging subscriptionto hardcopies of publications is available in mostpublications of the Census and Statistics Department.It may be completed and sent back together with acheque or bank draft covering all necessary cost andpostage. The order form is also available fordownloading from the website of the Department(Address : http://www.info.gov.hk/censtatd/eng/service_desk/forms_index.html).
銷售中心 Sales Centres
� 香港金鐘道六十六號
金鐘道政府合署低座地下
政府刊物銷售處
電話:(852) 2537 1910圖文傳真:(852) 2523 7195
� Government Publications CentreG/F Low BlockQueensway Government Offices66 Queensway, Hong KongTel. : (852) 2537 1910Fax : (852) 2523 7195
� 香港灣仔港灣道十二號
灣仔政府大樓十九樓
政府統計處刊物出版組
電話:(852) 2582 3025圖文傳真:(852) 2827 1708
� Publications UnitCensus and Statistics Department19/F Wanchai Tower12 Harbour RoadWan Chai, Hong KongTel. : (852) 2582 3025Fax : (852) 2827 1708

郵購表格(只適用於印刷版)(1)
致 : 香港花園道 請註明美利大廈4樓 刊期(月份/季/政府新聞處 期號及年份) 刊物銷售小組 本地 合計電話 : (852) 2842 8844 或 郵費 所需的
(852) 2842 8845 每本 (2) 及 (3) 合計 由 至 期數圖文傳真 : (852) 2598 7482 (港元) (港元) (港元)
(a) (b)
1. 香港統計月刊 (二零零三年期刊) 60.0 16.5 76.5 /2003 12/2003(J470003 B0)
2. 香港經濟趨勢 (二零零三年期刊) 13.0 3.0 16.0 /2003 24/2003(半月刊) (J410003 B0)
3. 香港統計年刊 (二零零二年版) 72.0 28.0 100.0 - -
(J47010200B0)
4. 香港社會及經濟趨勢 (二零零一年版) 84.0 16.4 100.4 - -
(雙年刊) (J57290100B0)
5. 二○○二年本地生產總值 47.0 8.2 55.2 - -
(年刊) (J35730200C0)
6. 統計發展概要 (二零零三年版) 44.0 8.2 52.2 - -
(年刊) (J33110300B0)
7.
8.
9.
本人現附上支票 (編號: ) 港幣 元,購買上述刊物。(註:支票應予劃線,並註明支付「香港特別行政區政府」。)
姓名 : 職銜 :
機構名稱 : 地址 :
電話 : 圖文傳真:
日期 :
註: (1)
(2)
(3)
資料,請與政府新聞處刊物銷售小組聯絡。地址:香港花園道美利大廈4樓。
售價
訂購超過一本相同名稱的年刊或非定期刊物,請向政府新聞處查詢所需本地郵費 (電話:(852) 2842 8844
外地訂購人士暫時毋須附上支票,所需郵費將於收到訂購要求後另行通知。
或 (852) 2842 8845,圖文傳真:(852) 2598 7482)。
總計(港元)
(a) x (b)
如 欲 訂 購 或 定 期 訂 閱 本 處 出 版 刊 物 的 下 載 版 , 請 到 網 上 「 香 港 統 計 數 據 書 店 」
(http://www.statisticalbookstore.gov.hk)。
�
你在表格上所提供的資料,只會用作辦理書刊訂購事宜,不會向任何和訂購無關的人士透露。如欲查看或更改所填報的
A11

Mail Order Form (Applicable to hardcopies only) (1)
To : Publications Sales Section Please indicateInformation Services Department Month/Quarter/4/F, Murray Building Issue no. and YearGarden Road Local TotalHong Kong Per postage no. ofTel. : (852) 2842 8844 or copy (2) & (3) From To issue(s)
(852) 2842 8845 (HK$) (HK$) requiredFax : (852) 2598 7482 (b)
1. Hong Kong Monthly Digest of Statistics 60.0 16.5 /2003 12/20032003 issues (J470003 B0)
2. Hong Kong Economic Trends 2003 issues 13.0 3.0 /2003 24/2003(half-monthly) (J410003 B0)
3. Hong Kong Annual Digest of Statistics 72.0 28.0 - -2002 edition (J47010200B0)
4. Hong Kong Social and Economic Trends 84.0 16.4 - -2001 edition (biennial) (J57290100B0)
5. 2002 Gross Domestic Product 47.0 8.2 - -(annual) (J35730200E0)
6. An Outline of Statistical Development 44.0 8.2 - -2003 edition (annual) (J33110300B0)
7.
8.
9.
) of HK$
Name : Title of post :
Name of organization : Address :
Tel. : Fax :
Date :
Notes: (1)
(2)
(3)
�
For an order of more than one copy of an annual or ad hoc publication with the same title, please consult the InformationServices Department about the required local postage. (Tel.: (852) 2842 8844 or (852) 2842 8845, Fax: (852) 2598 7482).
which are not involved in the processing. You may seek access to or correction of the information by addressing your request toThe information provided herein will only be used for processing your order of publications and will not be disclosed to parties
the Publications Sales Section, Information Services Department, 4/F, Murray Building, Garden Road, Hong Kong.
For ordering or arranging subscription to softcopies, please visit the online "Statistical Bookstore, Hong Kong"(http://www.statisticalbookstore.gov.hk).
76.5
16.0
Price
Total(HK$)
(a)
55.2
52.2
100.0
100.4
Totalamount(HK$)
(a) x (b)
I enclose a cheque (No. for the payment of the above
advised upon receipt of order.For mailings to addresses outside Hong Kong, please do not send in a cheque now. The required postage will be
Special Administrative Region' or 'The Government of the HKSAR'.)order. (Note : Please have the cheque crossed and made payable to 'The Government of the Hong Kong
A12

A13
訂閱表格(1)
香港統計月刊(二零零三年期刊)
Subscription Form (1)
Hong Kong Monthly Digest of Statistics (2003 Issues)
致: 香港灣仔港灣道十二號灣仔政府大樓十九樓政府統計處綜合統計組(一)乙電話:(852)2582 3025 圖文傳真:(852)2827 1708
To : General Statistics Section (1) B,Census and Statistics Department19/F., Wanchai Tower,12 Harbour Road, Wan Chai, Hong Kong.Tel. : (852) 2582 3025 Fax : (852) 2827 1708
請在適當空格(�)內加上(√ )號。Please tick (√ ) in the appropriate box (�). (港元 HK$)
刊物名稱
Title of Publication
每本
售價
Price percopy
每本
本地郵費
Local postage(2) &(3)
每本
合計
Totalprice(a)
期數
No. ofissues
(b)
總計
Totalamount(a) x (b)
�
香港統計月刊 二零零三年期刊,一月至十二月(共十二期)Hong Kong Monthly Digest of Statistics, 2003January to December 2003 (total 12 issues)
60.0 16.5 76.5 12 918.0
�
香港統計月刊 二零零三年期刊_____月至十二月(共_______期)Hong Kong Monthly Digest of Statistics, 2003__________to December, 2003 (total _________ issues)
60.0 16.5 76.5
�
合計 Total
本人現附上支票 (編號: ) 港幣 元,購買上述刊物。I enclose a cheque (No. ) of HK$ for the payment of the above order.註:支票應予劃線,並註明支付「香港特別行政區政府」。Note : Cheque should be crossed and made payable to 'The Government of the Hong Kong Special Administrative Region' or 'The
Government of the HKSAR'.)訂戶資料 Subscriber's Information姓名 Name : 機構名稱 Name of organization :
職銜 Title of post : 地址 Address :
部門 Department: 電話 Tel.:
圖文傳真 Fax : 日期 Date : 機構主要從事業務類別 Major type of business of organization:� 進出口貿易業 Import/export trade � 建造業 Construction� 零售貿易業 Retail trade � 金融、保險及地產業 Financing, insurance and real estate� 製造業 Manufacturing � 商用服務業 Business services� 教育機構 Educational institution � 社區、社會及個人服務業 Community, social and personal services� 其他,請註明 Others, please specify ____________________讀者類別 (可選多項) Type of readers (more than one choice allowed) :� 經理 Manager � 市場、推廣部人員 Marketing / promotional personnel� 分析員、研究員 Analyst / researcher � 教師、大專院校講師 Teaching staff / lecturer� 學生 Student � 其他,請註明 Others, please specify _______________訂戶類別 Type of subscriber :� 機構 Organization � 私人 Individual你是否願意收到本處推廣其他刊物的資料?Do you want to receive promotional materials of other publications of this department ?� 是 Yes � 否 No HKMDS
註:
Notes:(1) 只適用於印刷版。如欲定期訂閱下載版,請到網上「香港統計數據書店」(http://www.statisticalbookstore.gov.hk)。
Applicable to hardcopies only. For arranging subscription to softcopies, please visit the online "Statistical Bookstore, Hong Kong"(http://www.statisticalbookstore.gov.hk).
(2) 外地訂購人士暫時毋須附上支票,所需郵費將於收到訂購要求後另行通知。For mailings to addresses outside Hong Kong, please do not send in a cheque now. The required postage will be advised upon receipt of order.
(3) 訂閱超過一本相同名稱及期號的刊物,請向政府新聞處查詢所需本地郵費 (電話:(852) 2842 8844 或 (852) 2842 8845,圖文傳真:(852)2598 7482)。For arranging subscription to more than one copy per issue with the same title, please consult the Information Services Department about therequired local postage. (Tel.: (852) 2842 8844 or (852) 2842 8845, Fax: (852) 2598 7482).
你在表格上所提供的資料,只會用作辦理書刊訂購事宜,不會向任何和訂購無關的人士透露。如欲查看或更改所填報的資料,請與政府統計處的資料管理人員聯絡。地址:香港灣仔港灣道十二號灣仔政府大樓二十一樓。
The information provided herein will only be used for processing your order of publications and will not be disclosed to parties which are not involved in thesubscription of these publications. You may seek access to or correction of the information by addressing your request to the Data Controlling Officer,Census and Statistics Department, 21/F, Wanchai Tower, 12 Harbour Road, Wan Chai, Hong Kong.

A14
� 本刊物按年出版,就政府統計事務體系(由政府統計處及設於各政府部門及局的統計組構成)的工作和最新發展,作出報告。
� 刊物就多個市民關心的社會或經濟範疇,詳盡報道有關的統計發展,涵蓋的領域包括:
� 人口
� 勞工
� 工商業
� 物價及住戶開支
� 對外貿易
� 國民收入及國際收支平衡
� 貨幣、銀行、金融
� 策略性規劃
� 教育
� 房屋
� 生
� 社會福利
� 治安
� 運輸
� 社區資訊
� 食物及環境生
� 康樂及文化事務
� 水務
� 環境
� 專題研究
� This publication is published annually to provide anupdated account of the work and the development of theGovernment Statistical Service (GSS), which comprisesthe Census and Statistics Department (C&SD) andstatistical units in various government departments andbureaux.
� Details are given on recent statistical development in anumber of economic and social areas of interest to thepublic, including :• Population• Labour• Commerce and Industry• Prices and Household Expenditure• External Trade• National Income and Balance of Payments• Money, Banking and Finance• Strategic Planning• Education• Housing• Health• Social Welfare• Law and Order• Transport• Community Information• Food and Environmental Hygiene• Leisure and Cultural Services• Water Supplies• The Environment• Topical Studies
有關刊物的銷售途徑,請參閱本月刊內第 A10 頁。此外,刊物的郵購表格亦刊載於第 A11 頁。
For the purchase channels of the publication, please see page A10 of this Digest. A mail order form is alsoavailable on page A12 for ordering the publication.
統計發展概要(二零零三年版)An Outline of Statistical Development (2003 Edition)
備有印刷版及下載版每本售價 $44現已發售!
Available in bothhardcopy and softcopy
at $44 per issue!

A15
港口貨物、貨櫃吞吐量及船隻統計
刊載於香港船務統計
Statistics on Port Cargo and Container Throughputand Vessel Movement
are covered in Hong Kong Shipping Statistics
有關刊物的銷售途徑,請參閱本月刊內第 A10 頁。此外,刊物的郵購表格亦刊載於第 A16 頁。
For the purchase channels of the publication, please see page A10 of this Digest. A mail order form isalso available on page A17 for ordering the publication.
本季刊以中英文對照版印行,售價每
本$48,內容包括:
The quarterly report is available in bilingual format $48 per copy, and covers :
� 抵港船隻數目及容量 � Number and capacity of vessel arrivals
� 港口貨物/載貨貨櫃吞吐量
按以下特徵分析:
� Port cargo/laden container throughputanalysed by the following characteristics :
- 進口、出口及轉運 - Imports, exports and transhipment- 海運及河運 - Seaborne and river- 主要貨品 - Principal commodity- 主要裝貨/卸貨國家/地區及港口 - Major country/territory and port of loading
/discharge- 貨物裝卸地點 - Cargo handling location- 與中國內地有關的轉運 - Transhipment related to the mainland of China

A16
訂閱表格(1)
香港船務統計
致: 香港灣仔港灣道十二號灣仔政府大樓二十二樓
政府統計處船隻及貨運統計組
(電話:(852) 2582 4891, 傳真:(852) 2802 1192)
請在適當空格(�)內加上(√ )號。
(港元)
刊期 刊物出版日期每本售價
每本本地郵費
每本合計(a)
本數(b)
總計(a) x (b)
� 二零零三年一月至三月(J59000301B0)
二零零三年六月尾 48.0 8.5 56.5
� 二零零三年四月至六月(J59000302B0)
二零零三年九月尾 48.0 8.5 56.5
� 二零零三年七月至九月(J59000303B0)
二零零三年十二月尾 48.0 8.5 56.5
� 二零零三年十月至十二月(J59000304B0)
二零零四年三月尾 48.0 8.5 56.5
合計
本人現附上支票(編號: )港幣 元,購買上述刊物。(註:支票應予劃
線,並註明支付「香港特別行政區政府」。)
訂戶資料
姓名: 地址: 職銜: 部門: 機構名稱: 電話: 傳真: 日期:
機構主要從事業務類別:
� 船務業 � 貨運業 � 市場研究
� 進出口貿易業 � 建造業 � 金融、保險及地產業
� 製造業 � 商用服務業 � 教育機構
� 社區、社會及個人服務業 � 其他,請註明
讀者類別(可選多項) :� 經理 � 分析員、研究員 � 市場、推廣部人員
� 教師、大專院校講師 � 學生 � 其他,請註明
訂戶類別:
� 機構 � 私人
你是否願意收到本處推廣其他刊物的資料?
� 是 � 否
註 : (1) 只適用於印刷版。如欲定期訂閱下載版,請到網上「香港統計數據書店」(http://www.statisticalbookstore.gov.hk)。(2) 外地訂購人士暫時毋須附上支票,所需郵費將於收到訂購要求後另行通知。
(3) 訂閱超過一本相同期號的刊物,請向政府新聞處查詢所需本地郵費 (電話:(852) 2842 8844 或 (852) 2842 8845,圖文傳真:(852) 2598 7482)。
你在表格上所提供的資料,只會用作辦理書刊訂購事宜,不會向任何和訂購無關的人士透露。如欲查看或更
改所填報的資料,請與政府統計處的資料管理人員聯絡。地址:香港灣仔港灣道十二號灣仔政府大樓二十一
樓。

A17
Subscription Form (1)
Hong Kong Shipping Statistics
To : Shipping and Cargo Statistics Section, Census and Statistics Department22/F., Wanchai Tower, 12 Harbour Road, Wan Chai, Hong Kong(Tel. No. : (852) 2582 4891, Fax No. : (852) 2802 1192)
Please tick (√ ) in the appropriate box (�).(HK$)
IssueTo be
publishedPrice per
copyLocal
postageTotalprice(a)
No. of copies(b)
Totalamount(a) x (b)
� January to March 2003(J59000301B0)
End Jun 2003 48.0 8.5 56.5
� April to June 2003(J59000302B0)
End Sep 2003 48.0 8.5 56.5
� July to September 2003(J59000303B0)
End Dec 2003 48.0 8.5 56.5
� October to December 2003(J59000304B0)
End Mar 2004 48.0 8.5 56.5
TOTAL
I enclose a cheque (No. ) of HK$ for the payment of the above order.(Cheque should be crossed and made payable to ‘The Government of the Hong Kong Special AdministrativeRegion’ or ‘The Government of the HKSAR’.)
Subscriber’s Information
Name : Address : Title of Post : Department : Name of Tel. No. : Fax No. : Organization : Date :
Major type of business of organization :� Shipping � Forwarder � Marketing and research� Import/export trades � Construction � Financing, insurance and real estate� Manufacturing � Business services � Educational institution� Community, social and personal services� Others, please specify
Type of readers (more than one choice allowed) :� Manager � Analyst / researcher � Marketing / promotional personnel� Teaching staff / lecturer � Student � Others, please specify
Type of subscriber :� Organization � Individual
Do you want to receive promotional materials of other publications of this department?� Yes � No
Notes: (1) Applicable to hardcopies only. For arranging subscription to softcopies, please visit the online “Statistical Bookstore,Hong Kong” (http://www.statisticalbookstore.gov.hk).
(2) For mailings to addresses outside Hong Kong, please do not send in a cheque now. The required postage will beadvised upon receipt of order.
(3) For arranging subscription to more than one copy of the same issue, please consult the Information Services Departmentabout the required local postage. (Tel.: (852) 2842 8844 or (852) 2842 8845, Fax: (852) 2598 7482).
The information provided herein will only be used for processing your order of publications and will not be disclosedto parties which are not involved in the subscription of these publications. You may seek access to or correction ofthe information by addressing your request to the Data Controlling Officer, Census and Statistics Department, 21/F.,Wanchai Tower, 12 Harbour Road, Wan Chai, Hong Kong.

A18