Embed Size (px)
Citation preview
`
October 2006
Producing and Procuring Horticultural Crops with Chinese Characteristics: A Case Study in the Greater Beijing Area
Honglin Wang Michigan State University
Xiaoxia Dong
Chinese Academy of Sciences
Scott Rozelle University of California at Davis
Jikun Huang
Chinese Academy of Sciences
Thomas Reardon Michigan State University
Producing and Procuring Horticultural Crops with Chinese Characteristics:
A Case Study in the Greater Beijing Area
Abstract
The supermarket revolution has arrived in China and is spreading as fast as or
faster than anywhere in the world. As the demand for vegetables, fruit, nuts and other
high valued products has risen, urban retailers are handling increasingly more of these
high value commodities. The experience of many developing countries suggests that
there could be serious distributional impacts of the emergence of supermarkets. And, in
China, as elsewhere in the world, there is concern among policy makers and academics
that poor, small farmers might be excluded from the market for horticulture commodities.
The main goal of our paper is to understand what types of farmers have been able to
participate in the horticultural revolution, how they interact with markets and how supply
chains affect their production decisions and incomes. We also want to understand if (and
if so, then how) the rise of supermarkets have changed supply chains. Our analysis uses
spatially sampled data from 200 communities and 500 households in the Greater Beijing
area and supplemented by data collected in Shandong Province, China’s fruit and
vegetable basket. In contrast to fears of some researchers, we find small and poor farmers
have actively participate in the emergence of China’s horticulture economy. Moreover,
there has been almost no penetration of modern wholesalers or retailers into rural
communities. We also conducted surveys and interviews in wholesale markets and with
procurement agents in Beijing supermarket chains and document the fact that supply
chain shifts have only affected the downstream segments of food markets and China’s
wholesale markets (midstream in the food supply chain) are only being affected
marginally.
Keywords: Horticulture; Modern Supply Chains; Farmer Impacts; Poverty; China JEL Classification Codes: O33; O53; Q13
1
Producing and Procuring Horticultural Crops with Chinese Characteristics:
A Case Study in the Greater Beijing Area
The supermarket revolution has arrived in China and is spreading as fast as or
faster than anywhere in the world. As the demands for vegetables, fruit, nuts and other
high valued products have risen, urban retailers are finding new venues from which they
can sell to the increasingly prosperous city residents. From its start in the early 1990s,
today supermarkets have over $55 billion in sales (Hu et al., 2004). China’s
supermarkets already sell much higher levels of fresh fruits and vegetables to domestic
consumers than exporters sell into overseas markets. This development has been driven
by factors shared by other developing countries—urbanization, income growth and
liberalization of foreign direct investment in retailing—as well as a number of China-
specific policies (e.g., government investment in the sector and policies promoting
conversion of wetmarkets to supermarkets—Bi et al., 2004; Hu et al., 2004). Although
there has been no systematic study of the penetration of procurement into rural areas,
researchers have written about signs that supermarket procurement systems have begun to
shift away from the traditional wholesale system toward the use of large, centralized
distribution centers, specialized/dedicated wholesalers operating preferred supplier
systems and private standards for quality and food safety. Clearly, the spread of
supermarkets, in particular, and the rise of the demand for horticultural products, more
generally, present opportunities for China’s agricultural producers to diversify into
activities with higher income prospects.
The experience internationally, however, suggests that there could be serious
distributional impacts of the rise of supermarkets. For example, there are case studies in
2
Latin America, Central and Eastern Europe, Mexico, Brazil and Kenya that suggest that it
is the rich, large farmers that benefit from the rise of demand for fruit and vegetables and
the emergence of supermarkets (Berdegué et al., 2005; Alvarado, 2002; Dries et al, 2004;
Schwentesius et al, 2002; Farina, 2002; Neven et al, 2004). Because of the high
transaction costs involved with purchasing from millions of small farmers and difficulties
in monitoring quality and food safety, it is often assumed that supermarkets and their
agents (for example, specialized wholesalers; preferred suppliers) will turn to large and
better-off farmers. As a consequence, the rise of demand for horticultural and other high-
valued commodities in the consumption basket of consumer and the concomitant rise in
supermarkets have created concern among the international community about the
possible adverse consequences on small, poor farmers (Reardon and Timmer, 2005).
In many respects, the process that will allow China’s procurement systems to
mature and spread over larger regions faces similar, if not more severe, challenges than
those faced by food retailers in other countries. The average farm size in China is small,
less than 0.6 hectare per household (CNSB, 2005). Farmers are not well organized, since
historically cooperatives and associations have not been encouraged (Shen et al.,
2005). Households that are engaged in mostly farming (that is, full time-farmers) are
among the absolute poorest in China and live in relatively poor parts of the nation
(Rozelle, 1996; World Bank, 2005). Hence, the typical farm family faces significant
challenges in meeting the demanding product and transaction attributes that are required
by most supermarket retailers. Indeed, the rise of supermarkets, like elsewhere in the
world, has also generated a concern among policy makers about their impact on the
small, poor farming sector (Reardon and Swinnen. 2004). In fact, in China this concern
3
has already dampened the initial enthusiasm of some of those that believed the rise in the
demand for high valued horticulture and other commodities would provide opportunities
for farmers to move into the production of goods that could provide them with a higher
level of income (Yu, 2003; Yuan, 2004).
Surprisingly, given the importance of this topic, there has been little, if any,
systematic empirical analysis of the effect of the rise of demand for high-valued farm
commodities and the rise of the supermarket sector that is promoting these high-valued
goods on the welfare of farmers in China. The work that has been done (e.g., Hu.et al
2004; Yu 2003; Yuan, 2004), while interesting and providing important insights, is
unable to answer a few key questions in a systematic way: Where are the new high-
valued crops being cultivated and who is cultivating them? Are the farmers that are
supplying most of the demand rich and large? Are farmers that are poor and small able to
benefit? What is the nature of the supply chains that facilitate the procurement of crops
from the farmers? Are these supply chains imposing new quality and food safety
standards on farmers? How is the rise of supermarkets affecting China’s food supply
chain? As the share of fruits and vegetables that are sold through supermarkets rises,
through what procurement channel is demand met?
The main goal of this paper is limited to one major theme: getting the facts right
regarding the emergence of supply chains and the participation of farmers in China’s
rapidly evolving horticulture economy. To meet this goal, we have three main objectives.
First, we sketch a picture of who is producing the horticultural products that are
supplying the market in China. Second, we describe the patterns of marketing chains in
China’s rural areas, examining who is procuring vegetables, fruits and nuts from farmers,
4
where the transactions are taking place. Finally, we seek to understand if there is any
descriptive evidence about how the rise of supermarkets has affected the marketing
chains and how changes in the marketing supply chains are affecting the way farmers are
producing horticulture crops. We do this based on spatially-sampled community- and
household-level survey that was done in Greater Beijing and on information from a
community-level survey in Shandong Province. We also conducted surveys and
interviews in wholesale markets in Beijing and Shandong and with procurement agents
from supermarkets in Beijing.
Even given such a circumscribed set of objectives, we still must further recognize
the limitations of our work. First, while our sample is spatially sampled and is able to
produce a representative view of China’s horticultural economy in rural areas, we are still
only looking at two regions, the greater Beijing metropolitan region and Shandong
Province (although it is arguable that these are two of the most important horticulture-
producing regions in China). We also use our rural community and household data to
only look at the first two links in the marketing chain. Hence, our findings are not able to
trace the marketing paths of vegetables, fruits and nuts all the way to the consumer. In
order to overcome part of this limitation our wholesale market surveys and interviews can
provide a sketch of how the rest of the marketing chain is organized. Finally, because
exports are such a small part of total horticulture production (only around 2%), we are
almost exclusively focusing on the domestic side of the industry. Hence, we are unable to
answer many questions about the dynamics of the export segment of the market, which in
many cases may be expected to behave quite differently.
5
To meet our objectives, the rest of the paper is organized as follows. The first
section describes our data. The next section examines the production side of China’s
horticultural economy (from the rural community’s point of view) as well as measuring
the effect that horticulture production has had on the income of farmers. The next section
examines the supply chain. We do so by documenting the flow of horticultural crops from
two angles: a.) to whom farmers are selling their crops; and b.) from whom actors in the
downstream segments of China’s horticulture markets are buying (including both buyers
in wholesale markets and procurement agents from supermarkets). In this way we want to
triangulate on the channels through which horticultural crops flow from farm to retailer.
The final section concludes.
Data
The data set, collected by ourselves, is composed of two main parts and covers
two main producing regions. The first part (the extensive survey) is comprised of
observations on 201 villages and 500 households (from 50 of the villages) in the greater
Beijing metropolitan region. In the summer of 2005 enumerators visited each of the
villages and interviewed village leaders about the horticultural economy from the
village’s point of view between 2000 and 2004. Among other things, during a several
hour-long, sit-down questionnaire sessions with enumerators, village leaders recounted
information about production trends of their community’s major horticultural
commodities. The leaders also provided information on the most common ways that
horticultural goods are procured from farmers—including the type of buyer that
purchased the crop from the farmer. In total we identify 8 main types of buyers. Finally,

6
we asked leaders to tell us the nature of the contractual arrangement—either explicit or
implicit—between the farmer and first-time buyers. Enumerators also asked village
leaders about the characteristics of their communities (for example, income per capita;
cultivated land per capita; location; etc.).
Because we were concerned that village leaders would not be able to have
accurate information about the horticulture production and marketing activities of their
villagers, we also conducted a follow up study (henceforth called the intensive survey).
This survey re-visited a randomly selected set of 50 of the 201 villages from the extensive
survey. Within each intensive survey village we visited 10 randomly selected
households—some of them horticultural producing; others not. In the case of almost all
of our variables, the aggregated average of the answers of the household were close to
that of the level of the variable produced from information provided by the village leader.
At the very least the trends over time were the same. In some of the analysis that follows
we use and present information from both the extensive and intensive surveys. The
bottom line of the data collection exercise that collected both village- and household-
level data was, however, that village leaders know what is going on in their villages and
data based on surveys of leaders provides relatively accurate information about village
horticulture activities. The exact procedure for selecting the villages is included in
Appendix A.
Because of concerns about how representative Greater Beijing was of China’s
major producing areas, we supplemented this primary data set with a follow up survey in
Shandong Province. Shandong Province, while accounting for about 7 percent of China’s
cropping land, accounted for nearly 12 percent of its horticulture area in 2004 (MOA,
7
2005). This percentage has been rising over time. Moreover, since the number of
greenhouses is higher than average and since the level of commercialization is typically
thought to be higher than the rest of China (and so almost certainly yields are higher), it is
safe to assume that in fact the share of the Shandong’s total production is higher than it
area share. Details on the selection of the sample counties, townships and communities
(from which provincial point estimates can be made) are given in Appendix B as are
details of the exact content of the survey. At the very least, relying on surveys that
interviewed village leaders and randomly selected farmers, the data set can be used to
create a production and marketing profile in Shandong Province, China’s vegetable
basket.
Finally, we also interviewed individuals in the downstream segments of the
market. We ran one set of surveys and conducted interviews in three representative
wholesale markets in Greater Beijing. We also ran a set of surveys in wholesale markets
in Shandong Province. The details on the selection of the traders (which were all done
randomly) and the content of the interviews are in Appendix C. Finally, we also
interviewed procurement agents in Beijing supermarkets in order to create of profile of
their procurement channels.
Who are Producing China’s Vegetables, Fruits and Nuts?
The rise of demand for horticultural crops that have been observed in the demand
statistics is beginning to change production patterns of farmers from grain into other
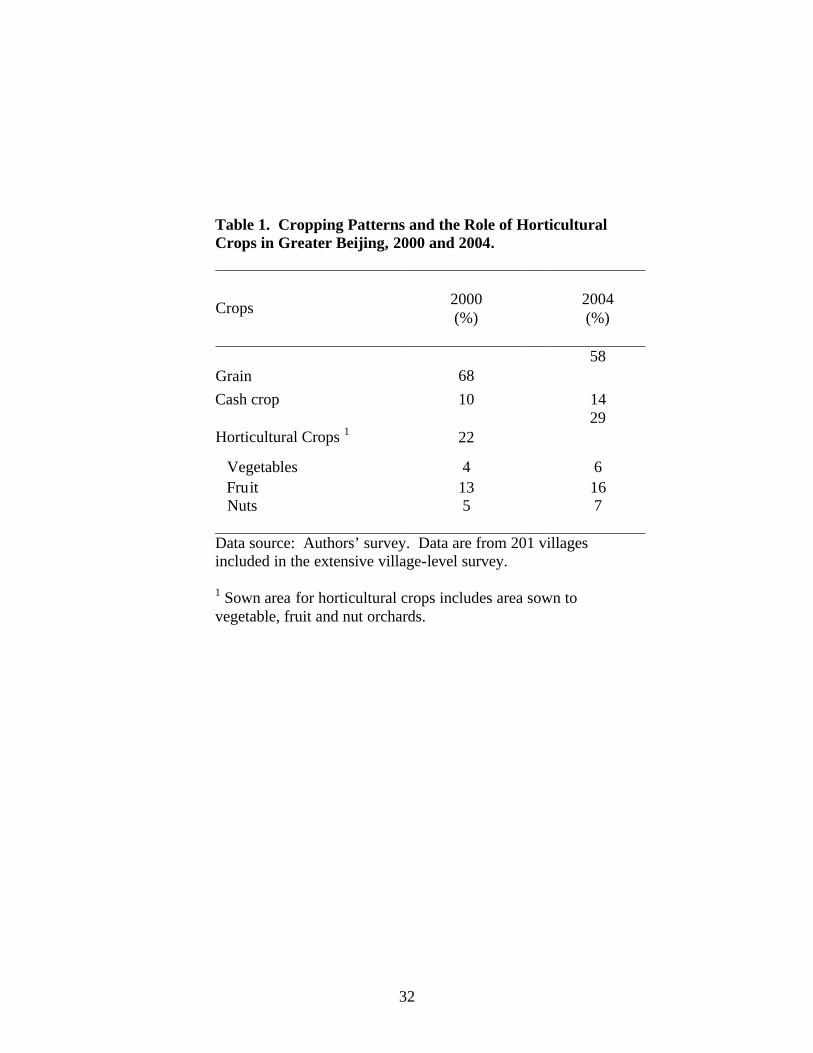
crops in the greater Beijing area after 2000 (Table 1, columns 1 and 2—eliminate other
columns). The total sown area of grain between 2000 and 2004 fell from 68 percent to 58
8
percent. In contrast, cash crops (which include mainly crops, such as cotton and peanuts,
crops that are not the focus of our study) rose by 4 percentage points. During the same
period, the area sown to horticultural crops rose by more than cash crops—7 percentage
points (from 22 percent in 2000 to 29 percent in 2004). Vegetables rose by 2 percentage
points; fruit—by far the crop category accounting for the largest share of horticultural
crops in Greater Beijing—rose by 3 percentage points; and nuts rose by 2 percentage
points.
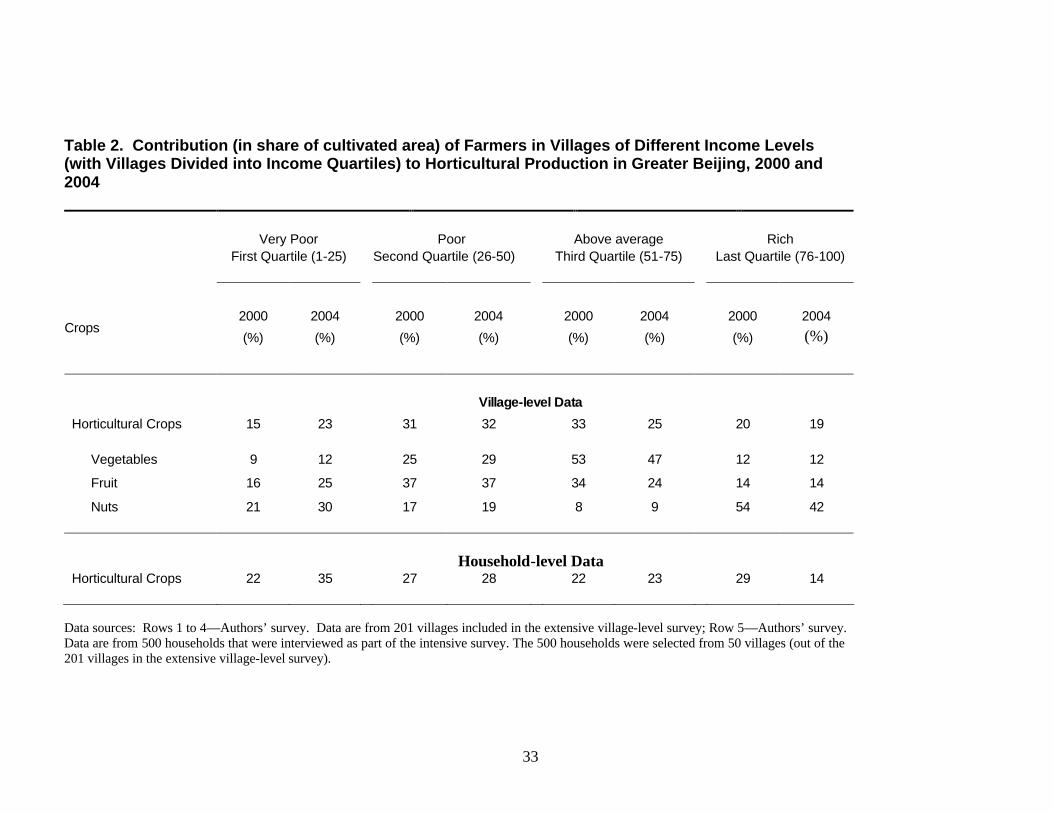
While the overall rise in the share of cropped area that is devoted by horticultural
crops should not be surprising (given the rise in demand), based on descriptive statistics,
one of the most significant findings is that farmers in poor villages and poor farmers are
increasing their share of the production of horticulture crops (Table 2). To show this, we
divide villages into four quartiles, according to each village’s reported income per capita.
Between 2000 and 2004 we find that farmers in the very poor and poor village categories
(i.e., those farmers living in villages with incomes below the median income level) have
increased their share of total sown area of horticultural crops, in general (top row). In
fact, by 2004 farmers in very poor and poor villages produced more than half (55 percent)
of horticultural crops in Greater Beijing. Even more significantly, farmers in the very
poor villages increased their share of vegetables, fruits and nuts between 2000 and 2004
(rows 2 to 4, columns 1 and 2).
A similar picture emerges when examining different types of horticultural crops
(Table 2, rows 2 to 4). For example, in the case of fruit, production is dominated by the
farmers in the very poor and poor farmer village. In contrast, farmers in average income
villages produce most of the vegetables. Of course, one of the most interesting findings of
9
Table 2 is that the farmers in the richest village are not the driving force (or beneficiary)
of vegetables, fruits or nuts.
Hence, according to our data, we have strong evidence the rise of horticultural
production in the greater Beijing area is not following the trends that have been observed
in other developing countries (e.g., Farina and Machado 1999). Clearly, our data show
that farmers in very poor and poor villages are not being left out. In fact, especially in the
case of farmers in the very poor villages, they are the driving force behind the rise in the
supply of fruit and nuts. Moreover, there is no evidence—even for vegetable crops—that
farmers in richer villages are dominating production. Indeed, farmers that live in the
richer villages (above average and rich) have lost production shares in all categories of
horticultural crops (e.g., 65 to 59 percent for vegetable, 48 to 38 percent for fruits and 62
to 51 percent for nut). In 2004 farmers in the 25 percent of the villages that are the richest
only cultivated 19 percent of the region’s horticultural area.
Household level data
According to household-level data collected as part of the intensive survey, we
find that our results are consistent—poorer households in the Greater Beijing area
account for the largest share of horticultural crops (in terms of area) and the share is
growing. We use household-level data in Table 2, row 5 (versus the village-level data in
Table 2, rows 1 to 4) in order to alleviate concerns that village-level data were provided
by village leaders (who might not know about the details of farmer production and
marketing transactions). We also want to make sure that we capture the distributional
trends. In fact, we find that the information supplied by village leaders and the use of
village-level data are consistent with household-level data. The very poorest farmers are
10
the ones that increase their share (from 22 to 35 percent) and the richest farmers are the
ones that decrease their share (from 28 to 14 percent). The middle two quartiles remain
virtually unchanged.
Multivariate Analysis
The main objective of this section is to explore further with more rigor whether or
not farmers in poor villages and whether or not poor farmers are benefiting from the
boom of the horticultural economy. To this end we examine three sets of relationships.
First, using the village-level data we want to see that, holding all other factors constant,
whether or not those farmers in poor villages able to participate in the production of
horticultural crops. Second, using the household-level data, we want to see that, holding
all other factors constant, whether or not poor farmers able to participate in the
production of horticultural crops. Finally, we use the household-level data to examine if
participation in the production of horticulture crop increases the income of households
(i.e., everything else held equal, do those households produce horticulture crop earn
higher incomes over and above what they would have earned had they not been engaged
in horticultural production).
To examine what factors, including income, facilitate the participation of farmers
in the horticulture economy (as well as what factors keep farmers from doing so), we
specify a simple multivariate model:
(1) Horticultural area = f ( income; income * year; sample location and geographical factors; socio-economic factors
where horticultural area is the dependent variable, which is measured as the total amount
of village land (in mu) that is allocate to horticultural production.1 Using the village level
1 15 mu equals 1 hectare.
11
data, this is measured at the village level; using the household level data set, this is
measured at the household level. The independent variable of interest, income, is
measured as a set of quartile income dummy variables (where the very poor have average
per capita incomes in the villages less than 985 Yuan in 2000; the poor have per capita
incomes between 986 and 1900; the above average income villages have per capita
incomes between 1901 and 2718; and the rich villages have average per capita incomes
above 2719). In the household level equations we construct wealth quartiles using assets
per household. In order to measure the increasing or decreasing importance of income,
the income variables are interacted with a year-2004 dummy variable (which is equal to 1
if the year is 2004 and 0 if the year is 2000). The model also includes a number of control
variables to hold constant the effects of sample location and geography (a set of
concentric ring dummies; and a variable that measures the distance of the village from the
nearest all-weather road—distance_to_road; dummy variable which indicates the village
is in mountainous area—mountains equals 1, otherwise 0) and socio-economic variables
(total land area of the village—in mu; share of cultivated area in the village that is
irrigated; share of laborers in the village that work as migrant_share; and the share of
households in the village that are engaged in running their own self-employed business
share). The control variables are the same in the household-level equation except that
there is no measure for irrigated area or the household’s participation in a self-employed
business.
In the multivariate analysis, we estimate the model in equation (1) four ways. As
stated above, we estimate the equation at the village-level and the household level. For
each of these, we also using two approaches. First, we use a standard Ordinary Least
12
Squares (OLS) estimator. Second, because 45 of the villages produce no horticultural
crops, we also account for the limited dependent nature of the explanatory variable by
using a Tobit estimator.
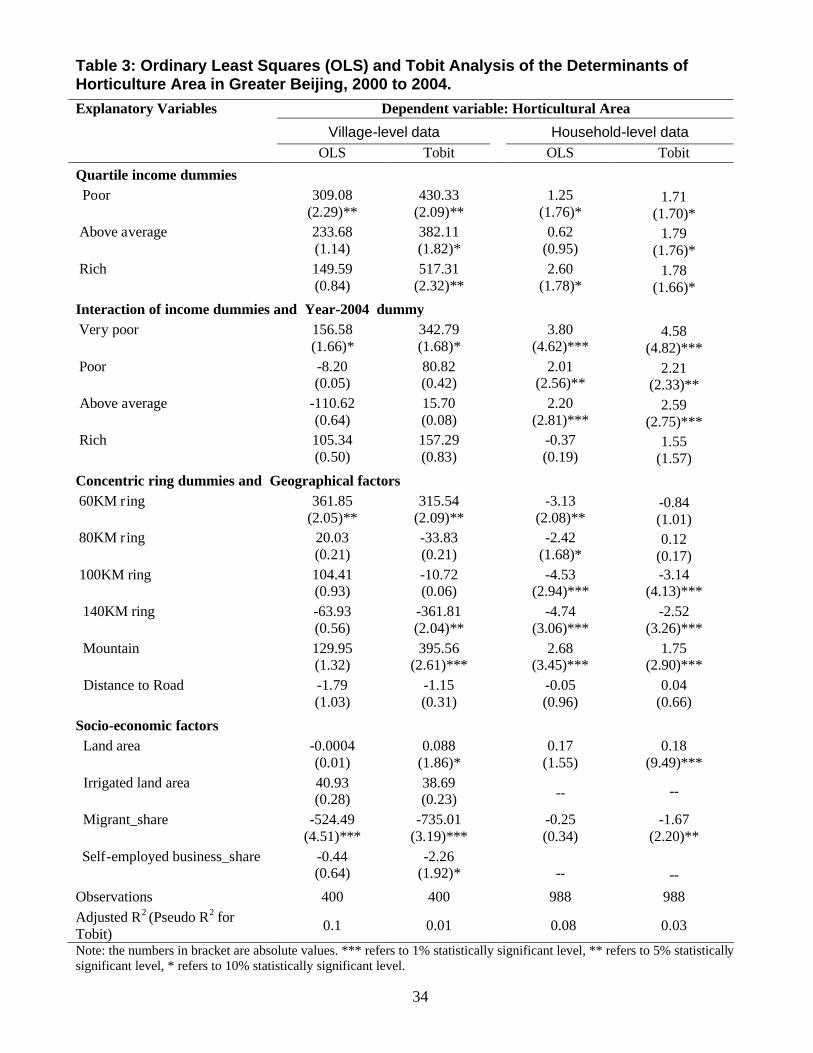
Results
The model using village-level data performs well in several dimensions (Table 3,
columns 1 and 2). First, although the R-square of the OLS version of the model is 0.1,
this is a level that is normal for such cross section regression analyses. Second, and more
importantly, many of the coefficients on the control variables are as expected. For
example, the sign on the migrant variable is negative in both the OLS and Tobit
equations, which suggests that those farmers that have high opportunity costs for their
time, spend relatively more time working off the farm. We also find that the sign on the
coefficient of the self-employed business share variable is negative (and significant in the
Tobit version of the equation). There also are several other interesting, more general
findings. For example, our results demonstrate that villages that are in mountainous areas
are relatively more likely to enter the horticulture economy. This may be a sign that the
economy is reacting to market signals since farmers in mountainous areas may have a
comparative advantage (though not necessarily an absolute advantage) producing fruit
and nuts in their villages.
Above all, however, our results show that over time the poor are benefiting
increasingly more from the rise of China’s horticulture economy. Specifically, we find
that when looking the income quartile dummies in the year 2000, in those in the very poor
category, ceteris paribus, were not participating as much as villages in the other income
quartiles. Since the very poor villages were acting as the base set of villages, the positive
13
sign on the coefficients in both the OLS equation (column 1) and the Tobit equation
(column 2) means that farmers in very poor villages allocated less of their land to
horticultural crops in the year 2000 (the base year). The signs are significant on all of the
income quartile dummies in the Tobit equation.
However, while farmers in very poor village were participating less in 2000,
between 2000 and 2004 our data show that many these farmers were able to significantly
expand their area. When looking at the interaction terms, we find that the only coefficient
that is positive and significant is that for the very poor villages (Table 3, columns 1 and 2,
row 4, columns 1 and 2). Hence, since 2000, a time when the horticultural economy has
boomed, we see that, holding all other things equal paribus, it is the farmers in the poorest
villages that have expanded their area relatively the most.
Similar results are found using household data (Table 3, columns 3 and 4).
Likewise, in 2000 (the base year), the positive sign on all of the quartile dummies are
positive. However, the signs on the interaction terms of the “very poor quartile times
2004 year dummy” (row 4) is positive and significant and is larger than the other quartile
dummy-year interaction terms (rows 5 to 7). The F-tests on the difference between the
interaction terms for the very poor and poor; the very poor and above average; and the
very poor and rich are suggest that the differences are statistically significant.
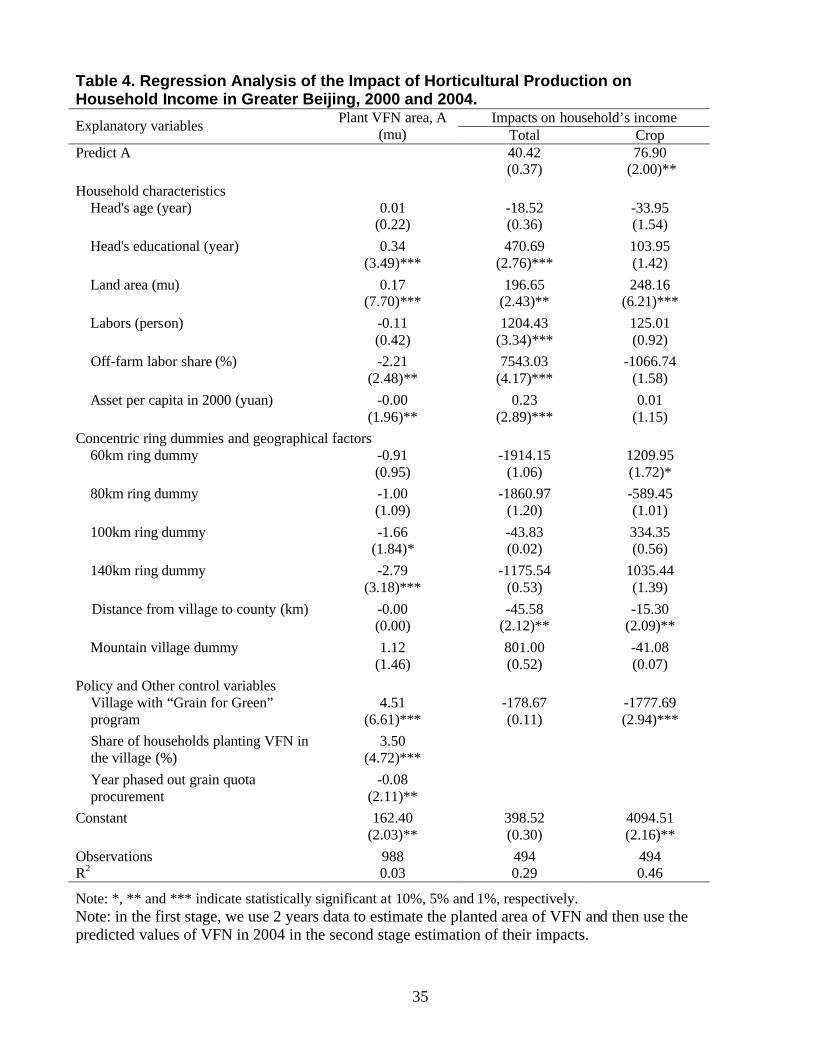
Impact of horticultural production on households
Our results not only demonstrate that the poor are producing more fruits and
vegetables but that households are benefiting from producing fruits and vegetables. To
show this, we estimate the following model:
(2) Income = f (Horticultural sown area; sample location and geographical factors; policy factors)
14
where income is measured one of two ways, either are total income or as cropping
income. Horticultural sown area is a measure (in mu) of the amount of land allocated by
the household in each year to horticulture production. The sample location and geography
variables are the same variables as were used in the estimation of equation (1). We also
added a variable, Grain for Green program variable, which controls for participation of
villages and households in the villages in a national reforestation plan (which might have
led to higher plantings of horticultural crops, especially fruit and nuts). Because it is
possible that the coefficient on the horticultural variable might be biased due the presence
of endogeneity (due to the presence of unobserved heterogeneity that might make the
correlation between the error term in equation 2 and horticultural area non-zero), we
adopt an instrumental variables approach. In the first stage of the two stage estimation
procedure, we use two variables to instrument horticulture sown area: a.) the share of the
household planting horticultural crops; and b.) a variable measuring the participation in
the nation’s grain procurement policy program that required farmers to cultivate grain (to
the detriment of horticultural area) and sell to the state. We believe these variables can
serve as instruments since they likely will be able to explain part of the variation in
horticultural sown area, but they will not likely have a direct effect on cropping income
(except through horticultural area). In addition to being logical candidates for IVs, they
also pass the Hausman-Wu exclusion restrictions tests.
The results of the two stage least squares (IV) estimation shows that, in fact,
horticulture production positive affects cropping income (Table 4). According to the
findings, for every additional mu of sown area sown to horticultural crops, income rises
by 76.90 yuan, or about 5 percent of per capita income. Although the sign on the total
15
income is positive, the t-ratio is low. It is possible that this means that although cropping
income rises, the use of labor in intensive horticultural production dampens the farmer’s
ability to earn income off the farm.
Supermarkets and the Evolution of Marketing Supply Chains (or Not)
While so far, we have shown that the expansion of demand for horticultural crops
are, at least in Greater Beijing, supplied by the poor and provide them with higher
incomes, there has been no attempt to identify the role of the emergence of new retail
institutional forms (such as supermarkets) in these trends. We also do not know if the
nature of the contractual relationship is changing between buyer and seller. In this
section, we examine the changes in the supply chain (or lack thereof) in two ways. First,
we examine the procurement channels at the household level and describe the terms and
conditions of the transaction that occurs between seller (the farmer) and the buyer. We do
so in both Greater Beijing and Shandong. We also examine the changes in other segments
of the supply chain, examining the nature of wholesale markets and the procurement
channels of supermarkets.
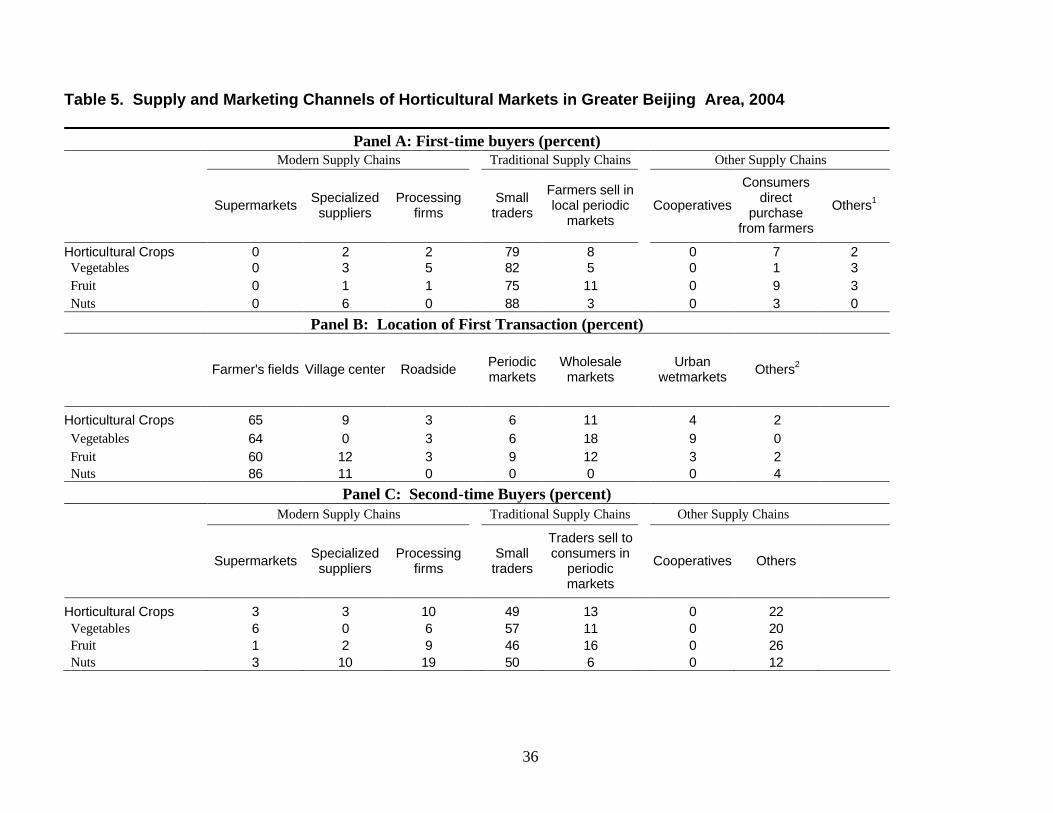
Where are the Supermarkets?
Although there has been a lot of discussion about the potential implications of the
rise modern supply chains and the effect of their procurement agents on welfare in rural
areas, according to our data, supermarkets are completely absent (Table 5). Indeed, not
one of the 201 village leaders that we interviewed reported the presence supermarkets for
the procurement of any horticultural goods (Panel A, column 1). Likewise, village leaders
reported that only 2 percent of procurement from farmers was from specialized suppliers
16
and only 2 percent was from processing firms (columns 2 and 3). Hence, in the Greater
Beijing area in 2004, only 4 percent of all horticultural goods were procured by those
operating in firms that could be described as part of the modern supply chain. Although
not shown, the data from the households that were part of the intensive survey in 50 of
the 201 villages in the extensive survey in Greater Beijing show the exact same pattern:
Households sold almost all of their output to small traders—either in the village or in
local wholesale markets. Not one household reported that they sold to a supermarket or a
specialized supplier.
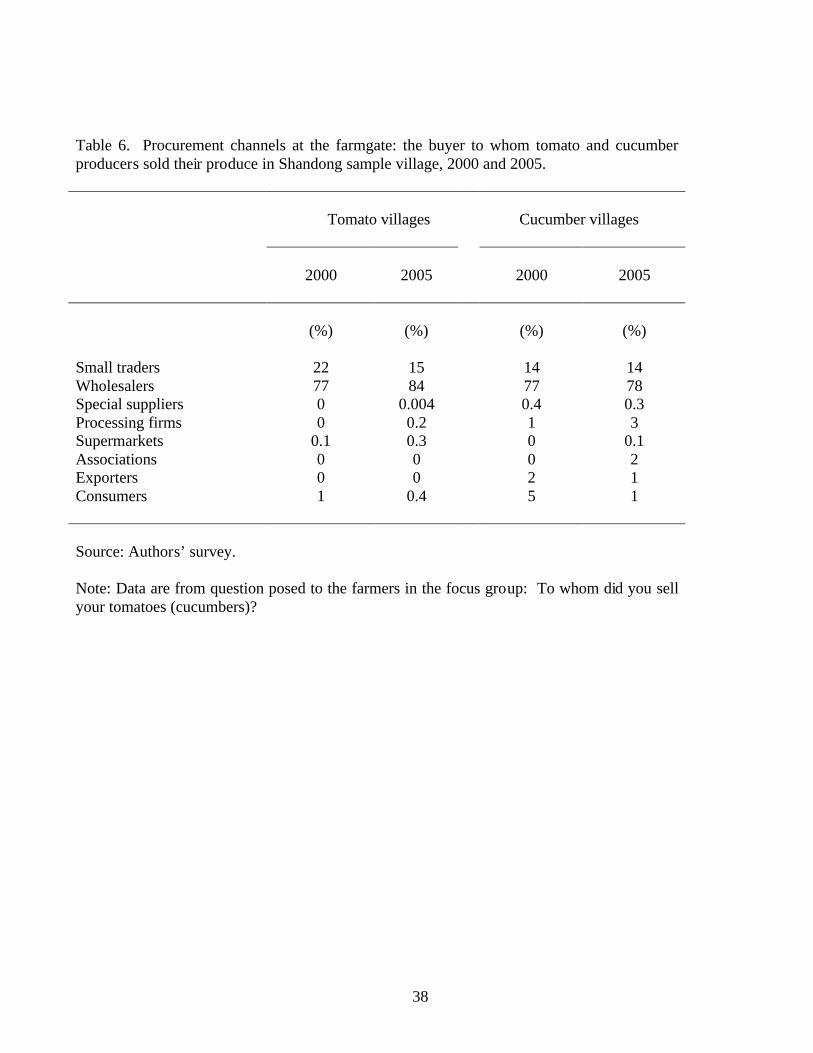
A similar picture emerges from the farmers that participated in the focus groups in
the 72 Shandong tomato and cucumber villages (Table 6). Fully 99% of farmers in the
Shandong tomato producing village in both 2000 and 2004 stated that they either sold
their tomatoes to small traders that visited villages or to small traders in the local
wholesale markets (columns 1 and 2). While the percentage that was sold to small traders
in the wholesale market rose (from 77 to 84 percent, shifting from direct sales to small
traders in the village), there were still less than 1% of sales to all other channels.
Cucumber producers showed similar trends; more than 90% of all sales of cucumbers
were either to small traders in the village or small traders in the wholesale market
(columns 3 and 4). Interviews of traders from trading firms in the wholesale markets in
both Beijing and Shandong (which on average consisted of 4 employees, almost always
family members or close friends) confirm that the procurement channels between the
farmer and the wholesale market have changed very little and that the supply of
horticultural products in China largely flow through traditional small-trader dominated
channels (tables not shown, but available in Huang et al., 2006).
17
Not only was there little evidence of procurement from farmers by the newly
emerging players in the retail segment of the supply chain, there was almost no change in
the contractual terms under which most transactions took place. In Greater Beijing
sample there was nearly zero contracting over either price or quantity, there was no
provision of input or credit by the buyer and all transactions took place a cash, spot
market basis. This was true for both 2000 and 2004. In Shandong tomato and cucumber
producing villages, the exact same pattern held for both 2000 and 2005. Clearly in our
study sites, which cover some of the most productive and commercialized horticultural
areas in China, transactions show little penetration by actors in the modern supply chain.
Decomposing the Downstream Segments of Horticultural Supply Chains
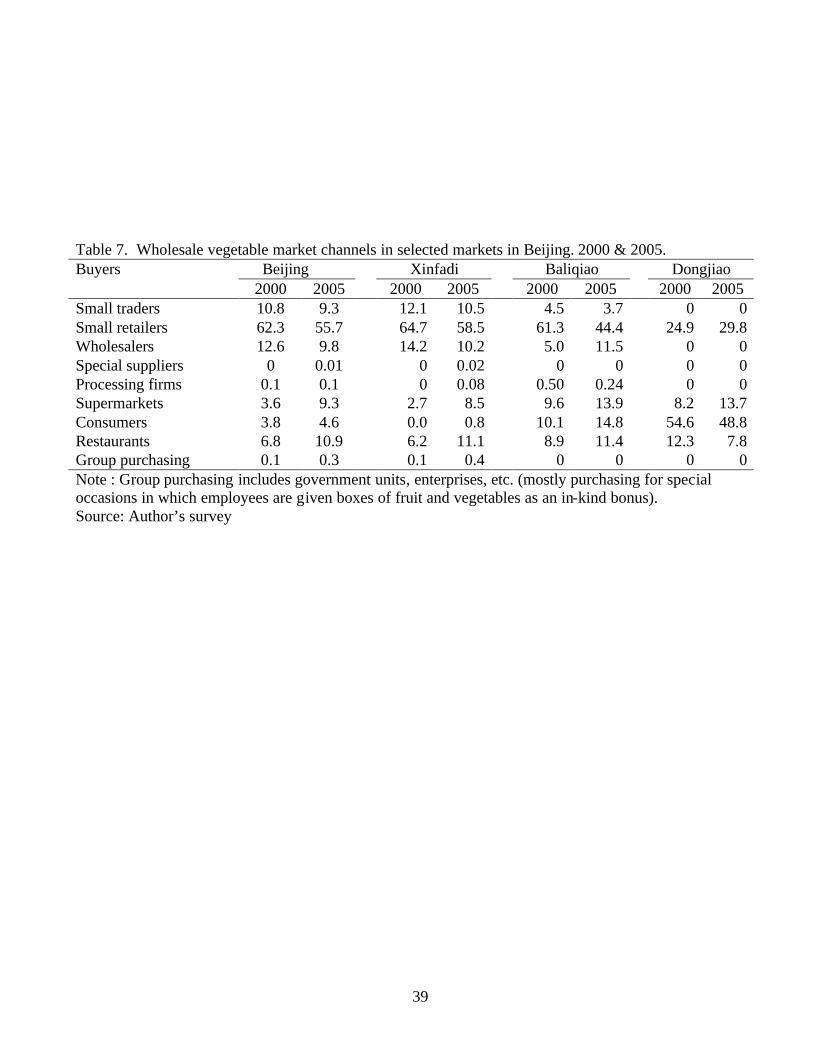
Using information from our surveys of market officials in Beijing wholesale
markets (who could tell us about the total volume of trade of all vegetables, not just
tomatoes and cucumbers), it can also be seen that the destination of sales from Beijing’s
wholesale markets are evolving in response to changing retailing patterns by China’s
consumers (Table ). In 2000 by far that largest volume of sales by wholesale traders went
to traditional buyers—small retailers (62.3%); wholesalers (12.6%) and small traders
(10.8%). Only 3.6 % were sold to supermarkets. Between 2000 and 2005, however,
Beijing wholesale traders reduced their sales to small retailers, wholesalers and small
trader from 85.7% to 74.8%. In its place, supermarkets (and restaurants) raised their share
to 9.3% (10.9%). Clearly the new ways that Beijing residents are buying and consuming
their food is changing the channels through which wholesale market traders are selling
vegetables.
18
Importantly, China’s markets can be sown to be quite competitive. In fact,
China’s wholesale markets have remained remarkably competitive at the trader level. To
see this one only has to examine the nature of firms that operate in China’s wholesale
markets. In Xinfadi (Asia’s largest wholesale market), for example, although the daily
level of sales from the market is more than 8000 tons per day, the largest single trader
only moves 25 tons per day. When taken in terms of trucks per day, this means that the
largest trader in the market only buys and sells about 5 large trucks of vegetables each
day. When one visits the market, however, it is clear that there are more than 1000 trucks
moving in and out of the market each day. On average, according to our survey, each
trader does only 1 to 2 tons of vegetable trading in a day, an amount that is less than one
large truck per day. This low volume means that there are more than 1000 traders that
operate in this single market for vegetables. Such a scenario is in stark contrast to many
vegetable markets in the US in recent years that have been increasingly dominated by a
handful of extremely large enterprises.
A profile of the typical trading company in Beijing’s wholesale is consistent with
the small volume of sales. In fact, almost all of the traders that we met were small family-
or friend-based firms of 2 to 6 people. In the typical way of doing business for a 6 person
firm, two to three team members are located in the marketing slots (or stalls) in the urban
wholesale market (e.g., they are the ones that occupy the space in the Xinfadi vegetable
market). In some cases, especially for more established ones, their space is permanent.
For smaller ones, they may have a space one day, but not for the next several days. For
these smaller traders, after they empty their truck or sell their lot of vegetables they leave
the market. The rest of the firm’s members are out purchasing vegetables from China’s
19
farmers in the surrounding villages or from wholesale markets in other parts of the
country (e.g., one person from a Xinfadi wholesale firm may be in a Shandong wholesale
market). Sometimes the wholesale buyer enters a village and purchases directly from its
farmers. Sometimes he/she will purchase a load of vegetables from independent small
traders, who are buying from farmers and selling to the wholesaler. When the buyer has
purchased sufficient quantities to fill up a truck, the load is transported to Xinfadi from
where it is resold to all of the different buyers that come from Beijng (e.g., small retailers;
supermarkets; restaurant owners; etc.).
Hence, from our research we see that it is likely that it is the nature of wholesale
markets in China that is shielding farmers from experiencing the radical shifts that are
occurring in the downstream retail sector. Although wholesale markets themselves are
getting bigger; moving to the suburbs and consolidating (Huang et al., 2006), China’s
wholesale markets are still made up of tens of thousands of individual traders in
thousands of trading firms. This picture is consistent with the findings in Tables 5 and 6
in which we find (using village- and household-level data) that China’s horticulture
economy is dominated by thousands of small traders that come into horticulture-
producing villages to procure vegetables from the farmers. Farmers also told us in Beijing
that if they went to the local market to sell their vegetables they were also selling to small
traders. Since there are really no large traders in a market as large as Xinfadi, the
observations from the villages and the observations from the wholesale markets are
consistent.
20
Supermarket procurement
The picture drawn according to the wholesaler interviews differs dramatically
from the story that some researchers have been telling: the rise of supermarkets has been
leading to a situation in which supermarkets are using contractual arrangements to
directly purchase from farmers. In fact, there are a number of pieces of evidence that
suggests that this is not the case. First, although it is difficult to verify the share of each
day’s total vegetable sales that pass through supermarkets, a conservative guess is around
15%. So where does this amount come from. According to our data (Table 7, column 2,
row 6) in 2005 Beijing wholesale markets sell about 9.3% of their vegetables to
supermarkets. Therefore one plausible story is that supermarkets get about 2/3rd of their
vegetables from local wholesale markets and 1/3rd from other sources.
In the rest of this section, we want to try to examine the evidence that can help us
answer two questions. First, is it plausible that 2/3rd come from purchases in local
wholesale markets (or is it more or less?). Second, (besides local wholesale markets),
through what other channels does the supply of fruits and vegetables flow.
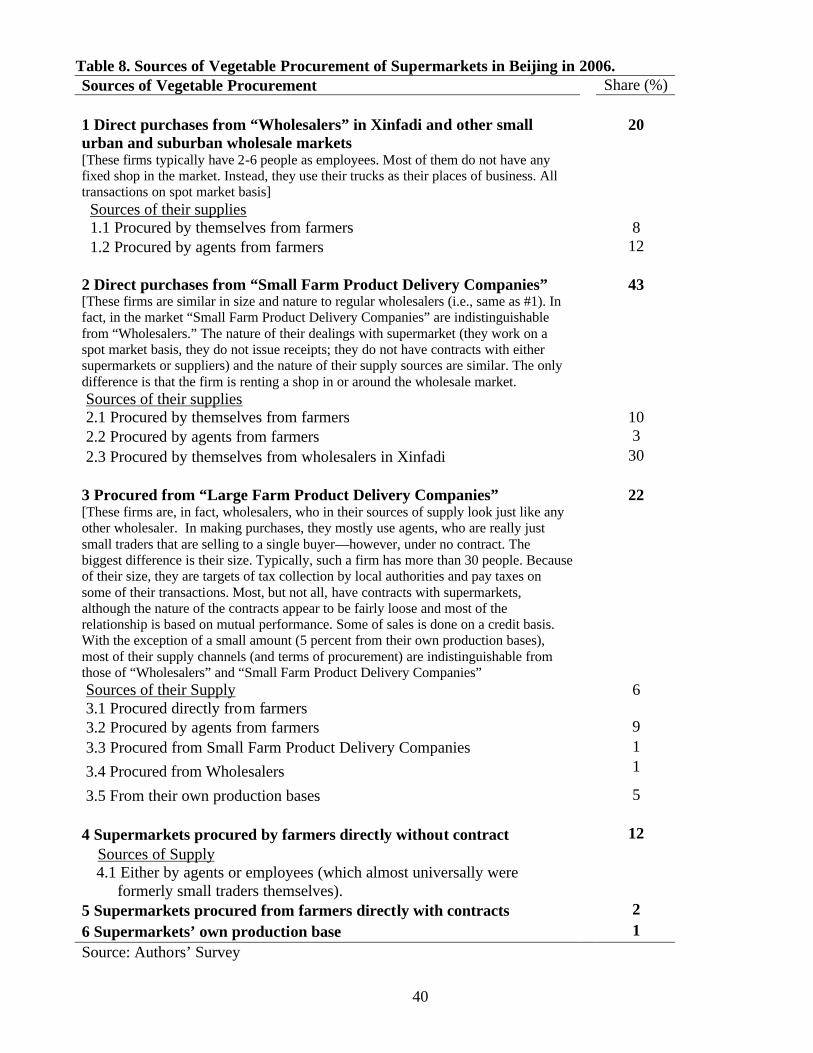
Perhaps the most compelling evidence about the dependence on supermarkets on
local wholesale markets comes from the supermarkets themselves. In fact, we found that
according to one interview of a procurement manager of a Beijing supermarket chain that
at first glance the reported sales that move directly from the wholesale market to the
supermarket (reported from the supermarket point of view) is remarkable consistent with
the results of the wholesaling survey (reported in Table 7). According to the interviewees
from Beijing supermarkets, 63 percent of their vegetables are procured directly from
small wholesalers or small product delivery companies (who are just wholesalers that rent
21
an office in or around the wholesale market) in Greater Beijing wholesale markets by
supermarket procurement agents (Table 8, rows 1 and 2). Although such information was
sometimes only grudgingly given (since buying from wholesale markets is not perceived
as being “modern”), we were told that supermarkets had no option except to rely on
wholesale market if they wanted to remain competitive. In other words, during the
interviews it was discovered that, in fact, supermarkets depend mostly upon wholesale
markets to supply their vegetable needs. In some instances, we were told buyers often just
buy in the wholesale market itself. Frequently, these purchases are made in the part of the
market that has evolved to supply relatively high quality fruits and vegetables. While the
new section of the market is evolving towards a specialty of handling high quality
produce, it should be noted that the structure of the market in terms of the size and nature
of the trading firms in the same. Like traditional wholesale markets, the quality part of the
market is dominated by small, private trading firms that procure from farmers and have
agents procuring from them. They also use not contracts. The respondent (traders) also
told us that there, in fact, was rarely any problem in procuring sufficient quantities or
qualities of vegetables that they wanted.
While nearly 2/3rd of procurement of supermarkets is directly from wholesale
markets, this is not to say that markets are stagnant. In fact, our data contain evidence of a
steady evolution of China’s markets, especially in the downstream segment. In particular,
as can be see from our data from our supermarket interviews (Table 8, row 3), a large
share of vegetables are procured from Large Farm Product Delivery Companies (22
percent). These firms differ from traditional wholesalers (and Small Farm Product
Delivery Companies) in several fundamental ways. First, they are larger, having around
22
20 to 25 employees, on average. Second, often have a shop-front with a higher profile.
Large Farm Product Delivery Companies sometimes also have formal contractual
relations with supermarkets, although it was difficult during our interviews to understand
the exact nature of the arrangements. Several times it appeared as if even though the
contractual jargon was about contracting over a fairly long term of the basis of quantities
and qualities, in fact, most relationships were run on the basis of an established
relationship and were flexible. In other words, prices were frequently spot market prices
and quantities and qualities were established on a rolling basis, depending on the daily
and weekly needs of the supermarkets and availability in the wholesale markets. In other
words, Large Farm Product Delivery Companies often appeared as if they were acting as
an in-the-wholesale-market buying agents for the supermarkets. Perhaps the most
fundamental difference is that many of the transactions between the Large Farm Product
Delivery Companies and supermarkets were on a credit basis, which gave the
supermarkets some degree of leverage (during negotiations) over the delivery companies.
Clearly, however, the emergence of Large Farm Product Delivery Companies represents
at least a small step in the evolution in Beijing’s wholesale markets.
Although the emergence of long term, quasi-contractual relationships between
supermarkets and Large Farm Product Delivery Companies appears to be indicative of
changes occurring among downstream actors in China’s horticultural supply chains, our
interviews with supermarkets confirm the hypothesis that the competitive nature of
wholesale markets in China shield upstream markets from these changes (at least so far).
Most poignantly, when examining the procurement practices of Large Farm Product
Delivery Companies, it can be seen that by far most of the purchases are done through
23
conventional channels. Employees of the companies and agents of the companies (who
are just freelance small traders) all purchase vegetables directly from farmers in ways that
are indistinguishable from those of the employees and agents of traditional (small)
wholesalers. In other words, from the farmer’s point of view, regardless of whether
his/her buyer is from a wholesaler, a Small Farm Product Delivery Company or a Large
Farm Product Delivery company, the terms and nature of the procurement transaction is
exactly the same. In other words, in most downstream segments of China’s vegetable
markets there is little evidence that markets are evolving. The same is true for the share of
the market (12%) in the case when supermarkets send their own employees of agents
directly to buy from farmers (Table 9, row 4).
That is not to say that there is absolutely no experimentation going on. Whether
for window dressing or due to true desire to understand alternative (future) sources of
supply, we can find that a small minority of vegetables in China’s super market come of
novel sources. For example, in 5% of total purchases, Large Farm Product Delivery
Companies procure vegetables from their production bases. In some cases, the companies
actually control production. However, in others (probably most) a production base is a
village in which there is a long term relationship between the Large Farm Product
Delivery Company and the villagers that produce horticultural crops supply a certain
product in return for preferential treatment in terms of reliability of procurement and
sometimes price premium. In addition, according to our interviews, 3 percent of the
vegetables in Beijing’s supermarkets are either from farmers with contractual
relationships with supermarkets (2 percent) or from the supermarket’s own production
base (1 percent). Although these are interesting (and often what is talked about in the
24
press and observed by visitors that are escorted or introduced the upstream segment of the
marketing supply chains by representatives of supermarkets), it must be remember as a
share of the total volume of vegetables this is very small. According to our estimates,
since at most 15 percent of total vegetables in Beijing are sold through supermarkets,
farmers that are producing and supplying under contract account for only 1.2 percent of
Beijing’s total supply (or 15% * [5+2+1] = 1.2%).
Discussion and Conclusions
In this paper we set out to assess the effect that modern supply chains and the rise
of the horticultural economy in China has had on the farming sector in China. Although
we only have data on two areas inside China—Greater Beijing and Shandong, our
samples were spatially sampled and we are able to produce regionally representative
figures on the rise of opportunities for planting horticultural crops and the penetrations of
marketing supply chains into rural areas. These questions have worried policy officials
not only in China but are of concern to leaders around the world.
Interestingly, although we showed the rise of horticultural crops was paralleled by
a surge in the emergence of supermarkets in urban areas, there has been almost no
penetration of modern wholesalers or retailers into rural communities. In Greater Beijing,
less than 6 percent of first-time buyers could be identified as being from modern supply
chains—either supermarkets, professional suppliers or processing firms. In Shandong
tomato and cucumber producing villages, the share is smaller. Instead, China’s
horticultural economy is dominated by small traders who are themselves poor and small,
operating in firms of less than 10 individuals and are themselves earning low wages.
25
Moreover, unlike the evidence found in other countries, it appears as if in China, far from
being hurt by the rise of supermarkets and the horticulture boom that has come with it,
poor, small farmers in our sample appear to have gained. The richest farmers, in contrast,
were playing a smaller role in 2004 than in 2000. Clearly it appears as if this is a special
case of “Producing Horticultural Crops with Chinese Characteristics.”
So what makes China special? While a full analysis and more definitive
conclusions require more research, it is our opinion that there are several characteristics
about China’s horticultural economy that produces these surprising results. First, China’s
land holdings are relatively equal. In essence, there are no large farmers in China; indeed
in our sample, the average farm size of the largest 20 percent of the farmer is only 0.36 ha
per capita.
Second, there also are almost no farmer cooperatives that can allow farmers to act
in concert with one another. In our sample, only 11.4 percent of the villages reported that
they had a horticultural or general farm cooperative. Only 1 percent of farmers said that
they belonged to a cooperative (row 3, column 1). These numbers, as it turns out, are
remarkably similar to figures for all of China reported by Shen et al. (2004) using data
from a national representative sample of more than 2000 villages. Because land size and
is small and there are few cooperative, it is easy to see why it could be so difficult for
supermarkets and other modern supply firms to deal with farmers, given their atomistic
size and the absence of organization. Clearly the transaction costs of contracting or direct
procurement would be high.
The third characteristic that may be relevant to explaining the role of small, poor farmers
in the rise of China’s horticultural economy is that although land is relatively equally
26
allocated across all communities in China, here are still differences. And in the case of
horticultural producers, farm households in poorer areas and those in more remote areas
have relatively more land (0.17 ha per capita) than those in areas nearer to the richer,
urban center (0.09 ha per capita).
In addition, there are also differences in the access that these households have to
labor for working on the farm. Although horticultural farmers have the same family size
as those not engaged in horticultural farming, the main differences are due to differential
access to off farm jobs. Farm households that are nearest to Beijing have a higher
percentage of their labor force in off farm employment (42 for those nearest; 31 for those
furthest) and they work a larger number of days per year (111 for those nearest; 82 for
those furthest). The same is true when dividing the sample between better off households
and poorer households. Poorer households have more land and labor available for use in
producing horticultural crops. It is partially due to these dynamics that we find that
horticultural production increases cropping income, but has not discernible effect on total
household income. Hence, when considering the nature of China’s land and labor
together, it is easy to see why poor farmers have increased their share of area in many of
the horticultural crops—they are relatively land and labor rich, the two keys factors in the
production of horticulture crops.
Two additional characteristics help reinforce the propensity for poorer farmers to
be increasing their participation in the horticultural economy, while the supermarkets are
almost completely absent from the production areas. Since China’s horticultural economy
is almost completely unregulated and since China’s road and communication networks
have improved remarkably over the past 10 years, small traders working with a limited

27
amount of capital and using extremely large amounts of low cost labor (while utilizing
the relatively efficient road and communication infrastructure) appear to be out-
competing all other types of would-be procurement agents. According to our interviews
with the small traders and producers, the competition among small traders is fierce and
profit margins on traders are almost always razor thin. There is little above normal profits
available to attract new, more innovative entrants. Interestingly, in this type of small
trader-dominated system, there is little or no effort being made to impose or monitor
quality or safety standards directly on producers.
Finally, one of the main characteristics of China’s economy that produces the
status quo is that China is still a relatively poor nation and its consumer, so far, may not
be placing a very high premium on food safety or obtaining a standard product. Although
there is a rising middle class, most urban consumers still live in households making
around 1000 US dollars per capita annual disposable income (CNSB, 2005). Many of
them are becoming increasingly stressed with rising payments in other expenditure
categories—housing, automobile ownership, education and health care (among other
expenditure categories). Combined with the absence of an active pro-consumer lobby
(which may be limiting the information consumers have on the quality of their food), it is
almost certain that the premium willing to be paid by the average urban consumer is still
relatively small. When this low premium is combined with the high transaction costs that
would have to be born should the supermarket want to maintain tight control over its
horticultural supply, along with the thriving, deep, extremely competitive wholesale
markets, it may be (although further research is required to definitively say so) that, at
28
least now and in the immediate future, China will still be relying mostly on traditional
wholesale channels.
If this is true, food safety in China’s food system may suffer. However, it is good
news for small poor farmers. Although, it should be recalled how fast China is changing
in so many areas; if any one (or perhaps any several) of these characteristics changed, we
should expect to see China’s horticultural economy—from both the supply and
procurement side change. The change, like so many other things in China, could be very
rapid.
29
References
Alvarado, I., and K. Charmel. 2002. “The Rapid Rise of Supermarkets in Costa Rica: Impact on Horticultural Markets”, Development Policy Review, 20(2002): 473-485.
Berdegué, J.A., F. Balsevich, L. Flores, and T. Reardon. 2005. “Central American
Supermarkets' Private Standards of Quality and Safety in Procurement of Fresh Fruits and Vegetables,” Food Policy., Vol.30, Iuuse 3, June, pp:254-269.
Bi, Xiang, Xiaosia Dong, Jikun Huang, Dinghuan Hu and Scott Rozelle, 2004, “Securing
Small Producer Participation in Restructured National and Regional Agri-food Systems”, China country project report on “Regoverning Markets”. Center for Chinese Agricultural Policy, Chinese Academy of Sciences.
China Statistics Yearbook. National Bureau of Statistics of China (NSBC), China
Statistics Press, Beijing, 2005. Dries, Liesbeth, Reardon, Thomas and Swinnen, Johan F.M 2004, “The Rapid Rise of
Supermarkets in Central and Eastern Europe: Implications for the Agrifood Sector and Rural Development”, Development Policy Review, vol. 22(5), page 525-556.
Fafchamps, Marcel, Shilpi, Forhad. 2003. "The spatial division of labour in Nepal," The
Journal of Development Studies, Taylor and Francis Journals, vol. 39(6), pages 23-66.
Farina, E. M. M. Q., and E. L. Machado. 1999. “Government Regulation and Business
Strategies in the Brazilian Fresh Fruit and Vegetable Market.” Presented at the International Food and Agribusiness Management Association (IAMA) Congress, Florence, Italy, 1999.
Farina, E. M. M. Q, 2002, “Consolidation, Multinationalisation, and Competition in
Brazil: Impacts on Horticulture and Dairy Products Systems”, Development Policy Review, vol. 20(4), page 441-457.
Hu, D.H., T. Reardon., S. Rozelle., P. Timmer, and H.L.Wang. 2004. “The Emergence of
Supermarkets with Chinese Characteristics: Challenges and Opportunities for China’s Agricultural Development.” Development Policy Review, 22 (2004): 557-586.
Huang, J.K, Dong,X.X , Wu, Y.H, Zhi,H.Y, Niu,X.F, Huang, Z.R, Rozelle, S . 2006,
“Regoverning Markets: the China Meso-Level Study”, Regoverning markets Projects Report.
30
Jin, Songqing, Huang, Jikun, Hu, Ruifa and Rozelle, Scott. 2002. “The Creation and Spread of Technology and Total Factor Productivity in China’s Agriculture”, American Journal of Agricultural Economics, 84(4) (November 2002): 916-930.
National Bureau of Statistics of China (NBSC) (2005). China Statistics Yearbook. China
Statistics Press, Beijing. Neven, David and Reardon, Thomas. 2004, “The Rise of Kenyan Supermarkets and the
Evolution of their Horticulture Product Procurement Systems”, Development Policy Review, vol 22 (6), page 669-699.
Reardon, T. and C.P. Timmer. 2005. “Transformation of Markets for Agricultural Output
in Developing Countries Since 1950: How Has Thinking Changed?” R. Evenson, P. Pingali, and T.P. Schultz (eds) Volume 3A, Handbook of Agricultural Economics: Agricultural Development: Farmers, Farm Production, and Farm Markets, Holland: Elsevier.
Reardon, T. and J.F.M. Swinnen. 2004. “Agrifood Sector Liberalization and the Rise of
Supermarkets in Former State-Controlled Economies: Comparison with other developing countries,” Development Policy Review , Vol.22, No.4 (November 2004): 515-524.
Rozelle, Scott, Jikun Huang, and Vincent Benziger. 2003. "Continuity and Change in
China’s Rural Periodic Markets," The China Journal, Vol.49.(January 2003):89-116. Rozelle, S. 1996 .”Stagnation Without Equity: Changing Patterns of Income and Inequality in China's Post-Reform Rural Economy,” The China Journal, January 1996: 63-96. Schwentesius, Rita and Gómez, Manuel Ángel, September 2002, “Supermarkets in
Mexico: Impacts on Horticulture Systems”, Development Policy Review, Volume 20 Issue 4 Page 487-502.
Shen, M. 2004. Farmers Professional Associations and the Supermarket Development: A double win institutional arrangement. Paper presented in the International conference” Supermarket and Agricultural Development”-challenges and opportunities. May, 2004, Shanghai. Sicular. J. 1988. Plan and market in China’s Agricultural Commerce”, Journal of Political Economy, 96, No.2:283-305. World Bank. 2005. “China – Compliance with Food Safety Requirements for Fruits and
Vegetables. Promoting Food Safety, Competitiveness and Poverty Reduction.” World Bank, Washington D.C.

31
Yu, H.F.2003. “Research on Management of Fresh Food in Supermarket in China.” Master Thesis, 2003, Beijing, China.
Yuan, Y.X. 2004. “Supermarket——A Effective Main Body Agri-food Entered Market.”
A Paper on Shanghai International Forum “Supermarket & agriculture Development –Challenges and Opportunities ”, May 2004.
32
Table 1. Cropping Patterns and the Role of Horticultural Crops in Greater Beijing, 2000 and 2004.
2000 2004 (%) (%) Crops
58 Grain 68 Cash crop 10 14 29 Horticultural Crops 1 22
Vegetables 4 6 Fruit 13 16 Nuts 5 7 Data source: Authors’ survey. Data are from 201 villages included in the extensive village-level survey.
1 Sown area for horticultural crops includes area sown to vegetable, fruit and nut orchards.
33
Table 2. Contribution (in share of cultivated area) of Farmers in Villages of Different Income Levels (with Villages Divided into Income Quartiles) to Horticultural Production in Greater Beijing, 2000 and 2004
Very Poor Poor Above average Rich First Quartile (1-25) Second Quartile (26-50) Third Quartile (51-75) Last Quartile (76-100)
2000 2004 2000 2004 2000 2004 2000 2004 (%) (%) (%) (%) (%) (%) (%) (%) Crops
Village-level Data Horticultural Crops 15 23 31 32 33 25 20 19
Vegetables 9 12 25 29 53 47 12 12
Fruit 16 25 37 37 34 24 14 14
Nuts 21 30 17 19 8 9 54 42 Household-level Data
Horticultural Crops 22 35 27 28 22 23 29 14
Data sources: Rows 1 to 4—Authors’ survey. Data are from 201 villages included in the extensive village-level survey; Row 5—Authors’ survey. Data are from 500 households that were interviewed as part of the intensive survey. The 500 households were selected from 50 villages (out of the 201 villages in the extensive village-level survey).
34
Table 3: Ordinary Least Squares (OLS) and Tobit Analysis of the Determinants of Horticulture Area in Greater Beijing, 2000 to 2004.
Note: the numbers in bracket are absolute values. *** refers to 1% statistically significant level, ** refers to 5% statistically significant level, * refers to 10% statistically significant level.
Explanatory Variables Dependent variable: Horticultural Area Village-level data Household-level data OLS Tobit OLS Tobit Quartile income dummies Poor 309.08
(2.29)** 430.33
(2.09)** 1.25
(1.76)* 1.71
(1.70)* Above average 233.68
(1.14) 382.11 (1.82)*
0.62 (0.95)
1.79 (1.76)*
Rich 149.59 (0.84)
517.31 (2.32)**
2.60 (1.78)*
1.78 (1.66)*
Interaction of income dummies and Year-2004 dummy Very poor 156.58
(1.66)* 342.79 (1.68)*
3.80 (4.62)***
4.58 (4.82)***
Poor -8.20 (0.05)
80.82 (0.42)
2.01 (2.56)**
2.21 (2.33)**
Above average -110.62 (0.64)
15.70 (0.08)
2.20 (2.81)***
2.59 (2.75)***
Rich 105.34 (0.50)
157.29 (0.83)
-0.37 (0.19)
1.55 (1.57)
Concentric ring dummies and Geographical factors 60KM ring 361.85
(2.05)** 315.54
(2.09)** -3.13
(2.08)** -0.84 (1.01)
80KM ring 20.03 (0.21)
-33.83 (0.21)
-2.42 (1.68)*
0.12 (0.17)
100KM ring 104.41 (0.93)
-10.72 (0.06)
-4.53 (2.94)***
-3.14 (4.13)***
140KM ring -63.93 (0.56)
-361.81 (2.04)**
-4.74 (3.06)***
-2.52 (3.26)***
Mountain 129.95 (1.32)
395.56 (2.61)***
2.68 (3.45)***
1.75 (2.90)***
Distance to Road -1.79 (1.03)
-1.15 (0.31)
-0.05 (0.96)
0.04 (0.66)
Socio-economic factors Land area -0.0004
(0.01) 0.088
(1.86)* 0.17
(1.55) 0.18
(9.49)*** Irrigated land area 40.93
(0.28) 38.69 (0.23)
-- --
Migrant_share -524.49 (4.51)***
-735.01 (3.19)***
-0.25 (0.34)
-1.67 (2.20)**
Self-employed business_share -0.44 (0.64)
-2.26 (1.92)*
--
--
Observations 400 400 988 988 Adjusted R2 (Pseudo R2 for Tobit) 0.1 0.01 0.08 0.03
35
Table 4. Regression Analysis of the Impact of Horticultural Production on Household Income in Greater Beijing, 2000 and 2004.
Impacts on household’s income Explanatory variables Plant VFN area, A (mu) Total Crop
Predict A
40.42 (0.37)
76.90 (2.00)**
Household characteristics Head's age (year) 0.01
(0.22) -18.52 (0.36)
-33.95 (1.54)
Head's educational (year) 0.34 (3.49)***
470.69 (2.76)***
103.95 (1.42)
Land area (mu) 0.17 (7.70)***
196.65 (2.43)**
248.16 (6.21)***
Labors (person) -0.11 (0.42)
1204.43 (3.34)***
125.01 (0.92)
Off-farm labor share (%) -2.21 (2.48)**
7543.03 (4.17)***
-1066.74 (1.58)
Asset per capita in 2000 (yuan) -0.00 (1.96)**
0.23 (2.89)***
0.01 (1.15)
Concentric ring dummies and geographical factors 60km ring dummy -0.91
(0.95) -1914.15
(1.06) 1209.95 (1.72)*
80km ring dummy -1.00 (1.09)
-1860.97 (1.20)
-589.45 (1.01)
100km ring dummy -1.66 (1.84)*
-43.83 (0.02)
334.35 (0.56)
140km ring dummy -2.79 (3.18)***
-1175.54 (0.53)
1035.44 (1.39)
Distance from village to county (km) -0.00 (0.00)
-45.58 (2.12)**
-15.30 (2.09)**
Mountain village dummy 1.12 (1.46)
801.00 (0.52)
-41.08 (0.07)
Policy and Other control variables Village with “Grain for Green” program
4.51 (6.61)***
-178.67 (0.11)
-1777.69 (2.94)***
Share of households planting VFN in the village (%)
3.50 (4.72)***
Year phased out grain quota procurement
-0.08 (2.11)**
Constant 162.40 (2.03)**
398.52 (0.30)
4094.51 (2.16)**
Observations 988 494 494 R2 0.03 0.29 0.46
Note: *, ** and *** indicate statistically significant at 10%, 5% and 1%, respectively. Note: in the first stage, we use 2 years data to estimate the planted area of VFN and then use the predicted values of VFN in 2004 in the second stage estimation of their impacts.
36
Table 5. Supply and Marketing Channels of Horticultural Markets in Greater Beijing Area, 2004
Panel A: First-time buyers (percent) Modern Supply Chains Traditional Supply Chains Other Supply Chains
Supermarkets Specialized suppliers
Processing firms
Small traders
Farmers sell in local periodic
markets Cooperatives
Consumers direct
purchase from farmers
Others1
Horticultural Crops 0 2 2 79 8 0 7 2 Vegetables 0 3 5 82 5 0 1 3 Fruit 0 1 1 75 11 0 9 3 Nuts 0 6 0 88 3 0 3 0
Panel B: Location of First Transaction (percent)
Farmer's fields Village center Roadside
Periodic markets
Wholesale markets
Urban wetmarkets Others2
Horticultural Crops 65 9 3 6 11 4 2 Vegetables 64 0 3 6 18 9 0 Fruit 60 12 3 9 12 3 2 Nuts 86 11 0 0 0 0 4
Panel C: Second-time Buyers (percent) Modern Supply Chains Traditional Supply Chains Other Supply Chains
Supermarkets Specialized suppliers
Processing firms
Small traders
Traders sell to consumers in
periodic markets
Cooperatives Others
Horticultural Crops 3 3 10 49 13 0 22 Vegetables 6 0 6 57 11 0 20 Fruit 1 2 9 46 16 0 26 Nuts 3 10 19 50 6 0 12
37
1 “Others” (first time buyers) includes purchases by agents of hotels or restaurants, gifts to other farmers or procurement by organized groups (such as enterprises for distribution to their workers).
2 “Others” (second time buyers) includes sales to other villages and sales to market sites that supply processing and other food firms.
38
Table 6. Procurement channels at the farmgate: the buyer to whom tomato and cucumber producers sold their produce in Shandong sample village, 2000 and 2005.
Tomato villages
Cucumber villages
2000
2005
2000
2005
Small traders
(%)
22
(%)
15
(%)
14
(%)
14
Wholesalers 77 84 77 78 Special suppliers 0 0.004 0.4 0.3 Processing firms 0 0.2 1 3 Supermarkets 0.1 0.3 0 0.1 Associations 0 0 0 2 Exporters 0 0 2 1 Consumers
1 0.4 5 1
Source: Authors’ survey. Note: Data are from question posed to the farmers in the focus group: To whom did you sell your tomatoes (cucumbers)?
39
Table 7. Wholesale vegetable market channels in selected markets in Beijing. 2000 & 2005. Buyers Beijing Xinfadi Baliqiao Dongjiao 2000 2005 2000 2005 2000 2005 2000 2005 Small traders 10.8 9.3 12.1 10.5 4.5 3.7 0 0 Small retailers 62.3 55.7 64.7 58.5 61.3 44.4 24.9 29.8 Wholesalers 12.6 9.8 14.2 10.2 5.0 11.5 0 0 Special suppliers 0 0.01 0 0.02 0 0 0 0 Processing firms 0.1 0.1 0 0.08 0.50 0.24 0 0 Supermarkets 3.6 9.3 2.7 8.5 9.6 13.9 8.2 13.7 Consumers 3.8 4.6 0.0 0.8 10.1 14.8 54.6 48.8 Restaurants 6.8 10.9 6.2 11.1 8.9 11.4 12.3 7.8 Group purchasing 0.1 0.3 0.1 0.4 0 0 0 0 Note : Group purchasing includes government units, enterprises, etc. (mostly purchasing for special occasions in which employees are given boxes of fruit and vegetables as an in-kind bonus). Source: Author’s survey
40
Table 8. Sources of Vegetable Procurement of Supermarkets in Beijing in 2006. Sources of Vegetable Procurement Share (%) 1 Direct purchases from “Wholesalers” in Xinfadi and other small urban and suburban wholesale markets [These firms typically have 2-6 people as employees. Most of them do not have any fixed shop in the market. Instead, they use their trucks as their places of business. All transactions on spot market basis]
20
Sources of their supplies 1.1 Procured by themselves from farmers
8
1.2 Procured by agents from farmers 12 2 Direct purchases from “Small Farm Product Delivery Companies” [These firms are similar in size and nature to regular wholesalers (i.e., same as #1). In fact, in the market “Small Farm Product Delivery Companies” are indistinguishable from “Wholesalers.” The nature of their dealings with supermarket (they work on a spot market basis, they do not issue receipts; they do not have contracts with either supermarkets or suppliers) and the nature of their supply sources are similar. The only difference is that the firm is renting a shop in or around the wholesale market.
43
Sources of their supplies 2.1 Procured by themselves from farmers
10
2.2 Procured by agents from farmers 3 2.3 Procured by themselves from wholesalers in Xinfadi 30 3 Procured from “Large Farm Product Delivery Companies” [These firms are, in fact, wholesalers, who in their sources of supply look just like any other wholesaler. In making purchases, they mostly use agents, who are really just small traders that are selling to a single buyer—however, under no contract. The biggest difference is their size. Typically, such a firm has more than 30 people. Because of their size, they are targets of tax collection by local authorities and pay taxes on some of their transactions. Most, but not all, have contracts with supermarkets, although the nature of the contracts appear to be fairly loose and most of the relationship is based on mutual performance. Some of sales is done on a credit basis. With the exception of a small amount (5 percent from their own production bases), most of their supply channels (and terms of procurement) are indistinguishable from those of “Wholesalers” and “Small Farm Product Delivery Companies”
22
Sources of their Supply 3.1 Procured directly from farmers
6
3.2 Procured by agents from farmers 9 3.3 Procured from Small Farm Product Delivery Companies 1 3.4 Procured from Wholesalers 1
3.5 From their own production bases 5 4 Supermarkets procured by farmers directly without contract 12
Sources of Supply 4.1 Either by agents or employees (which almost universally were
formerly small traders themselves).
5 Supermarkets procured from farmers directly with contracts 2 6 Supermarkets’ own production base 1 Source: Authors’ Survey
41
xx
x
x
x
xx
x
x
x
xx
x
x
x
x
x
x
x
x
x
x
x
x
x
x
x
x
x
36o
406080
100140
x
x
x
x
x
x
xx
xx
x x
x
xx x
xx
x
xx
Total Town Sample Size:
5 circles x
10 towns per circle =
50 towns
(or Nt = 50)
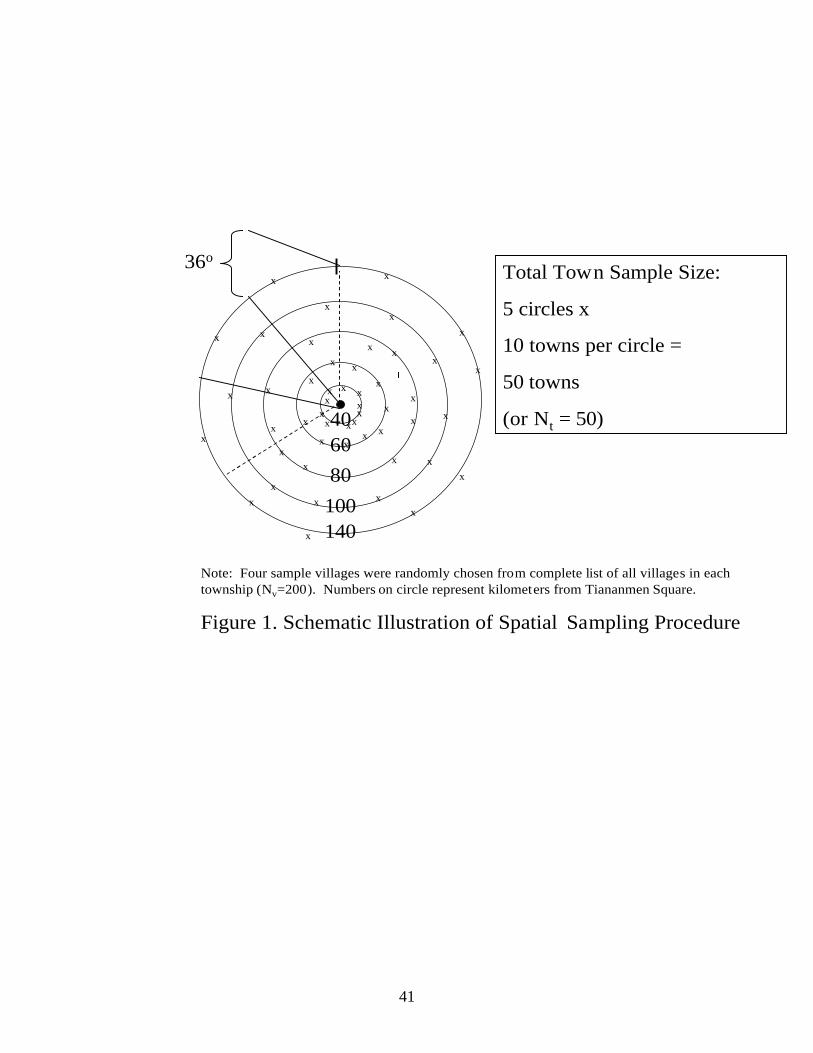
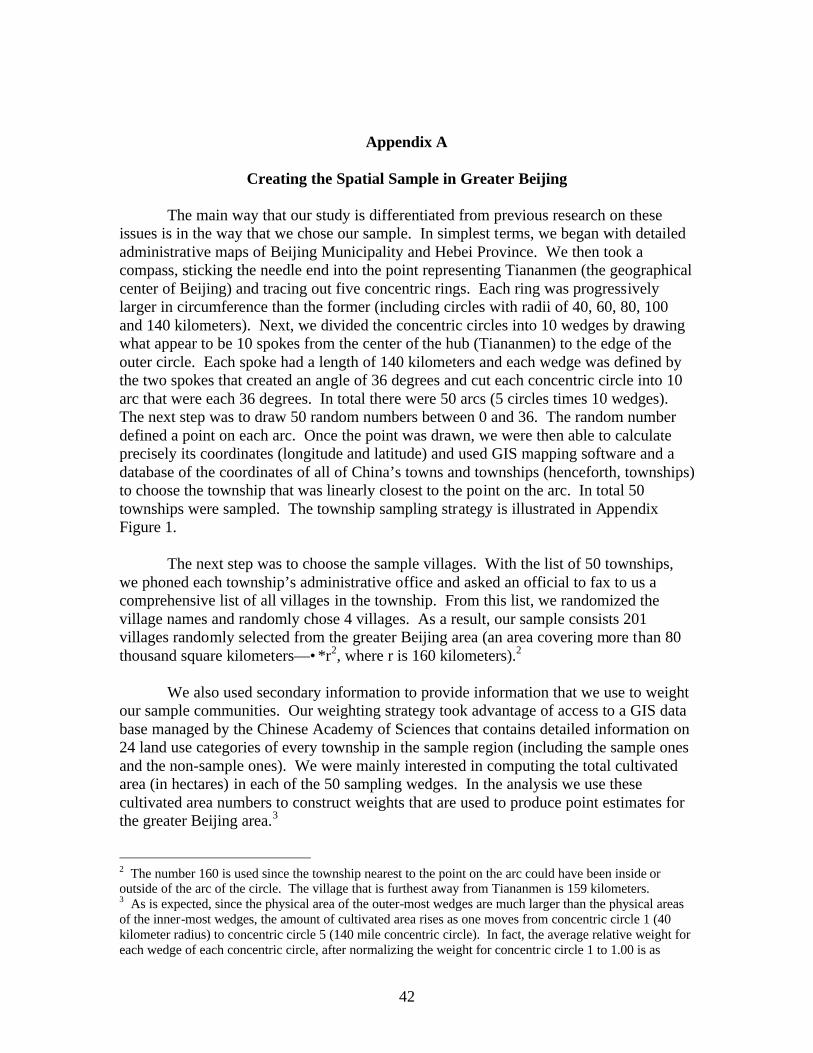
Note: Four sample villages were randomly chosen from complete list of all villages in each township (Nv=200). Numbers on circle represent kilometers from Tiananmen Square.
Figure 1. Schematic Illustration of Spatial Sampling Procedure
42
Appendix A
Creating the Spatial Sample in Greater Beijing
The main way that our study is differentiated from previous research on these issues is in the way that we chose our sample. In simplest terms, we began with detailed administrative maps of Beijing Municipality and Hebei Province. We then took a compass, sticking the needle end into the point representing Tiananmen (the geographical center of Beijing) and tracing out five concentric rings. Each ring was progressively larger in circumference than the former (including circles with radii of 40, 60, 80, 100 and 140 kilometers). Next, we divided the concentric circles into 10 wedges by drawing what appear to be 10 spokes from the center of the hub (Tiananmen) to the edge of the outer circle. Each spoke had a length of 140 kilometers and each wedge was defined by the two spokes that created an angle of 36 degrees and cut each concentric circle into 10 arc that were each 36 degrees. In total there were 50 arcs (5 circles times 10 wedges). The next step was to draw 50 random numbers between 0 and 36. The random number defined a point on each arc. Once the point was drawn, we were then able to calculate precisely its coordinates (longitude and latitude) and used GIS mapping software and a database of the coordinates of all of China’s towns and townships (henceforth, townships) to choose the township that was linearly closest to the point on the arc. In total 50 townships were sampled. The township sampling strategy is illustrated in Appendix Figure 1.
The next step was to choose the sample villages. With the list of 50 townships,
we phoned each township’s administrative office and asked an official to fax to us a comprehensive list of all villages in the township. From this list, we randomized the village names and randomly chose 4 villages. As a result, our sample consists 201 villages randomly selected from the greater Beijing area (an area covering more than 80 thousand square kilometers—•*r2, where r is 160 kilometers).2
We also used secondary information to provide information that we use to weight
our sample communities. Our weighting strategy took advantage of access to a GIS data base managed by the Chinese Academy of Sciences that contains detailed information on 24 land use categories of every township in the sample region (including the sample ones and the non-sample ones). We were mainly interested in computing the total cultivated area (in hectares) in each of the 50 sampling wedges. In the analysis we use these cultivated area numbers to construct weights that are used to produce point estimates for the greater Beijing area.3
2 The number 160 is used since the township nearest to the point on the arc could have been inside or outside of the arc of the circle. The village that is furthest away from Tiananmen is 159 kilometers. 3 As is expected, since the physical area of the outer-most wedges are much larger than the physical areas of the inner-most wedges, the amount of cultivated area rises as one moves from concentric circle 1 (40 kilometer radius) to concentric circle 5 (140 mile concentric circle). In fact, the average relative weight for each wedge of each concentric circle, after normalizing the weight for concentric circle 1 to 1.00 is as
43
Appendix B
Community Surveys of Horticulture Production and Marketing in Shandong Province
In Shandong, we conducted two coordinated, community level and wholesale
market surveys. The first one, the Shandong village survey, is a provincial representative sample of tomato and cucumber growing villages in China’s main horticulture-producing province. The first step in conducting the survey involved creating two sampling frames of county-level tomato production and county-level cucumber production in order to choose the five sample counties per crop. With a knowledge of the total production environment in Shandong for each crop, we ranked counties by the level of output per capita. We then divided the counties in Shandong into 3 groups: high production; medium production and low production counties. In our sample, one high production county was randomly selected from the counties in the top quintile; the other high production county was randomly selected from the second decile. The two medium production counties were randomly chosen from the third and fourth quintiles. There was only one low production county chosen. After eliminating the five percent of the counties with the lowest production, the low production county was randomly chosen from the lowest quintile. In the end for each crop there were 2 counties in the high production set of counties; 2 counties in the medium production set of countries and 1 county in the low production set of counties. The total level of production in each set of countries provided data for our weighting system (which is used to create point estimates for provincial averages of each of our variables).
After the sample counties were chosen, a relatively similar process was used to
select sample townships and villages. In total for each crop, the survey teams visited 10 townships. Moreover, for each crop (for the five counties and 10 townships), we interviewed village respondents in 35 villages (22 in high production counties; 10 in medium production counties; and 3 in low production counties). Since we collected area data on all village, townships and counties in the sample we were able to construct area-based weights in order to be able to create point estimates of our variable that are provincial representative.
After choosing the villages the enumeration team then visited each community and ran two data collection activities. One enumerator conducted a two hour, sit-down survey with the village leader, village accountant and an experienced farmer with vegetable production experience. Another set of enumerators convened a focus group with seven randomly selected farmers (with all leaders excluded), including 2 relatively large growers; 2 medium-sized growers; 2 small growers; and one with no experience. In follows: concentric circle 2=1.35; concentric circle 3=1.63; concentric circle 4=2.96; concentric circle 5=4.83.
44
this survey, information on the village’s farming and general economic characteristics were enumerated. The respondents also provided information on the village’s horticulture producing history as well as recounted previous policy and other government-initiated efforts to extend fruit and vegetables (and tomato and cucumbers) into the village. A profile of local markets and neighboring marketing venues were also part of the survey. In general, the main task of the village leader survey was to create a set of data that describe the production and marketing environment within which the village’s farmers operated. The main task of the focus group was create a comprehensive set of information on production, technology, marketing and constraints faced by farmers in their production and marketing activities. In particular, intensive questions were asked about marketing channels of the produce. To the extent possible, we tried to get the groups of farmers to tell us the typical way in which farmers in the village marketed their output and to whom that buyer sold. This information was asked for 2000 and 2005 to allow us to understand the direction of change (if any) of horticulture marketing at the village level.
45
Appendix C
Wholesale Market Data from Greater Beijing and Shandong
Beijing
In the Beijing area, we conducted a wholesale market survey in order to try to track the flows of fruit and vegetables, in general, and tomatoes and cucumbers, in particular, into and out of Beijing. We began to select the sample by creating a map of all of the wholesale markets in the Greater Beijing Area (Figure 2). This map was created from interviews of traders in a number of markets that we visited on a pre-survey trip. We also supplemented this information with expert opinion from the Beijing marketing bureau. After creating the map, we checked back with our respondents and when we were unable to identify any additional markets, we considered the map complete.
During the pretest, we also collected information on whether or not the markets were large or small. We discovered that in Beijing there were three large wholesale markets (accounting for about 85 percent of all volume) and there were 37 small wholesale markets that accounted for the other 15 percent. All of the large markets were located outside of the city in the suburban areas. Of the small markets, we divided them into two groups: those inside the fifth ring road (or in the city center or small urban wholesale markets); and those outside the fifth ring road (or in the surburbs). We discovered that although there were more small urban wholesale markets (25 of them), their sales volumes were relatively small. In contrast, compared to small urban markets, the small suburban markets had substantially greater volumes. On the basis of this information, we were able to estimate that the smaller suburban wholesale markets accounted for 10 percent of the sales volume in Beijing and the smaller urban wholesale markets accounted for only 5 percent of the overall sales volume. Therefore, when we construct totals for Beijing our weights are 85 percent for large wholesale markets; 10 percent for small suburban wholesale markets; and 5 percent for small urban wholesale markets. With these weights established, we then took a list of each of the three types of wholesale markets and randomly chose one of them for inclusion into our survey. After choosing the sample markets, our project team enumerators then visited each market and randomly chose a subset of traders for interviewing. To chose them, we divided the market into spatial sections and randomly chose a trader from each. In total, in the large wholesale market, we surveyed 20 wholesalers—10 tomato wholesalers and 10 cucumber wholesalers (Appendix Table 1). In the smaller wholesale markets (suburban and urban ones) we also surveyed 20 wholesalers (10 markets in each market), also 10 tomato wholesalers and 10 cucumber wholesalers. During the survey, we asked the wholesalers primarily about the sources of their purchases and the destination of their sales. In addition, we collected information about the nature of their transactions: who
46
purchased for them (their own firm members; agents; or on spot markets from traders); the terms of payment (credit; cash; etc.); and whether or not there was any contract. Shandong Wholesale Markets In addition to collecting information from 70 villages in Shandong (70 village leaders and 70 groups of farmers), we also included a set of interview/surveys with traders in the local wholesale markets. Unlike the results of two sets of village and household surveys in Greater Beijing done as part of another research project in 2005, from the Shandong village leader and focus group interviews/surveys we discovered that by far the most common marketing channel was for farmers to take their horticulture product from their village to the local wholesale market for sale to a large set of wholesale traders who were operating in the market. This type of marketing channel allowed us to conduct a follow-on survey of the second link in the supply chain by interviewing traders in two representative wholesale markets. To choose our sample, we proceeded as we did in the Beijing wholesale survey, spatially selecting a set of random traders. These traders were then asked a set of questions about the sources of their supply; the targets of their sales destinations and the ways in which they did business (e.g., contracting terms) with their suppliers and buyers.