Embed Size (px)
Citation preview
Horticulture's submission to
"Ensuring a profitable and sustainable
agriculture and food sector in Australia"
white paper - Stage II
Jan Paul van Moort Hassall & Associates
Project Number: AH05026
AH05026 This report is published by Horticulture Australia Ltd to pass on information concerning horticultural research and development undertaken for Australian Horticulture. The research contained in this report was funded by Horticulture Australia Ltd. All expressions of opinion are not to be regarded as expressing the opinion of Horticulture Australia Ltd or any authority of the Australian Government. The Company and the Australian Government accept no responsibility for any of the opinions or the accuracy of the information contained in this report and readers should rely upon their own enquiries in making decisions concerning their own interests. ISBN 0 7341 1181 9 Published and distributed by: Horticulture Australia Ltd Level 1 50 Carrington Street Sydney NSW 2000 Telephone: (02) 8295 2300 Fax: (02) 8295 2399 E-Mail: [email protected] © Copyright 2005
"Ensuring a profitable and sustainable agriculture and food sector in Australia" White Paper
Agriculture and Food Policy Reference Group
Final Horticulture Sector Submission
Submitted by
Horticulture Australia Limited
On behalf of the Australian Horticulture Sector October 2005
EXECUTIVE SUMMARY
This Submission Horticulture Australia Limited has prepared this submission to the Agriculture and Food Reference Group White Paper “Ensuring a profitable and sustainable agriculture and food sector in Australia” on behalf of the horticulture sector.
The Australian Horticulture Sector
A Diverse Sector Horticulture is Australia’s second largest agricultural sector. It contributes an average of $6.9 billion to GDP per year, $0.8 billion of which is exported. The sector is diverse comprising over 140 commodities including fruit, nuts, vegetables, nursery, extractive crops, cut flowers, turf and table and dried grapes.
Sustained Growth
Australian horticulture has been a growth sector of the Australian economy for the past 10 years. GVP has grown at 6.6% and production at 1.2% per annum. The diversity of the sector has been crucial to sustaining growth.
Significant Employment
Horticulture employs 108,000 people, accounting for 25% of agricultural employment in Australia.
Strong Regional Contribution
Two-thirds of horticulture’s value is generated in regional Australia, where 71,600 of the sector’s 108,000 workers are employed.
Horticulture Markets and Associated Challenges
Global Competitiveness is the Benchmark
The horticulture sector is operating in an increasingly competitive globalised environment. Many of the sector’s major competitors operate in lower cost environments than Australia’s. The future success of the horticulture sector is dependent upon its’ capacity to compete in the global, rather than domestic market place.
Requiring a Proactive Approach
Horticulture’s R&D structures, range of representational bodies for all components of the sector and competitive supply chain, provide a sound basis to adopt a proactive approach to becoming globally competitive. With many sub-sectors are already successfully opening markets, developing new products, increasing productivity and improving resource use.
And Collaborative Effort with Government
To ensure the sector successful makes the shift will also require a collaborative effort between the all parts of the sector and government. The following recommendations on government and the sector working together will improve horticulture’s competitiveness and assist communities through change.
Horticulture Australia Limited Submission to the Agriculture and Food Reference Group i
Market Access, Biosecurity and Quarantine Integrity
Market Access Biosecurity and Quarantine
Securing export market access and sustaining the integrity of domestic markets, biosecurity and quarantine is crucial to horticulture. Current arrangements can be significantly improved by:
• In coordination with government agencies, fully incorporating trade policy and strategy into market access, consistent with the maintenance and application of a science-based approach;
• Negotiating non-quarantine market access to obtain equivalent outcomes with trading partners;
• Putting in place market access protocols and work plans which reflect commercial reality, in coordination with industries:
• Expanding biosecurity plans to include Threat-Specific Contingency Plans and Pest Risk Analysis to strengthen sector biosecurity and assist domestic trading protocols;
Institutional and R&D Capacity
• Sufficiently investing in the institutions underpinning our biosecurity and quarantine, particularly Plant Health Australia, Biosecurity Australia and AQIS;
• Maintaining a R&D sector that is able to inform the science based, precautionary approach to quarantine; and particularly the development and implementation of Biosecurity Plans;
• Directing R&D at the requirements and priorities of market access, including export markets, as determined by the strategies and priorities of the horticulture sector;
Domestic Market Regulation
• Rapidly implementing the Mandatory Code of Conduct and country of origin labelling in the domestic market; and
• Continued vigorous monitoring by the ACCC, and where required applying the Trade Practices Act to maintain the effectiveness of the domestic market.
Enhancing Supply Chain Flexibility
Information Co-investment
Facilitate the development of efficient and flexible supply chains by:
• Providing information on horticultural production and performance at a farm, industry and sector scale, as done for other industries; and
• Co-investment with the sector to develop markets and industry skills and capacity to improve the enabling conditions for on-going investment in the supply chain.
Horticulture Australia Limited Submission to the Agriculture and Food Reference Group ii
Improving Labour Supply and Productivity
Improving Supply Developing Skills
Increasing supply and productivity of labour by:
• Changing current temporary visa requirements to allow workers to be employed by a single employer for the period of their stay, increasing the duration of visas and allowing multiple returns;
• Scoping and trialing a guest worker visa program to address labour shortages in the horticulture sector; and
• Undertaking on-going skilling of employers and employees.
Research & Development, Innovation and Technology
Flexible Resources Greater Leverage Strong Institutions and Skills Increased Coordination
To ensure R&D, innovation and technology adoption underpin the success of the horticulture sector in Australia, it is crucial to maintain the sector-owned R&D body by:
• Increasing flexibility to address the evolving challenges by replacing existing R&D and marketing levies with a single levy. In order to allow the sector to balance allocating resources between the two according to the requirements of implementing industry strategic plans;
• Achieving better leverage for the Australian Government investment by matching R&D and marketing levies at 2:1 and 1:1 respectively; and
• Maintaining the science/technology capability of R&D institutions and individuals as a key driver of competitiveness;
• Better focus on R&D that supports technical solutions that maximise market access outcomes, and
• Increasing co-investment in advisory services to facilitate technology adoption; and
• Achieving greater coordination of government co-investment in the sector by ensuring all government programs are focused on addressing the strategic priorities of horticultural industries and relevant initiatives such as NFIS are implemented through HAL.
Horticulture Australia Limited Submission to the Agriculture and Food Reference Group iii
Accessing and Sustaining Natural Resources
Natural Resource Management
In order to ensure that the horticulture sector has access to water, while sustaining the natural resource base, it is crucial that the sector and government work in partnership to:
• Make explicit and regularly report the reliability of water to users (probability of annual allocations in the short term and long term);
• Recognise the high water reliability that is required for permanent horticultural crops, and the huge cost of replanting if permanent crops suffer from water restrictions;
• Improve access to water for horticulture, by researching and implementing safe wastewater recycling and stormwater schemes, and enabling irrigators access to water trading systems;
• Ensure that town water restrictions do not unfairly limit access to water to horticulture (compared to other urban industry users) and are developed in consultation with the nursery and garden industry;
• Assist in the development of new technology and practices for improved water management to continue to enhance environmental performance, both on-farm and off farm;
• Plan and invest in the recapitalisation of Australia’s water infrastructure;
• Ensure ageing irrigation or drainage infrastructure and new irrigation schemes are designed with levels of service that do not limit horticulture's ability to adopt modern practice;
• Ensure on-going R&D and innovation drives improved water use efficiency; and
• Develop natural resource and planning policies that are targeted and use non-regulatory approaches to achieve efficient natural resource outcomes where appropriate.
Assisting Communities through Change
Government needs to work with the horticulture sector to gain a greater understanding of the adjustment likely to occur in the next 5 – 10 years and plan for the implications on rural communities. A statement of socio-economic impacts on all stakeholders within a region should be undertaken when a major structural adjustment place package or other form of Government intervention is planned to take This will allow:
• The development of suitable structural adjustment tools to assist the transition to a globally competitive horticulture sector; and
• Reduce unintended consequences of government programs other sectors.
Horticulture Australia Limited Submission to the Agriculture and Food Reference Group iv
Table of Contents Executive Summary................................................................................................. i 1 Introduction ..................................................................................................1
2 Australian Horticulture..................................................................................2
3 Markets for Australian Horticulture ...............................................................4 3.1 Domestic Markets ........................................................................................... 4 3.2 Export Markets ................................................................................................ 5 3.3 Key Challenges ............................................................................................... 6
4 Market Access, Biosecurity and Quarantine ................................................7 4.1 Trade Policy .................................................................................................... 7 4.2 Biosecurity and Quarantine............................................................................. 8 4.3 Domestic Trade Regulation............................................................................. 9 4.4 Recommendations ........................................................................................ 10
5 Supply Chains............................................................................................11 5.1 Improving Information ................................................................................... 11 5.2 Co-investment in Supply Chain..................................................................... 12 5.3 Recommendations ........................................................................................ 12
6 R&D, Innovation and Technology Adoption ...............................................13 6.1 Competitiveness Underpinned by Multiple R&D Priorities ............................ 13 6.2 Strengthening Institutions and R&D Capacity ............................................... 14 6.3 Recommendations ........................................................................................ 16
7 Labour........................................................................................................17 7.1 Labour Supply and Demand ......................................................................... 17 7.2 Improving Labour Availability and Productivity.............................................. 17 7.3 Recommendations ........................................................................................ 18
8 Using and Managing Natural Resources....................................................19 8.1 Water............................................................................................................. 19 8.2 Natural Resource Management .................................................................... 21 8.3 Recommendations ........................................................................................ 22
9 Rural and Regional Communities ..............................................................23 9.1 Strengthening Communities.......................................................................... 23 9.2 Future of the Sector ...................................................................................... 25 9.3 Recommendations ........................................................................................ 26
10 References.................................................................................................27
11 Appendix: Australian Horticulture Sector’s Production and Employment ...28
Horticulture Australia Limited Submission to the Agriculture and Food Reference Group v
Case Studies of Initiatives and Impact in the Horticulture Sector Case Study 1: Strategic Quarantine R&D to Improve Market Access ....................................... 7 Case Study 2: The Need to Focus on Trade Outcomes............................................................ 8 Case Study 3: Macadamia Nut Industry – Adjusting to Change.............................................. 11 Case Study 4: Horticulture Australia Export Strategic Plan ..................................................... 12 Case Study 5: Understanding the Flesh Browning Disorder in Pink LadyTM Apples................ 13 Case Study 6: R&D Priorities................................................................................................... 14 Case Study 7: Horticulture Sector Institutions ......................................................................... 15 Case Study 8: Sunraysia Mallee – Overseas Workers............................................................ 18 Case Study 9: Improving Water Management in Horticulture.................................................. 20 Case Study 10: Water Initiative ............................................................................................... 20 Case Study 11: Horticulture for Tomorrow .............................................................................. 21 Case Study 12: Go for 2&5™ .................................................................................................. 23 Case Study 13: Predicted Change in the Vegetable Industry.................................................. 25 Case Study 14: Structural Adjustment Options for Horticulture............................................... 26
List of Figures and Tables
Figure 1: Direct Contribution to GDP by Agricultural Sectors ($ billion per annum) .................. 2 Figure 2: Horticulture Regions in Australia ................................................................................ 3 Figure 3: Australia’s Share in the Value of World Trade in Fruit and Vegetables...................... 5 Figure 4: Horticulture Sector Exports ($ billion, % Share of National Exports).......................... 5 Figure 5: Major Horticulture Exports .......................................................................................... 6 Figure 6: Average Annual Employment Contribution of Horticulture (‘000 persons) ............... 24 Figure 7: Average Annual Regional Contribution of the Horticulture Economy ....................... 24 Table 1: Horticultural Provides High Economic and Employment Returns for Water .............. 19 Table 2: Returns to Water and Intensity of Water use by Landuse ......................................... 19 Table 3: Annual Contribution of the Horticulture Economy to GDP ($ million) ........................ 28 Table 4: Contribution of the Horticulture Economy to the Australian Economy 2003-04......... 28 Table 5: Contribution of the Horticulture Sector to the Australian Economy (2003-04) ........... 29 Table 6: Contribution of the Horticulture-Input Sector to Australian Economy (2003-04)........ 30 Table 7: Contribution of the Horticulture-Output Sector to Australian Economy (2003-04) ..... 31 Table 8: Average Regional Employment Contribution of Horticulture (‘000 persons) ............. 32
Horticulture Australia Limited Submission to the Agriculture and Food Reference Group vi
1 INTRODUCTION
Agriculture and Food Reference Group
The Australian Government Minister for Agriculture, Fisheries and Forestry announced the establishment of the Agriculture and Food Reference Group in March 2005.
The Reference Group has been tasked with developing broad recommendations to improve the profitability, competitiveness, and sustainability of the Australian agricultural and food sector.
In May 2005, the Reference Group released the paper, "Ensuring a profitable and sustainable agriculture and food sector in Australia". The paper called for public submissions and outlined that the Reference Group will report to the Minister in December 2005 on four key areas; markets for agriculture and food; competitiveness of Australia agriculture and food business; using and managing natural resources; and rural and regional communities.
Horticulture's Profitability and Sustainability
Horticulture is Australia’s second largest agricultural sector, meeting the majority of domestic demand and contributing to exports.
A range of forces including changing consumer preferences, aging farming community, raised awareness of sustainable farming practises, globalisation, increasing cost of compliance and urban encroachment are changing the face of the horticulture sector. Decisive action to respond to and deal with the changing business environment is essential to ensure Australia retains a profitable and sustainable horticulture sector well into the future.
A supportive and coordinated “whole of government” policy approach to horticulture, which interacts effectively with the sector, is an essential component of the enabling environment the sector will require in order to face and overcome its challenges.
Horticulture's Submissions to the Reference Group
Horticulture Australia Limited (HAL) is the sector’s marketing and research and development organisation. The Industry Management Committee (IMC) is a subcommittee of HAL, focusing on over-arching issues affecting all horticulture or a majority of the industry members. The committee consists of the CEO’s of the eight largest industries (vegetables, apples and pears, citrus, nursery, macadamias, mushrooms and avocados), a voluntary levy contributor (Growcom), one representative of smaller industries and the Managing Director of HAL.
This submission was prepared on behalf of the IMC, with input from committee members, HAL personnel and industry experts. The submission was funded by all horticultural industries through HAL. This submission outlines:
• The benefit of horticulture to Australia; • Horticulture markets and associated challenges; • New and current ways forward by improving the sector
competitiveness and assisting communities to change.
Horticulture Australia Limited Submission to the Agriculture and Food Reference Group 1
2 AUSTRALIAN HORTICULTURE
A Diverse Sector Australian horticulture is a diverse sector, comprising over 140 commodities including fruit, nuts, vegetables, nursery, extractive crops, cut flowers and turf (Table 5, page 29). Table and dried grapes but not wine grapes, are also part of the sector.
A Growing sector Horticulture has been a growth sector of the Australian economy for the past ten years. GVP has grown at 6.6% pa and production at 1.2% per annum (DAFF 2005). The diversity of the sector has been crucial to sustaining growth.
Horticulture is estimated to have contributed an average $6.9 billion per annum (or 1%) to Australia's Gross Domestic Product (GDP) between 1998/99 and 2003/04. The horticulture sector maintained its share of GDP contribution in the six years to 2003/04 (Econtech 2005).
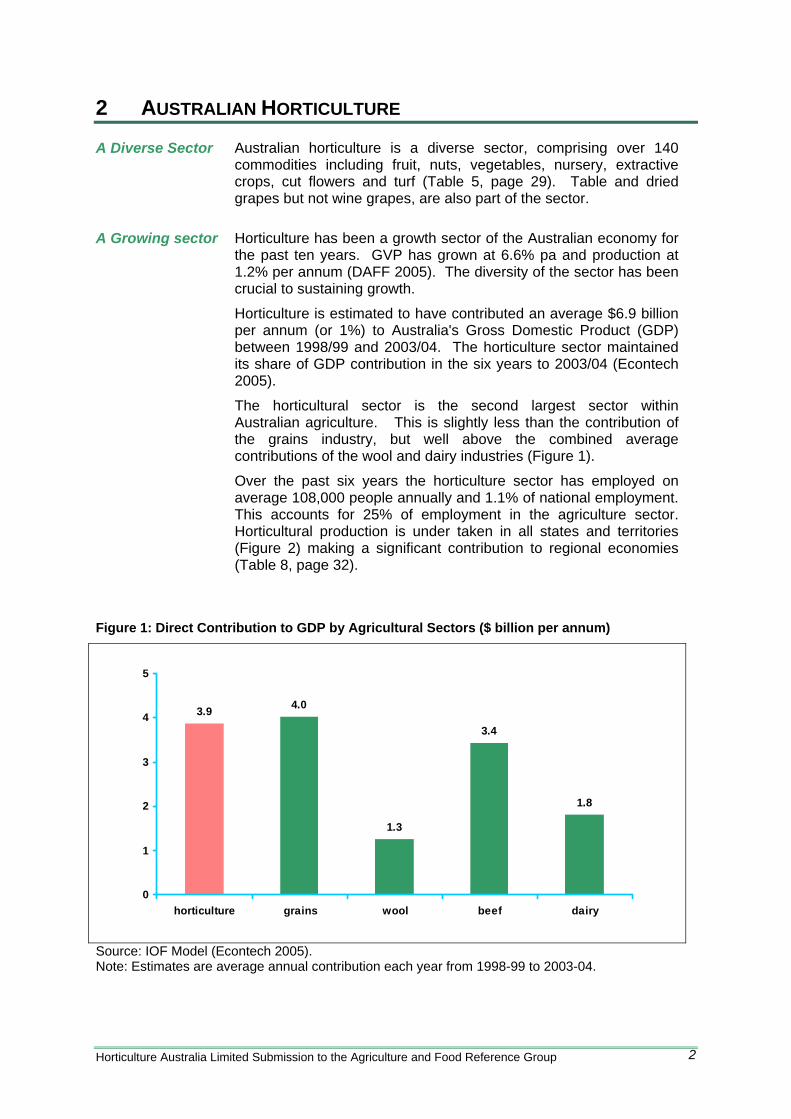
The horticultural sector is the second largest sector within Australian agriculture. This is slightly less than the contribution of the grains industry, but well above the combined average contributions of the wool and dairy industries (Figure 1).
Over the past six years the horticulture sector has employed on average 108,000 people annually and 1.1% of national employment. This accounts for 25% of employment in the agriculture sector. Horticultural production is under taken in all states and territories (Figure 2) making a significant contribution to regional economies (Table 8, page 32).
Figure 1: Direct Contribution to GDP by Agricultural Sectors ($ billion per annum)
3.9 4.0
1.3
3.4
1.8
0
1
2
3
4
5
horticulture grains wool beef dairy
Source: IOF Model (Econtech 2005). Note: Estimates are average annual contribution each year from 1998-99 to 2003-04.
Horticulture Australia Limited Submission to the Agriculture and Food Reference Group 2
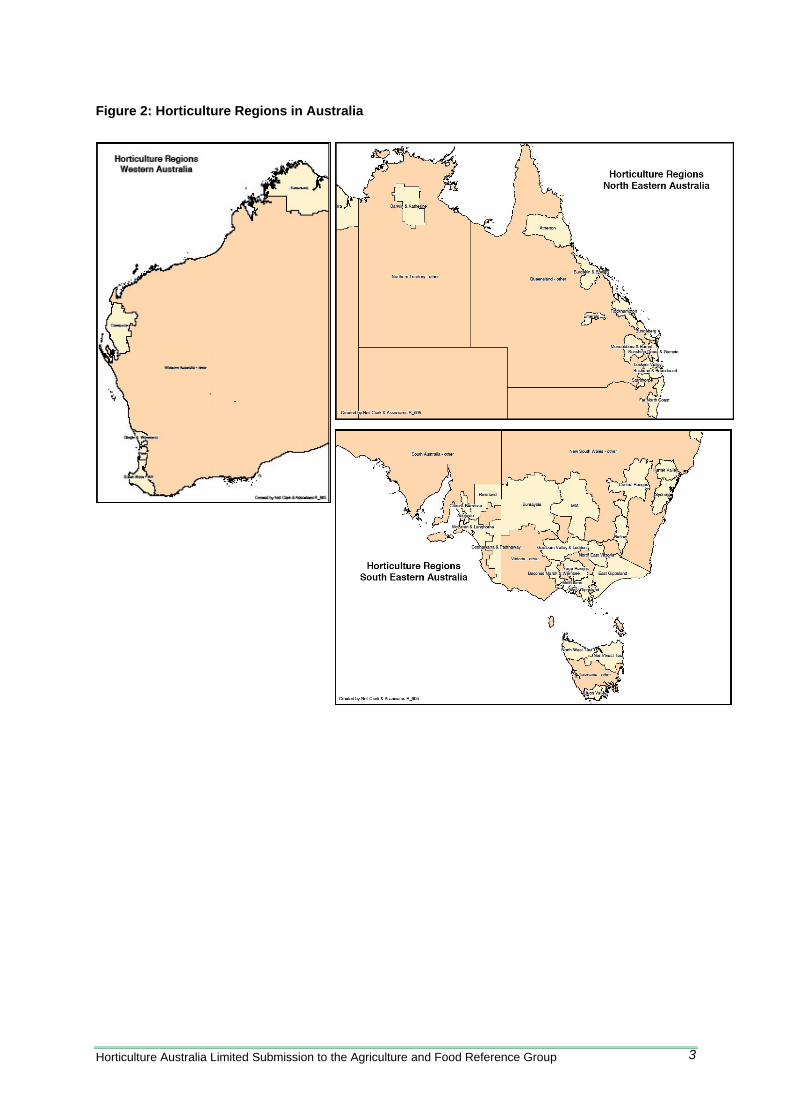
Figure 2: Horticulture Regions in Australia
Horticulture Australia Limited Submission to the Agriculture and Food Reference Group 3
3 MARKETS FOR AUSTRALIAN HORTICULTURE
Consumer Preference and Global Competition are Driving Change
Markets for the Australian horticulture sector are changing in response to evolving consumer preferences and global competition. Key trends in both the domestic and overseas markets include (Austrade 2005):
• Increased consumer interest in wellness, healthy nutritious food and regional cuisines;
• A focus on consumer convenience (year round supply, quality and ‘meal solutions’);
• Stronger food safety, traceability, environmental management;
• Branding of food produce as a point of differentiation; • Increasing “closed loop” supply chains, by the large and
emergent independent retailers, to manage cost and ensure quality and supply; and
• Decreasing prevalence of central wholesale markets as direct retailer-grower contracts expand.
3.1 Domestic Markets
Strong Domestic Presence Australian Horticulture Needs to be Globally Competitive
The Australian horticultural sector has historically focused on supplying the domestic market. Over the past six years domestic GDP of the horticulture sector has averaged $6.1 billion p.a., while exports averaged $0.8 billion p.a. (Econtech 2005). Fresh food and processing markets source approximately 84% of their produce (in terms of value) from domestic growers.
However with a highly competitive domestic market and increasing imports, the following major trends and settings are apparent in Australia (Ridge Partners 2005):
• Slow sales growth in food and fresh food; • Increasing concentration of major chain retailers; • Consolidation of the food service sector; • Changing preferences of consumers; • Retailers and processors increasingly using “global
sourcing”; and • Increased cost pressure on Australian horticultural producers
(For example, imported orange juice and processed potatoes have had a dramatic impact on Sunraysia citrus and Tasmanian potato growers respectively).
Horticulture Australia Limited Submission to the Agriculture and Food Reference Group 4
3.2 Export Markets
Sustained Export Earnings
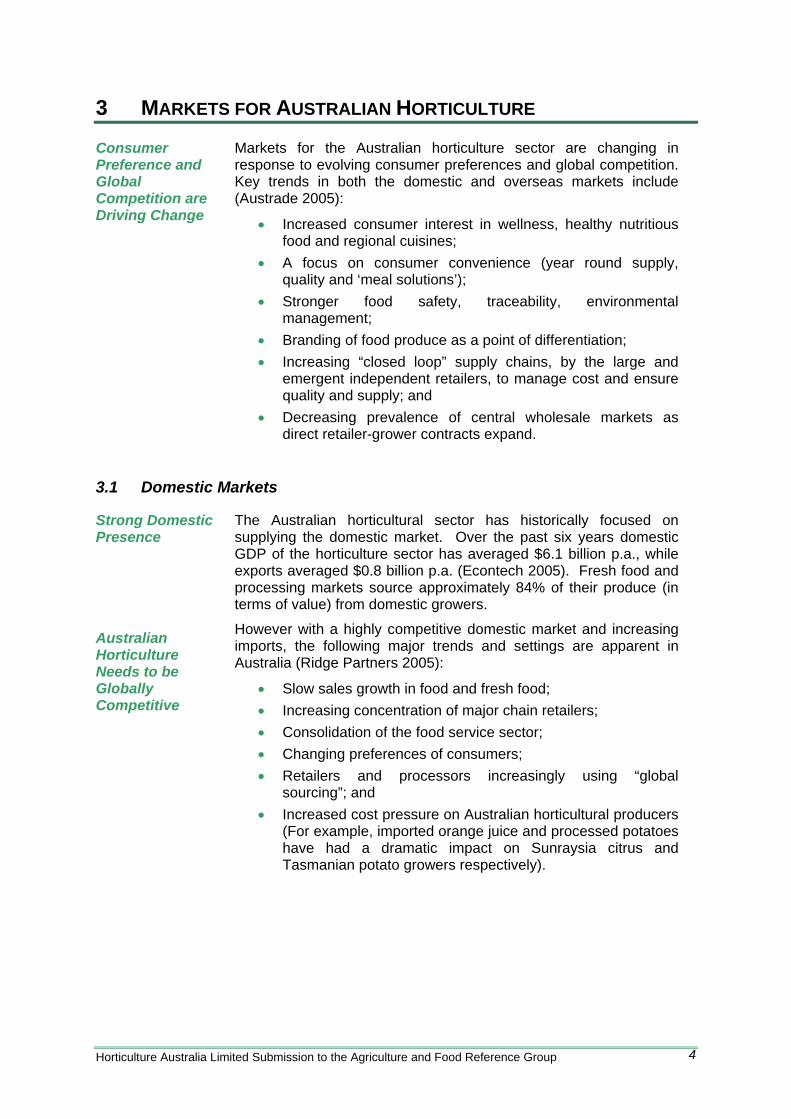
Horticulture exports form a significant part of the horticulture sector. Australia’s contribution to global horticultural trade has steadily increased since the late 1970’s (Figure 3) following the loss of access to European markets at the time.
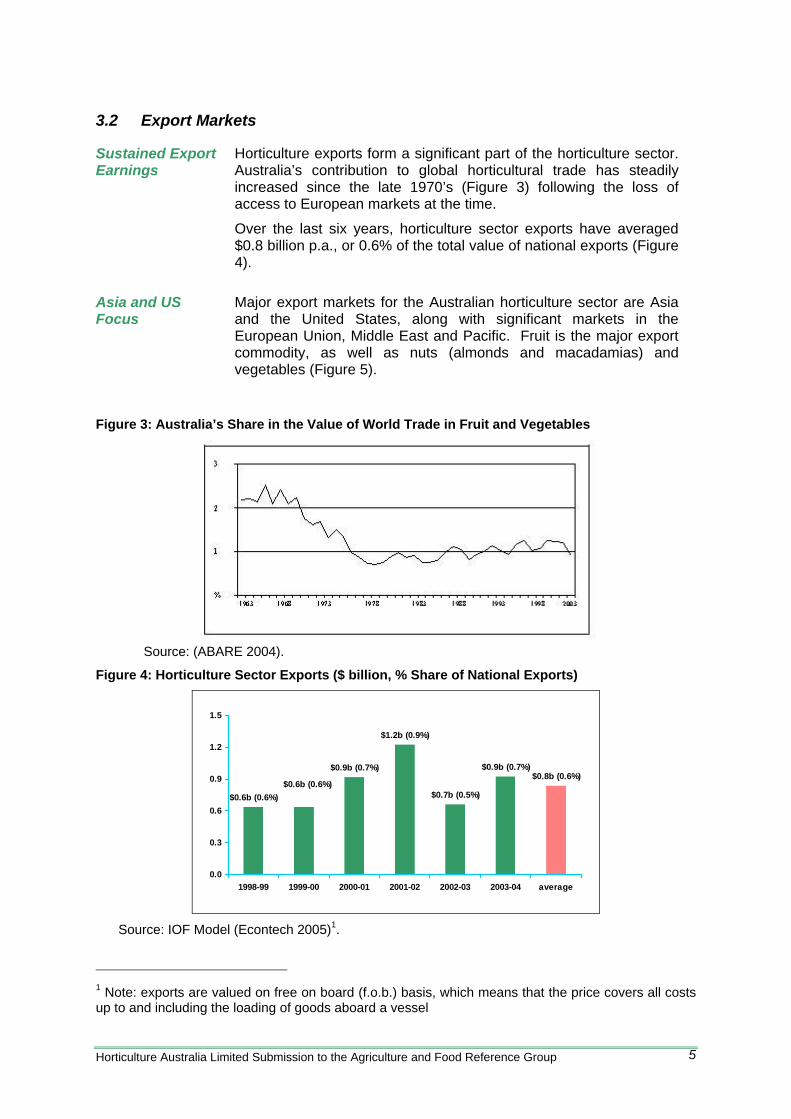
Over the last six years, horticulture sector exports have averaged $0.8 billion p.a., or 0.6% of the total value of national exports (Figure 4).
Asia and US Focus
Major export markets for the Australian horticulture sector are Asia and the United States, along with significant markets in the European Union, Middle East and Pacific. Fruit is the major export commodity, as well as nuts (almonds and macadamias) and vegetables (Figure 5).
Figure 3: Australia’s Share in the Value of World Trade in Fruit and Vegetables
Source: (ABARE 2004).
Figure 4: Horticulture Sector Exports ($ billion, % Share of National Exports)
$0.8b (0.6%)
$0.7b (0.5%)
$1.2b (0.9%)
$0.9b (0.7%)
$0.6b (0.6%)$0.6b (0.6%)
$0.9b (0.7%)
0.0
0.3
0.6
0.9
1.2
1.5
1998-99 1999-00 2000-01 2001-02 2002-03 2003-04 average
Source: IOF Model (Econtech 2005)1.
1 Note: exports are valued on free on board (f.o.b.) basis, which means that the price covers all costs up to and including the loading of goods aboard a vessel
Horticulture Australia Limited Submission to the Agriculture and Food Reference Group 5
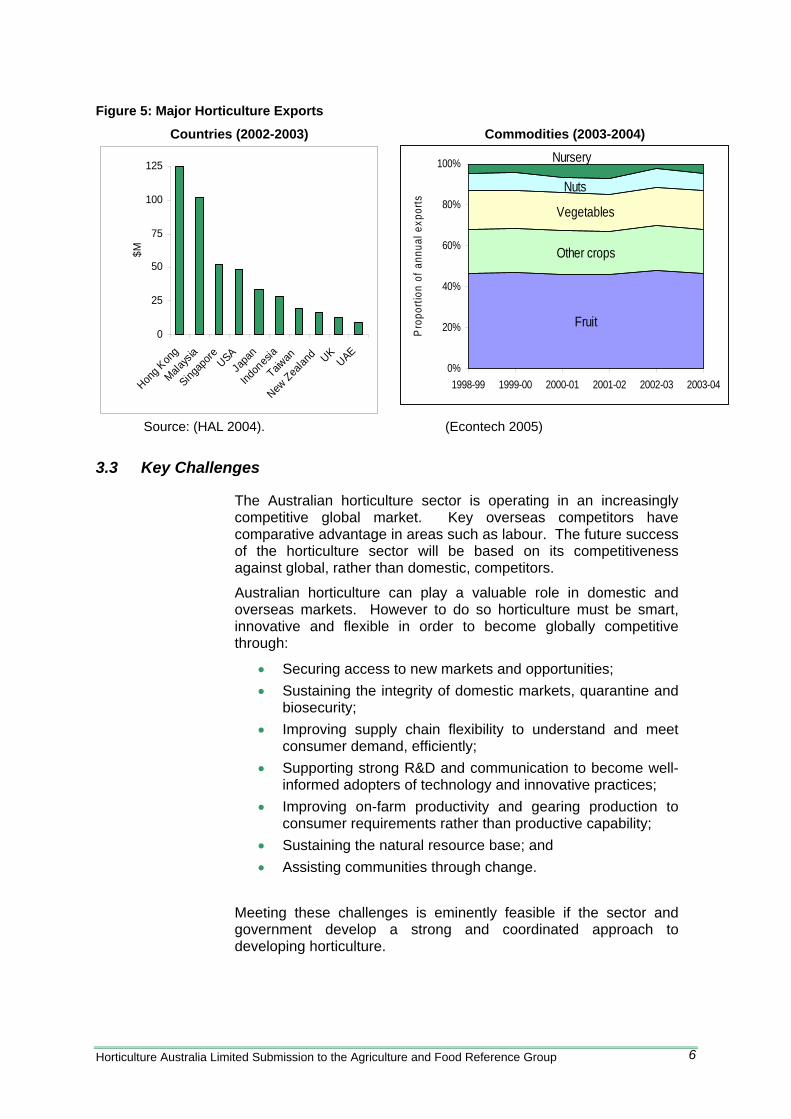
Figure 5: Major Horticulture Exports
Countries (2002-2003) Commodities (2003-2004)
0
25
50
75
100
125
Hong K
ong
Malays
ia
Singap
ore USAJa
pan
Indon
esia
Taiwan
New Zea
land UK
UAE
$M
Fruit
Other crops
Vegetables
Nuts
Nursery
0%
20%
40%
60%
80%
100%
1998-99 1999-00 2000-01 2001-02 2002-03 2003-04
Pro
porti
on o
f ann
ual e
xpor
tsSource: (HAL 2004). (Econtech 2005)
3.3 Key Challenges
The Australian horticulture sector is operating in an increasingly competitive global market. Key overseas competitors have comparative advantage in areas such as labour. The future success of the horticulture sector will be based on its competitiveness against global, rather than domestic, competitors.
Australian horticulture can play a valuable role in domestic and overseas markets. However to do so horticulture must be smart, innovative and flexible in order to become globally competitive through:
• Securing access to new markets and opportunities; • Sustaining the integrity of domestic markets, quarantine and
biosecurity; • Improving supply chain flexibility to understand and meet
consumer demand, efficiently; • Supporting strong R&D and communication to become well-
informed adopters of technology and innovative practices; • Improving on-farm productivity and gearing production to
consumer requirements rather than productive capability; • Sustaining the natural resource base; and • Assisting communities through change.
Meeting these challenges is eminently feasible if the sector and government develop a strong and coordinated approach to developing horticulture.
Horticulture Australia Limited Submission to the Agriculture and Food Reference Group 6
4 MARKET ACCESS, BIOSECURITY AND QUARANTINE
Market Access Inter-governmental market terms and conditions negotiated by import, plant, health and safety authorities are crucial for market access and managing domestic phytosanitary risks domestically and overseas. Areas of particular concern to the future success of the horticulture sector are:
• Quarantine; • Biosecurity; • Food safety; and • Non-quarantine requirements (quotas, tariffs, licences, duties
and other barriers).
Case Study 1: Strategic Quarantine R&D to Improve Market Access
Fruit Fly
• Fruit fly freedom protects horticulture export markets worth $470 million annually.
• The sector is investing in R&D to effectively manage fruit fly to protect markets and develop an additional $50 million annual export value.
Methyl bromide
• Methyl bromide is a quarantine treatment, impacting on $270 million of export value p.a.
• The sector is investing in R&D to improve its current use and develop alternatives in preparation for its likely withdrawal as a quarantine treatment in the next 5-10 years.
4.1 Trade Policy
Equivalent Trade Outcomes Underpin Horticulture’s Competitiveness
In the face of global competition, trade policy and strategy is crucial to maintaining and building market access.
The World Trade Organisation (WTO) and bilateral and multilateral trading agreements have a significant impact on imports in to Australia and our ability to access export markets. To sustain horticulture’s competitiveness government and the sector need to continue to work together through the Horticultural Market Access Committee (HMAC) to seek trade outcomes in target markets which, with respect to non-quarantine barriers, are:
• Effectively liberalising of trade; • Equivalent to those granted into Australia; and • At least equivalent or superior to those granted to other
suppliers under similar agreements into other markets.
Negotiating Market Access is Complex
Negotiating market access through WTO and Free Trade Agreements mechanisms are complex, slow and technical in nature, requiring resources from both the government and the horticulture sector.
Horticulture Australia Limited Submission to the Agriculture and Food Reference Group 7
Resources are Needed in the Short to Medium Term
For example in seeking to comply with the principles and procedures of the WTO SPS agreement in negotiating quarantine market access, quarantine authorities have a substantial backlog of new access applications. Similarly, trade negotiations place significant requirements on horticulture in terms of the resources and skills, for all industries of the sector.
Australia’s relationship with China is particularly important to horticulture, especially because China’s accession to the World Trade Organisation means that negotiations in accordance with the WTO Agreement on the Application of Sanitary and Phytosanitary Measures must be concluded before Australian horticulture products can be accepted into the Chinese market.
Both Government and the horticulture sector face an increasing demand for these resources and skills. A significant investment and coordination of effort will continue to be critical over the short to medium term and is likely to require an augmentation of resources from government and the sector.
Case Study 2: The Need to Focus on Trade Outcomes
When equivalence is not achieved, the competitiveness of horticulture is affected. For example:
• Under the China ASEAN FTA, China secured tariff free access into ASEAN, a major Australian target market. These trade agreement outcomes have supported China’s strong cost of production advantages and resulted in China’s horticultural exports into the ASEAN to soar.
• In contrast, the less than reciprocal tariff outcomes under the Thailand-Australia Free Trade Agreement (FTA) significantly favour Thai imports into the Australian market rather than Australian exports into Thailand.
• Even New Zealand has secured superior tariff outcomes to Australia in certain horticultural lines for access into Thailand.
4.2 Biosecurity and Quarantine
Biosecurity Australia has a comparatively low incidence of pests and diseases derived from our isolated location and border security. This benefits horticulture in terms of cost advantages, improved market position, the natural environment and human health.
With an increasingly global trade in horticultural products, the likelihood of pest and disease incursions will increase. Vigilance is essential as early detection of incursions increases the likelihood of eradication, reduces the cost of eradication, and thus reduces the impact on growers, domestic and export markets, the economy and community.
Horticulture Australia Limited Submission to the Agriculture and Food Reference Group 8
The effectiveness of Australia’s current biosecurity arrangements will be diminished if resources and technical skills dedicated to prevention and the early detection of pest incursions are reduced.
Expenditure on skills, diagnostic capability and recurrent funding for testing should be confirmed as a priority.
If an incursion does eventuate then:
• Prior planning and specification of a response is crucial; and • Agreed principles to guide assistance should be in place.
Quarantine
The science-based approach to quarantine incorporates the precautionary principle in the same manner as it is applied to environmental issues. Its application to assessments should not be compromised by external considerations.
Where the government makes risk-based decisions with regard to quarantine that are not supported by the sector, then the government should take appropriate cost sharing responsibility when an outbreak occurs, including short and long term consequences.
Domestic Post Incursion Policies
The Emergency Plant Pest Response Deed negotiated between the government and industry members of Plant Health Australia provides a process for establishing agreed funding arrangements and enabling rapid responses to emergency plant pest outbreaks.
4.3 Domestic Trade Regulation
The Trade Practices Act, Australian Consumer and Competition Commission and FSANZ are crucial to the operation of fair trade in the market place to benefit consumers, businesses and the broader community. On-going issues relevant to the horticulture sector are:
• Transparency in grower – wholesaler – retailer relations; • Market power; and • Product labelling.
Transparency In 2005 the Horticulture Australia Committee (HAC) and National Farmers Federation (NFF) identified six key issues:
• No contractual clarity between growers and trading partners; • No clear change of ownership of the product, even after it
has been passed along the marketing chain; • No guarantee that growers receive payment based on what
their product actually sold for; • No default minimum terms of trade; • Unfair return practices; and • No mechanisms for dispute resolution to address intimidating
behaviour.
Horticulture Australia Limited Submission to the Agriculture and Food Reference Group 9
Consequently the sector welcomes the development of a Mandatory Code of Conduct under relevant provisions of the Trade Practices Act.
Market Power Monitoring market power in the supply chain is crucial to improving the supply chain. The sector strongly supports the on-going monitoring by the ACCC and subsequent application of the Trade Practices Act if required.
COOL Country of origin labelling laws may reduce the substitutability of overseas and local product. This will lead to a reduction in the market power of the buyers. Responsibility for labelling requirements rests with FSANZ. Horticulture supports country of origin labelling.
4.4 Recommendations
To improve market access, biosecurity and quarantine for the on-going success of horticulture, it is essential that:
• Trade policy and strategy is fully incorporated into market access, consistent with the maintenance and application of science;
• Negotiation of non-quarantine market access obtains equivalent outcomes with trading partners;
• In coordination with industries, market access protocols and work plans are put in place which reflect commercial reality;
• Biosecurity plans are expanded to include Threat-Specific Contingency Plans and Pest Risk Analysis to strengthen sector biosecurity and assist domestic trading protocols;
• Sufficient investment is made in the institutions underpinning our biosecurity and quarantine, particularly Plant Health Australia, Biosecurity Australia and AQIS;
• We maintain a R&D sector that is able to inform the science based, precautionary approach to quarantine; and particularly the development and implementation of B Biosecurity Plans;
• R&D is directed at the requirements and priorities of market access, including export markets, as determined by the strategies and priorities of the horticulture sector;
• The Mandatory Code of Conduct and country of origin labelling are rapidly implemented in the domestic market; and
• The ACCC continues to vigorously monitor, and where required apply the Trade Practices Act to maintain the effectiveness of the domestic market.
Horticulture Australia Limited Submission to the Agriculture and Food Reference Group 10
5 SUPPLY CHAINS
The Challenge The continuous development of increasingly efficient and flexible supply chains for Australian horticulture products will be essential in meeting the changing demands of domestic and offshore consumers.
Government can play a clear role in facilitating improvements in the supply chain by:
• Providing information on the nature and production of the horticulture sector and its industries;
• Co-investing with the sector to market horticulture and develop supply chains into target markets.
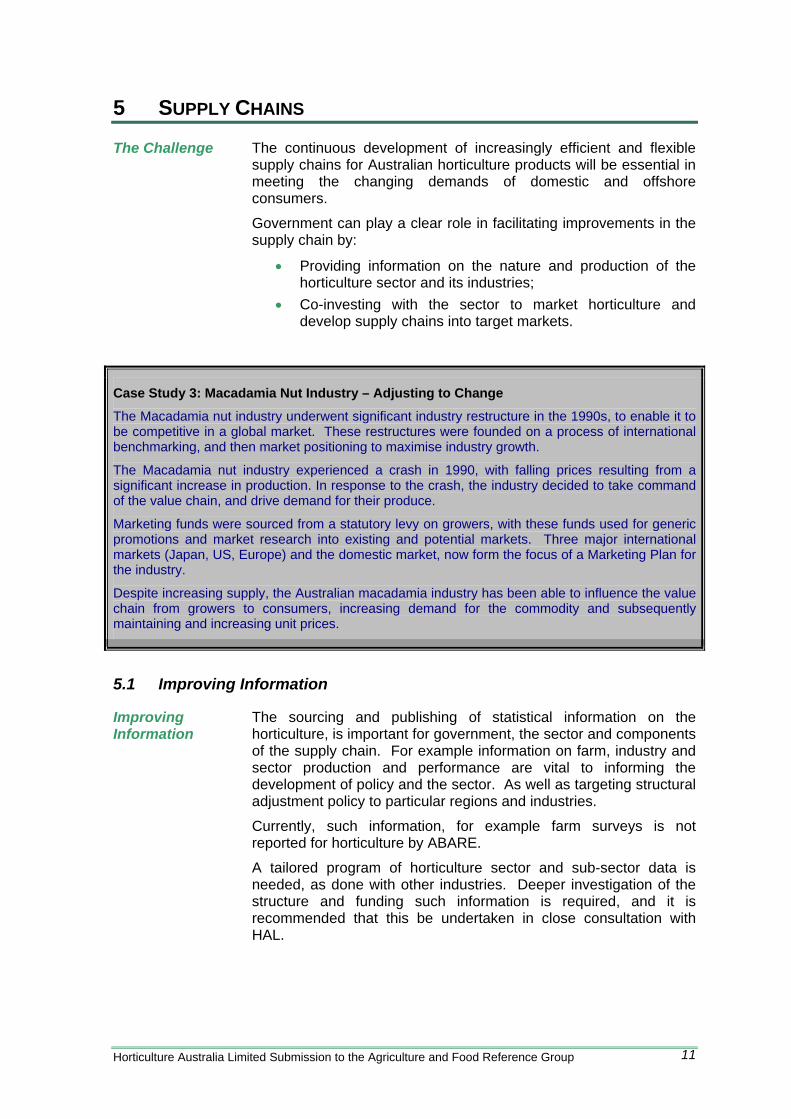
Case Study 3: Macadamia Nut Industry – Adjusting to Change
The Macadamia nut industry underwent significant industry restructure in the 1990s, to enable it to be competitive in a global market. These restructures were founded on a process of international benchmarking, and then market positioning to maximise industry growth.
The Macadamia nut industry experienced a crash in 1990, with falling prices resulting from a significant increase in production. In response to the crash, the industry decided to take command of the value chain, and drive demand for their produce.
Marketing funds were sourced from a statutory levy on growers, with these funds used for generic promotions and market research into existing and potential markets. Three major international markets (Japan, US, Europe) and the domestic market, now form the focus of a Marketing Plan for the industry.
Despite increasing supply, the Australian macadamia industry has been able to influence the value chain from growers to consumers, increasing demand for the commodity and subsequently maintaining and increasing unit prices.
5.1 Improving Information
Improving Information
The sourcing and publishing of statistical information on the horticulture, is important for government, the sector and components of the supply chain. For example information on farm, industry and sector production and performance are vital to informing the development of policy and the sector. As well as targeting structural adjustment policy to particular regions and industries.
Currently, such information, for example farm surveys is not reported for horticulture by ABARE.
A tailored program of horticulture sector and sub-sector data is needed, as done with other industries. Deeper investigation of the structure and funding such information is required, and it is recommended that this be undertaken in close consultation with HAL.
Horticulture Australia Limited Submission to the Agriculture and Food Reference Group 11
5.2 Co-investment in Supply Chain
Supply Chain Co-investment
Improvements in supply chains will enable Australia’s horticultural sector to remain competitive. This requires suitable enabling conditions for on-going investment by industry. Government and industry can facilitate this by co-investing in initiatives.
For example initiatives such as the National Food Industry Strategy are excellent ways to develop skills across the supply chain. Such strategies need to be sustained along with new initiatives to build skills and capacity. Enabling conditions are also created by the sector to working with DFAT and Austrade to strategically develop markets
The return on such co-investments can be greatly enhanced by greater coordination between government initiatives and organizations within the horticulture sector, such as HAL and industry bodies.
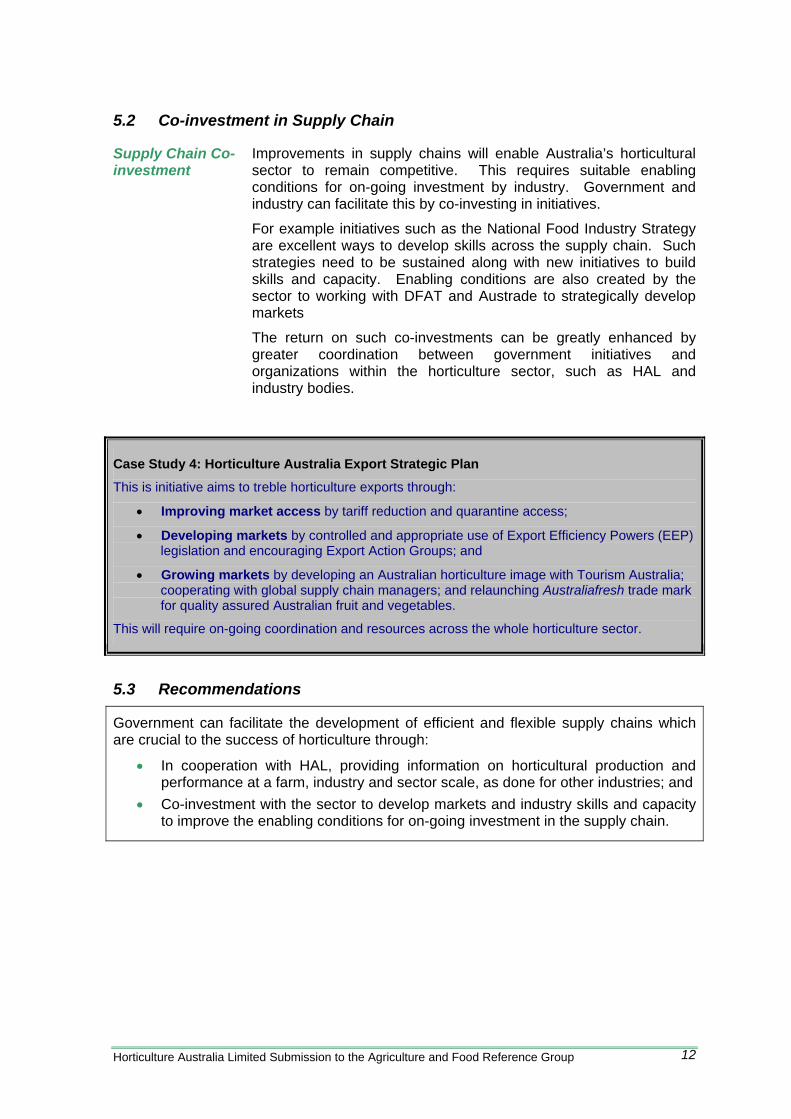
Case Study 4: Horticulture Australia Export Strategic Plan
This is initiative aims to treble horticulture exports through:
• Improving market access by tariff reduction and quarantine access;
• Developing markets by controlled and appropriate use of Export Efficiency Powers (EEP) legislation and encouraging Export Action Groups; and
• Growing markets by developing an Australian horticulture image with Tourism Australia; cooperating with global supply chain managers; and relaunching Australiafresh trade mark for quality assured Australian fruit and vegetables.
This will require on-going coordination and resources across the whole horticulture sector.
5.3 Recommendations
Government can facilitate the development of efficient and flexible supply chains which are crucial to the success of horticulture through:
• In cooperation with HAL, providing information on horticultural production and performance at a farm, industry and sector scale, as done for other industries; and
• Co-investment with the sector to develop markets and industry skills and capacity to improve the enabling conditions for on-going investment in the supply chain.
Horticulture Australia Limited Submission to the Agriculture and Food Reference Group 12
6 R&D, INNOVATION AND TECHNOLOGY ADOPTION
6.1 Competitiveness Underpinned by Multiple R&D Priorities
R&D Underpins Competitiveness
Research and development, innovation and technology adoption is fundamental to a successful horticulture sector in Australia. It relies on flexible and networked institutions with world class science/technical and communication capacity.
Australian growers need to improve productivity by 5% per annum on average, in the face of declining terms of trade and increased operating costs (Productivity Commission 2005), while the supply chain needs to innovate and reduce costs to meet changing consumer demand at globally competitive prices.
R&D, innovation and technology play a valuable role in horticulture by improving:
• On farm productivity; • Packing, storage, processing and distribution in the supply
chain; and • Branding and differentiation of produce in the wholesale and
retail markets.
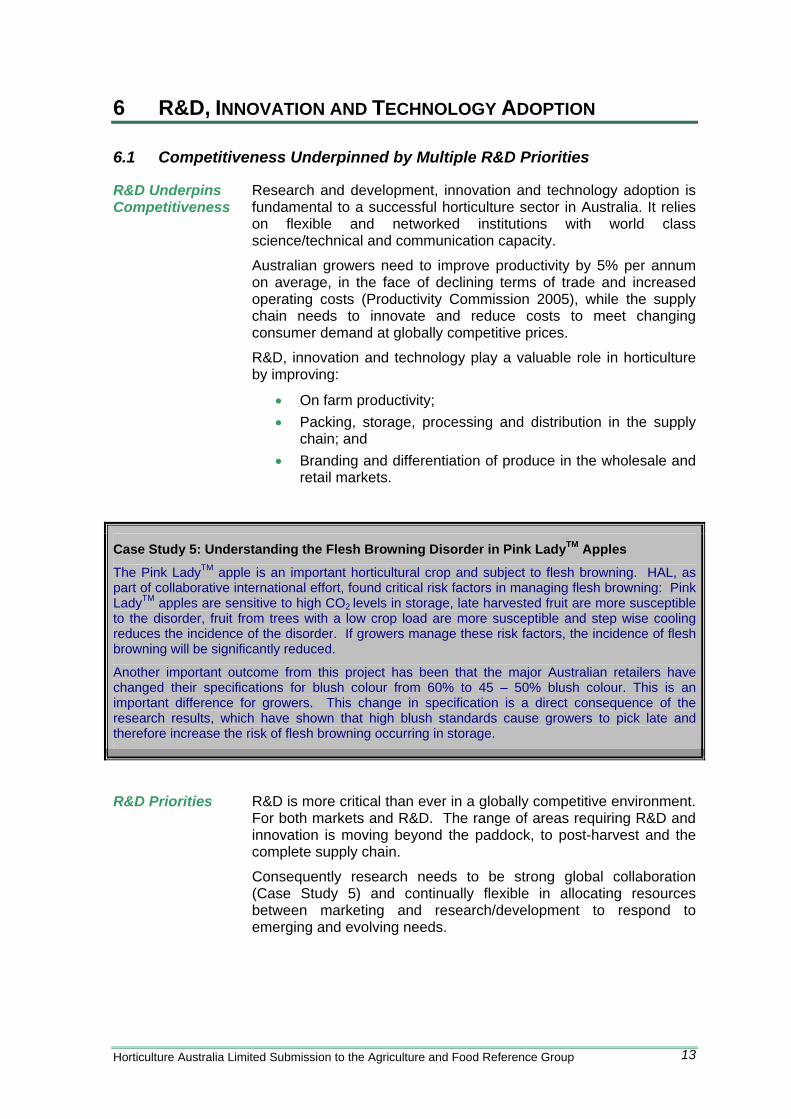
Case Study 5: Understanding the Flesh Browning Disorder in Pink LadyTM Apples
The Pink LadyTM apple is an important horticultural crop and subject to flesh browning. HAL, as part of collaborative international effort, found critical risk factors in managing flesh browning: Pink LadyTM apples are sensitive to high CO2 levels in storage, late harvested fruit are more susceptible to the disorder, fruit from trees with a low crop load are more susceptible and step wise cooling reduces the incidence of the disorder. If growers manage these risk factors, the incidence of flesh browning will be significantly reduced.
Another important outcome from this project has been that the major Australian retailers have changed their specifications for blush colour from 60% to 45 – 50% blush colour. This is an important difference for growers. This change in specification is a direct consequence of the research results, which have shown that high blush standards cause growers to pick late and therefore increase the risk of flesh browning occurring in storage.
R&D Priorities R&D is more critical than ever in a globally competitive environment. For both markets and R&D. The range of areas requiring R&D and innovation is moving beyond the paddock, to post-harvest and the complete supply chain.
Consequently research needs to be strong global collaboration (Case Study 5) and continually flexible in allocating resources between marketing and research/development to respond to emerging and evolving needs.
Horticulture Australia Limited Submission to the Agriculture and Food Reference Group 13
Case Study 6: R&D Priorities
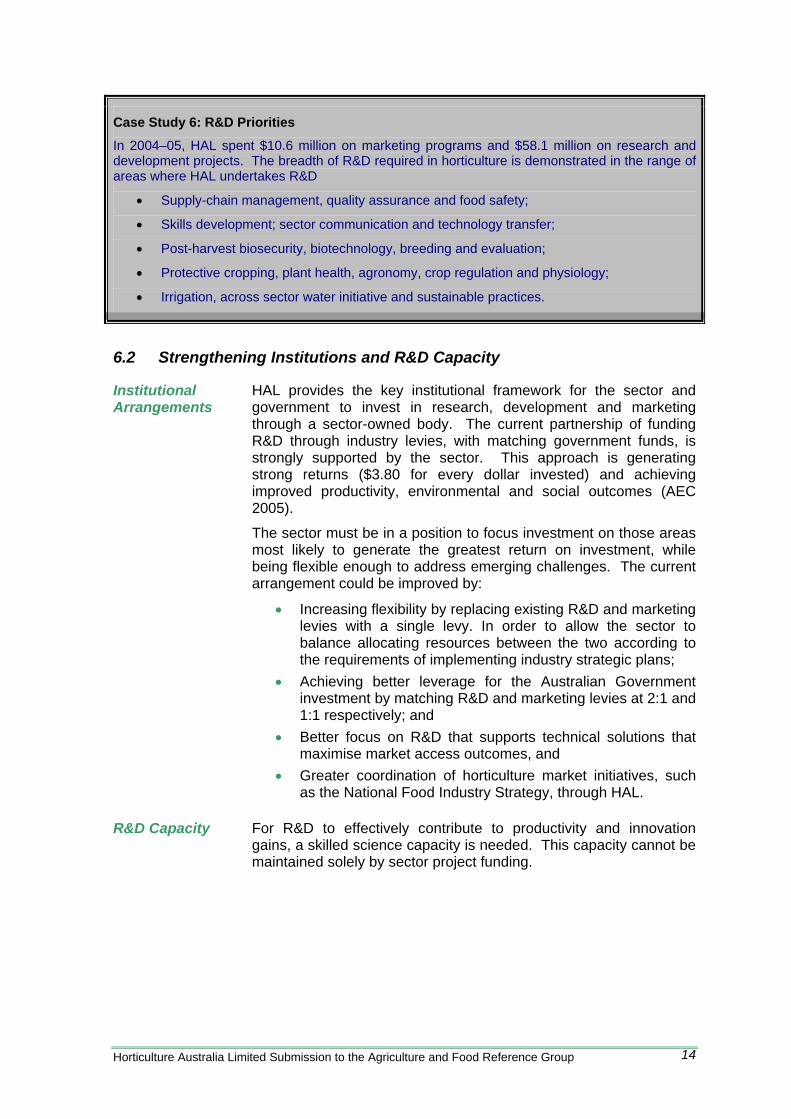
In 2004–05, HAL spent $10.6 million on marketing programs and $58.1 million on research and development projects. The breadth of R&D required in horticulture is demonstrated in the range of areas where HAL undertakes R&D
• Supply-chain management, quality assurance and food safety;
• Skills development; sector communication and technology transfer;
• Post-harvest biosecurity, biotechnology, breeding and evaluation;
• Protective cropping, plant health, agronomy, crop regulation and physiology;
• Irrigation, across sector water initiative and sustainable practices.
6.2 Strengthening Institutions and R&D Capacity
Institutional Arrangements
HAL provides the key institutional framework for the sector and government to invest in research, development and marketing through a sector-owned body. The current partnership of funding R&D through industry levies, with matching government funds, is strongly supported by the sector. This approach is generating strong returns ($3.80 for every dollar invested) and achieving improved productivity, environmental and social outcomes (AEC 2005).
The sector must be in a position to focus investment on those areas most likely to generate the greatest return on investment, while being flexible enough to address emerging challenges. The current arrangement could be improved by:
• Increasing flexibility by replacing existing R&D and marketing levies with a single levy. In order to allow the sector to balance allocating resources between the two according to the requirements of implementing industry strategic plans;
• Achieving better leverage for the Australian Government investment by matching R&D and marketing levies at 2:1 and 1:1 respectively; and
• Better focus on R&D that supports technical solutions that maximise market access outcomes, and
• Greater coordination of horticulture market initiatives, such as the National Food Industry Strategy, through HAL.
R&D Capacity For R&D to effectively contribute to productivity and innovation gains, a skilled science capacity is needed. This capacity cannot be maintained solely by sector project funding.
Horticulture Australia Limited Submission to the Agriculture and Food Reference Group 14
The continued withdrawal of resources from rural science (particularly by state governments) is reducing capacity. The horticultural sector is concerned that available resources may not be sufficient to maintain the R&D base at a sufficient level to meet current and future demands for knowledge and innovation.
Extension and Adoption – Using Innovation and Technology
Concentration in the horticultural sector, meaning fewer enterprises operating on a greater scale, is likely to lead to an increased demand for sophisticated information and support to sustain profitability. The use of private advisory services is increasing. Consequently, greater coordination will be required between public and private advisory services to draw off or avoid duplicating each other’s structures and networks. Co-investment through government and sector partnerships has proven effective (for example, the Queensland Rural Water Use Efficiency Initiative and the EMS Pilots and Pathways programs) and could be expanded to enhance the uptake of innovations.
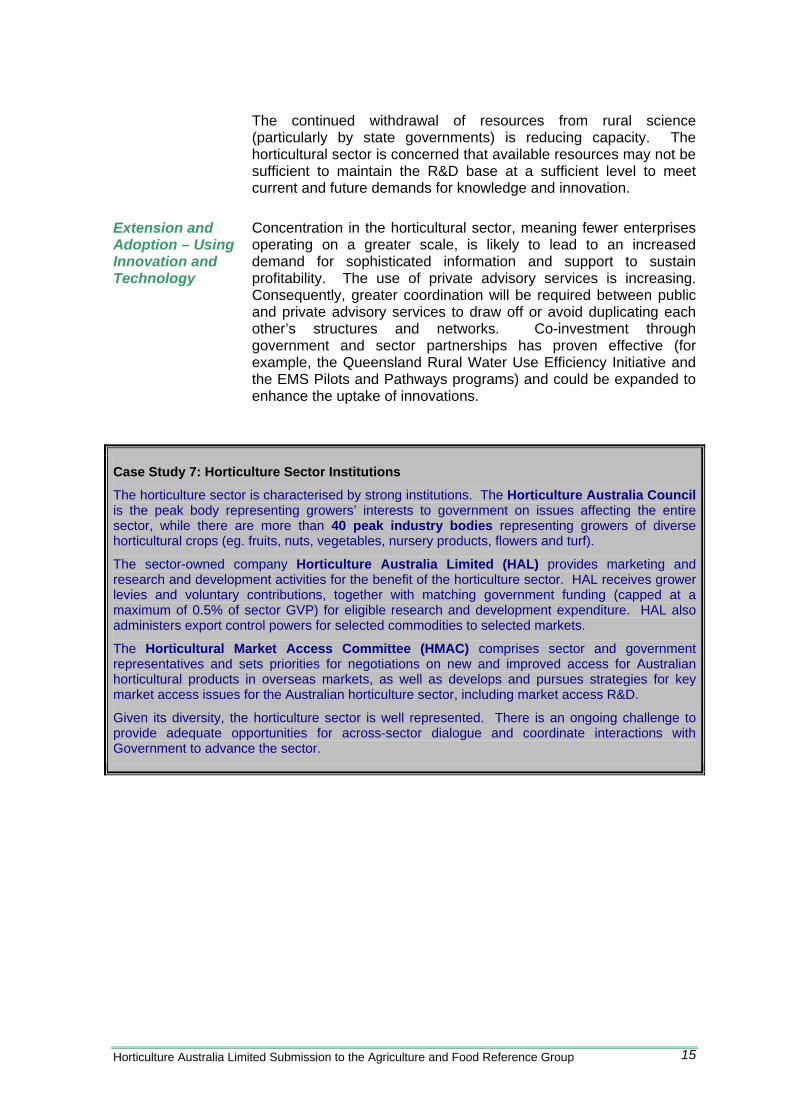
Case Study 7: Horticulture Sector Institutions
The horticulture sector is characterised by strong institutions. The Horticulture Australia Council is the peak body representing growers’ interests to government on issues affecting the entire sector, while there are more than 40 peak industry bodies representing growers of diverse horticultural crops (eg. fruits, nuts, vegetables, nursery products, flowers and turf).
The sector-owned company Horticulture Australia Limited (HAL) provides marketing and research and development activities for the benefit of the horticulture sector. HAL receives grower levies and voluntary contributions, together with matching government funding (capped at a maximum of 0.5% of sector GVP) for eligible research and development expenditure. HAL also administers export control powers for selected commodities to selected markets.
The Horticultural Market Access Committee (HMAC) comprises sector and government representatives and sets priorities for negotiations on new and improved access for Australian horticultural products in overseas markets, as well as develops and pursues strategies for key market access issues for the Australian horticulture sector, including market access R&D.
Given its diversity, the horticulture sector is well represented. There is an ongoing challenge to provide adequate opportunities for across-sector dialogue and coordinate interactions with Government to advance the sector.
Horticulture Australia Limited Submission to the Agriculture and Food Reference Group 15
6.3 Recommendations To ensure R&D, innovation and technology adoption underpin the success of the horticulture sector in Australia, it is crucial to maintain the sector-owned R&D body. As part of the current national review of R&D, the effectiveness of horticulture’s R&D can be improved by government working with the sector by:
• Increasing flexibility to address the evolving challenges by replacing existing R&D and marketing levies with a single levy. In order to allow the sector to balance allocating resources between the two according to the requirements of implementing industry strategic plans;
• Achieving better leverage for the Australian Government investment by matching R&D and marketing levies at 2:1 and 1:1 respectively; and
• Maintaining the science/technology capability of R&D institutions and individuals as a key driver of competitiveness;
• Better focus on R&D that supports technical solutions that maximise market access outcomes, and
• Increasing co-investment in advisory services to facilitate technology adoption; and
• Achieving greater coordination of government co-investment in the sector by ensuring all government programs are focused on addressing the strategic priorities of horticultural industries and relevant initiatives such as NFIS are implemented through HAL.
Horticulture Australia Limited Submission to the Agriculture and Food Reference Group 16
7 LABOUR
7.1 Labour Supply and Demand
Strong Demand for Labour
The horticulture sector has significant labour requirements, particularly during peak season. Horticulture employs on average 108,000 workers (Econtech 2005) with the major sources of labour being: Australian locals; working holiday makers and backpackers; full time or seasonal itinerant Australian workers; Australian students; and immigrants.
Demand for skilled and unskilled labour is high in all areas of the sector, including farm management, field workers, business and supply chain management and support services.
Over the period from 1991 to 2001, the number of people employed in horticultural industries across Australia increased by more than 40% (Econtech 2005b).
Shortage of Labour Limits the Supply Chain
The sector has a shortage of both permanent and seasonal labour. This creates bottlenecks and limits the ability of the sector to meet export and domestic market demands. There are significant issues of availability, reliability, skills variability and high turnover.
Labour is a Significant Cost
Labour forms a significant proportion of horticulture’s production costs with Australian wages relatively high compared to international competitors. While technical innovation will continue to improve productivity, labour will continue to be a significant cost for the sector in the future.
Consequently the recruitment, retention and skilling of people to the horticulture sector are crucial to improving labour availability and productivity.
7.2 Improving Labour Availability and Productivity
Recruiting Overseas Labour Improved Temporary Visa Workers Arrangements
Seasonal workforce availability is significantly influenced by labour pooling, visa, tax and employment arrangements.
Labour sourcing mechanisms are needed to link local and itinerant workers with the horticulture sector during peak times. While the national privatised labour employment services and the Harvest Trail and similar initiatives provide mechanisms, greater marketing and coordination is required. In particular, to stimulate backpacker networks, labour hire companies and labour pools, which can have excellent results.
Overseas workers are a significant proportion of horticultural labour, with an estimated 14,900 workers employed under the Working Holiday Makers Scheme (WHM) in 2003-2004 (CDI Pinnacle Management 2005).
Horticulture Australia Limited Submission to the Agriculture and Food Reference Group 17
There is scope to improve and widen the current temporary visa arrangements for overseas workers, holidaymakers and backpackers by:
• Removing the restriction limiting employment with a single employer to three months;
• Extending the duration of visits; and • Allowing multiple returns to Australia.
Additionally a new visa needs to be created for overseas workers who return annually, as proposed by HAC and NFF in September and previously explored in Sunraysia-Mallee (Case Study 8).
Skills and Training
For the seasonal skilled positions, there is a need to encourage local labour participation that can be skilled-up in each business and returned each season. Options for improving the skills of farm employers, managers and operators include:
• Introduction of accreditation of farm employers; • Training subsidies for either employers or employees to
undertake for either formal training or on the job training; and • Extension of the eligibility for FarmBis support and the
available courses to encompass the needs of permanent, contract and short-term casual employees, irrespective of the extent of their responsibility for farm management.
Government programs relating to training for agricultural labour need to recognise the itinerant nature of workers in the horticulture sector.
Case Study 8: Sunraysia Mallee – Overseas Workers
Chronic vacancies in the fruit-growing region of Mildura, led the Sunraysia Mallee Economic Development Board to develop a proposal to trial a “guest worker” visa class to allow growers to bring in foreign temporary labour. The board estimates that the region will require more than 2, 000 workers over the next five years to ease a chronic lack of fruit pickers, and the Board had targeted China as a potential source for these workers.
The “Guest worker” visa class would enable the temporary entry of lesser skilled overseas national to work for short periods of time, undertaking seasonal duties on farms.
7.3 Recommendations
In order to improve the supply and productivity of labour, it is crucial that:
• The current temporary visa requirements be changed to allow workers to be employed by a single employer for the period of their stay, increase the duration of visas and allow multiple returns;
• In cooperation with horticulture sector, government scope and trial program a guest worker visa program to address labour shortages in the sector; and
• On-going skilling of employers and employees is undertaken.
Horticulture Australia Limited Submission to the Agriculture and Food Reference Group 18
8 USING AND MANAGING NATURAL RESOURCES
8.1 Water
Water Access and Management Underpins Horticulture’s Success
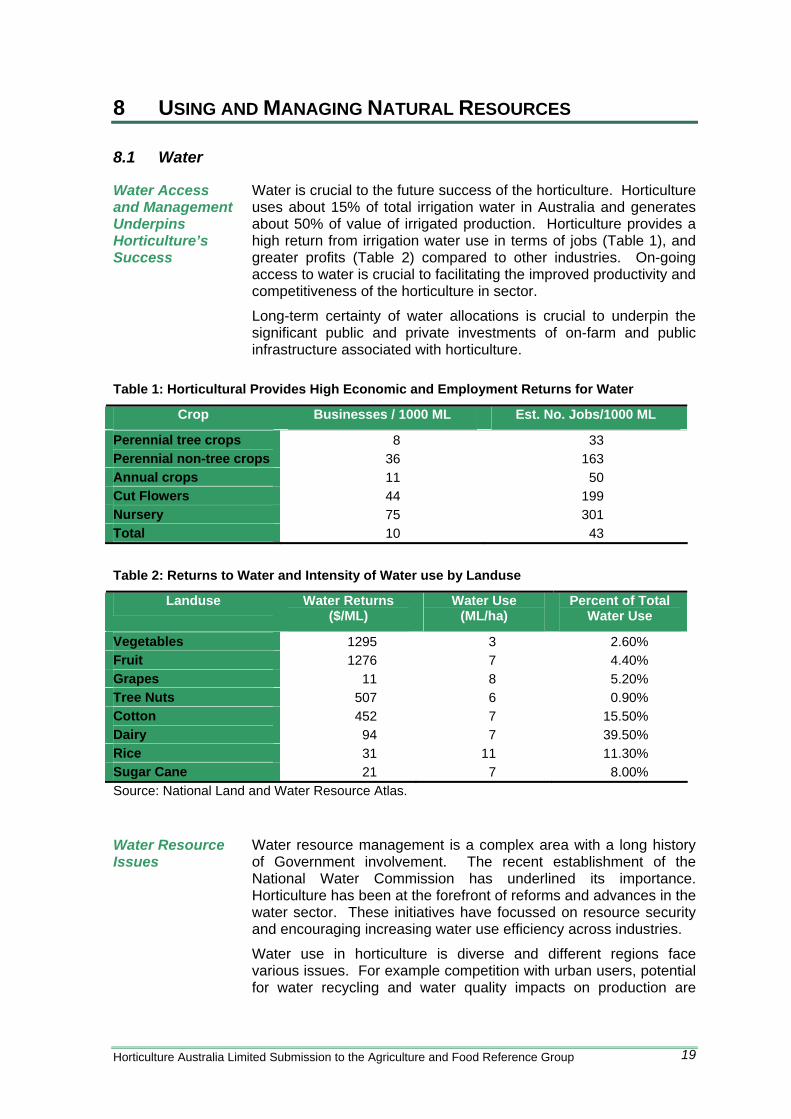
Water is crucial to the future success of the horticulture. Horticulture uses about 15% of total irrigation water in Australia and generates about 50% of value of irrigated production. Horticulture provides a high return from irrigation water use in terms of jobs (Table 1), and greater profits (Table 2) compared to other industries. On-going access to water is crucial to facilitating the improved productivity and competitiveness of the horticulture in sector.
Long-term certainty of water allocations is crucial to underpin the significant public and private investments of on-farm and public infrastructure associated with horticulture.
Table 1: Horticultural Provides High Economic and Employment Returns for Water
Crop Businesses / 1000 ML Est. No. Jobs/1000 ML
Perennial tree crops 8 33 Perennial non-tree crops 36 163 Annual crops 11 50 Cut Flowers 44 199 Nursery 75 301 Total 10 43
Table 2: Returns to Water and Intensity of Water use by Landuse
Landuse Water Returns ($/ML)
Water Use (ML/ha)
Percent of Total Water Use
Vegetables 1295 3 2.60% Fruit 1276 7 4.40% Grapes 11 8 5.20% Tree Nuts 507 6 0.90% Cotton 452 7 15.50% Dairy 94 7 39.50% Rice 31 11 11.30% Sugar Cane 21 7 8.00% Source: National Land and Water Resource Atlas.
Water Resource Issues
Water resource management is a complex area with a long history of Government involvement. The recent establishment of the National Water Commission has underlined its importance. Horticulture has been at the forefront of reforms and advances in the water sector. These initiatives have focussed on resource security and encouraging increasing water use efficiency across industries.
Water use in horticulture is diverse and different regions face various issues. For example competition with urban users, potential for water recycling and water quality impacts on production are
Horticulture Australia Limited Submission to the Agriculture and Food Reference Group 19
regional specific issues.
Certainty is a common concern across horticulture as it is characterised by the significance and fixed nature of capital investment. Maintaining access will be critical to the sector's future prosperity. The move to increase clarity and security through robust water entitlement systems should be pursued.
Efficient water delivery systems involve private and public investment. Current infrastructure configurations were often built 50-100 years ago and in many cases are inefficient and require recapitalisation. The evaluation of opportunities to reconfigure water supply; facilitate the emergence of more efficient systems and encourage of innovation is a crucial role of Government. Current R&D in the horticultural sector has demonstrably improved water use efficiency.
Case Study 9: Improving Water Management in Horticulture
Water management in horticulture in has significantly improved over the past decade as demonstrated by on-farm water use efficiency reducing wasteful drainage flows in Sunraysia. While 40% of Queensland horticulturists changed irrigation practice to generate significant, water savings and extra and extra value.
Case Study 10: Water Initiative
The Water Initiative has been established by HAL to secure on-going water access by demonstrating the economic and social benefits of horticulture water use and the environmental credentials of horticulture. The initiative will also invest in projects to further enhance the sustainability of the industry. The focus for its activities are:
• Demonstrating the economic and social contribution made by irrigated horticulture to water policy makers;
• Developing and assisting the implementation of management systems that produce more crop pre drop and lower environmental risk;
• Providing information for current drought affected horticulture;
• Defining water service levels and security needed for horticulture and ensuring water suppliers account for these; and
• Communicating with industry and 'change agents' on water issues and developing programmes in response to strategically important needs related to water access.
Horticulture Australia Limited Submission to the Agriculture and Food Reference Group 20
8.2 Natural Resource Management
In the face of increasing community environmental concern and natural resource degradation, there is a move towards environmental policies that have benefits for the wider society but place the costs on the producer. This creates challenges for the horticulture sector in balancing the need to generate income with sustaining the integrity of the resource base, and determining the appropriate role of farm businesses in environmental management.
Australia maintains one of the strictest regimes of environmental regulations in the world (Schwab 2005). However this incurs many costs such as sourcing information, dealing with regulation, and delay in investment incurring opportunity costs.
While complex, overlapping and in some cases competing legislation creates inefficiencies for both the Government and the sector. This is highlighted in peri-urban Western Sydney, a significant horticulture region, where 20 pieces of legislation and policies that related to land use are in place.
Therefore environmental policies should be targeted so that environmental benefits are achieved at the lowest possible cost to the sector and society. In addition, environmental regulation should be economically efficient with the attributes of simplicity, flexibility and certainty.
The horticulture sector is supportive of moves that allow industries and regions to develop partnership approaches to natural resource management rather than one-size-fits-all regulation, as well as providing mechanisms for the sector and enterprises to demonstrate their environmental stewardship through schemes such as EMS.
Case Study 11: Horticulture for Tomorrow
Quality assurance (QA) systems are an important market driven and owned component of the supply chain. These systems are used to meet consumer, community and food safety standards.
They are increasingly required to access both overseas (eg EureGAP, Sainsbury’s) and domestic markets (eg Woolworths Quality Assured), with taste, ethical and environmental issues becoming increasingly important.
To meet the increasing demand to demonstrate environment sustainability, government and the sector have co-invested in Horticulture for Tomorrow. The project aims to link production targets and environmental management, complementing existing QA systems.
Horticulture Australia Limited Submission to the Agriculture and Food Reference Group 21
8.3 Recommendations
In order to ensure that the horticulture sector has access to water, while sustaining the natural resource base, it is crucial that the sector and government work in partnership to:
• Make explicit and regularly report the reliability of water to users (probability of annual allocations in the short term and long term);
• Recognise the high water reliability that is required for permanent horticultural crops, and the huge cost of replanting if permanent crops suffer water restrictions;
• Improve access to water for horticulture, by researching and implementing safe wastewater recycling and stormwater schemes, and enabling irrigators access to water trading systems;
• Ensure that town water restrictions do not unfairly limit access to water to horticulture (compared to other urban industry users) and are developed in consultation with the nursery and garden industry;
• Assist in the development of new technology and practices for improved water management and practices to continue to enhance environmental performance, both on-farm and off farm. Including research and development into crop water requirement, nutrient management, sediment runoff and salinity management;
• Ensure ageing irrigation or drainage infrastructure and new irrigation schemes are designed with levels of service that do not limit horticulture's ability to adopt modern practice
• Plan and invest in the recapitalisation of Australia’s water infrastructure; • Ensure on-going R&D and innovation drives improved water use efficiency; and • Develop natural resource and planning policies that are targeted and use non-
regulatory approaches to achieve efficient natural resource outcomes where appropriate.
Horticulture Australia Limited Submission to the Agriculture and Food Reference Group 22
9 RURAL AND REGIONAL COMMUNITIES
9.1 Strengthening Communities
Horticulture contributes strongly to communities both in the regions where it operates as well as contributing to national and well-being by providing healthy food (Case Study 12).
Geographically Diverse Over 16,000 Enterprises
The horticulture sector is geographically diverse with production occurring across all Australian states and territories, and varying from rural and remote (eg Carnarvon, WA) through to the urban fringe (eg Sydney Basin).
There are over 16,000 Australian horticultural enterprises (Econtech 2005). The individual industries are highly diverse in their size, operational complexity, organisational arrangements, maturity, and marketing and supply chain focus. Some industries are highly regionalised, while others are more broadly based.
On average, 66% of the GDP associated with Australian horticulture, is generated in regional areas. Over half of the economic activity taking place in the six state capitals is due to the activities of the horticulture outputs sector, such as food retailing and fruit and vegetable processing.
66% of Horticulture’s Value is Generated Regionally
Horticulture employs 71,600 people in regional Australia (Figure 6), creating the critical mass necessary to sustain regional towns, and communities. This represents 25% of employment in the agricultural sector.
The Southern and Eastern South Australia region (Figure 7) was the most dependent region on horticulture each year between 1998-99 and 2003-04. The Wide Bay-Burnett and Darling Downs-South West regions of Queensland were also dependent (but to a lesser extent) on horticulture activities.
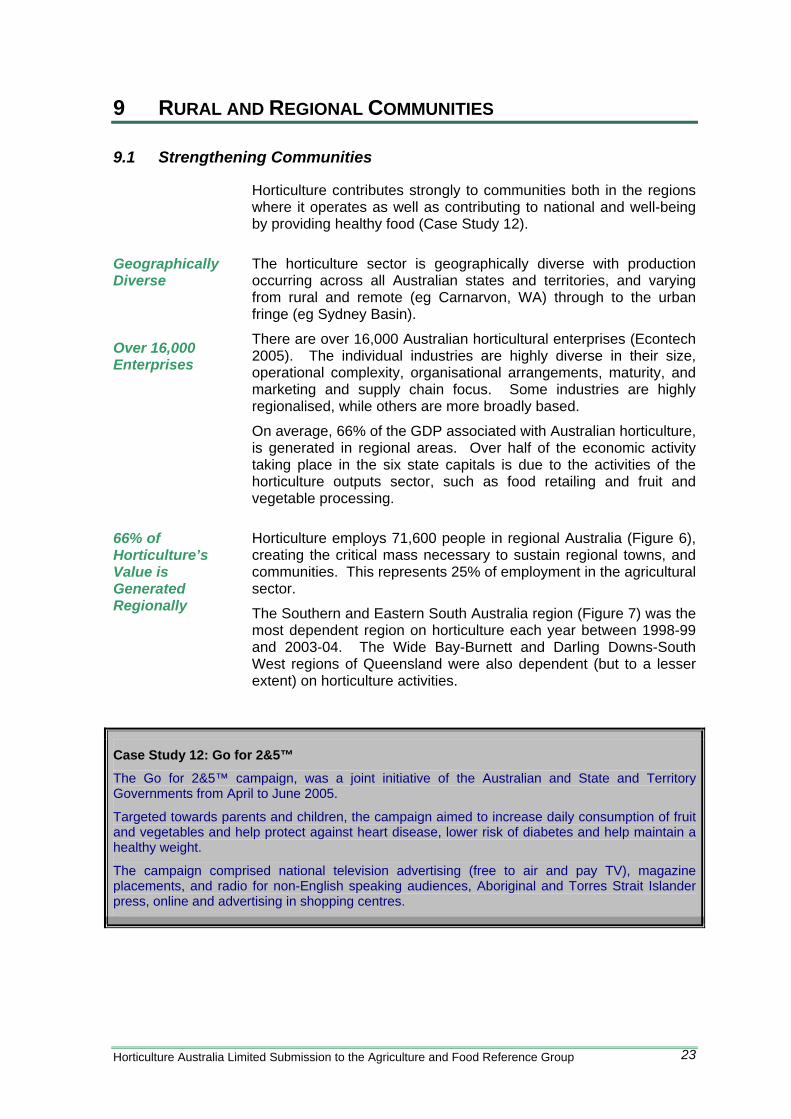
Case Study 12: Go for 2&5™
The Go for 2&5™ campaign, was a joint initiative of the Australian and State and Territory Governments from April to June 2005.
Targeted towards parents and children, the campaign aimed to increase daily consumption of fruit and vegetables and help protect against heart disease, lower risk of diabetes and help maintain a healthy weight.
The campaign comprised national television advertising (free to air and pay TV), magazine placements, and radio for non-English speaking audiences, Aboriginal and Torres Strait Islander press, online and advertising in shopping centres.
Horticulture Australia Limited Submission to the Agriculture and Food Reference Group 23
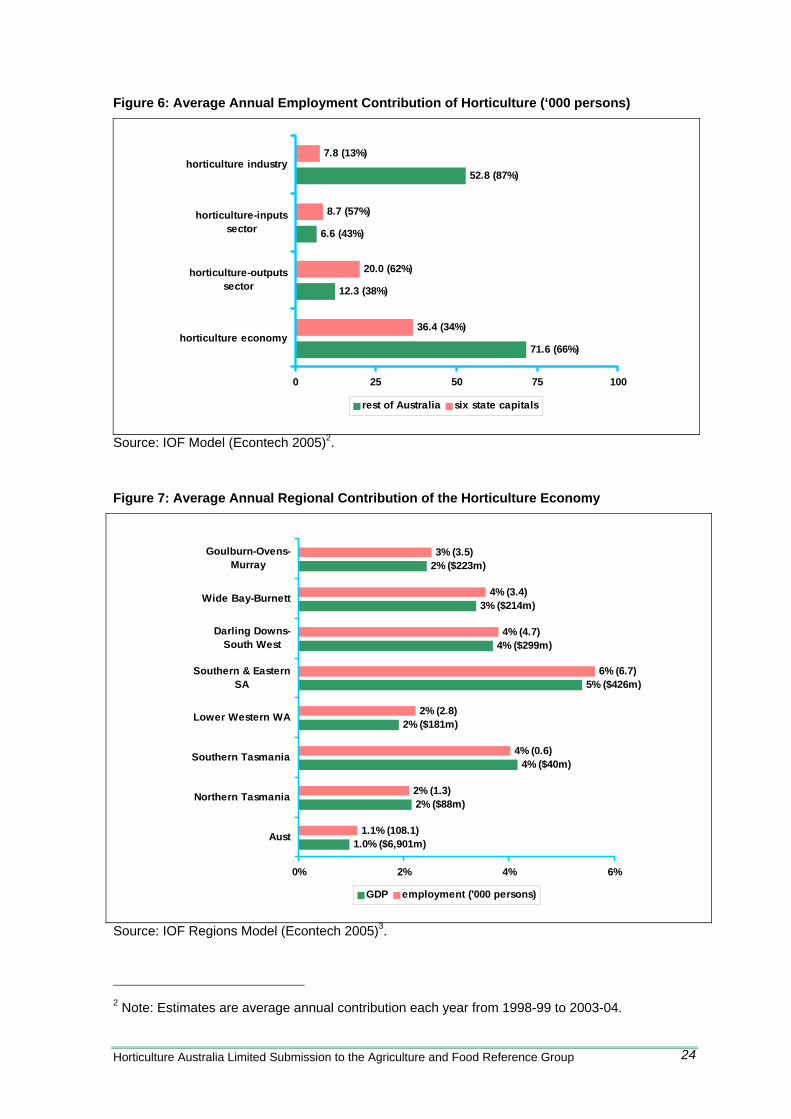
Figure 6: Average Annual Employment Contribution of Horticulture (‘000 persons)
52.8 (87%)
6.6 (43%)
12.3 (38%)
71.6 (66%)
36.4 (34%)
20.0 (62%)
8.7 (57%)
7.8 (13%)
0 25 50 75 100
horticulture economy
horticulture-outputssector
horticulture-inputssector
horticulture industry
rest of Australia six state capitals
Source: IOF Model (Econtech 2005)2. Figure 7: Average Annual Regional Contribution of the Horticulture Economy
1.0% ($6,901m)
2% ($88m)
4% ($40m)
2% ($181m)
5% ($426m)
4% ($299m)
3% ($214m)
2% ($223m)
1.1% (108.1)
2% (1.3)
4% (0.6)
2% (2.8)
6% (6.7)
4% (4.7)
4% (3.4)
3% (3.5)
0% 2% 4% 6%
Aust
Northern Tasmania
Southern Tasmania
Lower Western WA
Southern & EasternSA
Darling Downs-South West
Wide Bay-Burnett
Goulburn-Ovens-Murray
GDP employment ('000 persons)
Source: IOF Regions Model (Econtech 2005)3.
2 Note: Estimates are average annual contribution each year from 1998-99 to 2003-04.
Horticulture Australia Limited Submission to the Agriculture and Food Reference Group 24
9.2 Future of the Sector
Changing Face of Horticulture
Horticulture is the second largest sector in Australia’s broader agricultural industry. However, overseas competition from producers with lower cost structures is leading to increased imports and loss of export markets. Therefore Australia’s horticultural communities are undergoing fundamental change as falling prices and rising costs squeeze the margins of producers (McKinna 2005).
As a result, it is estimated that the number of horticulture producers in Australia will fall significantly over the next decade, with knock-on impacts to regional communities. For example vegetable producers are predicted to decrease by 75% within 5 years (Case Study 13).
At times the adjustment in the horticulture sector has been exacerbated through the unintended consequences of government structural adjustment packages that have encouraged producers from other agricultural industries to shift to horticulture production. For example grants were provided to Queensland sugarcane producers to move into melon and potato growing which led to oversupply and collapsed industry returns.
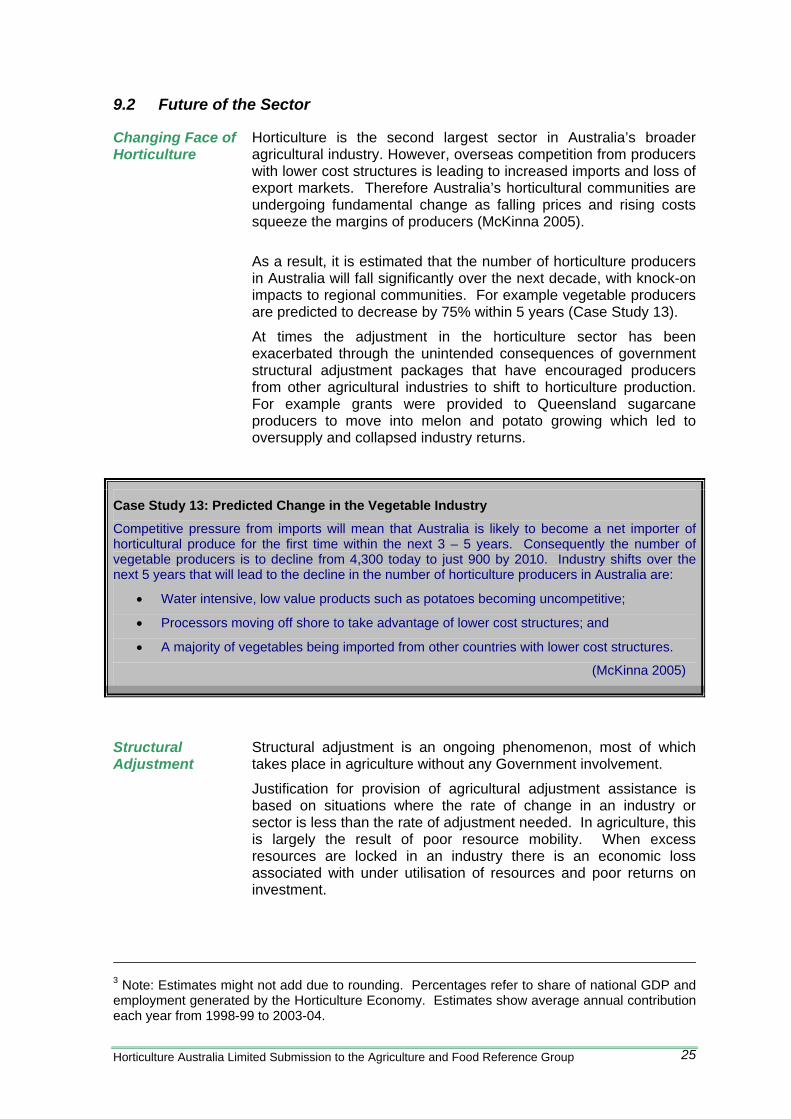
Case Study 13: Predicted Change in the Vegetable Industry
Competitive pressure from imports will mean that Australia is likely to become a net importer of horticultural produce for the first time within the next 3 – 5 years. Consequently the number of vegetable producers is to decline from 4,300 today to just 900 by 2010. Industry shifts over the next 5 years that will lead to the decline in the number of horticulture producers in Australia are:
• Water intensive, low value products such as potatoes becoming uncompetitive;
• Processors moving off shore to take advantage of lower cost structures; and
• A majority of vegetables being imported from other countries with lower cost structures.
(McKinna 2005)
Structural Adjustment
Structural adjustment is an ongoing phenomenon, most of which takes place in agriculture without any Government involvement.
Justification for provision of agricultural adjustment assistance is based on situations where the rate of change in an industry or sector is less than the rate of adjustment needed. In agriculture, this is largely the result of poor resource mobility. When excess resources are locked in an industry there is an economic loss associated with under utilisation of resources and poor returns on investment.
3 Note: Estimates might not add due to rounding. Percentages refer to share of national GDP and employment generated by the Horticulture Economy. Estimates show average annual contribution each year from 1998-99 to 2003-04.
Horticulture Australia Limited Submission to the Agriculture and Food Reference Group 25
Government has supported many industries through structural adjustment processes. Given the rapid change in the horticulture sector, there is an opportunity for the government and the sector to consider structural adjustment packages to improve on-farm efficiencies; and assist unprofitable horticulture producers to exit the sector. There are opportunities for Government and the horticultural sector to assess potential knock-on effects of this intervention.
Case Study 14 outlines two Commonwealth Government packages for the horticulture sector that are needed to facilitate an increase in sector efficiency through assisted exit of unprofitable producers and improved efficiency of viable producers.
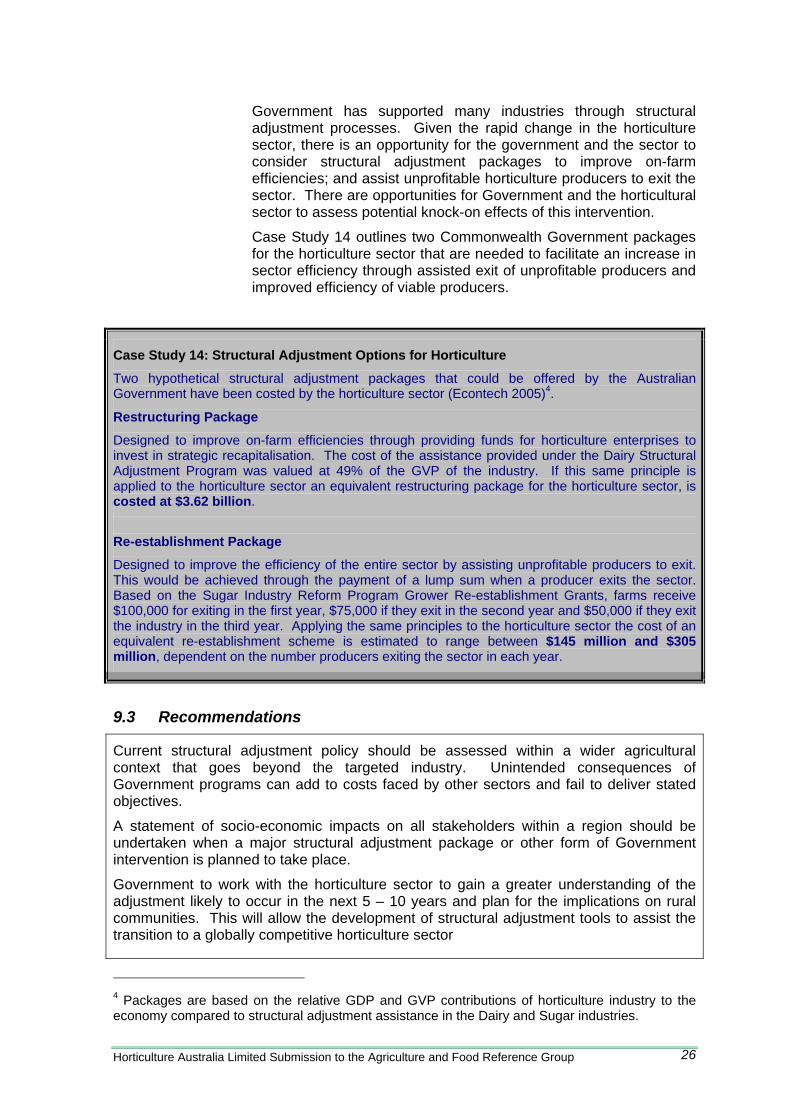
Case Study 14: Structural Adjustment Options for Horticulture
Two hypothetical structural adjustment packages that could be offered by the Australian Government have been costed by the horticulture sector (Econtech 2005)4.
Restructuring Package
Designed to improve on-farm efficiencies through providing funds for horticulture enterprises to invest in strategic recapitalisation. The cost of the assistance provided under the Dairy Structural Adjustment Program was valued at 49% of the GVP of the industry. If this same principle is applied to the horticulture sector an equivalent restructuring package for the horticulture sector, is costed at $3.62 billion.
Re-establishment Package
Designed to improve the efficiency of the entire sector by assisting unprofitable producers to exit. This would be achieved through the payment of a lump sum when a producer exits the sector. Based on the Sugar Industry Reform Program Grower Re-establishment Grants, farms receive $100,000 for exiting in the first year, $75,000 if they exit in the second year and $50,000 if they exit the industry in the third year. Applying the same principles to the horticulture sector the cost of an equivalent re-establishment scheme is estimated to range between $145 million and $305 million, dependent on the number producers exiting the sector in each year.
9.3 Recommendations
Current structural adjustment policy should be assessed within a wider agricultural context that goes beyond the targeted industry. Unintended consequences of Government programs can add to costs faced by other sectors and fail to deliver stated objectives.
A statement of socio-economic impacts on all stakeholders within a region should be undertaken when a major structural adjustment package or other form of Government intervention is planned to take place.
Government to work with the horticulture sector to gain a greater understanding of the adjustment likely to occur in the next 5 – 10 years and plan for the implications on rural communities. This will allow the development of structural adjustment tools to assist the transition to a globally competitive horticulture sector
4 Packages are based on the relative GDP and GVP contributions of horticulture industry to the economy compared to structural adjustment assistance in the Dairy and Sugar industries.
Horticulture Australia Limited Submission to the Agriculture and Food Reference Group 26
10 REFERENCES
ABARE (2004) Horticulture research: An evaluation of the costs and benefits of selected horticulture research projects. ABARE report for Horticulture Australia Limited. December 2004. Australian Bureau of Agricultural and Resource Economics, Canberra.
AEC (2005) Industry Forum, May 2005 prepared for Horticulture Australia Limited.
CDI Pinnacle Management (2005) Horticultural Labour Situation Statement, prepared for Growcom and HAL HG03072.
DAFF (2005) Securing the Future for Australia’s Primary Industries: Development of a National Research, Development and Extension (RD&E) Framework: A Discussion Paper.
DAFF (2005b) Horticulture Fact Sheet www.daff.gov.au.
Econtech (2005) The Significance of the Horticulture Industry to the Australian Economy, prepared for Hassall & Associates.
Econtech (2005b) Australia’s Farm Dependent Economy: Analysis of the Role of Agriculture in the Australian Economy, prepared for the Australian Farm Institute and Horticulture Australia Limited.
HAC & NFF (2005) Horticulture Code of Conduct Response to the CIE Discussion Paper.
HAL (2005) Irrigation Knowledge Exchange Program – Draft Report to HAL.
McKinna, D. (2005) The Australian Vegetables Industry at the Cross Roads: Presentation.
Productivity Commission (2005) Trends in Australian Agriculture, Research Paper Canberra.
Ridge Partners (2005) Australian Apple & Pear Supply Chain Efficiency Review Executive Summary, prepared for Apple & Pear Australia Limited and the Australian Government Department of Agriculture, Fisheries and Forestry.
Schwab, Klaus (2005). Global Competitiveness Report, 2004-05 prepared for the World Economic Forum.
Horticulture Australia Limited Submission to the Agriculture and Food Reference Group 27
11 APPENDIX: AUSTRALIAN HORTICULTURE SECTOR’S PRODUCTION AND EMPLOYMENT
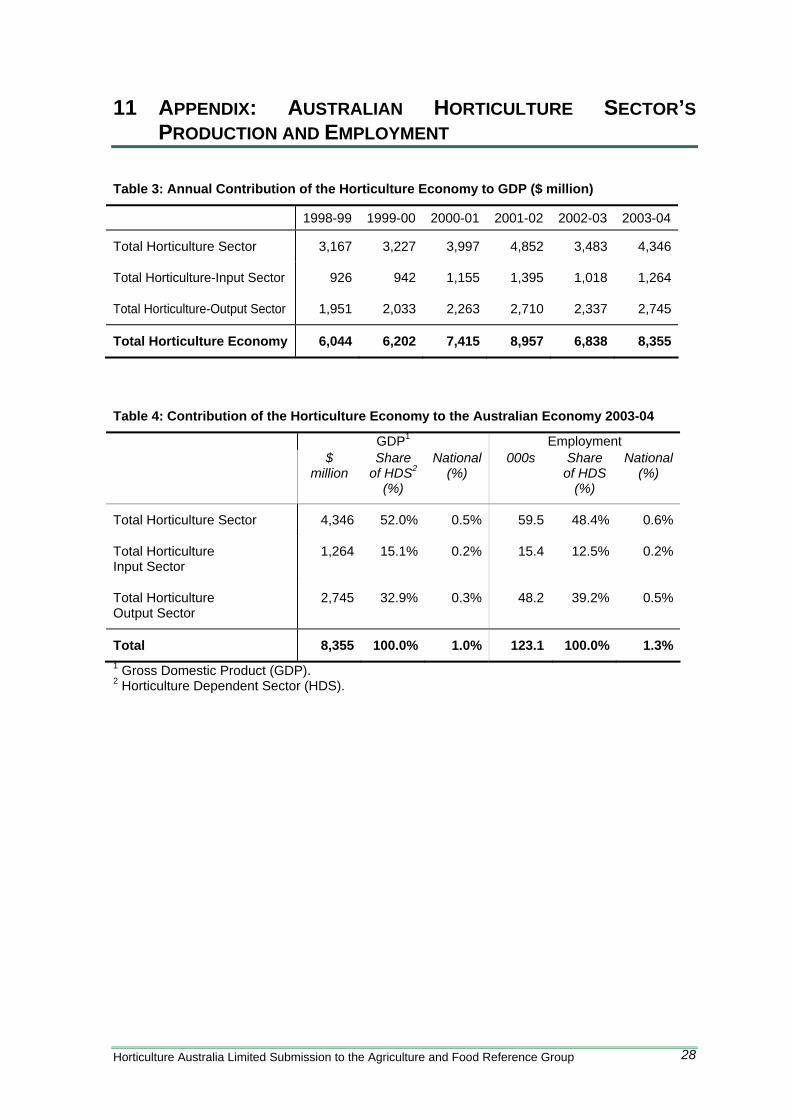
Table 3: Annual Contribution of the Horticulture Economy to GDP ($ million)
1998-99 1999-00 2000-01 2001-02 2002-03 2003-04
Total Horticulture Sector 3,167 3,227 3,997 4,852 3,483 4,346
Total Horticulture-Input Sector 926 942 1,155 1,395 1,018 1,264
Total Horticulture-Output Sector 1,951 2,033 2,263 2,710 2,337 2,745
Total Horticulture Economy 6,044 6,202 7,415 8,957 6,838 8,355
Table 4: Contribution of the Horticulture Economy to the Australian Economy 2003-04
GDP1 Employment $
million Share
of HDS2 (%)
National (%)
000s Share of HDS
(%)
National (%)
Total Horticulture Sector 4,346 52.0% 0.5% 59.5 48.4% 0.6%
Total Horticulture Input Sector
1,264 15.1% 0.2% 15.4 12.5% 0.2%
Total Horticulture Output Sector
2,745 32.9% 0.3% 48.2 39.2% 0.5%
Total 8,355 100.0% 1.0% 123.1 100.0% 1.3%1 Gross Domestic Product (GDP). 2 Horticulture Dependent Sector (HDS).
Horticulture Australia Limited Submission to the Agriculture and Food Reference Group 28
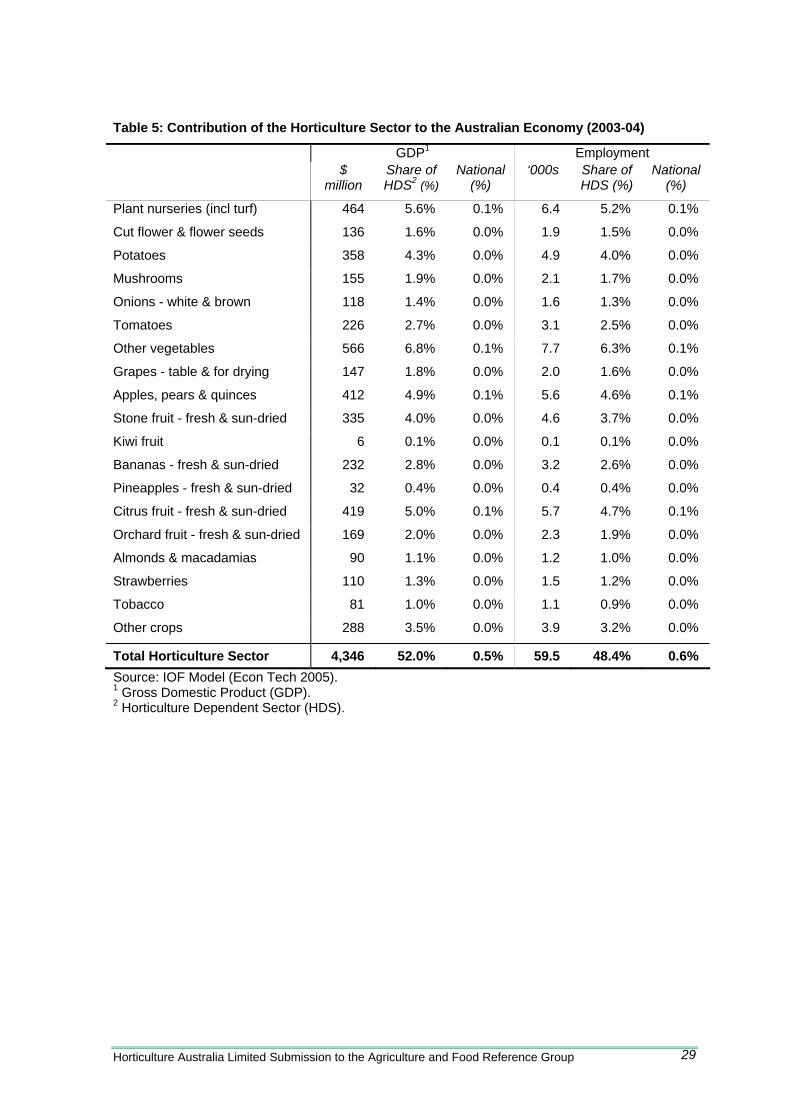
Table 5: Contribution of the Horticulture Sector to the Australian Economy (2003-04)
GDP1 Employment $
million Share of HDS2 (%)
National (%)
‘000s Share of HDS (%)
National (%)
Plant nurseries (incl turf) 464 5.6% 0.1% 6.4 5.2% 0.1%
Cut flower & flower seeds 136 1.6% 0.0% 1.9 1.5% 0.0%
Potatoes 358 4.3% 0.0% 4.9 4.0% 0.0%
Mushrooms 155 1.9% 0.0% 2.1 1.7% 0.0%
Onions - white & brown 118 1.4% 0.0% 1.6 1.3% 0.0%
Tomatoes 226 2.7% 0.0% 3.1 2.5% 0.0%
Other vegetables 566 6.8% 0.1% 7.7 6.3% 0.1%
Grapes - table & for drying 147 1.8% 0.0% 2.0 1.6% 0.0%
Apples, pears & quinces 412 4.9% 0.1% 5.6 4.6% 0.1%
Stone fruit - fresh & sun-dried 335 4.0% 0.0% 4.6 3.7% 0.0%
Kiwi fruit 6 0.1% 0.0% 0.1 0.1% 0.0%
Bananas - fresh & sun-dried 232 2.8% 0.0% 3.2 2.6% 0.0%
Pineapples - fresh & sun-dried 32 0.4% 0.0% 0.4 0.4% 0.0%
Citrus fruit - fresh & sun-dried 419 5.0% 0.1% 5.7 4.7% 0.1%
Orchard fruit - fresh & sun-dried 169 2.0% 0.0% 2.3 1.9% 0.0%
Almonds & macadamias 90 1.1% 0.0% 1.2 1.0% 0.0%
Strawberries 110 1.3% 0.0% 1.5 1.2% 0.0%
Tobacco 81 1.0% 0.0% 1.1 0.9% 0.0%
Other crops 288 3.5% 0.0% 3.9 3.2% 0.0%
Total Horticulture Sector 4,346 52.0% 0.5% 59.5 48.4% 0.6% Source: IOF Model (Econ Tech 2005). 1 Gross Domestic Product (GDP). 2 Horticulture Dependent Sector (HDS).
Horticulture Australia Limited Submission to the Agriculture and Food Reference Group 29
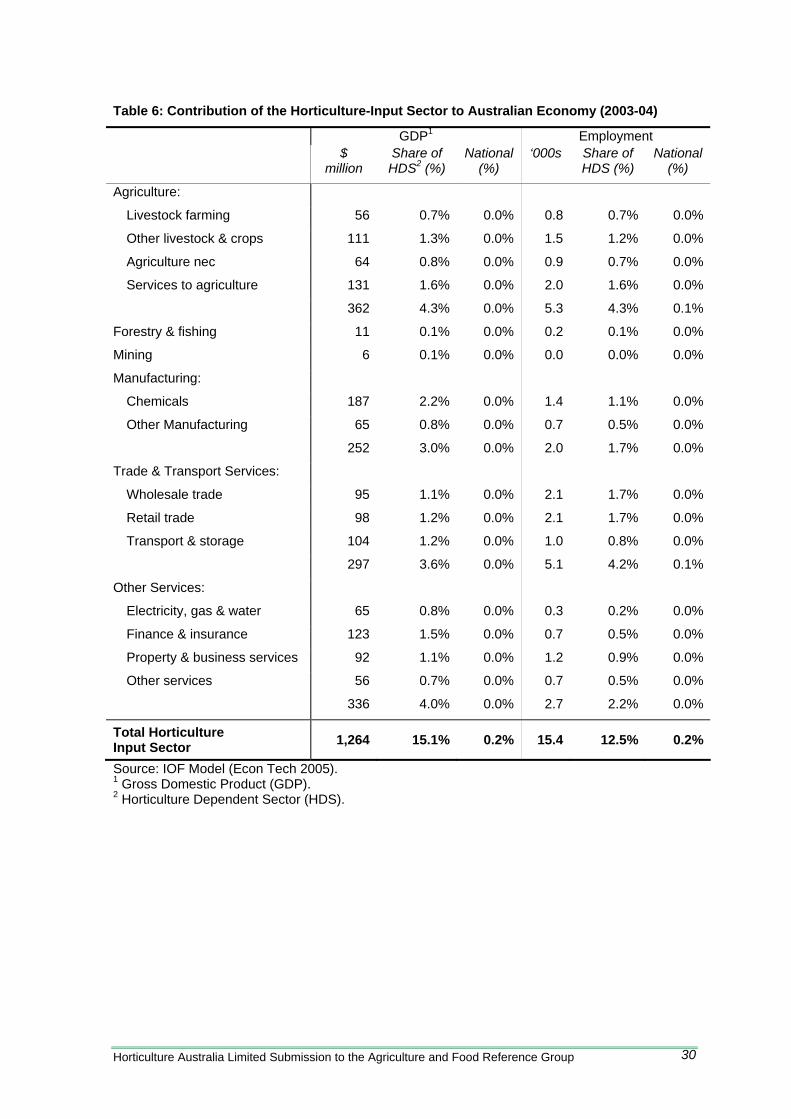
Table 6: Contribution of the Horticulture-Input Sector to Australian Economy (2003-04)
GDP1 Employment $
million Share of HDS2 (%)
National (%)
‘000s Share of HDS (%)
National (%)
Agriculture:
Livestock farming 56 0.7% 0.0% 0.8 0.7% 0.0%
Other livestock & crops 111 1.3% 0.0% 1.5 1.2% 0.0%
Agriculture nec 64 0.8% 0.0% 0.9 0.7% 0.0%
Services to agriculture 131 1.6% 0.0% 2.0 1.6% 0.0%
362 4.3% 0.0% 5.3 4.3% 0.1%
Forestry & fishing 11 0.1% 0.0% 0.2 0.1% 0.0%
Mining 6 0.1% 0.0% 0.0 0.0% 0.0%
Manufacturing:
Chemicals 187 2.2% 0.0% 1.4 1.1% 0.0%
Other Manufacturing 65 0.8% 0.0% 0.7 0.5% 0.0%
252 3.0% 0.0% 2.0 1.7% 0.0%
Trade & Transport Services:
Wholesale trade 95 1.1% 0.0% 2.1 1.7% 0.0%
Retail trade 98 1.2% 0.0% 2.1 1.7% 0.0%
Transport & storage 104 1.2% 0.0% 1.0 0.8% 0.0%
297 3.6% 0.0% 5.1 4.2% 0.1%
Other Services:
Electricity, gas & water 65 0.8% 0.0% 0.3 0.2% 0.0%
Finance & insurance 123 1.5% 0.0% 0.7 0.5% 0.0%
Property & business services 92 1.1% 0.0% 1.2 0.9% 0.0%
Other services 56 0.7% 0.0% 0.7 0.5% 0.0%
336 4.0% 0.0% 2.7 2.2% 0.0%
Total Horticulture Input Sector 1,264 15.1% 0.2% 15.4 12.5% 0.2%
Source: IOF Model (Econ Tech 2005). 1 Gross Domestic Product (GDP). 2 Horticulture Dependent Sector (HDS).
Horticulture Australia Limited Submission to the Agriculture and Food Reference Group 30
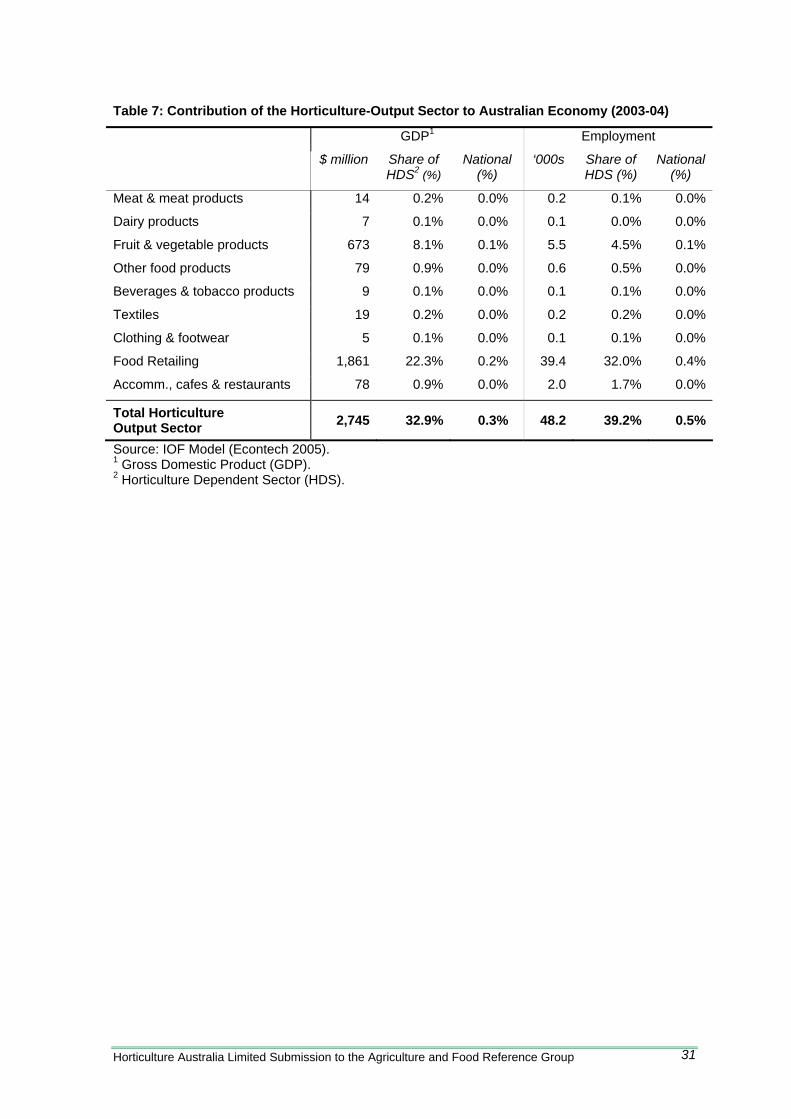
Table 7: Contribution of the Horticulture-Output Sector to Australian Economy (2003-04)
GDP1 Employment
$ million Share of HDS2 (%)
National (%)
‘000s Share of HDS (%)
National (%)
Meat & meat products 14 0.2% 0.0% 0.2 0.1% 0.0%
Dairy products 7 0.1% 0.0% 0.1 0.0% 0.0%
Fruit & vegetable products 673 8.1% 0.1% 5.5 4.5% 0.1%
Other food products 79 0.9% 0.0% 0.6 0.5% 0.0%
Beverages & tobacco products 9 0.1% 0.0% 0.1 0.1% 0.0%
Textiles 19 0.2% 0.0% 0.2 0.2% 0.0%
Clothing & footwear 5 0.1% 0.0% 0.1 0.1% 0.0%
Food Retailing 1,861 22.3% 0.2% 39.4 32.0% 0.4%
Accomm., cafes & restaurants 78 0.9% 0.0% 2.0 1.7% 0.0%
Total Horticulture Output Sector 2,745 32.9% 0.3% 48.2 39.2% 0.5%
Source: IOF Model (Econtech 2005). 1 Gross Domestic Product (GDP). 2 Horticulture Dependent Sector (HDS).
Horticulture Australia Limited Submission to the Agriculture and Food Reference Group 31
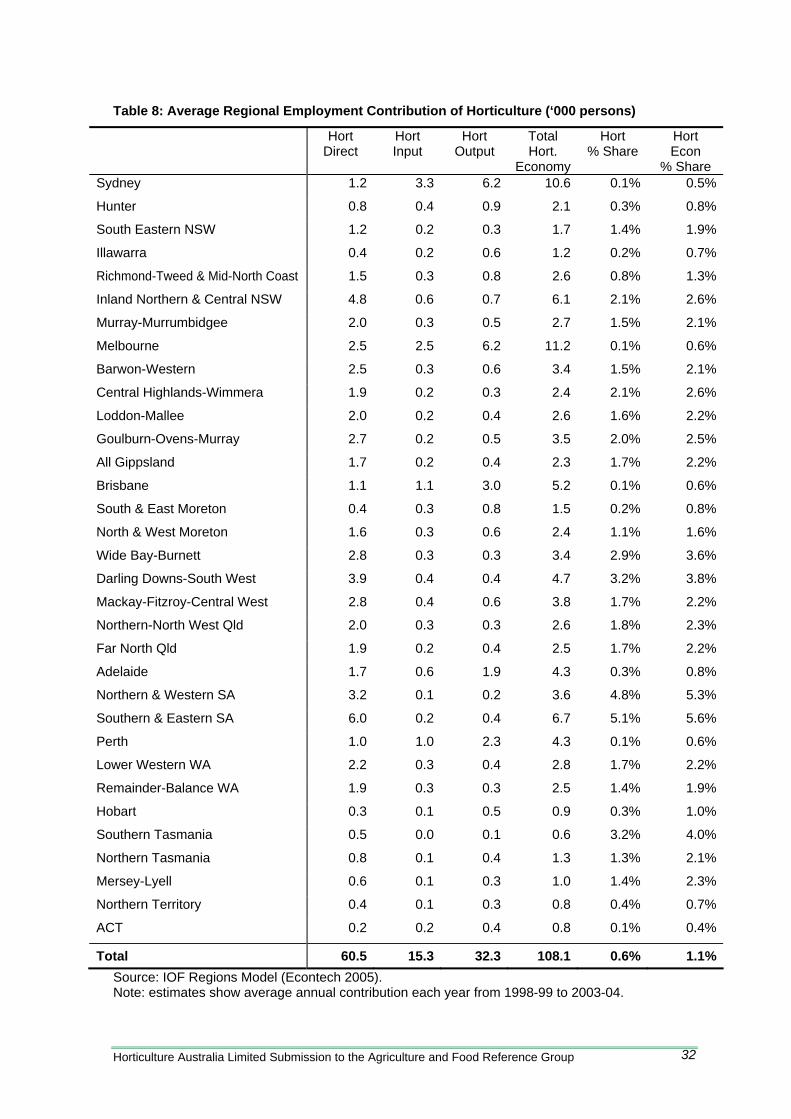
Table 8: Average Regional Employment Contribution of Horticulture (‘000 persons)
Hort Direct
Hort Input
Hort Output
Total Hort.
Economy
Hort % Share
Hort Econ
% Share Sydney 1.2 3.3 6.2 10.6 0.1% 0.5%
Hunter 0.8 0.4 0.9 2.1 0.3% 0.8%
South Eastern NSW 1.2 0.2 0.3 1.7 1.4% 1.9%
Illawarra 0.4 0.2 0.6 1.2 0.2% 0.7%
Richmond-Tweed & Mid-North Coast 1.5 0.3 0.8 2.6 0.8% 1.3%
Inland Northern & Central NSW 4.8 0.6 0.7 6.1 2.1% 2.6%
Murray-Murrumbidgee 2.0 0.3 0.5 2.7 1.5% 2.1%
Melbourne 2.5 2.5 6.2 11.2 0.1% 0.6%
Barwon-Western 2.5 0.3 0.6 3.4 1.5% 2.1%
Central Highlands-Wimmera 1.9 0.2 0.3 2.4 2.1% 2.6%
Loddon-Mallee 2.0 0.2 0.4 2.6 1.6% 2.2%
Goulburn-Ovens-Murray 2.7 0.2 0.5 3.5 2.0% 2.5%
All Gippsland 1.7 0.2 0.4 2.3 1.7% 2.2%
Brisbane 1.1 1.1 3.0 5.2 0.1% 0.6%
South & East Moreton 0.4 0.3 0.8 1.5 0.2% 0.8%
North & West Moreton 1.6 0.3 0.6 2.4 1.1% 1.6%
Wide Bay-Burnett 2.8 0.3 0.3 3.4 2.9% 3.6%
Darling Downs-South West 3.9 0.4 0.4 4.7 3.2% 3.8%
Mackay-Fitzroy-Central West 2.8 0.4 0.6 3.8 1.7% 2.2%
Northern-North West Qld 2.0 0.3 0.3 2.6 1.8% 2.3%
Far North Qld 1.9 0.2 0.4 2.5 1.7% 2.2%
Adelaide 1.7 0.6 1.9 4.3 0.3% 0.8%
Northern & Western SA 3.2 0.1 0.2 3.6 4.8% 5.3%
Southern & Eastern SA 6.0 0.2 0.4 6.7 5.1% 5.6%
Perth 1.0 1.0 2.3 4.3 0.1% 0.6%
Lower Western WA 2.2 0.3 0.4 2.8 1.7% 2.2%
Remainder-Balance WA 1.9 0.3 0.3 2.5 1.4% 1.9%
Hobart 0.3 0.1 0.5 0.9 0.3% 1.0%
Southern Tasmania 0.5 0.0 0.1 0.6 3.2% 4.0%
Northern Tasmania 0.8 0.1 0.4 1.3 1.3% 2.1%
Mersey-Lyell 0.6 0.1 0.3 1.0 1.4% 2.3%
Northern Territory 0.4 0.1 0.3 0.8 0.4% 0.7%
ACT 0.2 0.2 0.4 0.8 0.1% 0.4%
Total 60.5 15.3 32.3 108.1 0.6% 1.1%Source: IOF Regions Model (Econtech 2005). Note: estimates show average annual contribution each year from 1998-99 to 2003-04.
Horticulture Australia Limited Submission to the Agriculture and Food Reference Group 32