Embed Size (px)
Citation preview

Hotel Feasibility Analysis: Downtown Rome Brownfield Opportunity Area &
City of Rome, NY
April, 2017
Prepared for:
Bergmann Associates &
City of Rome, NY
120 West Avenue, Suite 303
Saratoga Springs, NY 12866
518.899.2608
www.camoinassociates.com

About Camoin Associates
Camoin Associates has provided economic development consulting services
to municipalities, economic development agencies, and private enterprises
since 1999. We specialize in real estate market analysis to evaluate the
feasibility and impacts of proposed projects. Through the services offered,
Camoin Associates has had the opportunity to serve EDOs and local and state
governments from Maine to California; corporations and organizations that
include Lowes Home Improvement, FedEx, Volvo (Nova Bus) and the New
York Islanders; as well as private developers proposing projects in excess of
$600 million. Our reputation for detailed, place-specific, and accurate analysis
has led to projects in 29 states and garnered attention from national media
outlets including Marketplace (NPR), Forbes magazine, and The Wall Street
Journal. Additionally, our marketing strategies have helped our clients gain
both national and local media coverage for their projects in order to build
public support and leverage additional funding. The firm currently has offices
in Saratoga Springs, NY; Portland, ME; and Brattleboro, VT. To learn more
about our experience and projects in all of our service lines, please visit our
website at www.camoinassociates.com. You can also find us on Twitter
@camoinassociate and on Facebook.
The Project Team
Michael N’dolo
Vice Principal, Project Principal
Victoria Storrs
Economic Development Analyst, Project Manager
Anna Winslow
Economic Development Analyst, Project Staff

Camoin Associates | Downtown Rome, NY: Hotel Feasibility Analysis
Table of Contents
Executive Summary ............................................................................................................................................................................................... 2
Introduction ............................................................................................................................................................................................................. 3
Hotel Market Area ............................................................................................................................................................................................ 3
Sociodemographic and Economic Overview ............................................................................................................................................... 4
Socioeconomic Profile and Trends ............................................................................................................................................................. 4
General Economic Outlook ............................................................................................................................................................................ 4
Oneida County Hotel Demand Drivers .......................................................................................................................................................... 5
Industry and Employment Expectations .................................................................................................................................................... 5
Marcy Nanocenter ............................................................................................................................................................................................ 5
Griffiss Business and Technology Park ....................................................................................................................................................... 6
Existing Supply ........................................................................................................................................................................................................ 6
Comparable Facilities ....................................................................................................................................................................................... 7
Supply, Demand, and Revenue for Hotel Rooms .................................................................................................................................. 8
Feasibility Analysis ............................................................................................................................................................................................... 15
Hotel Target Market and Type ................................................................................................................................................................... 15
Pro Forma Analysis ......................................................................................................................................................................................... 16

Camoin Associates | Downtown Rome, NY: Hotel Feasibility Analysis 2
Executive Summary An Extended-Stay Hotel in Downtown Rome Appears to be a Feasible Investment
A pro forma financial analysis was created to evaluate the revenue, operating costs, and rate of return for a hotel in
downtown Rome that would be similar to recently developed projects in Oneida County. The analysis considered
likely development costs, a financing package with a long term loan, tax credits and abatements, operating costs,
and occupancy and revenue trends for hotels in Oneida County.
The pro forma analysis shows that a 94-room, nationally branded extended-stay hotel would deliver an 8.36%
internal rate of return (IRR) to the project developer, just meeting the minimum IRR for this type of project.1 Debt
service coverage is projected to exceed minimum requirements for a bank loan, making it likely that a bank would
finance the project.
The analysis makes two assumptions that are critical to the feasibility of the project. First, a location in Rome’s Inside
District qualifies the project for the Business Investment Tax Exemption, which reduces real estate taxes due to the
city, the county, and the school district. Second, it is assumed that the project is located at a brownfield site and
qualifies for state BCP tax credits. BCP tax credit program benefits increase as cleanup costs increase; this analysis
assumes $275,000 of site cleanup costs, which generate $915,750 in tax credits.2
This analysis used conservative estimates for occupancy and revenue, calculating them from the average
performance of a group of 21 hotels in the county that provide information to STR,3 a travel research and data
provider. The median number of years these hotels have been operating is 26.3 years. While five new hotels have
opened in Oneida County since 2012, these added 432 rooms, less than a quarter of current supply. After a brief
drop immediately after the opening of two hotels in 2012, occupancy has been rising steadily, as have room rates
and room revenue. It is therefore possible that the performance of a well-located new hotel will exceed the county
averages and the projections in this analysis.
Hotel Location Should be Visible, Accessible, Attractive
While this analysis concludes that an extended-stay hotel project is feasible for Rome, location will be an important
factor. A City Yard location is less desirable because the site does not have high visibility, access is somewhat
limited, and adjacent uses are not highly compatible.
In the current market, newer nationally branded hotels are often located at sites convenient to businesses, such as
the Hampton Inn at Griffiss Business and Technology Park. A hotel in Rome that offers visitors ready access to
downtown amenities, while still being close to business locations, could differentiate itself from competitors. There
may be other sites within Rome better suited to a new hotel development.
1 RealtyRates.com collects commercial real estate investment, financial, and market data. Data used in this report are for the first
quarter of 2017. 2 Because the BCP tax credits exceed the actual cleanup costs, a reduction in cleanup costs results in a much larger reduction in
tax credits. For example, if cleanup were to cost $150,000, the BCP tax credits would drop to $499,500, and the IRR would be
6.86%. 3 STR, formerly Smiths Travel Research, collects data on occupancy, revenue, supply, and demand for hotels around the world.
www.str.com.

Camoin Associates | Downtown Rome, NY: Hotel Feasibility Analysis 3
Introduction As a sub consultant to Bergmann Associates, Camoin Associates conducted a hotel market analysis for the
Downtown Rome Brownfield Opportunity Area (BOA) in the City of Rome, NY. This report includes a brief overview
of the sociodemographic and economic characteristics of the area and demand drivers for a hotel, including
industry and employment expectations, and the potential for further development at Griffiss Business and
Technology Park and the Marcy Nanocenter. The market analysis shows there is likely demand for an additional
hotel, particularly an extended-stay hotel for business travelers.
A pro forma analysis was created to evaluate the revenue, operating costs, and rate of return for a hotel project. The
analysis considered likely development costs, a financing package with a long term loan, operating costs, and
occupancy and revenue trends for hotels in Oneida County.
Hotel Market Area
The service area for a hotel project, and therefore the study area for this report, is expected to be Oneida County,
including the City of Rome and the City of Utica. The study area encompasses two major industrial developments
that create demand for temporary accommodations; the Griffiss Business and Technology Park, just outside of the
City of Rome, and the Marcy Nanocenter development, located between Rome and Utica.
Oneida County

Camoin Associates | Downtown Rome, NY: Hotel Feasibility Analysis 4
Sociodemographic and Economic Overview Camoin Associates prepared a Real Estate Market Analysis: Erie Boulevard Opportunity Area & the City of Rome, NY
for the Erie Boulevard Brownfield Opportunity Area. This report, distributed in November of 2016, evaluated
sociodemographic trends and the general economic outlook and considered residential, retail, office, and industrial
markets to identify key trends and opportunities for the City of Rome. Selected information from this report is
summarized here to provide context for the hotel feasibility analysis.
Findings from the report that contribute to an understanding of the potential for a new hotel are presented under
four headings: Socioeconomic, Residential Real Estate, General Economic Outlook, and Retail Analysis. This
organization differs from that of the original report. The information has been summarized, not altered, and in some
cases, it is noted why the finding may be important to the location and success of a hotel.
The findings discussed in this section include past trends and projections based on historical performance and do
not take into account potential development at the Marcy Nanocenter. Activity there, including fulfillment of the
March 24, 2017 announcement that Danish company Danfoss Silicon Power GmbH will occupy the Quad C facility,
would significantly improve the projections for jobs, income, and general economic outlook.
Socioeconomic Profile and Trends
Historic population data shows that the BOA, the Local Trade Area and the City of Rome lost population in
the last five years, 2010-2015, but Oneida County and the New York State grew in population.
While New York State is forecasted to experience population growth in the coming four years, the BOA, the
Local Trade Area and the City of Rome do not show the same growth pattern, and instead will shed
residents between 2015 and 2020.
Growth in median household income in the City will outpace income growth in the county.
Rome exceeds the BOA and the Local Trade Area in the percentage of the population is 65 and over, which
should bring attention to the specialty services that these cohorts currently need and will desire in the
future.
Incomes in the City of Rome are shifting from lower to higher income brackets over the next five years.
General Economic Outlook
Employment growth in both Rome and Oneida County is expected to lag behind the rate in Upstate New
York, New York State as a whole, and the nation overall. Over the next ten years, Rome’s employment base
is projected to increase by 2.4%, adding 332 jobs. This exceeds the pace of job growth projected in Oneida
County, which is only 1.1% over ten years.
The Government sector currently accounts for the greatest proportion of Oneida County’s economy,
although public employment is expected to decline slightly in the near future. County government employs
26,500 people and provides earnings of nearly $2 billion annually. The government provides among the
highest average earnings per worker at nearly $75,000.
Health Care and Social Assistance currently ranks second in terms of jobs, with more than 20,000 jobs and
19% of jobs in the county. The Health Care industry is projected to see significant growth, while the retail
sector is expected to decline over the next five years.
Accommodation and Food Services, and Professional, Scientific, and Technical Services are among the only
other sectors expected to experience any significant growth. Select manufacturing activities are also

Camoin Associates | Downtown Rome, NY: Hotel Feasibility Analysis 5
expected to experience growth, including Electrical Equipment, Appliance, and Component Manufacturing;
Food Manufacturing; Computer and Electronic Product Manufacturing; Wood Product Manufacturing; and
Apparel Manufacturing.
The Retail market could experience transformative effects from development at the Marcy Nanocenter.
Based on current spending in the local trade area and the City of Rome, there are minimal opportunities for
additional retail stores. The 1,000 – 2,000 jobs that are anticipated to accompany the Marcy Nanocenter will
likely be high paying jobs. Individuals will seek out entertainment and recreation options in the area if Rome
can harness its downtown to draw regional patronage from the new residents.
Oneida County Hotel Demand Drivers Since this analysis focuses on a potential hotel, which may serve business travelers, a brief summary of industry and
employment expansion is provided here. Findings from the Real Estate Market Analysis on the demand for space,
expected employment growth, and development potential at Griffiss Industrial and Business Park and the Marcy
Nanocenter are summarized.
Industry and Employment Expectations
Demand for commercial space can indicate future demand for overnight accommodations. Expansion of existing
business, or expected relocation of businesses into the study area would increase visits from customers, suppliers,
and management. The Real Estate Market Analysis found that there is very weak demand for commercial and
industrial space in the city and Oneida County, with existing space, particularly at the Griffiss Industrial and Business
Park, likely to satisfy demand for some time. Exceptions are the potential for medical office space, and the fact that
flex space is in short supply.
Short-term office space; however, may be required as a result of building and growth at the Marcy Nanocenter. This
is space that leases for less than one year, is fully furnished, and includes basic business equipment. GlobalFoundries
in Saratoga County is a similar development that created demand for this type of space. Short-term workers would
need hotel and extended-stay hotel accommodations, particularly because the existing gap in high-quality housing
attractive to professionals would make sharing economy services such as AirBNB less effective than in other markets.
While government and health care are expected to continue to be major employment drivers, these sectors are not
anticipated to generate a high number of business travelers. However, industrial sectors that are forecasted to grow
significantly, and that may require additional accommodations for facility visitors, include: Professional, Scientific,
and Technical Services; Electrical Equipment, Appliance, and Component Manufacturing; Food Manufacturing;
Computer and Electronic Product Manufacturing; Wood Product Manufacturing; and Apparel Manufacturing.
Marcy Nanocenter
Development is planned at the Marcy Nanocenter site where a 360,000 square foot chip manufacturing facility is
expected to be constructed in the Town of Marcy, between the cities of Rome and Utica. On March 24, it was
announced that a new company, Denmark’s Danfoss Silicon Power GmbH, will occupy the Quad C facility and add
approximately 300 jobs. This is a portion of the 1,000 – 2,000 expected over time but is a positive event for the
region.

Camoin Associates | Downtown Rome, NY: Hotel Feasibility Analysis 6
Originally, production had been expected to start in early 2018 and when fully operational, the plant was projected
to employ 700 direct employees. An additional 500 indirect jobs are expected to be generated. The site boasts other
shovel-ready sites and it is likely that businesses will continue to locate at the Marcy Campus.
This campus is not currently designed to mix commercial and industrial with retail, restaurants, or hotels.
Griffiss Business and Technology Park
Griffiss Business and Technology Park was established in 1995 on the footprint of a former Air Force Base, and
portions of the base still function as a regional airport. The park spans 3,500 acres and is divided into 7 different
development districts all holding various available spaces for technology, manufacturing, aviation, office, education,
and recreation. There is room for additional development at 7 various land spaces ranging between 6 acres to 210
acres and 3 facilities ranging in size from 30,100 square feet to 290,560 square feet.
The park also includes a Hampton Inn, but no restaurants or retail to support the visitor experience.
Existing Supply Three nationally branded facilities are shown here, including two in Rome. Comparables were chosen if they were
nationally known, recently built, and similarly sized.
Reviewing facilities to identify
comparables revealed that these hotels
are not generally built in downtown areas
– hotel guests have limited options off
the primary grounds unless they choose
to travel by car. While it is highly likely
that visitors have a car available,
amenities within walking distance, for
example a distinctive local restaurant, or a
park, may be a refreshing change for a
business traveler. The photo at right, of
the Fairfield Inn on North Genessee Street
in Utica, illustrates the frequently isolated
neighborhoods of some hotels that target
business travelers.
National hotels do often seek sites that are within easy reach of major roadways, but according to Google maps,
downtown Rome can be reached in 10 minutes from Griffiss Business and Technology Park, and 17 minutes from
SUNY IT’s Marcy campus. While this is a key driver of local demand for existing and potential amenities in Rome’s
downtown, the option of staying near amenities and driving to a facility or meeting may appeal to business
travelers, particularly those planning a stay of two or more nights.

Camoin Associates | Downtown Rome, NY: Hotel Feasibility Analysis 7
Comparable Facilities
Hampton Inn Rome – Griffiss Business and
Technology Park
Opened December, 2014
Project Cost Est. $7.54 million
Owned by Rome Hospitality Group LLC
Assessed value $4.4 million; full market
value $5.9 million
94 rooms, rates for May 2017 estimated
$169 -$179 per night for a three-night
weekday stay
Business center, meeting rooms, free
breakfast, indoor swimming pool, fitness
center
Wingate by Windham Rome
Opened July, 2008
Owned by Rome Griffiss Dev Co LLP
since August, 2016; sale price listed as
$4 million
Assessed value $3 million; full market
value $4.0 million
76 rooms, rates for May, 2017 estimated
$143 - $167 per night for a three-night
weekday stay
Business center, one meeting room, free
breakfast, indoor swimming pool, fitness
center
Fairfield Inn & Suites Utica
Opened November, 2015
Project Cost
Owned by Utica Lodging Group, LLC
Assessed value $1.98 million; full market
value $2.7 million (City of Utica)
79 rooms, rates for May, 2017 estimated
$178 - $209 per night for a three-night
weekday stay.
Business services, meeting rooms, free
breakfast, indoor swimming pool, fitness
center

Camoin Associates | Downtown Rome, NY: Hotel Feasibility Analysis 8
Supply, Demand, and Revenue for Hotel Rooms
A supply and demand analysis for hotel rooms in Oneida County was performed using data from STR, formerly
known as Smith Travel Research. STR surveys hotels nationally and globally, some as frequently as every week,
collecting data on occupancy, average daily room rates, and revenue per room. Camoin Associates studied a Trend
Report for 2011 through February 2017 that included data from 21 hotels that have participated in the voluntary
surveys. These are generally “flag” hotels by national brands such as Hilton’s Hampton Inn or Marriott’s Fairfield Inn.
Since an extended stay hotel is likely to be developed and operated by a national brand rather than a small local
business, the data provided by this set of hotels is appropriate. Data from STR is aggregated, so individual hotel
performance is not available.
This section of the analysis begins with our takeaway findings and definitions of common measurement terms, then
presents an analysis of supply and demand for rooms, and trends in occupancy and revenue.
Takeaway Findings
Newly available rooms are being absorbed by the market:
1. Demand trends including occupancy, room rates, and revenue per room (RevPAR) have increased
since 2012;
2. The supply of rooms has increased during the same time period;
3. New rooms are being filled.
New supply is in the form of extended-stay and suite hotels, targeting the business traveler.
Demand is strongest during the summer tourism months of July and August, but the September and
October “shoulder” season is improving.
Occupancy, average daily rate, and revenue per room are increasing slightly for nights preceding weekdays,
and may indicate a growth in demand among business travelers, although the effect is not strong.
Definitions
The following definitions are used by STR and in this analysis.
Supply (Rooms Available) - The number of rooms times the number of days in the period. For example, annual
supply would be number of rooms times 365.
Demand (Rooms Sold) - The number of rooms sold (excludes complimentary rooms). For example, annual demand
would be the number of rooms sold times 365.
ADR (Average Daily Rate) - Room revenue divided by rooms sold, displayed as the average rental rate for a single
room.
Occupancy - Rooms sold divided by rooms available. Occupancy is always displayed as a percentage of rooms
occupied.
RevPAR (Revenue Per Available Room) - Room revenue divided by rooms available.
Supply and Demand for Rooms
The table below presents the 21 hotels in the STR data. The median number of rooms is 88 per facility, and the
median number of years since the hotel opened is 26.3. Three hotels in Rome participate: the Hampton Inn at
Griffiss Business and Technology Park, which opened in 2014 and is one of the newest in the county, the Wingate,
and the Quality Inn. Other new additions include the Fairfield Inn and Suites in Utica, which opened in 2015, and
three hotels which opened in 2012: the Hampton Inn Suites New Hartford/Utica, Holiday Inn Express & Suites Utica,

Camoin Associates | Downtown Rome, NY: Hotel Feasibility Analysis 9
and La Quinta Inns & Suites Verona. It is useful to note that recent openings are suite or extended stay facilities such
as the Hampton Inns and facilities styled as “& Suites.”
Between 2011 and 2016, both supply and demand for room nights increased, with a 27% growth in supply slightly
outpacing the 22% growth in demand. This is not necessarily a sign of too many total rooms for the market
demand, given the relatively old facilities, half of which were built more than 25 years ago. It may be a response to
consumer preference for newer facilities, branded hotels, or extended stay and suite hotels, which are the recent
additions to the overnight hospitality mix.
Room Nights Percent Change
Change in Supply 2011 - 2016 149,650 27%
Change in Demand 2011 - 2016 72,923 22%
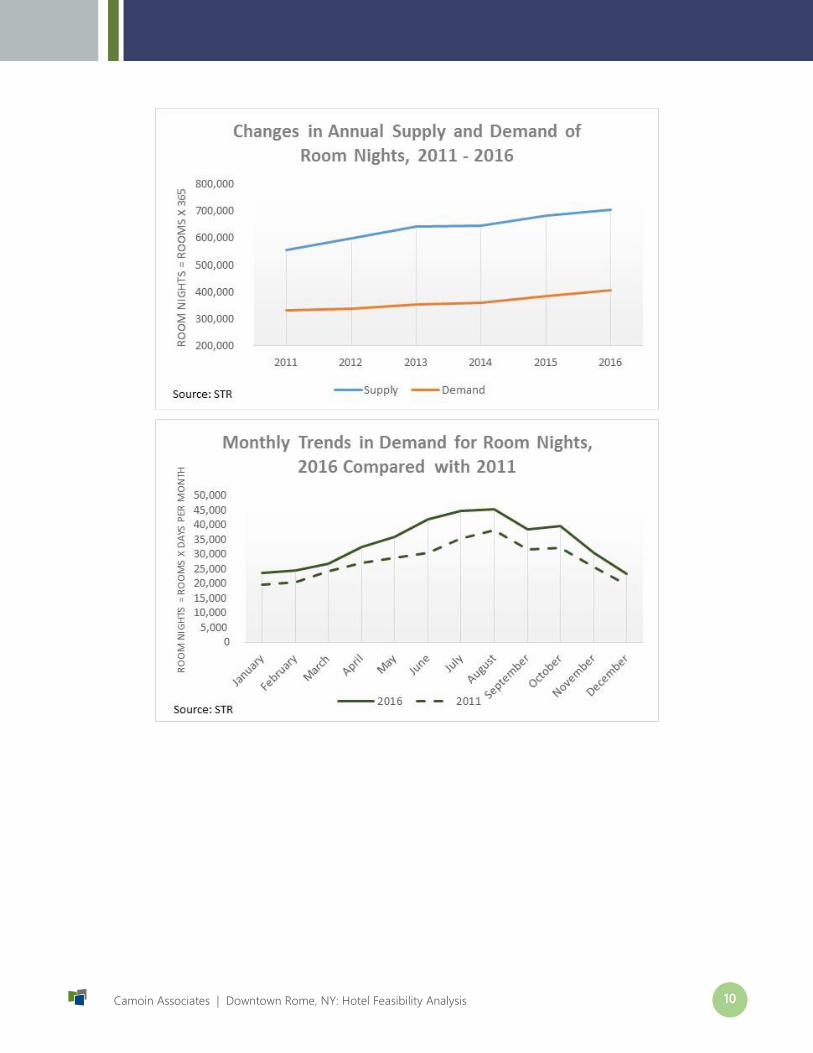
The “Monthly Trends in Demand for Room Nights, 2016 Compared with 2011” visual, below, shows that demand is
strongest during the summer months, increasing steadily from March and April and peaking in August. Gaps
between the two lines show where demand in 2016 for a given month is higher than it had been in 2011, indicating
the months experiencing the greatest growth in new visitors. These are April through October. All of these are
tourism months, with families most likely to travel in July and August. An increase in demand during the September
and October “shoulder” season is a tourism industry plus, as these visitors are often a higher-spending
demographic, for example recent retirees.
Name of Establishment Locatin Class Assigned by STR RoomsYear
Opened
Years Since
Opening
Hampton Inn Rome Rome Upper Midscale Class 94 2014 2.3
Wingate By Wyndham Rome Rome Midscale Class 76 2008 8.8
Quality Inn Rome Rome Midscale Class 104 1963 53.8
Hampton Inn Suites New Hartford Utica Clinton Upper Midscale Class 87 2012 4.8
Holiday Inn Utica New Hartford Upper Midscale Class 100 1990 26.8
Ramada New Hartford New Hartford Midscale Class 104 1981 35.7
Ramada New Hartford New Hartford Economy Class 65 1972 44.8
Motel 6 Oriskany Oriskany Economy Class 57 1975 41.8
Fairfield Inn & Suites Utica Utica Upper Midscale Class 79 2015 1.4
Holiday Inn Express & Suites Utica Utica Upper Midscale Class 75 2012 4.4
Hampton Inn Utica Utica Upper Midscale Class 83 2007 9.3
Knights Inn Utica Utica Economy Class 39 1990 26.3
Red Roof Inn Utica Utica Economy Class 112 1987 29.4
Days Inn Utica Utica Economy Class 59 1985 31.8
Radisson Hotel Utica Centre Utica Upscale Class 162 1981 35.8
Best Western Gateway Adirondack Inn Utica Midscale Class 88 1962 55.0
Hotel Utica Utica Upper Midscale Class 112 1912 104.8
Vernon Downs Hotel & Casino Vernon Economy Class 165 1994 22.5
La Quinta Inns & Suites Verona Vernon Midscale Class 97 2012 5.0
Fairfield Inn & Suites Verona Vernon Upper Midscale Class 93 2009 8.1
Microtel Inn & Suites by Wyndham Verona Vernon Economy Class 81 2008 8.9
Total Rooms 1,932
Median Number of Rooms 88
Median Years Since Opening 26.3
Oneida County Hotels Participating in STR Surveys
Source: STR
Camoin Associates | Downtown Rome, NY: Hotel Feasibility Analysis 10

Camoin Associates | Downtown Rome, NY: Hotel Feasibility Analysis 11
Trends in Occupancy Rates
Occupancy has been climbing despite additions to supply, which is consistent with the increase in demand noted
above. For the study period of 2011 – 2017 year to date, occupancy was highest at 60% in 2011, dropping to 55% in
2013 before climbing to the current 58%. Three hotels were added in 2012.
Occupancy varies by month of the year, and the chart “Average Monthly Occupancy, 2011 – 2016” shows a pattern
of occupancy that rises from 41% in January to peak at 77% in August, prime tourist season, before dropping to an
annual low with an average of 39% in December. This is consistent with the data for demand, which peaks during
summer tourist season. Occupancy of 64% in September and October likely benefits from autumn foliage tourism.

Camoin Associates | Downtown Rome, NY: Hotel Feasibility Analysis 12
Trends in Revenue
Room rates have been increasing at the same time as demand for rooms. RevPAR measures the revenue actually
generated by the hotel; it is total room revenue divided by the number of rooms. All else being equal, higher
occupancy rates will increase RevPAR by generating more revenue. RevPAR will increase with revenue growth from
either fee per room night (room rate), or occupancy rate. In the Oneida County market, it appears that both revenue
factors are on the rise.
The annual average daily rate, or ADR, has risen from $87 in 2011 to $106 in 2016, a 22% increase. The addition of
new, national chain or “flagged” hotel properties has likely contributed to increased rates, as name recognition, well-
understood service and quality levels, and new facilities can give an operator greater pricing power.
Not surprisingly, cost per night is highest during peak tourism season:

Camoin Associates | Downtown Rome, NY: Hotel Feasibility Analysis 13
RevPAR has risen between 2011 and 2016, although it experienced a slight drop from $52 in 2011 to $51 in 2012
before climbing to the current five-year high of $61. As noted with other upward trends, the increase in RevPAR has
been occurring at the same time as new supply is becoming available, indicating that the supply is being absorbed.
RevPAR is highest during the months of July and August; both room rates per night and occupancy are highest at
that time.

Camoin Associates | Downtown Rome, NY: Hotel Feasibility Analysis 14
Business Traveler Trends
Data about weekday compared with weekend hotel visits can indicate differences between business and tourism
use. Stays on nights that precede a business day, including Sunday, are more likely to indicate occupancy by a
business traveler. Growth in indicators for these periods is equal to or slightly higher than growth for weekend
travelers.
Occupancy rates are up for all nights of the week, with increases between 2.5% and 3.5%. There is slightly stronger
occupancy growth for Sundays, Tuesdays, and Thursdays, which would indicate business travelers. Saturday night
stays, which are likely to be leisure travelers, are up 3.4%.
ADR also shows growth across all nights of the week, but with Sunday rate increasing the most, followed by
Monday, both of which precede workdays.
RevPAR, which factors in both occupancy and room rates, shows the greatest variance in change by night of the
week. RevPAR is up 21.2% for Sunday, followed by 17.1% on Monday and 17.6% on Tuesday. This will be the result
of both higher rates and higher occupancy, which together are a positive indicator for more demand early in the
week, and is therefore likely demand by business travelers.
12 Months Ending
FebruraySun Mon Tue Wed Thu Fri Sat
2015 38.0% 49.6% 56.0% 57.6% 54.1% 62.4% 68.6%
2016 38.5% 50.1% 57.9% 59.3% 55.7% 64.6% 71.6%
2017 41.1% 52.1% 59.5% 60.5% 57.1% 65.2% 72.0%
Change 3.1% 2.5% 3.5% 2.9% 3.1% 2.8% 3.4%
Three Year Occupancy (%) by Night of Stay
Source: STR
12 Months Ending
FebruraySun Mon Tue Wed Thu Fri Sat
2015 $86.37 $91.03 $93.23 $93.20 $91.32 $103.22 $106.17
2016 $89.71 $94.93 $96.92 $95.91 $95.08 $107.05 $112.16
2017 $96.72 $101.56 $103.19 $102.45 $99.79 $113.89 $117.98
Change $10.35 $10.53 $9.96 $9.24 $8.47 $10.67 $11.81
% Change 12.0% 11.6% 10.7% 9.9% 9.3% 10.3% 11.1%
Three Year ADR by Night of Stay
Source: STR
12 Months Ending
FebruraySun Mon Tue Wed Thu Fri Sat
2015 $32.83 $45.14 $52.22 $53.67 $49.36 $64.45 $72.88
2016 $34.57 $47.59 $56.14 $56.85 $52.98 $69.13 $80.26
2017 $39.79 $52.87 $61.40 $62.00 $57.02 $74.31 $84.96
Change $6.96 $7.73 $9.18 $8.33 $7.66 $9.86 $12.08
% Change 21.2% 17.1% 17.6% 15.5% 15.5% 15.3% 16.6%
Three Year RevPAR by Night of Stay
Source: STR

Camoin Associates | Downtown Rome, NY: Hotel Feasibility Analysis 15
Feasibility Analysis
Hotel Target Market and Type
Target Market
The target market for a hotel in downtown Rome, particularly if it is to be located at the City Yard site, is the
business traveler. Activity at Griffiss Business and Technology Park, and expected new high-tech tenants at the
Marcy Nanocenter would be enticed to stay in a downtown environment where, after working hours, they could find
unique dining options and some retail amenities. Visitors to large businesses can include sales representatives and
vendors, visiting management, and professionals or technical staff on extended assignments from other locations.
Hampton Inn by Hilton, Marriott’s Fairfield Inn, and Holiday Inn Express and Suites are examples of extended stay
facilitates that have entered the Oneida County market since 2012. Previously, suite/extended stay hotels were
located in proximity to Vernon Downs racing and casino attractions, but the newer additions are closer to Utica and
Rome, where the draw is the increased prominence of the SUNY Polytechnic Institute and the announcement of
development, plus some actual business tenants, at the Marcy Nanocenter. The Griffiss Business and Technology
Park attracted a Hampton Inn which opened in 2014.
The average number of rooms in the hotels4 that have opened since 2012 is 86. Typical amenities include
complimentary breakfast, a business center, a fitness center, and guest laundry. There is frequently an indoor pool.
On-site restaurants are not included, making this type of facility attractive for a downtown location that can offer
restaurants within easy walking distance.
The analysis of trends in occupancy, ADR, and RevPAR show that new hotel capacity is being absorbed by current
travelers to the Rome-Utica area. The attraction of nationally recognized flagged hotels to the area is itself a positive
sign. These facilities can be developed locally, as with the Hampton Inn owned by the Rome Hospitality Group, but
national hotel chains choose carefully where they allow their brand to be established. The marketing reach and
name recognition of flagged hotels can be critical for business travelers, who are less likely than leisure visitors to
undertake the research to evaluate smaller, local, or boutique facilities.
Target Location
The feasibility analysis component of this report therefore considers the viability of a new hotel similar to what has
been successfully developed recently – an extended stay hotel of between 85 and 95 rooms, nationally branded and
locally developed.
Preliminary analyses confirmed the importance of financial assistance in the form of real estate tax reductions
through the City of Rome’s Business Property Exemption and New York State’s Brownfield Tax Credit Program.
Location is therefore assumed to be within the Inside District and the Downtown Rome BOA to maximize these
benefits.
In addition to maximizing the financial benefits available, location within the downtown would be expected to match
well with other planned transformational developments, including a walkable downtown.
4 Includes only hotels that participate in the STR voluntary surveys

Camoin Associates | Downtown Rome, NY: Hotel Feasibility Analysis 16
Pro Forma Analysis
It is expected that a hotel project is feasible, meeting current market requirements for developer rate of return and
bank financing.
The rate of return for the developer investing in the project and the debt service coverage ratio for a bank expected
to finance the project are the most important measures of hotel feasibility, as they are with other projects analyzed
in connection with the Brownfield Opportunity Area process.
A developer rate of return of 8.36% is estimated over a ten-year period. This is calculated using the present value of
expected project cash flows, in this case net operating income and expected sale price after ten years, and the up-
front investment of equity. A developer of a limited-service hotel, which is the category for extended-stay without a
restaurant, would expect an internal rate of return (IRR) of between 8.36% and 20.06%, according to RealtyRates.5
An average debt service coverage ratio of 1.45 over a ten-year period is projected. In the current market a bank would
expect minimum annual debt service coverage (DSCR) of at least 1.25%, exceeded in all years. It is slightly below the
average DSCR of 1.53.6 A developer could improve the DSCR by increasing equity and reducing the loan size,
although a higher equity contribution would reduce the IRR. It is expected that a bank would finance approximately
60% of the project, with the remaining 40% from developer equity.
To test project feasibility, a ten-year pro forma operating statement was created for a hotel similar to recently built
projects in Oneida County. STR data, presented above, was analyzed to generate estimated occupancy rates,
average daily room rate, and revenue. RealtyRates was used to determine the parameters for a bank financing
including required equity, interest rates on a construction loan and a long-term loan, amortization period, and debt
service coverage. RealtyRates also provided information on the developer’s likely required rate of return.
Summary tables presenting key results are below, followed by a list of the assumptions used in the pro forma.
Pro Forma Results
The Financial Summary table at right presents project costs and
loan information, and shows the estimated developer IRR of 8.36%.
Net cashflow after debt service for the first three years after
completion is estimated to average $214,894 per year.
Sources and Uses of Funds provides more detail on the financing
structure.
5 This project is on the low end of that spectrum with conservative estimates on occupancy rates and costs.
6 As published by RealtyRates
Project Cost $7,500,000
Site Cleanup Cost $275,000
Brownfield Tax Credits $915,750
Long Term Loan
Amount Borrowed $4,881,680
Loan Rate 8.67%
Loan Term, Years 23
Developer Return
IRR 8.36%
Average Cashflow after
Debt Service Years 1-3$214,894
Financial Summary
Sources of Funds
Developer Equity $3,385,000
Bank Loan $4,881,680
Total Sources $8,266,680
Uses of Funds
Construction Fund $7,500,000
Capitalized Interest $339,347
Loan Origination Fee $152,333
Total Uses $8,266,680
Sources and Uses of Funds

Camoin Associates | Downtown Rome, NY: Hotel Feasibility Analysis 17
The Sale Proceeds table summarizes the assumptions about the sale
of the hotel after ten years of operations. A sale is assumed in order
to calculate a ten-year time horizon for the developer IRR.
The Performance Trends table shows assumptions about occupancy
rates, the average daily rate for a room, and revenue per room
(RevPAR) for the first five years of the project. These are based on
STR data for hotels in Oneida County and the trends are projected
to improve slightly over time as the hotel is established. In order to
maintain a conservative approach, these trends do not rely on
rapid, large development at the Marcy Nanocenter, even though
plans for such development are a major reason for performing this
analysis. Substantial development at the Nanocenter
in the three-to-five year time horizon would be a
significant benefit to the project.
The Operating Summary table includes key
information about projected revenues, gross operating
profit, key fixed expense items including real estate
taxes, and Net Operating Income (NOI.) NOI less debt
service is projected to be $210,593 in year one,
increasing to $229,574 in year 5. Debt service
coverage is calculated by dividing NOI by debt service
for each year and coverage starts at 1.42x debt service
(principal and interest).
Assumptions
Rooms – The hotel is projected to have 94 rooms available, based on the size of recently built extended-stay hotels.
Expense – Operating expenses are modeled on a similarly sized extended-stay hotel studied in Western NY.
Development Cost – The recently built Hampton Inn at Griffiss Park was used as a model for total project cost. Tax
assessment for the developed property is published online by the City of Rome Assessor’s Office and the calculation
of annual taxes was confirmed in a telephone conversation with them.
Year 1 Year 2 Year 3 Year 4 Year 5
RevPAR $61.00 $61.92 $62.84 $63.79 $64.74
Total Revenues $2,252,108 $2,283,502 $2,318,111 $2,350,454 $2,383,282
Gross Operating Profit $1,005,645 $1,026,057 $1,046,396 $1,067,632 $1,089,293
Less: Real Estate Taxes $129,537 $142,223 $154,909 $167,595 $180,281
Less: Other Fixed Costs $168,908 $172,286 $175,732 $179,247 $182,832
Net Operating Income (NOI) $707,200 $711,547 $715,755 $720,791 $726,181
Less: Debt Service $496,607 $496,607 $496,607 $496,607 $496,607
Cashflow after Debt Service $210,593 $214,940 $219,148 $224,184 $229,574
Debt Service Coverage 1.42 1.43 1.44 1.45 1.46
Operating Summary
Year OccupancyAverage
Daily RateRevPAR
1 58% $105 $61
2 58% $107 $62
3 59% $107 $63
4 59% $108 $64
5 59% $110 $65
Performance Trends
Year Sold 11
Net Operating Income $720,308
Reversion Cap Rate 11.3%
Sale Value $6,368,770
Sale Commission, % 3.0%
Sale Commission, $ $191,063
Principal Payoff $3,784,451
Net Sale Proceeds $2,393,256
Sale Proceeds

Camoin Associates | Downtown Rome, NY: Hotel Feasibility Analysis 18
Developer Investment Assumptions:
40% equity investment
Bank financing, with a short-term construction loan and capitalized interest converted to a long-term loan
at 8.67% for 23 years
8.36% target rate of return for the developer
2-year build period and 10-year ownership ending in the sale of the facility
Financial Assistance Assumptions:
BCP Tax Credits, assumed to be one-time, up-front payment. For the BCP to be available it is assumed in
this analysis that site cleanup is performed by the developer.
City of Rome Business Property Exemption on cost of development; this program reduces real property
taxes by 50% in the first year, 45% in the second, and ending in full real property taxes paid after 10 years.
Inside District location allows Business Property Exemption for city, county, and school taxes.
RESTORE NY funds are not assumed to be applied to this project, although if the $500,000 were allocated, it
would result in an improved rate of return for the developer. These funds would be awarded in a one-time
payment and not improve the operating margin or debt service coverage of the project.
Occupancy and Revenue per Room - occupancy, room rates, ADR, and RevPAR are based on averages and trends
from the analysis of STR data, with conservative growth factors.
Sensitivity of Pro Forma to Key Assumptions
Certain inputs to the pro forma model have a substantial effect on the IRR and DSCR. Major changes to these
assumptions could result in the project’s no longer being feasible. While many assumptions, particularly occupancy
rates, have an impact, the following three have the greatest effect even for small changes.
Interest Rate on Long Term Loan – average interest rates for this type of financing have risen by
approximately 0.33% since the third quarter of 2016, from 8.34% to 8.67%. Further increases in loan rates
will make the project less viable. However, commercial loan rates are generally calculated using a “spread to
US Treasury,” meaning that the current interest rate on a 10-year US Treasury Note is used as a base rate,
and a risk premium, reflecting the lesser credit quality of a commercial borrower, is added to that base rate.
Since the third quarter of 2016, the spread to treasuries of average commercial loan rates has decreased.
Commercial loan rates have risen, but are not entirely tracking the rise in the general interest rate
environment. This suggests that while banks are increasing loan rates they may be constrained by concerns
that demand for loans would drop off if rates rose too high or too quickly.
Interest rates on construction financing have also risen, to 7.73% from 7.00%.
Size of Equity Investment - reducing the equity investment below 40% increases the loan size and therefore
the debt service to too high a percentage of operating revenue. In this model, debt service of $496,607
annually absorbs 22% of revenue in the first year, and while revenue is projected to increase modestly and
debt service remains fixed, after 10 years it is still 19% of revenue, a substantial cashflow requirement.
Interest rate and amortization period also affect the size of the loan; so, if a rate below 8.67% were available,
or an amortization period of more than 23 years, a larger amount could be borrowed without increasing the
annual debt service obligation.
Real property taxes – The project is assumed to be located in the Inside District, taking advantage of the
Business Property Exemption to reduce taxes on the value of the new development. Real property taxes are
6% of Year 1 revenues with the abatement; without it the taxes would be nearly 12%. Since this project is
almost entirely new development, the Business Property Exemption applies to most of the project costs. If
the project were located elsewhere this level of abatement may not be available.

Camoin Associates, Inc.
120 West Avenue, Suite 303
Saratoga Springs, NY 12866
518.899.2608
www.camoinassociates.com
@camoinassociate