Embed Size (px)
Citation preview

MADISON HOTEL FEASIBILITY STUDY
SUBMITTED TO The City of Madison
SUBMITTED BY
C.H. Johnson Consulting, Incorporated December 31, 2012

6 East Monroe Street | Fifth Floor | Chicago, Illinois 60603 | Phone: 312.447.2010 | Fax: 312.444.1125
www.chjc.com | [email protected]
TABLE OF CONTENTS
SECTION I
INTRODUCTORY LETTER
SECTION II
INTRODUCTION & EXECUTIVE SUMMARY ........................................................................................ 1
SECTION III
ECONOMIC & DEMOGRAPHIC ANALYSIS .......................................................................................... 5
SECTION IV
INDUSTRY TRENDS ..................................................................................................................................... 18
SECTION V
REGIONAL & NATIONAL CONVENTION COMPARABLES .........................................................38
SECTION VI
MADISON HOTEL MARKET ANALYSIS & REVIEW OF MONONA TERRACE ....................74
SECTION VII
HOTEL PROGRAM & OPERATING PROJECTIONS ....................................................................... 115
SECTION VIII
HOTEL IMPACTS .......................................................................................................................................... 137

6 East Monroe Street | Fifth Floor | Chicago, Illinois 60603 | Phone: 312.447.2010 | Fax: 312.444.1125
www.chjc.com | [email protected]
SECTION I
INTRODUCTORY LETTER

6 East Monroe Street | Fifth Floor | Chicago, Illinois 60603 | Phone: 312.447.2010 | Fax: 312.444.1125
www.chjc.com | [email protected]
December 31, 2012
Madison Headquarters Hotel Committee
City of Madison
210 Martin Luther King, Jr. Blvd.
Madison, WI 53703
Re: Competitive Analysis and Headquarters Hotel Feasibility Study
Dear Committee Members:
Johnson Consulting is pleased to submit this draft report to the City of Madison regarding the feasibility of
a hotel development to contribute to the economic development of Madison, and support operations of
Monona Terrace. Pursuant to Johnson Consulting’s engagement with the City of Madison, this draft report
provides an analysis of the economic and demographic characteristics of Madison and the broader region;
identifies and analyzes key characteristics of competitive and comparable venues and hotel developments;
summarizes key observations from interviews and primary research; provides hotel program
recommendations; and provides an assessment of the feasibility of a new headquarters hotel, including
demand and financial projections. The analysis also assesses the impact on Monona Terrace and area hotels,
assessing alternative size hotel offerings.
Johnson Consulting has no responsibility to update this report for events and circumstances occurring after
the date of this report. The findings presented herein reflect analyses of primary and secondary sources of
information. Johnson Consulting used sources deemed to be reliable, but cannot guarantee their accuracy.
Moreover, some of the estimates and analyses presented in this study are based on trends and assumptions,
which can result in differences between the projected results and the actual results. Because events and
circumstances frequently do not occur as expected, those differences may be material. This report is intended
for the clients’ internal use and cannot be used for project underwriting purposes without Johnson
Consulting’s written consent.
We have enjoyed serving you on this engagement and look forward to providing you with continuing service.
Sincerely,
C.H. JOHNSON CONSULTING, INC.
CHARLES H. JOHNSON IV, PRESIDENT

6 East Monroe Street | Fifth Floor | Chicago, Illinois 60603 | Phone: 312.447.2010 | Fax: 312.444.1125
www.chjc.com | [email protected]
SECTION II
INTRODUCTION & EXECUTIVE SUMMARY

Section II Introduction and Executive Summary | December 2012 Madison Hotel Feasibility Study – Madison, WI
PAGE 1
6 East Monroe Street | Fifth Floor | Chicago, Illinois 60603 | Phone: 312.447.2010 | Fax: 312.444.1125
www.chjc.com | [email protected]
NATURE OF THE ASSIGNMENT, SUMMARY DATA AND CONCLUSIONS
Subject of the Study
Johnson Consulting was retained by the City of Madison to prepare a feasibility study for a convention
headquarters hotel to be located in downtown Madison, within close proximity to Monona Terrace
Community and Convention Center. The planned hotel development is part of the City’s efforts to increase
convention business in Monona Terrace and to strengthen the facility’s and the City’s competitive position as
a convention destination. The hotel is also part of the City’s strategy to intensify development downtown to
make it more vibrant.
Objectives
In order to assess the economic feasibility and viability of adding a new convention headquarters hotel in
downtown Madison, Johnson Consulting prepared a hotel feasibility study, with a focus on addressing the
following framework questions:
How has Monona Terrace Community and Convention Center been performing? How have
Monona Terrace and the City of Madison positioned it among competing facilities and/or peer
markets?
How have Madison hotels been performing, market-wide and in downtown?
What does future demand for Madison downtown hotels look like?
What are the characteristics of events that have withdrawn and become Monona Terrace’s lost
business?
Is a new Hotel feasible for the City of Madison? What is the impact of a new hotel to Monona
Terrace events?
Methodology
In order to complete its market analysis for the Project, Johnson Consulting performed the following tasks:
Toured and analyzed existing hotels in the area and interviewed property management,
Collected and analyzed data on the city-wide and competitive hotel markets,
Assessed the experience of other similar-sized markets that utilize headquarters hotel properties, and
evaluated insights from them for a new hotel in the market,

Section II Introduction and Executive Summary | December 2012 Madison Hotel Feasibility Study – Madison, WI
PAGE 2
6 East Monroe Street | Fifth Floor | Chicago, Illinois 60603 | Phone: 312.447.2010 | Fax: 312.444.1125
www.chjc.com | [email protected]
Projected the number of room nights the Project will attract, as well as projected the number of
room nights generated by the convention center for the hotel market overall,
Developed a proforma operating projection for the proposed hotel facility based upon demand
projections, a ratio analysis of revenue and expenses derived from a set of similar hotels in the
market and in the US, the performance of similar facilities in other markets, the performance of the
competitive hotel market, and Johnson Consulting’s industry expertise,
Projected net operating income of the property to stabilization and through the 10th year of
operation, and
Projected economic and fiscal impact of the Hotel, including its impact to Monona Terrace events.
Executive Summary
There are several important questions that have been answered in this report. The questions and answers are
summarized below.
Is Madison an Attractive Location for Meetings and Conventions?
Madison competes at a tier above its position, as opposed to smaller markets. Madison is a robust market due
to the presence of the State capital, the University of Wisconsin and a strong and diverse employment base.
Given these factors, and its Midwest location, Madison is in a peer set with destinations such as
Minneapolis/St. Paul, Kansas City/Overland Park, Providence, Des Moines, Ft. Worth, Grand Rapids and
other destinations. It is easy to fall into a trap of visualizing the City as small, and trying to compete at a tier
below where the City should compete. However because of its assets, Madison is special and among a
handful of cities that are able to compete against larger metropolitan areas.
Madison is a market rich with demand potential. More university, state, corporate, regional and national event
potential exists. There are growth opportunities and corporations that need venues for their activities.
Further, continued efforts to improve the downtown area and provide more live, work and play options have
and will continue to make Madison a walkable, convenient and desirable area for event attendees to visit, one
of the key requirements for event recruitment to a destination. The Judge Doyle Square mixed-use
development and the new Hampton Inn downtown, along with improvements to the Edgewater will only
improve the attractiveness of Madison.
How Competitive is Monona Terrace?
Monona Terrace is a significant public asset that generates significant economic impact for the community.
To retain and grow Monona Terrace’s business, and to continue to be competitive in the marketplace and
maintain the Center’s viability, additional hotel rooms and function space must be added. Madison combined

Section II Introduction and Executive Summary | December 2012 Madison Hotel Feasibility Study – Madison, WI
PAGE 3
6 East Monroe Street | Fifth Floor | Chicago, Illinois 60603 | Phone: 312.447.2010 | Fax: 312.444.1125
www.chjc.com | [email protected]
with Monona Terrace is an attractive destination which is surrounded by corporations and associations that
need venues for their activities.
Monona Terrace has lost a significant amount of business due to a lack of hotel room inventory within close
proximity to Monona Terrace. It is very likely that a substantial share of potential business, in addition to lost
business, has not even considered Monona Terrace and Madison in past years because event planners know
there are insufficient hotel room blocks for their events. Currently, conferences and conventions held at
Monona Terrace average a room block size of 300 rooms. Therefore in order to grow the business model a
room block of at least 400 rooms is needed. The hotel market analysis completed in 2009 by Hunden
Strategic Partners identified that need and this study confirms it.
Importantly, Monona Terrace is small for a City the size of Madison. A new hotel should have a substantial
amount of meeting and ballroom space and serve as an extension of Monona Terrace to attract events. If
something is not done to enhance capacity, the market will stay the same, or could be attacked by other
markets and decline. Meeting space at the proposed new hotel at the Judge Doyle Square site is considered to
be essential to Monona Terrace and for growth and economic impact to Madison.
What Size Hotel is Indicated?
In most markets, average demand in excess of 70 percent occupancy indicates unaccommodated demand is
occurring and during peak nights room demand leaks out of the market. The Madison market as a whole is
not experiencing unaccommodated demand however the Downtown Hotel Market experienced seven
months in 2011 where occupancy exceeded seventy percent. Several individual hotels have year round
demand in excess of seventy percent.
Monona Terrace is heavily used, but the majority of events are smaller in size and shorter in event duration.
Hotel-related reasons are the top, controllable, reasons for lost business by those who withdrew events from
Monona Terrace and the City. Indeed, the Hilton was to be the prime hotel, but it is too small, and
sufficiently sized room blocks are not available.
Lost business analysis reveals that events asking for 301 to 400 rooms during peak nights generally give the
greatest impact to the City’s economy. Madison also has capacity to attract events larger than this room block
size. It does so several times a year, but has to use multiple hotels to get larger room blocks. Therefore,
adding a new hotel so the City can accommodate up to 401-to-500 peak room nights and larger, regularly and
consistently, is where help is most needed for Madison.
The Hunden report recommended a 400-room hotel, with the theory that its commitment plus the rooms at
the Hilton will provide a block of 400 rooms. Offering a 400-room block in two separate properties is still
less than ideal. It is our expectation that any proposed new hotel will be very successful and we fear that the
same experience that has occurred with the Hilton will repeat itself with just a 400-room hotel and be

Section II Introduction and Executive Summary | December 2012 Madison Hotel Feasibility Study – Madison, WI
PAGE 4
6 East Monroe Street | Fifth Floor | Chicago, Illinois 60603 | Phone: 312.447.2010 | Fax: 312.444.1125
www.chjc.com | [email protected]
consumed by business and leisure demand. If a new Headquarters Hotel were to accommodate 400 peak
rooms in its single property, its size needs to be 500 rooms and we suggest the City work hard to attract a
hotel as large as this if possible, using the 400-room size as the minimum size acceptable. It is also imperative
that a new hotel has a more robust room block agreement that gives Monona Terrace the support it needs.
It is our conclusion that this new hotel will induce more demand than it takes from other properties and will
help the market and Monona Terrace to be stronger rather than weaker. Based on data presented in this
report, both Ft. Worth and Baltimore achieved stronger convention center demand and better market wide
ADR and occupancies after adding new group oriented hotels to their downtown sectors (this has also been
the case in Dallas, Indianapolis, and several other cities analyzed for this report). We expect the same for
Madison.
Is the Judge Doyle Square Site Attractive?
Unless drastic measures are taken at a later time, the Judge Doyle Square is among the last sites near Monona
Terrace to build hotel rooms close enough to make a difference in demand at the center. The proposed
Judge Doyle Square development can address the most significant of the threats…more hotel rooms in close
proximity to Monona Terrace.
The recommended program for the new Headquarters Hotel is a minimum of 400 rooms and preferably 500
rooms. The hotel should be supported with a total of 50,000 square feet of function space (or 100 square feet
per room). This amount of ballroom and meeting rooms will allow the Hotel to co-host events with Monona
Terrace, serving as a de facto “expansion” of the convention facility. The hotel should be a first-class, chain-
affiliated operation.
The proposed new hotel with the amount of recommended meeting space will be a partner with Monona
Terrace to serve larger events. The development agreement and room block agreement with the proposed
new hotel has to be more aggressively written than the one with the Hilton. It needs to specify more of a
partnership relationship with Monona Terrace and be firmer in room block size and hotel room rates. If a
good agreement is structured, concerns about the competition between Monona Terrace and the hotel will be
mitigated.

6 East Monroe Street | Fifth Floor | Chicago, Illinois 60603 | Phone: 312.447.2010 | Fax: 312.444.1125
www.chjc.com | [email protected]
SECTION III
ECONOMIC & DEMOGRAPHIC ANALYSIS
6 East Monroe Street | Fifth Floor | Chicago, Illinois 60603 | Phone: 312.447.2010 | Fax: 312.444.1125
www.chjc.com | [email protected]
Section III Economic and Demographic Overview | December 2012 Madison Hotel Feasibility Study – Madison, WI.
PAGE 5
ECONOMIC AND DEMOGRAPHIC ANALYSIS
In order to analyze the market opportunity for a proposed headquarters hotel development, Johnson
Consulting undertook a comprehensive review of market conditions in the City of Madison, relative to the
broader metropolitan area, as well as state and national averages. The key objectives of this analysis are to
identify structural factors, opportunities and weaknesses that may affect the market’s ongoing competitive
situation, and to gauge the level of support that exists for the development.
While characteristics such as population, employment and income are not strict predictors of the
performance of convention, cultural, community or trade and exhibition facilities and their associated hotels,
these metrics provide insight into the capacity of a market to provide ongoing support for facilities and
activities. In addition, the size and role of a marketplace, its civic leadership, proximity to other metropolitan
areas, transportation concentrations, and the location of competing and/ or complementary attractions,
directly influence the scale and quality of facilities that can be supported within that particular market.
MARKET OVERVIEW
Strategically located in south-central Wisconsin, just 75 miles from Milwaukee, WI and less than 150 miles
from Chicago, Madison is the capital of Wisconsin and the second largest city in the State. The city covers an
area of 85 square miles, comprised of 69 square miles of land and 16 square miles of water, and just over 10
percent of Madison’s total area is parkland (roughly 4,500 acres). Madison was originally incorporated as a
village in 1846 with a population of 626, but by the time Madison was incorporated as a city in 1856 the
population had grown to 6,864. The first commercial districts were King Street and the East Main and South
Pinckney sides of the Capital Square, and the first residential districts were established along Gilman,
Gorham, Langdon, and Wilson Streets. Madison’s development was driven largely by the growth of the State
and County government and the University of Wisconsin-Madison, as well as several private sector industries
such as Oscar Mayer, Ray-o-Vac, and the Fauerbach Brewery. More recently, Madison has seen growth in the
health and biotech industries with Epic, one of the largest employers and a rapidly growing health system
technology company, having its headquarters in the Madison area, and the University of Wisconsin having
one of the largest research and technology programs in the World. Figure 3-1 provides a map of Madison and
the surrounding region.

6 East Monroe Street | Fifth Floor | Chicago, Illinois 60603 | Phone: 312.447.2010 | Fax: 312.444.1125
www.chjc.com | [email protected]
Section III Economic and Demographic Overview | December 2012 Madison Hotel Feasibility Study – Madison, WI.
PAGE 6
Figure 3 - 1
CURRENT POPULATION
In 2011 the City of Madison had an estimated resident population of 235,016 persons, representing 20.2
percent of the total population of the Greater Madison metropolitan area. Between 1990 and 2011, the
population of Madison increased at an average annual rate of around 1 percent (+1,996 persons per annum),
which was slightly lower than the rate of growth observed throughout Greater Madison (1.4 percent per
annum) but slightly higher than the growth rates recorded throughout Wisconsin (0.8 percent) and slightly
lower than the U.S. as a whole (1.1 percent).
Table 3 - 1
1990 2000 2011 % Growth 1990-2011
CAGR*1990-2011
U.S. 248,584,653 281,399,035 313,513,964 26.1% 1.1%
Wisconsin 4,891,760 5,363,658 5,741,249 17.4% 0.8%
Madison MSA 432,323 501,771 574,835 33.0% 1.4%
Madison 193,721 209,385 235,016 21.3% 0.9%
* Compounded Annual Growth RateSource: DemographicsNow, Johnson Consulting
Historic & Current Population - City of Madison (1990-2011)
6 East Monroe Street | Fifth Floor | Chicago, Illinois 60603 | Phone: 312.447.2010 | Fax: 312.444.1125
www.chjc.com | [email protected]
Section III Economic and Demographic Overview | December 2012 Madison Hotel Feasibility Study – Madison, WI.
PAGE 7
Total growth within Madison city limits has increased by 21.3 percent since 1990, or roughly 0.9 percent per
year. This is lower than the Metropolitan Statistical Area (MSA) and the U.S., but better than the State of
Wisconsin.
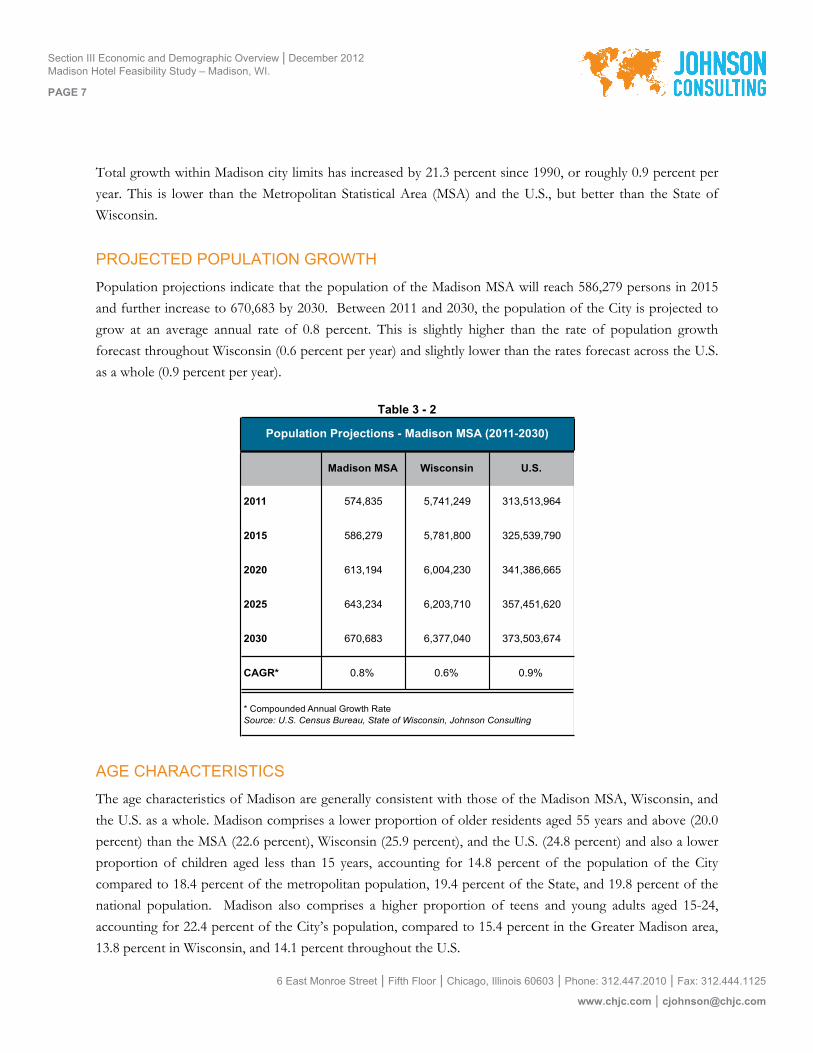
PROJECTED POPULATION GROWTH
Population projections indicate that the population of the Madison MSA will reach 586,279 persons in 2015
and further increase to 670,683 by 2030. Between 2011 and 2030, the population of the City is projected to
grow at an average annual rate of 0.8 percent. This is slightly higher than the rate of population growth
forecast throughout Wisconsin (0.6 percent per year) and slightly lower than the rates forecast across the U.S.
as a whole (0.9 percent per year).
Table 3 - 2
Madison MSA Wisconsin U.S.
2011 574,835 5,741,249 313,513,964
2015 586,279 5,781,800 325,539,790
2020 613,194 6,004,230 341,386,665
2025 643,234 6,203,710 357,451,620
2030 670,683 6,377,040 373,503,674
CAGR* 0.8% 0.6% 0.9%
* Compounded Annual Growth RateSource: U.S. Census Bureau, State of Wisconsin, Johnson Consulting
Population Projections - Madison MSA (2011-2030)
AGE CHARACTERISTICS
The age characteristics of Madison are generally consistent with those of the Madison MSA, Wisconsin, and
the U.S. as a whole. Madison comprises a lower proportion of older residents aged 55 years and above (20.0
percent) than the MSA (22.6 percent), Wisconsin (25.9 percent), and the U.S. (24.8 percent) and also a lower
proportion of children aged less than 15 years, accounting for 14.8 percent of the population of the City
compared to 18.4 percent of the metropolitan population, 19.4 percent of the State, and 19.8 percent of the
national population. Madison also comprises a higher proportion of teens and young adults aged 15-24,
accounting for 22.4 percent of the City’s population, compared to 15.4 percent in the Greater Madison area,
13.8 percent in Wisconsin, and 14.1 percent throughout the U.S.

6 East Monroe Street | Fifth Floor | Chicago, Illinois 60603 | Phone: 312.447.2010 | Fax: 312.444.1125
www.chjc.com | [email protected]
Section III Economic and Demographic Overview | December 2012 Madison Hotel Feasibility Study – Madison, WI.
PAGE 8
Table 3 - 3
No. % No. % No. % No. %
0-4 13,433 5.7% 35,583 6.2% 361,093 6.3% 20,515,002 6.5%
05-14 21,281 9.1% 70,169 12.2% 750,506 13.1% 41,650,303 13.3%
15-19 16,796 7.1% 36,323 6.3% 402,888 7.0% 22,380,439 7.1%
20-24 35,872 15.3% 52,221 9.1% 391,346 6.8% 21,925,644 7.0%
25-34 45,599 19.4% 89,314 15.6% 728,886 12.7% 41,703,842 13.3%
35-44 27,805 11.8% 76,443 13.3% 732,931 12.8% 41,722,752 13.3%
45-54 27,222 11.6% 82,913 14.5% 881,985 15.4% 45,694,540 14.6%
55-64 24,527 10.4% 67,771 11.8% 706,632 12.3% 37,049,733 11.8%
65-74 11,438 4.9% 32,914 5.7% 404,583 7.0% 22,053,995 7.0%
75-84 7,275 3.1% 19,767 3.5% 260,686 4.5% 13,245,781 4.2%
85+ 3,778 1.6% 9,438 1.6% 119,681 2.1% 5,561,498 1.8%
TOTAL 235,026 572,856 5,741,217 313,503,529
Source: DemographicsNow, Johnson Consulting
Age Distribution - City of Madison (2011)
Age Group (Years)
Madison Madison MSA Wisconsin U.S.
MEDIAN AGE
In 2011 the median age of residents of the City of Madison was 30.9 years, which was substantially lower than
figures recorded for the Greater Madison metropolitan area (35.2 years), Wisconsin (38.4 years), and the U.S.
as a whole (37.1). Between 2001 and 2011, the median age of residents of Madison has increased at a steady
rate of 1.6 percent per annum, reflecting the overall shift towards an aging population, but still remaining
below the rates of growth observed at the metropolitan, state, and national levels.
Table 3 - 4
1990 2000 2011 Growth 2001-2011
U.S. 32.9 35.3 37.1 4.2
Wisconsin 32.9 36.0 38.4 5.5
Madison MSA 31.2 33.9 35.2 4.0
Madison 29.3 30.8 30.9 1.6
Source: DemographicsNow, Johnson Consulting
Median Age - City of Madison (2001-2011)

6 East Monroe Street | Fifth Floor | Chicago, Illinois 60603 | Phone: 312.447.2010 | Fax: 312.444.1125
www.chjc.com | [email protected]
Section III Economic and Demographic Overview | December 2012 Madison Hotel Feasibility Study – Madison, WI.
PAGE 9
ETHNICITY
The City of Madison is predominantly white, with only 20.7 percent of the resident population coming from
non-white backgrounds. This is more diverse than the Greater Madison metropolitan area where only 13.7
percent come from non-white backgrounds and Wisconsin as a whole where only 13.8 percent come from
non-white backgrounds, but more representative of the U.S. as a whole where 27.6 percent come from non-
white backgrounds.
Table 3 - 5
No. % No. % No. % No. %
White 186,380 79.3% 496,335 86.3% 4,949,332 86.2% 227,109,319 72.4%
Black 16,656 7.1% 26,685 4.6% 361,750 6.3% 39,444,115 12.6%
American Indian/AK Native 996 0.4% 2,094 0.4% 55,682 1.0% 2,992,142 1.0%
Asian or Pacific Islander 16,781 7.1% 23,872 4.2% 132,100 2.3% 15,431,709 4.9%
Other 5,901 2.5% 10,773 1.9% 126,261 2.2% 18,439,794 5.9%
Two or More Races 8,303 3.5% 15,075 2.6% 116,105 2.0% 10,096,476 3.2%
TOTAL 235,017 574,834 5,741,230 313,513,555
Source: DemographicsNow, Johnson Consulting
Ethnicity - City of Madison (2011)
Madison Madison MSA Wisconsin U.S.
EDUCATIONAL ATTAINMENT
The City of Madison is a highly educated community, with the highest proportion of residents aged 25 years
and older, 28.6 percent, having a bachelor’s degree. This is generally consistent with the Greater Madison
metropolitan area where 25.4 percent of residents aged 25 years and older have a bachelor’s degree, and far
exceeds the state and national level, where only 17.5 percent and 17.8 percent respectively have attained a
bachelor’s degree. Additionally, 22.7 percent of the City of Madison’s residents also hold a graduate degree,
which is a far higher proportion than the Greater Madison metro area (16.3 percent), the State of Wisconsin,
(8.8 percent), and the U.S. as a whole (10.4 percent) by an even wider margin.

6 East Monroe Street | Fifth Floor | Chicago, Illinois 60603 | Phone: 312.447.2010 | Fax: 312.444.1125
www.chjc.com | [email protected]
Section III Economic and Demographic Overview | December 2012 Madison Hotel Feasibility Study – Madison, WI.
PAGE 10
Table 3 - 6
No. % No. % No. % No. %
K-8 3,164 2.0% 7,792 2.1% 128,475 3.3% 12,351,704 5.9%
9-12 6,440 4.0% 14,844 3.9% 246,744 6.4% 16,881,238 8.1%
High School Graduate 28,466 17.6% 88,607 23.4% 1,304,358 33.9% 60,961,809 29.1%
Some College, No Degree 27,049 16.8% 70,634 18.6% 778,667 20.2% 41,348,996 19.8%
Associates Degree 12,393 7.7% 37,270 9.8% 354,462 9.2% 16,140,031 7.7%
Bachelors Degree 46,138 28.6% 96,397 25.4% 673,200 17.5% 37,295,395 17.8%
Graduate Degree 36,670 22.7% 61,952 16.3% 339,146 8.8% 21,758,680 10.4%
No Schooling Completed 1,000 0.6% 1,616 0.4% 22,838 0.6% 2,613,811 1.2%
TOTAL 161,320 379,112 3,847,890 209,351,664
Source: DemographicsNow, Johnson Consulting
Educational Attainment - City of Madison (2011)
U.S.WisconsinMadison MSAMadison
EMPLOYMENT
In 2011, the prominent industry of employment in Madison was Services (46.6 percent of employed residents
aged 16 years and older), followed by Retail Trade (20.6 percent), Finance, Insurance and Real Estate (19.3
percent), and Health Care (16.0 percent). Employment in the Madison MSA declined from 2008 to 2009,
which was mostly due to declines in the manufacturing and construction industries. Additionally, it is worth
noting that the decline of roughly 5,500 total jobs shown from 2007 to 2008 is actually due to the lack of data
on the Transportation and Warehousing industry sector, not necessarily an overall decline in employment.
The Bureau of Economic Analysis (BEA) reports approximately 9,000 transportation and warehousing jobs
in 2007, with a slight overall growth rate in the industry sector from 2006 to 2007, but reports no data for that
industry later than 2007. Therefore, since the roughly 9,000 jobs in Transportation and Warehousing are not
included in the total for 2008 and there is only a decline in total employment of approximately 5,500, the
Madison MSA likely experienced growth or no change in employment in 2008 and then in 2009 and 2010
experienced a reduction in total employment largely due to national economic conditions.

6 East Monroe Street | Fifth Floor | Chicago, Illinois 60603 | Phone: 312.447.2010 | Fax: 312.444.1125
www.chjc.com | [email protected]
Section III Economic and Demographic Overview | December 2012 Madison Hotel Feasibility Study – Madison, WI.
PAGE 11
Table 3 - 7
2006 2007 2008 2009 2010
Utilities* (D) (D) (D) (D) (D)
% of Total
Construction 24,432 23,990 22,470 19,672 18,214
% of Total 7.31% 7.05% 6.71% 6.05% 5.59%
Manufacturing 34,095 34,576 33,003 29,984 29,939
% of Total 10.21% 10.16% 9.86% 9.22% 9.19%
Wholesale trade 14,024 13,916 14,691 13,937 13,911
% of Total 4.20% 4.09% 4.39% 4.29% 4.27%
Retail trade 46,945 47,189 47,389 45,642 44,977
% of Total 14.05% 13.87% 14.16% 14.04% 13.80%
Transportation and warehousing
8,739 8,892 (D) (D) (D)
% of Total 2.62% 2.61%
Information 10,352 10,889 11,491 11,483 12,021
% of Total 3.10% 3.20% 3.43% 3.53% 3.69%
FIRE** 43,955 44,212 45,958 46,741 46,738
% of Total 13.16% 12.99% 13.73% 14.38% 14.34%
Health care and social assistance
36,361 37,199 38,087 38,973 39,492
% of Total 10.88% 10.93% 11.38% 11.99% 12.12%
Arts, entertainment, and recreation
8,924 9,214 9,642 9,673 9,719
% of Total 2.67% 2.71% 2.88% 2.98% 2.98%
Services106,245 110,189 112,001 109,027 110,893
% of Total 31.80% 32.38% 33.46% 33.53% 34.03%
TOTAL 334,072 340,266 334,732 325,132 325,904
*undisclosed by BEA due to confidentiality issues**Finance, Insurance, and Real Estate (FIRE)Source: Bureau of Economic Analysis, Johnson Consulting
Industry of Employment - Madison MSA (2006-2010)
UNEMPLOYMENT
The following table shows the annual unemployment rates for Madison MSA, Wisconsin, and the U.S. from
2002 to 2011. The Madison MSA, Wisconsin, and the U.S. have experienced similar fluctuations in
unemployment, with the greatest increase in occurring in 2009 with 2.6 percent for the MSA, 3.9 percent for
Wisconsin, and 3.5 percent for the U.S. as a whole. However, the unemployment rate in the Madison MSA
has remained consistently more health than that of Wisconsin and the U.S. with overall average
unemployment from 2002 to 2011 at 4.2 percent, compared to 6.0 percent for Wisconsin and 6.5 percent for
the U.S.

6 East Monroe Street | Fifth Floor | Chicago, Illinois 60603 | Phone: 312.447.2010 | Fax: 312.444.1125
www.chjc.com | [email protected]
Section III Economic and Demographic Overview | December 2012 Madison Hotel Feasibility Study – Madison, WI.
PAGE 12
Table 3 - 8
Rate Change Rate Change Rate Change
2002 3.6% - 5.3% - 5.8%
2003 3.9% 0.3 5.6% 0.3 6.0% 0.2
2004 3.4% (0.5) 5.0% (0.6) 5.5% (0.5)
2005 3.3% (0.1) 4.8% (0.2) 5.1% (0.4)
2006 3.4% 0.1 4.7% (0.1) 4.6% (0.5)
2007 3.6% 0.2 4.8% 0.1 4.6% 0.0
2008 3.6% 0.0 4.8% 0.0 5.8% 1.2
2009 6.2% 2.6 8.7% 3.9 9.3% 3.5
2010 6.0% (0.2) 8.5% (0.2) 9.6% 0.3
2011 5.3% (0.7) 7.5% (1.0) 9.0% (0.6)
* Compounded Annual Growth RateSource: Bureau of Labor Statistics, Johnson Consulting
Unemployment Rate - Madison MSA (2002-2011)
Madison MSA Wisconsin U.S.
HOUSEHOLD INCOME
Income characteristics of the local market are a key indicator of the overall health and vibrancy of a market.
In general, higher income levels lead to greater amounts of disposable income that can be spent on non-
essential items, such as recreation and entertainment. In 2011, median household income in the Madison
MSA is estimated at $56,233 per year. This is significantly higher than estimated figures for the City of
Madison ($49,228 per year), Wisconsin ($50,139 per year) and the U.S. as a whole ($50,008 per year). This
variance is consistent with that reported in 2000, and is projected to continue into 2016 with median
household income in the MSA reaching $60,724, compared to $51,978 for the city, $53,249 throughout
Wisconsin, and $53,365 for the U.S. as a whole.
Table 3 - 9
2000 2011 2016 CAGR* 2000-2011
CAGR* 2011-2016
U.S. $42,257 $50,008 $53,365 1.5% 1.3%
Wisconsin $43,926 $50,139 $53,249 1.2% 1.2%
Madison MSA $48,498 $56,233 $60,724 1.4% 1.5%
City of Madison $42,088 $49,228 $51,978 1.4% 1.1%
* Compounded Annual Growth RateSource: DemographicsNow, Johnson Consulting
Median Household Income - City of Madison (2000-2016)

6 East Monroe Street | Fifth Floor | Chicago, Illinois 60603 | Phone: 312.447.2010 | Fax: 312.444.1125
www.chjc.com | [email protected]
Section III Economic and Demographic Overview | December 2012 Madison Hotel Feasibility Study – Madison, WI.
PAGE 13
CORPORATE PRESENCE
A strong corporate and business presence can be an important factor in the success of convention and
lodging facilities because local businesses can attract residents and visitors to an area, provide disposable
income, and support facilities through donations, advertising, and their requirement for event space.
The following table shows the largest public and private employers throughout the Madison MSA (+1,000
employees). As shown, the largest employers are concentrated within the healthcare, education, and
government sectors.
Table 3 - 10
Industry Employees
University of Wisconsin-Madison Education 1000+
UW Health Heath Care 1000+
Madison Metropolitan SchoolDistrict
Education 1000+
Epic Systems Corp Health Care 1000+
American Family MutualInsurance
Insurance 1000+
Department of Corrections Government 1000+
UWMF Health Care 1000+
Department of Health Services Government 1000+
SSM Health Care Health Care 1000+
City of Madison Government 1000+
* Excludes francishesSource: Thrive (Madison Economic Development Partnership), Johnson Consulting
Largest Employers* - Madison MSA
UNIVERSITY AND COLLEGE PRESENCE
The City of Madison is home to several universities and colleges, the largest of which is the University of
Wisconsin-Madison which offers 157 undergraduate majors, 150 Master’s programs, and 108 Doctoral
programs to its approximately 42,500 students. UW-Madison is also one of the largest research universities in
the U.S., ranking 2nd in total research expenditures and non-federally funded research, 4th in federally funded
research, and 5th in doctorates granted. Additionally, with more than 16,000 employees UW-Madison is
among the largest employers in Wisconsin.
ACCESSIBILITY
Madison means is easily accessible via numerous modes of transportation, and as such can draw visitors from
a wide catchment area:
Dane County Regional Airport: Located minutes from downtown Madison, Dane County Regional
Airport offers more than 90 arrivals and departures daily. Dane County Regional Airport also offers
non-stop service to several major U.S. cities, including Atlanta, Chicago, Dallas-Fort Worth, Denver,
New York, and Washington DC.
6 East Monroe Street | Fifth Floor | Chicago, Illinois 60603 | Phone: 312.447.2010 | Fax: 312.444.1125
www.chjc.com | [email protected]
Section III Economic and Demographic Overview | December 2012 Madison Hotel Feasibility Study – Madison, WI.
PAGE 14
Road: Madison has excellent highway access:
– Interstate 90/94 provides access to Madison from Milwaukee, Chicago, and Minneapolis.
– Highway 151 provides access from Green Bay, WI and Dubuque, IA.
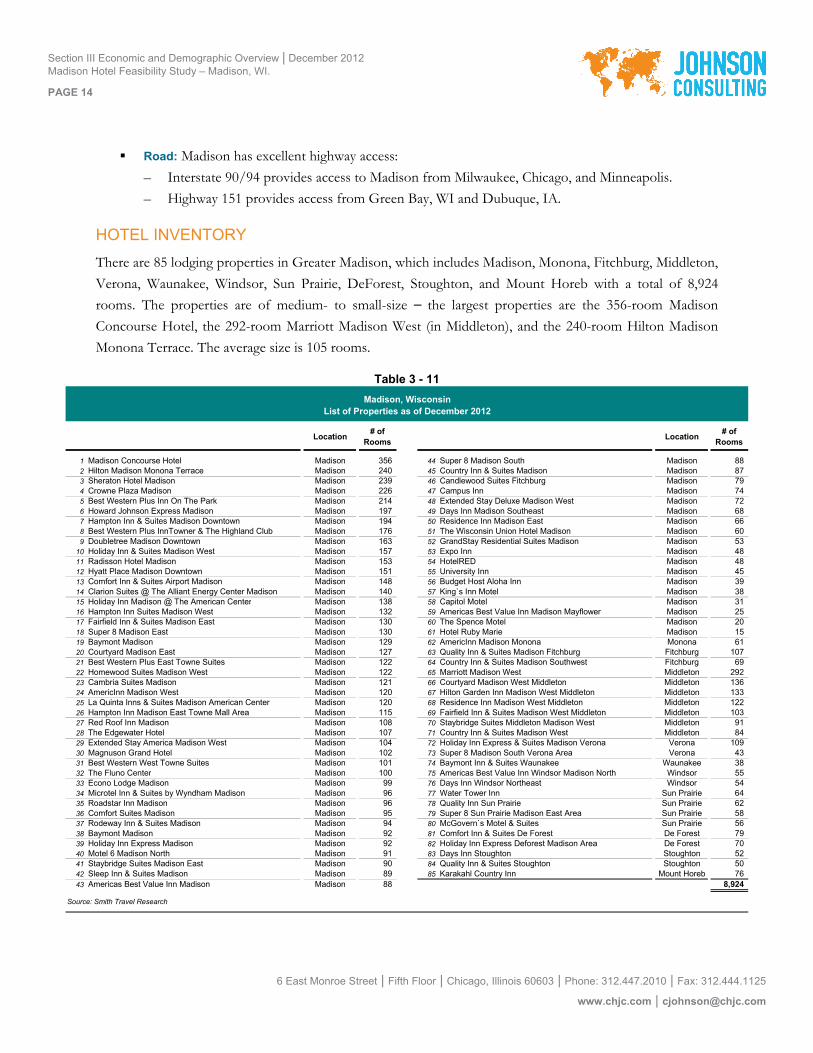
HOTEL INVENTORY
There are 85 lodging properties in Greater Madison, which includes Madison, Monona, Fitchburg, Middleton,
Verona, Waunakee, Windsor, Sun Prairie, DeForest, Stoughton, and Mount Horeb with a total of 8,924
rooms. The properties are of medium- to small-size the largest properties are the 356-room Madison
Concourse Hotel, the 292-room Marriott Madison West (in Middleton), and the 240-room Hilton Madison
Monona Terrace. The average size is 105 rooms.
Table 3 - 11
Madison, WisconsinList of Properties as of December 2012
Location# of
RoomsLocation
# of Rooms
1 Madison Concourse Hotel Madison 356 44 Super 8 Madison South Madison 882 Hilton Madison Monona Terrace Madison 240 45 Country Inn & Suites Madison Madison 873 Sheraton Hotel Madison Madison 239 46 Candlewood Suites Fitchburg Madison 794 Crowne Plaza Madison Madison 226 47 Campus Inn Madison 745 Best Western Plus Inn On The Park Madison 214 48 Extended Stay Deluxe Madison West Madison 726 Howard Johnson Express Madison Madison 197 49 Days Inn Madison Southeast Madison 687 Hampton Inn & Suites Madison Downtown Madison 194 50 Residence Inn Madison East Madison 668 Best Western Plus InnTowner & The Highland Club Madison 176 51 The Wisconsin Union Hotel Madison Madison 609 Doubletree Madison Downtown Madison 163 52 GrandStay Residential Suites Madison Madison 53
10 Holiday Inn & Suites Madison West Madison 157 53 Expo Inn Madison 4811 Radisson Hotel Madison Madison 153 54 HotelRED Madison 4812 Hyatt Place Madison Downtown Madison 151 55 University Inn Madison 4513 Comfort Inn & Suites Airport Madison Madison 148 56 Budget Host Aloha Inn Madison 3914 Clarion Suites @ The Alliant Energy Center Madison Madison 140 57 King`s Inn Motel Madison 3815 Holiday Inn Madison @ The American Center Madison 138 58 Capitol Motel Madison 3116 Hampton Inn Suites Madison West Madison 132 59 Americas Best Value Inn Madison Mayflower Madison 2517 Fairfield Inn & Suites Madison East Madison 130 60 The Spence Motel Madison 2018 Super 8 Madison East Madison 130 61 Hotel Ruby Marie Madison 1519 Baymont Madison Madison 129 62 AmericInn Madison Monona Monona 6120 Courtyard Madison East Madison 127 63 Quality Inn & Suites Madison Fitchburg Fitchburg 10721 Best Western Plus East Towne Suites Madison 122 64 Country Inn & Suites Madison Southwest Fitchburg 6922 Homewood Suites Madison West Madison 122 65 Marriott Madison West Middleton 29223 Cambria Suites Madison Madison 121 66 Courtyard Madison West Middleton Middleton 13624 AmericInn Madison West Madison 120 67 Hilton Garden Inn Madison West Middleton Middleton 13325 La Quinta Inns & Suites Madison American Center Madison 120 68 Residence Inn Madison West Middleton Middleton 12226 Hampton Inn Madison East Towne Mall Area Madison 115 69 Fairfield Inn & Suites Madison West Middleton Middleton 10327 Red Roof Inn Madison Madison 108 70 Staybridge Suites Middleton Madison West Middleton 9128 The Edgewater Hotel Madison 107 71 Country Inn & Suites Madison West Middleton 8429 Extended Stay America Madison West Madison 104 72 Holiday Inn Express & Suites Madison Verona Verona 10930 Magnuson Grand Hotel Madison 102 73 Super 8 Madison South Verona Area Verona 4331 Best Western West Towne Suites Madison 101 74 Baymont Inn & Suites Waunakee Waunakee 3832 The Fluno Center Madison 100 75 Americas Best Value Inn Windsor Madison North Windsor 5533 Econo Lodge Madison Madison 99 76 Days Inn Windsor Northeast Windsor 5434 Microtel Inn & Suites by Wyndham Madison Madison 96 77 Water Tower Inn Sun Prairie 6435 Roadstar Inn Madison Madison 96 78 Quality Inn Sun Prairie Sun Prairie 6236 Comfort Suites Madison Madison 95 79 Super 8 Sun Prairie Madison East Area Sun Prairie 5837 Rodeway Inn & Suites Madison Madison 94 80 McGovern`s Motel & Suites Sun Prairie 5638 Baymont Madison Madison 92 81 Comfort Inn & Suites De Forest De Forest 7939 Holiday Inn Express Madison Madison 92 82 Holiday Inn Express Deforest Madison Area De Forest 7040 Motel 6 Madison North Madison 91 83 Days Inn Stoughton Stoughton 5241 Staybridge Suites Madison East Madison 90 84 Quality Inn & Suites Stoughton Stoughton 5042 Sleep Inn & Suites Madison Madison 89 85 Karakahl Country Inn Mount Horeb 7643 Americas Best Value Inn Madison Madison 88 8,924
Source: Smith Travel Research

6 East Monroe Street | Fifth Floor | Chicago, Illinois 60603 | Phone: 312.447.2010 | Fax: 312.444.1125
www.chjc.com | [email protected]
Section III Economic and Demographic Overview | December 2012 Madison Hotel Feasibility Study – Madison, WI.
PAGE 15
ATTRACTIONS AND PLANNED DEVELOPMENTS
AREA ATTRACTIONS
University of Wisconsin-Madison Athletics: The University hosts 11 men’s and 12 women’s teams
that compete at the NCAA Division I level. The Badgers have a rich athletic tradition, and in the past
seven years alone have won 12 national titles and 26 conference titles.
Madison Symphony Orchestra: Entering its 85th season, the Madison Symphony Orchestra draws
50,000 concertgoers each year. In addition, they serve another 32,000 each year through educational
and community engagement programs.
Madison Museum of Contemporary Art: Since opening in 1901, the museum has acquired a
permanent collection of around 5,000 works. The museum moved to a new 51,000 square foot
location within the Overture Center for the Arts that also includes a 7,100 square foot rooftop
sculpture garden.
Overture Center for the Arts: The newly opened Overture Center for the Arts is located in the heart
of Madison’s cultural arts district. The 380,000 square foot facility houses ten resident organizations
and presents more than 200 performances, art exhibitions, and educational and community events
each year. Overture offers seven performance venues, diverse meeting spaces, and multiple art
galleries.
World Dairy Expo: World Dairy Expo is a five-day event that serves as a forum for dairy producers,
companies, organizations and other dairy enthusiasts to come together to compete, and to exchange
ideas, knowledge, technology and commerce. It is one of the nation’s largest agricultural shows. Over
the last five years, the Expo has hosted an average of 67,609 attendees with a high of 71,788 in 2012,
which included approximately 2,950 international attendees representing 95 different countries.
Chazen Museum of Art: The Chazen Museum of Art opened in 1970 as a division of the UW-
Madison College of Letters and Sciences. It is home to the second-largest art collection in Wisconsin
with over 20,000 works. The museum opened a new 86,000 square foot gallery building in October
2011.
PLANNED DEVELOPMENTS - The City of Madison is embarking on a redevelopment plan for Judge Doyle
Square, a two-block area in the city’s central business district. The goal of the project is to create a large
mixed-use development, possibly including a hotel, which is the subject of this study. This project will expand
and unify the restaurant and entertainment district, resulting in a pedestrian-friendly urban environment. The
figure below provides a map of downtown Madison and Judge Doyle Square in the lower right hand corner.

6 East Monroe Street | Fifth Floor | Chicago, Illinois 60603 | Phone: 312.447.2010 | Fax: 312.444.1125
www.chjc.com | [email protected]
Section III Economic and Demographic Overview | December 2012 Madison Hotel Feasibility Study – Madison, WI.
PAGE 16
Proposed elements of the development will include:
Hotel: The proposed hotel development will support and complement the Monona Terrace
Community and Convention Center by adding hotel rooms within walking distance.
Residential: The proposed residential component will attract additional residents to the district to
increase the vitality of the area.
Office, Retail, Restaurant, and Entertainment: The goal for these components of the development are
to stretch the existing downtown retail and business district from the Capitol Square and King Street
toward Monona Terrace and Wilson Street, while adding important live, work and play connections
to the overall downtown environment.
Parking: The existing Government East parking facility will be replaced with a new parking facility
that serves public parking needs in the area as well as the above-grade development for the above
project elements.
Bicycles: The new development will also help to increase use of bicycles in Madison, already one of
the top cities in the world regarding bike usage, as a viable mode of transportation by creating a
secure bicycle center and enhancing Pinckney Street as a connection for bicyclists and pedestrians.
CONCLUSION
Because of its assets, Madison is special and among a handful of cities that are better than its smaller size
warrants. Madison is a very robust market due to the presence of the State capital, the University of
Wisconsin and a strong and diverse employment base. Given these factors, and its Midwest location, Madison
is in a peer set with destinations such as Minneapolis/St. Paul, Kansas City/Overland Park, Providence, Des
Moines, Ft. Worth, Grand Rapids and other destinations. It is easy to fall into a trap of visualizing the City as
small, and trying to compete at a tier below where the City could and should compete.
Madison can compete at a tier above its position as a smaller tier market, as it has done in the past. The City
is one of the more attractive urban walking cities in the US. Efforts to improve the downtown area and

6 East Monroe Street | Fifth Floor | Chicago, Illinois 60603 | Phone: 312.447.2010 | Fax: 312.444.1125
www.chjc.com | [email protected]
Section III Economic and Demographic Overview | December 2012 Madison Hotel Feasibility Study – Madison, WI.
PAGE 17
provide more live, work and play opportunities will further enhance this destination. It will also support the
operations of Monona Terrace and future downtown development, by providing a walkable and desirable
area for event attendees to visit, which is one of the key requirements for event recruitment to a destination.
Some of the challenges that Madison faces as an event destination relate to hotel supply in proximity to
Monona Terrace (this will be discussed further in subsequent sections) and available airlift at the Dane
County Regional Airport. This airport offers service from four national carriers and has comparatively limited
arrival and departure options compared to other cities of larger size and stature. However, Madison is
accessible by air via connections and can deliver convention and conference attendees. The City is a natural
for state association business, regional events and select national and international association events that
relate to the University degree specializations, its regional corporation niches, and the Midwest economic
base. If these demand categories are matched to the attractive qualities of the City, substantially more hotel
based and Monona Terrace based meeting demand can be achieved.
The proposed Judge Doyle Square development can address the most significant of the threats to the
communities investment in Monona Terrace by adding more hotel rooms in close proximity to the facility.

6 East Monroe Street | Fifth Floor | Chicago, Illinois 60603 | Phone: 312.447.2010 | Fax: 312.444.1125
www.chjc.com | [email protected]
SECTION IV
INDUSTRY TRENDS

6 East Monroe Street | Fifth Floor | Chicago, Illinois 60603 | Phone: 312.447.2010 | Fax: 312.444.1125
www.chjc.com | [email protected]
Section IV Industry Trends | December 2012 Madison Hotel Feasibility Study – Madison, WI
PAGE 18
MEETINGS AND HOTEL INDUSTRY TRENDS
MEETINGS INDUSTRY
Virtually all categories of meeting activities have experienced worldwide growth since the early 1970s, with
moderate downturns and rebounds reflective of national and international economic shifts. Notwithstanding
the most recent global recession, the economic efficiency of using tradeshows to sell products, and for the
pursuit of education and commerce, has fueled the creation of new events and the growth of existing events,
in terms of both size and attendance. Cities counties and countries as well as hotel companies throughout the
world have responded and are still responding, albeit at a subdued pace, to this demand, along with efforts to
bolster tourism, trade and development, by supplying millions of square feet of new or renovated exhibition
and meeting space in both small and large markets.
In order to understand the long-term market demand for public assembly facilities, an analysis of
entertainment, social event, and meeting industry trends is important. This subsection provides a general
overview of the types of meeting facilities that exist in the industry, as well as the types of events that are
commonly hosted. Also discussed are the general requirements that meeting planners look for in a
prospective location, as well as an overview of current and likely future market trends, focusing on the impact
of broader economic conditions on the meetings and events industry.
TYPES OF FACILITIES
Each event type has unique facility needs. Certain events require large amounts of contiguous space, while
others require many smaller meeting rooms. Often a single meeting will use many different types of spaces,
such as large exhibit halls, banquet facilities, breakout meeting rooms, and theater seating. Hotels are also
used in conjunction with the convention center and host many associated food functions, special committee
meetings, board meetings and even events related to but not officially part of the main event held at the
convention center.
As societies mature and become more sophisticated, so too does the meetings market. The diverse nature of
the meetings industry, and the characteristics of various event types, necessitates a variety of alternative
facilities.
The main types of public assembly facilities are summarized as follows:
Hotel and Meeting Room Facilities: Many markets have developed a multipurpose or small
convention or conference center complex within or adjacent to a hotel, as a means of improving the
lure of the hotel and subsidizing its operations. These facilities, which have been undertaken in
markets of varying sizes, are frequently developed through public-private partnerships whereby the
public sector may assemble land, build parking, and fund meeting space components as a way to

6 East Monroe Street | Fifth Floor | Chicago, Illinois 60603 | Phone: 312.447.2010 | Fax: 312.444.1125
www.chjc.com | [email protected]
Section IV Industry Trends | December 2012 Madison Hotel Feasibility Study – Madison, WI
PAGE 19
execute a project. Often the various project elements are developed as a joint project, in terms of
timing, but in some markets, the public elements have been built first with the hotel coming later.
Conference Centers: Conference centers provide a specialized combination of meeting spaces, high-
tech amenities, and services in support of training and education initiatives. Most conference centers
are operated in conjunction with a hotel, although some are part of a university and a small number
operate as stand-alone venues.
Convention Centers: On a larger scale, convention centers combine the meeting capabilities of a
conference center with exhibit space. These facilities are designed to meet the broad needs of the
Meetings, Incentive, Convention, and Exhibition (M.I.C.E.) industry and primarily serve as economic
development enterprises for the community. Their mission is to bring outside visitors and associated
spending into the community, although they may also host large locally oriented consumer events.
Exposition Halls: These facilities focus exclusively on product and consumer shows that require little
meeting space. Pure exposition halls generally exist in markets that have other convention and/or
meeting venues available or in situations where the private sector has responded to a lack of supply
by developing an inexpensive facility. Fairgrounds also offer facilities that are exposition-oriented.
Trademarts: Trademarts or merchandise marts typically combine an exhibit facility, permanent
display space that is occupied by businesses under long-term lease agreements, and specialized office
space. These facilities provide space for the wholesale distribution of products in specific industries,
including furniture, clothing, sporting goods, and computers. These facilities occur in large cities that
serve as regional wholesale and marketing centers.
Fairgrounds: Fairgrounds combine a number of assembly and exposition elements on a large
campus. Facilities may include one or more exhibition halls, along with arena and meeting hall
functions, although little meeting space is usually offered on the property. Typically located away
from downtown areas, fairgrounds provide acres of parking for large events. Madison’s Fairgrounds
is located near downtown and is a demand generator for downtown during peak event periods.
Events Centers: Events centers, or arenas, are used as multi-purpose facilities to host a wide range of
events, from small to mid-size conventions, and trade shows, to sporting events, concerts, and
banquets. These facilities typically host many more locally oriented events than dedicated exhibit and
ballroom space within convention centers. Events centers also incorporate breakout and meeting
rooms, and often have a full commercial kitchen to cater banquet events.
Monona Terrace is a hybrid facility with aspects of a conference center, a convention center and an
events center. While beautiful and multifaceted, it is small and covers many fronts. Its small size limits
some event options and as the facility attracts and serves events and gains an excellent reputation with

6 East Monroe Street | Fifth Floor | Chicago, Illinois 60603 | Phone: 312.447.2010 | Fax: 312.444.1125
www.chjc.com | [email protected]
Section IV Industry Trends | December 2012 Madison Hotel Feasibility Study – Madison, WI
PAGE 20
events, its fixed nature does not allow it to grow with its customers or offer all of the spaces needed by
many events. Its lakefront setting is unique and adds to its attractiveness.
TYPES OF EVENTS
As outlined above, the events industry is comprised of various different types of events, including:
Conventions or Congresses: These are privately held meetings of professional groups and
associations that commonly take place in hotels, convention centers, or civic centers. These meetings
attract association members and/or affiliates wishing to meet similar professionals and share ideas.
A convention can consist of a single meeting or a number of concurrent meetings during the event
period, and are increasingly featuring exhibits to communicate ideas. These types of conventions are
known as “conventions with exhibits.”
The term “convention” is generally used in North America, and “congress” is used in Europe, and
sometimes in Asia, to describe the same type of events. However, conventions typically use more
exposition space and have a more social nature than congresses, but this distinction is narrowing as
congresses are becoming more like North American-style conventions.
Conventions are generally “high-impact” events since attendees normally stay several nights in the
host city, generating hotel room nights. In addition to hotel expenditures, attendees purchase other
goods and services while in the city such as food and beverage, souvenirs, and transportation that not
only contribute to local business but also increase local and state tax revenues.
Temporary Expositions and Trade Shows: These events are designed to bring buyers and sellers of
industry-specific products together. Trade shows usually cater to a specific industry, however, multi-
industry “trade fairs” also occur. Most trade show events are not open to the public or may have
limited public days.
Like conventions, trade shows offer a forum for exchanging industry ideas. They differ from
conventions, however, because they are more product-and sales-oriented. Tradeshows are exhibit-
intensive, and exhibitors prefer column-free, single-story, open-space facilities in which they
construct temporary custom booths for product display. Tradeshows typically attract a large number
of attendees, who originate from outside the host city but tend to have a shorter average stay than
convention attendees.
The event programs run for a period of three to six days, with equal or slightly less time allocated to
setting up and tearing down the event booths. Therefore, individual attendees may have less impact
on the host city’s economy than a convention attendee.

6 East Monroe Street | Fifth Floor | Chicago, Illinois 60603 | Phone: 312.447.2010 | Fax: 312.444.1125
www.chjc.com | [email protected]
Section IV Industry Trends | December 2012 Madison Hotel Feasibility Study – Madison, WI
PAGE 21
Temporary exposition events are increasing the number of meetings held during an exhibition in an
attempt to educate buyers about products, and as a result, are becoming more like “conventions with
exhibits” (see previous point). However, in comparison to more formal conventions with exhibits,
temporary expositions tend to maintain higher attendance figures, but a shorter average length of stay
for attendees.
The following table displays the most frequent event categories for conventions with exhibits and
trade shows.
Table 4 - 1
Aerospace & Aviation Energy & Mining Police & Fire Fighters
Agriculture & Farming Facilities, Engineering & Maintenance Printing & Graphics
Apparel & Fashion Food & Beverage Radio, TV & Cable
Art & Architecture Forest Products Religious
Associations Funeral Industry Safety & Security
Building & Construction Government Sanitation & Waste Management
Business & Finance Home & Garden Furnishings & Supplies Science
Chemicals Libraries Stores & Store Fittings
Communications Manufacturing & Industrial Textiles
Computers & Computer Applications Medical & Health Care Transportation
Education Military Travel Industry
Electrical & Electronics Ocean Supplies & Equipment Veterinary
Source: Red7 Media
Top Event Categories - Conventions with Exhibits & Trade Shows
Assemblies: These are largely association, fraternal, or religious events that require a large plenary
hall, arena, or stadium. Similar to conventions, they are characterized by large numbers of attendees
originating from outside the host city.
Conferences: These are smaller convention-type events and are typically held in meeting rooms and
ballrooms or in formal conference centers. Like conventions and congresses, they are often
sponsored by associations and corporations, and address current issues and information. Attendees
and users typically demand high-quality facilities and most originate from out of town.
Incentive Meetings: The corporate market uses incentive meetings as a way to reward employees,
combine recreation and business meetings, or to mix employees and clients in a business and
recreational setting. Product launches, key account conferences, and award events are all-important
aspects of this type of event.

6 East Monroe Street | Fifth Floor | Chicago, Illinois 60603 | Phone: 312.447.2010 | Fax: 312.444.1125
www.chjc.com | [email protected]
Section IV Industry Trends | December 2012 Madison Hotel Feasibility Study – Madison, WI
PAGE 22
Consumer Shows: These are public, ticketed events featuring exhibitions of merchandise, such as
clothing, food, and antiques. These events are typically held in public assembly facilities such as
hotels, convention centers, and exposition centers. They normally attract large numbers of attendees,
and depending upon the size, location, and type of merchandise being displayed, these shows
normally attract primarily local residents.
The following table displays a summary of the most prevalent types of consumer shows.
Table 4 - 2
Antique Golf RV & Camping
Art Health & Beauty Sewing & Needlework
Auto Holiday Sports Goods & Guns
Boat Home & Garden Super Sale
Computer Jewelry & Gem Toys & Hobbies
Ethnic Jobs, Career & College Travel
Film Motorcycle Weddings
Flower Outdoor Sports Woodworking
Gift & Craft Pets
Source: Red7 Media
Top Event Categories - Consumer Shows
Entertainment Events: Including performing arts, concerts, sporting events, and circuses that can be
accommodated by a variety of facilities. Although entertainment facilities will typically be dedicated
to one or more specific uses, multipurpose venues, such as convention centers, can accommodate a
large variety of events, especially if they are designed appropriately. Entertainment event promoters
require unobstructed space to arrange the performance and to allow attendees to view the show.
Permanent Expositions: Permanent expositions are designed to promote commerce by establishing
permanent exhibit areas for manufacturers. Although these facilities cater primarily to businesses, the
general public is usually allowed to enter. Show promoters, however, discourage public attendance, as
the primary intent of the exhibition is to promote wholesale trade. Permanent expositions use three
types of product promotions:
- Sample Showcases: These are small advertising displays of various new products. While
company representatives do not staff the permanent facility of the showcase, personnel are
usually available to provide buyers with information regarding the companies and their products.
- Export Marts: These are facilities with staffed booths displaying domestic manufactured
products. Export marts are typically arranged by industries and are meant to be one-stop-shops
for prospective domestic and international buyers. The display areas are typically 200 to 600
6 East Monroe Street | Fifth Floor | Chicago, Illinois 60603 | Phone: 312.447.2010 | Fax: 312.444.1125
www.chjc.com | [email protected]
Section IV Industry Trends | December 2012 Madison Hotel Feasibility Study – Madison, WI
PAGE 23
square feet in size and are staffed with three to five people. In industries such as fashion, where
seasonal sales patterns occur, booths are only staffed during peak sales periods, despite the fact
that annual rents are collected for the space.
- Import Marts: Foreign manufacturers use these to display their products to domestic buyers. Like
export marts, they are typically arranged by industries, are 200 to 600 square feet in size, and are
sometimes staffed (only during buying seasons). Often, trade associations representing mart
tenants sponsor temporary expositions, thereby creating a regional draw for the mart. If
significant exposition space is provided, these events can become the dominant industry event in
the country or region.
EVENT SPONSORS
The meetings industry includes a wide variety of event types that are sponsored by different types of
businesses and organizations, including:
Corporations: Business meetings are an integral part of the meetings industry. They represent the
majority of meetings held throughout the world, and topics can be as wide-ranging as the industries
themselves. For the purposes of this report, corporate meetings will refer to off-site conferences,
sales, and incentive meetings, such as the events that are often held at hotels.
Associations: Trade and business associations represent certain industries and strive to keep
members informed about current issues related to their industry. Associations sponsor meetings and
conventions to serve this educational and informational purpose, and also assist in marketing efforts
by holding trade shows where members can display and sell their products.
Educational Institutions: Universities are increasingly recognizing that more continuing education
occurs at meetings, rather than in classroom settings, and are becoming an important player in
developing and sponsoring continuing education activities and conferences.
Government: All levels of government hold meetings for the purpose of education, discussion of
issues, and policy deliberation. In many countries, governments also create and sponsor trade shows
in order to support sectors of the economy.
Independent Show Organizers, Incentive Houses, and Publishing Companies: The meetings industry
has grown so large that it now supports a growing number of organizations that specialize in the
business of producing meeting events. These businesses may work on behalf of corporations and
associations, and handle all aspects of a meeting, from booking attendees to event operations. Many
publishing companies have trade show and convention management divisions, while incentive

6 East Monroe Street | Fifth Floor | Chicago, Illinois 60603 | Phone: 312.447.2010 | Fax: 312.444.1125
www.chjc.com | [email protected]
Section IV Industry Trends | December 2012 Madison Hotel Feasibility Study – Madison, WI
PAGE 24
houses not only work for their corporate and association clientele, but may also develop programs
and conferences as moneymaking ventures.
Social, Military, Education, Religious, Fraternal, and Ethnic (SMERFE) Organizations: These
organizations typically sponsor convention or assembly events that are not always business-related
and tend to be geared more towards social networking and discussion of issues.
MEETING PLANNER SELECTION CRITERIA
The American Society of Association Executives (ASAE), which is a membership organization of more than
22,000 association executives in 50 countries throughout the world, recently surveyed its members regarding
their criteria for selecting a convention center destination. These executives are responsible for selecting
destination(s) for a variety of events, ranging from small meetings to large exhibitions. The following figure
illustrates the average responses of members who placed events in convention centers, including both
regional and local events, as well as national and international events.
Figure 4 - 1
0% 10% 20% 30% 40% 50% 60% 70%
Meeting Facilities
Quality of Service
Overall Affordability
Membership Appeal
Hotel Rooms
Rotation Policy
Driving Accessibility
Facility Type
Climate
ADA Facilities
Dining / Entertainment
Meeting Venue Selection Criteria
Regional / State / Local Events
National / International Events
Source: ASAE, Johnson Consulting
The survey respondents gave a high level of importance to the following criteria when selecting a convention
center for either a regional, state or local event, or a national or international event:
Availability and size of meeting facilities,
Quality of service,

6 East Monroe Street | Fifth Floor | Chicago, Illinois 60603 | Phone: 312.447.2010 | Fax: 312.444.1125
www.chjc.com | [email protected]
Section IV Industry Trends | December 2012 Madison Hotel Feasibility Study – Madison, WI
PAGE 25
Overall affordability,
Membership appeal, and
Availability of hotel rooms.
Meeting planners considered climate, ADA facilities, and dinning/entertainment options as least important
when selecting a venue.
In situations where there are only a limited number of cities with sufficient exhibit space to meet a planner’s
requirements, data from Red 7 Media, indicates that the most important selection criteria relates to hotel
supply. More specifically, the top five criteria when selecting a city, as opposed to a specific facility, are:
Hotel room prices and quality (69 percent of respondents);
Open Dates (66 percent);
Number of Hotel Rooms and Capacity (60 percent);
Hotel Block Attrition Policies and Issues (56 percent), and
Labor Costs and Service Issues (43 percent).
A competitive advantage for cities is gained by having an established and effective tourism and hospitality
industry that provides event producers and attendees with high quality experiences and encourages interest in
returning for subsequent events and meetings. Madison fits into this category and due to its unique urban
fabric, presence of governmental and educational concentrations, and being located in the Midwest with its
agricultural and manufacturing heritage, will continue to grow its market, if it chooses to.
IMPACT OF ECONOMIC CONDITIONS
A recent survey of event planners, conducted by Red 7 Media, indicates that 75 percent of respondents have
changed their site selection process due to the recent recession. Perhaps the most significant, and expected,
change is that more than 50 percent of planners are now looking for value locations and lower costs for
venues, hotels and services, with 46 percent of respondents stating that they are also now booking slightly
smaller hotel blocks.
The top five criteria currently used for selecting a city for an event are:
Hotel Room Prices (72 percent of respondents);
Convention Center and Exhibition Hall Size (66 percent);

6 East Monroe Street | Fifth Floor | Chicago, Illinois 60603 | Phone: 312.447.2010 | Fax: 312.444.1125
www.chjc.com | [email protected]
Section IV Industry Trends | December 2012 Madison Hotel Feasibility Study – Madison, WI
PAGE 26
Airport Capacity and Airfares (64 percent);
Hotel Room Availability (60 percent), and
Availability of Open Dates (57 percent).
It is apparent that hotels continue to play an important role in differentiating cities. Concurrently, the
importance of airlift has grown significantly, reflecting restricted travel budgets for many organizations, along
with service and capacity cuts by many airlines. Approximately 64 percent of planners who have changed
their selection criteria believe that the changes will remain in place for at least the next two years.
EVENT ATTRIBUTES
The following analysis of event attributes is based primarily upon data obtained from the Professional
Convention Management Association’s (PCMA) 2010 survey, which is the most current survey data available
at this time.
NUMBER OF ATTENDEES
An important element to consider in terms of the appropriate size and scope of meeting facilities is the size
distribution of the events it will pursue. Based on the PCMA’s 2010 survey, 44 percent of respondents hosted
less than 1,000 persons at their largest convention, meeting or exposition in 2009 (which is the most recent
data available). This size category is ideal for Monona Terrace and indicates that the facility is able to target a
large percentage of available events. If more meeting space is added to the proposed hotel that is supportive
of existing space at Monona Terrace and does not compromise existing or future events, the market may be
able to attract events in the next tier of attendance category or hold multiple larger events at the same time.
The following figure shows the distribution of attendees based on the PCMA’s survey responses.
Figure 4 - 2
< 500, 25.0%
500-999, 19.0%
1,000-2,499, 17.0%
2,500-4,999, 13.0%
5,000-9,999, 12.0%
10,000-24,999, 9.0%
25,000+, 4.0% No response, 1.0%
Attendance at Largest Convention/ Meeting/ Exhibition (2009)
Source: PCMA, Johnson Consulting
6 East Monroe Street | Fifth Floor | Chicago, Illinois 60603 | Phone: 312.447.2010 | Fax: 312.444.1125
www.chjc.com | [email protected]
Section IV Industry Trends | December 2012 Madison Hotel Feasibility Study – Madison, WI
PAGE 27
Between 2008 and 2009, close to half of survey respondents (48 percent) saw a decrease in the number of
attendees at their largest convention, meeting or exhibition, a consequence of broader economic downturn.
It is worth noting, however, that attendance is not always negatively impacted by an economic downtown
because attendees seek different things from events during periods of economic growth versus periods of
decline. More specifically, during a period of economic prosperity, attendees are typically motivated to attend
a convention, meeting or exhibition by a desire to gain new industry information and technology that may
give them an advantage over their competitors. During periods of economic downturn and recession,
attendees are motivated by a desire to understand what is happening in their market and stay abreast of the
latest opportunities and challenges facing their industry. This means that key personnel will continue to
attend what they consider to be their industry’s most important conventions, trade shows and meetings, even
during periods of economic decline.
A recent survey of major global convention center executives, conducted by the International Association of
Congress Centers (AIPC) and Red 7 Media (Research and Consulting), indicates that total attendance
contracted by 6.3 percent throughout North America in 2010. Notwithstanding this, venues were optimistic
about attendance levels in 2011, forecasting robust growth of 8.3 percent, with continued recovery in 2012
and 2013.
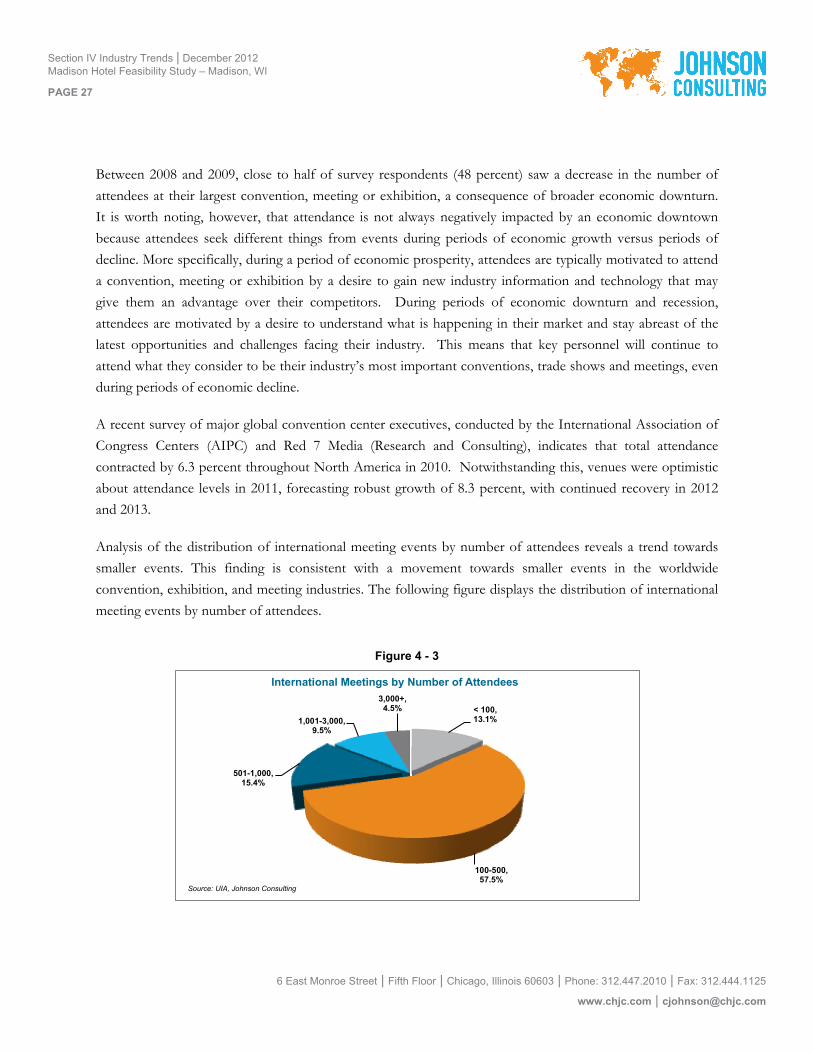
Analysis of the distribution of international meeting events by number of attendees reveals a trend towards
smaller events. This finding is consistent with a movement towards smaller events in the worldwide
convention, exhibition, and meeting industries. The following figure displays the distribution of international
meeting events by number of attendees.
Figure 4 - 3
< 100, 13.1%
100-500, 57.5%
501-1,000, 15.4%
1,001-3,000, 9.5%
3,000+, 4.5%
International Meetings by Number of Attendees
Source: UIA, Johnson Consulting

6 East Monroe Street | Fifth Floor | Chicago, Illinois 60603 | Phone: 312.447.2010 | Fax: 312.444.1125
www.chjc.com | [email protected]
Section IV Industry Trends | December 2012 Madison Hotel Feasibility Study – Madison, WI
PAGE 28
The majority of international meeting events (57.5 percent) are in the 100-500-attendee range. Very few of
these meeting events have over 3,000 attendees (4.5 percent), while 86 percent have 1,000 or fewer attendees.
There is more of a distinction between trade fairs and conventions in Europe than in the US, which explains
why European events are smaller. Many trade fairs are huge in Europe, but do not include as much
conference business as in the US.
EVENT SPACE REQUIREMENTS
The following figure highlights the distribution of shows by required exhibit space. As shown, the majority
of events (nearly 66 percent) utilize less than 100,000 square feet of space.
Figure 4 - 4
65.60%
19.60%
7.70%
2.50%
1.50% 1.30% 0.03%
1.70%
Distribution of Events by Required Exhibit Space (sq.ft)
< 100,000 sq.ft
100,000-199,999 sq.ft
200,000-299,999 sq.ft
300,000-399,999 sq.ft
400,000-499,999 sq.ft
500,000-599,999 sq.ft
600,000-699,999 sq.ft
700,000+ sq.ft
Source: Tradeshow Week, Johnson Consulting
Recent surveys by Red 7 Media (Research and Consulting) indicate that the number of exhibitors has grown
slightly (by 1-2 percent) in 2010, while total net square footage requirements have remained flat. The
fundamental makeup of the distribution of events by required exhibit space has remained unchanged through
2012.
The following figure presents the importance of various specifications and amenities of event space to
convention and exhibition producers based upon data from a recent Red 7 Media study. As shown, the most
important factors relate to column-free exhibit space (94 percent of respondents), efficient loading dock
facilities (94 percent), Wi-Fi (87 percent), meeting rooms (82 percent), state-of-the-art audio-visual capabilities
(79 percent), and quality restaurants (69 percent). The following figure shows the importance of various
convention center specifications and attributes.

6 East Monroe Street | Fifth Floor | Chicago, Illinois 60603 | Phone: 312.447.2010 | Fax: 312.444.1125
www.chjc.com | [email protected]
Section IV Industry Trends | December 2012 Madison Hotel Feasibility Study – Madison, WI
PAGE 29
Figure 4 - 5
0% 10% 20% 30% 40% 50% 60% 70% 80% 90% 100%
Column-Free Exhibit Space
Efficient Loading Dock
Wi-Fi
Meeting Rooms
State-of-the-Art Audio-Visual
Quality Restaurant(s)
High-Teach Meeting Rooms
"Green" Initiatives
Ballroom(s)
Business Center
High Ceilings in Meeting
Theater for Presentations
Entertainment Stages/ Staging
Space for Fashion Show
Boardroom(s)
Importance* of Various Convention Center Specifications & Amenities to Convention & Exhibition Producers (2010)
"Essential" or "Very Important" Source: Red7Media, Johnson Consulting
SEASONALITY
Meetings occur throughout the year. However, just as the number of people taking vacations displays distinct
seasonal patterns, so does the level of meeting activity vary from month-to-month. Since 2000, the first and
fourth quarters have generally seen the most stable growth. Second and third quarters saw contraction during
the beginning of the decade but growth in the past several years, with demand fluctuating much more during
the second and third quarters as opposed to the first and fourth.
LENGTH
The average length of events recorded by the Union of International Associates (UIA) is four days. The
increasing trend in meeting events is to concentrate activities into a shorter period of time. However, the
UIA’s criterion of a minimum of three days causes its data to exclude a growing number of shorter meeting
events from its analysis.
PURPOSE OF EVENTS
Corporate activity is responsible for a large share of overall meeting events, with demand often being
generated from the local region, although cities and regions that are particularly attractive as destinations can
attract meeting attendees from a much broader area. The following figure displays the distribution of
corporate meeting types by purpose of meeting.

6 East Monroe Street | Fifth Floor | Chicago, Illinois 60603 | Phone: 312.447.2010 | Fax: 312.444.1125
www.chjc.com | [email protected]
Section IV Industry Trends | December 2012 Madison Hotel Feasibility Study – Madison, WI
PAGE 30
Figure 4 - 6
Training Seminars, 23%
Sales, 22%
Incentive Trips, 18%
Professional / Technical, 10%
Management, 10%
Other, 10%
Product Introductions, 6%
Stockholder, 1%
Purpose of Corporate Meeting Events
Source: Tradeshow Week, Johnson Consulting
Training seminars, sales meetings, and incentive trips account for the largest share of overall meeting
attendees. As shown, the meeting industry is diversified, with no single meeting type accounting for over 25
percent of overall attendees, and seven distinct categories of meetings all contributing significant volumes of
attendees. This diversification helps to stabilize overall event demand, as the demand from each individual
sub-sector of meeting events ebbs and flows with changes in business cycles and technology.
Overlaying and adding to this is the university training and conference sectors. There are hundreds of
conference centers internationally that are affiliated with four year and community college institutions. They
host some of the above events, but also create a huge volume of business in their own right.
ECONOMIC IMPACT
The PCMA’s 2010 survey indicates that the average economic impact of respondents’ largest convention,
meeting or exposition was $3.6 million to the host destination in 2009, up from $3.0 million in 2008. The
following figure shows the economic value of survey respondents’ meetings to host communities in 2009.
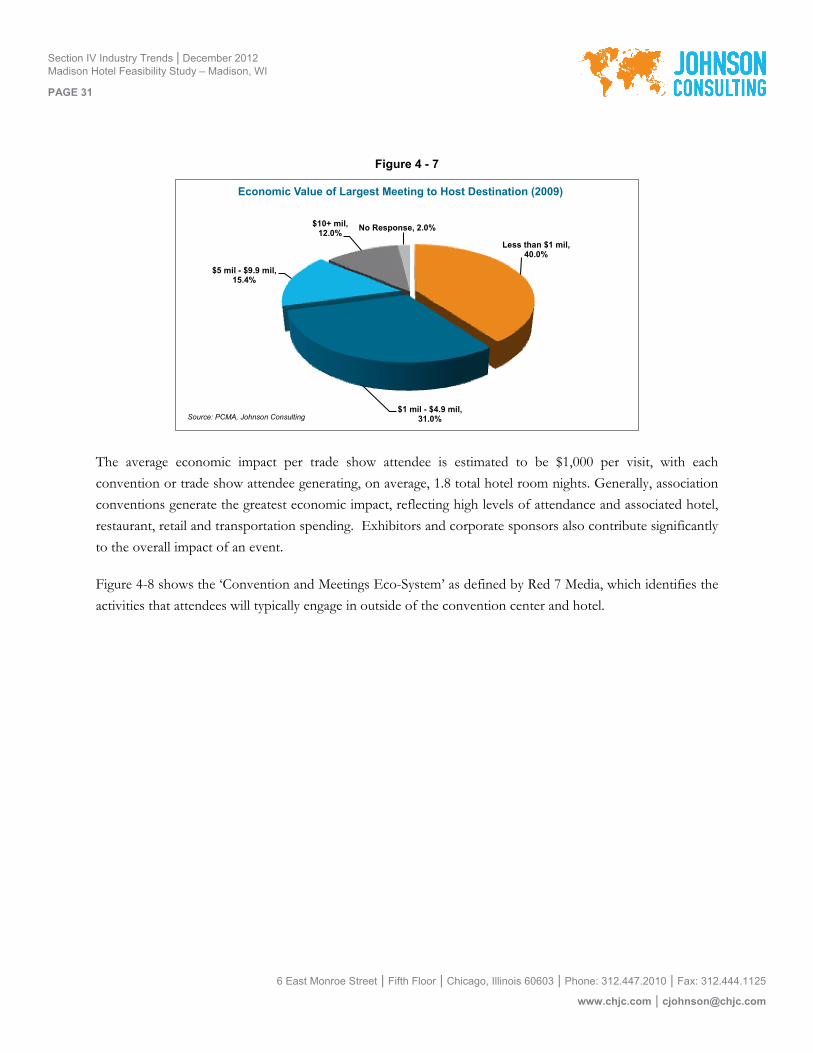
6 East Monroe Street | Fifth Floor | Chicago, Illinois 60603 | Phone: 312.447.2010 | Fax: 312.444.1125
www.chjc.com | [email protected]
Section IV Industry Trends | December 2012 Madison Hotel Feasibility Study – Madison, WI
PAGE 31
Figure 4 - 7
Less than $1 mil, 40.0%
$1 mil - $4.9 mil, 31.0%
$5 mil - $9.9 mil, 15.4%
$10+ mil, 12.0%
No Response, 2.0%
Economic Value of Largest Meeting to Host Destination (2009)
Source: PCMA, Johnson Consulting
The average economic impact per trade show attendee is estimated to be $1,000 per visit, with each
convention or trade show attendee generating, on average, 1.8 total hotel room nights. Generally, association
conventions generate the greatest economic impact, reflecting high levels of attendance and associated hotel,
restaurant, retail and transportation spending. Exhibitors and corporate sponsors also contribute significantly
to the overall impact of an event.
Figure 4-8 shows the ‘Convention and Meetings Eco-System’ as defined by Red 7 Media, which identifies the
activities that attendees will typically engage in outside of the convention center and hotel.

6 East Monroe Street | Fifth Floor | Chicago, Illinois 60603 | Phone: 312.447.2010 | Fax: 312.444.1125
www.chjc.com | [email protected]
Section IV Industry Trends | December 2012 Madison Hotel Feasibility Study – Madison, WI
PAGE 32
Figure 4 - 8
MARKET CONDITIONS
RECENT TRENDS
As a whole, the meeting industry has experienced sporadic growth in the past ten years, dipping slightly in the
early 2000’s, then experiencing a significant period of growth followed by another wave of decline over recent
years, reflecting broader economic conditions and the negative publicity associated with hosting meetings in
upscale or resort destinations.
The impact of the recession on the global meetings industry was widespread - new hotel and meeting facility
construction was delayed, and in many cases abandoned, corporations and associations dramatically reduced
their meetings and events budgets, attendance levels fell sharply, and negative perceptions of the value of
face-to-face meetings prevailed across governments, media and the general public.
Conditions in North America’s convention and meetings industry generally remained flat through 2011, in
line with the broader economy, however 2012 is seeing the transition of the industry towards recovery. The
following figure shows the typical recovery and growth cycle experienced in the convention and meetings
industry.
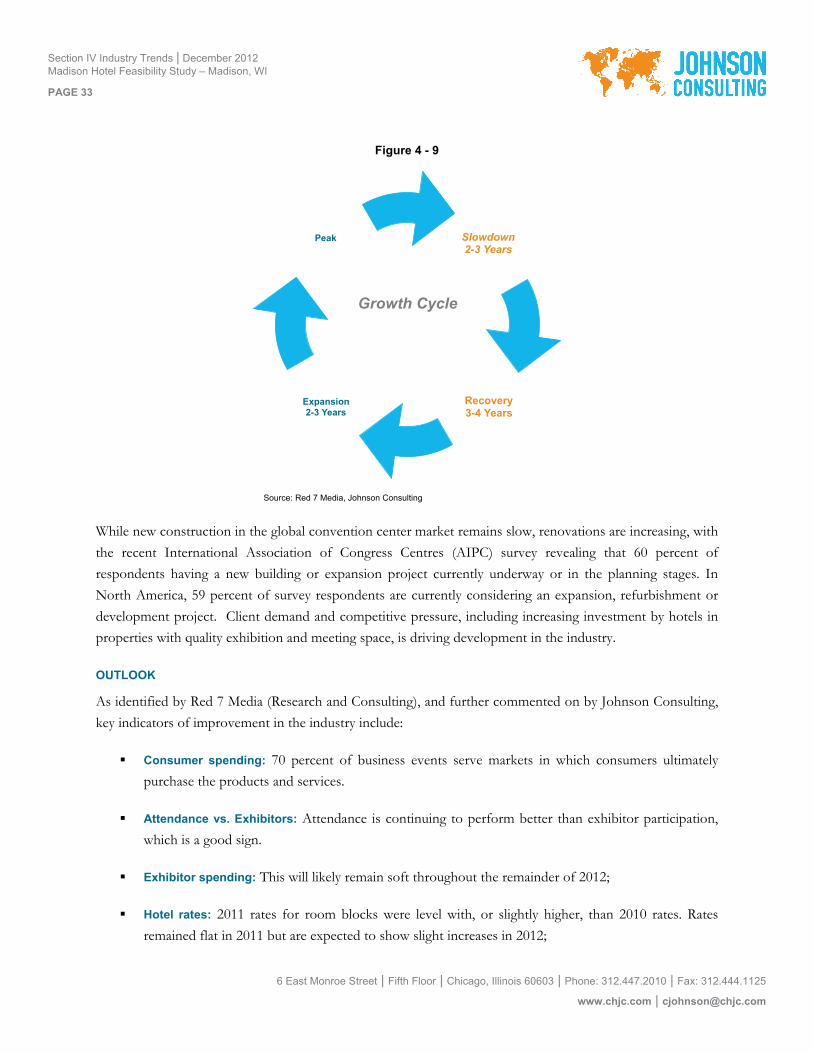
6 East Monroe Street | Fifth Floor | Chicago, Illinois 60603 | Phone: 312.447.2010 | Fax: 312.444.1125
www.chjc.com | [email protected]
Section IV Industry Trends | December 2012 Madison Hotel Feasibility Study – Madison, WI
PAGE 33
Figure 4 - 9
Slowdown 2-3 Years
Expansion 2-3 Years
Peak
Recovery 3-4 Years
Growth Cycle
Source: Red 7 Media, Johnson Consulting
While new construction in the global convention center market remains slow, renovations are increasing, with
the recent International Association of Congress Centres (AIPC) survey revealing that 60 percent of
respondents having a new building or expansion project currently underway or in the planning stages. In
North America, 59 percent of survey respondents are currently considering an expansion, refurbishment or
development project. Client demand and competitive pressure, including increasing investment by hotels in
properties with quality exhibition and meeting space, is driving development in the industry.
OUTLOOK
As identified by Red 7 Media (Research and Consulting), and further commented on by Johnson Consulting,
key indicators of improvement in the industry include:
Consumer spending: 70 percent of business events serve markets in which consumers ultimately
purchase the products and services.
Attendance vs. Exhibitors: Attendance is continuing to perform better than exhibitor participation,
which is a good sign.
Exhibitor spending: This will likely remain soft throughout the remainder of 2012;
Hotel rates: 2011 rates for room blocks were level with, or slightly higher, than 2010 rates. Rates
remained flat in 2011 but are expected to show slight increases in 2012;

6 East Monroe Street | Fifth Floor | Chicago, Illinois 60603 | Phone: 312.447.2010 | Fax: 312.444.1125
www.chjc.com | [email protected]
Section IV Industry Trends | December 2012 Madison Hotel Feasibility Study – Madison, WI
PAGE 34
Corporate events market: There is potentially significant pent-up demand, as 50 percent of major
global convention center managers consider meetings to be the second strongest sector, after
associations, for near-term growth.
New events: a sure sign of recovery will appear when new shows outside of the medical and IT
sectors, and not just limited to conventions, are launched.
In 2011, PCMA survey respondents expect a 24 percent increase in the number of meetings and a 38 percent
increase in attendance over 2009 figures, the height of the economic recession.
The following figure shows recent and forecast trends in the meetings and exhibition industry, based on the
Center for Exhibition Industry Research (CEIR) 2010 Index Report. The Index considers utilization (net
square footage), number of exhibitors, number of attendees, and revenue and shows positive momentum
beginning in mid-2009 and continuing through 2013 (the end of the forecast period).
Figure 4 -10
90�
95�
100�
105�
110�
115�
120�
2000� 2001� 2002� 2003� 2004� 2005� 2006� 2007� 2008� 2009� 2010� 2011� 2012� 2013�
Index�
Historic & Forecast Conditions Index - Meetings & Exhibition Industry
Net�SF� Exhibitors� A endees� Revenue�
The emergence of positive indicators within the market, along with continued improvement in the broader
economy, is expected to drive a recovery in North America’s convention and meetings market. Industry
forecasts indicate that the market will return to pre-recession levels by 2015.

6 East Monroe Street | Fifth Floor | Chicago, Illinois 60603 | Phone: 312.447.2010 | Fax: 312.444.1125
www.chjc.com | [email protected]
Section IV Industry Trends | December 2012 Madison Hotel Feasibility Study – Madison, WI
PAGE 35
SUMMARY
There are literally millions of conventions, tradeshows, and meetings happening annually throughout North
America and around the world. The number of associations is changing, as is the number of corporations, but
meetings will continue to occur. Although 2011 was a flat year and there may be slight structural changes in
meeting formats due to technology, the convention market saw signs of stabilization and growth since the
downturn in 2008-2009 with the majority of meeting planners and event organizers maintaining current event
levels and anticipating event attendance to remain consistent or improve going forward. Furthermore, the
rationale for meetings and associations still exists and will continue to do so. Given Madison’s educational
strengths as well as its compact Central Business District, the community is ripe for demand and will attract
more events if it equips itself to do so.
HOTEL INDUSTRY TRENDS
In most markets throughout the U.S. and globally, hotel demand emanates from three primary demand
segments, as follows:
Business: The Business (or commercial) market segment comprises individuals who travel to a
destination to conduct business, with activity amongst this group occurring primarily from Monday
through Thursday and falling sharply on the weekends. The length of stay by Business guests
typically varies between one and three days, with occupancy per room averaging between 1.2 and 1.3
persons. Demand from this market segment is generally constant throughout the year, although
December and other holiday periods typically represent low periods.
Lodging choices are heavily influenced by brand loyalty, and particularly loyalty/ rewards programs.
The location of lodging facilities also influences Business demand, with a demonstrated preference
for facilities close to businesses and amenities.
Meetings & Groups: This market segment relates primarily to corporate groups and Social, Military,
Education, Religious, Fraternal, and Ethnic (SMERFE) groups who travel for seminars, conferences,
tradeshows, and similar events. Similarly to Business travelers, demand from corporate groups tends
to be concentrated between Monday and Thursday, while SMERFE groups display a preference for
weekends. Demand from this market segment tends to be highest in fall and spring.
Lodging choices for the Meetings and Groups segment are influenced by the availability of meeting
space, technology, and food and beverage options.
Leisure: This market segment comprises individuals and groups who require accommodation when
traveling for leisure purpose. Accordingly, demand from this group tends to be highest on
weekends, as well as weekdays during holiday periods. The length of stay by Leisure guests typically
varies between one and four days, with occupancy averaging between 1.8 and 2.5 persons per room.

6 East Monroe Street | Fifth Floor | Chicago, Illinois 60603 | Phone: 312.447.2010 | Fax: 312.444.1125
www.chjc.com | [email protected]
Section IV Industry Trends | December 2012 Madison Hotel Feasibility Study – Madison, WI
PAGE 36
Leisure demand is heavily influenced by disposable income, and proximity of lodging facilities to
attractions, such as amusement parks, museums, and shopping malls. Events, such as college
graduations or family reunions, also generate significant demand from the Leisure market segment.
MARKET INDICATORS
The following table shows key indicators in the national convention hotel market, between 2008 and 2015
(forecasted). The statistics presented are based on a selection of facilities, selected on the basis of their size,
market, and locational attributes.
Table 4 - 3
Occupancy (%) ADR RevPAR
2008 60.0% $107.08 $64.28
2009 54.8% $97.68 $53.49
2010 57.7% $96.70 $55.80
2011 59.1% $101.05 $59.76
2012F 60.9% $106.11 $64.62
2013F 62.1% $111.94 $69.51
2014F 62.7% $117.54 $73.71
2015F 62.7% $121.07 $75.92
CAGR* 0.6% 1.8% 2.4%
Source: HVS, Johnson Consulting
U.S. Hotel Market Indicators (2008-2015)
* Compounded Annual Growth Rate
Growth in demand resumed in 2010, led by the return of business travel and some group activity, along with
significant discounting by hoteliers. This is reflected in the increase in total occupancy observed in 2010, but
the continued decline in ADR, which contracted by 1.0 percent over the same period. Notwithstanding this,
RevPAR increased by 4.3 percent between 2009 and 2010.
Data from Smith Travel Research (STR) indicates that conditions in the U.S. hotel market (including non-
convention hotels) continued to steadily improve throughout 2011, with total industry revenue growing by
7.5 percent in 2011 to $137.5 billion, representing the largest percentage increase recorded over the previous
10 years. Occupancy improved to 59.1 percent, with the ADR increasing by 5.0 percent over 2010 and
RevPAR increasing by 8.1 percent during the same period.
OUTLOOK
Demand and hotel profitability grew steadily throughout 2011, and it is the general consensus among industry
experts that modest gains will continue through year-end 2012 and into 2013. Unlike many hotel periods, the

6 East Monroe Street | Fifth Floor | Chicago, Illinois 60603 | Phone: 312.447.2010 | Fax: 312.444.1125
www.chjc.com | [email protected]
Section IV Industry Trends | December 2012 Madison Hotel Feasibility Study – Madison, WI
PAGE 37
industry is not overbuilt and has not suffered from lending largesse the way the housing market had. As
employment levels continue improve, demand growth is forecast to increase with conditions in the industry
forecast to stabilize in 2014. The result will be accelerating growth in ADRs as occupancy nears stabilization.
In 2013, STR forecasts that lodging supply will increase by 0.9 percent, which remains well below the long
term average of 2.1 percent. As a result of this imbalance between demand and supply forecasts project an
increase in occupancy levels to 62.1 percent. Strengthening demand and occupancies, along with low levels
of new supply through year-end 2012, should permit hotels to reduce, and eventually eliminate, the
substantial discounts implemented in response to the recession. Hotel operators are expected to increase
room rates, with an average increase of 5.5 percent in ADRs forecast in 2013 (over 2012 forecast rates).
CONCLUSION
Market conditions in the U.S. hotel market have steadily improved since the start of the Great Recession.
Hotel operators are expected to increase room rates in 2013. Specifically in the convention and meetings
industry, nationally, the meeting, trade show, consumer show and social markets are here to stay and will even
become more important mediums of trade and information exchange in the future.
Madison has many demand niches and due to good urban planning is among the top communities of its size
in terms of physical organization that recognizes good urban policies. Monona Terrace is attractive, albeit
somewhat small. However, the size of Monona Terrace is fixed. The facility does not by itself address growth
opportunities for more and larger events. Nor does the facility provide any defense against competition from
the Dells, Milwaukee or suburban Milwaukee venues that compete with Madison and Monona Terrace.
Madison is limited in terms of number of events it can attract due to the size of Monona Terrace as well as
the hotel supply near the Center. It is missing national and international events that are natural to the City
because of the University and corporations located in Madison. Due to the educational aspect of events that
would be attracted to Madison, more meeting and social spaces will be required to meet potential. The City’s
hotel strategy is essential to address these opportunities.
Given Madison’s educational strengths as well as its compact Central Business District, the community is ripe
to increase its market share if it can make investments to attract this additional demand to the city. Monona
Terrace has more capacity, but it will increasingly struggle to get blocks of dates long enough for better
quality events. Monona Terrace could accommodate 61 percent of the largest convention/ meeting/
exhibition events in the United States and 86 percent of international events based on the number of
attendees (1,000 or fewer attendees). However, as this study will point out it is readily apparent that the fixed
amount of meeting space at Monona Terrace and the lack of available hotel room nights limits Monona
Terrace’s ability to attract additional business to Madison or hold multiple larger events concurrently.

6 East Monroe Street | Fifth Floor | Chicago, Illinois 60603 | Phone: 312.447.2010 | Fax: 312.444.1125
www.chjc.com | [email protected]
SECTION V
REGIONAL & NATIONAL CONVENTION COMPARABLES

6 East Monroe Street | Fifth Floor | Chicago, Illinois 60603 | Phone: 312.447.2010 | Fax: 312.444.1125
www.chjc.com | [email protected]
Section V Comparable Facilities Analysis | December 2012 Madison Hotel Feasibility Analysis – Madison, WI
PAGE 38
REGIONAL AND NATIONAL FACILITIES ANALYSIS
This section profiles regional and national facilities that either compete with Monona Terrace or share similar
characteristics from a market standpoint. Developing the list of national comparable facilities was challenging
for this project since the size of Monona Terrace is small in comparison with its size of community and an
accurate competitive set of cities. As a way to overcome this challenge, we present a summary of regional
facilities that compete for the same business, and also present national that range in size from small to mid-
size markets so that a broader perspective can be provided about convention center performance and how
Monona Terrace compares.
REGIONAL ANALYSIS
The Greater Madison Convention and Visitors Bureau and Johnson Consulting have identified the following
cities as the primary regional competitors to Monona Terrace:
Chicago
Columbus
Des Moines
Grand Rapids
Indianapolis
Kansas City
Milwaukee
Minneapolis/St. Paul
Omaha
St. Louis
Wisconsin Dells
Of this group of regional facilities we have selected six destinations based on proximity to Madison, WI as
presented in the table and map below.
Table 5-1 Key Characteristics of Regional Facilities
Location Madison, WI Wisconsin Dells, WI
Milwaukee, WI Chicago, IL** St. Paul, MN Des Moines, IA Grand Rapids, MI Average
Facility Monona Terrace Kalahari Resort Frontier Airlines Center SchaumburgSt. Paul River
Centre Iowa Events Center DeVos Place -
Distance From Madison (miles) - 54 79 147 270 292 325 194.5
Demographic Characteristics
Metropolitan Area Population (2011) 575,000 173,000* 1,560,000 9,506,000 3,317,500 581,500 776,108 2,719,351
Rank 6 7 3 1 2 5 4 -
Median Household Income (2011) $56,000 $47,009* $52,075 $59,321 $62,630 $55,283 $48,964 $55,712
Rank 3 7 5 2 1 4 6 -
Hotel Supply Characteristics
# of rooms within 1 mile of Convention Center 1,035 756 2,862 474 1,377 1,694 1,411 1,373
Rank 5 6 1 7 4 2 3 -
Exhibit Space (SM/ SF)
Exhibit Space 37,200 - 188,695 97,200 ‐ 146,926 162,000 126,404
Ballroom 13,524 37,850 37,506 39,833 27,111 28,800 37,809 31,776
Meeting Room(s) 12,106 23,582 39,640 8,152 18,684 30,825 32,163 23,593
Total Function Space (SF) 62,830 61,432 265,841 145,185 45,795 206,551 231,972 145,658
Rank 5 6 1 4 7 3 2 -
*Includes the Counties of Columbia, Sauk, Adams, Juneau
**Schaumburg Profiled. Chicago also has McCormick Place, Donald E. Stevenson, and hotels with significant meeting space
Source: Relevant Facilities/CVB, Demographics Now, Johnson Consulting

6 East Monroe Street | Fifth Floor | Chicago, Illinois 60603 | Phone: 312.447.2010 | Fax: 312.444.1125
www.chjc.com | [email protected]
Section V Comparable Facilities Analysis | December 2012 Madison Hotel Feasibility Analysis – Madison, WI
PAGE 39
Figure 5-1
Of these competitive destinations, Madison ranks 6th for population, 3rd in terms of median house hold
income, 5th in number of hotel rooms within 1 mile and total size of convention facility. It appears that
Monona Terrace is undersized in terms of metropolitan area population and as a result has to compete
against much larger facilities in similar sized destinations. The two destinations with the most similar
population, Des Moines and Grand Rapids, have total convention facilities that exceed 200,000 net square
feet of function space and 1,694 and 1,411 hotel rooms, respectively, within one mile of the convention
center. The following subsections will provide an overview of each of the destinations and describe how they
function as a convention destination.
WISCONSIN DELLS
Located approximately 54 miles from Madison, the Wisconsin Dells (Dells) is nationally recognized as a top
family vacation destination. Over the past 15 years there has been a transformation in the waterpark industry
with the linkage of waterpark facilities, hotels, and convention space. In the Dells this has resulted in the
development of four primary resort and convention properties that include the Chula Vista Resort, the
Kalahari Water Park Resort and Convention Center, The Ho-Chunk Casino Hotel and Convention Center,
and Wilderness Territory. Each of these facilities was identified as the facilities that could host an event with
500 or more people. The resorts act independent of each other and operate under an Opryland model where
once you arrive at the resort one is there for the majority of time. The map below shows the four primary
convention resorts in relation to each other.

6 East Monroe Street | Fifth Floor | Chicago, Illinois 60603 | Phone: 312.447.2010 | Fax: 312.444.1125
www.chjc.com | [email protected]
Section V Comparable Facilities Analysis | December 2012 Madison Hotel Feasibility Analysis – Madison, WI
PAGE 40
Figure 5-2
CHULA VISTA RESORT: The Chula Vista Resort has 620 sleeping units and its two largest functions spaces
are the conference center with 11,544 square feet of space and the Riverview Ballroom at 11,300 square feet.
There are additional smaller ballrooms and meeting rooms that total an additional 18,000 square feet and in
total the resort offers 40,933 square feet of net usable function space. The resort has added a 90,000 square
foot air dome to host larger events and sports competitions.
THE WILDERNESS RESORT: The Wilderness Resort has 1,180 sleeping units and a total of 30,160 square feet
of function space with the two largest spaces being the Sandstone room at 14,823 square feet and the
Wilderness room with 8,812 square feet of space. The remainder of function space is comprised of breakout
rooms.
KALAHARI RESORT: This property has 756 sleeping units and the primary function space is comprised of the
North and South Atrium Ballrooms, 17,200 square feet and 20,560 square feet respectively. These are two
separate rooms but are directly across a hall from each other and when used together they provide 650 square
feet of more meeting space than the Monona Terrace exhibit hall. In addition to the two ballrooms, there are
four boardrooms and an additional 15 meeting/breakout rooms. This project is rated as being most
competitive with Madison and Monona Terrace.

6 East Monroe Street | Fifth Floor | Chicago, Illinois 60603 | Phone: 312.447.2010 | Fax: 312.444.1125
www.chjc.com | [email protected]
Section V Comparable Facilities Analysis | December 2012 Madison Hotel Feasibility Analysis – Madison, WI
PAGE 41
HO-CHUNK CASINO: This casino resort has 292 rooms and two ballrooms, an upper ballroom consisting of
14,293 square feet and a lower ballroom consisting of 14,299 square feet. There are 5 additional meeting
rooms that total 3,401 square feet.
MADISON/WISCONSIN DELLS DYNAMICS: The Wisconsin Dells is a family vacation destination first.
Meeting demand is a way to fill facilities on the off-season. The resorts compete on price and an ability to
host events under one roof. The Wisconsin Dells are able to capitalize on a number of factors that allows
some events to choose The Dells over Madison. These variables include the ability to beat the average daily
rate performance of the hotels that serve Monona Terrace, three of the resorts profiled offer larger room
block potential at a single property, and the uniqueness of being able to combine a work conference with a
family vacation, which is of interest to some meeting planners. The other variable that impacts destination
selection is the size of facilities offered between the two destinations. The Kalahari Resort offers two adjacent
ballrooms that are the same size as the Monona Terrace exhibit hall and this does not differentiate Madison
enough in some instances. Finally, facility rental costs at the Dells properties can be reduced or provided at
no cost to secure booked hotel room nights because hotel room revenue is captured by the hotel itself.
Madison offers a higher quality downtown business environment that is challenging for The Dells to compete
with, but when the factors above are presented to a cost conscious meeting planner, the Dells could have a
price advantage to secure the business. This is especially true if shuttle bussing is required in Madison.
MILWAUKEE
Milwaukee is 79 miles from Madison and is the largest city in Wisconsin with a metropolitan statistical area
population of greater than 1.6 million people. Milwaukee offers a historic downtown environment located
around the Milwaukee River and is served by a mid-sized international airport, a significant number of high
quality hotel rooms within walking distance to the Frontier Airlines Center and vibrant brewing and nightlife
scene.
FRONTIER AIRLINES CENTER: This facility was modernized and re-opened in 1998 and offers a total of
265,000 square feet of meeting space that is comprised of 188,700 square feet of exhibit hall space, a 37,500
square foot ballroom and 39,600 square feet of meeting space. In 2003, the former Milwaukee Auditorium
located across the street from the Frontier Airlines Center was converted into a theater that provides between
2,500 and 4,000 seats and was renovated at a cost of $40 million.
MILWAUKEE HOTEL SUPPLY: There are 11 hotels within .6 of a mile of the Frontier Airlines Center with a
total room supply of 2,862 rooms with the average property having 260 rooms and being .2 miles from the
convention center. The Hyatt and Hilton City Centre are connected to the Frontier Airlines Center via sky
bridge with the Hyatt having 481 rooms and the Hilton having 730 rooms. The Hyatt has total meeting space
of 20,000 square feet with the largest meeting space being 9,900 square feet. This is less than 50 square feet
per room. The Hilton has a total of 33,000 square feet of meeting space with its largest space being 6,845
square feet. This too is a comparatively low ratio of meeting space per room. The next three largest hotel
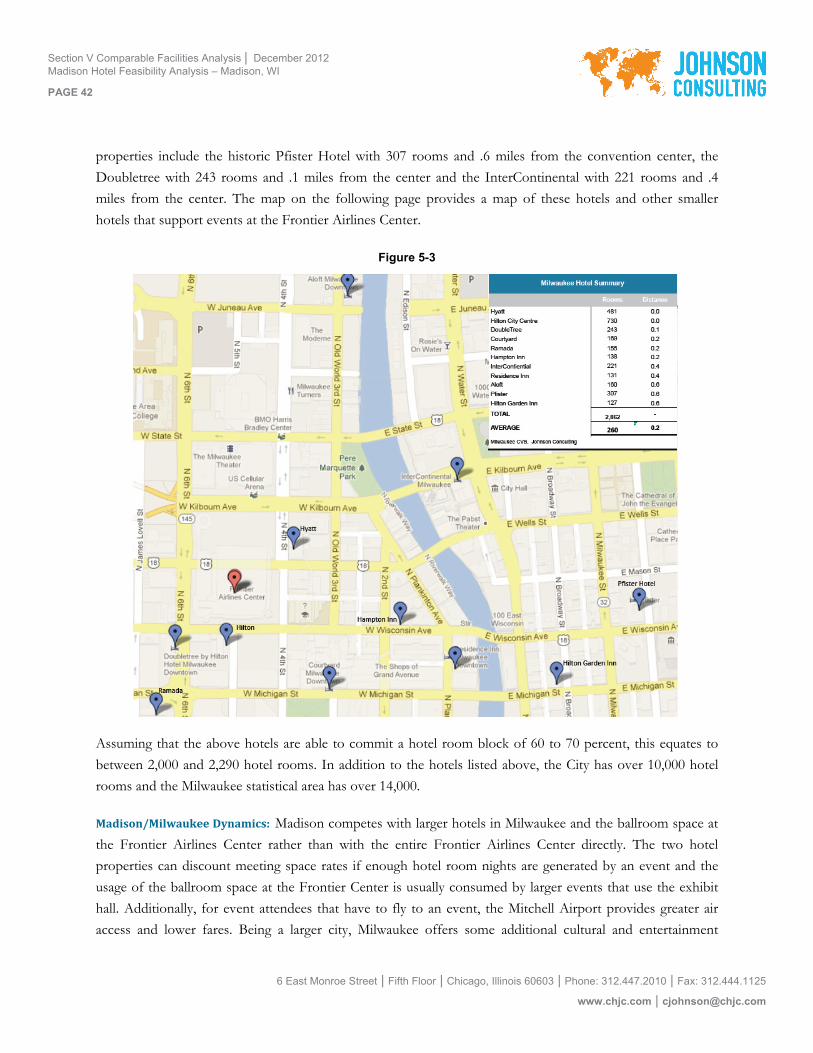
6 East Monroe Street | Fifth Floor | Chicago, Illinois 60603 | Phone: 312.447.2010 | Fax: 312.444.1125
www.chjc.com | [email protected]
Section V Comparable Facilities Analysis | December 2012 Madison Hotel Feasibility Analysis – Madison, WI
PAGE 42
properties include the historic Pfister Hotel with 307 rooms and .6 miles from the convention center, the
Doubletree with 243 rooms and .1 miles from the center and the InterContinental with 221 rooms and .4
miles from the center. The map on the following page provides a map of these hotels and other smaller
hotels that support events at the Frontier Airlines Center.
Figure 5-3
Assuming that the above hotels are able to commit a hotel room block of 60 to 70 percent, this equates to
between 2,000 and 2,290 hotel rooms. In addition to the hotels listed above, the City has over 10,000 hotel
rooms and the Milwaukee statistical area has over 14,000.
Madison/MilwaukeeDynamics:Madison competes with larger hotels in Milwaukee and the ballroom space at
the Frontier Airlines Center rather than with the entire Frontier Airlines Center directly. The two hotel
properties can discount meeting space rates if enough hotel room nights are generated by an event and the
usage of the ballroom space at the Frontier Center is usually consumed by larger events that use the exhibit
hall. Additionally, for event attendees that have to fly to an event, the Mitchell Airport provides greater air
access and lower fares. Being a larger city, Milwaukee offers some additional cultural and entertainment

6 East Monroe Street | Fifth Floor | Chicago, Illinois 60603 | Phone: 312.447.2010 | Fax: 312.444.1125
www.chjc.com | [email protected]
Section V Comparable Facilities Analysis | December 2012 Madison Hotel Feasibility Analysis – Madison, WI
PAGE 43
offerings that are currently underdeveloped in Madison. Of critical note, HVS just completed a study for a
new convention/conference center in Brookfield, a suburb of Milwaukee. This proposed hotel and
conference center is sized almost identical to the Hilton/Monona Terrace complex and will be a competitive
threat if built.
CHICAGO
Chicago is one of the top convention destinations in the world and home of the largest convention center in
North America, McCormick Place, and one of the world’s largest and busiest international airports, O’Hare.
Chicago evolved as a natural meeting destination due to the concentration of commerce and trading activities,
its role as a major crossroads of water, rail, air and interstate travel, association headquarters, and the cultural
and entertainment offerings of the downtown area. Located 147 miles from Madison, Chicago has a number
of convention facilities and large hotels that compete with Madison for events. The primary convention
facilities in Chicago include McCormick Place, the Donald E. Stephens Convention Center and the
Renaissance Schaumburg Convention Hotel and are displayed in the map below.
Figure 5-4
MCCORMICK PLACE: McCormick Place Convention Center (MPCC), originally built in 1960 and expanded
over the years, is the largest convention center under one roof in North America. Located along the shore of
Lake Michigan, McCormick Place features four distinct buildings: McCormick Place North, McCormick Place
South, McCormick Place West, and the Lakeside Building. The four buildings support a variety of
configurations for small corporate meetings, mid-sized conventions and mega tradeshows. The MPCC offers
meeting planners and attendees 2.6 million square feet of exhibit halls, of which offers 1.2 million square feet
of contiguous exhibit space, 173 meeting rooms in over 600,000 square feet of meeting space, 4 ballrooms, 2

6 East Monroe Street | Fifth Floor | Chicago, Illinois 60603 | Phone: 312.447.2010 | Fax: 312.444.1125
www.chjc.com | [email protected]
Section V Comparable Facilities Analysis | December 2012 Madison Hotel Feasibility Analysis – Madison, WI
PAGE 44
of which are the largest in the city, offering more than 204,000 square feet of space, assembly seating for
18,000 people, the 4,249 seat Arie Crown Theatre, 3 additional theaters seating 300 each, and parking for
5,000 vehicles. McCormick Place is inhibited by a lack of hotel rooms in direct proximity to the convention
center and is solely served by the 800-room Hyatt (being expanded to 1,200 rooms) that is directly connected
to the facility. The majority of the 33,000 downtown Chicago hotels are located 3 miles from McCormick
Place, requiring the use of busses and shuttle services that are costly for show organizers and inconvenient for
show attendees. There is also no direct public transportation linking McCormick Place to either O’Hare or
Midway Airports, as is the case in some other large convention destinations.
DONALD E. STEVENS CONVENTION CENTER: Located in Rosemont, IL and close to Chicago’s O’Hare
airport, the convention center has 787,000 square feet of interconnected exhibit hall space, three ballrooms
with 30,000, 22,000 and 17,300 square feet respectively a 7 meeting rooms with an additional 3,500 square
feet of meeting space. In Rosemont, there are a number of hotels that are in close proximity to the
convention center and include:
Holiday Inn & Suites
Holiday Inn Express
The Westin
Hilton
Embassy Suites
Sheraton
Double Tree
Residence inn
Crowne Plaza
InterContinental
Marriott
Hyatt
Hyatt Regency
Best Western
Aloft
These 15 properties offer a total of 6,000 rooms, most of which are in walking distance to the convention
center. The convention center and Rosemont primarily rely on the proximity to O’Hare and the hotel package
and entertainment offerings to attract events to the convention center.
RENAISSANCE SCHAUMBURG CONVENTION HOTEL: In Chicago’s Western suburbs, The Schaumburg
Convention Center (SCC) is located adjacent to Interstate 90 in the heart of the Woodfield regional center,
and is within a 20-minute drive from Chicago’s O’Hare International Airport, and 45 minutes from
downtown Chicago. The 45-acre site was purchased in 2000 for $13 million. The facility is owned by the City
of Schaumburg, operated by Marriott HOST management and is connected to a 474-room Renaissance hotel.
The SCC has a total of 97,200 square feet of exhibit space with a capacity ranging from 1,600 to 6,300. The
main exhibit hall has three main sections, Adventure hall has 32,670 square feet of space, Discovery hall has
32,400 square feet of space, and Exploration hall has 32,130 square feet of function space. There are three
ballrooms at the SCC, the largest being the Schaumburg Ballroom, which has a total of 27,502 square feet and
can be broken into ten individual rooms. The other two ballrooms, the Utopia and Nirvana Ballrooms, have
7,021 square feet and 5,310 square feet respectively. The Utopia Ballroom can be divided into four spaces, all
with 1,770 square feet. The Nirvana Ballroom can be separated into three spaces, all with 1,770 square feet of
meeting space. There are 12 meeting rooms. The smallest meeting room is 252 square feet, while the largest
meeting room is 1,770 square feet and has a capacity ranging from 100 to 190. The space ratio analysis
comparing SCC function space with the 474 rooms at the adjacent Renaissance hotel reveals that for each

6 East Monroe Street | Fifth Floor | Chicago, Illinois 60603 | Phone: 312.447.2010 | Fax: 312.444.1125
www.chjc.com | [email protected]
Section V Comparable Facilities Analysis | December 2012 Madison Hotel Feasibility Analysis – Madison, WI
PAGE 45
hotel room there is 205 square feet of exhibit space, 84 square feet of ballroom space, 17 square feet of
meeting space, and 102 square feet of combined ballroom and meeting space.
MADISON/CHICAGO DYNAMICS: There is great demand on the part of meeting planners to host events in the
Chicago region given the economic base, number of activities to do, hotel supply, ease of access, and large
supply of meeting space. Madison is most likely to compete with the Schaumburg facility and Chicago hotels
that have more than 20,000 square feet of contiguous ballroom space. Again both the Schaumburg facility
and Chicago hotels that meet the above criteria have the competitive advantages of being able to provide a
room block for larger events and are able to discount function space if room night generation is great enough.
MINNEAPOLIS/ST. PAUL, MN
The Minneapolis/St. Paul regional area has a population of 3,320,000 and is located 270 miles to the
northwest of Madison and has a similar season cycle. There are two facilities in Minneapolis, the St. Paul
River Centre and the Minneapolis Convention Center. Monona Terrace most directly competes with the
River Center given its similar size. The size of the Minneapolis Convention Center with more than 375,000
square feet of exhibit space and 27,500 square feet of ballroom space and its supply of 5,000 hotel rooms
connected via skyway attracts a different scale of events than what would be attracted to the River Center or
Monona Terrace.
RIVER CENTRE: The St. Paul River Centre has a ballroom of 27,111 square feet, 16 meeting rooms with an
additional 18,684 square feet of space and 43,000 square feet of lobby space that is used extensively as show
space for events. The River Centre is adjoined to the Xcel Energy Center, which has a 17,000 square foot
arena floor and a seating capacity of 18,000, and the Roy Wilkins Auditorium that has a 25,000 square foot
floor and a permanent balcony with fixed seats for 3,650. There are 1,377 hotel rooms within 1 mile of the
River Center as shown in the following map.

6 East Monroe Street | Fifth Floor | Chicago, Illinois 60603 | Phone: 312.447.2010 | Fax: 312.444.1125
www.chjc.com | [email protected]
Section V Comparable Facilities Analysis | December 2012 Madison Hotel Feasibility Analysis – Madison, WI
PAGE 46
Figure 5-5
Of this hotel set, the average hotel is 275 rooms and .5 miles from the River Centre. The largest 3 hotels are
the 470-room Crowne Plaza, the 254-room St. Paul hotel and the 251-room Doubletree. Assuming a 70 to 80
percent commitment from these properties for larger events would mean a total room block of 964 to 1102
hotel rooms.
MADISON/ST. PAUL DYNAMICS: St. Paul has a number of similarities to Madison ranging from facility size,
weather, being a state capital, nearby arenas and proximity to a larger metro area. In our judgement, Madison
offers a far more pleasant and competitive product and Monona Terrace is superior in terms of aesthetics and
quality.
DES MOINES, IA
Des Moines Iowa is approximately 292 miles from Madison, has a population of 581,500 and is home to the
Iowa Events Center. The Iowa Events Center is comprised of the Wells Fargo Arena, Hy-Vee Hall and
Community Choice Credit Union Convention Center (Convention Center) all of which are connected by sky
bridge. Hy-Vee Hall contains 3 exhibit halls that total 150,000 square feet of exhibit space and 8 meeting
rooms at 1,800 square feet each. The attached Convention Center has 27 meeting and boardrooms and a
ballroom with 28,800 square feet. The hotel supply within 1-mile of the Iowa Events Center is displayed in
the figure below.

6 East Monroe Street | Fifth Floor | Chicago, Illinois 60603 | Phone: 312.447.2010 | Fax: 312.444.1125
www.chjc.com | [email protected]
Section V Comparable Facilities Analysis | December 2012 Madison Hotel Feasibility Analysis – Madison, WI
PAGE 47
Figure 5-6
There are 1,486 total rooms within .8 miles of the Iowa Events Center with the average hotel size equating to
212 rooms and being .5 miles from the center. The largest property is the 411-room Marriott, followed by the
251-room Holiday Inn and the 234-room Embassy Suites. With a 70 to 80 percent room block commitment
from the above hotels, events at the Iowa Events Center would be able to have a room block ranging from
1,040 rooms to 1,189 rooms.
MADISON/DES MOINES DYNAMICS: Given the similarities in population, capital city status and corporate
presence between Madison and Des Moines, the size of convention facilities in Des Moines is significantly
larger than that of Monona Terrace. Similar to Madison, and given the size of the Iowa Events Center, the
City has been trying to attract a headquarters hotel to Des Moines for a number of years. We rate Madison as
being more attractive than Des Moines in many ways. Madison’s convention facility is substantially smaller
however.
GRAND RAPIDS, MI
Grand Rapids, the second largest city in Michigan, has a population of 775,000 people and is located 325
miles from Madison. The primary convention facility in Grand Rapids is DeVos Place and is located on the
banks of the Grand River. DeVos Place underwent a $219 million dollar expansion and upgrade in 2003 to
maintain and grow its place as one of the leading convention facilities in Michigan and the region. DeVos
Place has a main exhibit hall, which can be broken into three smaller sections, with a total combined area of
162,000 square feet. The exhibit hall has a capacity ranging from 10,730 people, in a banquet configuration, to
14,950 people in theater configuration. DeVos Place also has a large ballroom, 40,000 square feet, which can

6 East Monroe Street | Fifth Floor | Chicago, Illinois 60603 | Phone: 312.447.2010 | Fax: 312.444.1125
www.chjc.com | [email protected]
Section V Comparable Facilities Analysis | December 2012 Madison Hotel Feasibility Analysis – Madison, WI
PAGE 48
be divided into four sections, ranging in square footage from 6,106 square feet to 12,870 square feet. The full
ballroom has a capacity ranging from 2,560 people to 4,312 people. When meeting rooms are inventoried on
an individual basis, there are 25 rooms. The smallest meeting room has 884 square feet and has a capacity
ranging from 60 to 100 people. The largest meeting room has 8,544 square feet and has a capacity ranging
from 600 to 900 people. When a space ratio analysis is preformed on the interconnected 682 room Amway
grand Plaza Hotel there is 238 square feet of exhibit space per guest room, 59 square feet of ballroom space
per guest room, 47 square feet of meeting space per guest room, and 106 square feet of combined ballroom
and meeting space. In addition to the Amway Grand there are a number of other hotels in close proximity to
DeVos Place.
Figure 5-7
After the Amway Grand, the JW Marriott is the largest hotel with 340 rooms, followed by the Courtyard,
both of which are .3 miles from DeVos Place. A 70 to 80 percent room block from the four properties would
equal 988 rooms and 1,129 rooms respectively.
MADISON/GRAND RAPIDS DYNAMICS: Grand Rapids is fairly new on the scene and became so with the
renovation of the convention center and development of its hotel package. The hotels were sponsored by the
Amway owners, but have driven demand to this community.. Grand Rapids benefited greatly from private
contributions to support the development of public facilities. Additionally a city patron invested significantly
in the Amway Grand hotel that has allowed DeVos place to operate with a serious headquarters hotel. While
Monona Terrace is small when compared to the convention facility in Grand Rapids, the market is very
similar, and judged to be more attractive in many regards.
MID-MARKET, LOWER TIER CONVENTION DESTINATIONS
To benchmark the performance of Monona Terrace a range of facility types need to be looked at. Key points
in selecting the convention centers in this report reflect factors such as population, hotel supply, capital city

6 East Monroe Street | Fifth Floor | Chicago, Illinois 60603 | Phone: 312.447.2010 | Fax: 312.444.1125
www.chjc.com | [email protected]
Section V Comparable Facilities Analysis | December 2012 Madison Hotel Feasibility Analysis – Madison, WI
PAGE 49
and convention center performance. This analysis is intended to identify certain characteristics of the selected
facility that are similar to either Madison or Monona Terrace and not to identify facilities and markets that are
exactly the same because there are no destinations that offer the same unique attributes as Madison. Finally,
there are two categories of comparable analysis contained in this report. The first is classified as lower tier,
mid-market convention destinations, while the second category consists of upper tier mid-market convention
destinations. The lower tier destinations include:
Columbia, SC
Boise, ID
Tacoma, WA
Jackson, MS
Table 5-2
Key Characteristics of Lower Tier Mid-Size Markets
Location Madison, WI Columbia, SC Boise, ID Tacoma, WA Jackson, MS Average
Facility Monona TerraceColumbia
Metroploitan Convention Center
Boise CentreTacoma
Convention & Trade Center
Capital City Convention
Center-
Demographic Characteristics
Metropolitan Area Population (2011) 575,000 796,438 633,388 3,500,000 542,932 1,209,552
Rank 4 2 3 1 5 -
Median Household Income (2011) $56,000 $47,399 $49,768 $61,639 $42,978 $51,557
Rank 2 4 3 1 5 -
Hotel Supply Characteristics
# of rooms within 1 mile of Convention Center 1,035 1,080 1,320 481 489 881
Rank 3 2 1 5 4 -
Potential Room Block @ 40% Participation 414 432 528 192 196 352
Rank 3 2 1 5 4 -
Potential Room Block @ 70% Participation 725 756 924 337 342 617
Rank 3 2 1 5 4 -
Potential Room Block @ 80% Participation 828 864 1,056 385 391 705
Rank 3 2 1 5 4 -
Average Distance from CC 0.4 0.6 0.5 0.1 0.2 0.4
Rank 3 5 4 1 2 -
Exhibit Space (SM/ SF)
Exhibit Space 37,200 24,700 ‐ 50,000 60,000 42,975
Ballroom 13,524 17,135 24,426 13,376 25,000 18,692
Meeting Room(s) 12,106 15,190 7,914 14,255 28,001 15,493
Total Function Space (SF) 62,830 57,025 32,340 77,631 113,001 68,565
Rank 3 4 5 2 1 -
Source: Relevant Facilities/CVB, Demographics Now, Johnson Consulting
As the above table indicates, Madison ranks fourth in metropolitan area population and second in median
household income. Regarding hotel supply characteristics, Madison ranks third in number of hotel rooms
within 1 mile of the convention center, out ranked by Columbia and Boise. When looking at potential room
block available on a straight percentage basis from the hotel rooms within 1-mile, and not factoring in any

6 East Monroe Street | Fifth Floor | Chicago, Illinois 60603 | Phone: 312.447.2010 | Fax: 312.444.1125
www.chjc.com | [email protected]
Section V Comparable Facilities Analysis | December 2012 Madison Hotel Feasibility Analysis – Madison, WI
PAGE 50
other considerations, like rate or willingness to participate, Madison also ranks third in potential room block
size with 414 potential rooms available at 40 percent, 725 potential rooms at 70 percent participation, and 828
potential rooms at 80 percent participation. It is believed that on average most markets are able to commit a
room block in the range of 40 to 70 percent, with dedicated headquarters hotels able to commit up to 80
percent of total room supply. Madison ranks third in terms of proximity of hotel rooms to Monona Terrace
at .4 miles. More detailed facility and operating information for the lower tier facilities is provided in the
following pages.
COLUMBIA METROPOLITAN CONVENTION CENTER COLUMBIA, SOUTH CAROLINA
Since opening in 2004, the Columbia Metropolitan Convention Center (CMCC) has attempted to maintain
event and attendance demand through a difficult economic time. The facility has been hindered by an
undersized exhibit hall, which has caused the CMCC to attract a greater ratio of non-exhibit hall oriented
events, and a hotel supply that is largely consumed by other demand segments. Non-exhibit hall events
typically have a greater ratio of local attendees compared to exhibit hall events, which have a significantly
higher proportion of out-of-town/overnight visitors. The Columbia Metropolitan Convention Center is
supported jointly by the City of Columbia, Lexington County, and Richland County and is operated by the
Midlands Authority for Conventions, Sports, and Tourism (MACST). The MACST has a mission that
includes managing the Columbia Metropolitan Convention and Visitors Bureau, managing the Columbia
Regional Sports Council, and operating the Columbia Regional Visitors Center. MACST is responsible for
employing staff, marketing, daily operations, routine maintenance and repair at the CMCC facility.
The construction of the 142,500 gross square foot facility was completed in 2004, with a construction cost of
$38 million that is funded by a tourism development fee on area hotel rooms. The facility is located in
downtown Columbia, on a site fronting Lincoln Street between Senate Street and Pendleton Street. The
CMCC is separated from the University of South Carolina Colonial Life Arena by a 300-car parking lot.
The facility offers a total of 24,700 square feet of exhibit hall space, a 17,135 square foot ballroom, and
15,190 square feet of meeting space. The following table summarizes the size and capacity of the exhibit and
meeting space at the CMCC.

6 East Monroe Street | Fifth Floor | Chicago, Illinois 60603 | Phone: 312.447.2010 | Fax: 312.444.1125
www.chjc.com | [email protected]
Section V Comparable Facilities Analysis | December 2012 Madison Hotel Feasibility Analysis – Madison, WI
PAGE 51
Table 5-3 Columbia Metropolitan Convention Center
Summary of Exhibit and Meeting Space
Size (SF) Capacity (# of Persons)
Individual (Smallest)
Combined (Largest) Theater Classroom Banquet
Exhibit Halls
Exhibit Hall - 24,700 2,000 1,200 1,300
Subtotal Exhibit Hall SF 24,700
Ballrooms
Ballroom - 17,135 1,200 850 1,000
Ballroom A 6,290 - 400 340 328
Ballroom B 5,470 - 350 280 304
Ballroom C 5,375 - 350 280 304
Subtotal Ballroom SF 17,135
Meeting Rooms
Number of Rooms 11 6
Smallest Room 950 - 60 40 32
Largest Room - 5,540 500 300 304
Subtotal Meeting Room SF 15,190
Total 57,025
Source: Columbia Metropolitan Convention Center, Johnson Consulting
The exhibit hall and four of the six meeting rooms are located on the lower floor (Exhibit Level) of the two-
story facility, while the ballroom and two other meeting rooms are located on the upper floor with the
ballroom being divisible into three sections of similar size. CMCC plays a vital role in encouraging the growth
of tourism locally by having generated a total economic impact in excess of $150 million. The following table
summarizes historical event demand at the CMCC from 2006 through 2011.
Table 5-4 Columbia Metropolitan Convention Center
Demand Schedule 2008 - 2011
# Events Attendance # Events Attendance # Events Attendance # Events Attendance # Events Attendance # Events Attendance
Conventions/Conferences 23 10,448 45 25,483 52 26,510 45 34,935 40 20,500 36 18,270
Trade Shows 7 4,050 9 4,950 7 4,630 6 4,480 8 4,230 10 7,850
Concerts/Performances 0 0 0 0 0 0 0 0 0 0 2 1,400
Consumer Shows 6 14,230 10 12,800 6 13,000 11 18,850 13 14,200 14 25,900
Banquets 104 31,881 110 42,340 128 38,705 100 41,464 74 38,939 66 28,663
Meetings 185 19,615 207 24,607 188 35,008 159 31,014 189 30,497 190 41,732
Other 17 11,485 5 9,670 3 7,700 6 11,300 49 15,043 54 23,292
TOTAL 342 91,709 386 119,850 384 125,553 327 142,043 373 123,409 372 147,107
Source: Columbia Metropolitan Convention Center, Johnson Consulting
2008 2009 2010 201120072006
Since opening in 2004, there has been a significant ramp up in both exhibit hall and non-exhibit hall events.
In 2006 there were a total of 342 events and attendance of 91,710. Both event demand and attendance
increased significantly in 2007 and 2008 as the CMCC had exited its ramp up period after opening. In 2009,
the total number of events was down but overall attendance was up and in 2010 the CMCC saw in inverse
phenomenon due to a significant decline in convention attendees. 2011 was the best year of attendance
generation for the CMCC since opening, while the total number of events remained flat from the prior year.

6 East Monroe Street | Fifth Floor | Chicago, Illinois 60603 | Phone: 312.447.2010 | Fax: 312.444.1125
www.chjc.com | [email protected]
Section V Comparable Facilities Analysis | December 2012 Madison Hotel Feasibility Analysis – Madison, WI
PAGE 52
It is important to note that a significant number of the banquet events utilize the exhibit hall for larger events.
This has negative implications for the following reasons:
Banquet and meeting events are primarily local in attendee origin and do not have as significant of an
economic and fiscal impact profile when compared to conventions and tradeshows,
These events consume local demand that has traditionally occurred in local hotels or banquet halls,
thereby cannibalizing rather than growing the overall market.
However, as Columbia seeks to remedy its situation and is able to attract more and better events, the banquet
demand is anticipated to compress back out into area hotels and banquet facilities.
Table 5-5 provides a summary of historical revenue and expenses from 2006 to 2011.
Table 5-5 Columbia Metropolitan Convention Center
Revenue & Expense Profile
2006 2007 2008 2009 2010 2011
Revenues
Misc Revenue $4,086 $2,606 $13,813 $11,611 $27,440 $20,930
Grand Opening/Event Sponsorship 0 0 187 0 0 0
Rental Revenues 320,706 516,342 566,290 446,218 531,733 554,896
Food Service Revenues 582,886 935,952 652,740 465,194 582,743 811,950
Equipment Rental 130,646 158,239 139,140 126,027 156,594 191,047
Parking Revenues 1,550 2,700 1,114 861 1,166 1,821
Office Space Rental 26,000 0 0 0 0 0
Utilities 67,551 83,581 120,337 95,909 121,024 192,662
Labor Revenues 36,831 31,809 28,643 19,163 24,515 29,227
Co Promotion Revenues 0 0 0 0 0 0
Audio Visual Revenue 38,361 62,107 66,346 48,260 63,624 76,028
Reserve Fund Ovations 0 0 79,681 74,570 75,283 94,242
Non-Budgeted Revenues 118,481 78,554 153,695 109,529 322,020 423,613
Total $1,327,098 $1,871,890 $1,821,985 $1,397,343 $1,906,142 $2,396,416
Expenses
Salaries - Admin $267,207 $368,036 $303,766 $396,239 $407,059 $484,557
Salaries - Sales & Marketing 169,455 146,760 249,866 301,117 290,700 289,967
Salaries - Operations 318,580 351,867 396,240 399,357 410,458 496,083
Salaries - Engineering 88,013 82,769 106,626 110,026 113,888 124,888
Contract Labor - Security & Main 267,825 313,572 320,396 339,386 369,458 332,645
Tax Liabilities 69,039 78,222 85,836 91,788 99,624 105,232
Benefits 35,882 43,305 47,581 49,402 54,239 57,639
Medical Insurance 70,124 87,434 96,334 113,748 132,319 145,573
Unemployment Insurance 5,918 5,189 4,894 4,421 4,830 3,672
Incentives/Commissions 45,583 80,502 97,736 98,950 132,999 160,185
Travel & Entertainment 23,898 22,759 17,579 8,268 17,280 17,607
Telephone 24,805 24,581 26,625 26,659 28,892 22,794
Marketing & Advertising 119,195 149,778 56,130 28,907 35,007 114,976
General Insurance 119,811 90,491 95,710 108,732 100,830 99,544
Professional Fees 51,930 15,385 15,716 39,763 36,694 36,813
Office Supplies 14,088 11,487 11,320 17,404 17,224 16,663
Event Expenses 22,797 6,272 9,980 9,396 19,321 23,976
Utilities 296,113 349,601 398,028 367,495 424,881 434,320
Maintenance Supplies 47,683 87,078 89,870 91,668 57,051 75,017
Contract Building Services 127,781 138,999 154,986 127,762 136,378 155,300
Warehouse Rental 37,058 35,707 38,530 33,819 36,276 34,230
Miisc Expenses 123,517 141,275 164,184 187,558 140,687 151,573
Non-Budgeted Expenses 130,531 86,176 159,580 134,304 111,685 77,402
Total $2,476,834 $2,717,244 $2,947,513 $3,086,171 $3,177,780 3,460,656
Net Operating Income ($1,149,736) ($845,354) ($1,125,529) ($1,688,827) ($1,271,638) ($1,064,240)
Source: Columbia Metropolitan Convention Center, Johnson Consulting

6 East Monroe Street | Fifth Floor | Chicago, Illinois 60603 | Phone: 312.447.2010 | Fax: 312.444.1125
www.chjc.com | [email protected]
Section V Comparable Facilities Analysis | December 2012 Madison Hotel Feasibility Analysis – Madison, WI
PAGE 53
From 2006 to 2011, CMCC revenues have increased by $1.07 million from $1.33 million in 2006 to $2.40
million in 2011. The top revenue categories are food service revenues, space rental revenues, and equipment
rental. During this same period, expenses have also increased by $983,800 from $2.48 million in 2006 to $3.46
million in 2011. Net operating income has improved by $85,500 from 2006 to 2011 and by $625,000 from a
peak operating deficit in 2009 of $1.69 million.
The broader Columbia region has over 12,000 hotel rooms, of which only 1,080 rooms are within 1 mile of
the CMCC as shown in the following table and map.
Table 5-6
Rooms Distance
Hilton Columbia Center 222 0.1
SpringHill Suites Downtown 132 0.4
Courtyard at USC 189 0.7
Columbia Marriott 285 0.8
Sheraton Downtown 135 0.8
Inn at USC 117 0.8
Clarion Hotel Downtown 161 1.1
Embassy Suites - Greystone 260 3.2
Holiday Inn & Suites - Airport 122 4
Clarion Inn Airport 142 4
Courtyard Columbia NW 149 5.9
Holiday Inn Fort Jackson 100 6.3
Radisson Hotel Columbia & Conference Center 273 6.4
Holiday Inn & Suites - North 181 9.7
Hilton Garden Inn - Harbison 143 10.8
TOTAL 2,611 -
AVERAGE 174 3.7
Only properties with 100 or more rooms are included
Columbia CVB, Johnson Consulting
Columbia, SC Hotel Summary
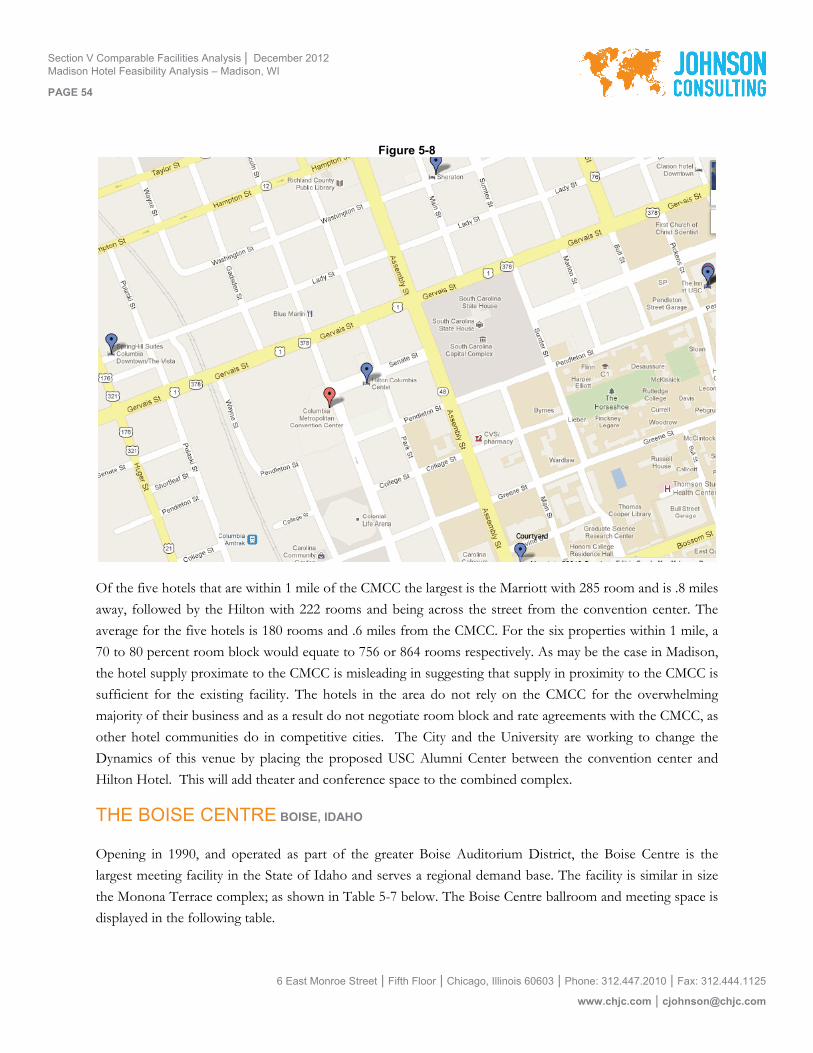
6 East Monroe Street | Fifth Floor | Chicago, Illinois 60603 | Phone: 312.447.2010 | Fax: 312.444.1125
www.chjc.com | [email protected]
Section V Comparable Facilities Analysis | December 2012 Madison Hotel Feasibility Analysis – Madison, WI
PAGE 54
Figure 5-8
Of the five hotels that are within 1 mile of the CMCC the largest is the Marriott with 285 room and is .8 miles
away, followed by the Hilton with 222 rooms and being across the street from the convention center. The
average for the five hotels is 180 rooms and .6 miles from the CMCC. For the six properties within 1 mile, a
70 to 80 percent room block would equate to 756 or 864 rooms respectively. As may be the case in Madison,
the hotel supply proximate to the CMCC is misleading in suggesting that supply in proximity to the CMCC is
sufficient for the existing facility. The hotels in the area do not rely on the CMCC for the overwhelming
majority of their business and as a result do not negotiate room block and rate agreements with the CMCC, as
other hotel communities do in competitive cities. The City and the University are working to change the
Dynamics of this venue by placing the proposed USC Alumni Center between the convention center and
Hilton Hotel. This will add theater and conference space to the combined complex.
THE BOISE CENTREBOISE, IDAHO
Opening in 1990, and operated as part of the greater Boise Auditorium District, the Boise Centre is the
largest meeting facility in the State of Idaho and serves a regional demand base. The facility is similar in size
the Monona Terrace complex; as shown in Table 5-7 below. The Boise Centre ballroom and meeting space is
displayed in the following table.

6 East Monroe Street | Fifth Floor | Chicago, Illinois 60603 | Phone: 312.447.2010 | Fax: 312.444.1125
www.chjc.com | [email protected]
Section V Comparable Facilities Analysis | December 2012 Madison Hotel Feasibility Analysis – Madison, WI
PAGE 55
Table 5-7 Boise Centre - Boise, Idaho
Summary of Exhibit and Meeting Space
Size (SF) Capacity (# of Persons)
Individual (Smallest)
Combined (Largest)
Theater Classroom BanquetExhibits (# of
Booths)
Boise Centre
Eyries Hall - 24,426 2,900 1,800 1,800 141
Eagle 9,322 - 1,160 740 670 51
Hawk 7,080 - 780 550 480 40
Falcon* 8,024 - 960 550 570 40
Subtotal Ballroom SF 24,426
Meeting Rooms
Number of Rooms 5 2
Smallest Room 1,116 - 65 45 64 -
Largest Room - 4,560 1,000 500 700 84
Subtotal Meeting Room SF 7,914
Auditorium
Summit - 7,645
Total Boise Centre 39,985
*Can be further subdivided into three smaller rooms
Source: Boise Centre - Boise, Idaho, Johnson Consulting
349 Fixed Seats
The Boise Centre currently does not have an exhibit hall. The Eyries Hall Ballroom has 24,426 square feet of
space that is divisible into three smaller sections, of which Falcon hall can be further subdivided. There are 5
individual meeting rooms with the smallest room being 1,116 square feet and when meeting rooms are
combined the largest meeting room space is 4,560 square feet. When all meeting rooms are counted there is
7,900 square feet of meeting room space. In addition to ballroom and meeting space, there is a 349-seat
auditorium.
Largely due to national economic conditions and the limited space offerings of the facility, the Boise Centre
has suffered a significant decline in event demand from 2008 to 2011 as the following table indicates.
Table 5-8 Boise Centre
Demand Schedule 2008 - 2011
# Events Attendance # Events Attendance # Events Attendance # Events Attendance
Social/Banquets 146 - 80 - 106 - 96 -
Consumer/Public Shows 20 - 9 - 10 - 2 -
Tradeshows - - 24 - 24 - 22 -
Conventions 30 - 28 - 25 - 29 -
Meetings 125 - 80 - 69 - 91 -
TOTAL 321 186,900 221 179,800 234 169,000 240 152,400
Source: Boise Centre, Johnson Consulting
2009 2010 20112008
Social and banquet events have declined significantly from 146 events in 2008 to 96 events in 2011, with a
low in 2008 of 80 events. Hit even harder have been consumer and public show events that have declined
from 20 events in 2008 to 2 events in 2011. Convention events have remained relatively stable over the 4-year
period with a peak of 30 events in 2008 and a rebound to 29 events by 2011. Meetings have declined from a
peak of 125 events to 91 events in 2011 with a low of 69 events in 2010. Given the sharp declines in events

6 East Monroe Street | Fifth Floor | Chicago, Illinois 60603 | Phone: 312.447.2010 | Fax: 312.444.1125
www.chjc.com | [email protected]
Section V Comparable Facilities Analysis | December 2012 Madison Hotel Feasibility Analysis – Madison, WI
PAGE 56
demand, attendance did not decline as much as would be anticipated from a peak high in 2008 of 186,900
attendees in 2008 to a low of 152,400 attendees in 2011. From 2008 to 2011 there has been an overall decline
of 81 events and 34,500 attendees.
Given the significant decline in events and attendance, revenues from 2010 to 2011 are up as the table below
indicates.
Table 5-9 Boise Centre
Revenue & Expense Statement (2010-2011) ($'000s)
2010 2011
Revenues
Convention Activities $2,877 $3,260
District Tax Collections 3,471 3,695
Interest Income 42 11
Other 64 132
Total Revenue $6,454 7,098
Expenses
Convention Activities $3,931 $4,577
General Government Changes 1,242 243
Unrealized Loss on Investments - 41
Total Expenses $5,173 4,861
Net Income (Loss) $1,281 2,237
Source: Boise Centre, Johnson Consulting
Convention related revenues were up in 2011 to $3.26 million from $2.88 million in convention revenues in
2010, an increase of $383,000. Facility operations are also supported by Boise Auditorium District collections
that were also up in 2011 by $224,000 over 2010. Convention related expenses increased in 2011 to $4.58
million from $3.93 million in 2010, an increase of $646,000, with total expenses in 2011 being $4.86 million,
down from $5.17 million in 2010. Expenses in 2010 were greater than 2011 due to a $1.24 million General
Government expenses, which decreased to $243,000 in 2011. Net Income in 2011 was $2.24 million, up by
$956,000 from 2010.
Currently the Boise Centre is supported by nine properties within 1-mile of the Centre as the table below
reflects.

6 East Monroe Street | Fifth Floor | Chicago, Illinois 60603 | Phone: 312.447.2010 | Fax: 312.444.1125
www.chjc.com | [email protected]
Section V Comparable Facilities Analysis | December 2012 Madison Hotel Feasibility Analysis – Madison, WI
PAGE 57
Table 5-10
Rooms Distance
The Grove Hotel 250 0.1
Hotel 43 112 0.2
Safari Inn Downtown 103 0.2
Hampton Inn & Suites 186 0.3
Owyhee Plaza Hotel 100 0.3
Red Lion Hotel (Boise Downtowner) 182 0.8
Courtyard by Marriott 162 0.8
Townplace Suites (Boise Downtown) 121 0.9
Residence Inn (Boise Central) 104 1.0
Shilo Inn (Boise Riverside) 112 1.5
Riverside Hotel 303 1.7
Springhill Suites (Boise Park Center) 230 2.7
Holiday Inn Express 158 2.7
Extended Stay America 107 2.7
Boise Hotel & Conference Center 264 3.1
Super 8 Motel 108 3.1
Holiday Inn 119 3.2
Shilo Inn & Suites (Boise Airport) 125 3.9
Residence Inn (Boise West) 104 3.9
AmeriTel Inn Boise Town Square 124 4.2
Hyatt Place 147 5.0
Oxford Suites 132 5.9
Homewood Suites 110 5.9
Hilton Garden Inn (Boise Spectrum) 137 6.2
Hampton Inn (Boise Spectrum) 133 6.3
Springhill Suites 119 7.8
Candlewood Suites (Meridian) 123 9.0
Hilton Garden Inn/Eagle 108 10.2
TOTAL 4,083 -
AVERAGE 146 3.3
# of Properties
Only properties with 100 or more rooms are included
Boise CVB, Johnson Consulting
Boise Hotel Summary
The Boise market area has 4,083 rooms, with the average property having 146 rooms and being 3.3 miles
from the Boise Centre. Of the 9 hotels that are within 1 mile of the Boise Centre, the Grove Hotel is the
largest at 250 rooms and also the closest at .1 miles. The next largest hotel within 1-mile is the Hampton Inn
with 186-rooms and .3 miles, this is followed by the 182-room Red Lion Boise Downtowner Hotel. In total,
the nine properties have a combined 1,320 rooms and the properties within .5 miles of the Centre provide a
total of 751 rooms. The Boise CVB indicated that less than 700 of the rooms within a half mile are of a
quality that would accommodate an event attendee If a rate of 70 percent or 80 percent were used to calculate
available room block for the Boise Center, this would indicate an available room block of 490 to 560 rooms
respectively. The following map indicates the location of the hotels within 1-mile of the Boise Centre.

6 East Monroe Street | Fifth Floor | Chicago, Illinois 60603 | Phone: 312.447.2010 | Fax: 312.444.1125
www.chjc.com | [email protected]
Section V Comparable Facilities Analysis | December 2012 Madison Hotel Feasibility Analysis – Madison, WI
PAGE 58
Figure 5-9
A recent feasibility study has indicated that there is demand to increase the facility size by adding an exhibit
hall of 50,000 square feet. The findings also determined that a new hotel would be needed to support the
expanded facility.
THE TACOMA CONVENTION & TRADE CENTERTACOMA, WASHINGTON
The Tacoma Convention & Trade Center (TCTC) is located 10 miles south of the Sea-Tac Airport and is
comprised of 77,600 square feet of net usable meeting space.

6 East Monroe Street | Fifth Floor | Chicago, Illinois 60603 | Phone: 312.447.2010 | Fax: 312.444.1125
www.chjc.com | [email protected]
Section V Comparable Facilities Analysis | December 2012 Madison Hotel Feasibility Analysis – Madison, WI
PAGE 59
Table 5-11 Greater Tacoma Convention & Trade Center
Summary of Exhibit and Meeting Space
Size (SF) Capacity (# of Persons)
Individual (Smallest)
Combined (Largest)
Theater Classroom Banquet
Exhibit Halls
Exhibit Hall - 50,000 4,250 2,900 2,520
Hall A 22,200 - 1,900 1,230 980
Hall B 27,500 - 2,200 1,560 1,260
Subtotal Exhibit Hall SF 50,000
Ballrooms
Ballrroom - 13,376 1,200 675 720
Ballroom A/B 6,600 - 650 335 360
Ballroom C 2,200 - 200 95 70
Ballroom D 4,575 - 400 230 230
Subtotal Ballroom SF 13,376
Meeting Rooms
Number of Rooms 12 10
Smallest Room 418 - 30 20 20
Largest Room - 5,100 450 240 240
Subtotal Meeting Room SF 14,255
Total 77,631
Source: Greater Tacoma Convention & Trade Center, Johnson Consulting
The exhibit hall is 50,000 square feet and is divisible into two smaller sections that are 22,200 square feet and
27,500 square feet. The full exhibit hall can accommodate up to 4,250 people in a theater setting and 2,520
people in a banquet setting. The ballroom offers 13,376 square feet of event space that can be split into three
smaller sections and accommodate between 675 and 1,200 people, depending on configuration. In total there
is 14,255 square feet of meeting room space distributed among 12 individual rooms or 10 combined rooms.
The largest meeting room is 5,100 square feet.
Table 5-12 Greater Tacoma Convention & Trade Center
Demand Schedule 2011
# Events Attendance Hotel Room Nights
Exhibit Hall Events
Tradeshows/Conventions 11 17,231 2,516
Corporate Events 4 15,076 2,270
Consumer Shows/Public Events 16 44,853 3,528
Other Events 14 23,480 6,561
Non - Exhibit Hall Events 145 46,025 -
TOTAL 190 146,665 14,875
Source: Greater Tacoma Convention & Trade Center, Johnson Consulting
In 2011, there were a total of 190 events at the TCTC, of which 45 were exhibit hall events. Of the exhibit
hall events, consumer/public shows had the greatest number of events, 16, and the largest attendance at
23,480. However, consumer and public shows draw predominantly from a regional area and do not generate a
significant number of room nights in relation to attendance. In total the TCTC generated 14,875 rooms
nights in 2011, a low number for the size of the TCTC and population density of Tacoma.
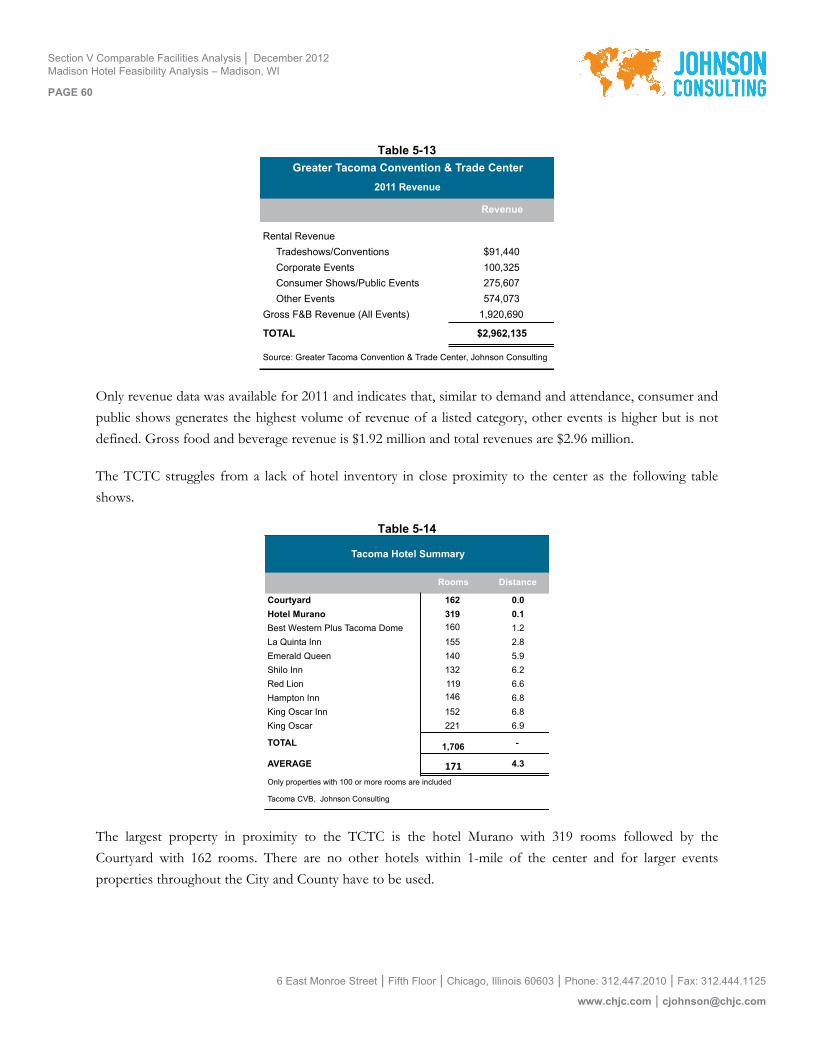
6 East Monroe Street | Fifth Floor | Chicago, Illinois 60603 | Phone: 312.447.2010 | Fax: 312.444.1125
www.chjc.com | [email protected]
Section V Comparable Facilities Analysis | December 2012 Madison Hotel Feasibility Analysis – Madison, WI
PAGE 60
Table 5-13
Greater Tacoma Convention & Trade Center
2011 Revenue
Revenue
Rental Revenue
Tradeshows/Conventions $91,440
Corporate Events 100,325
Consumer Shows/Public Events 275,607
Other Events 574,073
Gross F&B Revenue (All Events) 1,920,690
TOTAL $2,962,135
Source: Greater Tacoma Convention & Trade Center, Johnson Consulting
Only revenue data was available for 2011 and indicates that, similar to demand and attendance, consumer and
public shows generates the highest volume of revenue of a listed category, other events is higher but is not
defined. Gross food and beverage revenue is $1.92 million and total revenues are $2.96 million.
The TCTC struggles from a lack of hotel inventory in close proximity to the center as the following table
shows.
Table 5-14
Rooms Distance
Courtyard 162 0.0
Hotel Murano 319 0.1
Best Western Plus Tacoma Dome 160 1.2
La Quinta Inn 155 2.8
Emerald Queen 140 5.9
Shilo Inn 132 6.2
Red Lion 119 6.6
Hampton Inn 146 6.8
King Oscar Inn 152 6.8
King Oscar 221 6.9
TOTAL 1,706 -
AVERAGE 171 4.3
Only properties with 100 or more rooms are included
Tacoma CVB, Johnson Consulting
Tacoma Hotel Summary
The largest property in proximity to the TCTC is the hotel Murano with 319 rooms followed by the
Courtyard with 162 rooms. There are no other hotels within 1-mile of the center and for larger events
properties throughout the City and County have to be used.
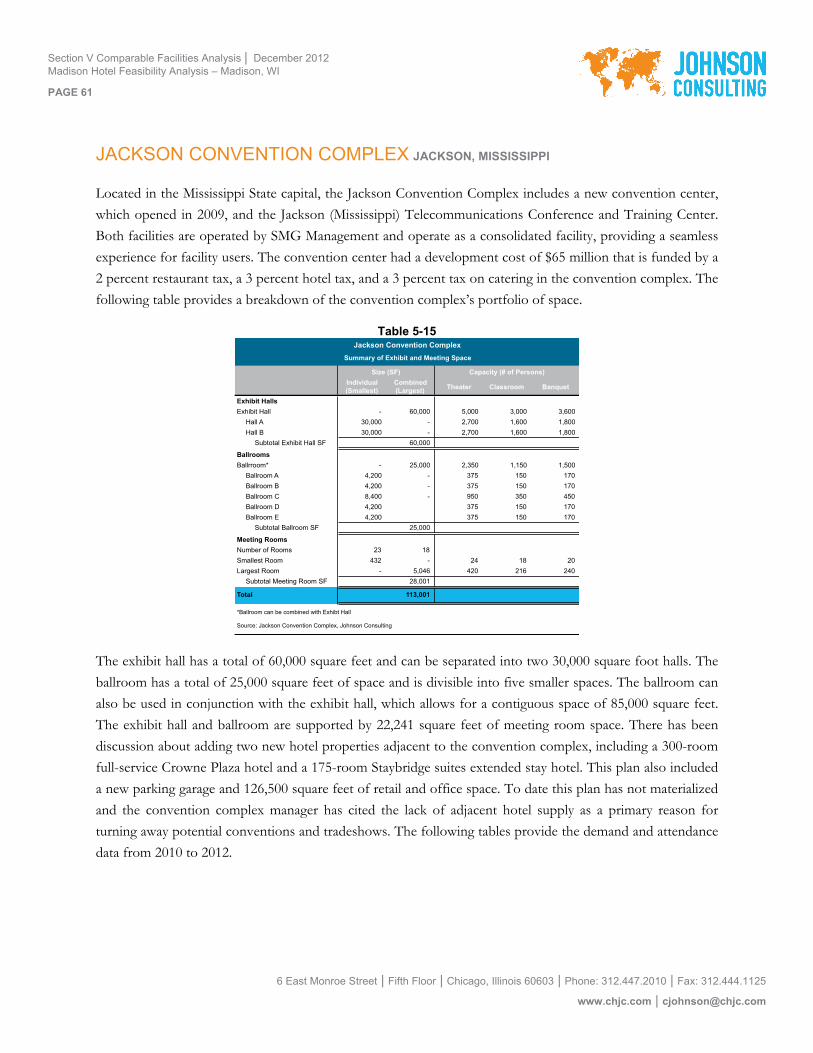
6 East Monroe Street | Fifth Floor | Chicago, Illinois 60603 | Phone: 312.447.2010 | Fax: 312.444.1125
www.chjc.com | [email protected]
Section V Comparable Facilities Analysis | December 2012 Madison Hotel Feasibility Analysis – Madison, WI
PAGE 61
JACKSON CONVENTION COMPLEX JACKSON, MISSISSIPPI
Located in the Mississippi State capital, the Jackson Convention Complex includes a new convention center,
which opened in 2009, and the Jackson (Mississippi) Telecommunications Conference and Training Center.
Both facilities are operated by SMG Management and operate as a consolidated facility, providing a seamless
experience for facility users. The convention center had a development cost of $65 million that is funded by a
2 percent restaurant tax, a 3 percent hotel tax, and a 3 percent tax on catering in the convention complex. The
following table provides a breakdown of the convention complex’s portfolio of space.
Table 5-15 Jackson Convention Complex
Summary of Exhibit and Meeting Space
Size (SF) Capacity (# of Persons)
Individual (Smallest)
Combined (Largest) Theater Classroom Banquet
Exhibit Halls
Exhibit Hall - 60,000 5,000 3,000 3,600
Hall A 30,000 - 2,700 1,600 1,800
Hall B 30,000 - 2,700 1,600 1,800
Subtotal Exhibit Hall SF 60,000
Ballrooms
Ballrroom* - 25,000 2,350 1,150 1,500
Ballroom A 4,200 - 375 150 170
Ballroom B 4,200 - 375 150 170
Ballroom C 8,400 - 950 350 450
Ballroom D 4,200 375 150 170
Ballroom E 4,200 375 150 170
Subtotal Ballroom SF 25,000
Meeting Rooms
Number of Rooms 23 18
Smallest Room 432 - 24 18 20
Largest Room - 5,046 420 216 240
Subtotal Meeting Room SF 28,001
Total 113,001
*Ballroom can be combined with Exhibt Hall
Source: Jackson Convention Complex, Johnson Consulting
The exhibit hall has a total of 60,000 square feet and can be separated into two 30,000 square foot halls. The
ballroom has a total of 25,000 square feet of space and is divisible into five smaller spaces. The ballroom can
also be used in conjunction with the exhibit hall, which allows for a contiguous space of 85,000 square feet.
The exhibit hall and ballroom are supported by 22,241 square feet of meeting room space. There has been
discussion about adding two new hotel properties adjacent to the convention complex, including a 300-room
full-service Crowne Plaza hotel and a 175-room Staybridge suites extended stay hotel. This plan also included
a new parking garage and 126,500 square feet of retail and office space. To date this plan has not materialized
and the convention complex manager has cited the lack of adjacent hotel supply as a primary reason for
turning away potential conventions and tradeshows. The following tables provide the demand and attendance
data from 2010 to 2012.

6 East Monroe Street | Fifth Floor | Chicago, Illinois 60603 | Phone: 312.447.2010 | Fax: 312.444.1125
www.chjc.com | [email protected]
Section V Comparable Facilities Analysis | December 2012 Madison Hotel Feasibility Analysis – Madison, WI
PAGE 62
Table 5-16 Jackson Convention Complex
Demand Schedule 2008 - 2011
Event Days Attendance Event Days Attendance Event Days Attendance
Banquets 36 13,355 38 13,825 34 15,751
Consumer Shows 19 9,078 21 10,600 16 11,530
Conventions 25 26,499 36 30,795 66 33,205
Meetings 195 43,692 140 30,008 129 23,047
Entertainment 16 19,457 9 12,830 8 12,425
Sporting 13 10,848 21 24,210 25 26,135
Other 29 23,706 38 12,405 17 13,734
TOTAL 333 146,635 303 134,673 295 135,827
*Partial Year
Source: Jackson Convention Complex, Johnson Consulting
2010 2011 2012*
Since 2010, event days and attendance have decreased from a high of 333 events days and 146,635 attendees
to 303 event days and 134,673 attendees in the last full year of operations in 2011. In 2011, convention
meetings and sporting events represented the three biggest categories of attendance demand.
Table 5-17 JACKSON CONVENTION COMPLEX
Revenue & Expense Statement (2009-2010) ($'000s)
2009 2010 2011 2012
Revenues
RENTAL INCOME $624,591 $792,100 $730,632 $724,892
FOOD & BEVERAGE 466,691 1,043,272 987,008 1,328,470
AUDIO VISUAL 23,862 36,512 74,388 137,132
MISCELLANEOUS ANCILLARY 27,639 22,919 31,232 31,195
SECURITY 24,184 33,923 32,249 36,294
OTHER OPERATING INCOME 108,125 193,296 156,889 109,458
Total Revenues $1,275,092 $2,122,022 $2,012,398 $2,367,441
Expenses
EMPLOYEE WAGES & BENEFITS $1,400,826 $1,599,244 $1,755,812 $1,815,754
CONTRACTED SERVICES 49,402 66,591 55,798 44,202
OPERATIONS EXPENSES 107,822 71,492 86,115 114,153
REPAIRS & MAINTENANCE 111,477 278,180 314,210 323,415
SUPPLIES 65,672 75,293 39,530 65,211
INSURANCE 16,599 40,292 46,144 44,788
GENERAL/ADMINISTRATIVE EXPENSES 568,273 364,166 308,756 360,002
UTILITIES 502,212 632,352 573,501 533,303
SMG MANAGEMENT FEES 143,271 218,404 196,047 228,419
OTHER EXPENSES 9,342 - 30,000 12,377
Total Expenses & Other Financing Uses $2,974,896 $3,346,014 $3,405,913 $3,541,624
Net Operating Income ($1,699,804) ($1,223,992) ($1,393,515) ($1,174,183)
Source: JACKSON CONVENTION COMPLEX, Johnson Consulting
Jackson is severely hindered by the lack of hotel supply in proximity to the convention complex. Once new
hotel supply is added to the market, Jackson will shift into the mid-market, upper tier convention destination
category.

6 East Monroe Street | Fifth Floor | Chicago, Illinois 60603 | Phone: 312.447.2010 | Fax: 312.444.1125
www.chjc.com | [email protected]
Section V Comparable Facilities Analysis | December 2012 Madison Hotel Feasibility Analysis – Madison, WI
PAGE 63
MID-MARKET, UPPER TIER CONVENTION DESTINATIONS
The following facilities have been classified as upper tier convention destinations due to the quality and
volume of hotel rooms that support their respective convention facilities. The upper tier destinations include:
Overland Park, KS
Providence, RI
Des Moines, IA
Grand Rapids, MI
Table 5-18
Key Characteristics of Upper Tier Mid-Sized Markets
Location Madison, WI Overland Park, KS
Providence, RI Des Moines, IA Grand Rapids, MI Average
Facility Monona TerraceOverland Park
Convention Center
Rhode IslandConvention
CenterIowa Events Center DeVos Place -
Demographic Characteristics
Metropolitan Area Population (2011) 575,000 2,047,000 1,600,000 581,500 776,108 1,115,922
Rank 5 1 2 4 3 -
Median Household Income (2011) $56,000 $54,244 $53,000 $55,283 $48,964 $53,498
Rank 1 3 4 2 5 -
Hotel Supply Characteristics
# of rooms within 1 mile of Convention Center 1,035 2,187 2,071 1,694 1,411 1,680
Rank 5 1 2 3 4 -
Potential Room Block @ 40% Participation 414 875 828 678 564 672
Rank 5 1 2 3 4 -
Potential Room Block @ 70% Participation 725 1,531 1,450 1,186 988 1,176
Rank 5 1 2 3 4 -
Potential Room Block @ 80% Participation 828 1,750 1,657 1,355 1,129 1,344
Rank 5 1 2 3 4 -
Average Distance from CC 0.4 0.6 0.3 0.5 0.3 0.4
Rank 3 5 1 4 1 -
Exhibit Space (SM/ SF)
Exhibit Space 37,200 58,494 100,000 146,926 162,000 65,231
Ballroom 13,524 24,991 20,000 28,800 37,809 19,505
Meeting Room(s) 12,106 15,015 16,540 30,825 32,163 14,554
Total Function Space (SF) 62,830 98,500 136,540 206,551 231,972 147,279
Rank 5 4 3 2 1 -
Source: Relevant Facilities/CVB, Demographics Now, Johnson Consulting
Madison has the smallest metropolitan area population, closely following Des Moines, but is ranked first in
median household income, a key metric in determining the relative strength of a market. Madison ranks last
by a significant margin of the number of hotel rooms within 1 mile of the convention center, along with
corresponding potential room block participation. Madison ranks third in the average distance of hotel rooms
from the convention center, but again this is offset by the age and quality of hotel rooms in comparison to

6 East Monroe Street | Fifth Floor | Chicago, Illinois 60603 | Phone: 312.447.2010 | Fax: 312.444.1125
www.chjc.com | [email protected]
Section V Comparable Facilities Analysis | December 2012 Madison Hotel Feasibility Analysis – Madison, WI
PAGE 64
the upper tier destinations. From an ongoing operations perspective, the age of the properties that currently
support Monona Terrace is a concern because as a hotel ages the capital cost of maintaining the property
increases and major renovations can be cost prohibitive for hotel owners to perform, potentially further
degrading the quality/volume of hotel rooms attractive to convention attendees. Madison also ranks last in
total square footage of the convention facility, with Overland Park ranking fourth in facility size while being
first in the number of hotel rooms within 1 mile. The following pages provide additional operating and
destination information for the above markets (text for the Iowa Events Center and DeVos Place is located
in the regional facility analysis at the beginning of this section on pages 46 and 47, respectively)
OVERLAND PARK CONVENTION CENTEROVERLAND PARK, KANSAS
Situated in the largest suburb of Kansas City, Overland Park Convention Center (OPCC) opened in 2002.
The OPCC, which sits on a 26-acre site in the heart of Overland Park, is owned by the City of Overland Park,
and is managed by Global Spectrum. The site also contains a 412-room Sheraton headquarters hotel.
Table 5-19 Overland Park Convention Center
Summary of Exhibit and Meeting Space
Size (SF) Capacity (# of Persons)
Individual (Smallest)
Combined (Largest) Theater Classroom Banquet
Exhibit Halls
Exhibit Hall - 58,494 5,233 3,264 4,760
Hall A 29,464 - 2,592 1,632 2,180
Hall B 29,030 - 2,641 1,632 2,140
Subtotal Exhibit Hall SF 58,494
Ballrooms
Ballrroom - 24,991 2,184 1,208 1,780
Ballroom A 8,482 - 720 416 540
Ballroom B 7,830 - 728 352 500
Ballroom C 8,679 - 736 440 540
Subtotal Ballroom SF 24,991
Meeting Rooms
Number of Rooms 8 3
Smallest Room 900 - 50 24 30
Largest Room - 7,354 624 352 320
Subtotal Meeting Room SF 15,015
Total 98,500
Source: Overland Park Convention Center, Johnson Consulting
*can combine with exhibit hall for total exhibit space of $90,000 square feet.
As shown, the OPCC comprises a total of 97,600 square feet of exhibit and meeting space, including a 59,494
square foot Exhibit Hall, and a 24,991 square foot Ballroom. Excluding the Ballroom, the largest meeting
room comprises 7,354 square feet, with a maximum capacity of 624 people. The smallest meeting room
comprises 1,810 square feet, with a maximum capacity of 156 people. In addition to the meeting space at
OPCC, the Sheraton Overland Park at the OPCC offers 21,841 square feet of meeting space, including
18,079 square feet of ballroom space and 3,762 square feet of meeting rooms. Excluding the three (3)

6 East Monroe Street | Fifth Floor | Chicago, Illinois 60603 | Phone: 312.447.2010 | Fax: 312.444.1125
www.chjc.com | [email protected]
Section V Comparable Facilities Analysis | December 2012 Madison Hotel Feasibility Analysis – Madison, WI
PAGE 65
ballrooms, the largest meeting room at the Sheraton Hotel comprises 1,390 square feet, with a maximum
capacity of 154 people. The smallest meeting room comprises 290 square feet, with a maximum capacity of
36 people.
The following table summarizes the OPCC’s 2011 demand schedule, by event type.
Table 5-20 Overland Park Convention Center
2011 Demand Schedule
# Events Event Mix
Convention 10 3%
Consumer Show 20 6%
Trade Show 31 9%
Special Events 55 16%
Banquet 78 23%
Meetings 147 43%
TOTAL 341 100%
Source: Overland Park Convention Center, Johnson Consulting
In 2011, there were a total of 341 events, of which meetings and banquets accounted for two-thirds of total
event demand. Revenues relating to the 2011 event demand is presented in the following table.
Table 5-21
Overland Park Convention Center
2011 Total Event Revenue
Revenue Event Mix
Convention $994,076 13%
Consumer Show 1,223,478 16%
Trade Show 1,299,945 17%
Special Events 458,804 6%
Banquet 1,682,282 22%
Meetings 1,988,152 26%
Total Event Revenue $7,646,738 100%
Total Event Expense $2,971,582 -
Net Event Income $4,675,156 -
Indirect Expenses $4,556,499 -
Total Other Revenue $185,275 -
Net Income $303,932 -
Source: Overland Park Convention Center, Johnson Consulting

6 East Monroe Street | Fifth Floor | Chicago, Illinois 60603 | Phone: 312.447.2010 | Fax: 312.444.1125
www.chjc.com | [email protected]
Section V Comparable Facilities Analysis | December 2012 Madison Hotel Feasibility Analysis – Madison, WI
PAGE 66
Total 2011 event revenue totalled $7.65 million of which meetings accounted for 26 percent of the total,
followed closely by banquet events at 22 percent of the total and tradeshow events with 17 percent of event
revenue. When total event expenses of $2.97 million are factored in, the OPCC generated total event net
income of $4.68 million. Other indirect expenses totalled $4.56 million and other total revenue was $185,275
resulting in positive net operating income of $304,000.
There are just under 5,000 hotel rooms in Overland park over 28 properties. The largest hotel size for the
market is 412 rooms and is an average of 1.8 miles from the OPCC. A summary of hotels is displayed in the
table and map below.
Table 5-22
Rooms Distance
Sheraton Convention Center 412 0.0
Hilton Garden Inn 125 0.1
Courtyard Convention Center 168 0.2
Chase Suite Hotels 112 0.3
Holiday Inn & Suites Convention Cente 119 0.5
Homestead Studio Suites 127 0.5
Drury Inn & Suites 169 0.8
Hyatt Place Convention Center 134 0.8
Hyatt Place Overland Park 124 0.8
Pear Tree Inn 149 0.8
Courtyard 149 0.9
Marriott 399 0.9
Hampton Inn 133 1.1
Clarion Hotel 180 1.2
Embassy Suites 199 1.2
Comfort Inn & Suites 149 1.3
La Quinta Inn 143 1.3
Extended Stay Deluxe 133 1.4
America's Best Value Inn 100 1.8
Residence Inn 120 1.9
Spring Hill Shuites 102 1.9
Fairfield Inn & Suites 110 2.4
DoubleTree 356 2.6
Hawthorn Suites 315 3.4
Candlewood Suites 120 4.2
Extended Stay America 119 4.2
Holiday Inn Overland Park West 191 6.0
Ramada Inn 151 7.4
TOTAL 4,808 -
AVERAGE 172 1.8
Only properties with 100 or more rooms are included
Overland Park CVB, Johnson Consulting
Overland Park Hotel Summary

6 East Monroe Street | Fifth Floor | Chicago, Illinois 60603 | Phone: 312.447.2010 | Fax: 312.444.1125
www.chjc.com | [email protected]
Section V Comparable Facilities Analysis | December 2012 Madison Hotel Feasibility Analysis – Madison, WI
PAGE 67
Figure 5-10
Within 1-mile of the OPCC there are 2,187 rooms with an average property size of 182 rooms and located .6
miles from the OPCC. The largest hotel is the Sheraton Headquarters Hotel with 412-rooms and attached to
the OPCC. Within .5 of a mile there are 1063 rooms, of which most provide shuttle service to OPCC. The
package overall is outstanding, and the Sheraton has performed above market averages.
RHODE ISLAND CONVENTION CENTER PROVIDENCE, RHODE ISLAND
Providence has a metro area population of 1.6 million and serves as the economic, cultural, and political hub
of the State of Rhode Island. The metro area is bisected by Interstate 95 and 195, and conveniently located
183 miles from New York City and 45 miles from Boston. Easily accessibly by air and train, Providence also
has a strong drive market, situated within 500 miles of 25 percent of the US population and six New England
states.
The primary convention facility is Rhode Island Convention Center (RICC), located in the heart of
downtown Providence. The facility is owned by the Rhode Island Convention Center Authority (RICCA)
and is managed by SMG. Opened in 1993, RICC features a 100,000 square foot exhibition hall, a 20,000
square foot ballroom, 16,540 square feet of meeting rooms.

6 East Monroe Street | Fifth Floor | Chicago, Illinois 60603 | Phone: 312.447.2010 | Fax: 312.444.1125
www.chjc.com | [email protected]
Section V Comparable Facilities Analysis | December 2012 Madison Hotel Feasibility Analysis – Madison, WI
PAGE 68
Table 5-23 Rhode Island Convention Center
Summary of Exhibit and Meeting Space
Size (SF) Capacity (# of Persons)
Individual (Smallest)
Combined (Largest)
Theater Classroom Banquet
Exhibit Halls
Exhibit Hall - 100,000 9,500 5,642 5,500
Hall A 27,608 - 2,880 1,790 2,000
Hall B 28,560 - 2,728 1,638 1,620
Hall C 28,560 - 2,728 1,638 1,620
Hall D 15,272 - 1,164 576 600
Subtotal Exhibit Hall SF 100,000
Ballrooms
Ballrroom - 20,000 2,300 1,400 1,400
Ballroom A 10,000 - 1,175 756 680
Ballroom B 3,700 - 414 234 210
Ballroom C 1,350 - 120 54 80
Ballroom D 3,700 414 234 210
Ballroom E 1,350 120 54 80
Subtotal Ballroom SF 20,000
Meeting Rooms
Number of Rooms 18 10
Smallest Room 304 - 24 18 20
Largest Room - 4,004 420 216 240
Subtotal Meeting Room SF 16,540
Total 136,540
Source: Rhode Island Convention Center, Johnson Consulting
As the following table shows, event demand has decreased from a peak high in 2009 of 322 events down to
283 events in 2012 (year to date). Attendance is also down from 318,000 in 2009 to 300,000 in 2012, which is
up from 287,000 in 2011. Given the declines in event demand and attendance, revenues are actually up by
over $1 million when comparing 2009 to 2012. In general, the annual net operating deficit ranges from $1
million to $2 million.
Table 5-24 Rhode Island Convention Center
Demand Schedule 2009 - 2012
# Events Attendance Revenue # Events Attendance Revenue # Events Attendance Revenue # Events Attendance Revenue
Public Shows 52 215,150 $1,901,534 44 204,200 $2,093,271 56 177,118 $2,151,494 58 197,835 $2,384,692
Tradeshows 13 17,450 1,121,487 16 20,950 2,085,169 14 25,517 1,099,516 8 19,519 868,672
Convenitons 21 25,535 2,178,731 19 25,525 1,487,653 25 16,280 2,219,070 17 18,851 2,345,678
Meetings 172 40,657 1,687,010 155 41,608 2,135,897 138 45,909 1,932,178 124 37,856 2,148,718
Banquets 64 19,270 1,039,293 73 21,520 985,551 71 22,182 1,188,989 76 25,898 1,233,699
TOTAL 322 318,062 $7,928,055 307 313,803 $8,787,541 304 287,006 $8,591,248 283 299,959 $8,981,459
Source: Rhode Island Convention Center, Johnson Consulting
2009 2010 2011 2012 (year to date)
In December 2005, RICCA purchased the Dunkin’ Donuts Center (formerly the Providence Civic Center)
from the City of Providence for $28.5 million. Currently home to the American Hockey League’s Providence
Bruins and Providence College Men’s Basketball, the 14,500-seat arena welcomes one million visitors annually
to its sporting events, family shows, and concerts. In January 2006, RICCA officially embarked on a $80
million renovation of the “Dunk.” This was completed in 2008 and improvements include creating suites and

6 East Monroe Street | Fifth Floor | Chicago, Illinois 60603 | Phone: 312.447.2010 | Fax: 312.444.1125
www.chjc.com | [email protected]
Section V Comparable Facilities Analysis | December 2012 Madison Hotel Feasibility Analysis – Madison, WI
PAGE 69
club boxes, installing new seats throughout the arena, upgrading the mechanical, electrical and plumbing
systems, and an enclosed pedestrian bridge connecting the Dunkin Donuts Center to the adjacent RICC. The
table below profiles the hotels within the Providence regional area.
Table 5-25
Rooms Distance
Westin Providence 564 0.0
Courtyard 216 0.1
Hilton Providence 274 0.2
Providence Biltmore 292 0.3
Hampton Inn 110 0.4
Providence Renaissance Downtown 264 0.5
Providence Marriott 351 0.9
Wyndham Garden 136 1.8
Sheraton Warwick 206 8.2
Warwick Hampton Inn 173 8.7
Holiday Inn Express Warwick 147 9.1
Hilton Garden Inn Warwick 160 9.4
Radisson Warwick 111 9.4
Crowne Plaza Warwick 266 9.9
SpringHill Suites Warwick 107 14.7
TOTAL 3,377 -
AVERAGE 225 4.9
Only properties with 100 or more rooms are included
Providence/Warwick CVB, Johnson Consulting
Providence, RI Hotel Summary
Figure 5-11

6 East Monroe Street | Fifth Floor | Chicago, Illinois 60603 | Phone: 312.447.2010 | Fax: 312.444.1125
www.chjc.com | [email protected]
Section V Comparable Facilities Analysis | December 2012 Madison Hotel Feasibility Analysis – Madison, WI
PAGE 70
As the table and map indicate, there are 3,377 rooms in the metropolitan area there is a strong supply of hotel
rooms within 1-mile of the Rhode Island Convention Center with 2,071 rooms dispersed among 7 properties.
Applying a 70 percent and 80 percent room block participation rate for the 2,071 rooms results in a potential
room block of 1,450 rooms and 1,657 rooms respectively.
IMPACT OF CONVENTION HOTEL DEVELOPMENT
To prove the positive impact a new convention hotel can have on the performance of a convention facility
and hotel supply, Johnson Consulting provides additional information regarding the developments in Ft.
Worth, TX and Baltimore, MD.
FT. WORTH, TX
The 614-room Omni hotel opened in 2009 and caused a significant upward trend in the demand profile and
market penetration of the Ft. Worth Convention Center as the following table indicates.
Table 5-26
Fort Worth, TexasHeadquarters Hotel Impact
2007-08 2008-09* 2009-10 2010-11 2011-12
LeadsEvents 907 970 944 1,101 1,257Room Attendance 767,584 775,417 543,280 496,096 604,375Show Attendance 479,430 815,099 1,157,894 1,136,012 1,445,009Room Nights 1,091,333 1,264,406 1,209,110 1,187,397 1,316,219
DefiniteEvents 342 331 293 309 371Room Attendance 281,968 147,761 101,234 104,323 128,622Show Attendance 93,045 689,337 335,575 419,117 543,937Room Nights 241,382 261,153 273,689 215,521 249,853
LostEvents 574 416 683 760 886Room Attendance 550,217 375,719 486,193 455,947 478,267Show Attendance 300,445 38,400 678,025 793,434 843,757Room Nights 806,475 645,677 923,297 984,437 1,124,666
*Omni Fort Worth Hotel (614 rooms) opened January 2009.Source: Fort Worth CVB
Using the 2007-2008 operating year as a benchmark for performance of the convention center without the
headquarters hotel, the number of event leads, show attendance and room nights have increased significantly
by 2011-2012, indicating that a new level of interest in the convention center was attained in large part from
the development of the hotel. This was reinforced in discussions with both the CVB and facility management.
According to Smith Travel Research (STR), in 2010 the hotel competitive set for the Omni Hotel posted
occupancy of 65 percent, up from 55.5 percent in 2009, an increase of 17.1 percent. The year 2011 saw
occupancy increase to 69.4 percent with stabilization of 68.9 percent in 2012. Average Daily Rate (ADR)

6 East Monroe Street | Fifth Floor | Chicago, Illinois 60603 | Phone: 312.447.2010 | Fax: 312.444.1125
www.chjc.com | [email protected]
Section V Comparable Facilities Analysis | December 2012 Madison Hotel Feasibility Analysis – Madison, WI
PAGE 71
decreased slightly in 2010 from 2009 to $143.40 from $145.16. 2012 ADR increased to $145.55. Revenue Per
Available Room (RevPAR) has also increased significantly since the opening of the Omni Hotel. RevPARin
2010 increased by 15.7 percent to $93.25, with a further increase in 2011 by 9.2 percent to $101.82 and a
slight decline in 2012 to $100.24. Total hotel room supply increased by 1.4 percent from 603,126 rooms in
2009 to 611,806 rooms in 2010, with another 4.1 percent increase in 2011 to 637,146 rooms. STR did not
report any new room additions in 2012. Revenue has also increased from $48.6 million in 2009 to $64.9
million in 2012.
BALTIMORE, MD
The 757-room Baltimore Hilton opened in 2008 and meeting planners indicated that the opening of the
Hilton Baltimore adjacent to the Baltimore Convention Center was one of the primary reasons for choosing
to host their event in Baltimore. Visit Baltimore estimates that the Hilton Baltimore has created $250 million
in large City-wide convention/ meetings business that could not have met in Baltimore without this
additional inventory. This hotel has also positively impacted Baltimore’s ability to host City-wide/ in-house
meetings, according to Visit Baltimore.
The following graph illustrates the trends in Inner Harbor hotel supply, demand, and resulting occupancy.
Despite opening of the Hilton Baltimore in 2008, the Inner Harbor sub-market has been able to absorb the
additional supply relatively quickly.
Figure 5-12
Source: Smith Travel Research
Inner HarborHotel Market Trends
0%
10%
20%
30%
40%
50%
60%
70%
80%
0.0
0.5
1.0
1.5
2.0
2.5
2005 2006 2007 2008 2009 2010
Occupancy
Ro
om
Nig
ht
Su
pp
ly/
De
ma
nd
(Million)�
Room Supply Room Demand Occupancy

6 East Monroe Street | Fifth Floor | Chicago, Illinois 60603 | Phone: 312.447.2010 | Fax: 312.444.1125
www.chjc.com | [email protected]
Section V Comparable Facilities Analysis | December 2012 Madison Hotel Feasibility Analysis – Madison, WI
PAGE 72
The following graph illustrates the number of events and total attendance at the Baltimore Convention
Center for the last six fiscal years.
Figure 13
Baltimore Convention CenterHistorical Events and Attendance
Source: Baltimore Convention Center
FY 2006 FY 2007 FY 2008 FY 2009 FY 2010 FY 2011 Average
Attendance 544,682 544,682 514,144 435,992 368,834 488,469 482,801
# of Events 201 166 172 139 131 162 162
0
100,000
200,000
300,000
400,000
500,000
600,000
0
50
100
150
200
250
Atte
nda
nce
Eve
nts
Attendance # of Events
CONCLUSION
Because of its attractiveness, Madison is a great destination and Monona Terrace complements the city.
Madison and Monona Terrace are in a market rich with demand potential; university, state, regional and
national event potential exists. However, there is only one hotel in immediate proximity to Monona Terrace
and the physical nature of the Monona Terrace does not permit expansion. Meanwhile, Madison competes
with destinations that offer greater hotel room availability in their downtown and within closer proximity to
their convention center. Madison and Monona Terrace’s competitive venues continue to invest in additional
hotel rooms and meeting facilities. Without further investment, the meeting and convention market share that
the City of Madison can capture will decline.
In Madison, the new Hampton Inn in downtown, along with enhancement of the Edgewater Hotel will
improve the attractiveness of Madison as a destination. However, while the City will have more total rooms, it
will only become more competitive when more hotel rooms within close proximity to the convention center
are added. The Illinois, Michigan, Wisconsin, Minnesota markets are competitive and Madison is a competitor
in this market. This market’s competitiveness only increases as proposed facilities such as those in Brookfield
and Appleton get built.
Madison and Monona Terrace are attractive, have growth opportunities and have corporations and
associations that need venues for their activities. The facility itself is small, so the hotel has to be part of the
expansion of the package offered by the City. Given the relatively fixed nature of the Monona Terrace facility,

6 East Monroe Street | Fifth Floor | Chicago, Illinois 60603 | Phone: 312.447.2010 | Fax: 312.444.1125
www.chjc.com | [email protected]
Section V Comparable Facilities Analysis | December 2012 Madison Hotel Feasibility Analysis – Madison, WI
PAGE 73
additional meeting spaces at the hotel, operated in concert with Monona Terrace, should be considered an
important component of a City investment plan. If something is not done to enhance capacity, the market
will stay the same, or will be attacked by other markets and decline. The proposed new hotel at the Judge
Doyle Square site is considered to be essential to maximize Monona Terrace, and for the growth of economic
impact to Madison.
In every situation analyzed by Johnson Consulting, new hotels have increased demand for the convention
center and have been absorbed by the market with not negative effect. In fact, after the hotels were built, the
hotel was absorbed and competitive set occupancy and rates improved to levels higher than prior to the time
the hotel was built.

6 East Monroe Street | Fifth Floor | Chicago, Illinois 60603 | Phone: 312.447.2010 | Fax: 312.444.1125
www.chjc.com | [email protected]
SECTION VI
MADISON HOTEL MARKET ANALYSIS & REVIEW OF MONONA TERRACE
6 East Monroe Street | Fifth Floor | Chicago, Illinois 60603 | Phone: 312.447.2010 | Fax: 312.444.1125
www.chjc.com | [email protected]
Section VI Hotel Market Analysis & Review of Monona Terrace | December 2012 Madison Hotel Feasibility Study – Madison, WI
PAGE 74
HOTEL MARKET ANALYSIS AND REVIEW OF MONONA TERRACE
This chapter presents an overview of the Madison hotel market, its position compared to its peer cities, and
two measured competitive sets within the Madison market. This data frames the basis of sizing and analyzing
the proposed Headquarters Hotel and analyzes supply and demand growth and the changing quality level of
hotel supply. The chapter also provides a review of Monona Terrace, its demand, potential and lost business.
This data informs opportunities to improve hotel inventory to support the facility and the City’s economic
development strategy.
MADISON HOTEL MARKET
According to Smith Travel Research, as of December 2012 there are 85 lodging properties in Greater
Madison, which includes Madison, Monona, Fitchburg, Middleton, Verona, Waunakee, Windsor, Sun Prairie,
DeForest, Stoughton, and Mount Horeb. They offer a total of 8,924 rooms. The properties are of medium-
to small-sized – the largest are the 356-room Madison Concourse Hotel, the 292-room Marriott Madison
West (in Middleton), and the 240-room Hilton Madison Monona Terrace. The average size is 105 rooms.
Table 6-1 on the following page lists these 85 hotels and motels. Figure 6-1 shows the hotel inventory in
closest proximity to Monona Terrace.

Section VI Hotel Market Analysis & Review of Monona Terrace | December 2012 Madison Hotel Feasibility Study – Madison, WI
PAGE 75
Table 6-1
Madison, WisconsinList of Properties as of December 2012
Location# of
RoomsLocation
# of Rooms
1 Madison Concourse Hotel Madison 356 44 Super 8 Madison South Madison 882 Hilton Madison Monona Terrace Madison 240 45 Country Inn & Suites Madison Madison 873 Sheraton Hotel Madison Madison 239 46 Candlewood Suites Fitchburg Madison 794 Crowne Plaza Madison Madison 226 47 Campus Inn Madison 745 Best Western Plus Inn On The Park Madison 214 48 Extended Stay Deluxe Madison West Madison 726 Howard Johnson Express Madison Madison 197 49 Days Inn Madison Southeast Madison 687 Hampton Inn & Suites Madison Downtown Madison 194 50 Residence Inn Madison East Madison 668 Best Western Plus InnTowner & The Highland Club Madison 176 51 The Wisconsin Union Hotel Madison Madison 609 Doubletree Madison Downtown Madison 163 52 GrandStay Residential Suites Madison Madison 53
10 Holiday Inn & Suites Madison West Madison 157 53 Expo Inn Madison 4811 Radisson Hotel Madison Madison 153 54 HotelRED Madison 4812 Hyatt Place Madison Downtown Madison 151 55 University Inn Madison 4513 Comfort Inn & Suites Airport Madison Madison 148 56 Budget Host Aloha Inn Madison 3914 Clarion Suites @ The Alliant Energy Center Madison Madison 140 57 King`s Inn Motel Madison 3815 Holiday Inn Madison @ The American Center Madison 138 58 Capitol Motel Madison 3116 Hampton Inn Suites Madison West Madison 132 59 Americas Best Value Inn Madison Mayflower Madison 2517 Fairfield Inn & Suites Madison East Madison 130 60 The Spence Motel Madison 2018 Super 8 Madison East Madison 130 61 Hotel Ruby Marie Madison 1519 Baymont Madison Madison 129 62 AmericInn Madison Monona Monona 6120 Courtyard Madison East Madison 127 63 Quality Inn & Suites Madison Fitchburg Fitchburg 10721 Best Western Plus East Towne Suites Madison 122 64 Country Inn & Suites Madison Southwest Fitchburg 6922 Homewood Suites Madison West Madison 122 65 Marriott Madison West Middleton 29223 Cambria Suites Madison Madison 121 66 Courtyard Madison West Middleton Middleton 13624 AmericInn Madison West Madison 120 67 Hilton Garden Inn Madison West Middleton Middleton 13325 La Quinta Inns & Suites Madison American Center Madison 120 68 Residence Inn Madison West Middleton Middleton 12226 Hampton Inn Madison East Towne Mall Area Madison 115 69 Fairfield Inn & Suites Madison West Middleton Middleton 10327 Red Roof Inn Madison Madison 108 70 Staybridge Suites Middleton Madison West Middleton 9128 The Edgewater Hotel Madison 107 71 Country Inn & Suites Madison West Middleton 8429 Extended Stay America Madison West Madison 104 72 Holiday Inn Express & Suites Madison Verona Verona 10930 Magnuson Grand Hotel Madison 102 73 Super 8 Madison South Verona Area Verona 4331 Best Western West Towne Suites Madison 101 74 Baymont Inn & Suites Waunakee Waunakee 3832 The Fluno Center Madison 100 75 Americas Best Value Inn Windsor Madison North Windsor 5533 Econo Lodge Madison Madison 99 76 Days Inn Windsor Northeast Windsor 5434 Microtel Inn & Suites by Wyndham Madison Madison 96 77 Water Tower Inn Sun Prairie 6435 Roadstar Inn Madison Madison 96 78 Quality Inn Sun Prairie Sun Prairie 6236 Comfort Suites Madison Madison 95 79 Super 8 Sun Prairie Madison East Area Sun Prairie 5837 Rodeway Inn & Suites Madison Madison 94 80 McGovern`s Motel & Suites Sun Prairie 5638 Baymont Madison Madison 92 81 Comfort Inn & Suites De Forest De Forest 7939 Holiday Inn Express Madison Madison 92 82 Holiday Inn Express Deforest Madison Area De Forest 7040 Motel 6 Madison North Madison 91 83 Days Inn Stoughton Stoughton 5241 Staybridge Suites Madison East Madison 90 84 Quality Inn & Suites Stoughton Stoughton 5042 Sleep Inn & Suites Madison Madison 89 85 Karakahl Country Inn Mount Horeb 7643 Americas Best Value Inn Madison Madison 88 8,924
Source: Smith Travel Research

Section VI Hotel Market Analysis & Review of Monona Terrace | December 2012 Madison Hotel Feasibility Study – Madison, WI
PAGE 76
Figure 6-1

6 East Monroe Street | Fifth Floor | Chicago, Illinois 60603 | Phone: 312.447.2010 | Fax: 312.444.1125
www.chjc.com | [email protected]
Section VI Hotel Market Analysis & Review of Monona Terrace | December 2012 Madison Hotel Feasibility Study – Madison, WI
PAGE 77
Figure 6-1 shows the hotels typically used by room blocks for Monona Terrace events. The bolded hotels in
Table 6-1 are prime and the gray ones are the second set of hotels used. Only one hotel is in immediate
proximity of Monona Terrace, the Hilton Hotel. This is the only hotel that has a room block agreement with
the City of Madison. The Hilton agrees to commit a minimum room block of 150 rooms on peak night(s),
based on availability at the time of booking. The bolded hotels will provide a maximum block of 60 percent,
or 272 rooms. The bold plus gray rooms may provide a block of 40 percent or 588 rooms, but only 150
rooms of this block are adjacent to Monona Terrace.
Table 6-2 shows City-wide lodging statistics in Madison from 2006 through 2011. Room night supply grew by
2.6 percent annually, while room night demand grew by 2.2 percent annually. As a result, occupancy
experienced a slight decrease from 2006 through 2011, although it recovered strongly from its low point in
2009. Average Daily Rate (ADR), Revenue per Available Room (RevPAR), and room revenue experienced an
average annual growth of 1.2 percent, 0.8 percent, and 3.4 percent, respectively.
Table 6-2
Madison, WisconsinCity-Wide Historical Lodging Statistics
RN Supply RN Demand Occupancy ADR RevPAR Room Revenue
000 % Growth 000 % Growth % % Growth $ % Growth $ % Growth $Million % Growth
2006 2,786 - 1,740 - 62.4% - $84.01 - $52.45 - $146 - 2007 2,868 2.9% 1,725 (0.9%) 60.1% (3.7%) $88.44 5.3% $53.19 1.4% $153 4.4%2008 2,972 3.6% 1,773 2.8% 59.6% (0.8%) $91.89 3.9% $54.81 3.0% $163 6.8%2009 3,096 4.2% 1,607 (9.3%) 51.9% (12.9%) $86.22 (6.2%) $44.76 (18.3%) $139 (14.9%)2010 3,174 2.5% 1,790 11.3% 56.4% 8.6% $85.79 (0.5%) $48.38 8.1% $154 10.8%2011 3,171 (0.1%) 1,940 8.4% 61.2% 8.5% $89.20 4.0% $54.56 12.8% $173 12.7%
CAGR* 2.6% 2.2% (0.4%) 1.2% 0.8% 3.4%
*CAGR = Compounded Annual Growth Rate 2006 thru 2011
Source: Smith Travel Research
Records of room tax collections in Madison allow for examination of lodging trends over a longer period of
time. Figure 6-2 shows historical room tax collections from 1992. The room tax rate was then 7 percent,
increased to 8 percent in 1996, and again to 9 percent in 2007 up till now. The chart shows actual and rate-
adjusted collection trends.

Section VI Hotel Market Analysis & Review of Monona Terrace | December 2012 Madison Hotel Feasibility Study – Madison, WI
PAGE 78
Figure 6-2
Madison, WisconsinHistorical Room Tax Collections ($Millions)
CAGR = Compounded Annual Growth Rate from 1992 through 2011.
Source: City of Madison
$0
$1
$2
$3
$4
$5
$6
$7
$8
$9
$10
Ro
om
Tax
Rev
enu
es (
$Mil
lio
ns)
Tax Rate (Change) 7% 8% 9%
Actual Collections $3.2 $3.4 $3.6 $3.8 $4.7 $5.0 $5.3 $5.6 $6.0 $6.0 $6.3 $6.4 $6.5 $6.7 $7.1 $8.3 $8.7 $7.5 $8.3 $9.3 5.8%
% Change 5% 7% 7% 21% 7% 7% 6% 7% (0%) 6% 1% 3% 3% 6% 17% 4% (14%) 11% 12%
Rate-Adjusted $3.2 $3.4 $3.6 $3.8 $4.1 $4.3 $4.7 $4.9 $5.2 $5.2 $5.5 $5.6 $5.7 $5.9 $6.2 $6.5 $6.8 $5.8 $6.5 $7.3 4.4%
% Change 5% 7% 7% 6% 7% 7% 6% 7% (0%) 6% 1% 3% 3% 6% 4% 4% (14%) 11% 12%
1992 1993 1994 1995 1996 1997 1998 1999 2000 2001 2002 2003 2004 2005 2006 2007 2008 2009 2010 2011CAG
R

6 East Monroe Street | Fifth Floor | Chicago, Illinois 60603 | Phone: 312.447.2010 | Fax: 312.444.1125
www.chjc.com | [email protected]
Section VI Hotel Market Analysis & Review of Monona Terrace | December 2012 Madison Hotel Feasibility Study – Madison, WI
PAGE 79
As shown on the figure, actual room tax collections increased by a compounded annual rate of 5.8 percent
from 1992 through 2011. When the revenue amounts are rate-adjusted, taking into consideration the two rate
increases in 1996 and 2007, room tax collections increased by a healthy compounded annual rate of 4.4
percent. This adjusted growth rate corresponds to the annual growth rate in room revenues, which reflects
the actual lodging activities. This translates that Madison lodging activities grew by 4.4 percent annually from
1992 through 2011, This is a fairly healthy growth and is attributed to ADR increases as well as room supply
increases.
New hotel developments in Madison include a Hampton Inn and Edgewater Hotel.
The 194-room Hampton Inn is in the early stages of construction and is located on the corner of
North Bassett Street and West Johnson Street, about 1-mile from Monona Terrace. The hotel is
scheduled to open in the Fall of 2013. It is aimed at corporate, university and leisure business.
The Edgewater Hotel has undergone a long pre-development process and is set to begin
redevelopment in October of 2012 and be complete in the late Spring of 2014. Located about a mile
from Monona Terrace and on the shore of Lake Mendota, the $98 million redeveloped hotel will
have 189 rooms, up to 10 luxury condos, as well as meeting, restaurants, parking and dock space.
This will be an outstanding amenity for the market, but will be a minor factor in addressing the
available room block for Monona Terrace, due to its distance from the center.
MONTHLY SEASONALITY
Figure 6-3 and 6-4 show monthly seasonality of occupancy and rates from the center. Note that August, a
non-school month is especially busy. This happens to be one of the busiest months for Monona Terrace.

6 East Monroe Street | Fifth Floor | Chicago, Illinois 60603 | Phone: 312.447.2010 | Fax: 312.444.1125
www.chjc.com | [email protected]
Section VI Hotel Market Analysis & Review of Monona Terrace | December 2012 Madison Hotel Feasibility Study – Madison, WI
PAGE 80
Figure 6-3
Madison, WisconsinHistorical Monthly Occupancy Jan 2010-Aug 2012
Source: Smith Travel Research
0%
10%
20%
30%
40%
50%
60%
70%
80%
90%
100%
Jan
'10
Feb
Mar
Apr
May
Jun
Jul
Aug
Sep Oct
Nov
Dec
Jan
'11
Feb
Mar
Apr
May
Jun
Jul
Aug
Sep Oct
Nov
Dec
Jan
'12
Feb
Mar
Apr
May
Jun
Jul
Aug
Figure 6-4
Madison, WisconsinHistorical Monthly ADR and RevPAR Jan 2010-Aug 2012
Source: Smith Travel Research
$0
$20
$40
$60
$80
$100
$120
$140
$160
$180
Jan
'10
Feb
Mar
Apr
May
Jun
Jul
Aug
Sep Oct
Nov
Dec
Jan
'11
Feb
Mar
Apr
May
Jun
Jul
Aug
Sep Oct
Nov
Dec
Jan
'12
Feb
Mar
Apr
May
Jun
Jul
Aug
ADR City-wide
RevPAR City-wide
As shown in the charts, high season in Madison typically runs from Summer through Fall. Winter is most
quiet in which occupancy could dip below 40 percent, ADR below $80, and RevPAR below $30.

6 East Monroe Street | Fifth Floor | Chicago, Illinois 60603 | Phone: 312.447.2010 | Fax: 312.444.1125
www.chjc.com | [email protected]
Section VI Hotel Market Analysis & Review of Monona Terrace | December 2012 Madison Hotel Feasibility Study – Madison, WI
PAGE 81
DOWNTOWN MADISON HOTEL MARKET
According to Smith Travel Research data maintained by Greater Madison Convention and Visitors Bureau
and our independent research, hotels/ motels in downtown Madison enjoy higher occupancy, ADR, and
RevPAR when compared to the market overall. Figure 6-5 through Figure 6-7 compare lodging statistics in
downtown vs. market-wide and show that downtown hotels perform better. The reason for this is the
concentration of assets downtown, Capital related business and a higher quality of hotel stock overall. In this
comparison, downtown hotels are represented by 214-room Best Western Plus Inn On The Park, 240-room
Hilton Madison Monona Terrace, 151-room Hyatt Place Madison Downtown, and 365-room Madison
Concourse Hotel. While several other hotels exist in the broader area, notably the Doubletree, Sheraton and
the Clarion Suites, the hotels in this analysis are those most immediate to Monona Terrace.
As the charts show, in the 24 months through August 2012, peak occupancy in downtown hotels reached
above 85 percent, compared to 70 percent market-wide. Peak ADR in downtown hotels was $50 higher than
market-wide rate, while in low season it was still $30 higher than market-wide amounts. Peak RevPAR was
also nearly $50 higher than the market-wide rate, while in low season it stayed above $40 while the market-
wide rate dipped to $30.
Figure 6-5
Madison, WisconsinHistorical Monthly Occupancy Jan 2010-Aug 2012
Source: Smith Travel Research
72.0%70.3%
87.2%86.5%
0%
10%
20%
30%
40%
50%
60%
70%
80%
90%
100%
Jan
'10
Feb
Mar
Apr
May
Jun
Jul
Aug
Sep Oct
Nov
Dec
Jan
'11
Feb
Mar
Apr
May
Jun
Jul
Aug
Sep Oct
Nov
Dec
Jan
'12
Feb
Mar
Apr
May
Jun
Jul
Aug
City-wide
Downtown

6 East Monroe Street | Fifth Floor | Chicago, Illinois 60603 | Phone: 312.447.2010 | Fax: 312.444.1125
www.chjc.com | [email protected]
Section VI Hotel Market Analysis & Review of Monona Terrace | December 2012 Madison Hotel Feasibility Study – Madison, WI
PAGE 82
Figure 6-6
Madison, WisconsinHistorical Monthly Average Daily Rate (ADR) Jan 2010-Aug 2012
Source: Smith Travel Research
$153.88
$105.90
$156.88
$100.58
$77.70
$103.83
$0
$20
$40
$60
$80
$100
$120
$140
$160
$180
Jan
'10
Feb
Mar
Apr
May
Jun
Jul
Aug
Sep Oct
Nov
Dec
Jan
'11
Feb
Mar
Apr
May
Jun
Jul
Aug
Sep Oct
Nov
Dec
Jan
'12
Feb
Mar
Apr
May
Jun
Jul
Aug
ADR Downtown
ADR City-wide
Figure 6-7
Madison, WisconsinHistorical Monthly Revenue Per Available Room (RevPAR) Jan 2010-Aug 2012
Source: Smith Travel Research
$42.93
$123.44
$31.01
$76.67
$0
$20
$40
$60
$80
$100
$120
$140
$160
$180
Jan
'10
Feb
Mar
Apr
May
Jun
Jul
Aug
Sep
Oct
Nov
Dec
Jan
'11
Feb
Mar
Apr
May
Jun
Jul
Aug
Sep
Oct
Nov
Dec
Jan
'12
Feb
Mar
Apr
May
Jun
Jul
Aug
RevPAR Downtown
RevPAR City-wide

6 East Monroe Street | Fifth Floor | Chicago, Illinois 60603 | Phone: 312.447.2010 | Fax: 312.444.1125
www.chjc.com | [email protected]
Section VI Hotel Market Analysis & Review of Monona Terrace | December 2012 Madison Hotel Feasibility Study – Madison, WI
PAGE 83
These statistics show the downtown Madison location is desirable and preferred by visitors to Madison and
given greater priority in hotel booking decisions.
MADISON LODGING MARKET VS. PEER CITIES
Figure 6-8 through Figure 6-13 compare lodging statistics in Madison and its peer cities: Columbus, Ohio;
Des Moines, Iowa; Milwaukee, Wisconsin; Minneapolis, Minnesota; Omaha, Nebraska; Portland, Oregon;
Providence, Rhode Island; and Raleigh, North Carolina. These cities were chosen because of similarities of
size of market, presence of university, state capital presence, and presence of convention center. Figure 6-8
and Figure 6-9 compare the occupancy trends.
Figure 6-8
Madison WI vs. Comparable CitiesHistorical Monthly Occupancy Jan 2010-Aug 2012
Source: Smith Travel Research
0%
10%
20%
30%
40%
50%
60%
70%
80%
90%
100%
Jan
'10
Feb
Mar
Apr
May
Jun
Jul
Aug
Sep Oct
Nov
Dec
Jan
'11
Feb
Mar
Apr
May
Jun
Jul
Aug
Sep Oct
Nov
Dec
Jan
'12
Feb
Mar
Apr
May
Jun
Jul
Aug
Madison Columbus Des Moines
Milwaukee Minneapolis Omaha
Portland Providence Raleigh

6 East Monroe Street | Fifth Floor | Chicago, Illinois 60603 | Phone: 312.447.2010 | Fax: 312.444.1125
www.chjc.com | [email protected]
Section VI Hotel Market Analysis & Review of Monona Terrace | December 2012 Madison Hotel Feasibility Study – Madison, WI
PAGE 84
Figure 6-9
Downtown Madison WI vs. Comparable CitiesHistorical Monthly Occupancy Jan 2010-Aug 2012
Source: Smith Travel Research
0%
10%
20%
30%
40%
50%
60%
70%
80%
90%
100%
Jan
'10
Feb
Mar
Apr
May
Jun
Jul
Aug
Sep Oct
Nov
Dec
Jan
'11
Feb
Mar
Apr
May
Jun
Jul
Aug
Sep Oct
Nov
Dec
Jan
'12
Feb
Mar
Apr
May
Jun
Jul
Aug
Madison Downtown Columbus Des Moines
Milwaukee Minneapolis Omaha
Portland Providence Raleigh
As shown in the charts, market-wide occupancy in Madison stayed on the lower side of the peers. On the
other hand, downtown Madison hotels are shown to experience comparable occupancy as peer markets.
Figure 6-10 and Figure 6-11 compare the ADR trends.

6 East Monroe Street | Fifth Floor | Chicago, Illinois 60603 | Phone: 312.447.2010 | Fax: 312.444.1125
www.chjc.com | [email protected]
Section VI Hotel Market Analysis & Review of Monona Terrace | December 2012 Madison Hotel Feasibility Study – Madison, WI
PAGE 85
Figure 6-10
Madison WI vs. Comparable CitiesHistorical Monthly Average Daily Rate (ADR) Jan 2010-Aug 2012
Source: Smith Travel Research
$0
$20
$40
$60
$80
$100
$120
$140
$160
$180
Jan
'10
Feb
Mar
Apr
May
Jun
Jul
Aug
Sep Oct
Nov
Dec
Jan
'11
Feb
Mar
Apr
May
Jun
Jul
Aug
Sep Oct
Nov
Dec
Jan
'12
Feb
Mar
Apr
May
Jun
Jul
Aug
Madison Columbus Des Moines
Milwaukee Minneapolis Omaha
Portland Providence Raleigh
Figure 6-11
Downtown Madison WI vs. Comparable CitiesHistorical Monthly Average Daily Rate (ADR) Jan 2010-Aug 2012
Source: Smith Travel Research
$0
$20
$40
$60
$80
$100
$120
$140
$160
$180
Jan
'10
Feb
Mar
Apr
May
Jun
Jul
Aug
Sep
Oct
Nov
Dec
Jan
'11
Feb
Mar
Apr
May
Jun
Jul
Aug
Sep
Oct
Nov
Dec
Jan
'12
Feb
Mar
Apr
May
Jun
Jul
Aug
Madison Downtown Columbus Des Moines
Milwaukee Minneapolis Omaha
Portland Providence Raleigh

6 East Monroe Street | Fifth Floor | Chicago, Illinois 60603 | Phone: 312.447.2010 | Fax: 312.444.1125
www.chjc.com | [email protected]
Section VI Hotel Market Analysis & Review of Monona Terrace | December 2012 Madison Hotel Feasibility Study – Madison, WI
PAGE 86
As shown in charts, market-wide, Madison hotels trailed all of the peers in terms of ADR, staying below
peers’ ADR throughout the 32-month period. However, downtown Madison hotels enjoyed very comparable
or higher rates compared to peers, and this would be experience by any new product added to the market.
Figure 6-12 and Figure 6-13 compare the ADR trends.
Figure 6-12
Madison WI vs. Comparable CitiesHistorical Monthly Revenue Per Available Room (RevPAR) Jan 2010-Aug 2012
Source: Smith Travel Research
$0
$20
$40
$60
$80
$100
$120
$140
$160
$180
Jan
'10
Feb
Mar
Apr
May
Jun
Jul
Aug
Sep
Oct
Nov
Dec
Jan
'11
Feb
Mar
Apr
May
Jun
Jul
Aug
Sep
Oct
Nov
Dec
Jan
'12
Feb
Mar
Apr
May
Jun
Jul
Aug
Madison Columbus Des Moines
Milwaukee Minneapolis Omaha
Portland Providence Raleigh

6 East Monroe Street | Fifth Floor | Chicago, Illinois 60603 | Phone: 312.447.2010 | Fax: 312.444.1125
www.chjc.com | [email protected]
Section VI Hotel Market Analysis & Review of Monona Terrace | December 2012 Madison Hotel Feasibility Study – Madison, WI
PAGE 87
Figure 6-13
Downtown Madison WI vs. Comparable CitiesHistorical Monthly Revenue Per Available Room (RevPAR) Jan 2010-Aug 2012
Source: Smith Travel Research
$0
$20
$40
$60
$80
$100
$120
$140
$160
$180
Jan
'10
Feb
Mar
Apr
May
Jun
Jul
Aug
Sep Oct
Nov
Dec
Jan
'11
Feb
Mar
Apr
May
Jun
Jul
Aug
Sep Oct
Nov
Dec
Jan
'12
Feb
Mar
Apr
May
Jun
Jul
Aug
Madison Downtown Columbus Des Moines
Milwaukee Minneapolis Omaha
Portland Providence Raleigh
As shown in the charts, similar to ADR, market-wide RevPAR of Madison hotels trailed all of the peers,
staying below all other cities’ RevPAR throughout the 32-month period. However, downtown Madison hotels
enjoyed comparable rates to peers.
LODGING STATISTICS OF COMPETITIVE SETS
Competitive sets are subsets of properties that most resemble and are most competitive to the proposed
Hotel. Analyses of competitive sets are essential to further examine their historical trends and future
potentials before and after the proposed Hotel entering the market.
Two competitive sets are selected to the proposed Headquarters Hotel for Madison. They are listed in Table
6-3. Set #1 consists of five hotels, offering 1,035 rooms combined. Set #2 consists of ten hotels, offering
1,845 rooms combined.

6 East Monroe Street | Fifth Floor | Chicago, Illinois 60603 | Phone: 312.447.2010 | Fax: 312.444.1125
www.chjc.com | [email protected]
Section VI Hotel Market Analysis & Review of Monona Terrace | December 2012 Madison Hotel Feasibility Study – Madison, WI
PAGE 88
Table 6-3
Madison, WisconsinList of Competitive Sets
Competitive Set #1# of
RoomsCompetitive Set #2
# of Rooms
1 Campus Inn 74 1 Campus Inn 742 Hyatt Place Madison Downtown 151 2 Hyatt Place Madison Downtown 1513 Hilton Madison Monona Terrace 240 3 Hilton Madison Monona Terrace 2404 Best Western Plus Inn On The Park 214 4 Best Western Plus Inn On The Park 2145 Madison Concourse Hotel 356 5 Madison Concourse Hotel 356
6 Doubletree Madison Downtown 1637 Clarion Suites @ The Alliant Energy Center Madison 1408 Holiday Inn Express Madison 929 Sheraton Hotel Madison 239
10 Best Western Plus InnTowner & The Highland Club 176
Total # of Rooms 1,035 Total # of Rooms 1,845
Room block at 50% 518 923Room block at 60% 621 na
Source: Smith Travel Research
As the city tries to increase demand from conventions, tradeshows and conferences, a key ingredient is room
block size. The complexion of hotels in Madison make room blocks very hard to assemble. First, very few
rooms are near the center. Second, the occupancy rates are very high, with the best performance being the
Hilton, right next to Monona Terrace. The agreement with that hotel stipulates only 62 percent of its rooms
be granted for room blocks (150 rooms). Other hotels in the market also have consistent market segments
they prefer to cater to, and during busy periods, they will grant an even smaller room block. Table 6-3 shows
the room block at 50 and 60 percent for competitive set #1 and at 50 percent for competitive set #2. Room
block at 60% for competitive set two would not be granted due to their base of business from other sectors.

6 East Monroe Street | Fifth Floor | Chicago, Illinois 60603 | Phone: 312.447.2010 | Fax: 312.444.1125
www.chjc.com | [email protected]
Section VI Hotel Market Analysis & Review of Monona Terrace | December 2012 Madison Hotel Feasibility Study – Madison, WI
PAGE 89
Figure 6-14 through Figure 6-17 show the statistics of the two competitive sets from 2006 through 2011, as
reported by Smith Travel Research. Figure 6-14 shows the annual occupancy.
Figure 6-14
Madison, WisconsinHistorical Annual Occupancy 2006 thru 2011
*CAGR = Compounded Annual Growth from 2006 through 2011.
Source: Smith Travel Research
0%
10%
20%
30%
40%
50%
60%
70%
80%
90%
100%
City-Wide 62.4% 60.1% 59.6% 51.9% 56.4% 61.2% (0.4%)
Comp Set #1 71.0% 72.7% 72.0% 64.9% 65.0% 69.0% (0.6%)
Comp Set #2 67.7% 67.0% 67.6% 61.0% 63.6% 67.4% (0.1%)
2006 2007 2008 2009 2010 2011 CAGR*
As shown on the chart, the competitive sets experienced higher occupancy than market-wide. In general,
both maintained healthy and strong occupancy, going below 65 percent only in 2009 for Set #1, and in 2009
and 2010 for Set #2. In 2011, their occupancy was at least 6 percentage points higher than the market-wide
rate. Markets that have occupancy over seventy percent have many nights at many hotels that are full.
Downtown Madison hotels had over seventy percent occupancy seven months in 2011. Several hotels
operate at an annual occupancy rate well over seventy percent.

6 East Monroe Street | Fifth Floor | Chicago, Illinois 60603 | Phone: 312.447.2010 | Fax: 312.444.1125
www.chjc.com | [email protected]
Section VI Hotel Market Analysis & Review of Monona Terrace | December 2012 Madison Hotel Feasibility Study – Madison, WI
PAGE 90
Figure 6-15
Madison, WisconsinHistorical Annual Average Daily Rate (ADR) 2006 thru 2011
*CAGR = Compounded Annual Growth from 2006 through 2011.
Source: Smith Travel Research
$0
$20
$40
$60
$80
$100
$120
$140
$160
$180
City-wide $84.01 $88.44 $91.89 $86.22 $85.79 $89.20 1.2%
Comp Set #1 $114.22 $118.55 $126.07 $123.75 $126.39 $127.97 2.3%
Comp Set #2 $108.08 $114.22 $120.31 $116.36 $116.60 $118.64 1.9%
2006 2007 2008 2009 2010 2011 CAGR*
Figure 6-15 above shows that the competitive sets also experienced higher ADR than market-wide. From
2006, annual growth was 2.3 percent for Set #1 and 1.9 percent for Set #2. In 2011, their ADR was more
than 30 percent higher than market-wide rate.

6 East Monroe Street | Fifth Floor | Chicago, Illinois 60603 | Phone: 312.447.2010 | Fax: 312.444.1125
www.chjc.com | [email protected]
Section VI Hotel Market Analysis & Review of Monona Terrace | December 2012 Madison Hotel Feasibility Study – Madison, WI
PAGE 91
Figure 6-16
Madison, WisconsinHistorical Annual Revenue Per Available Room (RevPAR) 2006 thru 2011
*CAGR = Compounded Annual Growth from 2006 through 2011.
Source: Smith Travel Research
$0
$20
$40
$60
$80
$100
$120
$140
$160
$180
City-wide $52.45 $53.19 $54.81 $44.76 $48.38 $54.56 0.8%
Comp Set #1 $81.05 $86.22 $90.78 $80.33 $82.12 $88.24 1.7%
Comp Set #2 $73.16 $76.49 $81.35 $71.00 $74.18 $79.92 1.8%
2006 2007 2008 2009 2010 2011 CAGR*
Figure 6-16 above shows that the competitive sets also experienced higher RevPAR than market-wide. From
2006, annual growth was 1.7 percent for Set #1 and 1.8 percent for Set #2. In 2011, their RevPAR was more
than 45 percent higher than market-wide rate.
Figure 6-17 shows historical room revenues of the competitive sets.

6 East Monroe Street | Fifth Floor | Chicago, Illinois 60603 | Phone: 312.447.2010 | Fax: 312.444.1125
www.chjc.com | [email protected]
Section VI Hotel Market Analysis & Review of Monona Terrace | December 2012 Madison Hotel Feasibility Study – Madison, WI
PAGE 92
Figure 6-17
Madison, WisconsinHistorical Room Revenues 2006 thru 2011 ($Millions)
*CAGR = Compounded Annual Growth from 2006 through 2011.
Source: Smith Travel Research
$0
$10
$20
$30
$40
$50
$60
Comp Set #1 $26.2 $27.9 $29.3 $25.9 $29.9 $33.3 4.9%
Comp Set #2 $45.3 $47.3 $50.3 $43.9 $49.0 $53.8 3.5%
2006 2007 2008 2009 2010 2011 CAGR*
As shown on the chart, room revenues of Set #1 and Set #2 increased by 4.9 percent and 3.5 percent
annually, respectively, from 2006 through 2011. These are higher than market-wide growth rate, which was
3.1 percent annually during the same period. Revenue Per Available Room is summarized as well, which
shows that in 2011, Set #1 had a 10 percent advantage over Set #2.
LODGING STATISTICS OF NATIONAL COMPARABLE PROPERTIES
Five hotels were selected from nation-wide lodging properties to represent those most comparable to the
proposed Headquarters Hotel in Madison. The properties were selected for a number of reasons including, a
range of hotel sizes to ascertain the average performance of small to large properties (the average room count
for the 5 properties selected is 513 rooms); in the case of the Renaissance Nashville, Marriott San Jose and
Columbia Hilton, the properties operate in conjunction with a stigmatized convention center due to a small
facility size; each hotel and facility operates in a specialized market with unique demand generators; and each
hotel operates in the top tier of their market area. The five hotels have a total room supply of 2,565 rooms
and an average size of 513-rooms. They are summarized in Table 6-4.
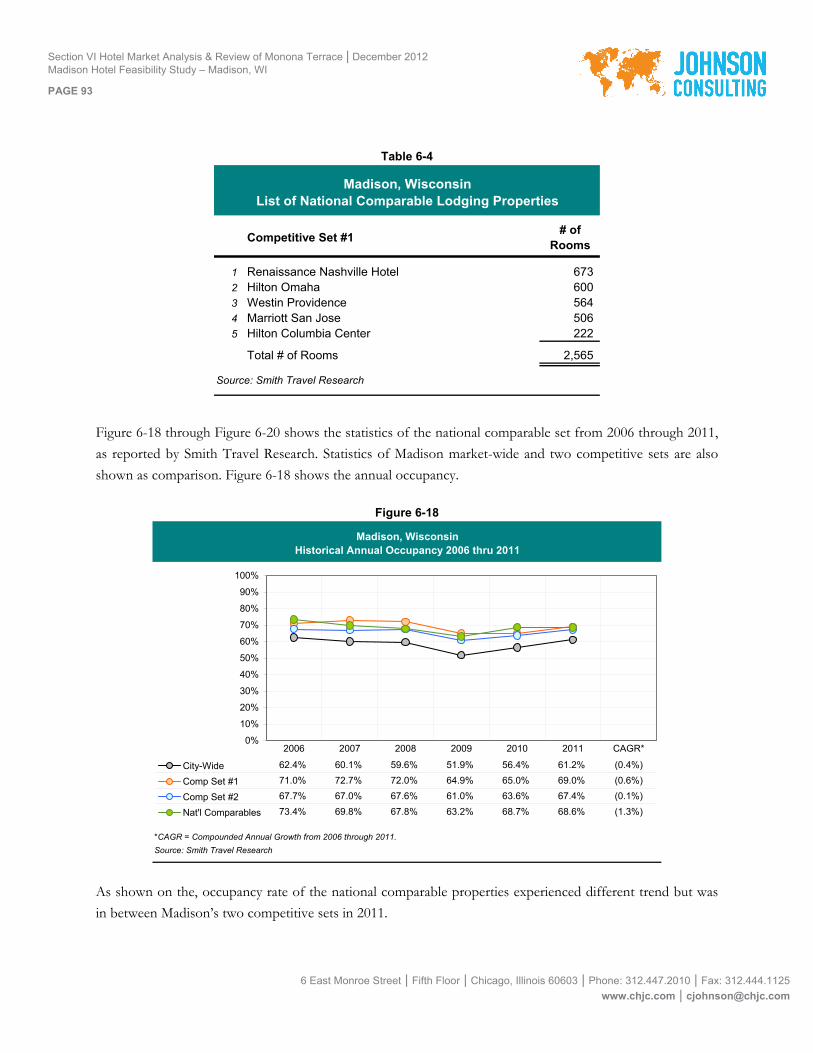
6 East Monroe Street | Fifth Floor | Chicago, Illinois 60603 | Phone: 312.447.2010 | Fax: 312.444.1125
www.chjc.com | [email protected]
Section VI Hotel Market Analysis & Review of Monona Terrace | December 2012 Madison Hotel Feasibility Study – Madison, WI
PAGE 93
Table 6-4
Madison, WisconsinList of National Comparable Lodging Properties
Competitive Set #1# of
Rooms
1 Renaissance Nashville Hotel 6732 Hilton Omaha 6003 Westin Providence 5644 Marriott San Jose 5065 Hilton Columbia Center 222
Total # of Rooms 2,565
Source: Smith Travel Research
Figure 6-18 through Figure 6-20 shows the statistics of the national comparable set from 2006 through 2011,
as reported by Smith Travel Research. Statistics of Madison market-wide and two competitive sets are also
shown as comparison. Figure 6-18 shows the annual occupancy.
Figure 6-18
Madison, WisconsinHistorical Annual Occupancy 2006 thru 2011
*CAGR = Compounded Annual Growth from 2006 through 2011.
Source: Smith Travel Research
0%
10%
20%
30%
40%
50%
60%
70%
80%
90%
100%
City-Wide 62.4% 60.1% 59.6% 51.9% 56.4% 61.2% (0.4%)
Comp Set #1 71.0% 72.7% 72.0% 64.9% 65.0% 69.0% (0.6%)
Comp Set #2 67.7% 67.0% 67.6% 61.0% 63.6% 67.4% (0.1%)
Nat'l Comparables 73.4% 69.8% 67.8% 63.2% 68.7% 68.6% (1.3%)
2006 2007 2008 2009 2010 2011 CAGR*
As shown on the, occupancy rate of the national comparable properties experienced different trend but was
in between Madison’s two competitive sets in 2011.

6 East Monroe Street | Fifth Floor | Chicago, Illinois 60603 | Phone: 312.447.2010 | Fax: 312.444.1125
www.chjc.com | [email protected]
Section VI Hotel Market Analysis & Review of Monona Terrace | December 2012 Madison Hotel Feasibility Study – Madison, WI
PAGE 94
Figure 6-19
Madison, WisconsinHistorical Annual Average Daily Rate (ADR) 2006 thru 2011
*CAGR = Compounded Annual Growth from 2006 through 2011.
Source: Smith Travel Research
$0
$20
$40
$60
$80
$100
$120
$140
$160
$180
City-wide $84.01 $88.44 $91.89 $86.22 $85.79 $89.20 1.2%
Comp Set #1 $114.22 $118.55 $126.07 $123.75 $126.39 $127.97 2.3%
Comp Set #2 $108.08 $114.22 $120.31 $116.36 $116.60 $118.64 1.9%
Nat'l Comparables $144.80 $154.26 $155.48 $141.06 $137.99 $140.57 (0.6%)
2006 2007 2008 2009 2010 2011 CAGR*
The national comparable properties notably enjoyed higher ADR than Madison hotels from 2006 through
2011. It is our experience that a new product can have an elevating effect on ADR and on all surrounding
properties, sometimes after a very short absorption period decline.
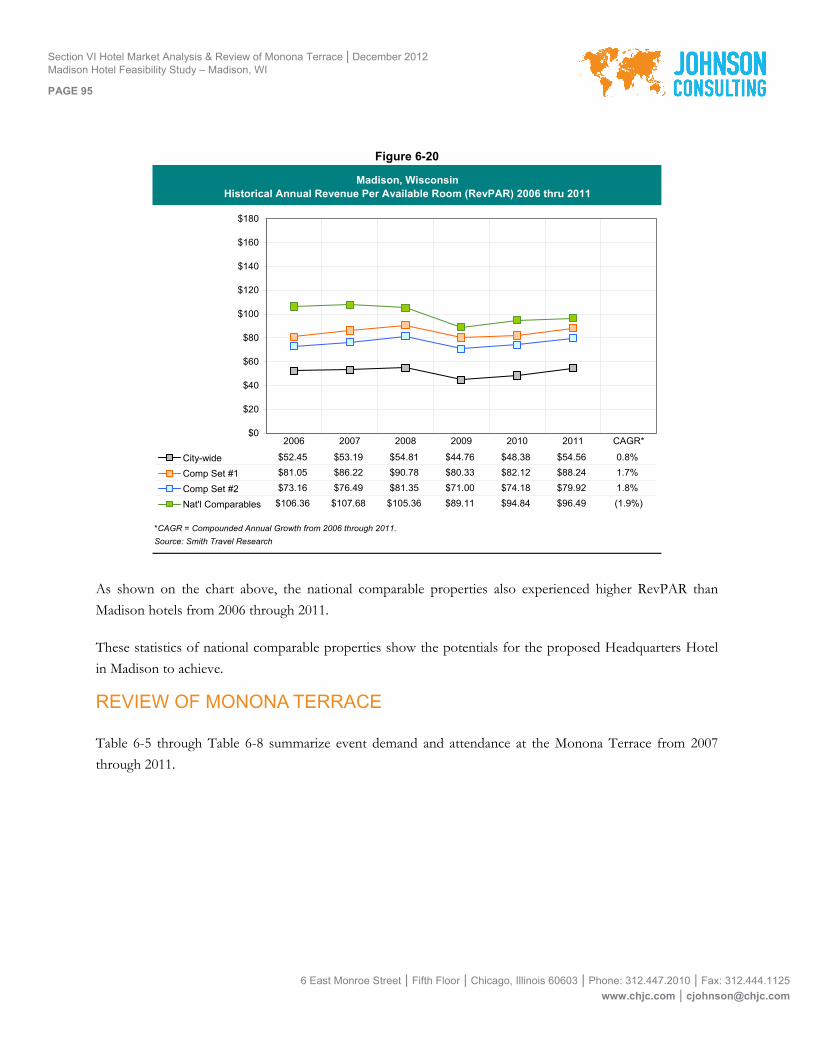
6 East Monroe Street | Fifth Floor | Chicago, Illinois 60603 | Phone: 312.447.2010 | Fax: 312.444.1125
www.chjc.com | [email protected]
Section VI Hotel Market Analysis & Review of Monona Terrace | December 2012 Madison Hotel Feasibility Study – Madison, WI
PAGE 95
Figure 6-20
Madison, WisconsinHistorical Annual Revenue Per Available Room (RevPAR) 2006 thru 2011
*CAGR = Compounded Annual Growth from 2006 through 2011.
Source: Smith Travel Research
$0
$20
$40
$60
$80
$100
$120
$140
$160
$180
City-wide $52.45 $53.19 $54.81 $44.76 $48.38 $54.56 0.8%
Comp Set #1 $81.05 $86.22 $90.78 $80.33 $82.12 $88.24 1.7%
Comp Set #2 $73.16 $76.49 $81.35 $71.00 $74.18 $79.92 1.8%
Nat'l Comparables $106.36 $107.68 $105.36 $89.11 $94.84 $96.49 (1.9%)
2006 2007 2008 2009 2010 2011 CAGR*
As shown on the chart above, the national comparable properties also experienced higher RevPAR than
Madison hotels from 2006 through 2011.
These statistics of national comparable properties show the potentials for the proposed Headquarters Hotel
in Madison to achieve.
REVIEW OF MONONA TERRACE
Table 6-5 through Table 6-8 summarize event demand and attendance at the Monona Terrace from 2007
through 2011.

6 East Monroe Street | Fifth Floor | Chicago, Illinois 60603 | Phone: 312.447.2010 | Fax: 312.444.1125
www.chjc.com | [email protected]
Section VI Hotel Market Analysis & Review of Monona Terrace | December 2012 Madison Hotel Feasibility Study – Madison, WI
PAGE 96
Table 6-5
Monona Terrace, Madison, WisconsinSummary of Event Demand
2007 2008 2009 2010 2011 % of Total
Banquets 275 274 233 231 210 37%Meetings 213 238 193 206 207 32%Conventions 30 33 28 26 30 4%Conferences 38 49 40 36 32 6%Consumer Shows 11 15 13 19 23 2%Entertainment 33 27 26 30 30 4%Community Events 72 69 76 61 82 11%Community Meetings 19 23 23 13 16 3%
Total 691 728 632 622 630 100%
Source: Monona Terrace
As typical with conference/ convention/ civic centers, banquets and meetings make up nearly 70 percent of
events at Monona Terrace, due to their frequency and local demand orientation. However, these events
generate only 42 percent of attendees, as summarized in Table 6-6, below.
Table 6-6
Monona Terrace, Madison, WisconsinSummary of Actual Attendance
2007 2008 2009 2010 2011 % of Total
Banquets 32,287 44,061 51,174 54,530 49,805 26%Meetings 18,006 26,956 31,811 33,023 36,535 16%Conventions 15,119 18,232 17,241 30,242 31,151 13%Conferences 6,013 9,138 9,918 10,659 9,725 5%Consumer Shows 13,960 28,153 38,862 40,930 41,368 18%Entertainment 1,542 7,060 15,279 13,457 9,045 5%Community Events 28,572 28,610 24,759 30,608 35,345 17%Community Meetings 197 185 381 252 327 0%
Total 115,696 162,395 189,425 213,701 213,301 100%
Source: Monona Terrace
Indeed, banquets and meetings are smaller events compared to conventions and consumer shows. Table 6-7
shows the average attendance by types of events. Note the uptick in average convention size from 2009 to
2010, largely attributed to marketing strategies employed at the building and CVB. When demand at Monona
Terrace is compared to that of comparable sites analyzed elsewhere in this report, the facility does very well in
terms of both events and attendance.

6 East Monroe Street | Fifth Floor | Chicago, Illinois 60603 | Phone: 312.447.2010 | Fax: 312.444.1125
www.chjc.com | [email protected]
Section VI Hotel Market Analysis & Review of Monona Terrace | December 2012 Madison Hotel Feasibility Study – Madison, WI
PAGE 97
Table 6-7
Monona Terrace, Madison, WisconsinSummary of Average Attendance
2007 2008 2009 2010 2011
Banquets 117 161 220 236 237Meetings 85 113 165 160 176Conventions 504 552 616 1,163 1,038Conferences 158 186 248 296 304Consumer Shows 1,269 1,877 2,989 2,154 1,799Entertainment 47 261 588 449 302Community Events 397 415 326 502 431Community Meetings 10 8 17 19 20
Weighted Average 316 300 300 326 312
Source: Monona Terrace
Table 6-8 summarizes the level of utilization of Monona Terrace, measured in number of event-days.
Table 6-8
Monona Terrace, Madison, WisconsinSummary of Event Days
2007 2008 2009 2010 2011Average
Event-Days*
Banquets 277 276 233 235 214 1.0Meetings 264 300 239 262 246 1.2Conventions 124 132 111 103 128 4.1Conferences 90 117 102 92 78 2.5Consumer Shows 16 19 24 42 48 1.8Entertainment 35 29 27 32 31 1.1Community Events 75 76 80 65 86 1.1Community Meetings 19 24 25 13 16 1.0
Total 900 973 841 844 847
*Based on 2007-2011 statistics.
Source: Monona Terrace
As shown in the table, the majority of events in Monona Terrace are one- to two-day events. Moreover, most
banquet and meeting events are small sized and held simultaneously. Therefore, even though Monona
Terrance was used for over 800 event-days, they only translated to utilization rate of 40 percent in 2010 and
2011 due to number of different available spaces in the complex. These utilization rates are summarized in
Table 6-9. Do not interpret these as “under utilized.” The building is actually quite heavily used. The number
of events and event days is actually quite high. The issue relates to the smaller size of event and their short
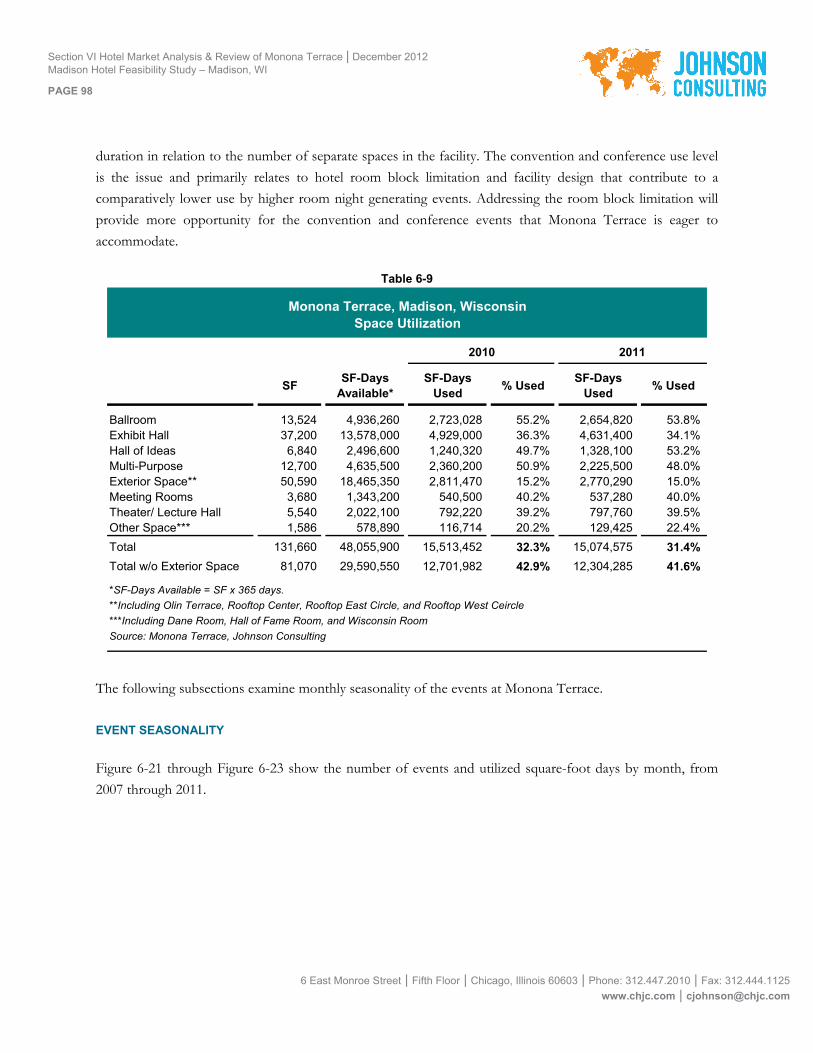
6 East Monroe Street | Fifth Floor | Chicago, Illinois 60603 | Phone: 312.447.2010 | Fax: 312.444.1125
www.chjc.com | [email protected]
Section VI Hotel Market Analysis & Review of Monona Terrace | December 2012 Madison Hotel Feasibility Study – Madison, WI
PAGE 98
duration in relation to the number of separate spaces in the facility. The convention and conference use level
is the issue and primarily relates to hotel room block limitation and facility design that contribute to a
comparatively lower use by higher room night generating events. Addressing the room block limitation will
provide more opportunity for the convention and conference events that Monona Terrace is eager to
accommodate.
Table 6-9
Monona Terrace, Madison, WisconsinSpace Utilization
2010 2011
SFSF-Days
Available*SF-Days
Used% Used
SF-Days Used
% Used
Ballroom 13,524 4,936,260 2,723,028 55.2% 2,654,820 53.8%Exhibit Hall 37,200 13,578,000 4,929,000 36.3% 4,631,400 34.1%Hall of Ideas 6,840 2,496,600 1,240,320 49.7% 1,328,100 53.2%Multi-Purpose 12,700 4,635,500 2,360,200 50.9% 2,225,500 48.0%Exterior Space** 50,590 18,465,350 2,811,470 15.2% 2,770,290 15.0%Meeting Rooms 3,680 1,343,200 540,500 40.2% 537,280 40.0%Theater/ Lecture Hall 5,540 2,022,100 792,220 39.2% 797,760 39.5%Other Space*** 1,586 578,890 116,714 20.2% 129,425 22.4%
Total 131,660 48,055,900 15,513,452 32.3% 15,074,575 31.4%
Total w/o Exterior Space 81,070 29,590,550 12,701,982 42.9% 12,304,285 41.6%
*SF-Days Available = SF x 365 days.
**Including Olin Terrace, Rooftop Center, Rooftop East Circle, and Rooftop West Ceircle
***Including Dane Room, Hall of Fame Room, and Wisconsin Room
Source: Monona Terrace, Johnson Consulting
The following subsections examine monthly seasonality of the events at Monona Terrace.
EVENT SEASONALITY
Figure 6-21 through Figure 6-23 show the number of events and utilized square-foot days by month, from
2007 through 2011.

6 East Monroe Street | Fifth Floor | Chicago, Illinois 60603 | Phone: 312.447.2010 | Fax: 312.444.1125
www.chjc.com | [email protected]
Section VI Hotel Market Analysis & Review of Monona Terrace | December 2012 Madison Hotel Feasibility Study – Madison, WI
PAGE 99
Figure 6-21
Monona Terrace, Madison, WisconsinMonthly Event Demand 2007 thru 2011
Source: Monona Terrace, Johnson Consulting
39
46
52
60
74
67
55
37
67 67
58
38
0
10
20
30
40
50
60
70
80
90
Jan Feb Mar Apr May Jun Jul Aug Sep Oct Nov Dec
# o
f E
ven
ts
2007
2008
2009
2010
2011
Average
The above figure plots number of events by month. It is deceptive because August, which appears to be a
slow month, is perhaps the most valuable month to Monona Terrace and the City from a revenue and
economic impact perspective. Figure 6-22 captures this value, based on occupied square foot days.

6 East Monroe Street | Fifth Floor | Chicago, Illinois 60603 | Phone: 312.447.2010 | Fax: 312.444.1125
www.chjc.com | [email protected]
Section VI Hotel Market Analysis & Review of Monona Terrace | December 2012 Madison Hotel Feasibility Study – Madison, WI
PAGE 100
Figure 6-22
Monona Terrace, Madison, WisconsinHistorical Monthly Utilized Square Foot Days 2007 thru 2011
Excluding Exterior Space
Including Exterior Space
Source: Monona Terrace, Johnson Consulting
973,613
786,215
995,506
1,187,5911,254,827
1,084,031
910,299
1,612,065
1,089,896
1,354,498
900,978
573,675
0
500,000
1,000,000
1,500,000
2,000,000
2,500,000
3,000,000
Jan Feb Mar Apr May Jun Jul Aug Sep Oct Nov Dec
Use
d S
F-D
ays
2007
2008
2009
2010
2011
Average
974,613
786,215
995,506
1,247,643
1,711,3391,806,599
1,370,715
2,108,695
1,689,060
1,510,364
900,978
584,191
0
500,000
1,000,000
1,500,000
2,000,000
2,500,000
3,000,000
Jan Feb Mar Apr May Jun Jul Aug Sep Oct Nov Dec
Use
d S
F-D
ays
2007
2008
2009
2010
2011
Average

6 East Monroe Street | Fifth Floor | Chicago, Illinois 60603 | Phone: 312.447.2010 | Fax: 312.444.1125
www.chjc.com | [email protected]
Section VI Hotel Market Analysis & Review of Monona Terrace | December 2012 Madison Hotel Feasibility Study – Madison, WI
PAGE 101
Figure 6-23
Monona Terrace, Madison, WisconsinHistorical Monthly Occupancy 2007 thru 2011
Excluding Exterior Space
Including Exterior Space
Source: Monona Terrace, Johnson Consulting
39%35%
40%
49% 50%
45%
36%
64%
45%
54%
37%
23%
0%
10%
20%
30%
40%
50%
60%
70%
80%
Jan Feb Mar Apr May Jun Jul Aug Sep Oct Nov Dec
Use
d S
F-D
ays
2007
2008
2009
2010
2011
Average
24%21%
24%
32%
42%46%
34%
52%
43%
37%
23%
14%
0%
10%
20%
30%
40%
50%
60%
70%
80%
Jan Feb Mar Apr May Jun Jul Aug Sep Oct Nov Dec
Use
d S
F-D
ays
2007
2008
2009
2010
2011
Average
Figure 6-21 through Figure 6-23 show activities at Monona Terrace are not even throughout the year. The
month of August has the lowest number of events but it also the busiest, with the highest occupancy and

6 East Monroe Street | Fifth Floor | Chicago, Illinois 60603 | Phone: 312.447.2010 | Fax: 312.444.1125
www.chjc.com | [email protected]
Section VI Hotel Market Analysis & Review of Monona Terrace | December 2012 Madison Hotel Feasibility Study – Madison, WI
PAGE 102
highest number of square foot days. Figure 6-24 shows the square foot days on per event basis each month
from 2007 through 2011.
Figure 6-24
Monona Terrace, Madison, WisconsinHistorical Monthly Utilized Square Foot Days per Event, 2007 thru 2011
Excluding Exterior Space
Including Exterior Space
Source: Monona Terrace, Johnson Consulting
25,181
17,25019,508 19,731
17,203 16,263 16,880
43,966
16,22020,358
15,693 14,862
0
10,000
20,000
30,000
40,000
50,000
60,000
70,000
80,000
Jan Feb Mar Apr May Jun Jul Aug Sep Oct Nov Dec
Use
d S
F-D
ays
2007
2008
2009
2010
2011
Average
25,208
17,25019,508 20,742
23,35327,229
25,320
57,819
25,26822,644
15,693 15,150
0
10,000
20,000
30,000
40,000
50,000
60,000
70,000
80,000
Jan Feb Mar Apr May Jun Jul Aug Sep Oct Nov Dec
Use
d S
F-D
ays
2007
2008
2009
2010
2011
Average

6 East Monroe Street | Fifth Floor | Chicago, Illinois 60603 | Phone: 312.447.2010 | Fax: 312.444.1125
www.chjc.com | [email protected]
Section VI Hotel Market Analysis & Review of Monona Terrace | December 2012 Madison Hotel Feasibility Study – Madison, WI
PAGE 103
Clearly, Figure 6-24 shows that August events are longer and larger. The strategy for Monona Terrace is to fill
other months as closely to August as practically possible. Please also note the correlation of peak occupancy
and ADR for August and September in Figures 6-3 and 6-4. The goal would be to make many more months
as busy as August with the correct hotel strategy.
MONONA TERRACE-BASED ROOM NIGHTS SEASONALITY
Figure 6-25 shows the number of room nights generated by events at the Monona Terrace by month, from
2007 through 2011. Note that in our experience, building management only captures a small fraction of
room night data about events. Many users are not aware of rooms booked by individuals outside the room
block.
Figure 6-25
Monona Terrace, Madison, WisconsinHistorical Monthly MT-Generated Room Nights 2007 thru 2011
Source: Monona Terrace, Johnson Consulting
1,4071,046
1,984
2,674
3,587
4,539
2,705
6,390
9,135
4,129
1,293
343
0
2,000
4,000
6,000
8,000
10,000
12,000
Jan Feb Mar Apr May Jun Jul Aug Sep Oct Nov Dec
Use
d S
F-D
ays
2007
2008
2009
2010
2011
Average
As shown on the figure, August and September are the most productive months to generate convention
room nights.
Figure 6-26 shows average room nights per events, by month from 2007 through 2011.

6 East Monroe Street | Fifth Floor | Chicago, Illinois 60603 | Phone: 312.447.2010 | Fax: 312.444.1125
www.chjc.com | [email protected]
Section VI Hotel Market Analysis & Review of Monona Terrace | December 2012 Madison Hotel Feasibility Study – Madison, WI
PAGE 104
Figure 6-26
Monona Terrace, Madison, WisconsinHistorical Monthly MT-Generated Room Nights per Event, 2007 thru 2011
Source: Monona Terrace, Johnson Consulting
37
23
3945 50
69
51
171
137
62
23
8
0
20
40
60
80
100
120
140
160
180
200
220
240
Jan Feb Mar Apr May Jun Jul Aug Sep Oct Nov Dec
Use
d S
F-D
ays
2007
2008
2009
2010
2011
Average
On per event basis, August events are also the most productive in generating room nights.
POTENTIAL TO INCREASE UTILIZATION AT MONONA TERRACE
There is capacity at Monona Terrace for more conventions and conferences. However there are few options
for larger banquets and social and consumer show events in the City. Figure 6-27 on the following page
illustrates the potential to increase utilization in Monona Terrace, by holding more events during “low”
months making more months with demand profiles similar to the months of August and September. For
example, the busiest month the past five years was August, with an average of 1.6 million square-foot-days of
utilization during the month. Having all other months as busy as August would have increased level of
utilization from 43 percent to approximately 64 percent, which is nearing the 70-percent practical maximum
occupancy of a convention center. Given this, a meeting space strategy for the proposed hotel must play a
role in solving the fixed nature of the function space at Monona Terrace.

6 East Monroe Street | Fifth Floor | Chicago, Illinois 60603 | Phone: 312.447.2010 | Fax: 312.444.1125
www.chjc.com | [email protected]
Section VI Hotel Market Analysis & Review of Monona Terrace | December 2012 Madison Hotel Feasibility Study – Madison, WI
PAGE 105
Figure 6-27
Monona Terrace, Madison, WisconsinAverage Monthly Square Foot Days (2007 thru 2011)
Source: Monona Terrace, Johnson Consulting
0%
10%
20%
30%
40%
50%
60%
70%
Additions to 64% Occ. 25% 30% 25% 15% 14% 20% 28% 0% 19% 10% 27% 41%
Actual (43% Occ.) 39% 35% 40% 49% 50% 45% 36% 64% 45% 54% 37% 23%
Jan Feb Mar Apr May Jun Jul Aug Sep Oct Nov Dec
The figure shows there is still capacity at Monona Terrace to hold more events and increase utilization, most
efficiently by pursuing events that are longer and larger. It is essential to note that structurally, a much higher
level of utilization is not practical without some form of physical modification to add more exhibit and
support meeting space or displacing less strategic events. The only practical way to accomplish this is via a
larger hotel and its complement of meeting and ballroom space. If the right hotel is added with its own
ballroom, space at Monona Terrace will be utilized as exhibit and conference space and the combined array of
spaces at both the hotel and at Monona Terrace will allow market expansion.
LOST EVENT BUSINESS
The Greater Madison Convention and Visitors Bureau provided records of lost business from bookings for
2008 through 2017. Table 6-10 summarizes those lost opportunities, from a total of 474 leads. These events
reflect lost opportunities market-wide, not just from Monona Terrace.

6 East Monroe Street | Fifth Floor | Chicago, Illinois 60603 | Phone: 312.447.2010 | Fax: 312.444.1125
www.chjc.com | [email protected]
Section VI Hotel Market Analysis & Review of Monona Terrace | December 2012 Madison Hotel Feasibility Study – Madison, WI
PAGE 106
Table 6-10
Madison, WisconsinSummary of Lost Convention/ Meeting Business
Year# of Events
Lost# of
Attendees# of Room
Nights
Est. Economic Impact
($Millions)
2008 13 12,010 4,760 $3.62009 71 61,480 37,904 22.12010 97 66,050 83,683 37.32011 94 78,375 91,773 44.12012 94 116,531 111,988 54.22013 50 50,651 76,314 33.42014 29 58,420 36,156 18.82015 15 24,750 44,148 22.42016 9 15,510 34,575 15.42017 2 1,300 2,535 1.6
Total 474 485,077 523,836 $253.0
Source: Greater Madison CVB, Johnson Consulting
As reported by the CVB, for the 10-year booking period, there are 474 events lost, resulting in loss of over
485,000 attendees, over 523,800 room nights, and $253 million of economic impact for the entire market.
The average event size lost is 1,023 attendees, for all events considered. These large size events are the ones
of greatest value to the city. This analysis does not include events that do not even investigate the market
because of knowledge that the center and/or hotel supply do not support their event.
Figure 6-28 breakdowns lost business by reasons cited in their withdrawals. In CVB records, there are 31
reasons, which in the following figures are combined into 11 groups of similar issues.

6 East Monroe Street | Fifth Floor | Chicago, Illinois 60603 | Phone: 312.447.2010 | Fax: 312.444.1125
www.chjc.com | [email protected]
Section VI Hotel Market Analysis & Review of Monona Terrace | December 2012 Madison Hotel Feasibility Study – Madison, WI
PAGE 107
Figure 6-28
Madison, WisconsinLost Business by Reasons Cited (from 474 Lost Events 2008-2017)
Loss Code Group
Lost Code
DefinitionLoss Code Group
Lost Code
Definition
00 1 No connecting hotel 60 60 Insufficient exhibit space2 Require sleeping and meeting rooms under one roof 61 Lack of available meeting space
10 10 Conflicting events at desired times 70 70 Total cost of coming to Madison too high14 Date scheduling conflict 72 Meeting space too expensive at AEC
20 20 Insufficient number hotel rooms in area 74 Meeting space too expensive at MT21 Madison headquarter hotel block not large enough 76 Competition offered cash incentive22 Room rates too high 78 Competition offered other incentive23 Lack of sleeping room availability 80 80 Demographics, area population25 Not enough hotels bidding 81 Chose to remain in current facility or city
27 27 Lack of local funding 82 Weather30 30 Not enough community support 83 Considering Madison for different year40 40 Not enough direct flights into Madison 85 Entire event canceled50 50 Not enough meeting space at hotel 86 Client is unresponsive
52 Not enough meeting space at AEC 87 Lack of decision maker interest54 Not enough meeting space at MT 88 Geographic or Rotation
99 99 OtherNotes:
MT = Monona Terrace
AEC = Alliant Energy Center
Source: Greater Madison CVB, Johnson Consulting
0.0%
5.0%
10.0%
15.0%
20.0%
25.0%
30.0%
35.0%
40.0%
45.0%
% o
f T
ota
l
% Reasons Cited 3.9% 4.6% 14.6% 0.6% 1.3% 2.3% 1.5% 1.2% 13.5% 40.8% 15.6%
% Attendees 4.4% 10.9% 13.3% 1.3% 0.6% 1.4% 4.7% 1.6% 10.2% 40.7% 10.9%
% Room Nights 4.6% 6.1% 22.3% 1.2% 0.7% 2.0% 2.4% 2.4% 12.2% 33.7% 12.3%
% Economic Impact 5.9% 5.7% 21.9% 0.7% 0.7% 2.1% 2.6% 1.7% 11.7% 35.1% 11.9%
00 10 20 27 30 40 50 60 70 80 99
As shown in the figure, from 474 event lost in 2008-to-2017 bookings, hotel-related reasons (Group 20) are
the reasons for the second highest lost business as measured in number of attendees, room nights, and

6 East Monroe Street | Fifth Floor | Chicago, Illinois 60603 | Phone: 312.447.2010 | Fax: 312.444.1125
www.chjc.com | [email protected]
Section VI Hotel Market Analysis & Review of Monona Terrace | December 2012 Madison Hotel Feasibility Study – Madison, WI
PAGE 108
economic impact; second only the reasons that are beyond the city’s control such as weather, rotation, etc
(Group 80). Therefore, development of the appropriate sized hotel is the number one variable the city can
influence.
As a sub-set of Table 6-10 and Figure 6-28, Table 6-11 shows the lost opportunities that specifically cited
hotel-related reasons (Group 20), regardless of venue listed (Monona Terrace, Hotel, and/or Alliant Energy
Center). This highlights that there are bigger hotel supply and quality issues at hand that can be partially
addressed by the addition of a new headquarters hotel to support Monona Terrace. This will support Monona
Terrace in reaching the room block size needed to recapture turned away events and compete for events that
have so far not even considered Madison as a viable destination. Additionally, with a larger and higher quality
room supply, other hotels will benefit from the recapture of other lost business that was categorized
specifically for a hotel facility or the Alliant Energy Center.
Table 6-11
Madison, WisconsinSummary of Lost Convention/ Meeting Business Due to Hotel-
Related Reasons
Year# of Events
Lost# of
Attendance# of Room
Nights
Est. Economic Impact
($Millions)
2008 2 385 190 $0.22009 10 6,825 8,044 4.12010 17 8,946 16,083 8.22011 20 22,190 20,522 12.02012 9 5,860 10,613 5.52013 4 5,550 10,751 3.52014 5 4,900 11,046 4.32015 4 11,000 21,277 11.32016 5 12,310 29,050 12.42017 0 0 0 0.0
76 77,966 127,576 $61.5
Source: Greater Madison CVB
As shown in the table, from 2008 through 2017 bookings, there are 76 lost opportunities, which are
anticipated to have had generated nearly 78,000 attendees, 127,600 room nights, and $61.5 million economic
impact.
Figure 6-12 shows a further sub-set of the previous tables, showing lost opportunities that specifically cited
hotel-related reasons and specifically affected Monona Terrace.
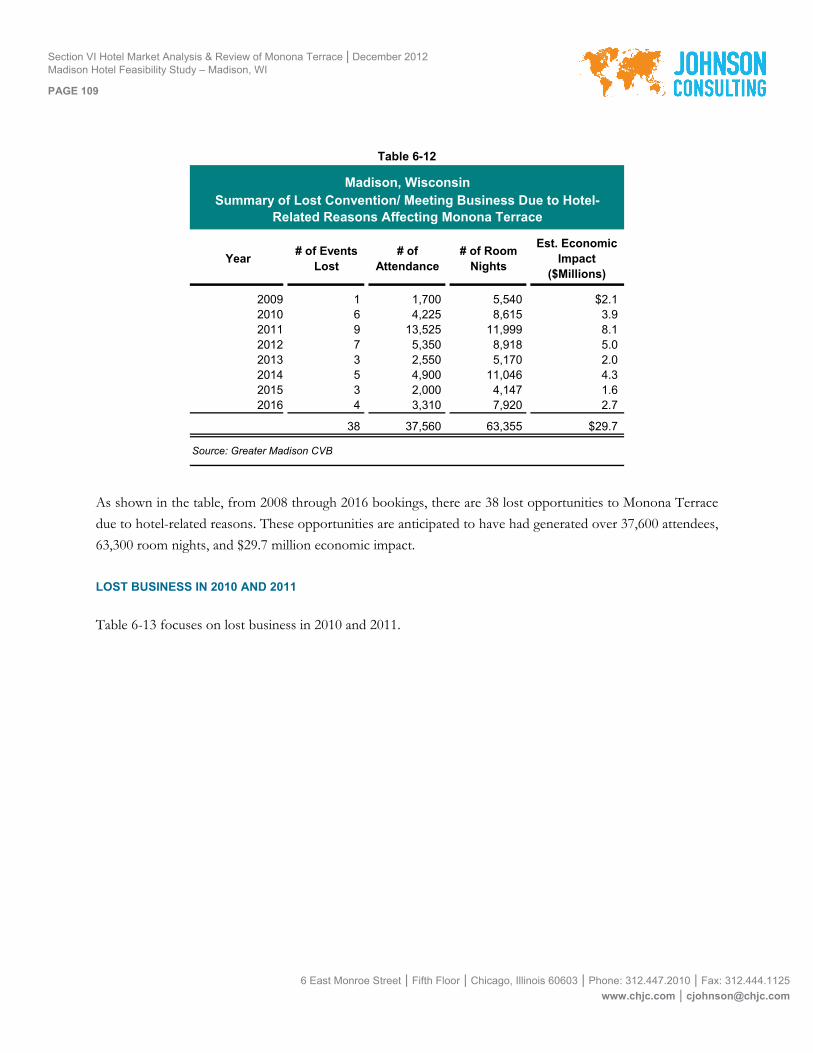
6 East Monroe Street | Fifth Floor | Chicago, Illinois 60603 | Phone: 312.447.2010 | Fax: 312.444.1125
www.chjc.com | [email protected]
Section VI Hotel Market Analysis & Review of Monona Terrace | December 2012 Madison Hotel Feasibility Study – Madison, WI
PAGE 109
Table 6-12
Madison, WisconsinSummary of Lost Convention/ Meeting Business Due to Hotel-
Related Reasons Affecting Monona Terrace
Year# of Events
Lost# of
Attendance# of Room
Nights
Est. Economic Impact
($Millions)
2009 1 1,700 5,540 $2.12010 6 4,225 8,615 3.92011 9 13,525 11,999 8.12012 7 5,350 8,918 5.02013 3 2,550 5,170 2.02014 5 4,900 11,046 4.32015 3 2,000 4,147 1.62016 4 3,310 7,920 2.7
38 37,560 63,355 $29.7
Source: Greater Madison CVB
As shown in the table, from 2008 through 2016 bookings, there are 38 lost opportunities to Monona Terrace
due to hotel-related reasons. These opportunities are anticipated to have had generated over 37,600 attendees,
63,300 room nights, and $29.7 million economic impact.
LOST BUSINESS IN 2010 AND 2011
Table 6-13 focuses on lost business in 2010 and 2011.

6 East Monroe Street | Fifth Floor | Chicago, Illinois 60603 | Phone: 312.447.2010 | Fax: 312.444.1125
www.chjc.com | [email protected]
Section VI Hotel Market Analysis & Review of Monona Terrace | December 2012 Madison Hotel Feasibility Study – Madison, WI
PAGE 110
Table 6-13
Madison, WisconsinSummary of Lost Convention/ Meeting Business
Attendance Room Nights
Year# of Events
Lost# of
AttendeesAverage
Attendees# of Room
NightsAverage
Room Nights
Est. Economic Impact
($Millions)
2008 13 12,010 924 4,760 366 $3.62009 71 61,480 866 37,904 534 22.12010 97 66,050 681 83,683 863 37.3
2011 94 78,375 834 91,773 976 44.12012 94 116,531 1,240 111,988 1,191 54.22013 50 50,651 1,013 76,314 1,526 33.42014 29 58,420 2,014 36,156 1,247 18.82015 15 24,750 1,650 44,148 2,943 22.42016 9 15,510 1,723 34,575 3,842 15.42017 2 1,300 650 2,535 1,268 1.6
Total 474 485,077 523,836 $253.0
Average in 2010 and 2011 96 72,213 756 87,728 919 $41
Source: Greater Madison CVB, Johnson Consulting
In 2010 and 2011, 191 events were lost in the Madison market. Madison lost an average of approximately
87,700 room nights per year, with the average event having an estimated room night impact of 919 rooms
over the stay of the event.
Table 6-14 and Figure 6-29 shows a breakdown of lost business in 2010 and 2011 by the size of peak room
nights, in 100-room increments.

6 East Monroe Street | Fifth Floor | Chicago, Illinois 60603 | Phone: 312.447.2010 | Fax: 312.444.1125
www.chjc.com | [email protected]
Section VI Hotel Market Analysis & Review of Monona Terrace | December 2012 Madison Hotel Feasibility Study – Madison, WI
PAGE 111
Table 6-14
Madison, WisconsinLost Business by Peak Room Nights (2010 and 2011 Average)
Peak Room Nights# of Lost Events
# of Attendees
# of Room Nights
Est. Economic
Impact
1 - 100 33 6,013 4,483 $2.7101 - 200 24 9,145 11,140 5.9201 - 300 13 7,035 9,769 4.8301 - 400 10 16,250 18,655 7.6401 - 500 9 10,475 11,358 6.5501 - 600 2 3,050 4,129 1.8601 - 700 3 5,770 13,301 3.7701 - 800 2 3,600 5,385 2.8801 - 900 1 1,375 2,958 1.5901 - 1,000 1 2,500 2,013 0.6
1,001 or more 1 7,000 4,540 2.8
Total 96 72,213 87,728 $40.7
Source: Greater Madison CVB, Johnson Consulting
The gray area represents events sized for Monona Terrace. Smaller events are sized for hotels, including the
proposed headquarters hotel.

Section VI Hotel Market Analysis & Review of Monona Terrace | December 2012 Madison Hotel Feasibility Study – Madison, WI
PAGE 112
Figure 6-29
Madison, WisconsinLost Business by Size of Peak Room Nights (Averaged from 2010 and 2011 Bookings)
Source: Greater Madison CVB, Johnson Consulting
0
20
40
60
80
100
Lost Events 33 24 13 10 9 2 3 2 1 1 1
Attendance (000) 6.0 9.1 7.0 16.3 10.5 3.1 5.8 3.6 1.4 2.5 7.0
Room Nights (000) 4.5 11.1 9.8 18.7 11.4 4.1 13.3 5.4 3.0 2.0 4.5
Est. Impact ($M) $2.7 5.9 4.8 7.6 6.5 1.8 3.7 2.8 1.5 0.6 2.8
Cumm. Room Nights 4.5 15.6 25.4 44.0 55.4 59.5 72.8 78.2 81.2 83.2 87.7
1-100 101-200 201-300 301-400 401-500 501-600 601-700 701-800 801-900 901-1000 1001+

6 East Monroe Street | Fifth Floor | Chicago, Illinois 60603 | Phone: 312.447.2010 | Fax: 312.444.1125
www.chjc.com | [email protected]
Section VI Hotel Market Analysis & Review of Monona Terrace | December 2012 Madison Hotel Feasibility Study – Madison, WI
PAGE 113
The table and figure suggest that events requesting over 301 peak rooms have the greatest impact, as
evidenced by the combined potential of attendance, room nights, and estimated economic impact, especially
when compared to the number of events itself. Beyond that 301-to-400 peak room bracket, the increase in
attendance, room nights, and economic impact loss diminishes. Given that the current room block is not
regularly able to support these types of events adequately, additional room supply that can be relied upon as
part of the room block is necessary. Therefore, adding a new hotel and modifying room block strategies in
existing hotels so that the City can accommodate up to 401-500 peak room nights regularly and consistently,
is where help is most needed for Madison.
CONCLUSION
Madison lodging activities grew by 4.4 percent annually from 1992 – 2011. This is healthy growth and is
attributed to ADR increases as well as room supply increases. Downtown Madison hotels historically perform
better than the rest of Madison hotels and enjoyed comparable ADR rates to its peer cities. In 2011, for
example occupancy and average daily rates for the downtown hotel comp set far exceeds the market overall.
Additionally, there were seven months where the downtown demand exceeds seventy percent, and to
reiterate typically demand in excess of seventy percent indicates unaccommodated demand.
Downtown Madison is a desirable and a preferred location by visitors to the city. The addition of the 194-
room Hampton Inn and the expansion and upgrade of Edgewater Hotel will reinforce this preference but will
be a minor factor in addressing the available room block for Monona Terrace due to their distance from the
center.
There is capacity at Monona Terrace for more conventions and conferences Pursuing events that are longer
and larger will create the greatest impact. To achieve this however will require a larger room block size, but
the geographic location of hotels in Madison makes room blocks very hard to assemble. As described earlier,
currently only the 240-room Hilton Madison Monona Terrace has a room block agreement with the City. The
Hilton agrees to commit a minimum room block of 150 rooms (or 62.5 percent of room capacity) on peak
night(s), based on availability at the time of booking. Considering the only existing room block agreement is
with Hilton, a minimum of an additional 250 rooms are needed to reach the minimum 400 room block target.
For a hotel to offer a 250-room block at a 62.5 percent ratio (like at the Hilton), its size has to be 400 rooms.
However, rather than offering a 400 room block in two separate properties, offering a larger block in a single
property is preferable. To achieve a larger room block commitment a ratio greater than 62.5 percent is
required and it is not uncommon in the industry to find room block requirements of 80 percent. Therefore, if
a new Headquarters Hotel were to accommodate 400 peak rooms in its single property, its size needs to be
500 rooms.
6 East Monroe Street | Fifth Floor | Chicago, Illinois 60603 | Phone: 312.447.2010 | Fax: 312.444.1125
www.chjc.com | [email protected]
Section VI Hotel Market Analysis & Review of Monona Terrace | December 2012 Madison Hotel Feasibility Study – Madison, WI
PAGE 114
The proposed addition of an adjacent headquarters hotel will address many of the reasons cited for lost
business. From 2008-2017, Madison has lost 474 events worth over $253 million in economic impact.
Specifically, at Monona Terrace during that same time period 76 events and over $61 million in economic
impact were lost as well as incalculable amount of building revenue.
It is very likely too that a substantial share of potential business, in addition to lost business, has not even
considered Madison in past years because event planners know there are insufficient hotel room blocks for
their events. These events have not been recorded as lost business because an initial inquiry was never made.
Although it is not possible to determine the extent of this latent business, it could add significantly to the
amount of lost business actually recorded. Local corporations also have latent demand, demand that would
come or be created if the right mix of hotel and meeting space were provided.

6 East Monroe Street | Fifth Floor | Chicago, Illinois 60603 | Phone: 312.447.2010 | Fax: 312.444.1125
www.chjc.com | [email protected]
SECTION VII
HOTEL PROGRAM & OPERATING PROJECTIONS

6 East Monroe Street | Fifth Floor | Chicago, Illinois 60603 | Phone: 312.447.2010 | Fax: 312.444.1125
www.chjc.com | [email protected]
Section VII Hotel Operating Projections | December 2012
Monona Terrace HQ Hotel Analysis – Madison, WI
PAGE 115
HOTEL OPERATING PROJECTIONS
This section projects demand, occupancy, average daily rates, as well as operating income and expenses for
the proposed new hotel in Madison, to be developed in close proximity to Monona Terrace, and compiles the
results into a ten-year pro forma. The analysis focuses on a 500-room hotel. Section 8 analyzes the impact of
a 300, 400 and 500 room hotel. While a hotel smaller than 500 rooms can be considered because of site
capacity and cost reasons, a 500 room hotel best solves the room block issue, addresses capacity issues at
Monona Terrace and exploits the last, close site (Judge Doyle Square) to Monona Terrace to achieve
additional rooms to serve Monona Terrace.
RECOMMENDED HOTEL PROGRAM
Based on discussions in Section 5 and Section 6 of this report, the recommended program for the new
Headquarters Hotel includes a top meeting brand affiliated hotel with approximately 500 rooms with a
minimum of 30,000 to 40,000 square feet of divisible ballroom space configured into separate main and
junior ballrooms and 10,000 to 20,000 square feet of meeting rooms for a total of 50,000 square feet of
function space (or 100 square feet per room). This amount of ballroom and meeting room space will allow
the Hotel to co-host events with Monona Terrace, serving as an “expansion” of the convention facility. The
hotel should be first-class, chain-affiliated operation.
DEMAND ANALYSIS
Given the assessment of supply discussed in Section 5, lodging demand growth is analyzed in order to predict
the environment for success for the proposed Headquarters Hotel. Currently, the 240-room Hilton Madison
is located in close proximity to Monona Terrace. Time and experience has shown that this property is too
small. By the time its corporate and top tier customers are served, often not enough rooms are left for room
blocks or the room blocks are offered at rates conventions will not accept. A new hotel is needed to support
Monona Terrace to be able to host larger conventions and compete with other centers in the region. These
considerations are reflected in the projections below.
SUMMARY OF HISTORICAL LODGING TRENDS
Table 7-1 summarizes historical lodging trends in city-wide Madison and the existing competitive set to the
proposed hotel. These trends serve as the basis of the Hotel projections and were previously discussed in
greater detail in Section 5 of this report.

6 East Monroe Street | Fifth Floor | Chicago, Illinois 60603 | Phone: 312.447.2010 | Fax: 312.444.1125
www.chjc.com | [email protected]
Section VII Hotel Operating Projections | December 2012
Monona Terrace HQ Hotel Analysis – Madison, WI
PAGE 116
Table 7-1
Historical Lodging TrendsMadison City-Wide, Competitive Set Properties, and National Comparable Properties
2005 2006 2007 2008 2009 2010 2011
OccupancyCity-wide 56.4% 61.2%Competitive Set 71.0% 72.7% 72.0% 64.9% 65.0% 69.0%Peer Properties in Comparable Markets 73.4% 69.8% 67.8% 63.2% 68.7% 68.6%
ADRCity-wide $85.80 $89.17Competitive Set $114.22 $118.55 $126.07 $123.75 $126.39 $127.97Peer Properties in Comparable Markets $144.80 $154.26 $155.48 $141.06 $137.99 $140.57
RevPARCity-wide $48.37 $54.56Competitive Set $81.05 $86.22 $90.78 $80.33 $82.12 $88.24Peer Properties in Comparable Markets $106.36 $107.68 $105.36 $89.11 $94.84 $96.49
Supply (000's)City-wideCompetitive Set 323 323 323 323 365 378Peer Properties in Comparable Markets 727 792 881 881 881 898
Demand (000's)City-wideCompetitive Set 229 235 233 210 237 260Peer Properties in Comparable Markets 534 553 597 557 606 616
Revenues ($Millions)City-wide $88.9 $92.7 $96.6 $83.5 $92.6 $103.8Competitive Set $26.2 $27.9 $29.3 $25.9 $29.9 $33.3Peer Properties in Comparable Markets $77.4 $85.3 $92.9 $78.5 $83.6 $86.6
Source: Smith Travel Research, Johnson Consulting
As shown in the table, city-wide occupancy was 61.2 percent in 2011, and average daily rate was $88.17. For
the competitive set (Set #1 in Section 5), which includes 356-room Madison Concourse Hotel, 240-room
Hilton Madison Monona Terrace, 214-room Best Western Plus Inn On The Park, 151-room Hyatt Place
Madison Downtown, 74-room Campus Inn, average occupancy was 69 percent in 2011, and average daily rate
was $127.97. These reflect average decline of 0.6 percent in occupancy and average growth of 2.3 percent in
ADR from 2009. Even with the new Hampton Inn and the renovation of the Edgewater, just inducing and
serving new demand will be accomplished. Very little effect on the capacity to host more and larger events
will be accomplished by these additions.
SEGMENTATION
Table 7-2 shows the estimated segmentation of the Madison hotel market, based on interviews with the local
hotel community, the CVB, and confirmed by us during our field work. Of the hotels analyzed, the Hilton
was the top performer in the market in terms of both rate and occupancy, indicating two factors: It is very

6 East Monroe Street | Fifth Floor | Chicago, Illinois 60603 | Phone: 312.447.2010 | Fax: 312.444.1125
www.chjc.com | [email protected]
Section VII Hotel Operating Projections | December 2012
Monona Terrace HQ Hotel Analysis – Madison, WI
PAGE 117
successful and less inclined to provide room blocks to Monona Terrace; and newer, branded properties
perform well, especially of they have the demand generator provided by Monona Terrace located nearby.
Table 7-2
Madison Market Segmentation
Market Share
Corporate 19.0%Group 44.0%Leisure 37.0%
Total 100.0%
Source: Johnson Consulting
Madison market is mostly reliant upon the group travelers. Leisure segment comes a close second, followed
by corporate segment. The following briefly describes the market segments.
Commercial/ Corporate Segment - The commercial segment consists of those who are traveling for
business purposes. Sales visits, research, small training sessions, and executive education are all
considered to be in the commercial segment. Most commercial travelers will fly to a market and rent
a car for local transportation. It is estimated that the commercial market makes up approximately 19
percent of the room night demand in the market and have generated approximately 49,495 room
nights in 2011 for the Competitive Set #1.
Group Market – The group segment consists of those visiting the area either as part of an
association, SMERF (social, military, education, religious, or fraternal), or corporate conventions or
tradeshows. It also includes other corporate group functions, university conferences, as well as tour
bus demand although these are sometimes counted as leisure travelers. It is estimated that the group
segment currently accounts for 44 percent of the market demand and have generated approximately
114,619 room nights in 2011.
Leisure Segment - The leisure segment consists of individuals, couples, families, or small groups that
travel for pleasure or to visit friends or family. In the Madison market, it is estimated that the leisure
segment accounts for 37 percent of the hotel market and have generated approximately 96,384 room
nights in 2011.
This is a balanced demand cross-section and shows that the market is attractive to group, leisure and
commercial business.

6 East Monroe Street | Fifth Floor | Chicago, Illinois 60603 | Phone: 312.447.2010 | Fax: 312.444.1125
www.chjc.com | [email protected]
Section VII Hotel Operating Projections | December 2012
Monona Terrace HQ Hotel Analysis – Madison, WI
PAGE 118
LATENT DEMAND
Latent demand is defined as potential room night demand that either cannot be accommodated by the
existing supply or would be induced to the market with additions to supply. Both components of this demand
are described below.
Unaccommodated Demand
Unaccommodated demand is defined as demand that would have been captured by the market, but for a lack
of available rooms. This demand is therefore deferred to later dates, accepts lesser accommodations, moves
just outside the metro area, moves its business to another metro area, or cancels plans altogether. As new
properties are added to the market, it is expected that any unaccommodated demand will be accommodated
in the new supply.
In most markets, average monthly demand in excess of 70 percent indicates unaccommodated demand.
Madison market as a whole is not experiencing unaccommodated demand, but as shown in Figure 7-1 below,
the Madison Downtown Competitive set operates much differently with 11 months from 2010 to 2011 in
which occupancy was 70 percent or higher. A new hotel that induces demand to the market will not only help
absorb existing demand and future growth in the market, but it will also be a demand generator for corporate
and association meeting business that is currently held elsewhere.
Figure 7-1
Madison, WisconsinHistorical Monthly Occupancy, Jan 2010-Dec 2011
Source: Smith Travel Research, Madison WI Convention and Visitors Bureau
0%
10%
20%
30%
40%
50%
60%
70%
80%
90%
100%
Jan
'10
Feb
Mar
Apr
May
Jun
Jul
Aug
Sep Oct
Nov
Dec
Jan
'11
Feb
Mar
Apr
May
Jun
Jul
Aug
Sep Oct
Nov
Dec
City-Wide
Comp Set #1
Comp Set #2

6 East Monroe Street | Fifth Floor | Chicago, Illinois 60603 | Phone: 312.447.2010 | Fax: 312.444.1125
www.chjc.com | [email protected]
Section VII Hotel Operating Projections | December 2012
Monona Terrace HQ Hotel Analysis – Madison, WI
PAGE 119
When translated to numbers, unaccommodated demand during the months in which occupancy is over 70
percent is estimated to average a minimum of 17,300 room nights annually in the primary competitive set. It
is believed that this amount is substantially higher, as many people would choose the downtown area over
outlying areas if a new brand affiliated property were present, shifting demand into the Central Business
District from outlying areas.
Induced Demand
Induced demand is defined as demand that is attracted to a market due to the addition of a demand
generator. The expansion of a local major business, or opening/expansion/ renovation of a convention
center, in house meeting space at a new hotel, and/or the development of a critical mass of unique shopping
and/or dining destinations are all examples of demand generators. Indeed, Monona Terrace has been the
primary group demand generator in the market. The proposed Headquarters Hotel would also induce
significant demand into the market and maximize the ability of convention and conference facilities such as
Monona Terrace and Alliant Energy Center to host groups. The primary source of this demand would be
group business and recapture of suburban demand.
POTENTIAL DEMAND
While there currently does not appear to be much unaccommodated demand in the market, as the economy
continues to recover, and if the Edgewater and Hampton Inn accomplish their objectives, which is expected,
demand will continue to be in balance with or outpace hotel room supply for several years, especially during
peak periods of the year and when larger conventions come to the market and during the popular leisure
months of spring, summer and fall. We also expect that there will be many more groups that can be
accommodated in or will consider Monona Terrace, especially if a new hotel with substantial meeting and
ballroom space is provided. This incremental demand can be partially accommodated by the development of
an additional hotel within close proximity to the Monona Terrace. In turn, the addition of the hotel will
induce more demand to the market itself primarily in the group sector and help maximize the ability of
Monona Terrace and Alliant Energy Center to host events. An additional hotel will be able to accommodate a
portion of this demand, but overflow demand will be pushed to other area hotels, benefiting the market. We
know this phenomenon is factual. As was shown in Section 5, and based on conversations with the CVB and
the manager at the Ft. Worth Convention Center, the new Omni there caused a wave of development and has
improved room inventory to increase and improve in quality since its opening. Now over 2,000 rooms serve
the convention center and even during the recession, the property is the rate and occupancy leader.
GROUP DEMAND FROM MONONA TERRACE
As has been noted throughout this report, Monona Terrace is comparatively small for its market. Expansion
is prohibitive and the proposed hotel site is close enough to provide and “expansion” of sorts to the complex.

6 East Monroe Street | Fifth Floor | Chicago, Illinois 60603 | Phone: 312.447.2010 | Fax: 312.444.1125
www.chjc.com | [email protected]
Section VII Hotel Operating Projections | December 2012
Monona Terrace HQ Hotel Analysis – Madison, WI
PAGE 120
Ballroom space and meeting space is essential for this specific property, and if the room block agreement is
structured properly, and the hotel is managed in a way that serves the Convention Center (dictated by the
room block agreement), it will structurally enhance the way Monona Terrace and its support properties can
attract business. The group segment is discussed in greatest detail because it is expected to be the primary
source of room night demand for the new Hotel. In convention and meetings market competition, Madison
has the advantage of being the capital city of Wisconsin. This makes the City one of the “must” locations for
rotating state events. The urban attractiveness of the City as well as the presence of UW will make the City
attractive for regional, national, and international groups as well.
PROJECTION OF OCCUPANCY AND AVERAGE DAILY RATE
As stated earlier in this report, the Hotel is assumed to be a 500-room hotel and will begin marketing as soon
as financing is in place. For analytical purposes, it is assumed that the Hotel will open in January 2015. Prior
to that, two hotels are scheduled to add room as well. First, 194-room Hampton Inn is scheduled to open in
the Fall of 2013 (assumed to be October 1st for analytical purposes). Subsequently, Edgewater Hotel is
scheduled to add 82 rooms in he late Spring of 2014 (assumed to be May 1st for analytical purposes). Table 7-
3 shows the calculation for estimating the additional room nights resulted from these three hotels. Then, on
the next page, Table 7-4 displays estimated future growth in demand by segment, from 2009 through 2019.
The projections assume that there is no new hotel in the downtown area other than the Hampton Inn,
Edgewater Hotel, and the new Headquarters Hotel during the ten-year projection period.

Section VII Hotel Operating Projections | December 2012
Monona Terrace HQ Hotel Analysis – Madison, WI
PAGE 121
Table 7-3
Estimated Competitive Set Supply Growth
2009 2010 2011 2012 2013 2014 2015* 2016 2017 2018 2019
Available Room Nights of Prior Year 377,775 395,478 468,538
Additions:
1. Hampton Inn (194 rooms)opens in Fall 2013 (assumed to be Oct 1, 2013)
New Room Nights in 2013 (only 3 months: Oct thru Dec) 17,703New Room Nights in 2014 (the remaining of full year's worth) 53,108(Full-year's worth of room nights = 194 x 365 = 70,810)
2. Edgewater Hotel (additional 82 rooms)opens in late Spring 2014 (assumed to be May 1, 2014)
New Room Nights in 2014 (only 8 months: May thru Dec) 19,953New Room Nights in 2015 (the remaining of full year's worth) 9,977(Full-year's worth of room nights = 82 x 365 = 29,930)
3. Headquarters Hotel (500 rooms) opens in Jan 1, 2015New Room Nights in 2015 (full-year's worth, because it opens in Jan 1) 182,500
Available Room Nights** 323,025 364,550 377,775 377,775 395,478 468,538 661,015 661,015 661,015 661,015 661,015Annual Growth 12.9% 3.6% 0.0% 4.7% 18.5% 41.1% 0.0% 0.0% 0.0% 0.0%
*The proposed Headquarters Hotel is expected to open near the beginning of 2015.**Hampton Inn (194 rooms) is scheduled to open in Fall of 2013. Edgewater Hotel expansion (adding 82 rooms) is scheduled to open in late Spring of 2014.Source: Smith Travel Research, Johnson Consulting

Section VII Hotel Operating Projections | December 2012
Monona Terrace HQ Hotel Analysis – Madison, WI
PAGE 122
Table 7-4
Estimated Competitive Set Demand Growth by Segment
Demand Segment 2009 2010 2011 2012 2013 2014 2015* 2016 2017 2018 2019
Commercial Transient 27,962 31,583 34,736 35,636 36,888 41,999 50,399 55,439 58,211 59,957 60,856Annual Growth 12.9% 10.0% 2.6% 3.5% 13.9% 20.0% 10.0% 5.0% 3.0% 1.5%
Corporate Group 11,881 13,419 14,759 15,141 15,673 17,845 22,306 24,983 26,232 27,019 27,424Annual Growth 12.9% 10.0% 2.6% 3.5% 13.9% 25.0% 12.0% 5.0% 3.0% 1.5%
Group related to Monona Terrace 58,366 65,923 72,504 74,382 76,996 87,665 113,964 131,059 137,612 141,740 143,866Annual Growth 12.9% 10.0% 2.6% 3.5% 13.9% 30.0% 15.0% 5.0% 3.0% 1.5%
In-House Group 33,903 38,293 42,115 43,206 44,725 50,922 65,180 75,608 79,389 81,770 82,997Annual Growth 12.9% 10.0% 2.6% 3.5% 13.9% 28.0% 16.0% 5.0% 3.0% 1.5%
Leisure Group 16,545 18,688 20,553 21,086 21,827 24,851 28,578 30,722 32,258 33,226 33,724Annual Growth 12.9% 10.0% 2.6% 3.5% 13.9% 15.0% 7.5% 5.0% 3.0% 1.5%
Leisure Transient 61,044 68,949 75,831 77,796 80,530 91,688 105,441 113,349 119,016 122,587 124,425Annual Growth 12.9% 10.0% 2.6% 3.5% 13.9% 15.0% 7.5% 5.0% 3.0% 1.5%
Total 209,701 236,855 260,498 267,246 276,639 314,969 385,868 431,159 452,717 466,299 473,293Annual Growth 12.9% 10.0% 11.5% 3.5% 13.9% 22.5% 11.7% 5.0% 3.0% 1.5%
Absolute # of Rooms at Year-End 885 999 1,035 1,035 1,229 1,311 1,811 1,811 1,811 1,811 1,811
Available Room Nights** 323,025 364,550 377,775 377,775 395,478 468,538 661,015 661,015 661,015 661,015 661,015Annual Growth 12.9% 3.6% 0.0% 4.7% 18.5% 41.1% 0.0% 0.0% 0.0% 0.0%
Occupancy 64.9% 65.0% 69.0% 70.7% 70.0% 67.2% 58.4% 65.2% 68.5% 70.5% 71.6%Annual Growth 0.1% 6.1% 2.6% (1.1%) (3.9%) (16.5%) 11.7% 5.0% 3.0% 1.5%
*The proposed Headquarters Hotel is expected to open near the beginning of 2015.**Hampton Inn (194 rooms) is scheduled to open in Fall of 2013. Edgewater Hotel expansion (adding 82 rooms) is scheduled to open in late Spring of 2014.The numbers of room nights correspond to those shown in Table 7-3.Source: Smith Travel Research, Johnson Consulting

6 East Monroe Street | Fifth Floor | Chicago, Illinois 60603 | Phone: 312.447.2010 | Fax: 312.444.1125
www.chjc.com | [email protected]
Section VII Hotel Operating Projections | December 2012
Monona Terrace HQ Hotel Analysis – Madison, WI
PAGE 122
Table 7-3 shows that the Fall 2013 opening of 194-room Hampton Inn, late Spring 2014 addition of 82
rooms from Edgewater Hotel, and the January 2015 opening of 500-room Headquarters Hotel are estimated
to increase available room nights by 4.7 percent in 2013, 18.5 percent in 2014, and 41.1 percent in 2015.
Table 7-4 shows that the competitive set ended 2011 with an average occupancy of 69 percent, which was an
increase of 6.1 percent from the previous year. With no addition to supply in 2012, it is estimated that
occupancy will increase by 2.6 percent, which is the long-term, annual growth from 2006 through 2011. In
2013, the Fall opening of Hampton Inn is expexted to induce 3.5 percent of demand growth. In 2014, the full
operation of Hampton Inn and the late Spring addition of 82 rooms from Edgewater Hotel are expected to
induce 13.9 percent of demand growth.
As already pointed out, in 2015, the recommended 500-room Hotel (or minimum 400 rooms), which is
expected to open at the beginning of 2015, along with the first full year operation of the expanded Edgewater
Hotel, will increase the number of available room nights of the competitive set by 41.1 percent. To offset the
increase in supply, the Hotel is expected to be a demand driver that will generate demand for not just the
Monona Terrace and the Hotel itself, but for other properties as well. The hotel will attract larger events at
Monona Terrace and will sell events largest than it can serve internally. In addition, its place in the market will
be one that serves convention hotel groups, groups that are smaller than those targeted by the Monona
Terrace (for in-house meetings), and groups that need more space than the other area hotels can handle. This
phenomenon has been observed in a number of markets that have added new convention hotel properties,
including Ft. Worth, Texas and Baltimore, Maryland, as shown in Section 5 of this report. Additionally, after
1 year of operations, the Omni Dallas Headquarters hotel has posted an occupancy rate 8 percent ahead of
projections, while occupancy rates and average daily rates increased for the central city hotel supply, even as
the total hotel supply increased.
Johnson Consulting estimates that the Hotel will induce new demand into the market due to its strong
national sales force, unique quality and amenity package, and strategic location in close proximity to Monona
Terrace. We also believe that the above factors will help the in-house, new business for the Hotel even when
the Monona Terrace is not full. As a result, in-house group demand in the competitive set is expected to
increase by 28 percent in 2015; group related to Monona Terrace by 30 percent; corporate group up by 25
percent; corporate transient by 20 percent, and leisure up by 15 percent. Again, most increases will be related
to the opening of the Hotel. These increases will decline quickly as the Hotel establishes itself within the
market. Occupancy in the competitive set is expected to dip to 58.4 percent, as the Hotel will not be able to
induce all of the competitive set’s demand – as stated previously, the proposed Hotel will help create more
room nights than it can consume, but not as much as all of the competitive set can, short-term. However,
with continued growth in the competitive set demand, the average occupancy rate in competitive set is
expected to quickly recover and reach a healthy 71.6 percent by the Hotel’s fifth year of operation in 2019.

6 East Monroe Street | Fifth Floor | Chicago, Illinois 60603 | Phone: 312.447.2010 | Fax: 312.444.1125
www.chjc.com | [email protected]
Section VII Hotel Operating Projections | December 2012
Monona Terrace HQ Hotel Analysis – Madison, WI
PAGE 123
Figure 7-2 illustrates the occupancy estimates shown in previously in Table 7-4. The figure also shows a 500-
room Hotel impact on ADR, as well as a 400-room Hotel impact on both occupancy and ADR.
Figure 7-2
Madison, WisconsinImpact of a HQ Hotel on Market-wide Occupancy and ADR
Impact of 500-Rm HQ HotelOccupancy 64.9% 65.0% 69.0% 70.7% 70.0% 67.2% 58.4% 65.2% 68.5% 70.5% 71.6%ADR $123.75 $126.39 $127.97 $130.92 $133.93 $137.01 $144.26 $146.24 $148.48 $151.47 $154.90
Impact of 400-Rm HQ HotelOccupancy 64.9% 65.0% 69.0% 70.7% 70.0% 67.2% 58.7% 63.7% 67.0% 69.3% 70.7%ADR $123.75 $126.39 $127.97 $130.92 $133.93 $137.01 $143.64 $145.32 $147.11 $149.00 $150.90
*The proposed Headquarters Hotel is expected to open near the beginning of 2015.
Source: Smith Travel Research, Johnson Consulting
40
60
80
100
120
140
160
2009 2010 2011 2012 2013 2014 2015* 2016 2017 2018 2019
Occupancy (500-Rm) ADR (500-Rm)
Occupancy (400-Rm) ADR (400-Rm)
The chart shows that even though occupancy is expected to dip for the competitive set in the year that the
Headquarters Hotel opens, the market will quickly recover and reach a healthier level. It will also improve
overall ADR.
PENETRATION RATE ANALYSIS
Occupancy penetration is the ratio of a particular property’s actual room nights captured compared to its fair
share. Fair share is defined as the ratio of the property’s number of rooms to the total rooms in the defined
competitive supply. For example, if a hotel has 100 rooms and the market has 1,000 rooms, its ‘fair share’ of
business would be 10 percent of a market’s room nights. The ratio is then applied to the total market demand
by segment to measure the property’s actual room nights captured compared to its fair share of room nights.
Table 7-5 shows how the property would fare if it captured its fair share of the competitive set’s demand.
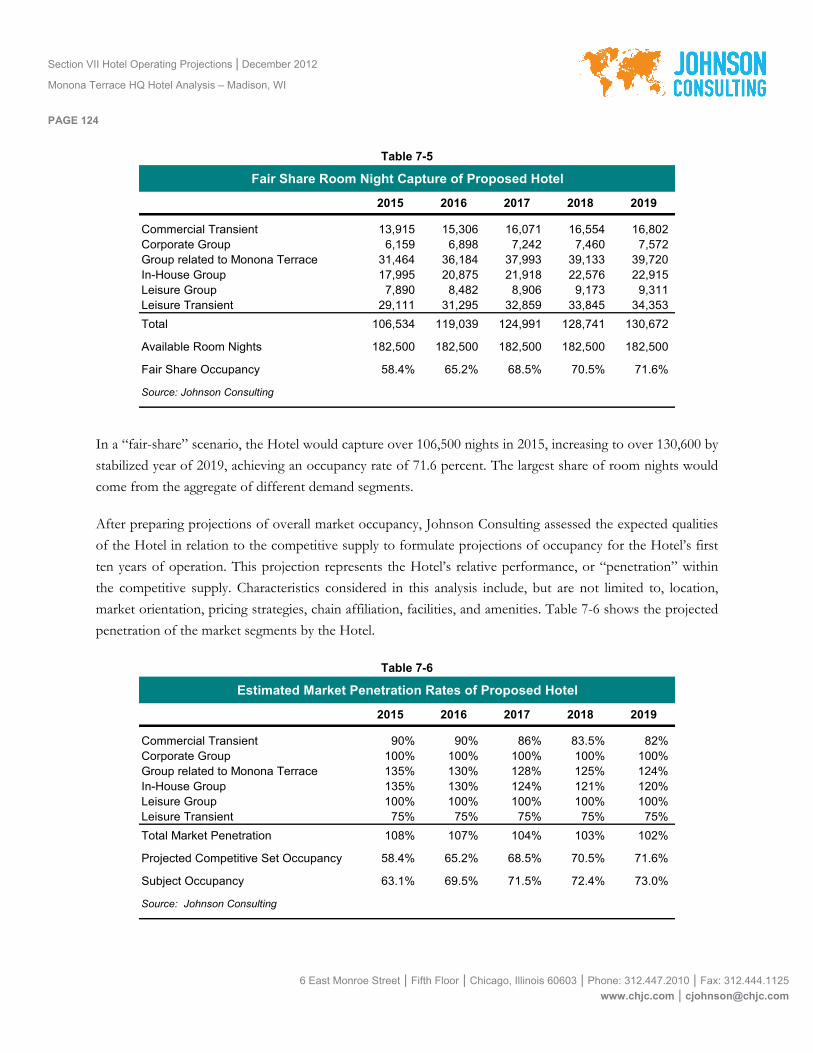
6 East Monroe Street | Fifth Floor | Chicago, Illinois 60603 | Phone: 312.447.2010 | Fax: 312.444.1125
www.chjc.com | [email protected]
Section VII Hotel Operating Projections | December 2012
Monona Terrace HQ Hotel Analysis – Madison, WI
PAGE 124
Table 7-5
Fair Share Room Night Capture of Proposed Hotel
2015 2016 2017 2018 2019
Commercial Transient 13,915 15,306 16,071 16,554 16,802Corporate Group 6,159 6,898 7,242 7,460 7,572Group related to Monona Terrace 31,464 36,184 37,993 39,133 39,720In-House Group 17,995 20,875 21,918 22,576 22,915Leisure Group 7,890 8,482 8,906 9,173 9,311Leisure Transient 29,111 31,295 32,859 33,845 34,353
Total 106,534 119,039 124,991 128,741 130,672
Available Room Nights 182,500 182,500 182,500 182,500 182,500
Fair Share Occupancy 58.4% 65.2% 68.5% 70.5% 71.6%
Source: Johnson Consulting
In a “fair-share” scenario, the Hotel would capture over 106,500 nights in 2015, increasing to over 130,600 by
stabilized year of 2019, achieving an occupancy rate of 71.6 percent. The largest share of room nights would
come from the aggregate of different demand segments.
After preparing projections of overall market occupancy, Johnson Consulting assessed the expected qualities
of the Hotel in relation to the competitive supply to formulate projections of occupancy for the Hotel’s first
ten years of operation. This projection represents the Hotel’s relative performance, or “penetration” within
the competitive supply. Characteristics considered in this analysis include, but are not limited to, location,
market orientation, pricing strategies, chain affiliation, facilities, and amenities. Table 7-6 shows the projected
penetration of the market segments by the Hotel.
Table 7-6
Estimated Market Penetration Rates of Proposed Hotel
2015 2016 2017 2018 2019
Commercial Transient 90% 90% 86% 83.5% 82%Corporate Group 100% 100% 100% 100% 100%Group related to Monona Terrace 135% 130% 128% 125% 124%In-House Group 135% 130% 124% 121% 120%Leisure Group 100% 100% 100% 100% 100%Leisure Transient 75% 75% 75% 75% 75%
Total Market Penetration 108% 107% 104% 103% 102%
Projected Competitive Set Occupancy 58.4% 65.2% 68.5% 70.5% 71.6%
Subject Occupancy 63.1% 69.5% 71.5% 72.4% 73.0%
Source: Johnson Consulting

6 East Monroe Street | Fifth Floor | Chicago, Illinois 60603 | Phone: 312.447.2010 | Fax: 312.444.1125
www.chjc.com | [email protected]
Section VII Hotel Operating Projections | December 2012
Monona Terrace HQ Hotel Analysis – Madison, WI
PAGE 125
The Hotel is expected to penetrate the market at 108 percent in Year 1 and 107 percent in Year 2 due to its
size, strategic location, national brand name, standards and rewards program, and its full-service amenities.
Subsequently, it is expected that this penetration level will decrease over the first five years to a stabilized
penetration level of 102 percent. The resulting Hotel occupancy is projected to be 63.1 percent in 2015,
increasing to 69.5 percent in 2016, 71.5 percent in 2017, 72.4 percent in 2018, and 73 percent in 2019. The
Hotel will excel at penetrating Monona Terrace group market, as it will be the primary headquarters hotel
(along with others). It will also excel at penetrating the in-house group market, as it will induce such groups
when Monona Terrace is not hosting a large event or co-house events with Monona Terrace.
Table 7-7 displays the projected occupied room nights by sector and the occupancy rate for the Hotel.
Table 7-7
Projected Occupied Room Nights of the Proposed Hotel
Demand Segment 2015 2016 2017 2018 2019% Recaptured
and/ or Induced
Commercial Transient 12,523 13,775 13,821 13,822 13,822 20.0%Annual Growth -- 10.0% 0.3% 0.0% 0.0%
Corporate Group 6,159 6,898 7,242 7,460 7,572 75.0%Annual Growth -- 12.0% 5.0% 3.0% 1.5%
Group related to Monona Terrace 42,477 47,039 48,631 48,916 49,253 75.0%Annual Growth -- 10.7% 3.4% 0.6% 0.7%
In-House Group 24,294 27,137 27,179 27,317 27,498 90.0%Annual Growth -- 11.7% 0.2% 0.5% 0.7%
Leisure Group 7,890 8,482 8,906 9,173 9,311 75.0%Annual Growth -- 7.5% 5.0% 3.0% 1.5%
Leisure Transient 21,833 23,471 24,644 25,384 25,765 60.0%Annual Growth -- 7.5% 5.0% 3.0% 1.5%
Total 115,176 126,802 130,425 132,072 133,220 69.5%Annual Growth -- 10.1% 2.9% 1.3% 0.9% (weighted avrg)
Available Room Nights 182,500 182,500 182,500 182,500 182,500
Occupancy 63.1% 69.5% 71.5% 72.4% 73.0%
Source: Johnson Consulting
Based on the estimated penetration rates for the growing group demand segment, as well as the leisure and
corporate markets, we project that the Hotel will capture more Monona Terrace-related room nights than
commercial transient guest room nights.
Table 7-8 shows the resulting stabilized demand mix for the Hotel.
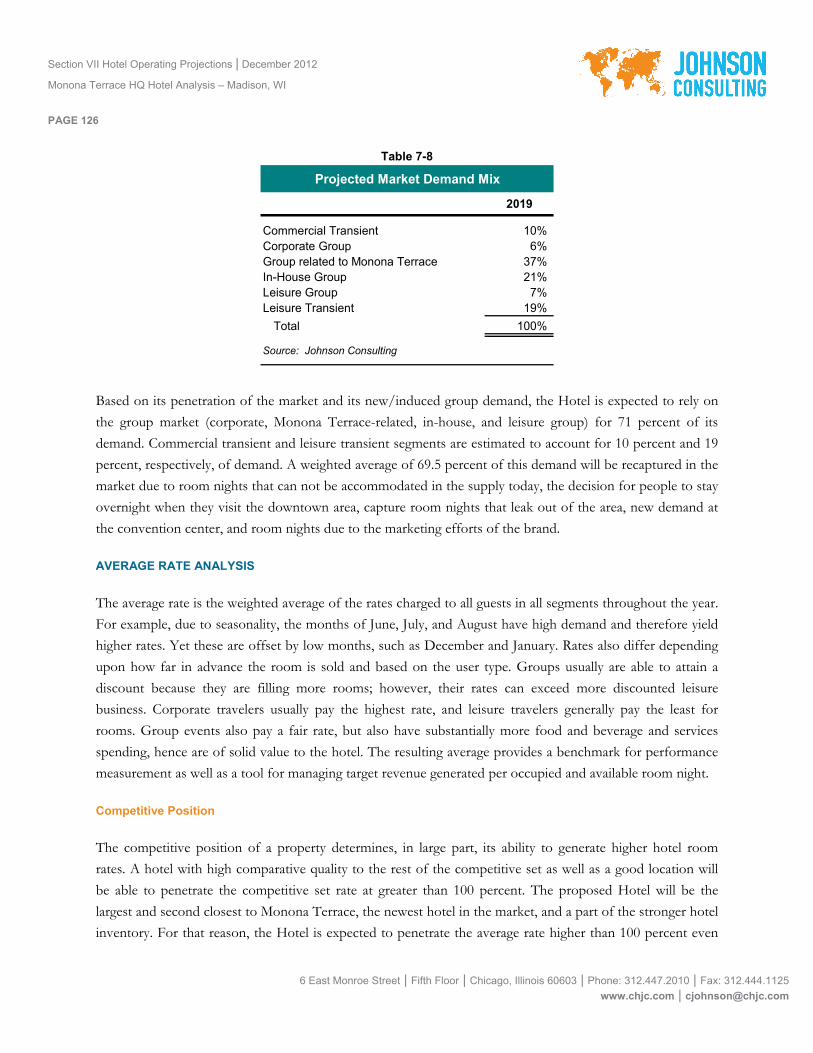
6 East Monroe Street | Fifth Floor | Chicago, Illinois 60603 | Phone: 312.447.2010 | Fax: 312.444.1125
www.chjc.com | [email protected]
Section VII Hotel Operating Projections | December 2012
Monona Terrace HQ Hotel Analysis – Madison, WI
PAGE 126
Table 7-8
Projected Market Demand Mix
2019
Commercial Transient 10%Corporate Group 6%Group related to Monona Terrace 37%In-House Group 21%Leisure Group 7%Leisure Transient 19%
Total 100%
Source: Johnson Consulting
Based on its penetration of the market and its new/induced group demand, the Hotel is expected to rely on
the group market (corporate, Monona Terrace-related, in-house, and leisure group) for 71 percent of its
demand. Commercial transient and leisure transient segments are estimated to account for 10 percent and 19
percent, respectively, of demand. A weighted average of 69.5 percent of this demand will be recaptured in the
market due to room nights that can not be accommodated in the supply today, the decision for people to stay
overnight when they visit the downtown area, capture room nights that leak out of the area, new demand at
the convention center, and room nights due to the marketing efforts of the brand.
AVERAGE RATE ANALYSIS
The average rate is the weighted average of the rates charged to all guests in all segments throughout the year.
For example, due to seasonality, the months of June, July, and August have high demand and therefore yield
higher rates. Yet these are offset by low months, such as December and January. Rates also differ depending
upon how far in advance the room is sold and based on the user type. Groups usually are able to attain a
discount because they are filling more rooms; however, their rates can exceed more discounted leisure
business. Corporate travelers usually pay the highest rate, and leisure travelers generally pay the least for
rooms. Group events also pay a fair rate, but also have substantially more food and beverage and services
spending, hence are of solid value to the hotel. The resulting average provides a benchmark for performance
measurement as well as a tool for managing target revenue generated per occupied and available room night.
Competitive Position
The competitive position of a property determines, in large part, its ability to generate higher hotel room
rates. A hotel with high comparative quality to the rest of the competitive set as well as a good location will
be able to penetrate the competitive set rate at greater than 100 percent. The proposed Hotel will be the
largest and second closest to Monona Terrace, the newest hotel in the market, and a part of the stronger hotel
inventory. For that reason, the Hotel is expected to penetrate the average rate higher than 100 percent even

6 East Monroe Street | Fifth Floor | Chicago, Illinois 60603 | Phone: 312.447.2010 | Fax: 312.444.1125
www.chjc.com | [email protected]
Section VII Hotel Operating Projections | December 2012
Monona Terrace HQ Hotel Analysis – Madison, WI
PAGE 127
with its higher reliance on group business. However, it will most likely discount rate somewhat in the first
year to establish a strong base of business.
Average Rate Increases
Average daily has continued to grow at an accelerated rate since 2006 and is expected to continue increasing
via an improved economy, natural growth, and due to the addition of the Hotel. This growth in demand
should help support further rate increases. Within the competitive set, the historical annual rate increase since
2006 through 2011 has been 2.3 percent annually.
Projected Average Daily Rate
Table 7-9 displays the projected average daily rate in the competitive set and the proposed Hotel’s penetration
and resulting rate.
Table 7-9
Average Daily Room Rate Projections
YearAnnual
IncreaseCompetitive
Set ADRHQ Hotel's ADR
PenetrationHQ Hotel's
ADR
2006 -- $114.222007 3.8% $118.552008 6.3% $126.072009 (1.8%) $123.75 -- -- 2010 2.1% $126.39 -- -- 2011 1.3% $127.97 -- -- 2012 2.3% $130.92 -- -- 2013 2.3% $133.93 -- -- 2014 2.3% $137.01 -- -- 2015 2.3% $140.16 110.0% $154.202016 0.0% $140.16 115.0% $161.202017 0.8% $141.23 118.0% $166.702018 1.5% $143.40 120.0% $172.102019 2.3% $146.69 120.0% $176.00
Note: Rates in 2006 through 2011 are as reported by Smith Travel Research
Source: Johnson Consulting
The competitive set’s average daily rate was $114.22 in 2006 and $127.97 in 2011, reflecting a 2.3 percent
compounded annual growth. We project rates to increase in the set as a whole by the same annual growth
rate, reaching $140.16 in 2015. We expect that given its location, market orientation, and quality, the
proposed Hotel will be able to penetrate the competitive set at 110 percent, leading to a first-year rate of

6 East Monroe Street | Fifth Floor | Chicago, Illinois 60603 | Phone: 312.447.2010 | Fax: 312.444.1125
www.chjc.com | [email protected]
Section VII Hotel Operating Projections | December 2012
Monona Terrace HQ Hotel Analysis – Madison, WI
PAGE 128
$154.20, compared with the competitive set rate of $140.16. The penetration is expected to increase and
stabilize at 120 percent, leading to a 2019 rate of $176.00 in 2019 dollars.
INFLATION ASSUMPTION
Inflation will be used to project income and expenses for the project after stabilization. The Consumer Price
Index is not necessarily the best measure of hotel inflation, as it takes into account prices for numerous goods
and services. Inflation in the hotel industry should take into account demand increases for travel and resulting
rate increases. Johnson Consulting analyzed historical rate increases in the competitive set in Table 7-10.
Table 7-10
Historic Average Daily Room Rate Changes
Hotel SetAnnual
Increase
Competitive Set (2006-2011) 2.3%
Source: Johnson Consulting
From 2006 through 2011, the annual average rate increase was 2.3 percent. Growth during non-recession
years is generally higher than this. Based on these figures and assuming that there is no further economic
contraction, we have estimated long-term rate increases of three percent.
COMPARABLE HOTEL OPERATIONS
In order to determine the hotel operating ratios for the Hotel, Johnson Consulting relied on our industry
experience, comparable hotels, and a HOST report.
HOST REPORT
A HOST report is a composite of similar hotels across the US. Smith Travel Research collects operating data
from hotels and makes these composite analyses, called Host reports, available based on the results of the
hotels chosen. Because not all hotels participate and a minimum of four brands must be used, the resulting
composite will not be a perfect predictor of performance. However, it allows for helpful comparison.
Johnson Consulting developed one list for the HOST analysis, which is of comparable properties in
comparable cities. The tables on the following pages list the hotels used in the analysis and the resulting
HOST ratios. APR in the tables stands for Average Published Rate.

Section VII Hotel Operating Projections | December 2012
Monona Terrace HQ Hotel Analysis – Madison, WI
PAGE 129
STR HOST Response Report
2011 Full-Service: Selected Properties
Job #: 73224
STR # PROPERTY NAME ADDRESS CITY ST ZIP ROOMS APR ($) PRICE CHAIN SCALEYEAR OPEN
LOCATION
17413 Hilton Madison Monona Terrace 9 E Wilson St Madison WI 53703 240 139 Luxury Upper Upsc 200102 Urban 20769 Renaissance Nashville Hotel 611 Commerce St Nashville TN 37203 673 162 Luxury Upper Upsc 198708 Urban 29359 Westin Providence 1 W Exchange St Providence RI 2903 564 254 Upscale Upper Upsc 199412 Urban 42961 Marriott San Jose 301 S Market St San Jose CA 95113 506 274 Upscale Upper Upsc 200304 Urban 50171 Hilton Omaha 1001 Cass St Omaha NE 68102 487 198 Luxury Upper Upsc 200404 Urban
Total Properties: 5 Total Rooms: 2470
Source: SMITH TRAVEL RESEARCH - The information contained in this report is based upon independent surveys and research from sources considered reliable but no representation is made as to its completeness or accuracy. This information is in no way to be constructed as a recommendation by Smith Travel Research of any industry standard and is intended solely for the internal purposes of your company and should not be published in any manner unless authorized by Smith Travel Research. Copyright 2012 Smith Travel Research.

6 East Monroe Street | Fifth Floor | Chicago, Illinois 60603 | Phone: 312.447.2010 | Fax: 312.444.1125
www.chjc.com | [email protected]
Section VII Hotel Operating Projections | December 2012
Monona Terrace HQ Hotel Analysis – Madison, WI
PAGE 130
STRCustom HOST Report
2011 Full-Service: Selected Properties
Job #: 73224 Occupancy: 70.5%Props: 5 ADR: $139.89Rooms: 2,470 RevPAR: $98.61
Ratio to Sales 1 Amount Per Available Room Amount Per Occupied Room Night
REVENUE %
Rooms 69.2 % $35,933 $139.8913.5 7,007 $27.28
4.3 2,216 $8.637.3 3,764 $14.650.7 381 $1.481.3 685 $2.673.2 1,651 $6.430.4 231 $0.90
100.0 % $51,868 $201.93
DEPARTMENTAL EXPENSES
27.3 % $9,810 $38.1976.0 9,874 $38.44
168.2 641 $2.501.2 612 $2.38
40.4 % $20,937 $81.51
DEPARTMENTAL PROFITS
72.7 % $26,123 $101.7024.0 3,113 $12.12
-68.2 -260 -$1.0298.8 1,955 $7.6259.6 % $30,931 $120.42
UNDISTRIBUTED OPERATING EXPENSES
9.0 % $4,665 $18.168.7 4,518 $17.594.7 2,419 $9.424.2 2,202 $8.57
26.6 % $13,804 $53.74
GROSS OPERATING PROFIT 33.0 % $17,127 $66.68
2.2 1,145 $4.463.0 1,541 $6.00
INCOME BEFORE FIXED CHARGES 27.8 % $14,441 $56.22
SELECTED FIXED CHARGES
5.2 % $2,686 $10.461.0 523 $2.032.6 1,374 $5.35
19.0 % $9,858 $38.38
SUPPLEMENTAL PAYROLL ANALYSIS 3
16.7 % $6,006 $23.3844.8 5,824 $22.67
135.4 538 $2.03113.4 424 $1.71
5.0 2,605 $10.142.7 1,424 $5.542.2 1,151 $4.48
34.2 % $17,720 $68.98
SUPPLEMENTAL FOOD & BEVERAGE INFORMATION 3
27.1 % $1,902 $7.4022.4 496 $1.9318.5 2,398 $9.34
44.8 5,824 $22.67
12.7 1,652 $6.43
1 Rooms, F&B, and Telecommunications expense ratios to sales for departmental expenses and profits are based on their
respective departmental revenues. All other expenses are based on total revenue. 2 Other Fixed Charges include Depreciation and Amortization, Interest, Rent, and Equipment Leases
3 Payroll and Costs of Sales are included in expenses. Amounts shown here are for additional detail only.
Not all HOST participants provide detailed data on payroll and F&B costs; therefore, the following supplemental analyses provide the ratios for only these hotels in the samples that reported detailed information. Consequently, the amounts may not tie to the departmental figures provided.
NOTE: Totals may not add due to rounding.
Food & Beverage
Telecommunications
Telecommunications
Other Operated Departments
Rentals & Other Income
Cancellation Fee
Beverage
Other Food & Beverage
Food
Rooms
Marketing
Property Operations & Maintenance
Other Operated Depts & Rentals TOTAL DEPARTMENTAL EXPENSES
Rooms
Food & Beverage
Telecommunications
Other Operated Depts & Rentals
Administrative & General
Telecommunications
TOTAL DEPARTMENTAL PROFITS
TOTAL REVENUE
Other Operated Departments
Administrative & General
Marketing
Utility Costs
Property Operation & Maintenance
Total Food and Beverage
TOTAL UNDISTRIBUTED OPERATING EXPENSES
SERVICE & OTHER FIXED CHARGES 2
$$
Rooms
Franchise Fees (Royalty)
Management Fees
Property Taxes
Insurance
Reserve For Capital Replacement
AMOUNT AVAILABLE FOR DEBT
Food & Beverage Payroll
Food & Beverage Other Expenses
TOTAL PAYROLL & RELATED EXPENSES
Cost of Food Sales
Cost of Beverage Sales
Total Cost of F&B Sales

6 East Monroe Street | Fifth Floor | Chicago, Illinois 60603 | Phone: 312.447.2010 | Fax: 312.444.1125
www.chjc.com | [email protected]
Section VII Hotel Operating Projections | December 2012
Monona Terrace HQ Hotel Analysis – Madison, WI
PAGE 131
The combined comparable hotels in peer cities reported that room revenue accounts for 69.2 percent of sales
while total food and beverage revenue accounts for 25.1 percent of sales. Total revenue per occupied room
night is $201.93. Departmental expenses total 40.4 percent of sales, leaving 59.6 percent of revenues as
departmental profit. Undistributed operating expenses total 26.6 percent, leaving a gross operating profit of
33.0 percent. Net operating income before fixed charges was reported to be 27.8 percent. Net amount
available for debt service and other fixed charges (such as depreciation and amortization, interest, rent, and
equipment leases) was 19 percent of sales. This equates to approximately $9,858 per room per year, or $38.38
per occupied room night.
PROJECTION OF INCOME AND EXPENSE
The final step in this analysis of the potential Project was to prepare income and expense projections for ten
years. The financial projections are presented in Table 7-11. PAR stands for ‘per available room’ and POR
stands for ‘per occupied room night.’

Section VII Hotel Operating Projections | December 2012
Monona Terrace HQ Hotel Analysis – Madison, WI
PAGE 132 Table 7-11
Statement of Operating Proforma - 500-Room New Hotel (in $000, Inflated)
2015 2016 2017 2018 2019 2020 2021 2022 2023 2024
1 Room Count 500 500 500 500 500 500 500 500 500 5002 Available Room Nights 182,500 182,500 182,500 182,500 182,500 182,500 182,500 182,500 182,500 182,5003 Occupancy Rates 63.1% 69.5% 71.5% 72.4% 73.0% 73.0% 73.0% 73.0% 73.0% 73.0%4 Occupied Room Nights 115,176 126,802 130,425 132,072 133,220 133,220 133,220 133,220 133,220 133,2205 Average Daily Rate $154.20 $161.20 $166.70 $172.10 $176.00 $181.28 $186.72 $192.32 $198.09 $204.036 RevPAR $97.32 $112.00 $119.13 $124.55 $128.47 $132.33 $136.30 $140.39 $144.60 $148.947 Percent of Change from Prior Year -- 15.1% 6.4% 4.5% 3.2% 3.0% 3.0% 3.0% 3.0% 3.0%
Revenue % PAR POR %
8 Rooms $17,760 71.5% $35,520 $154.20 $20,441 $21,742 $22,730 $23,447 69.2% $24,150 $24,875 $25,621 $26,389 $27,1819 Hotel Food and Beverage 5,866 23.6% 11,732 50.93 6,968 7,646 8,244 8,504 25.1% 8,760 9,022 9,293 9,572 9,859
10 Telephone 174 0.7% 348 1.51 202 218 230 237 0.7% 244 252 259 267 27511 Other Operated Departments 249 1.0% 497 2.16 318 373 427 440 1.3% 454 467 481 496 51112 Rentals and Other Income 808 3.3% 1,616 7.01 983 1,103 1,215 1,254 3.7% 1,291 1,330 1,370 1,411 1,453
13 Total Hotel Revenue $24,857 100.0% $49,714 $215.82 $28,912 $31,082 $32,846 $33,882 100.0% $34,899 $35,946 $37,024 $38,135 $39,279
Expenses 14 Rooms $5,381 30.3% $10,763 $46.72 $5,989 $6,153 $6,205 $6,401 27.3% $6,593 $6,791 $6,994 $7,204 $7,42015 Hotel Food and Beverage 4,458 76.0% 8,917 38.71 5,295 5,811 6,266 6,463 76.0% 6,657 6,857 7,063 7,275 7,49316 Telephone 293 168.2% 585 2.54 340 366 387 399 168.2% 411 423 436 449 46217 Other Operated Departments 3 1.2% 6 0.03 4 4 5 5 1.2% 5 6 6 6 618 Rent and Other Income 10 1.2% 19 0.08 12 13 15 15 1.2% 15 16 16 17 17
19 Total Hotel Expenses $10,145 40.8% $20,290 $88.08 $11,641 $12,348 $12,877 $13,284 39.2% $13,682 $14,093 $14,515 $14,951 $15,399
20 Departmental Operating Income $14,712 59.2% $29,424 $127.73 $17,271 $18,734 $19,969 $20,599 60.8% $21,217 $21,853 $22,509 $23,184 $23,880$ $
Undistributed Operating Expenses 21 Administrative and General $2,237 9.0% $4,474 $19.42 $2,602 $2,797 $2,956 $3,049 9.0% $3,141 $3,235 $3,332 $3,432 $3,53522 Credit Card Commissions 373 1.5% 746 3.24 434 466 493 508 1.5% $523 539 555 572 55023 Marketing 2,237 9.0% 4,474 19.42 2,573 2,735 2,858 2,948 8.7% $3,036 3,127 3,221 3,318 3,41724 Utility Costs 1,168 4.7% 2,337 10.14 1,359 1,461 1,544 1,592 4.7% $1,640 1,689 1,740 1,792 1,84625 Property Operations and Maintenance 671 2.7% 1,342 5.83 925 1,150 1,380 1,423 4.2% $1,466 1,510 1,555 1,602 1,650
26 Total $6,686 26.9% $13,373 $58.05 $7,893 $8,610 $9,230 $9,521 28.1% $9,807 $10,101 $10,404 $10,716 $10,998
27 Gross Operating Profit $8,025 32.3% $16,051 $69.68 $9,378 $10,125 $10,739 $11,078 32.7% $11,410 $11,753 $12,105 $12,468 $12,882
Selected Fixed Charges 28 Property Taxes $1,119 4.5% $2,237 $9.71 $1,272 $1,305 $1,314 $1,355 4.0% $1,396 $1,438 $1,481 $1,525 $1,57129 Insurance 249 1.0% 497 2.16 289 311 328 339 1.0% 349 359 370 381 393
30 Total $1,367 5.5% $2,734 $11.87 $1,561 $1,616 $1,642 $1,694 5.0% $1,745 $1,797 $1,851 $1,907 $1,964
31 Income Before Management Fees $6,658 26.8% $13,316 $57.81 $7,817 $8,508 $9,097 $9,384 27.7% $9,665 $9,955 $10,254 $10,561 $10,918
32 Management Fee and Chain Services $746 3.0% $1,491 $6.47 $867 $932 $985 $1,016 3.0% $1,047 $1,078 $1,111 $1,144 $1,178
33 Income after Management Fees $5,912 23.8% $11,825 $51.33 $6,950 $7,576 $8,111 $8,367 24.7% $8,618 $8,877 $9,143 $9,417 $9,739
34 Reserve for Replacement $646 2.6% $1,293 5.61 $752 $808 $854 $881 2.6% $907 $935 $963 $992 $1,021
35 Project Net Operating Income $5,266 21.2% $10,532 $45.72 $6,198 $6,768 $7,257 $7,486 22.1% $7,711 $7,942 $8,181 $8,426 $8,718
Source: Johnson Consulting

6 East Monroe Street | Fifth Floor | Chicago, Illinois 60603 | Phone: 312.447.2010 | Fax: 312.444.1125
www.chjc.com | [email protected]
Section VII Hotel Operating Projections | December 2012
Monona Terrace HQ Hotel Analysis – Madison, WI
PAGE 133
Hotel gross income is projected to be $24.9 million in 2015, increasing to $33.9 million in 2019. Net
operating income is projected to be $5.3 million in 2015, increasing to $7.5 million in 2019. By 2024, net
operating income is projected to be $8.7 million. Net operating income as a percent of revenue is projected to
increase from 21.2 percent in 2015 to 22.1 percent in 2019.
We recognize this hotel will be part of a mixed-use development. Hence, it is unclear how parking will be
treated. It is not recognized in the proforma. Property taxes are considered in the proforma.
BASIS FOR INCOME AND EXPENSE ASSUMPTIONS
The estimates of income and expense statements are based on the results of operations of comparable hotels,
including those discussed at the beginning of this section.
The steps in the projection of income and expenses for the potential Hotel include projecting the income and
expenses for 2015 (or Year 1, the “base” year of operation). Then, income and expenses for the potential
Hotel were estimated for the projection period, using the base year estimates as a basis for prior and
subsequent income and expense levels. The income for each of these years is estimated based on the expected
impact that the change in occupancy and average daily room rates is expected to have on income and
expenses. Expense estimates are assumed to have both fixed and variable components, and vary based on
projected occupancy levels.
Revenue increases beyond the stabilized year use the three percent inflation rate discussed earlier, unless
indicated otherwise. On the expense side, annual increases are based percent of revenue, so will increase at
the same three percent rate. Breakdown for revenue and expenses is derived from the operating ratio
averages.
DISTRIBUTED DEPARTMENTAL REVENUES AND EXPENSES
Rooms Department: Room revenue is calculated by multiplying the estimated occupied room nights by the
estimated average daily rate (ADR) projected in this analysis. Based on the projected ADR and room nights
previously presented, room revenue is projected to account for 71.5 percent of total revenue in 2015,
decreasing to 69.2 percent by 2018.
Rooms department expenses include payroll and related costs associated with the front desk and
housekeeping, operating supplies, laundry linens, cable television, and other items necessary to maintain guest
rooms. Expenses are estimated at 30.3 percent of room sales in 2015; 27.3 percent in 2019.
Food and Beverage: Based on similar hotel performance, it is projected that the hotel will generate $5.9
million in food and beverage sales in 2015, increasing to $8.5 million in 2019, which is based on $50.93 per
occupied room night (POR) in 2015, increasing to $63.84 POR in 2019. Food and beverage expenses for the
6 East Monroe Street | Fifth Floor | Chicago, Illinois 60603 | Phone: 312.447.2010 | Fax: 312.444.1125
www.chjc.com | [email protected]
Section VII Hotel Operating Projections | December 2012
Monona Terrace HQ Hotel Analysis – Madison, WI
PAGE 134
hotel amount to 76 percent of food and beverage revenue throughout the projection period. Food and
beverage revenue is largely driven by catering at group functions, but also includes restaurant operations and
room service.
Telephone Department: Telephone usage is declining in hotels due to cellular phone use. Estimated
telephone revenue is based on the experience of the similar convention properties, and thus a projection of
$1.51 POR was used in 2015, increasing slightly to $1.78 by 2019. The projection estimates expenses at 168.2
percent of telephone revenue throughout the period, as most guests use their cell phones now.
Other Operated Departments: This income category is typically comprised of smaller departments that
generate income from activities such as valet laundry, business services, and similar others. This income
category is estimated to begin at $2.16 per occupied room night in 2015 and increase to $3.31 by 2019.
The projection estimates expenses of other operated departments at approximately 1.2 percent of revenue
over the projection period, based on the HOST report.
Rentals and Other Income: This income category is typically comprised of interest, rental of equipment, in-
house leases, commissions on vending machine sales, movies, and other miscellaneous income. This income
category is typically highly dependent on occupancy. The projection estimates that rental and other income
will be $7.01 per occupied room in 2015, increasing to nearly $9.41 by 2019.
The expenses related to rental and other income are usually estimated and reported to be zero by hotel
companies. This projection assumes an expense ratio of 1.2 percent, based on HOST report.
UNDISTRIBUTED OPERATING EXPENSES
Operating expenses that are not chargeable to a particular operating department are presented as
undistributed operating expenses in accordance with the Uniform System of Accounts for hotels. These
expenses are discussed in the following paragraphs.
Administrative and General: This category covers expenses such as salaries and wages for management staff,
bookkeeping, credit card commissions (which we have estimated separately), data processing charges,
corporate office charges, office supplies, legal, accounting, allowance for bad debts, travel expenses, and
similar items. General insurance (liability, business risk, etc.) is included in the Administrative and General
(A&G) category. These expenses are expected to amount to 9.0 percent throughout the projection period.
Credit Card Commissions: It is estimated that credit card commissions amount to 1.5 percent of total
revenue throughout the projection period. These are pass-through expenses and do not provide revenue to
the operator.

6 East Monroe Street | Fifth Floor | Chicago, Illinois 60603 | Phone: 312.447.2010 | Fax: 312.444.1125
www.chjc.com | [email protected]
Section VII Hotel Operating Projections | December 2012
Monona Terrace HQ Hotel Analysis – Madison, WI
PAGE 135
Marketing Expenses: Marketing expenses include wages, salaries, employee benefits and payroll costs for a
sales staff, local advertising, national brand system marketing costs, the cost of printing brochures, and other
related items. Based on the marketing expenses typical for convention hotels, the projection estimates that
marketing expenses begin at 9.0 percent of total revenues, declining to 8.7 percent.
Utilities: Johnson Consulting estimates that utility expenses will be 4.7 percent of total revenue throughout
the projection period.
Property Operations and Maintenance: Property operations and maintenance expenses include salaries and
wages, employee benefits, other payroll costs, normal maintenance of the building and grounds, landscaping
and electrical and mechanical equipment. Based on the comparable information, property operations and
maintenance expenses are expected to be 2.7 percent of total revenue in 2015 and due to typical wear-and-
tear increase slightly to 4.2 percent in 2019.
FIXED CHARGES
Property Taxes: For the proposed Hotel, property taxes are estimated at 4.5 percent in 2015; decreasing to
4.0 percent in 2019.
Insurance: This insurance category covers only the cost of building and contents insurance and no liability
insurance. The liability insurance is found in the A&G expense. Based on the experience of similar properties,
this expense is estimated to be 1.0 percent throughout the projection period.
Management Fees and Chain Services: Unless the hotel is financed using tax-exempt bonds, the
management fee will be generally based upon a percentage of revenues. The chain services expense includes
the payments the hotel owes to the corporate parent for the company’s rewards program and a variety of
other services performed centrally by the chain company for its managed hotels. For the proposed 500-room
Hotel in Madison, the management fee and chain services combined are projected to be 3.0 percent annually,
or $746,000 in 2015, increasing to $1 million in 2019.
Reserve for Replacement: As is standard for income-producing properties, a reserve for replacement for
furniture, fixtures, and equipment, as well as other long-lived items has been included in this analysis.
According to the HOST reports, the reserve for replacement in the competitive set is reported as 2.6 percent.
For the proposed Hotel in Madison, reserve for replacement is estimated at 2.6 percent throughout the
projection period.
CONCLUSION
A new hotel is needed to support Monona Terrace to host both larger and more frequent conventions and
compete with other centers regionally and nationally. A real concern is that the hotel be of a suitable size to
maximize Monona Terrace and fill the function space within a new hotel. Knowing that the Judge Doyle

6 East Monroe Street | Fifth Floor | Chicago, Illinois 60603 | Phone: 312.447.2010 | Fax: 312.444.1125
www.chjc.com | [email protected]
Section VII Hotel Operating Projections | December 2012
Monona Terrace HQ Hotel Analysis – Madison, WI
PAGE 136
Square is one of the last sites in downtown Madison and within close proximity to Monona Terrace, getting
the right amount of hotel rooms and function space is critical.
At minimum the hotel should be of a size not less than 400 rooms with a room block of 250 but Madison
could accommodate a hotel near 500 rooms with a room block of 400 rooms. The hotel should also have
ample function space to support larger conventions that could be held simultaneously at the hotel and
Monona Terrace.
The proposed Headquarters Hotel would induce significant demand into the market and maximize the ability
of convention and conference facilities including Monona Terrace and the Alliant Energy Center to host
groups. Johnson Consulting estimates that the Hotel will induce new demand due to its strong national sales
force, unique quality and amenity package, and strategic location close to Monona Terrace.
While occupancy of the competitive set will decline at the onset of the opening of the new hotel, the market
is expected to quickly recover and return to a better rate within five years of operation.
The Judge Doyle Square site is the last practical site for a close hotel and its meeting space is close enough t
effectuate an “expansion” of Monona Terrace. The City would be prudent to justify TIF investment for a
larger hotel with substantial meeting space because it will help on the hotel room block matter and provide
extra capacity to help attract more business to all hotels in the market.

6 East Monroe Street | Fifth Floor | Chicago, Illinois 60603 | Phone: 312.447.2010 | Fax: 312.444.1125
www.chjc.com | [email protected]
SECTION VIII
HOTEL IMPACTS

Section VIII Hotel Impact Analysis | December 2012 Madison Hotel Feasibility Study – Madison, WI
PAGE 137
6 East Monroe Street | Fifth Floor | Chicago, Illinois 60603 | Phone: 312.447.2010 | Fax: 312.444.1125
www.chjc.com | [email protected]
ECONOMIC AND FISCAL IMPACT ASSOCIATED WITH A NEW HEADQUARTERS HOTEL
This section analyzes the economic and fiscal benefit that would be generated from developing the proposed
new Headquarters Hotel in Madison, Wisconsin.
Johnson Consulting advocates pushing for as large a hotel as possible (up to 500 rooms) for two key reasons.
1.) We are very concerned that a hotel of 300 or even 400 rooms will put the city in the same condition
it is in now – too few rooms available for room blocks of the right size needed to make the city more
attractive for conventions and conferences. Currently, the Hilton has a 62 percent room block, but
often these rooms are hard to get because commercial and in-house group demand is so strong.
Further, this hotel is not what we consider a “group” house. Typical room blocks will be in the 60 to
70 percent range (however, Fort Worth’s room block agreement with the Omni Hotel stipulates up
to 80 percent). Using the optimistic 70 percent of the combined Hilton and the new property,
between 360 and 500 rooms would be committable, to the Monona Terrace. As was shown in
Section VI, the City’s goal is towards more months like August – a portfolio of regularly recurring
larger events. What is essential is a consistently available larger room block. A smaller hotel will
affect this requirement, as growth in corporate demand, even with the expanded Edgewater and new
Hampton Inn, will cause the experience at the Hilton to repeat itself.
2.) Unless drastic measures are taken later, the Judge Doyle Square Site is among the last sites close
enough to Monona Terrace to build hotel rooms close enough to make a difference in demand at the
center. It is suggested that market potential exists for both hotel-based demand and Monona Terrace
sized events to justify creating a groups oriented hotel that hosts in-house group business well, but
also extends the Monona Terrace product by combining meeting facilities for many events. De
facto, the hotel’s meeting space becomes an expansion for Monona Terrace.
In the following analysis a 500-room scenario is presented, supplemented with assessments of impacts of
adding just 300 rooms, and 400 rooms.
DEFINITIONS
The economic and fiscal impact analysis is based on room night and operating projections of the proposed
500-room Headquarters Hotel in Madison. For the purpose of this analysis, impact is discussed in terms of
the Madison area economy. The levels of impacts are described as follows:
Direct impacts - are an expression of the spending that occurs as a direct result of the events and
activities that occur in the Hotels. For example, a hotel guest’s expenditures on hotel rooms and
meals are a direct economic impact.

Section VIII Hotel Impact Analysis | December 2012 Madison Hotel Feasibility Study – Madison, WI
PAGE 138
6 East Monroe Street | Fifth Floor | Chicago, Illinois 60603 | Phone: 312.447.2010 | Fax: 312.444.1125
www.chjc.com | [email protected]
Indirect impacts - consist of re-spending of the initial or direct expenditures, or, the supply of goods
and services resulting from the initial direct spending in these facilities. For example, a hotel guest’s
direct expenditure on a restaurant meal causes the restaurant to purchase food and other items from
suppliers. The portion of these restaurant purchases that are within the local, regional, or state
economies is counted as an indirect economic impact.
Induced impacts – represent changes in local consumption due to the personal spending by
employees whose incomes are affected by direct and indirect spending. For example, a waiter at the
Hotel restaurant may have more personal income as a result of the guest’s visit. The amount of the
increased income the waiter spends in the local economy is considered an induced impact.
Personal income – measures increased employee and worker compensation related to the events
being analyzed. This figure represents increased payroll expenditures, including benefits paid to
workers locally. It also expresses how the employees of local businesses share in the increased
outputs.
Employment impact – measures the number of jobs supported in the study area related to the
spending generated as a result of the events occurring in the Convention Center. Employment
impact is stated in a number of full-time equivalent jobs.
This analysis differentiates impacts from spending by people coming from out of town and by local residents,
defined as follows:
Net New Spending - is spending by out-of-town attendees, exhibitors, and other visitors who come
from outside the subject area, (i.e., City, County, metro area, and State of Wisconsin), which
represents the amount of ”new dollars” that flow into the respective economies.
Transfer Spending - Spending by those who live in the market area represents ”transfer” spending.
For example, a resident of the City of Madison who eats at the Hotel restaurant would transfer
income from one sector of the City’s economy to another, and therefore is not bringing new dollars
into the City economy. Nevertheless, they are part of the economic activities generated by the Hotels.
The analysis will present total impacts of the Hotel, as expressed through net new spending (to the City,
County, metro area, and State of Wisconsin) and transfer spending.
ECONOMIC IMPACT ANALYSIS OF THE HOTEL
In Section 7, projections for the 500-room Headquarters Hotel are presented. The projections serve as the
basis for the economic and fiscal impact analysis of the Hotel.

Section VIII Hotel Impact Analysis | December 2012 Madison Hotel Feasibility Study – Madison, WI
PAGE 139
6 East Monroe Street | Fifth Floor | Chicago, Illinois 60603 | Phone: 312.447.2010 | Fax: 312.444.1125
www.chjc.com | [email protected]
Hotel guests, by definition, originate from outside Madison; thus spending by guests in the Hotel is 100
percent new to Madison. It is assumed that the new hotel will cause more demand than it consumes, due to
the amount of meeting space it will have, the positive influence it will have on Monona Terrace and the fact
that it will spend extensively to market group business. This is a reasonable assumption for a couple of
reasons. First, there is inherent growth in the market overall. This new hotel is absorbing some of that
growth. If a new larger hotel were not attracted, natural market forces would result in smaller limited service
properties evolving, most likely in less productive areas outside the downtown core, consuming this demand.
A hotel that is newer, larger and complements Monona Terrace will induce more demand than limited service
properties and will shift that into the downtown core. Further, a new larger hotel actually forces other hotels
to work harder. It is our experience that if hotels see a new product, they will increase marketing and sales
efforts and upgrade their properties, having an overall wholesome effect on the market.
ECONOMIC IMPACT CALCULATION
The economic impact analysis focuses on the 500-room hotel’s stabilized year of operation (Year 5). As
shown in Section 7 of this report, the hotel’s occupancy rate stabilizes at 73 percent, resulting in 133,220
occupied room nights, all of which are effectively net new- induced, recaptured from suburban locales or
capture of market growth. According to the expected market segmentation of the Hotel, these 133,295 room
nights include 58,600 group room nights, and 74,600 commercial, leisure and other room nights.
Assuming that the average length of stay per occupied night is 1.2 days across all segments and the average
number of guests per room is 1.4, 1.2, and 1.7 for group, commercial, and leisure and other segment,
respectively, the 133,220 occupied room nights translates to 235,500 guest-days, total. Table 8-1 summarizes
the calculation.
Table 8-1
500-Room Hotel, Madison, WisconsinStatistics and Assumptions - Stabilized Year
Group CommercialLeisure and
OtherTotal
# of Occupied Room Nights 133,220
Market Segmentation 44.0% 19.0% 37.0% 100.0%# of Occupied Room Nights 58,617 25,312 49,291 133,220x Avrg Length of Stay per Night (in # of Days) 1.2 1.2 1.2
x Avrg # of Guests per Room 1.4 1.2 1.7= Estimated # of Guest-Days 98,500 36,400 100,600 235,500
Source: Johnson Consulting

Section VIII Hotel Impact Analysis | December 2012 Madison Hotel Feasibility Study – Madison, WI
PAGE 140
6 East Monroe Street | Fifth Floor | Chicago, Illinois 60603 | Phone: 312.447.2010 | Fax: 312.444.1125
www.chjc.com | [email protected]
By definition, these hotel guest-days are all non-local, i.e., from outside City of Madison, thus any related
spending would be net new to the City.
Table 8-2 shows the estimated number of room nights and guest-days (or person-days) that are net new to
Dane County, Madison Metropolitan Statistical Area, and State of Wisconsin, which is assumed to be 90
percent, 80 percent, and 50 percent, respectively, of total room nights generated by the 500-room Hotel.
Table 8-2
500-Room Hotel, Madison, WisconsinEstimate of Net New Person Days and Room Nights
From Out of City
From Out of County
From Out of MSA
From Out of State
Room NightsGroup 58,617 52,755 46,894 29,309Commercial 25,312 22,781 20,250 12,656Leisure and Other 49,291 44,362 39,433 24,646
Total 133,220 119,898 106,577 66,611
Person-DaysGroup 98,500 88,650 78,800 49,250Commercial 36,400 32,760 29,120 18,200Leisure and Other 100,600 90,540 80,480 50,300
Total 235,500 211,950 188,400 117,750
Source: Johnson Consulting
Multiplying the number of occupied room nights and the estimated number of guest-days with the average
daily rate (ADR) and average daily spending per guest, total amount of guest spending can be estimated.
Based on the 500-room Hotel’s projected ADR of $176.00 for Year 5 (assumed to be 2019) as described in
Section 7 of this report, discounted back to 2012 dollars, the ADR used for this impact analysis is $143.10,
which then translates to $138.40 for group, $179.10 for commercial, and $130.20 for leisure and other
segment. In addition to lodging, it is assumed that each guest incurs daily expenditures for recreation,
transportation, meals, shopping, and other. For group segment, estimates for these categories of spending are
derived from study by Destination Marketing Association International (DMAI, formerly International
Association of Convention and Visitors Bureaus, or IACVB) and Johnson Consulting’s experience with
similar projects in comparably-sized markets. These spending amounts are adjusted slightly for commercial
guests (e.g., no spending on entertainment tickets) and leisure guests (e.g., greater recreation spending and
smaller food and beverage spending).
Table 8-3 shows the estimated average daily spending per guest, shown in 2012 dollars.

Section VIII Hotel Impact Analysis | December 2012 Madison Hotel Feasibility Study – Madison, WI
PAGE 141
6 East Monroe Street | Fifth Floor | Chicago, Illinois 60603 | Phone: 312.447.2010 | Fax: 312.444.1125
www.chjc.com | [email protected]
Table 8-3
500-Room Hotel, Madison, WisconsinAverage Daily Spending per Guest (in 2012 Dollars)
Group CommercialLeisure and
Other
Type of SpendingTickets/ Entertainment $6.40 $8.50 $16.00 Transportation 48.30 64.20 48.30 Eating and Drinking 24.00 26.40 10.60 Lodging 138.40 179.10 130.20 Shopping 21.40 18.20 23.50 Other 9.60 14.40 9.60 Association Spending 25.00 na na
Total $273.10 $310.80 $238.20
Source: Destination Marketing Association International, Johnson Consulting
As the table shows, the estimated average daily spending for hotel guests ranges from $238.20 to $310.80 per
day, including lodging.
Multiplying average daily spending with the number of person-days will result in direct spending, which will
then ripple throughout the economy, generating indirect spending, induced spending, increased earnings, and
employment. Table xx shows the multiplier rates that are used to estimate the overall impact. The rates are
based on those applied to a Madison Convention Center impact analysis in 2008.
Table 8-4
500-Room Hotel, Madison, WisconsinEconomic Impact Multipliers
Impact Multiplier Base
Indirect Spending 0.33 of direct spendingInduced Spending 0.43 of direct spendingIncreased Earnings 0.70 of direct spendingIncreased Employment 17.54 per $1 million of direct spending
Source: Implan, Johnson Consulting
The multiplier rates mean that for every dollar spent by people in Madison, it results in an additional 76 cents
of spending and 70 cents of increased earnings to the economy. Also, every million dollars spent result in
17.54 jobs in the market.
Table 8-5 shows the estimated overall economic impact of the 500-room Hotel..

Section VIII Hotel Impact Analysis | December 2012 Madison Hotel Feasibility Study – Madison, WI
PAGE 142
6 East Monroe Street | Fifth Floor | Chicago, Illinois 60603 | Phone: 312.447.2010 | Fax: 312.444.1125
www.chjc.com | [email protected]
Table 8-5
500-Room Hotel, Madison, WisconsinEconomic Impact ($Millions) - Stabilized Year
Net New to City
Net New to County
Net New to MSA
Net New to State
(a) (b) (c) (d)
HotelDirect Spending $44.9 $40.4 $35.9 $22.4 Indirect Spending 14.7 12.8 11.0 11.7 Induced Spending 19.2 16.3 14.3 13.8
Total $78.8 $69.4 $61.2 $48.0
Personal Income $31.3 $27.2 $23.6 $18.8 Employment (in FTE) 787 692 608 333
Notes:
Column (a) represents City-wide impact from spending by all out-of-City visitors.
Column (b) is a subset of Column (a), representing County-wide impact from spending by all out-of-County visitors
Column (c) is a subset of Column (b), representing State-wide impact from spending by all out-of-MiSA visitors.
Column (d) is a subset of Column (c), representing State-wide impact from spending by all out-of-State visitors.
Employment impact shows # of jobs supported in area; and is over and above on-site employment at the Hotel.
Source: Johnson Consulting
As shown in the table, Johnson Consulting projects that in the stabilized year of operation, the proposed 500-
room Hotel is estimated to generate approximately $78.8 million in total direct, indirect, and induced
spending, $31.3 million in earnings, and support for the equivalent of 787 full-time jobs, all of which are net
new impact to the City of Madison. (This employment impact shows the number of jobs supported Madison-
wide, and is over and above on-site employment at the Hotel.) Net new impact to Dane County is projected
to include approximately $69.5 million in total direct, indirect, and induced spending, $27.2 million in
earnings, and 692 full-time jobs. Net new impact to the MSA is projected to include approximately $61.2
million in total direct, indirect, and induced spending, $23.6 million in earnings, and 608 full-time jobs. Net
new impact to the State of Wisconsin is projected to include approximately $48 million in total direct,
indirect, and induced spending, $18.8 million in earnings, and 333 full-time jobs.
FISCAL IMPACT OF THE HOTEL
Fiscal impacts are tax revenues that result from the spending and income related to the activities by the guests
to the 500-room Hotel. This analysis estimates fiscal impacts for the governmental units that levy taxes in the
jurisdiction. Like the annual spending estimates on which they are based, fiscal impacts are based on activities
in stabilized year of operation.
The fiscal impacts are the public sector’s return on investment. Fiscal impacts provide a partial offset to the
capital and operating expenditures required to support the development of the facility. Although the new tax

Section VIII Hotel Impact Analysis | December 2012 Madison Hotel Feasibility Study – Madison, WI
PAGE 143
6 East Monroe Street | Fifth Floor | Chicago, Illinois 60603 | Phone: 312.447.2010 | Fax: 312.444.1125
www.chjc.com | [email protected]
revenues cannot be expected to pay for a publicly-funded project in full, fiscal impacts are important because
they improve the ability of the public sector to provide potential support for the project. The overall
economic impacts, including the fiscal impacts, provide a rationale for public participation in a project.
Based on the spending shown in Table 8-5 for the Hotel, Johnson Consulting estimated the fiscal impacts
from three major categories of tax revenues that are directly affected by event attendees’ activity: general sales
tax, hotel tax, income tax from the incremental increase in personal and corporate income, and property rax.
Applicable tax rates include the following:
General Sales Tax – State sales tax in Wisconsin is 5 percent, while Dane County sales tax is 0.5
percent.
Hotel Tax – includes Transient Occupancy Tax (TOT) of 9 percent, in addition to the 5.5 percent
general sales tax.
Income Tax – includes the following:
State Individual Income Tax – uses an effective rate of 4.46 percent. State individual income tax
rates are graduated and taxpayer-specific. The 4.46 percent rate reflects an effective rate, which is
based on average tax rate as a percentage of Wisconsin Adjusted Gross Income (WAGI) as
reported by Wisconsin Department of Revenue.
State Corporate Income Tax – is 7.90 percent in Wisconsin.
Property Tax – Property tax as shown in the pro forma in Table 7-11 in Section 7 is $1.4 million in
Year 5 (2019). We estimate the balance of the proposed mixed-use development and the increase of
demand should result in a minimum 150 percent of the pro forma amount shown.
Table 8-6 summarizes the fiscal impact estimates of the 500-room Hotel.

Section VIII Hotel Impact Analysis | December 2012 Madison Hotel Feasibility Study – Madison, WI
PAGE 144
6 East Monroe Street | Fifth Floor | Chicago, Illinois 60603 | Phone: 312.447.2010 | Fax: 312.444.1125
www.chjc.com | [email protected]
Table 8-6
500-Room Hotel, Madison, WisconsinEstimates of Annual Fiscal Impact
Taxable Spending or
Income ($000)Tax Rate
Tax Revenues
($000)
General Sales Tax
State Sales Tax $44,868 1 5.00% $2,243
County Sales Tax $44,868 0.50% 224
Total Sales Tax 5.50% $2,468
Room Tax
Transient Occupancy Tax $15,942 2 9.00% $1,435(In addition to the 5.5% sales tax)
Income Tax
State Personal Income Tax $31,298 3 4.46% $1,396
State Corporate Income Tax 78,802 4 7.90% 6,225
Total Income Tax $7,621
Property Tax 5
Of Hotel $1,102
Of Balance of Mixed-Use Complex 551
Total Property Tax $1,653
$13,177
1 Includes spending on eating and drinking, lodging, shopping, and other.2 Includes spending on lodging only.3 Corresponds to Personal Income in Table 8-4.4 Corresponds to Total Spending in Table 8-4.5 Hotel property tax corresponds to proforma, shown in 2012 dollars.
Property tax of balance of complex is assumed to amount to 50 percent of Hotel property tax.
Source: Johnson Consulting
As the table shows, direct spending generated by the 500-room Hotel guests is projected to result in
approximately $13.2 million in tax revenues, which include $2.5 million of General Sales Tax; $1.4 million in
Room Tax; $7.6 million in Individual and Corporate Income Tax, and $1.65 million in Property Tax,
annually.
IMPACT OF A NEW HEADQUARTERS HOTEL TO MONONA TERRACE
Based on discussions we have had with Monona Terrace management and the City, the general sense is this
hotel is just a headquarters hotel. In our judgment it is much more than that. If the proper amount of meeting
and ballroom space is added, it is a structural change in the capacity offering in downtown Madison. This
structural change is required by the market, given the small size of Monona Terrace and the potential
development of similar sized convention centers in Brookfield and Appleton. The hotel and Monona Terrace
package also becomes a defensive strategy for the City. The Marriott in Middleton, the Dells products and

Section VIII Hotel Impact Analysis | December 2012 Madison Hotel Feasibility Study – Madison, WI
PAGE 145
6 East Monroe Street | Fifth Floor | Chicago, Illinois 60603 | Phone: 312.447.2010 | Fax: 312.444.1125
www.chjc.com | [email protected]
proposed offerings in Brookfield all pose threats to downtown Madison. By being aggressive, the City is
addressing risks and intensifying hotel concentration in downtown.
As previously discussed in Section 6 of this report, every year Monona Terrace is losing business, nearly 25
percent of which cited hotel-related reasons. In 2010 and 2011 alone, approximately 37 Monona Terrace
based potential events were lost along with 36,600 room nights due to hotel-related reasons.
The proposed addition of an adjacent headquarters hotel will significantly address many of the reasons cited
for lost business. It will certainly help in recapturing a portion of lost events. Moreover, it is likely that a
substantial share of potential business, in addition to lost business, has not considered Madison in past years
because event planners know there are insufficient hotel room blocks for their events. These events have not
been recorded as lost business because an initial inquiry was never made. Although it is not possible to
determine the extent of this latent business, it could add significantly to the amount of lost business actually
recorded.
Table 8-7
Madison, WisconsinRecovery of Lost Business*
% Recovery
# of Events# of
Attendees# of Room
Nights
10% 10 7,221 8,77315% 14 10,832 13,15920% 19 14,443 17,54625% 24 18,053 21,93230% 29 21,664 26,31835% 33 25,274 30,70540% 38 28,885 35,09145% 43 32,496 39,47850% 48 36,106 43,86455% 53 39,717 48,25060% 57 43,328 52,63765% 62 46,938 57,02370% 67 50,549 61,41075% 72 54,159 65,79680% 76 57,770 70,18285% 81 61,381 74,56990% 86 64,991 78,95595% 91 68,602 83,342
100% 96 72,213 87,728
*Based on lost business in 2010 and 2011.
Source: Greater Madison CVB, Johnson Consulting
Table 8-8 shows the estimated impact of a 300-room, 400-room, or 500-room Headquarters Hotel Monona
Terrace, assuming a 50-percent recovery rate for recaptured events that will be hosted in Monona Terrace
and/ or co-hosted at Monona Terrace and the proposed new hotel.

Section VIII Hotel Impact Analysis | December 2012 Madison Hotel Feasibility Study – Madison, WI
PAGE 146
6 East Monroe Street | Fifth Floor | Chicago, Illinois 60603 | Phone: 312.447.2010 | Fax: 312.444.1125
www.chjc.com | [email protected]
Table 8-8
Monona Terrace, Madison, WisconsinEstimated Impact of New Headquarters Hotel to Monona Terrace Event Demand
Current Stabilized Year of Operation w/ 300-Room HQ Hotel w/ 400-Room HQ Hotel w/ 500-Room HQ Hotel
2010 2011 AverageAverage
AttendanceIncremental
Average Attendance
Total IncrementalAverage
AttendanceTotal Incremental
Average Attendance
Total
# of EventsBanquets 231 210 221 (5) 216 (10) 211 (15) 206Meetings 206 207 207 (10) 197 (15) 192 (20) 187Conventions 26 30 28 10 38 15 43 24 52
Conferences 36 32 34 10 44 15 49 24 58Consumer Shows 19 23 21 0 21 0 21 0 21Entertainment 30 30 30 0 30 0 30 0 30Community Events 61 82 72 0 72 0 72 0 72Community Meetings 13 16 15 0 15 0 15 0 15
Total 622 630 628 5 633 5 633 13 641
# of AttendeesBanquets 54,530 49,805 52,168 236 (1,200) 236 50,968 (2,361) 236 49,807 (3,500) 236 48,668Meetings 33,023 36,535 34,779 168 (1,700) 168 33,079 (2,520) 168 32,259 (3,400) 168 31,379Conventions 30,242 31,151 30,697 1,096 12,100 1,206 42,797 19,320 1,288 50,017 32,900 1,370 63,597
Conferences 10,659 9,725 10,192 300 3,300 330 13,492 5,280 352 15,472 9,000 375 19,192Consumer Shows 40,930 41,368 41,149 1,959 0 41,149 0 41,149 0 41,149Entertainment 13,457 9,045 11,251 375 0 11,251 0 11,251 0 11,251Community Events 30,608 35,345 32,977 458 0 32,977 0 32,977 0 32,977Community Meetings 252 327 290 19 0 290 0 290 0 290
Total 213,701 213,301 213,503 12,500 226,003 19,719 233,222 35,000 248,503
# of Incremental Room Nights 14,300 22,500 40,000
Notes:
- Incremental events assume a 50% recovery rate from lost business.
- Incremental events are assumed to fill two high-impact events equally: conventions and conferences.
- Average attendance for incremental events reflects a 25% increase over stabilized year's average.
- Average room nights for incremental events are based on lost business statistics.
Source: Monona Terrace, Johnson Consulting
Section VIII Hotel Impact Analysis | December 2012 Madison Hotel Feasibility Study – Madison, WI
PAGE 147
6 East Monroe Street | Fifth Floor | Chicago, Illinois 60603 | Phone: 312.447.2010 | Fax: 312.444.1125
www.chjc.com | [email protected]
As shown in the table, the presence of a 300-, 400-, or 500-room Headquarters Hotel to support Monona
Terrace has different impact to the facility. Essentially, the Headquarters Hotel will help Monona Terrace in
two ways: (i) to improve attractiveness of Madison and Monona Terrace for larger conventions and
conferences, and (ii) to attract smaller meetings and banquet events from Monona Terrace, allowing the
facility to accommodate more of those larger, high-impact conventions and conferences. A smaller
headquarters hotel would limit the City’s ability to attract new demand and would attract fewer of small
events away from Monona Terrace, and therefore would have less impact on operations at Monona Terrace
and the community as a while. A larger headquarters hotel will more significantly improve Madison’s
attractiveness as an event location to potential event planners and potential attendees. Furthermore, a larger
hotel would move more banquets and meetings from Monona Terrace, allowing the facility to serve a greater
number of convention and conference events (and their banquet business).
The estimates assume that incremental high-impact events will be equally distributed between conventions
and conferences, and have greater average attendance as well. In the 300-room scenario, Monona Terrace has
potential to accommodate twenty new conventions and conferences, translating to approximately 12,500 net
additional attendees and 14,300 new room nights. In the 500-room scenario, Monona Terrace has a potential
to accommodate 48 new conventions and conferences, translating to approximately 35,000 net additional
attendees and 40,000 new room nights, which are approximately 70 percent of the Headquarters Hotel’s
estimated new group room nights as shown previously in Table 8-1 (the remaining 30 percent may be
associated with new events at Alliant Energy Center and other meetings facilities in Madison). These events
are expected to be held at Monona Terrace or the combined Monona Terrace AND the hotel- co hosted-;
but does not include in-house meetings at the hotel.
Table 8-9 shows the estimated Monona Terrace revenues associated with those increased business due to a
new Headquarters Hotel offering 300 room, 400 rooms, or 500 rooms.

Section VIII Hotel Impact Analysis | December 2012 Madison Hotel Feasibility Study – Madison, WI
PAGE 148
6 East Monroe Street | Fifth Floor | Chicago, Illinois 60603 | Phone: 312.447.2010 | Fax: 312.444.1125
www.chjc.com | [email protected]
Table 8-9
Monona Terrace, Madison, WisconsinEstimated Impact of New Headquarters Hotel to Monona Terrace Revenues ($000)
Current Stabilized Year of Operation With 300-Room HQ Hotel With 400-Room HQ Hotel With 500-Room HQ Hotel
2010 2011 Average Incremental Total Incremental Total Incremental Total
# of EventsBanquets $947 $861 $904 ($14) $890 ($27) $877 ($39) $865Meetings 724 652 688 (22) 666 (32) 656 (44) 644Conventions 1,384 1,647 1,516 388 1,904 620 2,136 1,056 2,572Conferences 550 476 513 108 621 173 686 294 807Consumer Shows 176 147 162 0 162 0 162 0 162Entertainment 64 64 64 0 64 0 64 0 64Community Events 68 74 71 0 71 0 71 0 71Community Meetings 1 1 1 0 1 0 1 0 1
Subtotal $3,914 $3,921 $3,919 $461 $4,380 $734 $4,653 $1,267 $5,186
Ancillary RevenueGift Shop $153 $155 $154 $5.9 $160 $9.2 $163 $16.4 $170Tours 8 8 8 0.3 8 0.5 8 0.8 9Misc 86 80 83 3.2 86 5.0 88 8.9 92
Subtotal $247 $243 $245 $9.3 $254 $14.7 $260 $26.1 $271
Total Revenue $4,161 $4,164 $4,164 $470 $4,634 $748 $4,912 $1,293 $5,457
Source: Monona Terrace, Johnson Consulting

Section VIII Hotel Impact Analysis | December 2012 Madison Hotel Feasibility Study – Madison, WI
PAGE 149
6 East Monroe Street | Fifth Floor | Chicago, Illinois 60603 | Phone: 312.447.2010 | Fax: 312.444.1125
www.chjc.com | [email protected]
As shown on the table, with a new 300-room Headquarters Hotel, Monona Terrace is expected to host more
convention and conference events that result in approximately $470,000 of additional revenues, while a 500-
room Headquarters Hotel is expected to increase such revenues by $1.3 million. It is expected that a
minimum of 30 percent of incremental revenue will be captured by the Hotel for co-hosted events.
Additionally, the additional 40,000 room nights are estimated to generate $5.6 million of additional room
revenues, which translates to approximately $500,000 of additional Transient Occupancy Tax revenues,
annually.
CONCLUSION
A 500-room hotel would generate approximately $78.8 million in total direct, indirect and induced spending,
$31.3 million in earnings, and support 787 full-time equivalent jobs.
A new hotel is needed to sustain Monona Terrace operations and unlock significant market potential. Since
Monona Terrace can’t be expanded in any significant way, the addition of a new hotel, operated in concert
with the center, would significantly increase event demand at Monona Terrace and help Madison maintain its
market competitiveness. In order for the City of Madison and Monona Terrace to maximize its potential,
Johnson Consulting recommends that a full service hotel of a size not smaller than 400 rooms, which could
accommodate a room block of at 250 and optimally, a 500-room hotel with a room block of 400 rooms be
built to serve the facility.
Ideally, a larger hotel that could serve as a headquarters would be preferable. It is always optimal to house
convention attendees under one roof. The hotel should also have ample function space up to 50,000 square
feet to create latent demand and allow Madison to compete for larger events than Monona Terrace alone
could host.
Finally, the additional of a new hotel to serve Monona Terrace has multiple benefits including more facility
income, greater room and sales tax, and greater economic impact. However more so than all those attributes
is building Madison as a destination city. This development is a cornerstone to building Madison’s
reputation, desirability and ultimately a location that is in the conversation by meeting planners looking to
book their next convention. This attractiveness increase affects all facets of economic and cultural economic
development.