Embed Size (px)
Citation preview

ISSN (Print) 0473-453X Discussion Paper No. 1068 ISSN (Online) 2435-0982
HOUSEHOLD DEBT AND AGING IN JAPAN
Charles Yuji Horioka Yoko Niimi
November 2019
The Institute of Social and Economic Research Osaka University
6-1 Mihogaoka, Ibaraki, Osaka 567-0047, Japan

Household Debt and Aging in Japan*
By Charles Yuji Horioka and Yoko Niimi
November 2019
Abstract
In this paper, we analyze the borrowing behavior of Japanese households in comparison to the other Group of Seven (G7) countries and also broken down by the age group of the household head. We find that pre-retirement households (households with a head in the 50-59 age group) in Japan do not have inordinate amounts of debt and that their financial health is satisfactory. However, we also find that households with a head in the 30-39 age group have shown a sharp increase in debt holdings in recent years, due partly to the fact that tax breaks for housing purchase, reforms in the housing loan market since the early 2000s, and expansionary monetary policy enabled Japanese households to purchase housing at a younger age than they could previously. We therefore need to monitor the borrowing behavior of this cohort over time as the Bank of Japan normalizes its monetary policy, especially since households have become more vulnerable to rising interest rates as the share of households who have chosen variable-rate housing loans has increased in recent years. Keywords: aging, borrowing, debt, homeownership, households, housing, Japan, liabilities, loans, mortgages, retirement JEL classification codes: D14, E21, G51, J14, R21 Charles Yuji Horioka Research Institute for Economics and Business Administration Kobe University 2-1, Rokkodai-cho, Nada-ku Kobe, Hyogo 657-8501, Japan; National Bureau of Economic Research; and Institute of Social and Economic Research, Osaka University; and Asian Growth Research Institute Tel: +81-78-803-7022 Email: [email protected]
Yoko Niimi Faculty of Policy Studies Doshisha University Imadegawa-agaru, Shinmachi-dori Kamigyo-ku, Kyoto 602-0047, Japan; and Asian Growth Research Institute Tel: +81-75-251-3460 Email: [email protected]
*This paper was presented at the 2019 Pension Research Council Symposium on “Remaking Retirement? Debt in an Aging Economy,” held at the Inn at Penn, Philadelphia, Pennsylvania, USA, on May 2-3, 2019, and was originally published as Pension Research Council Working Paper PRC WP2019-17, Pension Research Council, The Wharton School, University of Pennsylvania, Philadelphia, PA, USA. The authors are grateful to Karen Dynan, Annamaria Lusardi, Olivia Mitchell, John Sabelhaus, Nobuyuki Yamori, and other symposium participants for their valuable comments and to JSPS KAKENHI Grant Numbers 18H00870 and 15H05728 for financial support. All findings, interpretations, and conclusions of this paper represent the views of the authors and not those of the Wharton School or the Pension Research Council. © 2019 Pension Research Council of the Wharton School of the University of Pennsylvania. All rights reserved.
1
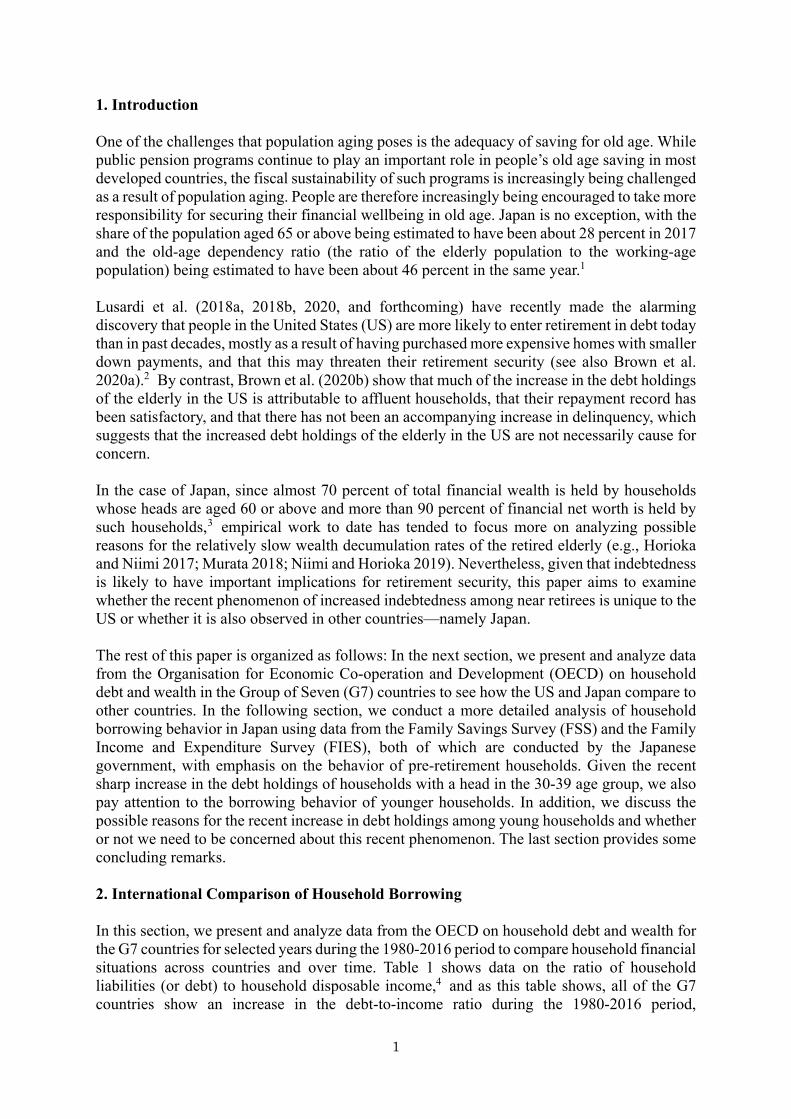
1. Introduction One of the challenges that population aging poses is the adequacy of saving for old age. While public pension programs continue to play an important role in people’s old age saving in most developed countries, the fiscal sustainability of such programs is increasingly being challenged as a result of population aging. People are therefore increasingly being encouraged to take more responsibility for securing their financial wellbeing in old age. Japan is no exception, with the share of the population aged 65 or above being estimated to have been about 28 percent in 2017 and the old-age dependency ratio (the ratio of the elderly population to the working-age population) being estimated to have been about 46 percent in the same year.1 Lusardi et al. (2018a, 2018b, 2020, and forthcoming) have recently made the alarming discovery that people in the United States (US) are more likely to enter retirement in debt today than in past decades, mostly as a result of having purchased more expensive homes with smaller down payments, and that this may threaten their retirement security (see also Brown et al. 2020a).2 By contrast, Brown et al. (2020b) show that much of the increase in the debt holdings of the elderly in the US is attributable to affluent households, that their repayment record has been satisfactory, and that there has not been an accompanying increase in delinquency, which suggests that the increased debt holdings of the elderly in the US are not necessarily cause for concern. In the case of Japan, since almost 70 percent of total financial wealth is held by households whose heads are aged 60 or above and more than 90 percent of financial net worth is held by such households,3 empirical work to date has tended to focus more on analyzing possible reasons for the relatively slow wealth decumulation rates of the retired elderly (e.g., Horioka and Niimi 2017; Murata 2018; Niimi and Horioka 2019). Nevertheless, given that indebtedness is likely to have important implications for retirement security, this paper aims to examine whether the recent phenomenon of increased indebtedness among near retirees is unique to the US or whether it is also observed in other countries—namely Japan. The rest of this paper is organized as follows: In the next section, we present and analyze data from the Organisation for Economic Co-operation and Development (OECD) on household debt and wealth in the Group of Seven (G7) countries to see how the US and Japan compare to other countries. In the following section, we conduct a more detailed analysis of household borrowing behavior in Japan using data from the Family Savings Survey (FSS) and the Family Income and Expenditure Survey (FIES), both of which are conducted by the Japanese government, with emphasis on the behavior of pre-retirement households. Given the recent sharp increase in the debt holdings of households with a head in the 30-39 age group, we also pay attention to the borrowing behavior of younger households. In addition, we discuss the possible reasons for the recent increase in debt holdings among young households and whether or not we need to be concerned about this recent phenomenon. The last section provides some concluding remarks. 2. International Comparison of Household Borrowing In this section, we present and analyze data from the OECD on household debt and wealth for the G7 countries for selected years during the 1980-2016 period to compare household financial situations across countries and over time. Table 1 shows data on the ratio of household liabilities (or debt) to household disposable income,4 and as this table shows, all of the G7 countries show an increase in the debt-to-income ratio during the 1980-2016 period,
2
presumably because of the development of the financial sector over time, which resulted in greater access to credit.
Table 1 here
However, Table 1 also shows some variations in trends across countries. For example, the table confirms the relatively rapid expansion of debt in the US prior to the 2008-2009 financial crisis, though the debt-to-income ratio in the US seems to have declined since then. As for Japan, a relatively large increase in the debt-to-income ratio was observed earlier, from 1990 to 2005.5 While Japan had the highest debt-to-income ratio among the G7 countries during this period, Canada, France, and the United Kingdom (UK) now have a higher ratio than Japan.
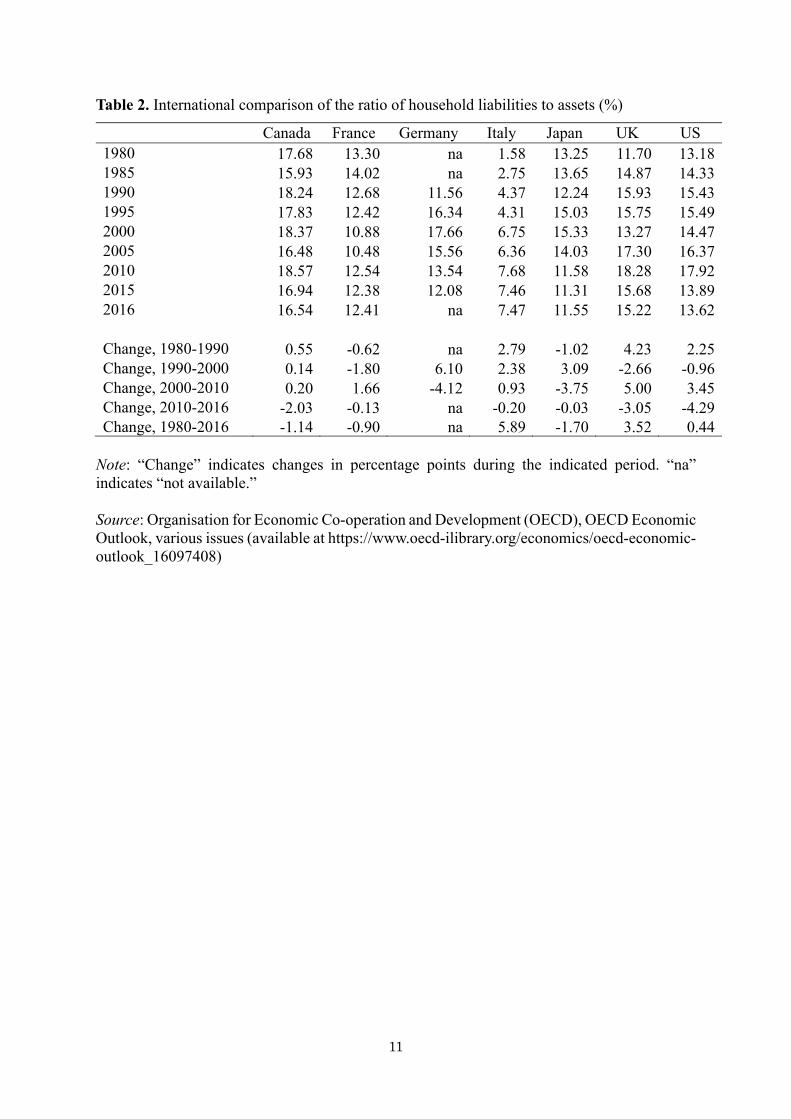
Table 2 here
We turn next to debt-to-asset ratios. Table 2 shows that the amount of debt relative to assets also increased until 2010 in the US (from about 14% in 2000 to about 18% in 2010). Only Canada and the UK had reached this level in 2010, but there has been a decline in the debt-to-asset ratio since then in all three of these countries. In the case of Japan, Table 2 shows that the debt-to-asset ratio peaked earlier (at about 15% in 2000) than in these three countries and that the debt-to-asset ratio actually declined during the 1980-2016 period as a whole. The fact that debt levels relative to income and assets have been declining in Japan since 2000 seems to suggest that the recent phenomenon of increased indebtedness among near retirees in the US is not observed in the case of Japan. However, in order to reach a more definitive conclusion, we need to examine data broken down by age group, which is what we do in the next section. 3. Trends in Household Borrowing Behavior in Japan In this section, we present and analyze data from the Family Savings Survey (FSS) and the Family Income and Expenditure Survey (FIES), conducted by the Statistics Bureau, Ministry of Internal Affairs and Communications, on household borrowing behavior broken down by the 10-year age group of the household head for selected years during the 1980-2017 period. The FSS is a comprehensive survey of household assets and liabilities that was started in 1959 as a supplement to the FIES, the Japanese equivalent of the US Consumer Expenditure Survey. The FSS was fully incorporated into the FIES in 2002, but the data for before and after 2002 are fully comparable. About 8,000 households are randomly selected from throughout Japan using a three-stage stratified sampling method, and thus the sample of the FSS/FIES is representative of the entire population of Japan. However, the two most serious defects of the FSS/FIES are that it does not collect data on holdings of land, housing, and other nonfinancial assets, meaning that the total assets and the total net worth of households cannot be computed, and that it does not collect data on the assets and liabilities of single-person households. Thus, we had no choice but to confine our analysis to two-or-more-person households, but fortunately, the proportion of single-person households is quite small in the 50-59 age group, meaning that excluding them from the analysis will not create any serious problems. Tables 3-10 below show data on two-or-more-person households from these surveys on various
3
aspects of household borrowing behavior broken down by 10-year age group of the household head. 3.1. The borrowing behavior of pre-retirement households
We first analyze the borrowing behavior of pre-retirement households (defined as households with a head in the 50-59 age group) in Japan in an attempt to shed light on whether their debt holdings have increased sharply in recent years, as they have in the US. We focus on the 50-59 age group because the retirement age (not only the age at which workers are required to retire but also the age at which workers can begin receiving public pension benefits) in Japan has until recently been 60. The retirement age is in the process of being raised to 65 but a retirement age of 65 has not yet been fully implemented, so our use of a 60 cut-off is justified.
Table 3 here
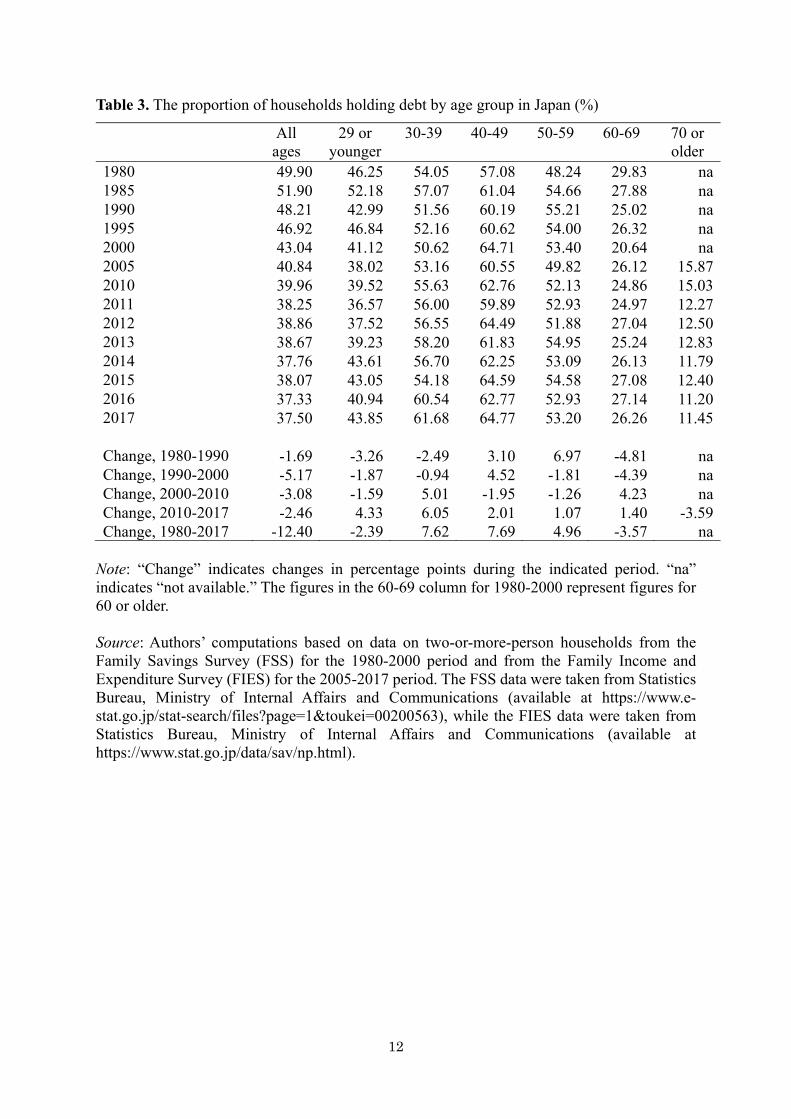
Table 3 shows that while the proportion of households holding debt in the 50-59 age group increased relatively significantly between 1980 and 1985, it was rather stable during the subsequent 1985-2017 period, fluctuating in the relatively narrow range of 50 to 55 percent. Moreover, since households in Japan tend to pay off their housing loans upon retirement, only about one-quarter of households in the 60-69 age group still hold debt. The proportion of households holding debt is even lower among households in the 70 or older age group, and it steadily declined in this age group from about 16 percent in 2005 to about 11 percent in 2017.
Table 4 here
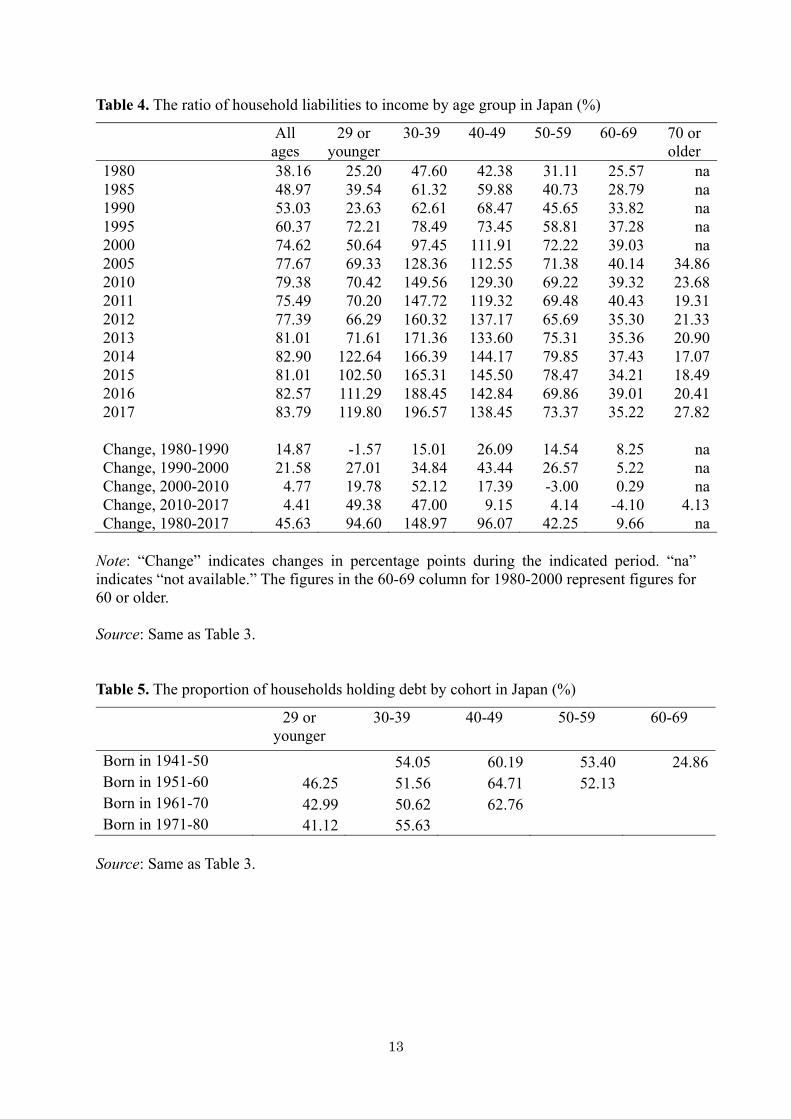
If we look at debt-to-income ratios (see Table 4), we find that the ratio for the 50-59 age group increased significantly between 1980 and 2000, but since then it has been relatively stable, although it increased slightly between 2010 and 2015. By contrast, the debt-to-income ratio was relatively stable in older age groups throughout the 1980-2017 period. The figures in Tables 3 and 4 therefore suggest that pre-retirement households in Japan do not hold inordinate amounts of debt and that there has not been a discernible increase in their debt holdings, suggesting that the recent phenomenon of increased indebtedness among near retirees in the US does not apply in the case of Japan. However, recall from the OECD data on the G7 countries that we presented earlier in Table 1 that the debt-to-income ratio peaked in Japan in 1990-2005, which was much earlier than in the US. Thus, there is a possibility that this might have caused those living through this period to reach retirement with substantial debt, but our earlier findings showed that this was not the case. Lusardi et al.se (2018a, 2018b, 2020, and forthcoming) and Brown et al. (2020b) found that those nearing retirement have shown a sharp increase in their debt holdings in recent years in the US, so it is curious why those nearing retirement in Japan did not show a discernible increase in their debt holdings. A detailed examination of this issue is beyond the scope of this paper, but a likely explanation is as follows. As discussed in the next section, a number of government policies adopted after 2000 such as the deregulation and expansion of the housing credit market made it easier for households to purchase housing, but this had the effect of allowing households to purchase housing at a younger age (in their 30s) than previously. However, most older households (e.g., those in their 40s and 50s) had already purchased

4
housing even before the new measures were implemented so the new measures did not cause any changes in their behavior or cause them to increase their debt holdings.
There was, however, a sharp increase in the debt holdings of the 30-39 age group after 2000, and we turn to a detailed analysis of this phenomenon in the remainder of the paper. 3.2. The borrowing behavior of younger households While increased indebtedness among near retirees has not been observed in Japan thus far, our data show evidence of a sharp increase in borrowing in the 30-39 age group. We therefore examine the borrowing behavior of younger households in more detail to shed light on the extent and the possible causes of the sharp increase in their debt holdings and to explore the possibility that the sharp increase in their debt holdings will threaten their retirement security when they reach retirement age 20 to 30 years from now (see Horioka and Niimi, 2019, for a more detailed analysis). As Table 3 shows, the proportion of households holding debt in the 30-39 age group ¥increased significantly during the 2000-2017 period (from about 51% in 2000 to about 62% in 2017) and the increase was more pronounced than in other age groups. As a consequence, the proportion of households holding debt in the 30-39 age group had almost caught up with that in the 40-49 age group by 2017, even though there was a relatively large gap (about 14 percentage points) in the proportion of households holding debt between these age groups in 2000.
Table 5 here
If we look at trends in the proportion of households holding debt by cohort (Table 5), we find that the proportion of households holding debt in the 30-39 age group increased slightly from about 51 percent for the 1961-70 cohort to about 56 percent for the 1971-80 cohort but that it was also relatively high for the 1941-50 cohort for some reason. Turning to the debt-to-income ratios shown in Table 4, we find that there was a significant increase in this ratio as well for the 30-39 age group. It almost doubled from about 97 percent to about 197 percent during the 2000-2017 period. Although the size of the increase is smaller, we also observe a relatively large increase in the debt-to-income ratio for households whose heads were in their 20s or 40s during this period. Tables 3 and 4 thus suggest that households in younger age groups were not only more likely to take out loans but that they were also taking out larger loans relative to their incomes during the 2000-2017 period.
Table 6 here
Indeed, Table 6 shows that the debt-to-income ratio is much higher for the 1971-80 cohort in comparison to that for older cohorts. The debt-to-income ratio in the 30-39 age group for the 1971-80 cohort was about 150 percent, which is significantly higher than the ratio for the 1961-70 cohort (about 97%) and more than three times higher than the ratio for the 1941-50 cohort (about 48%).
Table 7 here
Table 8 here

5
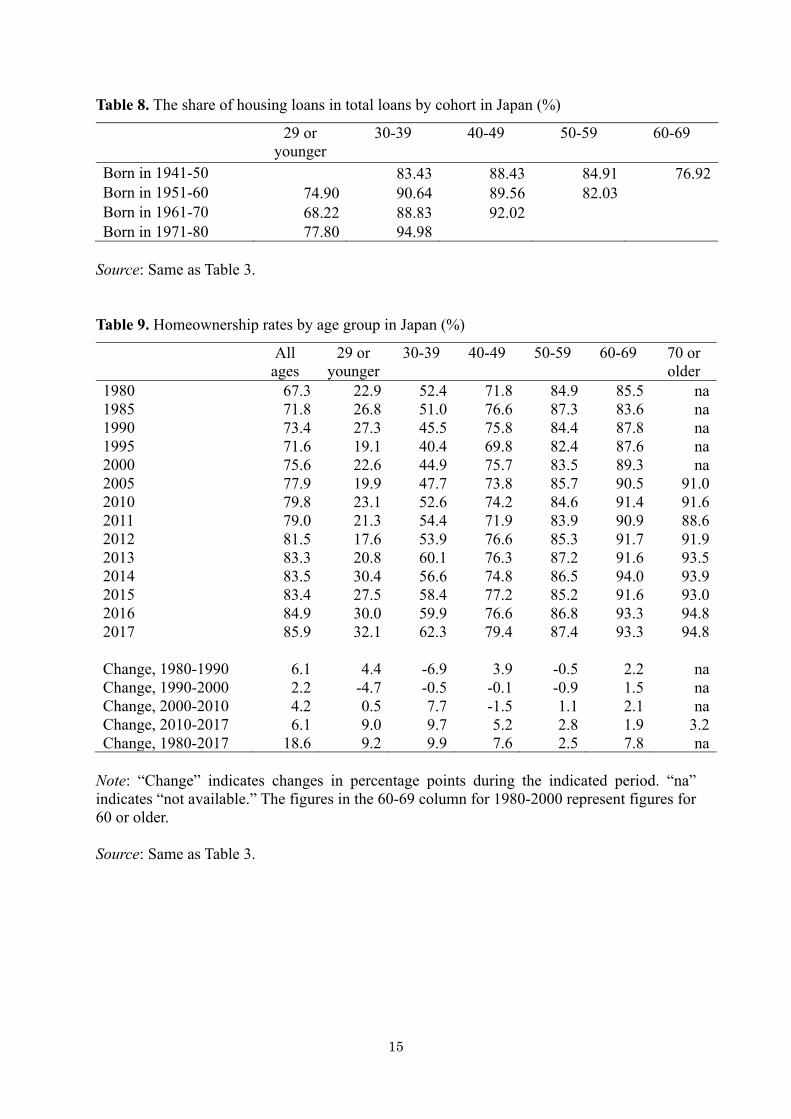
To see whether the recent sharp increase in the debt holdings of relatively young households is due to housing loans or to other types of loans, Table 7 shows the share of housing loans in total loans. This table shows that, as in other age groups, the vast majority (generally 90 to 95%) of loans that households in the 30-39 age group have taken out are housing loans. Table 8 also confirms that the loans that households in the 1971-80 cohort have taken out are largely housing loans, as in the case of older cohorts. In fact, Table 8 shows that there has been an increase in the share of housing loans in total loans in the 30-39 age group from cohort to cohort. All of these trends suggest that households in Japan are purchasing houses at a younger age today than in the past.
Table 9 here Indeed, Table 9 shows that the homeownership rate increased significantly during the 2000-2017 period for the 30-39 age group and, to a lesser extent, for the 29 or younger age group. For instance, in the case of the 30-39 age group, the homeownership rate increased by about 17 percentage points from about 45 to about 62 percent during this period. This provides further corroboration that the increase in household liabilities among relatively young households in recent years has been due largely to an increase in housing purchases.
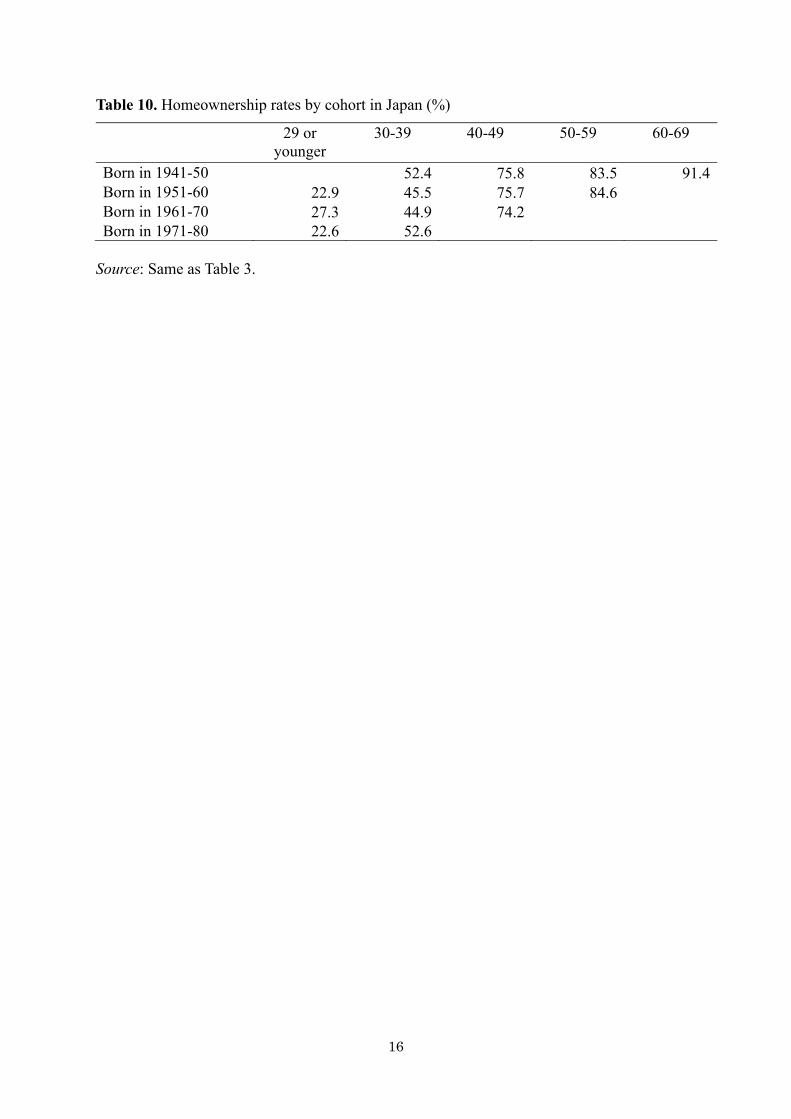
Table 10 here
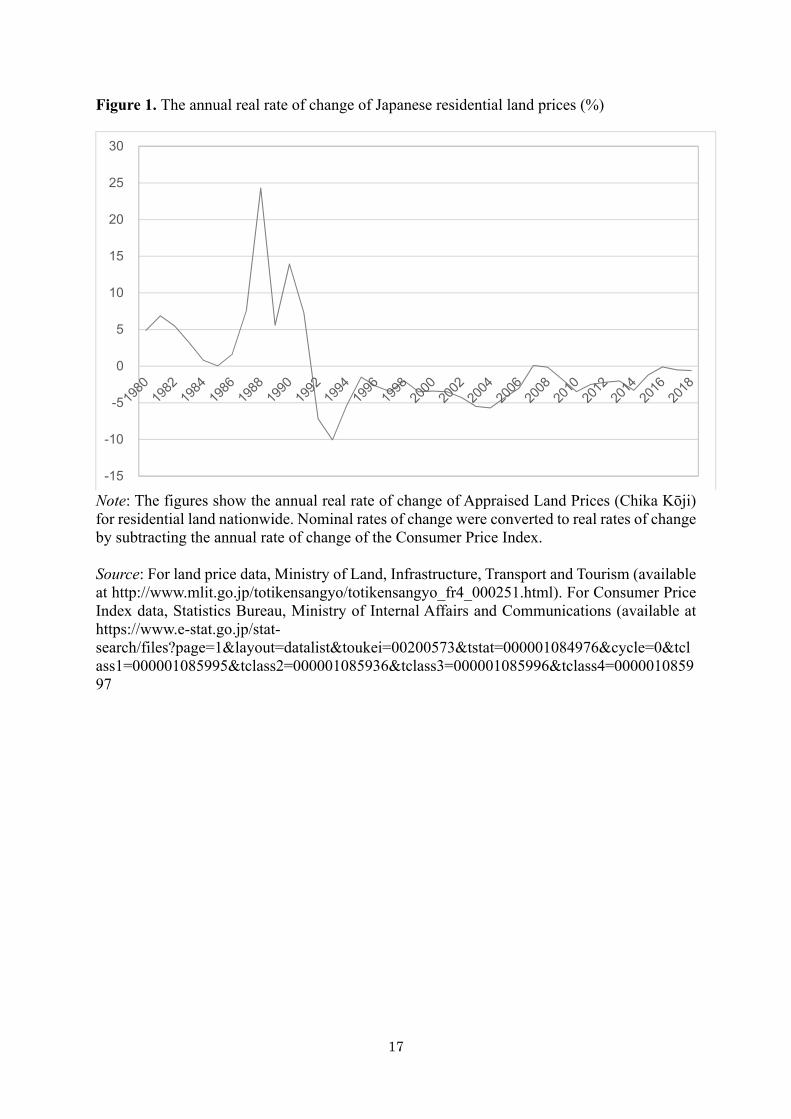
Figure 1 here
However, it is interesting to find that the homeownership rate in the 30-39 age group was already relatively high in 1980. It subsequently declined during the 1980s and 1990s, which may be partly explained by the sharp increase in land prices until the collapse of the bubble economy in the early 1990s, which may have forced households to abandon or to delay their housing purchase plans until a later age (see Figure 1). Table 10 shows that the homeownership rate in the 30-39 age group for the 1971-80 cohort is comparable to that for the 1941-50 cohort. However, what is different between these two cohorts is the debt-to-income ratio. While the average debt-to-income ratio in the 30-39 age group for the 1941-50 cohort was about 48 percent, the ratio for the 1971-80 cohort was about 150 percent (see Table 6). In other words, while the 1971-80 cohort managed to have a homeownership rate that is comparable to that for the 1941-50 cohort, they relied much more on housing loans than the 1941-50 cohort did. This is supported by Table 8, which shows that the share of housing loans in total loans in the 30-39 age group increased from about 83 percent for the 1941-50 cohort to about 95 percent for the 1971-80 cohort.
4. The Causes of the Increase in the Housing Debt of Households with a Head Aged 30-
39 As for why housing purchases and housing loans have increased so much in the 30-39 age group since 2000, it may be due, at least partly, to institutional factors such as the expansion of the system of tax breaks for housing purchase, expansionary monetary policy, and reforms of the housing loan market, which enabled households to purchase housing at a younger age than they could previously. We will discuss each of these factors in turn. 4.1. Tax breaks for housing purchase The Japanese government has offered various tax breaks for housing purchase since 1978,
6
partly to promote homeownership and partly to stimulate the economy as a whole. These tax breaks have typically taken the form of tax deductions that are calculated as a certain percentage (currently 1%) of the outstanding value of housing loans and that are available for a certain number of years (currently 10 years but soon to be extended to 13 years) if certain conditions are met. Given that these tax breaks for housing purchase have been repeatedly expanded, they are likely to have promoted housing purchases as well as the use of housing loans to finance these purchases. 4.2. Monetary policy The Bank of Japan has maintained an expansionary monetary policy since at least September 1995, and in particular, it has pursued a so-called “zero interest rate policy” since February 1999 (except during the August 2000 to March 2001 period). This led to a sharp decline in all interest rates, and interest rates on housing loans were no exception. Moreover, the Bank of Japan has pursued quantitative easing policies since 2001 and quantitative and qualitative easing policies since 2013, and this has increased the supply of credit, including housing credit. The decline in interest rates and the increased supply of credit are likely to have promoted housing purchases as well as the use of housing loans to finance these purchases. 4.3. Reforms of the housing loan market In light of the poor housing conditions and the low homeownership rate in Japan in the early postwar period, the Japanese government established the Government Housing Loan Corporation (GHLC, Jūtaku Kin’yū Kōko), a government agency whose purpose was to provide long-term fixed- and low-interest rate loans to households wishing to purchase or construct housing, in 1950. In the early postwar years, the GHLC was the primary source of housing loans, but private financial institutions began offering housing loans in the 1970s and 1980s. Moreover, in 1994, the Ministry of Finance liberalized the housing loan market and allowed private financial institutions to freely set the terms and interest rates of housing loans. This led to intense competition among private financial institutions for housing loans. As a result of growing concern that GHLC loans would crowd out private housing credit, it was decided in 2001 that the GHLC would be abolished as part of the reform of special public corporations, and in 2003, a law governing the restructuring of the GHLC was passed that provided for the abolition of the GHLC in 2007 and its replacement by the newly created Japan Housing Finance Agency (JHF, Jūtaku Kin’yū Shien Kikō). At the same time, it was decided that the GHLC would scale back its provision of housing loans and shift its focus to securitizing and guaranteeing private-sector housing loans. The GHLC started its securitization operations in 2003, and these operations were taken over by the JHF following the abolition of the GHLC in 2007. Thus, whereas the primary role of the GHLC was to provide housing loans directly to households, the JHF’s primary role is to help private financial institutions to provide housing loans by securitizing and guaranteeing a type of long-term fixed-rate housing loan offered by private financial institutions called Flat 35. More specifically, the JHF purchases such housing loans from private financial institutions, issues mortgage-backed securities, and guarantees that investors in these securities will receive payment of the principal and interest on schedule. The government decided to assume the role of securitizing and guaranteeing private housing loans because, although the securitization of housing loans started in 1999, the securitization market for private label securities was too small to replace GHLC lending.
7
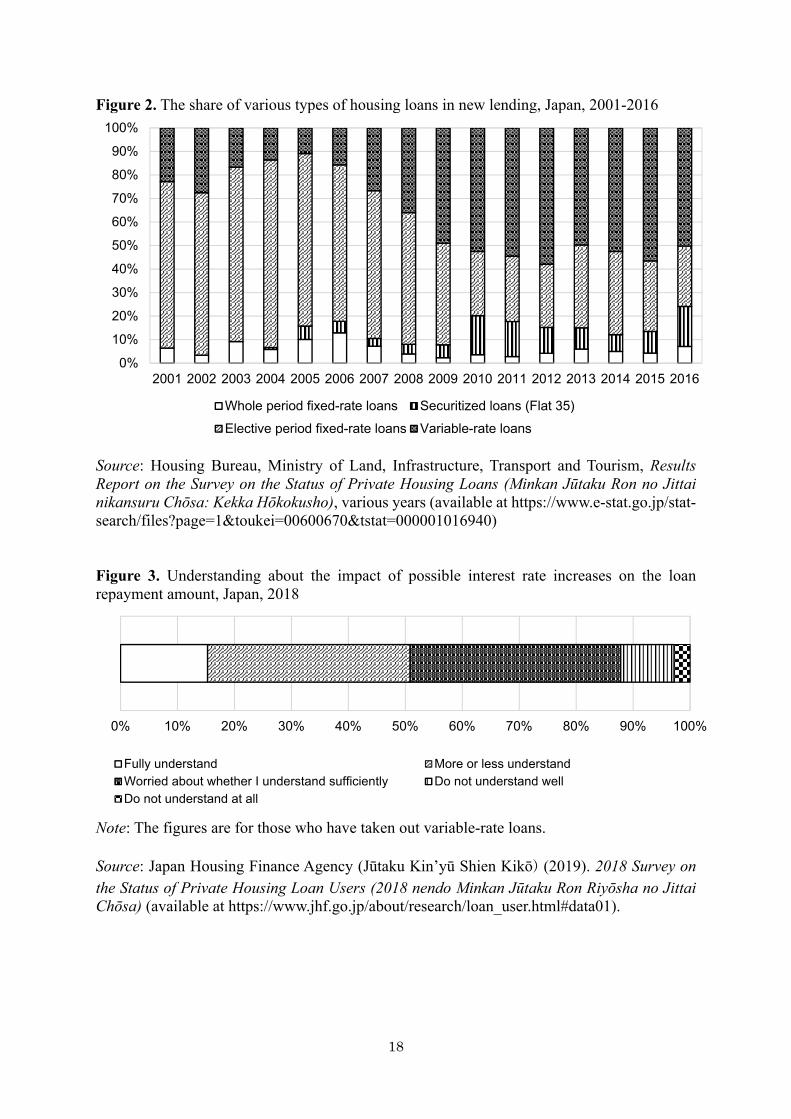
The end result of these reforms is that the housing finance system was greatly liberalized with the role of private sector expanding relative to that of the government sector and with the choices available to households broadening to include not only fixed-rate loans but also variable-rate loans. Figure 2, for example, shows the shares of various types of housing loans in the case of new lending during the 2001-2016 period. One of the most noticeable trends in this figure is a significant increase in the share of variable-rate loans since the mid-2000s. Its share was only about 23 percent in 2001 but increased to about 50 percent in 2016. By contrast, the share of elective period fixed-rate loans, a hybrid product whose interest rate is fixed for a pre-determined number of years before becoming variable, declined sharply during this period. Note that, as of 2016, the most common form of elective period fixed-rate loans was fixed-rate loans for the 10-year period (about 49% of all elective period fixed-rate loans).6
Figure 2 here
These reforms of the housing finance system increased the choices available to homebuyers, and in conjunction with the low interest rates that have prevailed in recent years, they made it easier and more affordable to take out housing loans (see Kobayashi (2016) and Yamori and Kondo (2008) for more details). 4.4. Summary In sum, all three factors have played some role in encouraging households to purchase housing and to finance their purchases using housing loans and in enabling them to do so at an earlier age since 2000. Nevertheless, a rigorous analysis is certainly needed to determine the contribution of each of these factors to the recent increase in debt holding among young households. 5. Do We Need to Be Concerned? One of the questions that arise from recent trends in the borrowing behavior of young households is whether or not we need to be concerned about their implications for their retirement security. If the recent trend merely reflects the fact that households are purchasing houses at an earlier stage in their life cycles, we may not need to be overly concerned. However, as we saw earlier, the 1971-80 cohort seems to be relying more on housing loans for housing purchases than older cohorts, and the debt-to-income ratio in the 30-39 age group for the 1971-80 cohort increased significantly relative to those for older cohorts. If the debt-to-income ratio in the 40-49 age group for the 1971-80 cohort remains relatively high in 2020, we may need to monitor closely their loan repayment patterns as they approach retirement age. Another cause for concern is the fact that it has become increasingly more common to take out variable-rate housing loans over the last few decades (see Figure 2). As long as interest rates are kept low, this should not be a major concern. Nevertheless, if and when the Bank of Japan normalizes its monetary policy, this will certainly affect households’ loan repayment capacity. Given that interest rates have been kept low for so long in Japan, some households may not be fully aware of the risk associated with variable-rate loans.
Figure 3 here
Figure 4 here

8
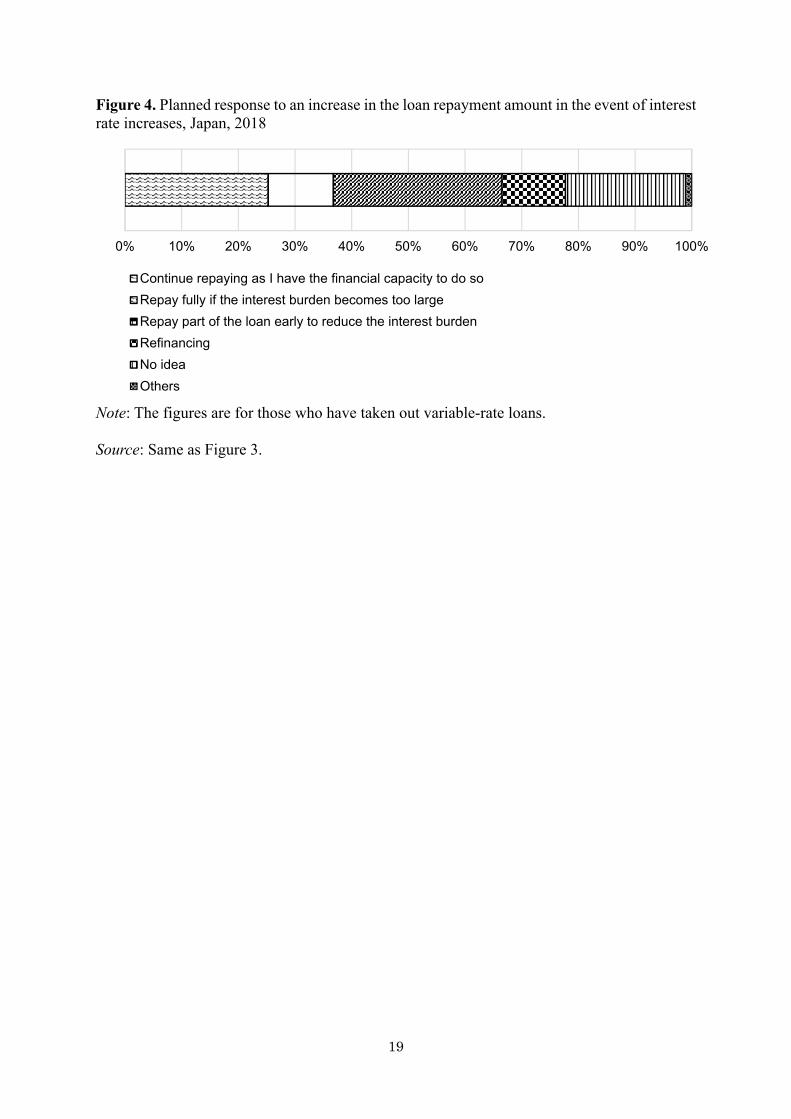
Figure 3, for example, shows that about 12 percent of those who have taken out variable-rate housing loans do not seem to understand the implications of interest rate increases for loan repayment amounts. In addition, about 37 percent of them are worried about whether or not they understand this risk sufficiently. This suggests that Japan may see a group of households who encounter difficulties in repaying their housing loans if and when interest rates are increased. It is indeed worrying to find that about one-fifth of those who have taken out variable-rate housing loans do not seem to have thought through possible ways of responding to the increase in the loan repayment amount that will occur if and when interest rates are increased (see Figure 4). Thanks to a number of government policies that have been implemented to promote housing purchases over the last few decades, households have more choices for housing loans and these loans seem to have become more affordable. However, given that the level of understanding of the risks associated with the type of housing loan they chose appears to be relatively low for many households, the recent increase in debt holdings among young households raises some concerns about their retirement security 20 to 30 years from now, particularly if the Bank of Japan normalizes its monetary policy in the future. Thus, as in the case of the US, the low level of financial literacy, especially with respect to the complexities of housing loans, seems to be a serious problem in Japan and needs to be urgently rectified (see Sekita (2011) for an analysis of financial literacy and of the impact of financial literacy on asset and debt management and retirement security in Japan and Clark and Liu (2020) and Lusardi et al. (2020) for similar analyses for the US).
6. Conclusion In this paper, we analyzed the borrowing behavior of Japanese households in comparison to the other G7 countries and also broken down by the age group of the household head. We found that pre-retirement households (households with a head in the 50-59 age group) in Japan do not have inordinate amounts of debt and that their financial health is satisfactory. However, we also found that households with a head in the 30-39 age group have shown a sharp increase in debt holdings in recent years, due largely to the fact that tax breaks for housing purchase, reforms in the housing loan market since the early 2000s, and expansionary monetary policy enabled Japanese households to purchase housing at a younger age than they could previously. We therefore need to monitor the borrowing behavior of this cohort over time as the Bank of Japan normalizes its monetary policy, especially since households have become more vulnerable to rising interest rates as the share of households who have chosen variable-rate housing loans has increased in recent years. Moreover, there is an urgent need to raise the financial literacy of this cohort, especially with respect to the complexities of housing loans, so that it is able to manage its assets and debt properly as it approaches its retirement years. Turning finally to directions for further research, we have looked only at average figures for each age group but studies for the US find enormous heterogeneity by gender, marital status, ethnicity, income, educational attainment, and other demographic characteristics (e.g., Lusardi et al. 2018b, 2020, and forthcoming; Brown et al. 2020a; Brown et al. 2020b; and Clark and Liu 2020). An important direction for further research is to take account of heterogeneity in the case of Japan as well.

9
References Brown, J., K. Dynan, and T. Figinski (2020a). ‘The Risk of Financial Hardship in Retirement:
A Cohort Analysis,’ in O. S. Mitchell and A. Lusardi, eds., Remaking Retirement: Debt in an Aging Economy. Oxford, UK: Oxford University Press.
Brown, M., D. Lee, J. Scally, and W. van der Klaauw (2020b). ‘The Graying of American Debt,’ in O. S. Mitchell and A. Lusardi, eds., Remaking Retirement: Debt in an Aging Economy. Oxford, UK: Oxford University Press.
Clark, R. L. and S. Liu (2020). ‘Financial Well-being of State and Local Government Retirees in North Carolina,’ in O. S. Mitchell and A. Lusardi, eds., Remaking Retirement: Debt in an Aging Economy. Oxford, UK: Oxford University Press.
Horioka, C. Y. (2012). ‘Are Japanese Households Financially Healthy, If So, Why?’ Japanese Economy, 39(4): 109-124.
Horioka, C. Y. and Y. Niimi (2017). ‘Nihon no Kōreisha Setai no Chochiku Kōdō nikansuru Jisshō Bunseki (An Empirical Analysis of the Saving Behavior of Elderly Households in Japan),’ Keizai Bunseki (Economic Analysis), 196: 29-47 (in Japanese).
Horioka, C. Y. and Y. Niimi (2019). ‘Was the Expansion of Housing Credit in Japan Good or Bad?” mimeo., Research Institute for Economics and Business Administration, Kobe University, Nada, Kobe, Hyogo, Japan.
Kobayashi, M. (2016). ‘The Housing Market and Housing Policies in Japan,’ ADBI Working Paper Series No. 558, Tokyo, Japan: Asian Development Bank Institute.
Lusardi, A., O. S. Mitchell, and N. Oggero (2018a). ‘The Changing Face of Debt and Financial Fragility at Older Ages,’ AEA (American Economic Association) Papers and Proceedings, 108: 407-411.
Lusardi, A., O. S. Mitchell, and N. Oggero (2018b). ‘Understanding Debt at Older Ages and Its Implications for Retirement Well-being,’ Pension Research Council Working Paper PRC WP2018-11, Philadelphia, PA: Pension Research Council, Wharton School, University of Pennsylvania.
Lusardi, A., O. S. Mitchell, and N. Oggero (2020). ‘Debt Close to Retirement and Its Implications for Retirement Well-being,’ in O. S. Mitchell and A. Lusardi, eds., Remaking Retirement: Debt in an Aging Economy. Oxford, UK: Oxford University Press.
Lusardi, A., O. S. Mitchell, and N. Oggero (forthcoming). ‘Debt and Financial Vulnerability on the Verge of Retirement,’ Journal of Money, Credit and Banking.
Murata, K. (2018). ‘Dissaving by the Elderly in Japan: Empirical Evidence from Survey Data,’ ESRI Discussion Paper Series No. 346, Tokyo, Japan: Economic and Social Research Institute.
Niimi, Y. and C. Y. Horioka (2019). ‘The Wealth Decumulation Behavior of the Retired Elderly in Japan: The Relative Importance of Precautionary Saving and Bequest Motives,’ Journal of the Japanese and International Economies, 51: 52-63.
Sekita, S. (2011). ‘Financial Literacy and Retirement Planning in Japan,’ Journal of Pension Economics and Finance, 10(4): 637-656.
Yamori, N. and K. Kondo (2008). ‘How Has Japan Housing Finance Agency’s Flat 35 Affected Regional Housing Loan Markets,’ Government Auditing Review, 15: 63-76.

10
Table 1. International comparison of the ratio of household liabilities to income (%)
Canada France Germany Italy Japan UK US 1980 87 62 15 8 77 57 77 1985 76 63 17 9 89 86 88 1990 93 79 70 29 132 116 87 1995 103 66 97 32 130 106 93 2000 113 69 116 55 134 118 100 2005 132 87 108 59 134 154 130 2010 161 113 98 77 116 155 124 2015 167 115 93 75 111 141 105 2016 172 118 93 74 113 146 106 Change, 1980-1990 6 17 55 21 55 59 10 Change, 1990-2000 20 -10 46 26 2 2 13 Change, 2000-2010 48 44 -18 22 -28 37 24 Change, 2010-2016 11 5 -5 -3 7 -9 -18 Change, 1980-2016 85 56 78 66 36 89 29
Note: “Change” indicates changes in percentage points during the indicated period. Source: Organisation for Economic Co-operation and Development (OECD), OECD Economic Outlook, various issues (available at https://www.oecd-ilibrary.org/economics/oecd-economic-outlook_16097408)
11
Table 2. International comparison of the ratio of household liabilities to assets (%)
Canada France Germany Italy Japan UK US 1980 17.68 13.30 na 1.58 13.25 11.70 13.18 1985 15.93 14.02 na 2.75 13.65 14.87 14.33 1990 18.24 12.68 11.56 4.37 12.24 15.93 15.43 1995 17.83 12.42 16.34 4.31 15.03 15.75 15.49 2000 18.37 10.88 17.66 6.75 15.33 13.27 14.47 2005 16.48 10.48 15.56 6.36 14.03 17.30 16.37 2010 18.57 12.54 13.54 7.68 11.58 18.28 17.92 2015 16.94 12.38 12.08 7.46 11.31 15.68 13.89 2016 16.54 12.41 na 7.47 11.55 15.22 13.62 Change, 1980-1990 0.55 -0.62 na 2.79 -1.02 4.23 2.25 Change, 1990-2000 0.14 -1.80 6.10 2.38 3.09 -2.66 -0.96 Change, 2000-2010 0.20 1.66 -4.12 0.93 -3.75 5.00 3.45 Change, 2010-2016 -2.03 -0.13 na -0.20 -0.03 -3.05 -4.29 Change, 1980-2016 -1.14 -0.90 na 5.89 -1.70 3.52 0.44
Note: “Change” indicates changes in percentage points during the indicated period. “na” indicates “not available.” Source: Organisation for Economic Co-operation and Development (OECD), OECD Economic Outlook, various issues (available at https://www.oecd-ilibrary.org/economics/oecd-economic-outlook_16097408)
12
Table 3. The proportion of households holding debt by age group in Japan (%)
All ages
29 or younger
30-39 40-49 50-59 60-69 70 or older
1980 49.90 46.25 54.05 57.08 48.24 29.83 na 1985 51.90 52.18 57.07 61.04 54.66 27.88 na 1990 48.21 42.99 51.56 60.19 55.21 25.02 na 1995 46.92 46.84 52.16 60.62 54.00 26.32 na 2000 43.04 41.12 50.62 64.71 53.40 20.64 na 2005 40.84 38.02 53.16 60.55 49.82 26.12 15.87 2010 39.96 39.52 55.63 62.76 52.13 24.86 15.03 2011 38.25 36.57 56.00 59.89 52.93 24.97 12.27 2012 38.86 37.52 56.55 64.49 51.88 27.04 12.50 2013 38.67 39.23 58.20 61.83 54.95 25.24 12.83 2014 37.76 43.61 56.70 62.25 53.09 26.13 11.79 2015 38.07 43.05 54.18 64.59 54.58 27.08 12.40 2016 37.33 40.94 60.54 62.77 52.93 27.14 11.20 2017 37.50 43.85 61.68 64.77 53.20 26.26 11.45 Change, 1980-1990 -1.69 -3.26 -2.49 3.10 6.97 -4.81 na Change, 1990-2000 -5.17 -1.87 -0.94 4.52 -1.81 -4.39 na Change, 2000-2010 -3.08 -1.59 5.01 -1.95 -1.26 4.23 na Change, 2010-2017 -2.46 4.33 6.05 2.01 1.07 1.40 -3.59 Change, 1980-2017 -12.40 -2.39 7.62 7.69 4.96 -3.57 na
Note: “Change” indicates changes in percentage points during the indicated period. “na” indicates “not available.” The figures in the 60-69 column for 1980-2000 represent figures for 60 or older. Source: Authors’ computations based on data on two-or-more-person households from the Family Savings Survey (FSS) for the 1980-2000 period and from the Family Income and Expenditure Survey (FIES) for the 2005-2017 period. The FSS data were taken from Statistics Bureau, Ministry of Internal Affairs and Communications (available at https://www.e-stat.go.jp/stat-search/files?page=1&toukei=00200563), while the FIES data were taken from Statistics Bureau, Ministry of Internal Affairs and Communications (available at https://www.stat.go.jp/data/sav/np.html).
13
Table 4. The ratio of household liabilities to income by age group in Japan (%)
All ages
29 or younger
30-39 40-49 50-59 60-69 70 or older
1980 38.16 25.20 47.60 42.38 31.11 25.57 na 1985 48.97 39.54 61.32 59.88 40.73 28.79 na 1990 53.03 23.63 62.61 68.47 45.65 33.82 na 1995 60.37 72.21 78.49 73.45 58.81 37.28 na 2000 74.62 50.64 97.45 111.91 72.22 39.03 na 2005 77.67 69.33 128.36 112.55 71.38 40.14 34.86 2010 79.38 70.42 149.56 129.30 69.22 39.32 23.68 2011 75.49 70.20 147.72 119.32 69.48 40.43 19.31 2012 77.39 66.29 160.32 137.17 65.69 35.30 21.33 2013 81.01 71.61 171.36 133.60 75.31 35.36 20.90 2014 82.90 122.64 166.39 144.17 79.85 37.43 17.07 2015 81.01 102.50 165.31 145.50 78.47 34.21 18.49 2016 82.57 111.29 188.45 142.84 69.86 39.01 20.41 2017 83.79 119.80 196.57 138.45 73.37 35.22 27.82 Change, 1980-1990 14.87 -1.57 15.01 26.09 14.54 8.25 na Change, 1990-2000 21.58 27.01 34.84 43.44 26.57 5.22 na Change, 2000-2010 4.77 19.78 52.12 17.39 -3.00 0.29 na Change, 2010-2017 4.41 49.38 47.00 9.15 4.14 -4.10 4.13 Change, 1980-2017 45.63 94.60 148.97 96.07 42.25 9.66 na
Note: “Change” indicates changes in percentage points during the indicated period. “na” indicates “not available.” The figures in the 60-69 column for 1980-2000 represent figures for 60 or older. Source: Same as Table 3. Table 5. The proportion of households holding debt by cohort in Japan (%)
29 or younger
30-39 40-49 50-59 60-69
Born in 1941-50 54.05 60.19 53.40 24.86 Born in 1951-60 46.25 51.56 64.71 52.13 Born in 1961-70 42.99 50.62 62.76 Born in 1971-80 41.12 55.63
Source: Same as Table 3.

14
Table 6. The ratio of household liabilities to income by cohort in Japan (%)
29 or younger
30-39 40-49 50-59 60-69
Born in 1941-50 47.60 68.47 72.22 39.32 Born in 1951-60 25.20 62.61 111.91 69.22 Born in 1961-70 23.63 97.45 129.30 Born in 1971-80 50.64 149.56
Source: Same as Table 3. Table 7. The share of household housing loans in total loans by age group in Japan (%)
All ages
29 or younger
30-39 40-49 50-59 60-69 70 or older
1980 80.98 74.90 83.43 84.39 77.10 67.98 na 1985 80.67 72.85 90.20 82.31 80.97 48.76 na 1990 87.61 68.22 90.64 88.43 87.41 82.37 na 1995 87.71 88.02 91.26 86.50 86.99 87.42 na 2000 86.05 77.80 88.83 89.56 84.91 77.99 na 2005 86.63 87.23 93.86 90.14 81.07 75.89 82.04 2010 88.14 88.09 94.98 92.02 82.03 76.92 76.85 2011 88.53 87.78 94.77 93.23 84.57 75.22 75.56 2012 89.77 89.42 94.94 93.35 86.19 77.66 75.00 2013 89.78 89.19 94.36 92.86 86.66 80.88 75.27 2014 89.98 92.11 94.77 92.77 85.32 83.57 75.64 2015 89.38 91.67 95.47 93.07 83.10 80.61 75.90 2016 89.15 92.44 94.96 93.03 82.91 82.73 68.89 2017 89.56 94.27 94.10 93.65 87.52 79.02 71.07 Change, 1980-1990 6.63 -6.68 7.21 4.05 10.32 14.39 na Change, 1990-2000 -1.57 9.58 -1.81 1.12 -2.50 -4.38 na Change, 2000-2010 2.09 10.29 6.15 2.46 -2.88 -1.07 na Change, 2010-2017 1.42 6.18 -0.88 1.63 5.49 2.10 -5.78 Change, 2000-2017 8.57 19.37 10.67 9.26 10.42 11.05 na
Note: “Change” indicates changes in percentage points during the indicated period. “na” indicates “not available.” The figures in the 60-69 column for 1980-2000 represent figures for 60 or older. Source: Same as Table 3.
15
Table 8. The share of housing loans in total loans by cohort in Japan (%)
29 or younger
30-39 40-49 50-59 60-69
Born in 1941-50 83.43 88.43 84.91 76.92 Born in 1951-60 74.90 90.64 89.56 82.03 Born in 1961-70 68.22 88.83 92.02 Born in 1971-80 77.80 94.98
Source: Same as Table 3. Table 9. Homeownership rates by age group in Japan (%)
All ages
29 or younger
30-39 40-49 50-59 60-69 70 or older
1980 67.3 22.9 52.4 71.8 84.9 85.5 na 1985 71.8 26.8 51.0 76.6 87.3 83.6 na 1990 73.4 27.3 45.5 75.8 84.4 87.8 na 1995 71.6 19.1 40.4 69.8 82.4 87.6 na 2000 75.6 22.6 44.9 75.7 83.5 89.3 na 2005 77.9 19.9 47.7 73.8 85.7 90.5 91.0 2010 79.8 23.1 52.6 74.2 84.6 91.4 91.6 2011 79.0 21.3 54.4 71.9 83.9 90.9 88.6 2012 81.5 17.6 53.9 76.6 85.3 91.7 91.9 2013 83.3 20.8 60.1 76.3 87.2 91.6 93.5 2014 83.5 30.4 56.6 74.8 86.5 94.0 93.9 2015 83.4 27.5 58.4 77.2 85.2 91.6 93.0 2016 84.9 30.0 59.9 76.6 86.8 93.3 94.8 2017 85.9 32.1 62.3 79.4 87.4 93.3 94.8 Change, 1980-1990 6.1 4.4 -6.9 3.9 -0.5 2.2 na Change, 1990-2000 2.2 -4.7 -0.5 -0.1 -0.9 1.5 na Change, 2000-2010 4.2 0.5 7.7 -1.5 1.1 2.1 na Change, 2010-2017 6.1 9.0 9.7 5.2 2.8 1.9 3.2 Change, 1980-2017 18.6 9.2 9.9 7.6 2.5 7.8 na
Note: “Change” indicates changes in percentage points during the indicated period. “na” indicates “not available.” The figures in the 60-69 column for 1980-2000 represent figures for 60 or older. Source: Same as Table 3.
16
Table 10. Homeownership rates by cohort in Japan (%)
29 or younger
30-39 40-49 50-59 60-69
Born in 1941-50 52.4 75.8 83.5 91.4 Born in 1951-60 22.9 45.5 75.7 84.6 Born in 1961-70 27.3 44.9 74.2 Born in 1971-80 22.6 52.6
Source: Same as Table 3.
17
Figure 1. The annual real rate of change of Japanese residential land prices (%)
Note: The figures show the annual real rate of change of Appraised Land Prices (Chika Kōji) for residential land nationwide. Nominal rates of change were converted to real rates of change by subtracting the annual rate of change of the Consumer Price Index. Source: For land price data, Ministry of Land, Infrastructure, Transport and Tourism (available at http://www.mlit.go.jp/totikensangyo/totikensangyo_fr4_000251.html). For Consumer Price Index data, Statistics Bureau, Ministry of Internal Affairs and Communications (available at https://www.e-stat.go.jp/stat-search/files?page=1&layout=datalist&toukei=00200573&tstat=000001084976&cycle=0&tclass1=000001085995&tclass2=000001085936&tclass3=000001085996&tclass4=000001085997
-15
-10
-5
0
5
10
15
20
25
30
18
Figure 2. The share of various types of housing loans in new lending, Japan, 2001-2016
Source: Housing Bureau, Ministry of Land, Infrastructure, Transport and Tourism, Results Report on the Survey on the Status of Private Housing Loans (Minkan Jūtaku Ron no Jittai nikansuru Chōsa: Kekka Hōkokusho), various years (available at https://www.e-stat.go.jp/stat-search/files?page=1&toukei=00600670&tstat=000001016940) Figure 3. Understanding about the impact of possible interest rate increases on the loan repayment amount, Japan, 2018
Note: The figures are for those who have taken out variable-rate loans. Source: Japan Housing Finance Agency (Jūtaku Kin’yū Shien Kikō) (2019). 2018 Survey on the Status of Private Housing Loan Users (2018 nendo Minkan Jūtaku Ron Riyōsha no Jittai Chōsa) (available at https://www.jhf.go.jp/about/research/loan_user.html#data01).
0%
10%
20%
30%
40%
50%
60%
70%
80%
90%
100%
2001 2002 2003 2004 2005 2006 2007 2008 2009 2010 2011 2012 2013 2014 2015 2016
Whole period fixed-rate loans Securitized loans (Flat 35)
Elective period fixed-rate loans Variable-rate loans
0% 10% 20% 30% 40% 50% 60% 70% 80% 90% 100%
Fully understand More or less understandWorried about whether I understand sufficiently Do not understand wellDo not understand at all
19
Figure 4. Planned response to an increase in the loan repayment amount in the event of interest rate increases, Japan, 2018
Note: The figures are for those who have taken out variable-rate loans. Source: Same as Figure 3.
0% 10% 20% 30% 40% 50% 60% 70% 80% 90% 100%
Continue repaying as I have the financial capacity to do so
Repay fully if the interest burden becomes too large
Repay part of the loan early to reduce the interest burden
Refinancing
No idea
Others
20
Endnotes
1 These figures are taken from the 2019 Population Statistics, provided by the National Institute of Population and Social Security Research (available at http://www.ipss.go.jp/syoushika/tohkei/Popular/Popular2019.asp?chap=0). 2 See Lusardi et al. (forthcoming) for a useful review of the literature on possible reasons for the rapid increase in debt holdings in the US. 3 These figures are based on data on two-or-more-person households from Statistics Bureau, Ministry of Internal Affairs and Communications, Annual Report on the Family Income and Expenditure Survey, Volume II: Savings and Liabilities, 2017 edition (http://www.stat.go.jp/data/sav/2017np/index.html). 4 Income here refers to household net disposable income, which is defined as the sum of household final consumption expenditure and saving minus the change in net equity of households in pension funds. This indicator corresponds to the sum of wages and salaries, mixed income, net property income, net current transfers, and social benefits other than social transfers in kind, less taxes on income and social wealth and social security contributions paid by employees, the self-employed and the unemployed (https://data.oecd.org/hha/household-disposable-income.htm). 5 Horioka (2012) provides earlier data for Japan, which show that the upward trend in debt levels in Japan started as early as 1955. 6 Housing Bureau, Ministry of Land, Infrastructure, Transport and Tourism (2018). 2017 Results Report on the Survey on the Status of Private Housing Loans (Minkan Jūtaku Ro-n no Jittai nikansuru Chōsa: Kekka Hōkokusho) (available at https://www.e-stat.go.jp/stat-search/files?page=1&toukei=00600670&tstat=000001016940).