Embed Size (px)
Citation preview
1
Household Income and
Expenditure 2012 Household Budget Survey
BySanjev Bhonoo
18 November 2013

2
Household Budget Survey 2012
• Survey on private non-institutional households conducted in
Mauritius and Rodrigues
• Period : January to December 2012
• 6720 households surveyed
• Main data items: income and expenditure
• Conducted every 5 years to take account of the changes in the
consumption pattern of the population (ILO recommendation)

3
Objectives of the Household Budget Survey
• Determine the content of Consumer Price Index (CPI)
basket
• Estimate weight (importance) of each item in the basket
• Distribution of household income and expenditure
• Poverty analysis and other analyses
4
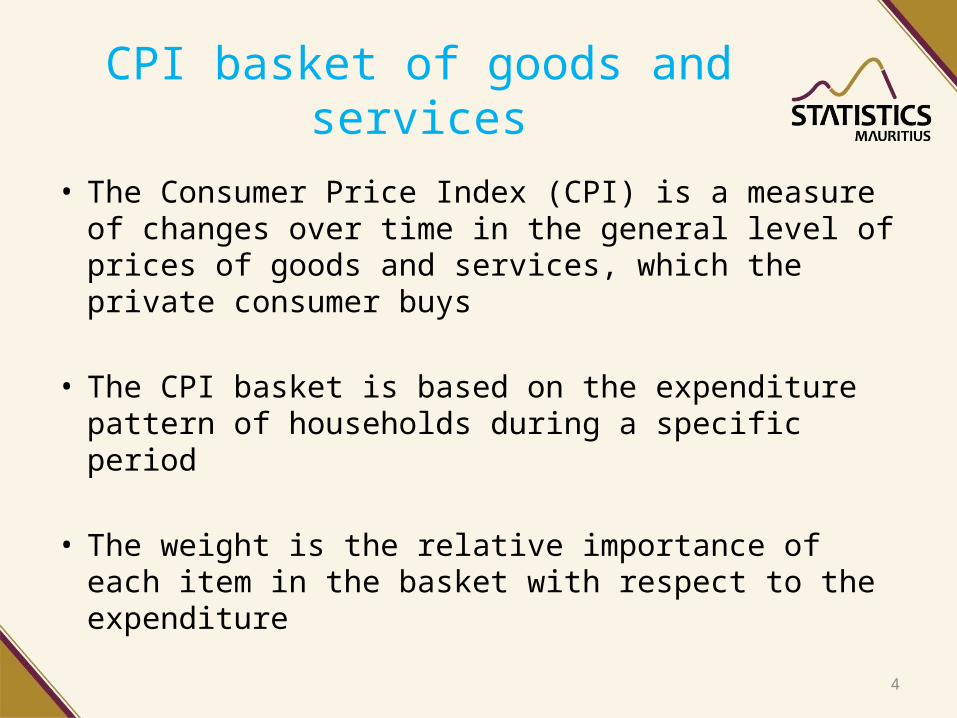
CPI basket of goods and services
• The Consumer Price Index (CPI) is a measure of changes over time in the general level of prices of goods and services, which the private consumer buys
• The CPI basket is based on the expenditure pattern of households during a specific period
• The weight is the relative importance of each item in the basket with respect to the expenditure
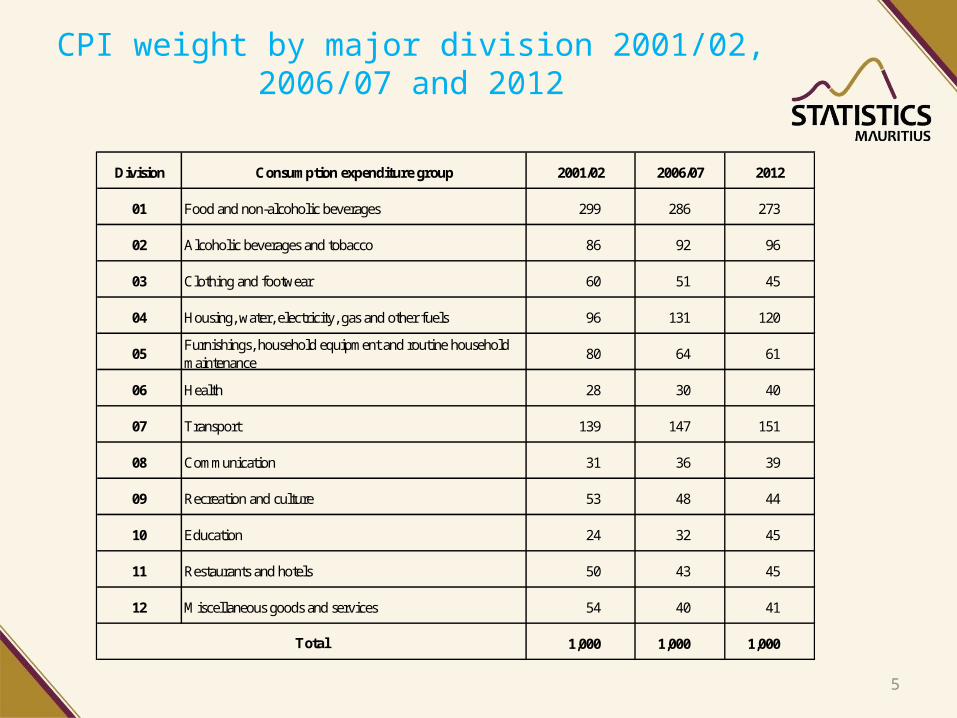
CPI weight by major division 2001/02, 2006/07 and 2012
5
Division Consumption expenditure group 2001/02 2006/07 2012
01 Food and non-alcoholic beverages 299 286 273
02 Alcoholic beverages and tobacco 86 92 96
03 Clothing and footwear 60 51 45
04 Housing, water, electricity, gas and other fuels 96 131 120
05Furnishings, household equipment and routine household maintenance
80 64 61
06 Health 28 30 40
07 Transport 139 147 151
08 Communication 31 36 39
09 Recreation and culture 53 48 44
10 Education 24 32 45
11 Restaurants and hotels 50 43 45
12 Miscellaneous goods and services 54 40 41
1,000 1,000 1,000 Total

6
Major changes in weight by selected division 2001/02, 2006/07 & 2012
Food Furnishings, hh equip etc.
Transport Alc. Bev. & tobacco
Education Health0
50
100
150
200
250
300
350
299
80
139
86
24 28
286
64
147
92
32 30
273
61
151
96
45 40
2001/02 2006/07 2012
Major decreases
Major increases

7
Increases
Electricity From 32 to 38
Mobile phone calls From 4 to 11
Internet connection From 2 to 11
University fees From 3 to 19
Prepared food From 16 to 24
Decreases
Bus fare From 26 to 11
Fixed telephone calls From 14 to 11
Newspaper From 9 to 4
Some item wise changes in weight, 2001/02 to 2012

8
CPI basket’s weight – comparison with other countries
Description UK S. Africa Mauritius Malaysia Burundi
Food and non-alcoholic beverages 106 175 273 303 486
Alcoholic beverages and tobacco 44 54 96 22 80
Clothing and footwear 68 45 45 34 25Housing, water, electricity, gas and other fuels 137 228 120 226 155Furnishings, household equipment and routine household maintenance 59 52 61 41 49
Health 25 14 40 13 10
Transport 148 154 151 149 66
Communication 31 29 39 57 29
Recreation and culture 141 45 44 46 11
Education 21 27 45 14 13
Restaurants and hotels 117 34 45 32 36
Miscellaneous goods and services 103 143 41 63 40
Total 1000 1000 1000 1000 1000

9
Household Disposable Income, 2012
• Avg. monthly household disposable income was Rs 29,360
• The average household size was 3.5
• There were 2 income earners per household

10
Self em-ployment
15%
Property2%
Transfer14%
Paid em-ployment
70%
Household disposable income composition, 2012
• Income from paid employment is the major source of household income• Property income has a negligible share of total income

11
Household Consumption Expenditure, 2012
• Average monthly household expenditure was Rs 23,930 in 2012
of which: Rs %
Food & non alcoholic beverages 6,540 27.3
Transport 3,630 15.2
Housing, water, electricity, gas and other fuels 2,860 12.0
Alcoholic beverages & tobacco 2,300 9.6
Education 1,080 4.5
Health 950 3.9

12
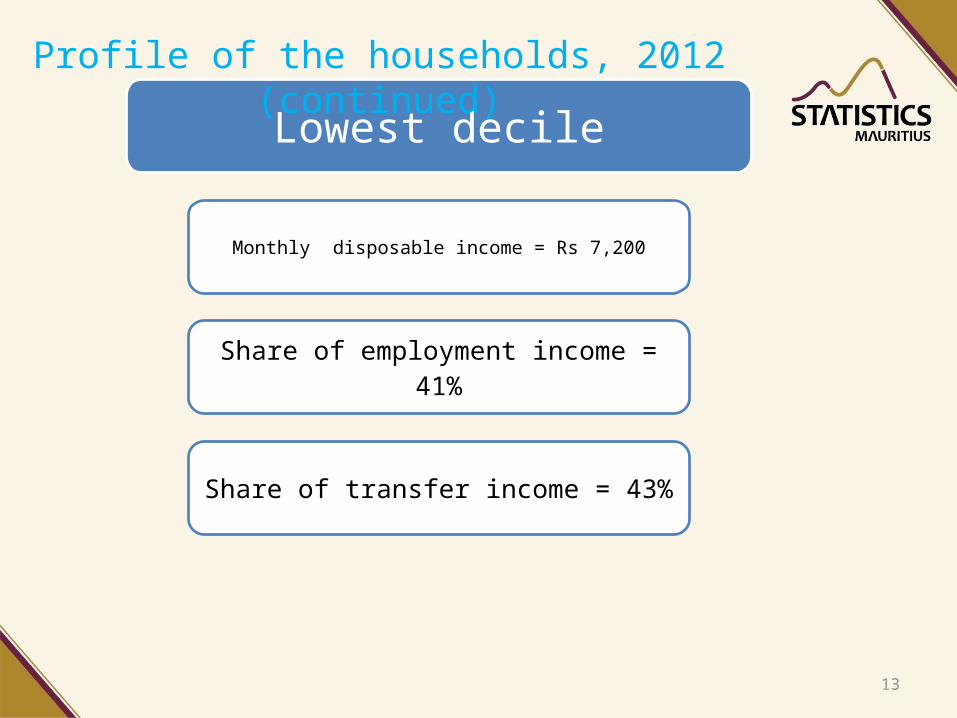
Lowest decile
No. of income earners per household = 1.4
No. of persons working per household = 0.8
73% own their house & 21% had free accommodation
Household size : 3.3
Profile of households in lowest and highest income deciles, 2012
13
Lowest decile
Monthly disposable income = Rs 7,200
Share of employment income = 41%
Share of transfer income = 43%
Profile of the households, 2012 (continued)
14
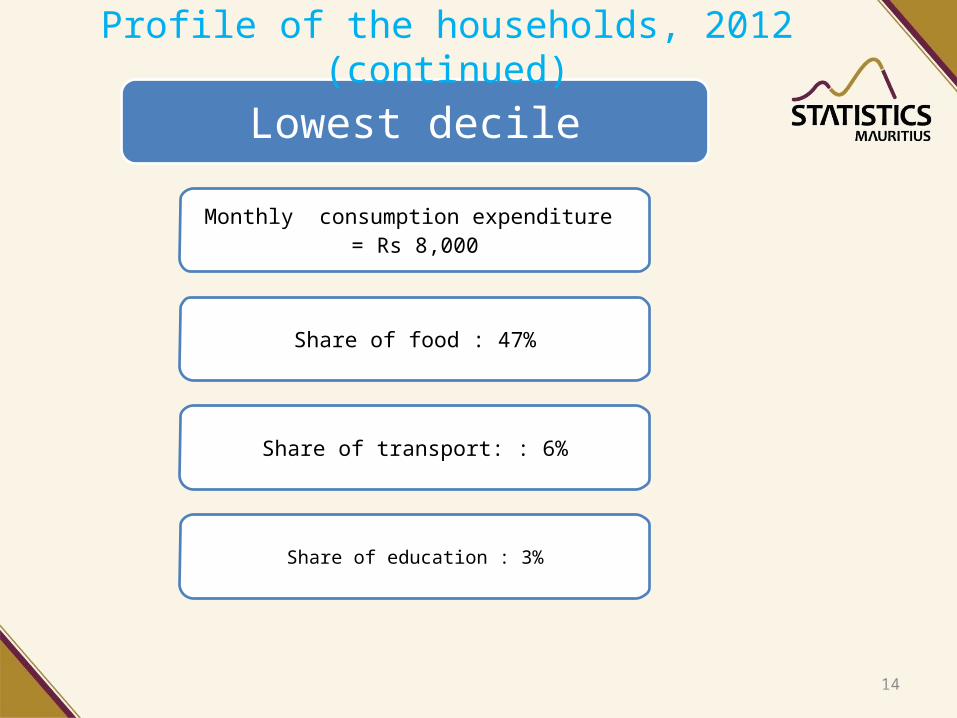
Lowest decile
Monthly consumption expenditure = Rs 8,000
Share of food : 47%
Share of transport: : 6%
Share of education : 3%
Profile of the households, 2012 (continued)
15
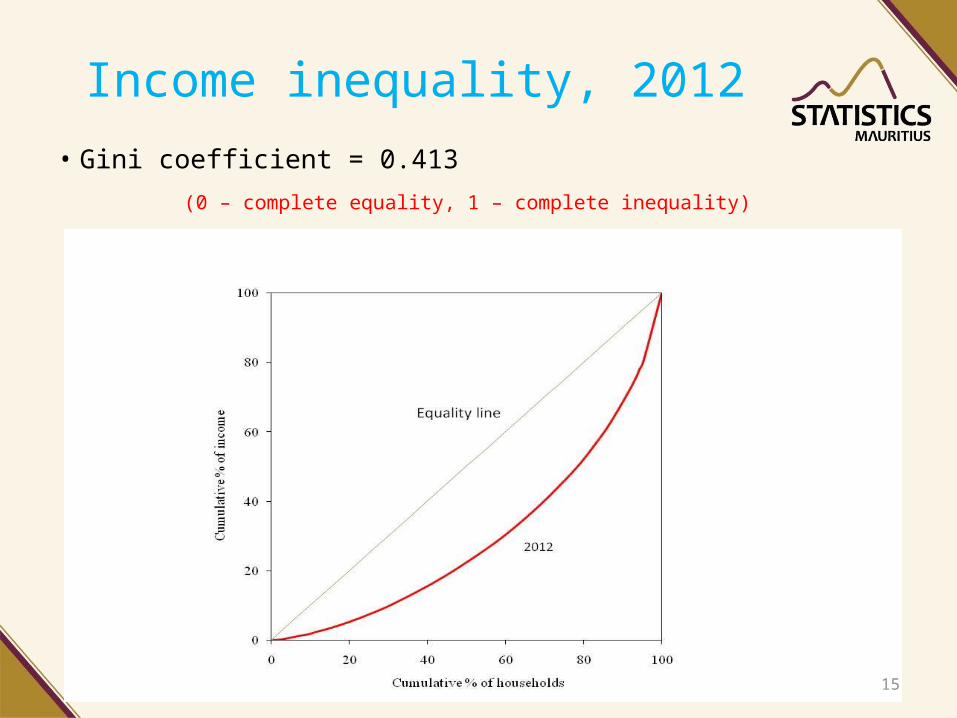
Income inequality, 2012• Gini coefficient = 0.413 (0 – complete equality, 1 – complete inequality)

16
Gini coefficient - international comparisonSelected countries Latest available data
France 0.293
Australia 0.320
Japan 0.329
India 0.339
United Kingdom 0.342
United States 0.378
Thailand 0.394
Mauritius 0.413
Madagascar 0.441
China 0.474
Singapore 0.478
Botswana 0.610
South Africa 0.631
Seychelles 0.658

17
Share of household income, 2012
Share of households (%) Share of total household income (%)
0102030405060708090
100
10.01.9
10.0
31.2HIGH-EST
LOWEST
The highest 10% of households received some 30% of the total income, while the lowest 10% of households received only some 2% of the total income
18
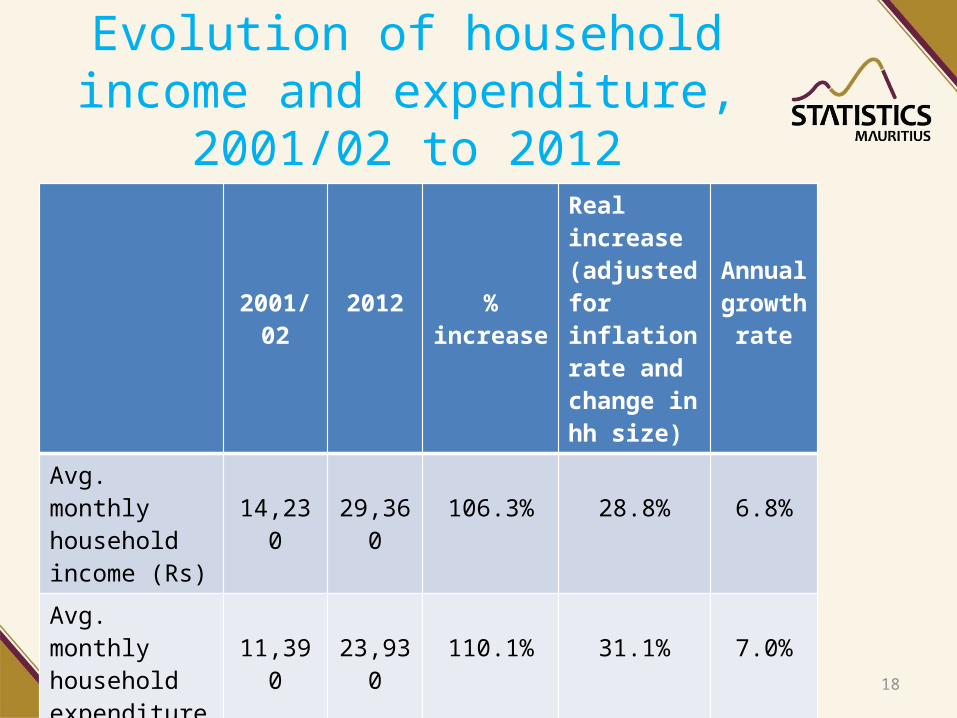
Evolution of household income and expenditure, 2001/02 to 2012
2001/02 2012 % increase
Real increase (adjusted for inflation rate and change in hh size)
Annual growth
rateAvg. monthly household income (Rs)
14,230 29,360 106.3% 28.8% 6.8%
Avg. monthly household expenditure (Rs)
11,390 23,930 110.1% 31.1% 7.0%
19
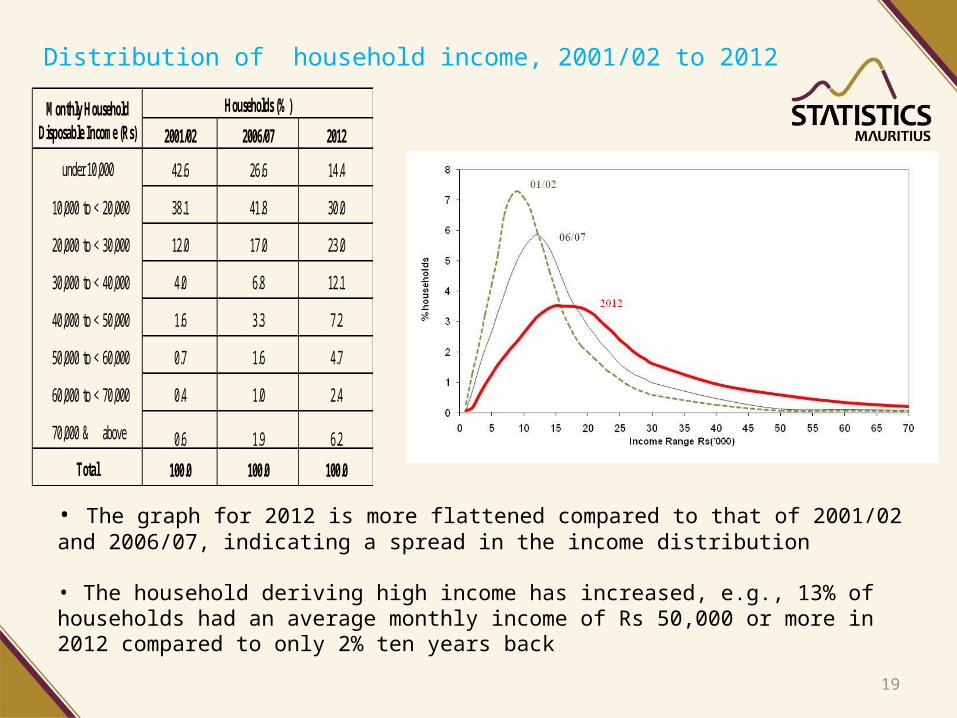
Distribution of household income, 2001/02 to 2012
2001/02 2006/07 2012
42.6 26.6 14.4
10,000 to < 20,000 38.1 41.8 30.0
20,000 to < 30,000 12.0 17.0 23.0
30,000 to < 40,000 4.0 6.8 12.1
40,000 to < 50,000 1.6 3.3 7.2
50,000 to < 60,000 0.7 1.6 4.7
60,000 to < 70,000 0.4 1.0 2.4
70,000 & above 0.6 1.9 6.2
100.0 100.0 100.0
Households (%)Monthly Household Disposable Income (Rs)
under 10,000
Total
• The graph for 2012 is more flattened compared to that of 2001/02 and 2006/07, indicating a spread in the income distribution
• The household deriving high income has increased, e.g., 13% of households had an average monthly income of Rs 50,000 or more in 2012 compared to only 2% ten years back

20
Trends in income inequality - Gini coefficient, 2001/02 to 2012
2001/02 2006/07 2012
Gini coefficient 0.371 0.388 0.413
A higher Gini coefficient over the past 10 years indicates income inequality is on the rise
The further away the curve is from the equality line, the larger is the Gini coefficient, i.e. higher income inequality.
21
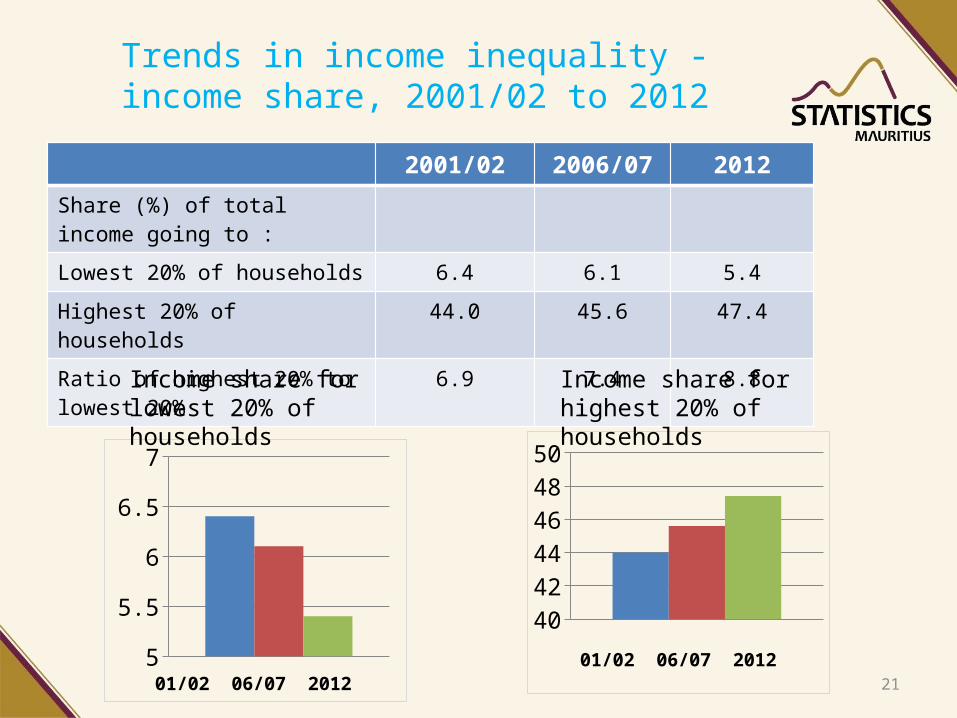
Trends in income inequality - income share, 2001/02 to 2012
2001/02 2006/07 2012
Share (%) of total income going to :
Lowest 20% of households 6.4 6.1 5.4
Highest 20% of households 44.0 45.6 47.4
Ratio of highest 20% to lowest 20% 6.9 7.4 8.8
40
42
44
46
48
50
01/02 06/07 20125
5.5
6
6.5
7
01/02 06/07 2012
Income share for lowest 20% of households
Income share for highest 20% of households

22
Thank you