Embed Size (px)
Citation preview
Household Income and Expenditure
Survey - 2009/10
Preliminary Report
Department of Census and Statistics Ministry of Finance and Planning
Sri Lanka
ISBN 978-955-577-719-3
Prepared by Samples Survey Division
Department of Census and Statistics 8th floor - Unity plaza Bldg.
Colombo 04 Sri Lanka
Preface The Sri Lanka Household Income and Expenditure Survey (HIES) is conducted by the Department of
Census and Statistics (DCS) under the National Household Sample Survey Program. The HIES is an year long sample survey which is conducted in 12 consecutive monthly rounds and an island wide representative sample of equal size is enumerated in each monthly round to capture seasonal and regional variations of income, expenditure and consumption patterns. The HIES series which started in 1980 was conducted once in every five years until 2006/07 and thereafter, as rapidly changing economic conditions demanded far more frequent monitoring of income and expenditure patterns in the country, the DCS with the help of the rapid developments in the ICT, decided to conduct the HIES once in every three years in Sri Lanka. The HIES 2009/10 which was conducted three years after the previous survey, HIES 2006/07, is the seventh in the HIES series.
The field data collection of the survey was done in twelve monthly rounds starting from July 2009 to June
2010 and covered all the districts excluding Mannar, Kilinochchi and Mulaithive districts in the Northern province as post liberation resettlements of internally displaced persons, a situation which is not suitable for conducting an HIES like household survey, were in progress in most of the areas in the three districts during the pre scheduled survey period.
This report is the preliminary report of the HIES 2009/10, which is based on the first three monthly rounds
of the survey data and publishes much needed socio economic development indicator information of households and household population in Sri Lanka.
D. B. P. S. Vidyarathne Director General of
Census and Statistics 11 January, 2011 Department of Census and Statistics 15/12, Maitland Crescent Colombo 07 Sri Lanka

Acknowledgements
Planning and execution of the survey was done by staff of the Samples Survey Division (SSD) under the
direction of Mr. W. W. M. A. S. Premakumara, Director (SSD) and the total survey activities were coordinated by Mr. G. Y. L. Fernando, Director (2).
Field data collection activities of the survey were done by Statistical officers and Statistical assistants
attached to divisional secretariat divisions and district statistics offices under the direct supervision of Deputy director/ Senior statistician/ Statistician in charge of the respective district statistics offices.
Co-ordination of the field work was done by Statistical Officers, Statistical Assistants, Data entry operators
and Coding clerks of the SSD under the supervision of Mr. D. C. A. Fernando, Mr. I. L. Sherifdeen, Mr. H. T. Fonseka, Mr. U. B. Saputhanthri, Ms. A. H. S. P. Gunawardane and Ms. D. D. Deepawansa, Statisticians under the guidance and direction of Mr. W. W. M. A. S. Premakumara, Director (SSD).
Data entry activities were done by the staff of the Data Processing Division under the direction Mr. S. A. S.
Bandulasena, Deputy Director and Mr. H. O. Chandrathilaka, Deputy Director and Mr. W. H. P. W. Weerasiri, Senior Systems Analyst/ Programmer was responsible for overall supervision and guidance of the data entry activities conducted in the district offices as well.
Development of samples selection, data cleaning, estimation and tabulation programs were done by Mr. K.
M. R. Wickramasinghe, Systems analyst/ Programmer attached to the SSD.
This publication was organized and prepared by Ms. M. D. D. Deepawansa Statistician and Mr. J. S. N. P. Dharmawardene, Senior statistician, Mr. H. T. Fonseka, Statistician and staff of the SSD joined the report in preparing various chapters. Mr. K. M. R. Wickramasinghe, Systems Analyst/ Programmer contributed by overall editing of the report under the direction of Mr. W. W. M. A. S. Premakumara, Director (SSD).
Printing of the report and other survey materials were done by staff of the Printing Division under the supervision of Mr. W. C. Weerawanse, Senior Statistician.
Officers engaged in the Survey activities Supervision of the survey activities in Sample Survey Division Mr. C. A. E. R. M. L. Perera Senior Statistician Mr. J. S. N. P. Dharmawardene Senior Statistician Mr. I. L. Sherifdeen Statistician Mr. D. C. A. Fernando Statistician Mr. K. M. R. Wickramasinghe Systems analyst/ Programmer Mr. H. T. Fonseka Statistician Mr. U. B. Saputhanthri Statistician Ms. A. H. S. P. Gunawardane Statistician Ms. D. D. Deepawansa Statistician Supervision of the survey activities at District Offices Colombo Mr. D. L. R. Wijethunga Senior Statistician Gampaha Mr. J. D. Nandasiri Senior Statistician Kalutara Mr. P. Nandasena Statistician Kandy Mr. H. S. Wanasinghe Deputy Director Matale Mr. A. M. U. K. Alahakoon Senior Statistician Nuwara-Eliya Mr. G. W. Gunasekara Statistician Galle Mr. S. D. Wisumperuma Statistician Matara Mr. M. S. M. Musammil Statistician Hambantota Mr. Sarath Jayasooriya Statistician Ampara Mr. M. S. Sahuthul Kaleem Statistician Batticaloa Mr. M. H. Manzoor Senior Statistician Puttlam Mr. M. J. Marcus Fernando Statistician Anuradhapura Mr. P. S. A. Ariyathilake, Mr. S. L. Mamaduwa Statistician Polonnaruwa Mr. D. L. Edirisinghe Statistician Badulla Mr. A. M. P. Abayasinghe Statistician Moneragala Mr. R. M. Gunadasa Statistician Ratnapura Mr. L. W. Ranjith Senior Statistician Kegalle Mr. C. L. A. K. Hearath Statistician Kurunegala Mr. K. P. K. Dissanayake Senior Statistician Jaffna Mr. S. Udayakumar Statistician Vavuniya Mr. M. Thiyakalingam Statistician Trincomalee Mr. T. Chandran Statistician Manual Editing, Coding and Error Correction etc Mr. I. H. J. Rohan Statistical officer Mrs. Sathyadevi Ranjith Statistical officer Mr. K. B. G. U. Jayatissa Statistical Assistant Mr. S. Balasankar Statistical Assistant Mrs. C. S. Liyanage Statistical Assistant Mrs. A. N. Ekanayake Statistical Assistant Mrs. S. W. N. D. Attanayake Data Entry Operator Miss. G. P. G. N. Y. Dewasurendra Data Entry Operator / Coding Clerk Miss. P. R. R. Chamilalatha Data Entry Operator / Coding Clerk Miss. M. A. C. G. Priyadhrshani Data Entry Operator / Coding Clerk Mrs. Phathima Riyana Data Entry Operator / Coding Clerk Miss. M. S. F. Nilamiya Data Entry Operator / Coding Clerk Miss. M. G. C. Lakmali Data Entry Operator / Coding Clerk Mrs. K. S. de Silva Weeraddana Data Entry Operator / Coding Clerk Miss. Y. W. S. Chandralatha Data Entry Operator / Coding Clerk Mrs. S. A. S. T. Samaratunge Data Entry Operator / Coding Clerk Miss. G. C. Geekiyanage Data Entry Operator / Coding Clerk Miss. K. M. C. P. Kulasinghe Data Entry Operator / Coding Clerk
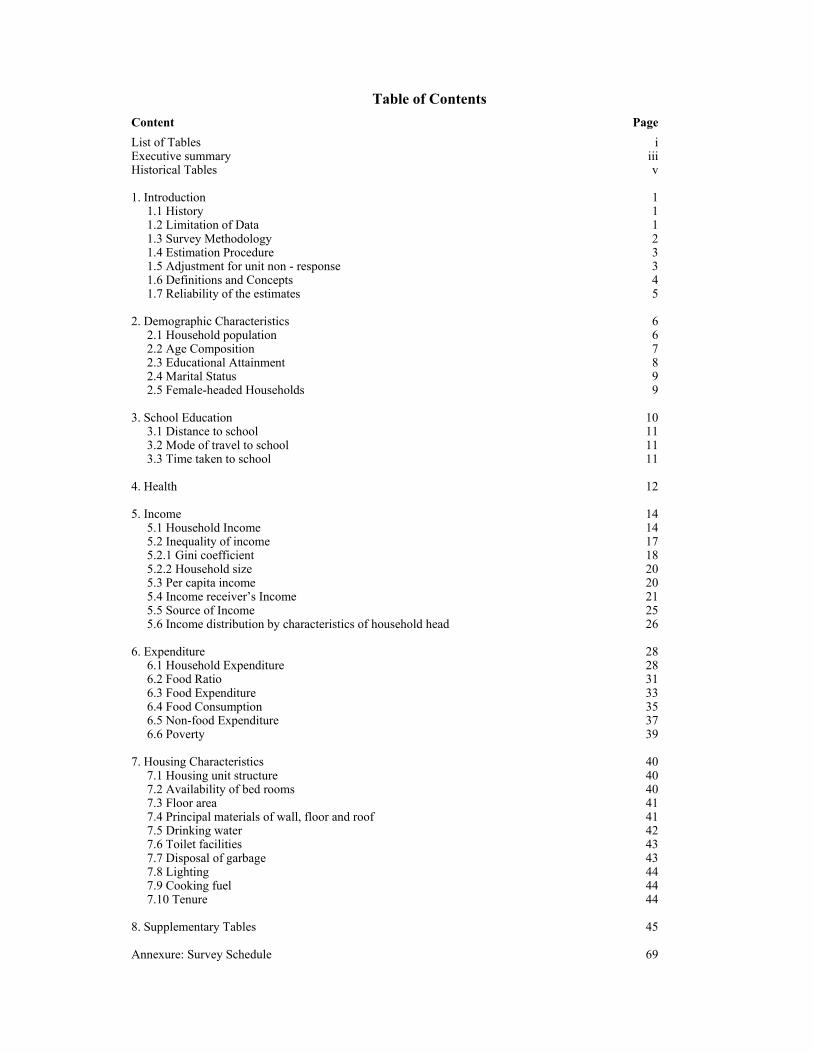
Table of Contents Content Page List of Tables Executive summary Historical Tables 1. Introduction
1.1 History 1.2 Limitation of Data 1.3 Survey Methodology 1.4 Estimation Procedure 1.5 Adjustment for unit non - response 1.6 Definitions and Concepts 1.7 Reliability of the estimates
2. Demographic Characteristics
2.1 Household population 2.2 Age Composition 2.3 Educational Attainment 2.4 Marital Status 2.5 Female-headed Households
3. School Education
3.1 Distance to school 3.2 Mode of travel to school 3.3 Time taken to school
4. Health 5. Income
5.1 Household Income 5.2 Inequality of income 5.2.1 Gini coefficient 5.2.2 Household size 5.3 Per capita income 5.4 Income receiver’s Income 5.5 Source of Income 5.6 Income distribution by characteristics of household head
6. Expenditure
6.1 Household Expenditure 6.2 Food Ratio 6.3 Food Expenditure 6.4 Food Consumption 6.5 Non-food Expenditure 6.6 Poverty
7. Housing Characteristics
7.1 Housing unit structure 7.2 Availability of bed rooms 7.3 Floor area 7.4 Principal materials of wall, floor and roof 7.5 Drinking water 7.6 Toilet facilities 7.7 Disposal of garbage 7.8 Lighting 7.9 Cooking fuel 7.10 Tenure
8. Supplementary Tables Annexure: Survey Schedule
iiii v
1 1 1 2 3 3 4 5
6 6 7 8 9 9
10 11 11 11
12
14 14 17 18 20 20 21 25 26
28 28 31 33 35 37 39
40 40 40 41 41 42 43 43 44 44 44
45
69

i
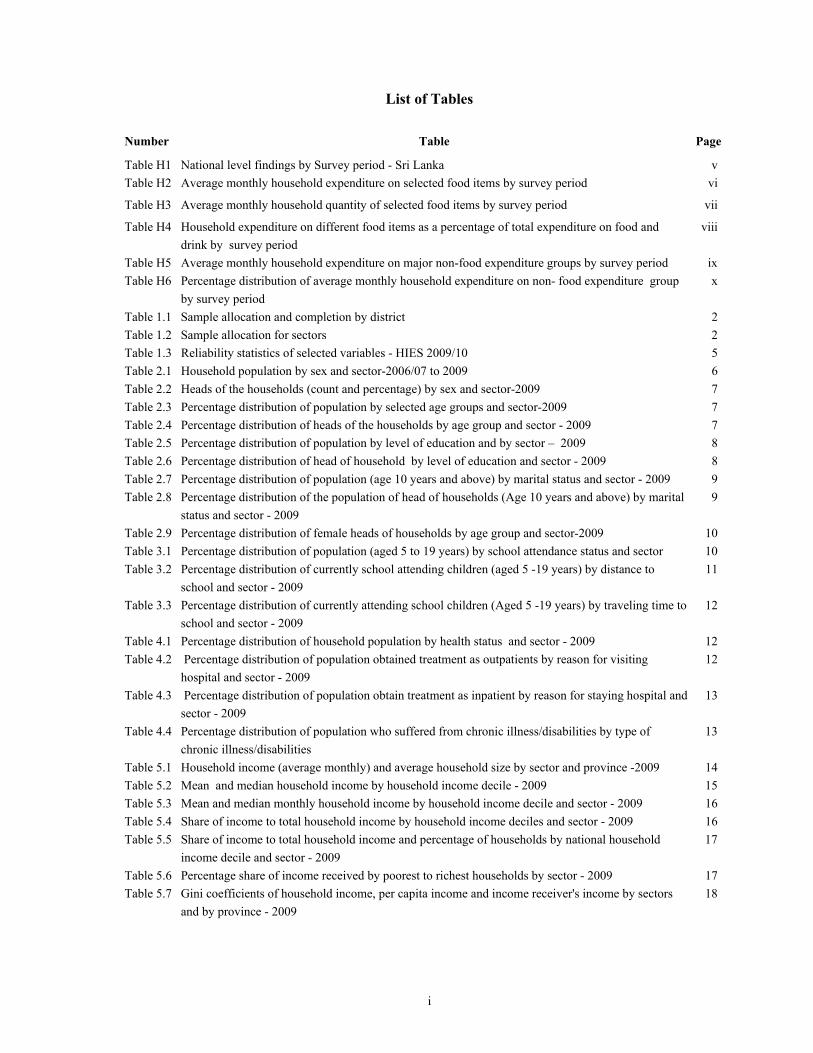
List of Tables Number Table Page
Table H1 National level findings by Survey period - Sri Lanka vTable H2 Average monthly household expenditure on selected food items by survey period vi
Table H3 Average monthly household quantity of selected food items by survey period vii
Table H4 Household expenditure on different food items as a percentage of total expenditure on food and viii drink by survey period Table H5 Average monthly household expenditure on major non-food expenditure groups by survey period ixTable H6 Percentage distribution of average monthly household expenditure on non- food expenditure group x by survey period Table 1.1 Sample allocation and completion by district 2Table 1.2 Sample allocation for sectors 2Table 1.3 Reliability statistics of selected variables - HIES 2009/10 5Table 2.1 Household population by sex and sector-2006/07 to 2009 6Table 2.2 Heads of the households (count and percentage) by sex and sector-2009 7Table 2.3 Percentage distribution of population by selected age groups and sector-2009 7Table 2.4 Percentage distribution of heads of the households by age group and sector - 2009 7Table 2.5 Percentage distribution of population by level of education and by sector – 2009 8Table 2.6 Percentage distribution of head of household by level of education and sector - 2009 8Table 2.7 Percentage distribution of population (age 10 years and above) by marital status and sector - 2009 9Table 2.8 Percentage distribution of the population of head of households (Age 10 years and above) by marital 9 status and sector - 2009 Table 2.9 Percentage distribution of female heads of households by age group and sector-2009 10Table 3.1 Percentage distribution of population (aged 5 to 19 years) by school attendance status and sector 10Table 3.2 Percentage distribution of currently school attending children (aged 5 -19 years) by distance to 11 school and sector - 2009 Table 3.3 Percentage distribution of currently attending school children (Aged 5 -19 years) by traveling time to 12 school and sector - 2009 Table 4.1 Percentage distribution of household population by health status and sector - 2009 12Table 4.2 Percentage distribution of population obtained treatment as outpatients by reason for visiting 12 hospital and sector - 2009 Table 4.3 Percentage distribution of population obtain treatment as inpatient by reason for staying hospital and 13 sector - 2009 Table 4.4 Percentage distribution of population who suffered from chronic illness/disabilities by type of 13 chronic illness/disabilities Table 5.1 Household income (average monthly) and average household size by sector and province -2009 14Table 5.2 Mean and median household income by household income decile - 2009 15Table 5.3 Mean and median monthly household income by household income decile and sector - 2009 16Table 5.4 Share of income to total household income by household income deciles and sector - 2009 16Table 5.5 Share of income to total household income and percentage of households by national household 17 income decile and sector - 2009 Table 5.6 Percentage share of income received by poorest to richest households by sector - 2009 17Table 5.7 Gini coefficients of household income, per capita income and income receiver's income by sectors 18 and by province - 2009
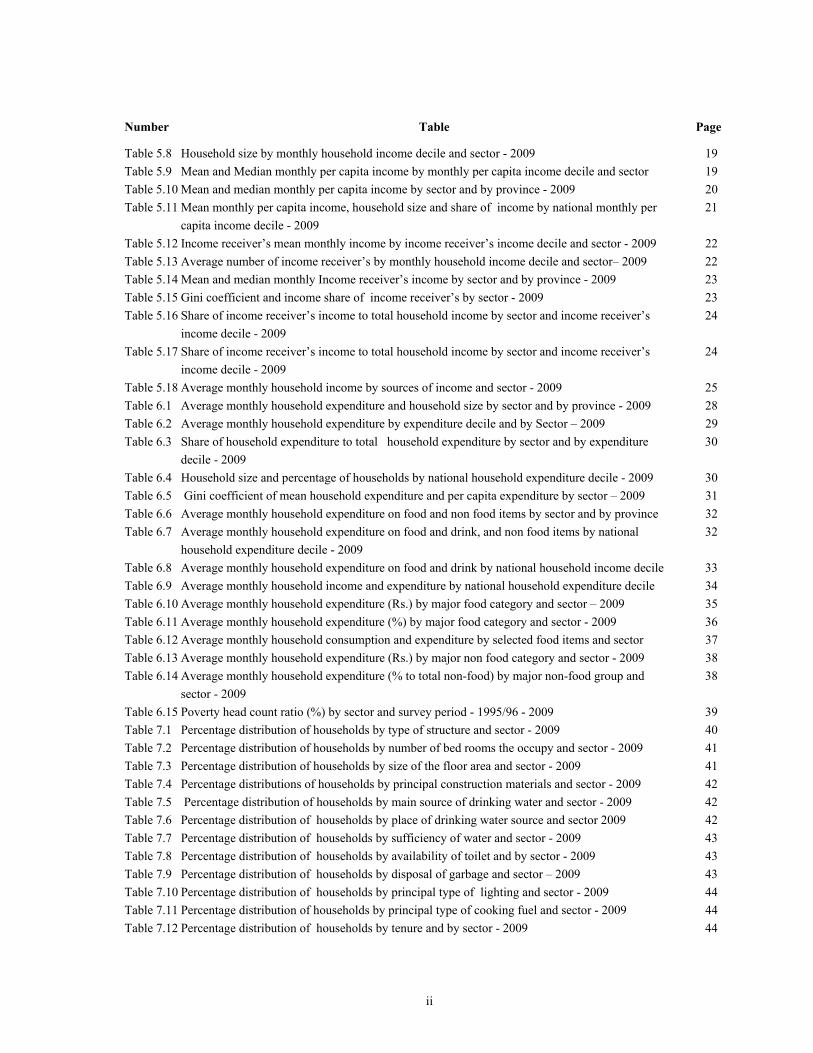
ii
Number Table Page
Table 5.8 Household size by monthly household income decile and sector - 2009 19Table 5.9 Mean and Median monthly per capita income by monthly per capita income decile and sector 19Table 5.10 Mean and median monthly per capita income by sector and by province - 2009 20Table 5.11 Mean monthly per capita income, household size and share of income by national monthly per 21 capita income decile - 2009 Table 5.12 Income receiver’s mean monthly income by income receiver’s income decile and sector - 2009 22Table 5.13 Average number of income receiver’s by monthly household income decile and sector– 2009 22Table 5.14 Mean and median monthly Income receiver’s income by sector and by province - 2009 23Table 5.15 Gini coefficient and income share of income receiver’s by sector - 2009 23Table 5.16 Share of income receiver’s income to total household income by sector and income receiver’s 24 income decile - 2009 Table 5.17 Share of income receiver’s income to total household income by sector and income receiver’s 24 income decile - 2009 Table 5.18 Average monthly household income by sources of income and sector - 2009 25Table 6.1 Average monthly household expenditure and household size by sector and by province - 2009 28Table 6.2 Average monthly household expenditure by expenditure decile and by Sector – 2009 29Table 6.3 Share of household expenditure to total household expenditure by sector and by expenditure 30 decile - 2009 Table 6.4 Household size and percentage of households by national household expenditure decile - 2009 30Table 6.5 Gini coefficient of mean household expenditure and per capita expenditure by sector – 2009 31Table 6.6 Average monthly household expenditure on food and non food items by sector and by province 32Table 6.7 Average monthly household expenditure on food and drink, and non food items by national 32 household expenditure decile - 2009 Table 6.8 Average monthly household expenditure on food and drink by national household income decile 33Table 6.9 Average monthly household income and expenditure by national household expenditure decile 34Table 6.10 Average monthly household expenditure (Rs.) by major food category and sector – 2009 35Table 6.11 Average monthly household expenditure (%) by major food category and sector - 2009 36Table 6.12 Average monthly household consumption and expenditure by selected food items and sector 37Table 6.13 Average monthly household expenditure (Rs.) by major non food category and sector - 2009 38Table 6.14 Average monthly household expenditure (% to total non-food) by major non-food group and 38 sector - 2009 Table 6.15 Poverty head count ratio (%) by sector and survey period - 1995/96 - 2009 39Table 7.1 Percentage distribution of households by type of structure and sector - 2009 40Table 7.2 Percentage distribution of households by number of bed rooms the occupy and sector - 2009 41Table 7.3 Percentage distribution of households by size of the floor area and sector - 2009 41Table 7.4 Percentage distributions of households by principal construction materials and sector - 2009 42Table 7.5 Percentage distribution of households by main source of drinking water and sector - 2009 42Table 7.6 Percentage distribution of households by place of drinking water source and sector 2009 42Table 7.7 Percentage distribution of households by sufficiency of water and sector - 2009 43Table 7.8 Percentage distribution of households by availability of toilet and by sector - 2009 43Table 7.9 Percentage distribution of households by disposal of garbage and sector – 2009 43Table 7.10 Percentage distribution of households by principal type of lighting and sector - 2009 44Table 7.11 Percentage distribution of households by principal type of cooking fuel and sector - 2009 44Table 7.12 Percentage distribution of households by tenure and by sector - 2009 44
iii
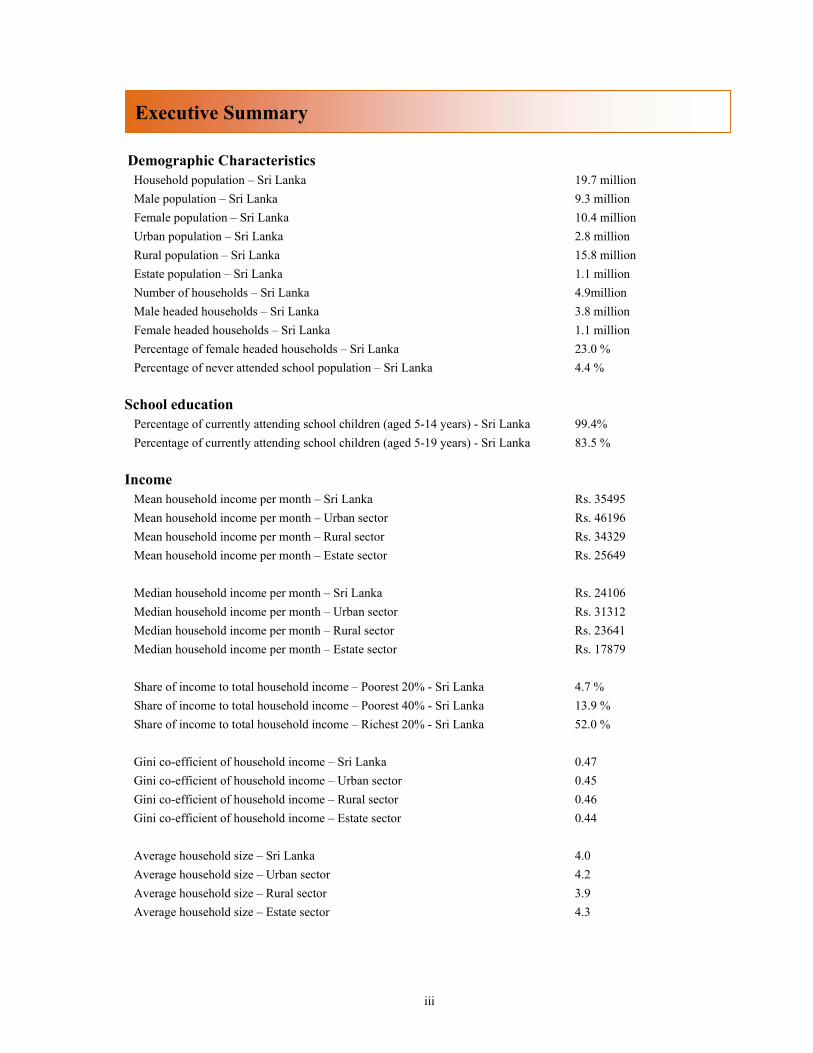
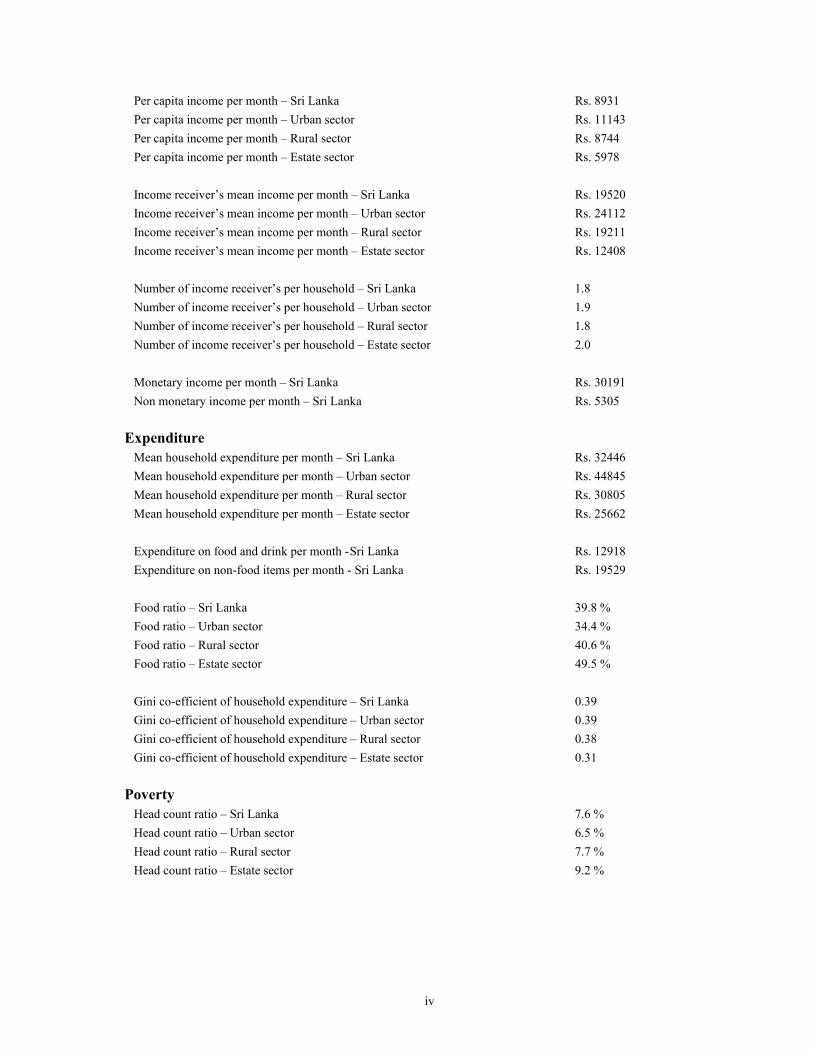
Demographic Characteristics Household population – Sri Lanka 19.7 million Male population – Sri Lanka 9.3 million Female population – Sri Lanka 10.4 million Urban population – Sri Lanka 2.8 million Rural population – Sri Lanka 15.8 million Estate population – Sri Lanka 1.1 million Number of households – Sri Lanka 4.9million Male headed households – Sri Lanka 3.8 million Female headed households – Sri Lanka 1.1 million Percentage of female headed households – Sri Lanka 23.0 % Percentage of never attended school population – Sri Lanka 4.4 % School education Percentage of currently attending school children (aged 5-14 years) - Sri Lanka 99.4% Percentage of currently attending school children (aged 5-19 years) - Sri Lanka 83.5 % Income Mean household income per month – Sri Lanka Rs. 35495 Mean household income per month – Urban sector Rs. 46196 Mean household income per month – Rural sector Rs. 34329 Mean household income per month – Estate sector Rs. 25649 Median household income per month – Sri Lanka Rs. 24106 Median household income per month – Urban sector Rs. 31312 Median household income per month – Rural sector Rs. 23641 Median household income per month – Estate sector Rs. 17879 Share of income to total household income – Poorest 20% - Sri Lanka 4.7 % Share of income to total household income – Poorest 40% - Sri Lanka 13.9 % Share of income to total household income – Richest 20% - Sri Lanka 52.0 % Gini co-efficient of household income – Sri Lanka 0.47 Gini co-efficient of household income – Urban sector 0.45 Gini co-efficient of household income – Rural sector 0.46 Gini co-efficient of household income – Estate sector 0.44 Average household size – Sri Lanka 4.0 Average household size – Urban sector 4.2 Average household size – Rural sector 3.9 Average household size – Estate sector 4.3
Executive Summary
iv
Per capita income per month – Sri Lanka Rs. 8931 Per capita income per month – Urban sector Rs. 11143 Per capita income per month – Rural sector Rs. 8744 Per capita income per month – Estate sector Rs. 5978 Income receiver’s mean income per month – Sri Lanka Rs. 19520 Income receiver’s mean income per month – Urban sector Rs. 24112 Income receiver’s mean income per month – Rural sector Rs. 19211 Income receiver’s mean income per month – Estate sector Rs. 12408 Number of income receiver’s per household – Sri Lanka 1.8 Number of income receiver’s per household – Urban sector 1.9 Number of income receiver’s per household – Rural sector 1.8 Number of income receiver’s per household – Estate sector 2.0 Monetary income per month – Sri Lanka Rs. 30191 Non monetary income per month – Sri Lanka Rs. 5305 Expenditure Mean household expenditure per month – Sri Lanka Rs. 32446 Mean household expenditure per month – Urban sector Rs. 44845 Mean household expenditure per month – Rural sector Rs. 30805 Mean household expenditure per month – Estate sector Rs. 25662 Expenditure on food and drink per month - Sri Lanka Rs. 12918 Expenditure on non-food items per month - Sri Lanka Rs. 19529 Food ratio – Sri Lanka 39.8 % Food ratio – Urban sector 34.4 % Food ratio – Rural sector 40.6 % Food ratio – Estate sector 49.5 % Gini co-efficient of household expenditure – Sri Lanka 0.39 Gini co-efficient of household expenditure – Urban sector 0.39 Gini co-efficient of household expenditure – Rural sector 0.38 Gini co-efficient of household expenditure – Estate sector 0.31 Poverty Head count ratio – Sri Lanka 7.6 % Head count ratio – Urban sector 6.5 % Head count ratio – Rural sector 7.7 % Head count ratio – Estate sector 9.2 %
v
Historical Tables
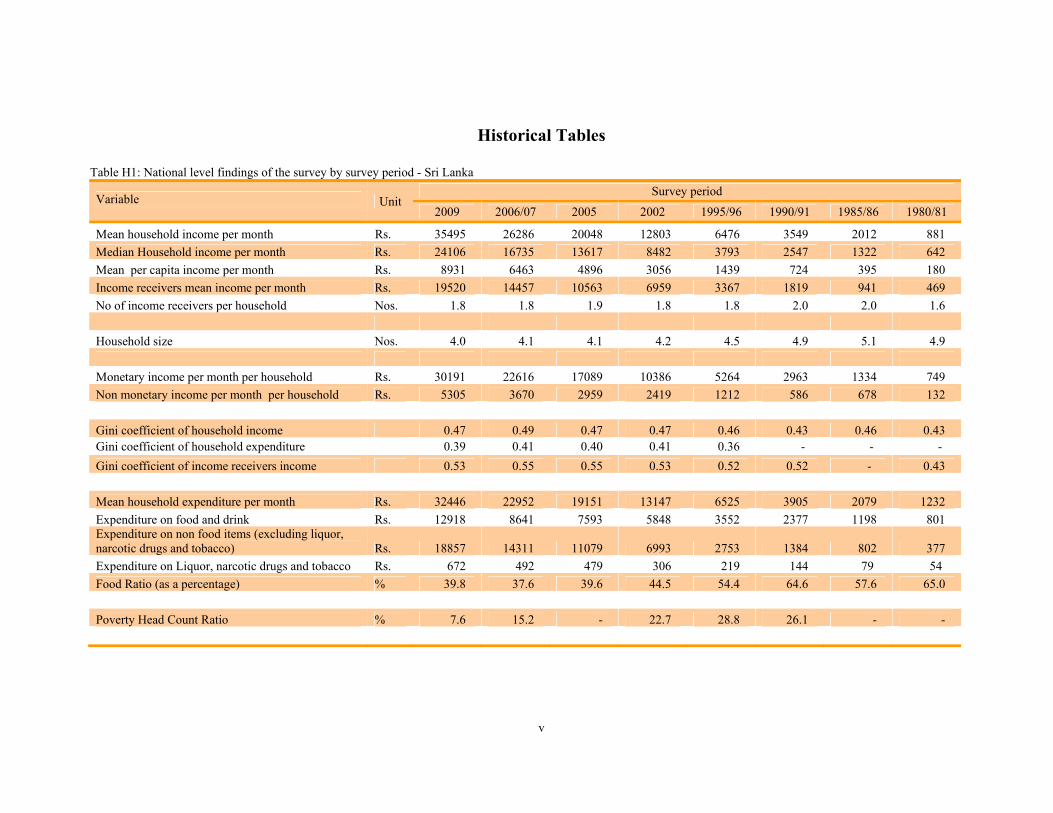
Table H1: National level findings of the survey by survey period - Sri Lanka
Variable
Unit Survey period
2009 2006/07 2005 2002 1995/96 1990/91 1985/86 1980/81
Mean household income per month Rs. 35495 26286 20048 12803 6476 3549 2012 881 Median Household income per month Rs. 24106 16735 13617 8482 3793 2547 1322 642 Mean per capita income per month Rs. 8931 6463 4896 3056 1439 724 395 180 Income receivers mean income per month Rs. 19520 14457 10563 6959 3367 1819 941 469 No of income receivers per household Nos. 1.8 1.8 1.9 1.8 1.8 2.0 2.0 1.6 Household size Nos. 4.0 4.1 4.1 4.2 4.5 4.9 5.1 4.9 Monetary income per month per household Rs. 30191 22616 17089 10386 5264 2963 1334 749 Non monetary income per month per household Rs. 5305 3670 2959 2419 1212 586 678 132 Gini coefficient of household income 0.47 0.49 0.47 0.47 0.46 0.43 0.46 0.43 Gini coefficient of household expenditure 0.39 0.41 0.40 0.41 0.36 - - - Gini coefficient of income receivers income 0.53 0.55 0.55 0.53 0.52 0.52 - 0.43 Mean household expenditure per month Rs. 32446 22952 19151 13147 6525 3905 2079 1232 Expenditure on food and drink Rs. 12918 8641 7593 5848 3552 2377 1198 801Expenditure on non food items (excluding liquor, narcotic drugs and tobacco) Rs. 18857 14311 11079 6993 2753 1384 802 377 Expenditure on Liquor, narcotic drugs and tobacco Rs. 672 492 479 306 219 144 79 54 Food Ratio (as a percentage) % 39.8 37.6 39.6 44.5 54.4 64.6 57.6 65.0 Poverty Head Count Ratio % 7.6 15.2 - 22.7 28.8 26.1 - -
vi
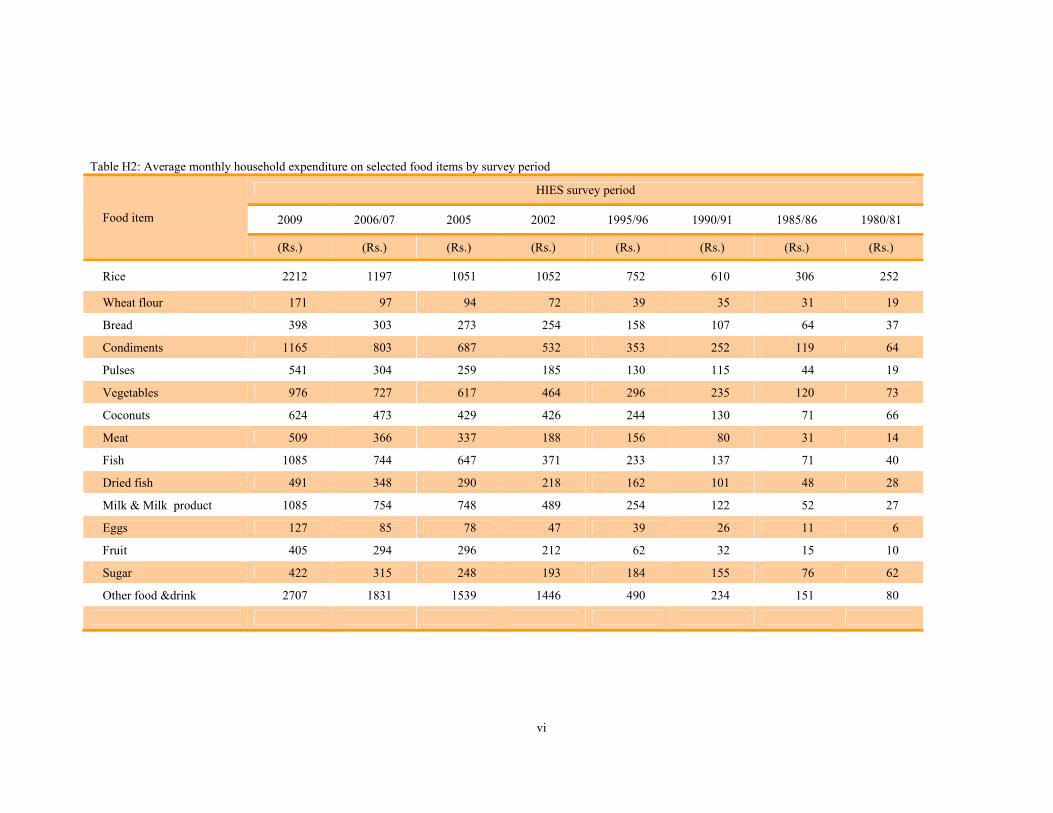
Table H2: Average monthly household expenditure on selected food items by survey period
Food item
HIES survey period
2009 2006/07 2005 2002 1995/96 1990/91 1985/86 1980/81
(Rs.) (Rs.) (Rs.) (Rs.) (Rs.) (Rs.) (Rs.) (Rs.)
Rice 2212 1197 1051 1052 752 610 306 252
Wheat flour 171 97 94 72 39 35 31 19
Bread 398 303 273 254 158 107 64 37
Condiments 1165 803 687 532 353 252 119 64
Pulses 541 304 259 185 130 115 44 19
Vegetables 976 727 617 464 296 235 120 73
Coconuts 624 473 429 426 244 130 71 66
Meat 509 366 337 188 156 80 31 14
Fish 1085 744 647 371 233 137 71 40
Dried fish 491 348 290 218 162 101 48 28
Milk & Milk product 1085 754 748 489 254 122 52 27
Eggs 127 85 78 47 39 26 11 6
Fruit 405 294 296 212 62 32 15 10
Sugar 422 315 248 193 184 155 76 62
Other food &drink 2707 1831 1539 1446 490 234 151 80
vii
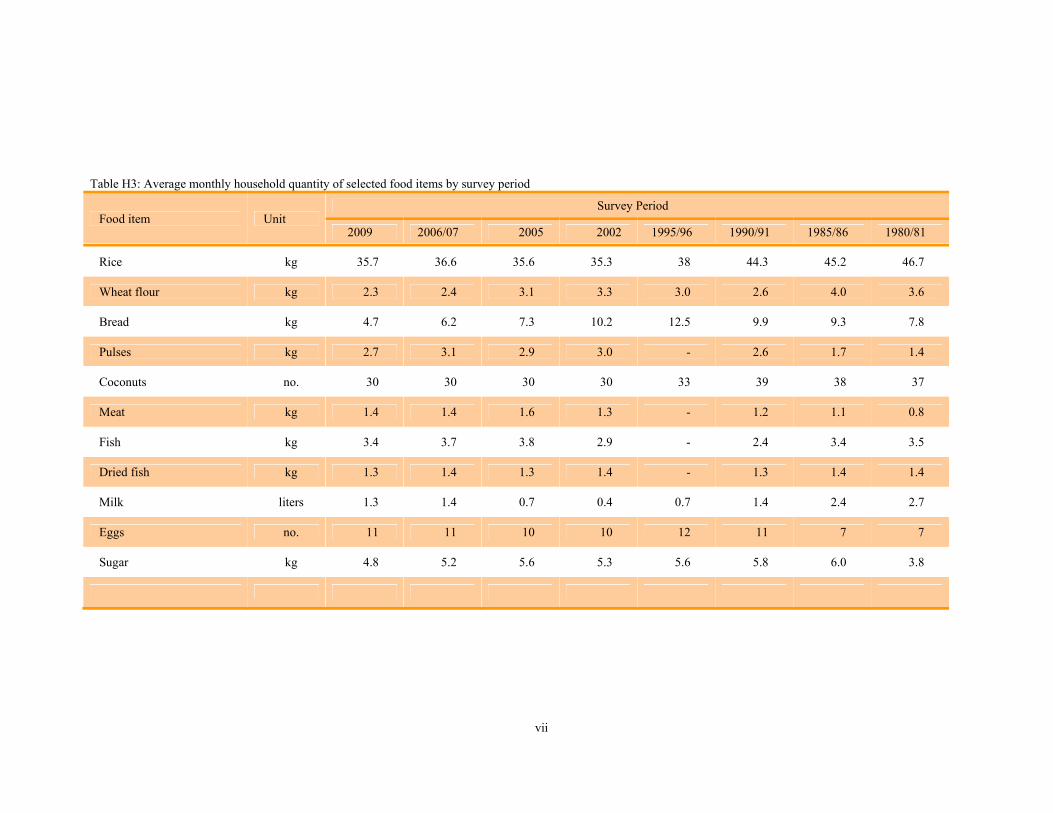
Table H3: Average monthly household quantity of selected food items by survey period
Food item Unit Survey Period
2009 2006/07 2005 2002 1995/96 1990/91 1985/86 1980/81
Rice kg 35.7 36.6 35.6 35.3 38 44.3 45.2 46.7
Wheat flour kg 2.3 2.4 3.1 3.3 3.0 2.6 4.0 3.6
Bread kg 4.7 6.2 7.3 10.2 12.5 9.9 9.3 7.8
Pulses kg 2.7 3.1 2.9 3.0 - 2.6 1.7 1.4
Coconuts no. 30 30 30 30 33 39 38 37
Meat kg 1.4 1.4 1.6 1.3 - 1.2 1.1 0.8
Fish kg 3.4 3.7 3.8 2.9 - 2.4 3.4 3.5
Dried fish kg 1.3 1.4 1.3 1.4 - 1.3 1.4 1.4
Milk liters 1.3 1.4 0.7 0.4 0.7 1.4 2.4 2.7
Eggs no. 11 11 10 10 12 11 7 7
Sugar kg 4.8 5.2 5.6 5.3 5.6 5.8 6.0 3.8
viii
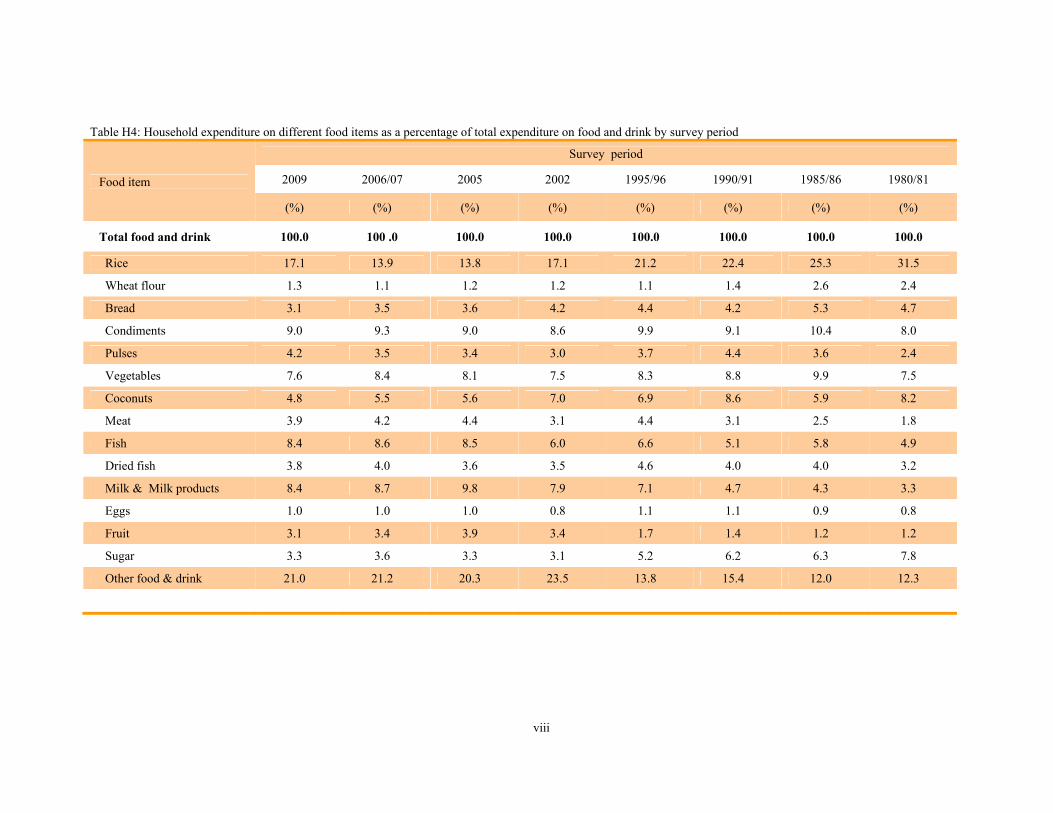
Table H4: Household expenditure on different food items as a percentage of total expenditure on food and drink by survey period
Food item
Survey period
2009 2006/07 2005 2002 1995/96 1990/91 1985/86 1980/81
(%) (%) (%) (%) (%) (%) (%) (%)
Total food and drink 100.0 100 .0 100.0 100.0 100.0 100.0 100.0 100.0
Rice 17.1 13.9 13.8 17.1 21.2 22.4 25.3 31.5
Wheat flour 1.3 1.1 1.2 1.2 1.1 1.4 2.6 2.4
Bread 3.1 3.5 3.6 4.2 4.4 4.2 5.3 4.7
Condiments 9.0 9.3 9.0 8.6 9.9 9.1 10.4 8.0
Pulses 4.2 3.5 3.4 3.0 3.7 4.4 3.6 2.4
Vegetables 7.6 8.4 8.1 7.5 8.3 8.8 9.9 7.5
Coconuts 4.8 5.5 5.6 7.0 6.9 8.6 5.9 8.2
Meat 3.9 4.2 4.4 3.1 4.4 3.1 2.5 1.8
Fish 8.4 8.6 8.5 6.0 6.6 5.1 5.8 4.9
Dried fish 3.8 4.0 3.6 3.5 4.6 4.0 4.0 3.2
Milk & Milk products 8.4 8.7 9.8 7.9 7.1 4.7 4.3 3.3
Eggs 1.0 1.0 1.0 0.8 1.1 1.1 0.9 0.8
Fruit 3.1 3.4 3.9 3.4 1.7 1.4 1.2 1.2
Sugar 3.3 3.6 3.3 3.1 5.2 6.2 6.3 7.8
Other food & drink 21.0 21.2 20.3 23.5 13.8 15.4 12.0 12.3
ix
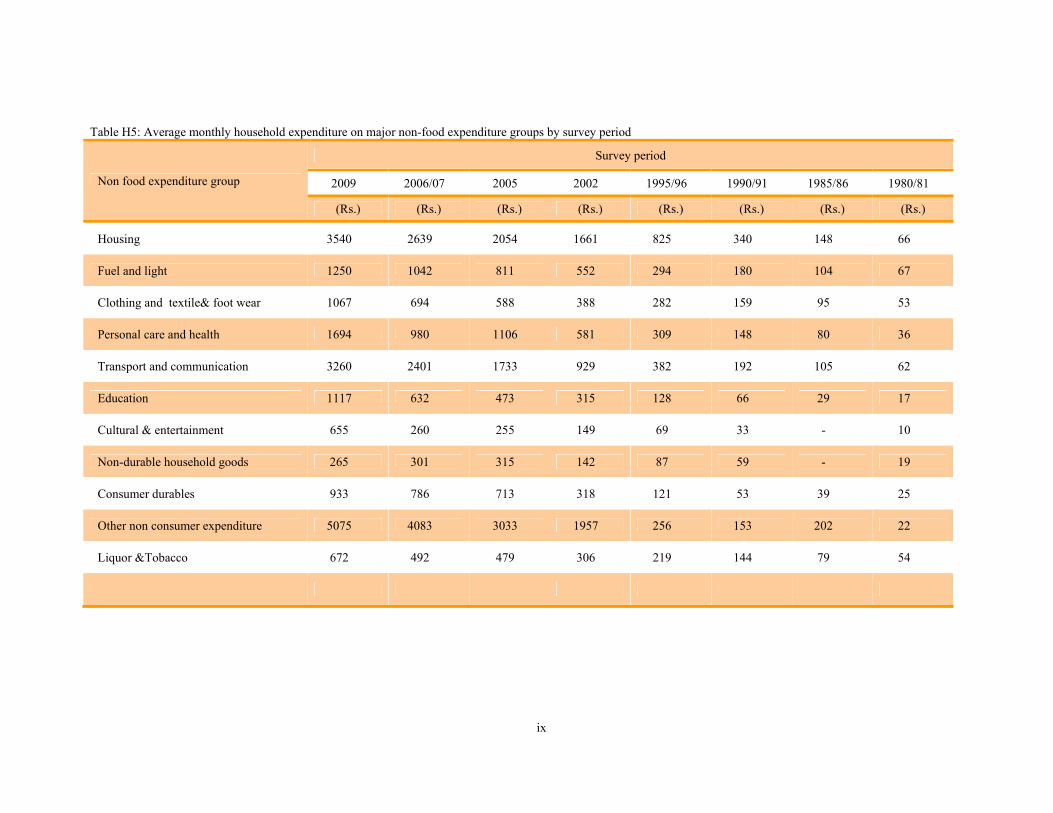
Table H5: Average monthly household expenditure on major non-food expenditure groups by survey period
Non food expenditure group
Survey period
2009 2006/07 2005 2002 1995/96 1990/91 1985/86 1980/81
(Rs.) (Rs.) (Rs.) (Rs.) (Rs.) (Rs.) (Rs.) (Rs.)
Housing 3540 2639 2054 1661 825 340 148 66
Fuel and light 1250 1042 811 552 294 180 104 67
Clothing and textile& foot wear 1067 694 588 388 282 159 95 53
Personal care and health 1694 980 1106 581 309 148 80 36
Transport and communication 3260 2401 1733 929 382 192 105 62
Education 1117 632 473 315 128 66 29 17
Cultural & entertainment 655 260 255 149 69 33 - 10
Non-durable household goods 265 301 315 142 87 59 - 19
Consumer durables 933 786 713 318 121 53 39 25
Other non consumer expenditure 5075 4083 3033 1957 256 153 202 22
Liquor &Tobacco 672 492 479 306 219 144 79 54
x
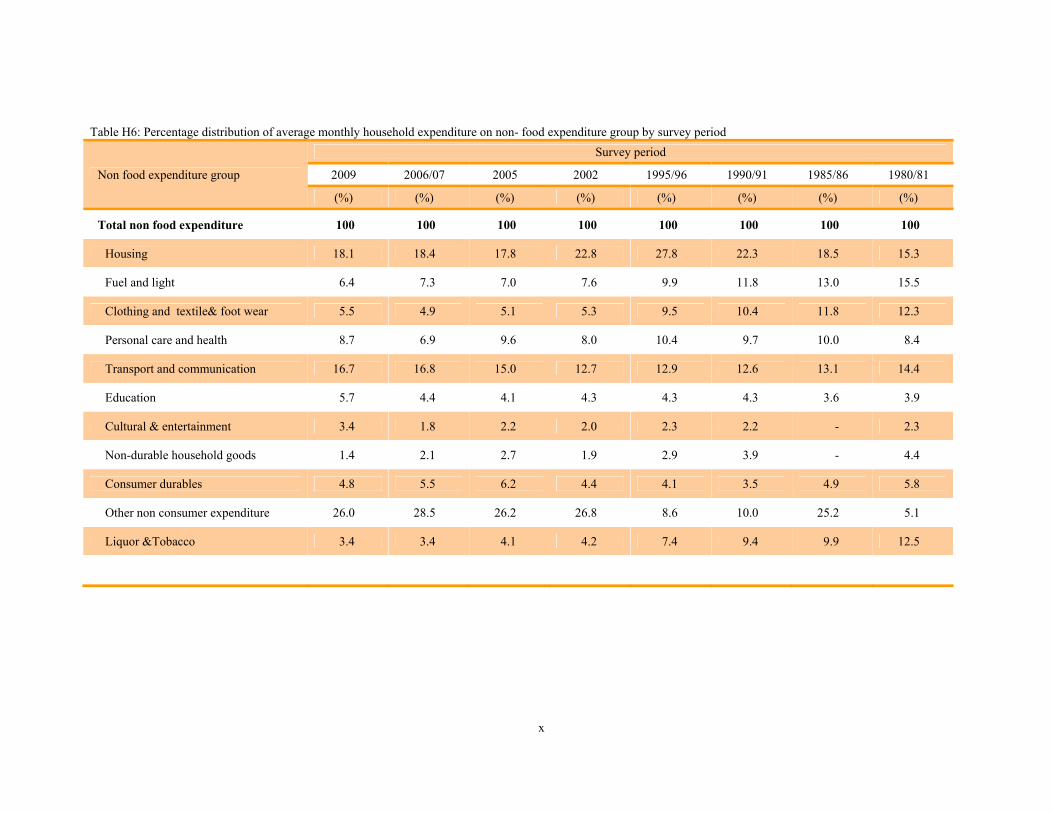
Table H6: Percentage distribution of average monthly household expenditure on non- food expenditure group by survey period
Non food expenditure group
Survey period
2009 2006/07 2005 2002 1995/96 1990/91 1985/86 1980/81
(%) (%) (%) (%) (%) (%) (%) (%)
Total non food expenditure 100 100 100 100 100 100 100 100
Housing 18.1 18.4 17.8 22.8 27.8 22.3 18.5 15.3
Fuel and light 6.4 7.3 7.0 7.6 9.9 11.8 13.0 15.5
Clothing and textile& foot wear 5.5 4.9 5.1 5.3 9.5 10.4 11.8 12.3
Personal care and health 8.7 6.9 9.6 8.0 10.4 9.7 10.0 8.4
Transport and communication 16.7 16.8 15.0 12.7 12.9 12.6 13.1 14.4
Education 5.7 4.4 4.1 4.3 4.3 4.3 3.6 3.9
Cultural & entertainment 3.4 1.8 2.2 2.0 2.3 2.2 - 2.3
Non-durable household goods 1.4 2.1 2.7 1.9 2.9 3.9 - 4.4
Consumer durables 4.8 5.5 6.2 4.4 4.1 3.5 4.9 5.8
Other non consumer expenditure 26.0 28.5 26.2 26.8 8.6 10.0 25.2 5.1
Liquor &Tobacco 3.4 3.4 4.1 4.2 7.4 9.4 9.9 12.5
1
The Household Income and Expenditure Survey (HIES) is conducted by Department of Census and Statistics (DCS) under the National Household Survey Programme (NHSP) of Sri Lanka. The DCS has completed the most recent HIES, the HIES 2009/10 and this publication exposes preliminary information of the survey to fulfill urgent data needs of the country. 1.1 History The HIES was started to conduct as Labour Force and Socio Economic Survey (LFSES) in 1980/81 and it was conducted for the second time in 1985/86. The LFSES, through a single survey, provided comprehensive information on labour force, household income and expenditure and demographic characteristics of the households and household population in Sri Lanka. In 1990 the LFSES was separated into the under mentioned 2 individual surveys as the labour force information of the country was more frequently needed. 1. Labour Force Survey (LFS) 2. Household Income and Expenditure Survey
The first HIES, conducted as a separate survey was the HIES 1990/91 and this survey provided information on household income and consumption expenditure to measure the levels and to observe the changes of living conditions in the country. The HIES information is also used to estimate consumption needs of the country and to compute various other important indicators related to poverty and price indices. Generally the HIES surveys a sample of 25,000 housing units throughout the country to facilitate the information be given at district level. Field data collection of the survey is carried out in twelve consecutive monthly rounds to capture seasonal variations in income, expenditure and consumption of households. The data collection of the survey is done through direct interviews using the survey questionnaire, which included the following three main sections. 1. Demographic characteristics 2. Household expenditure (on food and non-food) 3. Household income (monetary and non-monetary)
The previous survey, the HIES 2006/07 was the sixth in the HIES series and was conducted during the period from July 2006 to June 2007 in all the provinces other than the Northern province in Sri Lanka. The previous survey had been planned to conduct in 2005 but the survey was postponed to 2006/07 due to the tragic 2004, December 26th Tsunami disaster that destroyed most of the housing units in the coastal areas of mostly in the Eastern and the Southern provinces.
The HIES gathers information related to demographic characteristics of the members of the surveyed households, expenditure on food and non-food items and income received by each household member from all the different sources in a compulsory manner. Starting from the HIES 2006/07, the survey questionnaire was further expanded beyond the collection of just demographic, income and expenditure information, introducing 7 new sections to collect almost all the other household information that helps to understand the correct living standards of the households and the following are the new areas covered by the HIES starting from the HIES 2006/07. 1. School education (aged 5-19 years) 2. Health information 3. Inventory of durable goods 4. Access to infrastructure facilities 5. Household debts and borrowings 6. Housing, sanitary and disasters 7. Land and agriculture holdings The HIES 2009/10 is the seventh in the HIES series and the field work of the survey was completed during the period from July 2009 to June 2010 covering all the districts except Mannar, Kilinochchi and Mullaithivu districts in the Northern province. 1.2 Limitations of data Information given in this preliminary report of the HIES 2009/10 is based on the data collected in the first three months, July, August and September of 2009 out of the total 12 survey months started from July 2009 to June 2010. Due to massive post conflict resettlement activities and travel restrictions existed in most of the areas in the Northern Province during the first 3 months of the survey, only the Vavuniya district was surveyed in the Northern Province, and therefore this report is limited to an island wide representative sample of 4,773 households which excludes Jaffna, Mannar, Kilinochchi and Mullaithivu districts and carries the date stamp from July to September, 2009. The information in this report is presented at national, sector and province levels along with previous survey findings where applicable to facilitate effective comparisons overtime. However the final report of the survey, which covers an island wide sample of over 20,000 households including Jaffna district also in the Northern Province, provides all of the information published by this report and many more at district level too.
1. Introduction
2
1.3 Survey methodology Sample design of the survey is two stage stratified and the Urban, Rural and the Estate sectors in each district of the country are the selection domains thus the district is the main domain used for the stratification. The sampling frame is the list of housing units prepared for the Census of Population and Housing (CPH) 2001 and the HIES 2009/10 will be the last HIES sampled from this sampling frame as the DCS is all set to conduct the CPH in 2011 based on whole newly prepared set of census blocks, which has been almost completed by now.
1.3.1 Selection of Primary Sampling Units Primary sampling units (PSUs) are the census blocks selected for the survey and the sampling frame, which is the collection of all the census blocks prepared in 2001 in Sri Lanka, is used for the selection of the PSUs at the first stage of the selection. The PSU selection is done within all the independent selection domains that are assigned different sample size allocations to total the targeted sample size of 2,500 PSUs. The method of selection of the PSUs at the first stage is systematic with a selection probability given to each census block proportionate to the number of housing units available in the census blocks within the selection domains (PPS). The selected PSUs are updated to include newly built housing units and to exclude demolished or vacated housing units, which are no longer considered as housing units according to the survey definitions, to capture variation of natural growth and to make necessary adjustments for the same. The PSU updating operation in field is generally done less than one month prior to the survey and it was carried out for the 12 months starting from June 2009 to May 2010 to support the scheduled 12 survey months started from July 2009 to June 2010 for the HIES 2009/10.
1.3.2 Selection of Secondary Sampling Units Secondary Sampling Units (SSUs) or Final sampling units (FSUs) are the housing units selected at the second stage from the 2,500 PSUs selected at the first stage. From each PSU, 10 SSUs (housing units) are systematically selected giving each housing unit in the PSU an equal probability to be selected for the survey. The total sample of size 25,000 housing units is resulted at the end of the sampling process and this sample represents the whole country in different probabilities depend on the different sample sizes allocated for the selection domains. 1.3.3 Sample allocation Allocation of the number of PSUs or determining the sample sizes for the districts is made proportionate to the number of housing units and the standard deviations
of the mean household expenditure values reported in the respective districts in previous surveys (Neymann Allocation). Sector allocation of the district sample is made proportionate to the square root of the sizes of the respective selection domains (Urban, Rural and Estate sectors in the district). The sample of PSUs within the selection domain is equally distributed among the 12 survey months and the monthly sample too is equally dispersed among all the weeks in the month assigning a specific week for each PSU for the survey activities. Table 1.1 and Table 1.2 depict the sample distribution and response by district and by sector respectively. Table 1.1 Sample allocation and completion by district
District Housing units Households
responded Selected Responded
Sri Lanka 5,233 4,721 4,773 Colombo 756 651 663 Gampaha 510 450 454 Kalutara 429 368 378 Kandy 300 264 267 Matale 150 138 141 Nuwara Eliya 180 158 160 Galle 440 414 421 Matara 348 329 330 Hambantota 220 205 206 Vavuniya 20 19 19 Batticaloa 90 83 83 Ampara 100 93 93 Trincomalee 40 38 38 Kurunegala 310 276 277 Puttlam 200 181 183 Anuradhapura 210 194 194 Polonnaruwa 150 142 142 Badulla 200 186 190 Moneragala 130 109 109 Ratnapura 240 230 232 Kegalle 210 193 193
Table 1.2: Sample allocation for sectors
Sector Housing units Households
responded Selected Responded
Sri Lanka 5,233 4,721 4,773 Urban 1,374 1,218 1,234 Rural 3,400 3,086 3,119 Estate 459 417 420
3
∑∑==
∧
=)(
1)(
)()(
)()(
1)( )(j(u)
1m
1 Xuh
ui
uhiuh
uhuj
uh uhj
nX
nNm
P
∑∑==
+)(
1)()(
)(
)()(
1)( )(j(r)
1m
1 rh
rirhi
rh
rhrj
rh rh
nX
nNm
P
∑∑==
+)(
1)()(
)(
)()(
1)( )(j(e)
1m
1 eh
eiehi
eh
ehej
eh eh
nX
nNm
P
)(ujm
∑=
=)(
1
)(
)()(
ujh
h
ujh
ujhuh M
S
SP
)(ujhS
)(ujhM
)(uhn
)(uhiX
∑∑==
∧
=)(
1)(
)()(
)()(
1)( )(jk(u))(
1m
1 Xuh
ui
uhiuh
uhujk
uh uhujk
nX
nNm
P
1.4 Estimation procedure Let be the estimate of any given characteristic for jth district and this could be given by,
Where, = Number of census blocks selected from the
urban sector of the jth district for the survey = Selection probability of the hth census block
in the urban sector. = Measure of size (number of housing units) of
the hth census block in the urban sector of the jth district.
= Total number of census blocks in urban
sector of the jth district. = Total number of housing units listed in the
hth census block in the urban sector. = Number of housing units selected from the
hth census block in the urban sector. = The observed value for the ith sample
household in the hth census block in the urban sector.
mj(r), Ph(r), Sjh(r), Mjh(r), Nh(r), nh(r), and Xhi(r) are corresponding terms for the rural sector and mj(e), Ph (e),
Sjh(e), Mjh(e), Nh (e), nh(e), and Xhi(e) are corresponding terms for the estate sector. The estimate for the total value of the characteristic X for the country (21 districts) could be given by,
Note: The estimation procedure given above is for the total sample to be covered in 12 monthly rounds and the estimates given in this publication is based on the sample covered in the first 3 monthly rounds only. 1.5 Adjustment for unit non-response The occurrence of unit non-response was determined by examining the final result code recorded under data control section of the survey schedule. Based on the final result codes the households were grouped into the following categories, which were used as a basis for adjusting for the unit non-response.
Category 1 and 2 These were considered as fully accounted for as a schedule was completed to the extent required by the situation at the time of interview and therefore no adjustment was necessary.
Category 3 This is incomplete therefore a non-response adjustment was made for this category. The assumption made here for the adjustment of non-response was the proportion of households in category 3 is the same as the corresponding proportion for sample households in category 1. This assumption is applied on a block-by-block basis separately for urban, rural and estate sectors.
Category and description Result code
1. Schedule completed 1
2. Housing unit demolished or vacant 6
3. Unable to complete schedule, refusal, temporarily away etc.
2,3,4,5,9
j∧
X
)(uhP
)(uhN
∑=
∧∧
=21
1X X
j
j
4
⎟⎠⎞
⎜⎝⎛ −′=
1
21
.h
hhhh
nnn
WW
h
hm
1h hjh
nN
P1
m1 W
jk
∑=
=′
The block weight before adjusting for unit non-response was Where Nh = Total number of housing units listed in block h. nh = Number of housing units selected in block h. The revised weight should take the form
Where nh1 = Number of sample households in category 1. nh2 = Number of sample households in category 2. n1
h = Total number of households in all the 3 categories (category 1, 2 and 3)
1.6 Definitions and Concepts
Readers should aware about the frequently used definitions of the survey terms prior to interpret or compare the data. The definitions of the terms frequently used in this report are given below.
Household A household may be a one-person household or a multi person household. A one-person household is a unit where a person lives by himself and makes separate provision for his food, either cooking himself or purchasing. A multi person household is a group of two or more persons who lives together and has a common arrangement for cooking and partaking food. Boarders and servants who share the meals and housing facilities with other members of the household are also considered as members of the household.
Head of the household Head of a household is a person who usually resides in the household and is acknowledged by the other members of the household as the head of the household. Residential sector The residential sector can be either Urban sector, Rural sector or Estate sector. Urban Sector Area governed by either Municipal Council (MC) or Urban Council (UC) is considered as Urban Sector.
Estate Sector Plantation areas, which are more than 20 acres of extent and having not less than 10 residential laborers, are considered as estate sector.
Rural Sector Residential areas, which do not belong to the Urban sector or Estate sector described above, are considered as Rural sector. Marital Status The marital status recorded was the current status at the time of the survey. A person whose marriage was registered is classified as married (registered). If the marriage has not been registered according to the law but the person claimed to be married according to the custom or repute then it is also classified as married (customary). A person is regarded as divorced only if a divorce has been obtained in a court of law. A person who has obtained a judicial or legal separation in a court of law is classified as separated (legally). On the other hand if a person had been voluntarily separated without obtaining a court order then such persons fall into the same category classified as separated (not legally) Educational attainment This refers to the highest academic qualification obtained and the professional and technical qualifications are excluded. In the case of person with no such qualifications the highest grade or class passed in school is considered as the level of education or educational attainment. Share of income The share of income is calculated
Household size Number of persons usually living in the household including boarders and servants etc. is defined as the household size.
Household income deciles Income deciles are income groups whose boundaries are defined as to get 10 percent of the total number of households fallen into each group.
Share of income =
Total income of the households or persons belong to the group Total income of all households
or persons in all groups
5
Household expenditure deciles Expenditure deciles are defined similarly as income deciles, but expenditure values are used instead of income values.
Gini Co-efficient Gini Co-efficient, which is the most popular indicator used to measure the depth of inequality of a distribution is defined as the ratio of the area between the diagonal and the Lorenz curve to the triangular region underneath the diagonal.
Income receiver
A person who is 10 or more years old and his or her calculated total monthly income received from any source is more than or equal to Rs.150 then he or she is defined as an income receiver in this survey. Food Ratio
Food ratio (%) =
Household expenditure on food and drink
X 100 Total household expenditure
(food and drink and non food)
Dependency ratio In this survey, dependency ratio is defined as follows
1.7 Reliability of the estimates As the actual sample which is based for this publication is limited to 4,773 households surveyed in first 3 months, the estimations given are mostly limited to residential sector level to preserve the reliability of them. However after carefully considering the sizes of standard errors, some of the Province level estimations have also been given. Reliability statistics calculated for some of the estimations of most important variables of the survey are given below to build confidence among advanced data users and to support future sample design activities of similar type of surveys.
Table 1.3: Reliability statistics of selected variables - HIES 2009/10
Variable Estimate Standard error
Coefficient of variation (%)
95% confidence interval Design effect Lower Upper
Household expenditure(Rs./month) 32446.08 827.41 2.55 30820.06 34072.09 2.26 Urban 44845.30 3016.36 6.73 38917.58 50773.02 2.56 Rural 30804.74 846.52 2.75 29141.17 32468.31 2.09 Estate 25661.67 2253.76 8.78 21232.60 30090.75 2.39
Household size (persons) 3.97 0.04 0.90 3.90 4.05 2.36 Urban 4.15 0.10 2.38 3.95 4.34 1.87 Rural 3.93 0.04 1.01 3.85 4.00 2.48 Estate 4.29 0.09 2.07 4.12 4.46 0.70
Household income (Rs./month) 35495.27 1092.71 3.08 33347.88 37642.66 2.42 Urban 46196.44 3586.58 7.76 39148.13 53244.76 2.73 Rural 34329.42 1201.30 3.50 31968.63 36690.20 2.44 Estate 25649.39 3157.51 12.31 19444.27 31854.51 2.39
Household population (millions)* 19.70 0.41 2.08 18.90 20.50 12.54 Urban 2.79 0.21 7.53 2.38 3.19 2.73 Rural 15.83 0.45 2.84 14.90 16.70 2.44 Estate 1.09 0.07 6.42 0.96 1.22 2.39
* Excluding Jaffna, Mannar, Kilinochchi and Mullaithivu districts in the Northern Province
Dependency ratio =
Persons aged less than 15 years and above 60 years
Persons aged 15 – 59 years
6
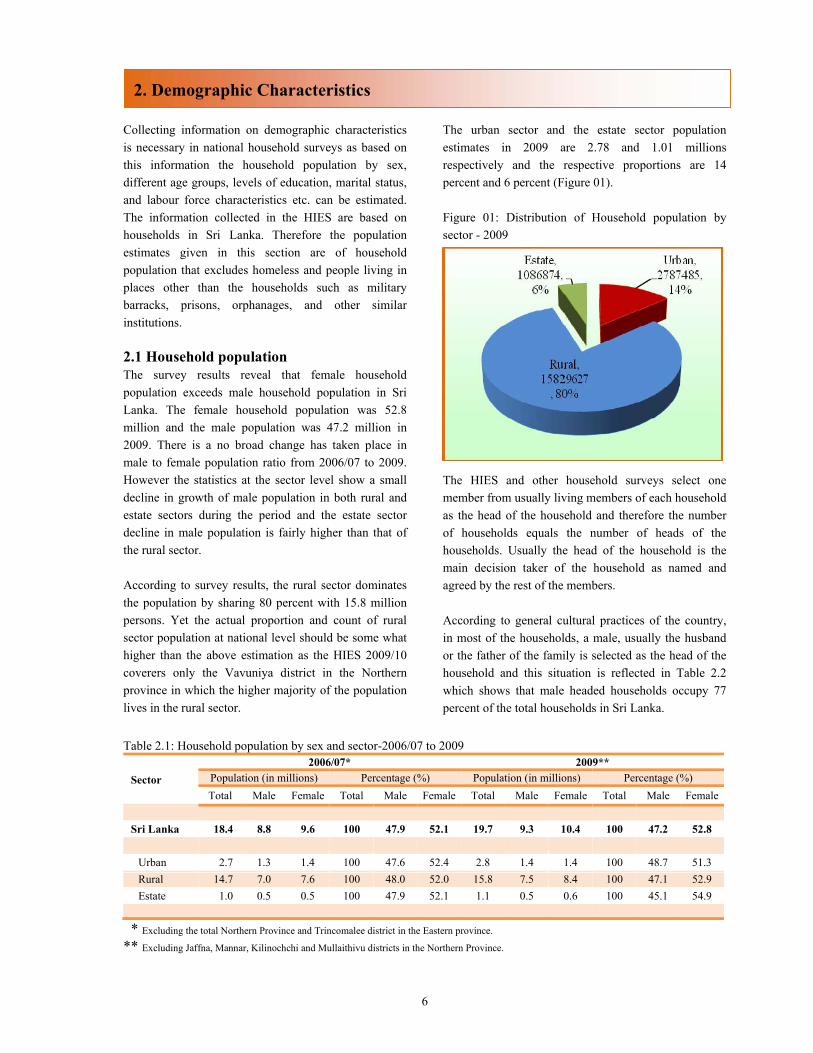
Collecting information on demographic characteristics is necessary in national household surveys as based on this information the household population by sex, different age groups, levels of education, marital status, and labour force characteristics etc. can be estimated. The information collected in the HIES are based on households in Sri Lanka. Therefore the population estimates given in this section are of household population that excludes homeless and people living in places other than the households such as military barracks, prisons, orphanages, and other similar institutions. 2.1 Household population The survey results reveal that female household population exceeds male household population in Sri Lanka. The female household population was 52.8 million and the male population was 47.2 million in 2009. There is a no broad change has taken place in male to female population ratio from 2006/07 to 2009. However the statistics at the sector level show a small decline in growth of male population in both rural and estate sectors during the period and the estate sector decline in male population is fairly higher than that of the rural sector. According to survey results, the rural sector dominates the population by sharing 80 percent with 15.8 million persons. Yet the actual proportion and count of rural sector population at national level should be some what higher than the above estimation as the HIES 2009/10 coverers only the Vavuniya district in the Northern province in which the higher majority of the population lives in the rural sector.
The urban sector and the estate sector population estimates in 2009 are 2.78 and 1.01 millions respectively and the respective proportions are 14 percent and 6 percent (Figure 01). Figure 01: Distribution of Household population by sector - 2009 The HIES and other household surveys select one member from usually living members of each household as the head of the household and therefore the number of households equals the number of heads of the households. Usually the head of the household is the main decision taker of the household as named and agreed by the rest of the members. According to general cultural practices of the country, in most of the households, a male, usually the husband or the father of the family is selected as the head of the household and this situation is reflected in Table 2.2 which shows that male headed households occupy 77 percent of the total households in Sri Lanka.
Table 2.1: Household population by sex and sector-2006/07 to 2009
Sector 2006/07* 2009**
Population (in millions) Percentage (%) Population (in millions) Percentage (%) Total Male Female Total Male Female Total Male Female Total Male Female
Sri Lanka 18.4 8.8 9.6 100 47.9 52.1 19.7 9.3 10.4 100 47.2 52.8
Urban 2.7 1.3 1.4 100 47.6 52.4 2.8 1.4 1.4 100 48.7 51.3 Rural 14.7 7.0 7.6 100 48.0 52.0 15.8 7.5 8.4 100 47.1 52.9 Estate 1.0 0.5 0.5 100 47.9 52.1 1.1 0.5 0.6 100 45.1 54.9
* Excluding the total Northern Province and Trincomalee district in the Eastern province. ** Excluding Jaffna, Mannar, Kilinochchi and Mullaithivu districts in the Northern Province.
2. Demographic Characteristics
7
Table 2.2: Heads of households (total and percentage) by sex and sector-2009
Sector
Total count (thousands) Percentage (%)
Total Sex
Total Sex
Male Female Male Female
Sri Lanka 4957.7 3819.5 1138.2 100 77.0 23.0 Urban 672.3 492.7 179.7 100 73.3 26.7 Rural 4032.1 3129.2 902.9 100 77.6 22.4 Estate 253.3 197.6 55.7 100 78.0 22.0
2.2 Age composition The age distribution of the population is one of the most important factors that effect the economic development of the country. Age distribution described in this section is limited to 3 major age groups due to the limited sample size of the preliminary publication of the survey. According to the table 2.3, which shows the percentage distributions of the household population by the 3 major age groups at sector level, the highest population
proportion in Sri Lanka is in the broad age group of 15 to 59 years (62.9%) and so are in all the 3 sectors. The percentages of aging population (60 years and above) and adult population are significantly low in estate sector than the other two sectors in Sri Lanka. Accordingly the percentage of child population (bellow 15 years) is high in estate sector which shows a sign of low life expectancy.
Table 2.3: Percentage distribution of population by selected age groups and sector-2009
Sector Age group (Years)
Total 0-14 15-59 60 and above (%) (%) (%) (%)
Sri Lanka 100 25.1 62.9 11.9
Urban 100 24.4 63.3 12.3 Rural 100 24.9 63.1 12.0 Estate 100 30.7 59.6 9.8
Household living standard has a strong relation to the characteristics of the head of the household and therefore the HIES-2009 has also investigated the same. The survey found that 51.4% of the household heads are
in the 40-59 years age group. Among the total household heads in the country, only 1.4 percent is less than 25 years old and in the estate sector almost no less than 25 years old heads are found.
Table 2.4: Percentage distribution of heads of the households by age group and sector - 2009
Sector Age group (years)
Total (%) below25 (%) 25 - 39 (%) 40 - 59 (%) 60 & above (%) Sri Lanka 100 1.4 20.6 51.4 26.5
Urban 100 2.6 22.1 50.6 24.7 Rural 100 1.3 20.4 51.3 27.0 Estate 100 0.3 20.5 54.8 24.4
8
2.3 Educational attainment As reported by the survey, the percentage distribution of five years and above aged population by the level of education is given in Table 2.5. The highest percentage of the pertinent population is reported to be in the group of grade 6 - 10 educational attainment group at national level (43.5%) and every sector confirms the same. The last column of table 2.5 shows that nearly one out of every thousand persons of the relevant population is receiving or attained in special education which is
provided to children who suffers from retarded mental conditions. The Table 2.5 also shows that the most educated group of the population choose to live in the urban sector as the urban sector holds the highest percentage (15.6%) of persons who passed G.C.E (A/L) or higher level examination and it is not so in the lesser educated groups. In the estate sector only 4.2% has attained beyond G. C. E. (A/L) and 8.8% has never attended any school.
Table 2.5: Percentage distribution of the population (Age 5 years and above) by level of education and sector - 2009
Sector
Educational attainment
Total No schooling
Up to grade 5
Passed grade 6-10
Passed GCE(O/L)
Passed GCE(A/L) and above
Attended/ attending to
special education*
(%) (%) (%) (%) (%) (%) (%) Sri Lanka 100 4.4 24.7 43.5 16.0 11.3 0.1
Urban 100 2.7 21.0 39.3 21.0 15.8 0.1 Rural 100 4.4 24.0 44.7 15.8 11.0 0.1
Estate 100 8.8 43.2 38.1 5.7 4.2 -
* The education given to children who are unable or limited capabilities in carrying out activities due to disabilities When we monitor the level of education of heads of the households at sector level, the estate sector shows the poorest educational attainment than the other two sectors. Highest number of household heads in the
estate sector falls in to the groups of who have attained only up to grade five level of education (53.7%) and 10 percent has refrained from schooling.
Table 2.6: Percentage distribution of head of household by level of education and sector - 2009 Level of education of head of the household
Sector Total No schooling
Up to Grade 5
Grade 6-10
Passed GCE(O/L)
Passed GCE(A/L) and above
(%) (%) (%) (%) (%) (%) Sri Lanka 100 4.7 24.2 45.2 15.6 10.2 Urban 100 2.4 16.5 39.9 23.6 17.6 Rural 100 4.8 23.6 47.0 15.0 9.4 Estate 100 10.0 53.7 30.2 2.9 3.1
9
2.4 Marital status Household income and expenditure survey collects information on the marital status of the persons who are in ten years and above aged and based on this the percentage distribution of this population by the marital status is given in table 2.5. The survey reveals that 57.6
percent of this population has reported as married and 34 percent has never married. Above seven persons out of every hundred were recorded as widowed and only one percent reported either divorced or separated at national level in 2009
Table 2.7: Percentage distribution of population (age 10 years and above) by marital status and sector - 2009
Sector
Marital status Total
(%)
Never married
(%)
Married
(%)
Widowed
(%)
Divorced/ Separated
(%) Sri Lanka 100 33.9 57.6 7.5 1.0
Urban 100 34.3 56.5 8.2 1.0 Rural 100 33.6 58.1 7.3 1.0 Estate 100 37.5 53.1 8.3 1.1
The survey has also reveals that one in every five heads of the households (15%) in Sri Lanka is a widower. However, the number of divorced and separated
household heads is not relatively high as more than eighty percent of the heads of the households in Sri Lanka are currently in wedlock.
Table 2.8: Percentage distribution of the population of head of households (Age 10 years and above) by marital status and sector - 2009
Sector
Marital status
Total Never married Married Widowed Divorced/ Separated
(%) (%) (%) (%) (%) Sri Lanka 100. 2.7 80.4 15.4 1.6
Urban 100. 4.7 78.1 16.2 1.0 Rural 100. 2.4 80.9 15.0 1.7 Estate 100. 0.8 79.1 18.7 1.4
2.5 Female headed households Female-headed households are households in which a female adult member is the one who is responsible for the care and organization of the household or she is selected as the head of the household by the other members of the household. Survey estimates that out of 5 million households, in Sri Lanka, 1.1 million
households or 23 percent of the households are female headed households. Table 2.9 shows that the age distribution of female heads of households and the survey has found that the majority of female heads of the households are in the age group of 40-59 years.
10
Table 2.9: Percentage distribution of female heads of households by age group and sector-2009
Sector
Age group
Total Less than 40 40 - 59 60 and above
(%) (%) (%) (%)
Sri Lanka 100 18.4 43.3 38.2
Urban 100 21.8 49.8 28.5 Rural 100 17.6 41.5 40.6 Estate 100 19.4 50.8 29.8
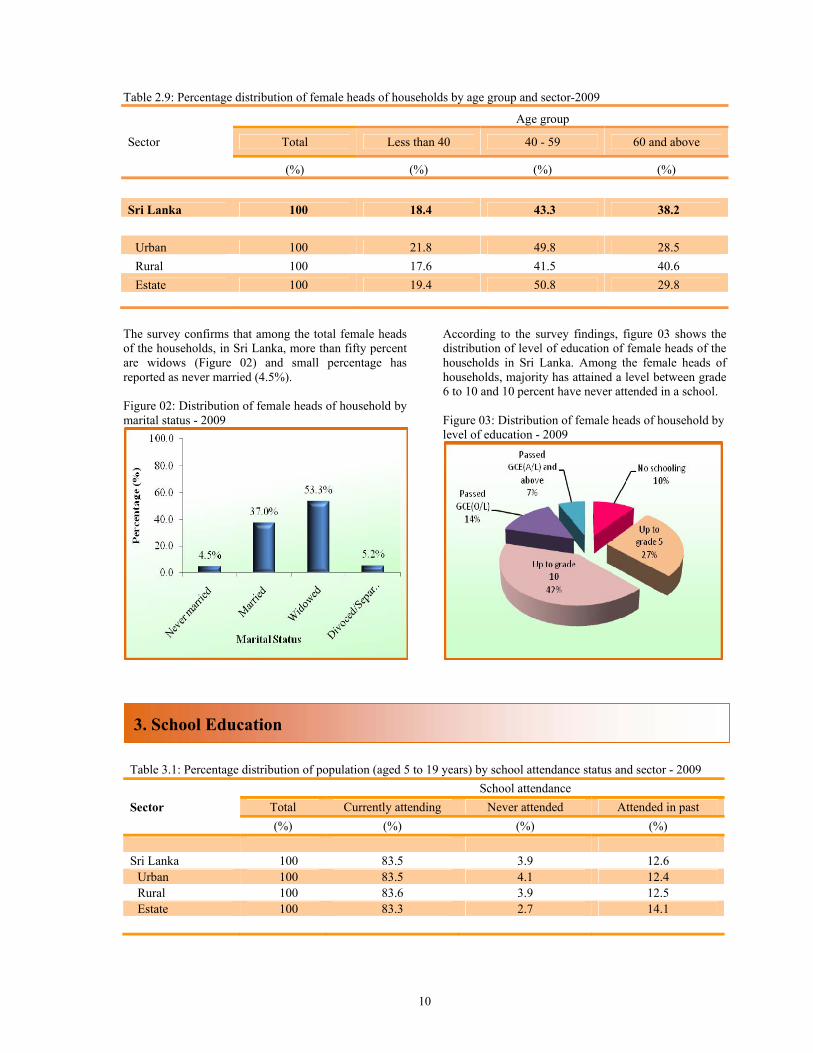
The survey confirms that among the total female heads of the households, in Sri Lanka, more than fifty percent are widows (Figure 02) and small percentage has reported as never married (4.5%). Figure 02: Distribution of female heads of household by marital status - 2009
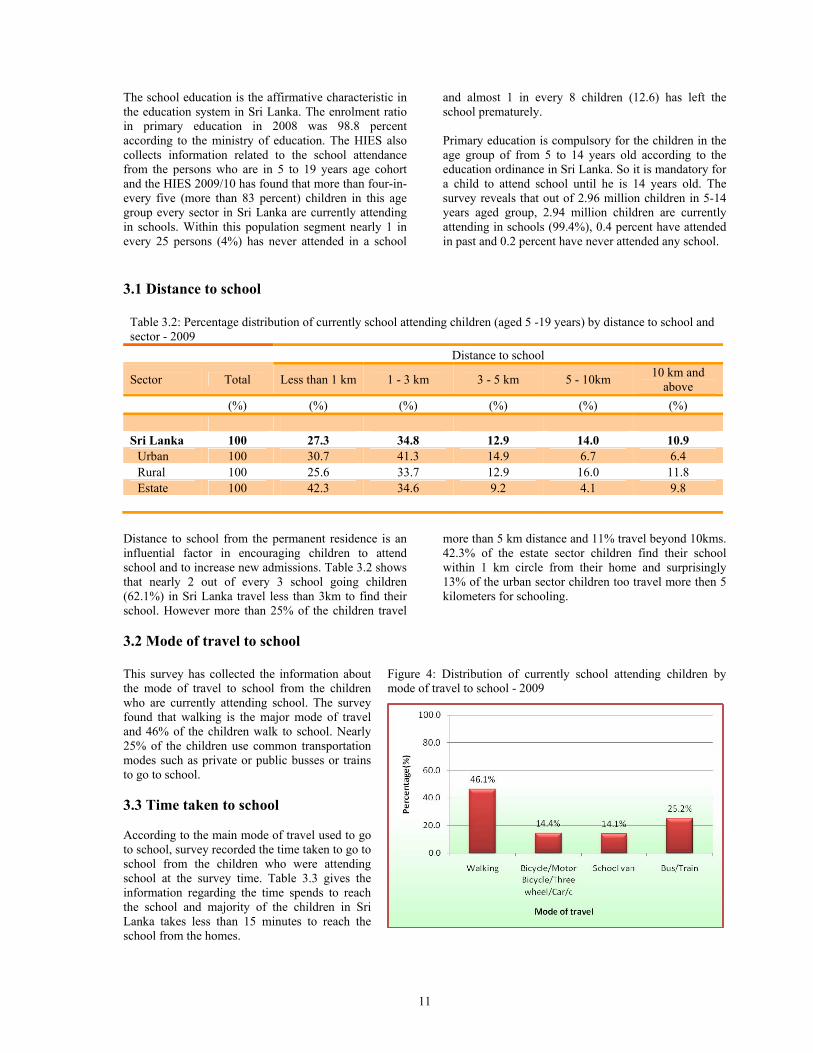
According to the survey findings, figure 03 shows the distribution of level of education of female heads of the households in Sri Lanka. Among the female heads of households, majority has attained a level between grade 6 to 10 and 10 percent have never attended in a school. Figure 03: Distribution of female heads of household by level of education - 2009
Table 3.1: Percentage distribution of population (aged 5 to 19 years) by school attendance status and sector - 2009
Sector School attendance
Total Currently attending Never attended Attended in past (%) (%) (%) (%)
Sri Lanka 100 83.5 3.9 12.6
Urban 100 83.5 4.1 12.4 Rural 100 83.6 3.9 12.5 Estate 100 83.3 2.7 14.1
3. School Education
11
The school education is the affirmative characteristic in the education system in Sri Lanka. The enrolment ratio in primary education in 2008 was 98.8 percent according to the ministry of education. The HIES also collects information related to the school attendance from the persons who are in 5 to 19 years age cohort and the HIES 2009/10 has found that more than four-in-every five (more than 83 percent) children in this age group every sector in Sri Lanka are currently attending in schools. Within this population segment nearly 1 in every 25 persons (4%) has never attended in a school
and almost 1 in every 8 children (12.6) has left the school prematurely. Primary education is compulsory for the children in the age group of from 5 to 14 years old according to the education ordinance in Sri Lanka. So it is mandatory for a child to attend school until he is 14 years old. The survey reveals that out of 2.96 million children in 5-14 years aged group, 2.94 million children are currently attending in schools (99.4%), 0.4 percent have attended in past and 0.2 percent have never attended any school.
3.1 Distance to school
Distance to school from the permanent residence is an influential factor in encouraging children to attend school and to increase new admissions. Table 3.2 shows that nearly 2 out of every 3 school going children (62.1%) in Sri Lanka travel less than 3km to find their school. However more than 25% of the children travel
more than 5 km distance and 11% travel beyond 10kms. 42.3% of the estate sector children find their school within 1 km circle from their home and surprisingly 13% of the urban sector children too travel more then 5 kilometers for schooling.
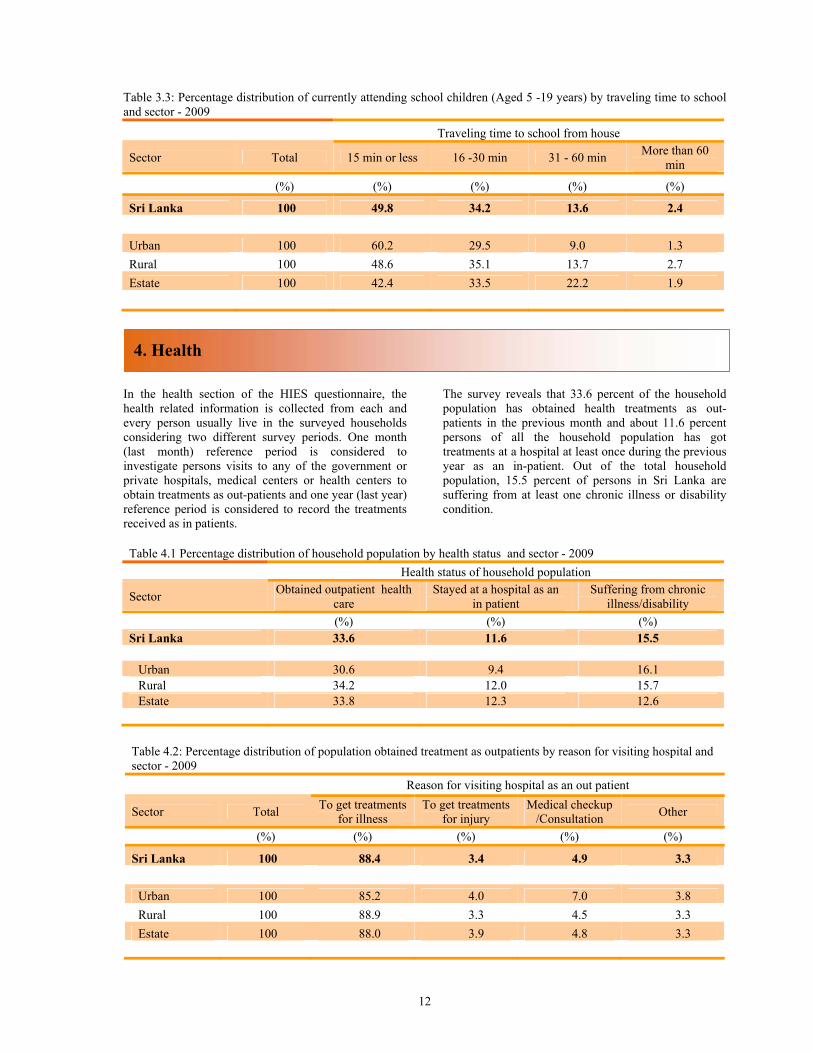
3.2 Mode of travel to school This survey has collected the information about the mode of travel to school from the children who are currently attending school. The survey found that walking is the major mode of travel and 46% of the children walk to school. Nearly 25% of the children use common transportation modes such as private or public busses or trains to go to school. 3.3 Time taken to school According to the main mode of travel used to go to school, survey recorded the time taken to go to school from the children who were attending school at the survey time. Table 3.3 gives the information regarding the time spends to reach the school and majority of the children in Sri Lanka takes less than 15 minutes to reach the school from the homes.
Figure 4: Distribution of currently school attending children by mode of travel to school - 2009
Table 3.2: Percentage distribution of currently school attending children (aged 5 -19 years) by distance to school and sector - 2009 Distance to school
Sector Total Less than 1 km 1 - 3 km 3 - 5 km 5 - 10km 10 km and above
(%) (%) (%) (%) (%) (%) Sri Lanka 100 27.3 34.8 12.9 14.0 10.9
Urban 100 30.7 41.3 14.9 6.7 6.4 Rural 100 25.6 33.7 12.9 16.0 11.8 Estate 100 42.3 34.6 9.2 4.1 9.8
12
Table 3.3: Percentage distribution of currently attending school children (Aged 5 -19 years) by traveling time to school and sector - 2009
Traveling time to school from house
Sector Total 15 min or less 16 -30 min 31 - 60 min More than 60 min
(%) (%) (%) (%) (%)
Sri Lanka 100 49.8 34.2 13.6 2.4 Urban 100 60.2 29.5 9.0 1.3 Rural 100 48.6 35.1 13.7 2.7 Estate 100 42.4 33.5 22.2 1.9
In the health section of the HIES questionnaire, the health related information is collected from each and every person usually live in the surveyed households considering two different survey periods. One month (last month) reference period is considered to investigate persons visits to any of the government or private hospitals, medical centers or health centers to obtain treatments as out-patients and one year (last year) reference period is considered to record the treatments received as in patients.
The survey reveals that 33.6 percent of the household population has obtained health treatments as out-patients in the previous month and about 11.6 percent persons of all the household population has got treatments at a hospital at least once during the previous year as an in-patient. Out of the total household population, 15.5 percent of persons in Sri Lanka are suffering from at least one chronic illness or disability condition.
Table 4.1 Percentage distribution of household population by health status and sector - 2009 Health status of household population
Sector Obtained outpatient health care
Stayed at a hospital as an in patient
Suffering from chronic illness/disability
(%) (%) (%) Sri Lanka 33.6 11.6 15.5
Urban 30.6 9.4 16.1 Rural 34.2 12.0 15.7 Estate 33.8 12.3 12.6
Table 4.2: Percentage distribution of population obtained treatment as outpatients by reason for visiting hospital and sector - 2009
Reason for visiting hospital as an out patient
Sector Total To get treatments for illness
To get treatments for injury
Medical checkup /Consultation Other
(%) (%) (%) (%) (%)
Sri Lanka 100 88.4 3.4 4.9 3.3
Urban 100 85.2 4.0 7.0 3.8 Rural 100 88.9 3.3 4.5 3.3 Estate 100 88.0 3.9 4.8 3.3
4. Health
13
In relation to the information collected regarding the reason for visiting a hospital from the persons who had obtained any treatments as outpatients, nearly 88 percent had admitted that they visited the hospital to
obtain treatments for illnesses and about 5 percent reported that a medical checkup or a consultation is their reason for visiting the hospitals (see Table 4.2).
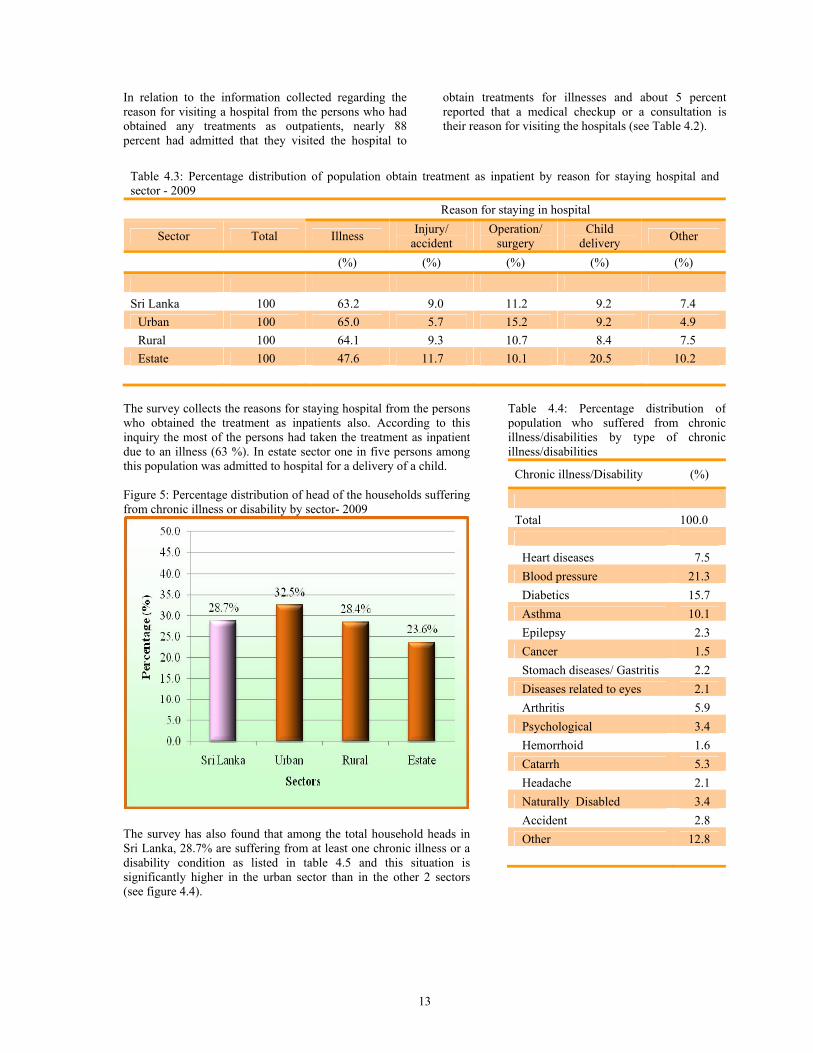
The survey collects the reasons for staying hospital from the persons who obtained the treatment as inpatients also. According to this inquiry the most of the persons had taken the treatment as inpatient due to an illness (63 %). In estate sector one in five persons among this population was admitted to hospital for a delivery of a child. Figure 5: Percentage distribution of head of the households suffering from chronic illness or disability by sector- 2009
The survey has also found that among the total household heads in Sri Lanka, 28.7% are suffering from at least one chronic illness or a disability condition as listed in table 4.5 and this situation is significantly higher in the urban sector than in the other 2 sectors (see figure 4.4).
Table 4.4: Percentage distribution of population who suffered from chronic illness/disabilities by type of chronic illness/disabilities
Chronic illness/Disability (%)
Total 100.0
Heart diseases 7.5 Blood pressure 21.3 Diabetics 15.7 Asthma 10.1 Epilepsy 2.3 Cancer 1.5 Stomach diseases/ Gastritis 2.2 Diseases related to eyes 2.1 Arthritis 5.9 Psychological 3.4 Hemorrhoid 1.6 Catarrh 5.3 Headache 2.1 Naturally Disabled 3.4 Accident 2.8 Other 12.8
Table 4.3: Percentage distribution of population obtain treatment as inpatient by reason for staying hospital and sector - 2009
Reason for staying in hospital
Sector Total Illness Injury/ accident
Operation/ surgery
Child delivery Other
(%) (%) (%) (%) (%)
Sri Lanka 100 63.2 9.0 11.2 9.2 7.4
Urban 100 65.0 5.7 15.2 9.2 4.9 Rural 100 64.1 9.3 10.7 8.4 7.5 Estate 100 47.6 11.7 10.1 20.5 10.2
14
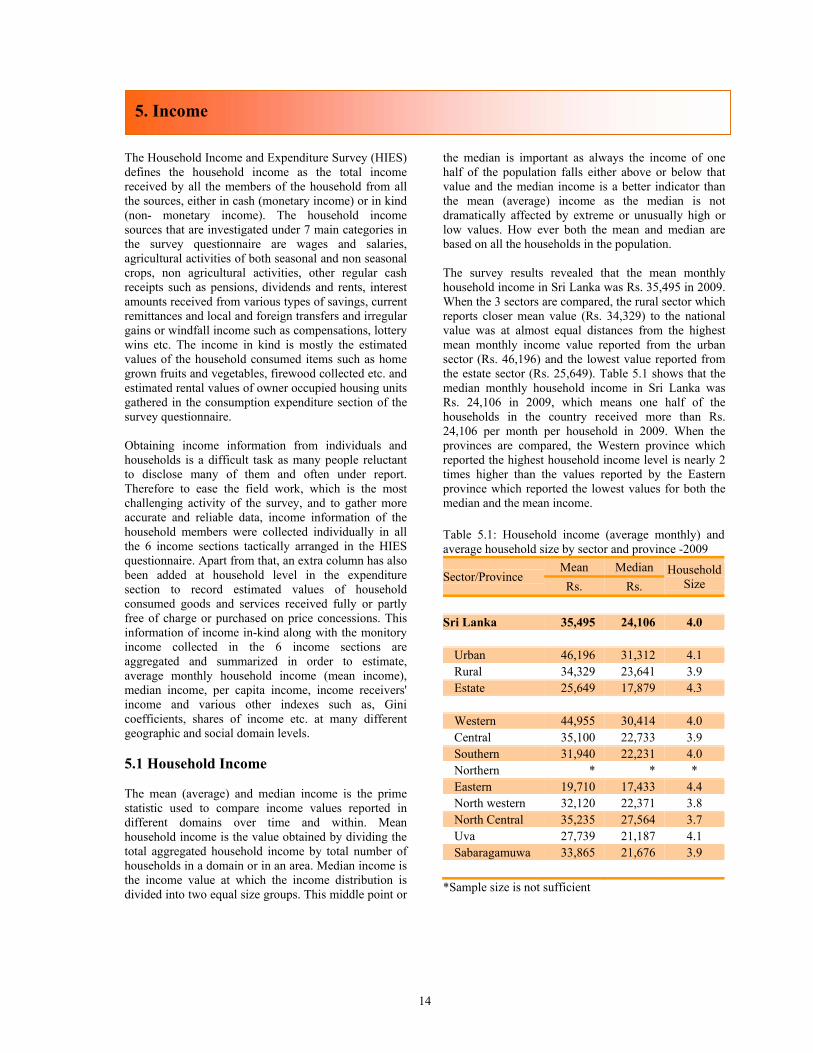
The Household Income and Expenditure Survey (HIES) defines the household income as the total income received by all the members of the household from all the sources, either in cash (monetary income) or in kind (non- monetary income). The household income sources that are investigated under 7 main categories in the survey questionnaire are wages and salaries, agricultural activities of both seasonal and non seasonal crops, non agricultural activities, other regular cash receipts such as pensions, dividends and rents, interest amounts received from various types of savings, current remittances and local and foreign transfers and irregular gains or windfall income such as compensations, lottery wins etc. The income in kind is mostly the estimated values of the household consumed items such as home grown fruits and vegetables, firewood collected etc. and estimated rental values of owner occupied housing units gathered in the consumption expenditure section of the survey questionnaire. Obtaining income information from individuals and households is a difficult task as many people reluctant to disclose many of them and often under report. Therefore to ease the field work, which is the most challenging activity of the survey, and to gather more accurate and reliable data, income information of the household members were collected individually in all the 6 income sections tactically arranged in the HIES questionnaire. Apart from that, an extra column has also been added at household level in the expenditure section to record estimated values of household consumed goods and services received fully or partly free of charge or purchased on price concessions. This information of income in-kind along with the monitory income collected in the 6 income sections are aggregated and summarized in order to estimate, average monthly household income (mean income), median income, per capita income, income receivers' income and various other indexes such as, Gini coefficients, shares of income etc. at many different geographic and social domain levels. 5.1 Household Income The mean (average) and median income is the prime statistic used to compare income values reported in different domains over time and within. Mean household income is the value obtained by dividing the total aggregated household income by total number of households in a domain or in an area. Median income is the income value at which the income distribution is divided into two equal size groups. This middle point or
the median is important as always the income of one half of the population falls either above or below that value and the median income is a better indicator than the mean (average) income as the median is not dramatically affected by extreme or unusually high or low values. How ever both the mean and median are based on all the households in the population. The survey results revealed that the mean monthly household income in Sri Lanka was Rs. 35,495 in 2009. When the 3 sectors are compared, the rural sector which reports closer mean value (Rs. 34,329) to the national value was at almost equal distances from the highest mean monthly income value reported from the urban sector (Rs. 46,196) and the lowest value reported from the estate sector (Rs. 25,649). Table 5.1 shows that the median monthly household income in Sri Lanka was Rs. 24,106 in 2009, which means one half of the households in the country received more than Rs. 24,106 per month per household in 2009. When the provinces are compared, the Western province which reported the highest household income level is nearly 2 times higher than the values reported by the Eastern province which reported the lowest values for both the median and the mean income. Table 5.1: Household income (average monthly) and average household size by sector and province -2009
Sector/Province Mean Median Household
Size Rs. Rs. Sri Lanka 35,495 24,106 4.0
Urban 46,196 31,312 4.1 Rural 34,329 23,641 3.9 Estate 25,649 17,879 4.3 Western 44,955 30,414 4.0 Central 35,100 22,733 3.9 Southern 31,940 22,231 4.0 Northern * * * Eastern 19,710 17,433 4.4 North western 32,120 22,371 3.8 North Central 35,235 27,564 3.7 Uva 27,739 21,187 4.1 Sabaragamuwa 33,865 21,676 3.9
*Sample size is not sufficient
5. Income
15
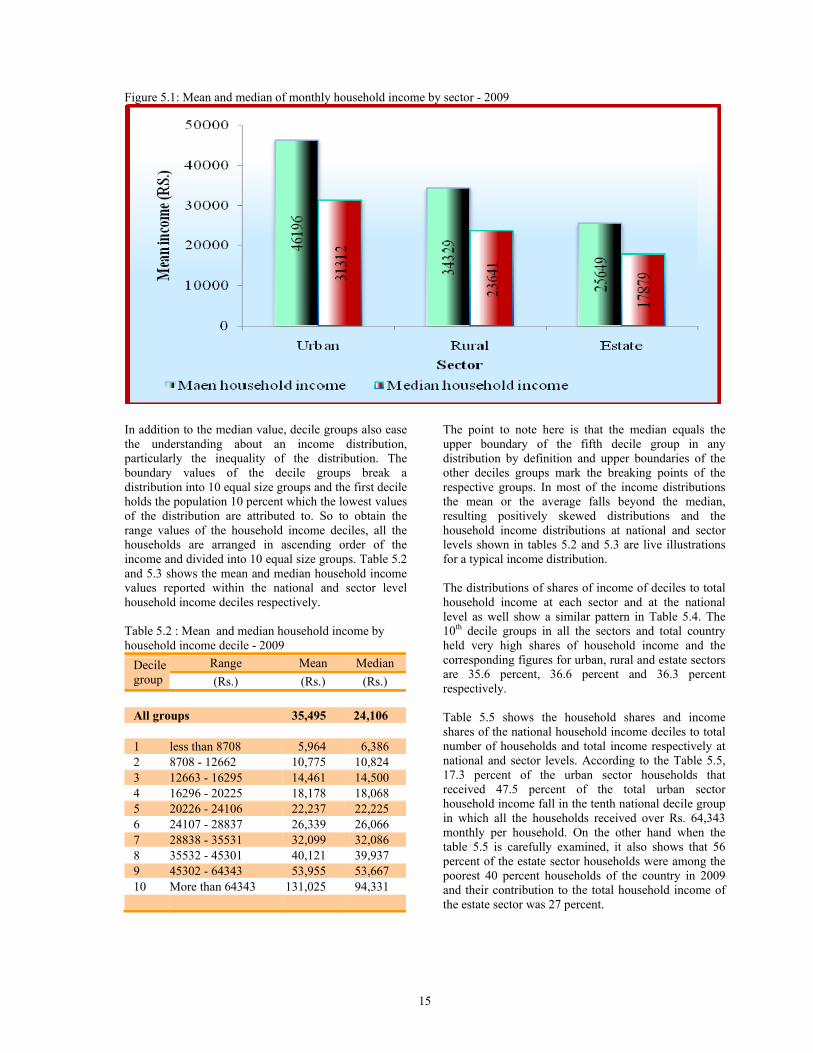
Figure 5.1: Mean and median of monthly household income by sector - 2009
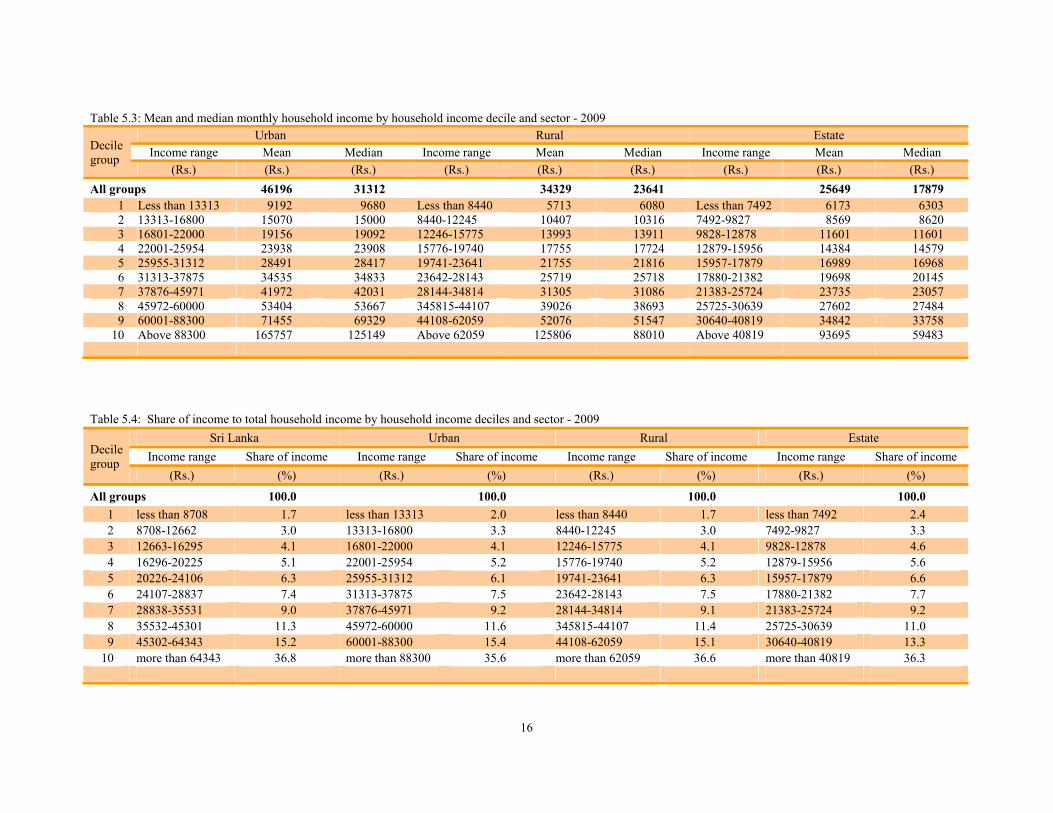
In addition to the median value, decile groups also ease the understanding about an income distribution, particularly the inequality of the distribution. The boundary values of the decile groups break a distribution into 10 equal size groups and the first decile holds the population 10 percent which the lowest values of the distribution are attributed to. So to obtain the range values of the household income deciles, all the households are arranged in ascending order of the income and divided into 10 equal size groups. Table 5.2 and 5.3 shows the mean and median household income values reported within the national and sector level household income deciles respectively. Table 5.2 : Mean and median household income by household income decile - 2009
Decile group
Range Mean Median (Rs.) (Rs.) (Rs.)
All groups 35,495 24,106 1 less than 8708 5,964 6,386 2 8708 - 12662 10,775 10,824 3 12663 - 16295 14,461 14,500 4 16296 - 20225 18,178 18,068 5 20226 - 24106 22,237 22,225 6 24107 - 28837 26,339 26,066 7 28838 - 35531 32,099 32,086 8 35532 - 45301 40,121 39,937 9 45302 - 64343 53,955 53,667 10 More than 64343 131,025 94,331
The point to note here is that the median equals the upper boundary of the fifth decile group in any distribution by definition and upper boundaries of the other deciles groups mark the breaking points of the respective groups. In most of the income distributions the mean or the average falls beyond the median, resulting positively skewed distributions and the household income distributions at national and sector levels shown in tables 5.2 and 5.3 are live illustrations for a typical income distribution. The distributions of shares of income of deciles to total household income at each sector and at the national level as well show a similar pattern in Table 5.4. The 10th decile groups in all the sectors and total country held very high shares of household income and the corresponding figures for urban, rural and estate sectors are 35.6 percent, 36.6 percent and 36.3 percent respectively. Table 5.5 shows the household shares and income shares of the national household income deciles to total number of households and total income respectively at national and sector levels. According to the Table 5.5, 17.3 percent of the urban sector households that received 47.5 percent of the total urban sector household income fall in the tenth national decile group in which all the households received over Rs. 64,343 monthly per household. On the other hand when the table 5.5 is carefully examined, it also shows that 56 percent of the estate sector households were among the poorest 40 percent households of the country in 2009 and their contribution to the total household income of the estate sector was 27 percent.
16
Table 5.4: Share of income to total household income by household income deciles and sector - 2009
Decile group
Sri Lanka Urban Rural Estate Income range Share of income Income range Share of income Income range Share of income Income range Share of income
(Rs.) (%) (Rs.) (%) (Rs.) (%) (Rs.) (%)
All groups 100.0 100.0 100.0 100.0 1 less than 8708 1.7 less than 13313 2.0 less than 8440 1.7 less than 7492 2.4 2 8708-12662 3.0 13313-16800 3.3 8440-12245 3.0 7492-9827 3.3 3 12663-16295 4.1 16801-22000 4.1 12246-15775 4.1 9828-12878 4.6 4 16296-20225 5.1 22001-25954 5.2 15776-19740 5.2 12879-15956 5.6 5 20226-24106 6.3 25955-31312 6.1 19741-23641 6.3 15957-17879 6.6 6 24107-28837 7.4 31313-37875 7.5 23642-28143 7.5 17880-21382 7.7 7 28838-35531 9.0 37876-45971 9.2 28144-34814 9.1 21383-25724 9.2 8 35532-45301 11.3 45972-60000 11.6 345815-44107 11.4 25725-30639 11.0 9 45302-64343 15.2 60001-88300 15.4 44108-62059 15.1 30640-40819 13.3
10 more than 64343 36.8 more than 88300 35.6 more than 62059 36.6 more than 40819 36.3
Table 5.3: Mean and median monthly household income by household income decile and sector - 2009
Decile group
Urban Rural Estate Income range Mean Median Income range Mean Median Income range Mean Median
(Rs.) (Rs.) (Rs.) (Rs.) (Rs.) (Rs.) (Rs.) (Rs.) (Rs.) All groups 46196 31312 34329 23641 25649 17879
1 Less than 13313 9192 9680 Less than 8440 5713 6080 Less than 7492 6173 6303 2 13313-16800 15070 15000 8440-12245 10407 10316 7492-9827 8569 8620 3 16801-22000 19156 19092 12246-15775 13993 13911 9828-12878 11601 11601 4 22001-25954 23938 23908 15776-19740 17755 17724 12879-15956 14384 14579 5 25955-31312 28491 28417 19741-23641 21755 21816 15957-17879 16989 16968 6 31313-37875 34535 34833 23642-28143 25719 25718 17880-21382 19698 20145 7 37876-45971 41972 42031 28144-34814 31305 31086 21383-25724 23735 23057 8 45972-60000 53404 53667 345815-44107 39026 38693 25725-30639 27602 274849 60001-88300 71455 69329 44108-62059 52076 51547 30640-40819 34842 33758
10 Above 88300 165757 125149 Above 62059 125806 88010 Above 40819 93695 59483
17
Table 5.5: Share of income to total household income and percentage of households by national household income decile and sector - 2009
National household income decile group and range (Rs.)
Percentage of households (%) Share of income (%) Total Urban Rural Estate Total Urban Rural Estate (%) (%) (%) (%) (%) (%) (%) (%)
All deciles 100.0 100.0 100.0 100.0 100.0 100.0 100.0 100.0 1 less than 8708 10.0 4.2 10.6 16.2 1.7 0.6 1.8 4.4 2 8708-12662 10.0 4.1 10.7 13.6 3.0 1.0 3.4 5.8 3 12663-16295 10.0 10.2 9.9 11.4 4.1 3.2 4.2 6.5 4 16296-20225 10.0 9.1 9.8 14.6 5.1 3.6 5.2 10.2 5 20226-24106 10.0 8.3 10.3 9.4 6.3 4.0 6.7 8.0 6 24107-28837 10.0 9.9 9.9 12.6 7.4 5.7 7.6 12.9 7 28838-35531 10.0 11.0 10.0 7.7 9.0 7.7 9.3 9.4 8 35532-45301 10.0 12.3 9.9 5.2 11.3 10.8 11.6 7.9 9 45302-64343 10.0 13.5 9.8 4.8 15.2 16.0 15.3 9.6
10 more than 64343 10.0 17.3 9.1 4.4 36.8 47.5 35.0 25.5
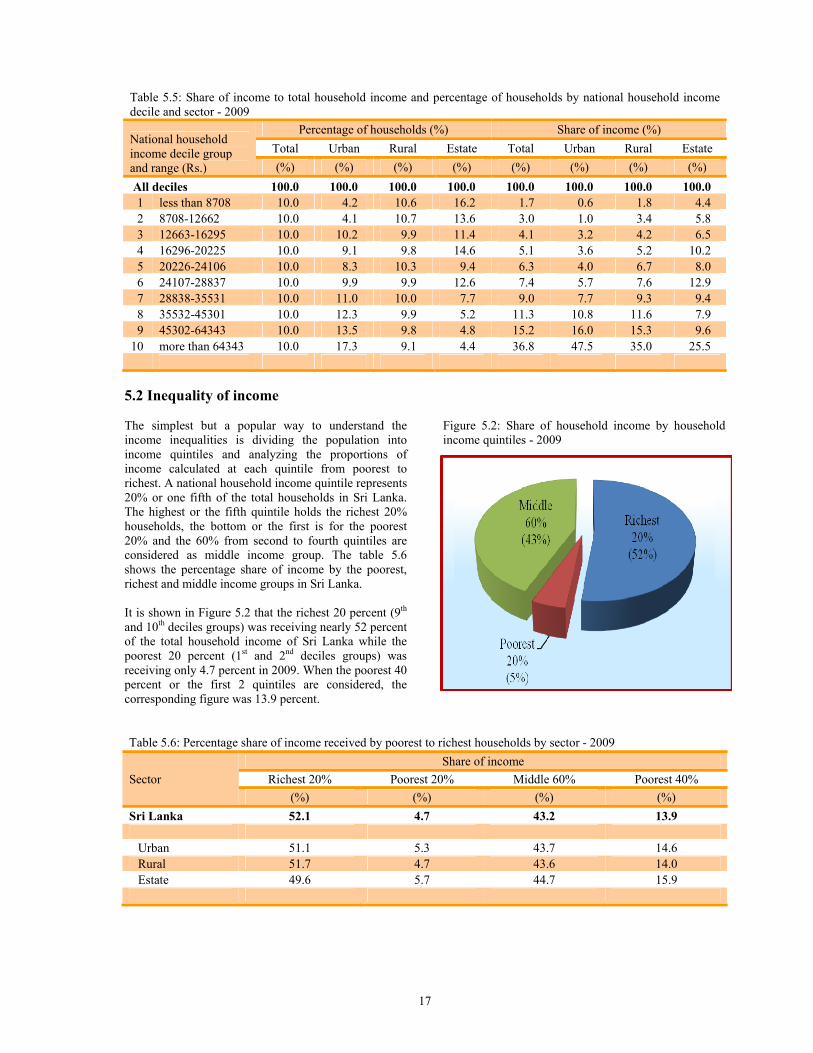
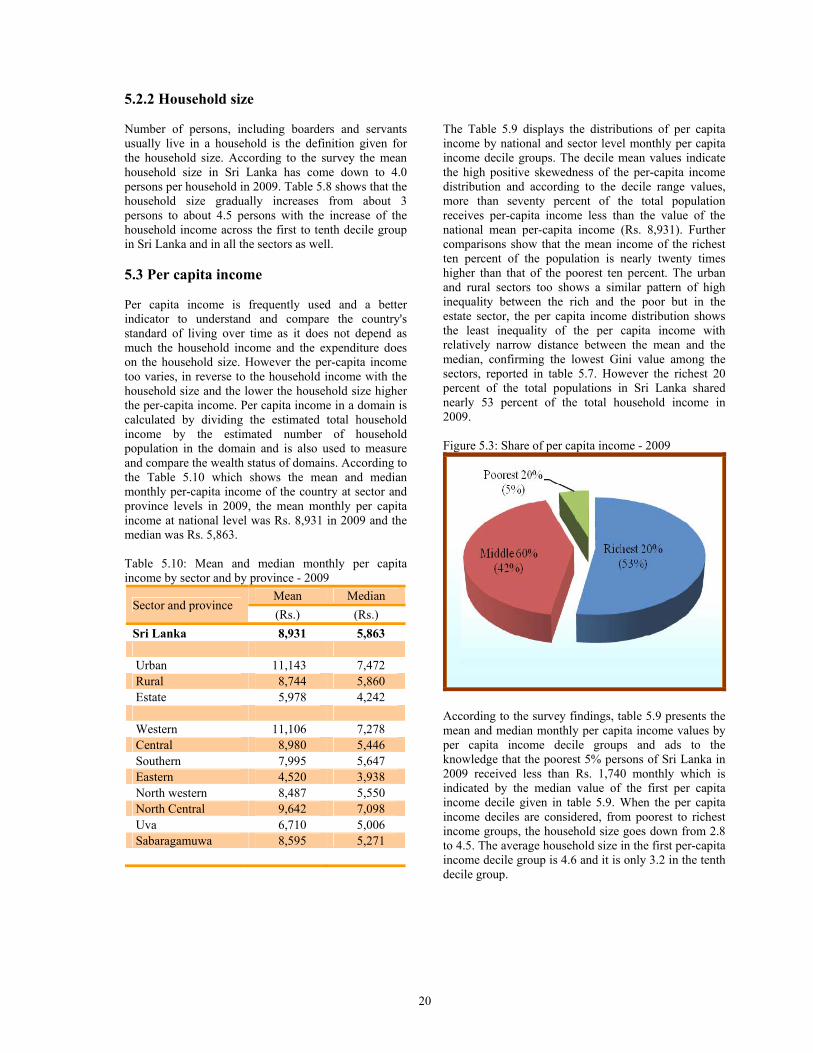
5.2 Inequality of income The simplest but a popular way to understand the income inequalities is dividing the population into income quintiles and analyzing the proportions of income calculated at each quintile from poorest to richest. A national household income quintile represents 20% or one fifth of the total households in Sri Lanka. The highest or the fifth quintile holds the richest 20% households, the bottom or the first is for the poorest 20% and the 60% from second to fourth quintiles are considered as middle income group. The table 5.6 shows the percentage share of income by the poorest, richest and middle income groups in Sri Lanka. It is shown in Figure 5.2 that the richest 20 percent (9th
and 10th deciles groups) was receiving nearly 52 percent of the total household income of Sri Lanka while the poorest 20 percent (1st and 2nd deciles groups) was receiving only 4.7 percent in 2009. When the poorest 40 percent or the first 2 quintiles are considered, the corresponding figure was 13.9 percent.
Figure 5.2: Share of household income by household income quintiles - 2009
Table 5.6: Percentage share of income received by poorest to richest households by sector - 2009
Sector Share of income
Richest 20% Poorest 20% Middle 60% Poorest 40% (%) (%) (%) (%)
Sri Lanka 52.1 4.7 43.2 13.9
Urban 51.1 5.3 43.7 14.6 Rural 51.7 4.7 43.6 14.0 Estate 49.6 5.7 44.7 15.9
18
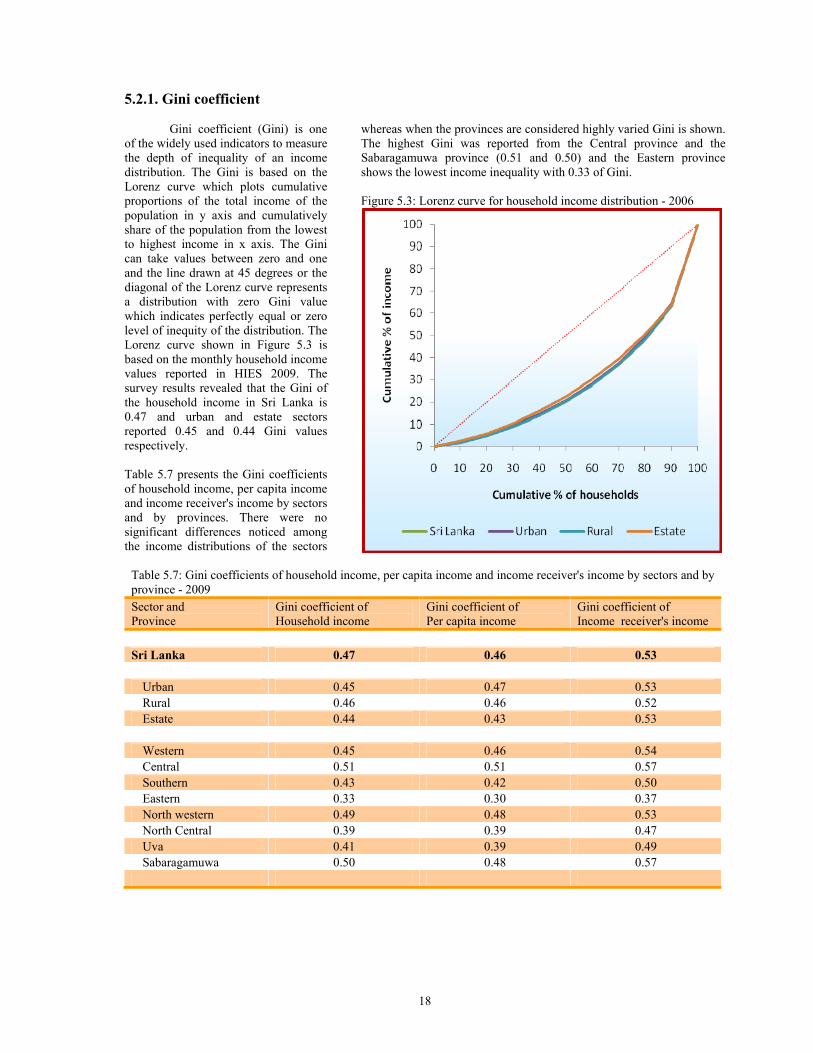
5.2.1. Gini coefficient
Gini coefficient (Gini) is one of the widely used indicators to measure the depth of inequality of an income distribution. The Gini is based on the Lorenz curve which plots cumulative proportions of the total income of the population in y axis and cumulatively share of the population from the lowest to highest income in x axis. The Gini can take values between zero and one and the line drawn at 45 degrees or the diagonal of the Lorenz curve represents a distribution with zero Gini value which indicates perfectly equal or zero level of inequity of the distribution. The Lorenz curve shown in Figure 5.3 is based on the monthly household income values reported in HIES 2009. The survey results revealed that the Gini of the household income in Sri Lanka is 0.47 and urban and estate sectors reported 0.45 and 0.44 Gini values respectively. Table 5.7 presents the Gini coefficients of household income, per capita income and income receiver's income by sectors and by provinces. There were no significant differences noticed among the income distributions of the sectors
whereas when the provinces are considered highly varied Gini is shown. The highest Gini was reported from the Central province and the Sabaragamuwa province (0.51 and 0.50) and the Eastern province shows the lowest income inequality with 0.33 of Gini. Figure 5.3: Lorenz curve for household income distribution - 2006
Table 5.7: Gini coefficients of household income, per capita income and income receiver's income by sectors and by province - 2009 Sector and Province
Gini coefficient of Household income
Gini coefficient of Per capita income
Gini coefficient of Income receiver's income
Sri Lanka 0.47 0.46 0.53
Urban 0.45 0.47 0.53 Rural 0.46 0.46 0.52 Estate 0.44 0.43 0.53 Western 0.45 0.46 0.54 Central 0.51 0.51 0.57 Southern 0.43 0.42 0.50 Eastern 0.33 0.30 0.37 North western 0.49 0.48 0.53 North Central 0.39 0.39 0.47 Uva 0.41 0.39 0.49 Sabaragamuwa 0.50 0.48 0.57
19
Table 5.8 : Household size by monthly household income decile and sector - 2009
Household income deciles
Sri Lanka Urban Rural Estate Income range Household Size Income range Household Size Income range Household Size Income range Household Size
(Rs.) (Persons) (Rs.) (Persons) (Rs.) (Persons) (Rs.) (Persons) All groups 4.0 4.2 3.9 4.3
1 less than 8708 2.8 less than 13313 3.2 less than 8440 2.8 less than 7492 3.0 2 8708-12662 3.4 13313-16800 3.8 8440-12245 3.4 7492-9827 3.3 3 12663-16295 3.7 16801-22000 3.8 12246-15775 3.6 9828-12878 3.8 4 16296-20225 3.9 22001-25954 4.4 15776-19740 3.8 12879-15956 4.4 5 20226-24106 4.1 25955-31312 4.6 19741-23641 4.0 15957-17879 5.0 6 24107-28837 4.3 31313-37875 4.2 23642-28143 4.2 17880-21382 4.7 7 28838-35531 4.2 37876-45971 4.1 28144-34814 4.2 21383-25724 4.6 8 35532-45301 4.4 45972-60000 4.2 345815-44107 4.4 25725-30639 4.6 9 45302-64343 4.4 60001-88300 4.6 44108-62059 4.4 30640-40819 4.6
10 more than 64343 4.5 more than 88300 4.4 more than 62059 4.5 more than 40819 5.0
Table 5.9: Mean and Median monthly per capita income by monthly per capita income decile and sector - 2009
Per capita income decile
Sri Lanka Urban Rural Estate Income range Mean Median Income range Mean Median Income range Mean Median Income range Mean Median
(Rs.) (Rs.) (Rs.) (Rs.) (Rs.) (Rs.) (Rs.) (Rs.) (Rs.) (Rs.) (Rs.) (Rs.) All groups 8931 5863 11143 7472 8744 5860 5978 4242
1 Less than 2420 1714 1740 Less than 2823 2088 2124 Less than 2403 1690 1675 Less than 2069 1513 1557 2 2420-3405 2941 2965 2823-3850 3412 3440 2403-3421 2959 3016 2069-2541 2348 2397 3 3406-4186 3809 3832 3851-4833 4306 4250 3422-4204 3835 3859 2542-2983 2780 2751 4 4187-4971 4556 4551 4834-5792 5287 5185 4205-4982 4567 4558 2984-3465 3216 3232 5 4971-5863 5433 5468 5793-7472 6451 6335 4983-5860 5445 5481 3466-4242 3970 4029 6 5864-7098 6419 6398 7473-8867 8072 8000 5861-7006 6388 6385 4243-4935 4552 4577 7 7099-8631 7778 7726 8868-11075 9902 9925 7007-8431 7655 7575 4936-5736 5209 5132 8 8632-11048 9770 9724 11076-14395 12820 12869 8432-10796 9568 9538 5737-6828 6256 6254 9 11049-16353 13233 12874 14396-21792 17788 17330 10797-15731 12753 12462 6829-10213 8194 7992 10 More than 16353 33672 24250 More than 21792 41538 31500 More than 15731 32623 22591 More than 10213 21911 13616
20
5.2.2 Household size Number of persons, including boarders and servants usually live in a household is the definition given for the household size. According to the survey the mean household size in Sri Lanka has come down to 4.0 persons per household in 2009. Table 5.8 shows that the household size gradually increases from about 3 persons to about 4.5 persons with the increase of the household income across the first to tenth decile group in Sri Lanka and in all the sectors as well. 5.3 Per capita income Per capita income is frequently used and a better indicator to understand and compare the country's standard of living over time as it does not depend as much the household income and the expenditure does on the household size. However the per-capita income too varies, in reverse to the household income with the household size and the lower the household size higher the per-capita income. Per capita income in a domain is calculated by dividing the estimated total household income by the estimated number of household population in the domain and is also used to measure and compare the wealth status of domains. According to the Table 5.10 which shows the mean and median monthly per-capita income of the country at sector and province levels in 2009, the mean monthly per capita income at national level was Rs. 8,931 in 2009 and the median was Rs. 5,863. Table 5.10: Mean and median monthly per capita income by sector and by province - 2009
Sector and province Mean Median (Rs.) (Rs.)
Sri Lanka 8,931 5,863 Urban 11,143 7,472 Rural 8,744 5,860 Estate 5,978 4,242 Western 11,106 7,278 Central 8,980 5,446 Southern 7,995 5,647 Eastern 4,520 3,938 North western 8,487 5,550 North Central 9,642 7,098 Uva 6,710 5,006 Sabaragamuwa 8,595 5,271
The Table 5.9 displays the distributions of per capita income by national and sector level monthly per capita income decile groups. The decile mean values indicate the high positive skewedness of the per-capita income distribution and according to the decile range values, more than seventy percent of the total population receives per-capita income less than the value of the national mean per-capita income (Rs. 8,931). Further comparisons show that the mean income of the richest ten percent of the population is nearly twenty times higher than that of the poorest ten percent. The urban and rural sectors too shows a similar pattern of high inequality between the rich and the poor but in the estate sector, the per capita income distribution shows the least inequality of the per capita income with relatively narrow distance between the mean and the median, confirming the lowest Gini value among the sectors, reported in table 5.7. However the richest 20 percent of the total populations in Sri Lanka shared nearly 53 percent of the total household income in 2009. Figure 5.3: Share of per capita income - 2009
According to the survey findings, table 5.9 presents the mean and median monthly per capita income values by per capita income decile groups and ads to the knowledge that the poorest 5% persons of Sri Lanka in 2009 received less than Rs. 1,740 monthly which is indicated by the median value of the first per capita income decile given in table 5.9. When the per capita income deciles are considered, from poorest to richest income groups, the household size goes down from 2.8 to 4.5. The average household size in the first per-capita income decile group is 4.6 and it is only 3.2 in the tenth decile group.
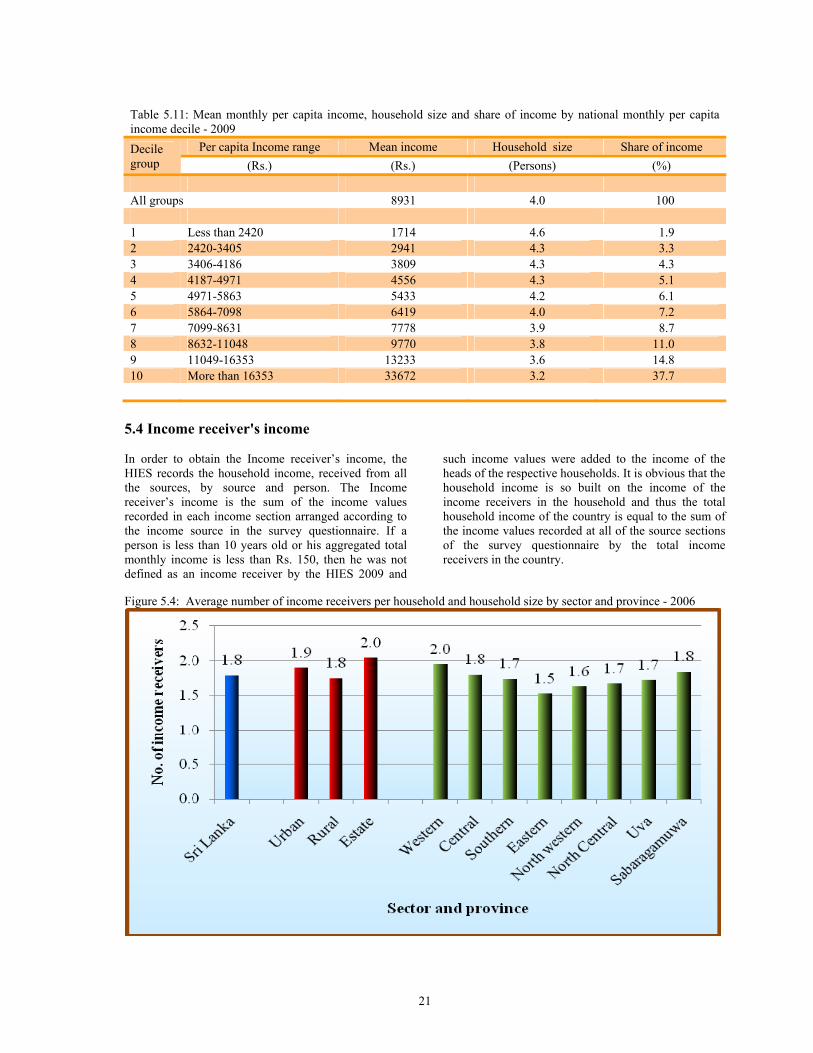
21
Table 5.11: Mean monthly per capita income, household size and share of income by national monthly per capita income decile - 2009 Decile group
Per capita Income range Mean income Household size Share of income (Rs.) (Rs.) (Persons) (%)
All groups 8931 4.0 100 1 Less than 2420 1714 4.6 1.9 2 2420-3405 2941 4.3 3.3 3 3406-4186 3809 4.3 4.3 4 4187-4971 4556 4.3 5.1 5 4971-5863 5433 4.2 6.1 6 5864-7098 6419 4.0 7.2 7 7099-8631 7778 3.9 8.7 8 8632-11048 9770 3.8 11.0 9 11049-16353 13233 3.6 14.8 10 More than 16353 33672 3.2 37.7
5.4 Income receiver's income In order to obtain the Income receiver’s income, the HIES records the household income, received from all the sources, by source and person. The Income receiver’s income is the sum of the income values recorded in each income section arranged according to the income source in the survey questionnaire. If a person is less than 10 years old or his aggregated total monthly income is less than Rs. 150, then he was not defined as an income receiver by the HIES 2009 and
such income values were added to the income of the heads of the respective households. It is obvious that the household income is so built on the income of the income receivers in the household and thus the total household income of the country is equal to the sum of the income values recorded at all of the source sections of the survey questionnaire by the total income receivers in the country.
Figure 5.4: Average number of income receivers per household and household size by sector and province - 2006
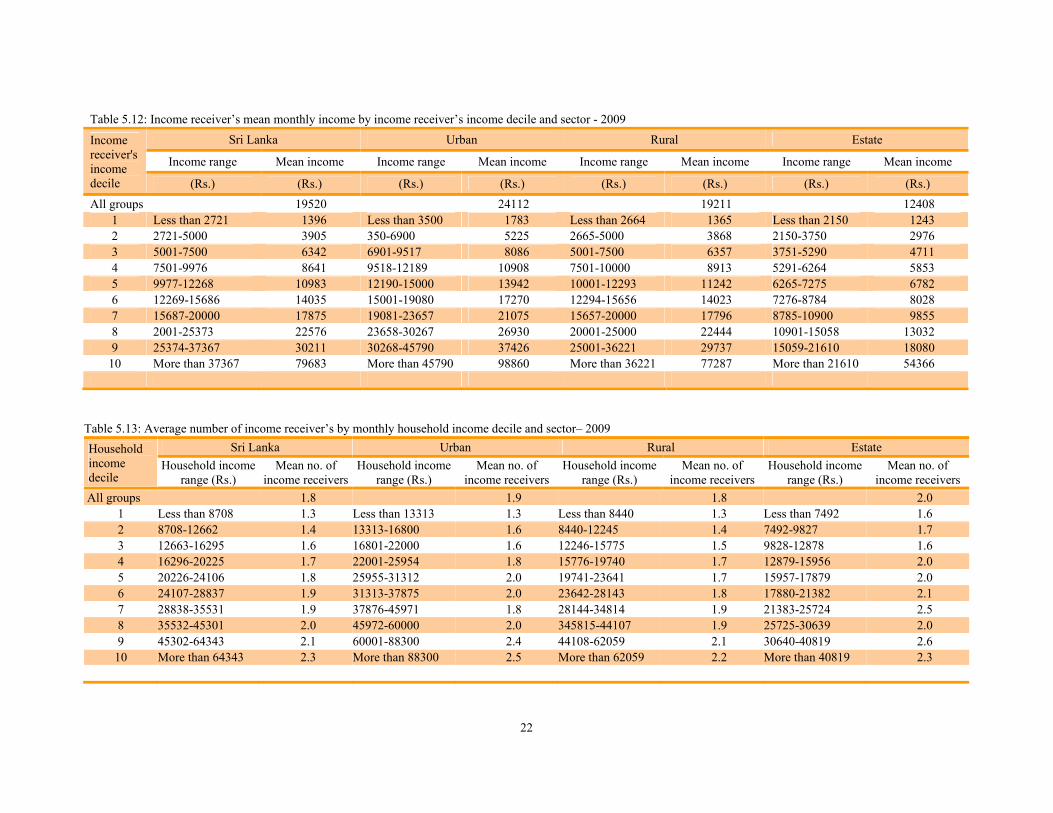
22
Table 5.13: Average number of income receiver’s by monthly household income decile and sector– 2009 Household income decile
Sri Lanka Urban Rural Estate Household income
range (Rs.) Mean no. of
income receiversHousehold income
range (Rs.) Mean no. of
income receivers Household income
range (Rs.) Mean no. of
income receivers Household income
range (Rs.) Mean no. of
income receivers All groups 1.8 1.9 1.8 2.0
1 Less than 8708 1.3 Less than 13313 1.3 Less than 8440 1.3 Less than 7492 1.6 2 8708-12662 1.4 13313-16800 1.6 8440-12245 1.4 7492-9827 1.7 3 12663-16295 1.6 16801-22000 1.6 12246-15775 1.5 9828-12878 1.6 4 16296-20225 1.7 22001-25954 1.8 15776-19740 1.7 12879-15956 2.0 5 20226-24106 1.8 25955-31312 2.0 19741-23641 1.7 15957-17879 2.0 6 24107-28837 1.9 31313-37875 2.0 23642-28143 1.8 17880-21382 2.1 7 28838-35531 1.9 37876-45971 1.8 28144-34814 1.9 21383-25724 2.5 8 35532-45301 2.0 45972-60000 2.0 345815-44107 1.9 25725-30639 2.0 9 45302-64343 2.1 60001-88300 2.4 44108-62059 2.1 30640-40819 2.6 10 More than 64343 2.3 More than 88300 2.5 More than 62059 2.2 More than 40819 2.3
Table 5.12: Income receiver’s mean monthly income by income receiver’s income decile and sector - 2009
Income receiver's income decile
Sri Lanka Urban Rural Estate
Income range Mean income Income range Mean income Income range Mean income Income range Mean income
(Rs.) (Rs.) (Rs.) (Rs.) (Rs.) (Rs.) (Rs.) (Rs.) All groups 19520 24112 19211 12408
1 Less than 2721 1396 Less than 3500 1783 Less than 2664 1365 Less than 2150 1243 2 2721-5000 3905 350-6900 5225 2665-5000 3868 2150-3750 2976 3 5001-7500 6342 6901-9517 8086 5001-7500 6357 3751-5290 4711 4 7501-9976 8641 9518-12189 10908 7501-10000 8913 5291-6264 5853 5 9977-12268 10983 12190-15000 13942 10001-12293 11242 6265-7275 6782 6 12269-15686 14035 15001-19080 17270 12294-15656 14023 7276-8784 8028 7 15687-20000 17875 19081-23657 21075 15657-20000 17796 8785-10900 9855 8 2001-25373 22576 23658-30267 26930 20001-25000 22444 10901-15058 13032 9 25374-37367 30211 30268-45790 37426 25001-36221 29737 15059-21610 18080
10 More than 37367 79683 More than 45790 98860 More than 36221 77287 More than 21610 54366
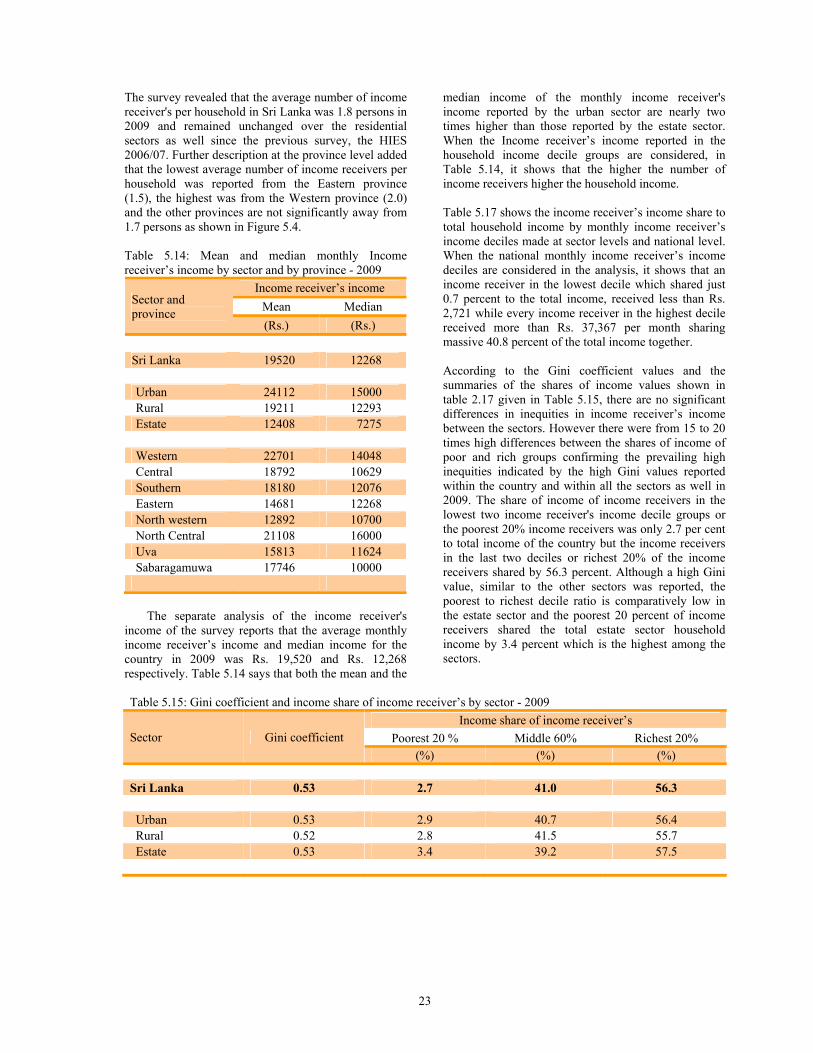
23
The survey revealed that the average number of income receiver's per household in Sri Lanka was 1.8 persons in 2009 and remained unchanged over the residential sectors as well since the previous survey, the HIES 2006/07. Further description at the province level added that the lowest average number of income receivers per household was reported from the Eastern province (1.5), the highest was from the Western province (2.0) and the other provinces are not significantly away from 1.7 persons as shown in Figure 5.4. Table 5.14: Mean and median monthly Income receiver’s income by sector and by province - 2009
Sector and province
Income receiver’s income Mean Median (Rs.) (Rs.)
Sri Lanka 19520 12268 Urban 24112 15000 Rural 19211 12293 Estate 12408 7275 Western 22701 14048 Central 18792 10629 Southern 18180 12076 Eastern 14681 12268 North western 12892 10700 North Central 21108 16000 Uva 15813 11624 Sabaragamuwa 17746 10000
The separate analysis of the income receiver's
income of the survey reports that the average monthly income receiver’s income and median income for the country in 2009 was Rs. 19,520 and Rs. 12,268 respectively. Table 5.14 says that both the mean and the
median income of the monthly income receiver's income reported by the urban sector are nearly two times higher than those reported by the estate sector. When the Income receiver’s income reported in the household income decile groups are considered, in Table 5.14, it shows that the higher the number of income receivers higher the household income.
Table 5.17 shows the income receiver’s income share to total household income by monthly income receiver’s income deciles made at sector levels and national level. When the national monthly income receiver’s income deciles are considered in the analysis, it shows that an income receiver in the lowest decile which shared just 0.7 percent to the total income, received less than Rs. 2,721 while every income receiver in the highest decile received more than Rs. 37,367 per month sharing massive 40.8 percent of the total income together.
According to the Gini coefficient values and the summaries of the shares of income values shown in table 2.17 given in Table 5.15, there are no significant differences in inequities in income receiver’s income between the sectors. However there were from 15 to 20 times high differences between the shares of income of poor and rich groups confirming the prevailing high inequities indicated by the high Gini values reported within the country and within all the sectors as well in 2009. The share of income of income receivers in the lowest two income receiver's income decile groups or the poorest 20% income receivers was only 2.7 per cent to total income of the country but the income receivers in the last two deciles or richest 20% of the income receivers shared by 56.3 percent. Although a high Gini value, similar to the other sectors was reported, the poorest to richest decile ratio is comparatively low in the estate sector and the poorest 20 percent of income receivers shared the total estate sector household income by 3.4 percent which is the highest among the sectors.
Table 5.15: Gini coefficient and income share of income receiver’s by sector - 2009
Sector Gini coefficient Income share of income receiver’s
Poorest 20 % Middle 60% Richest 20% (%) (%) (%)
Sri Lanka 0.53 2.7 41.0 56.3 Urban 0.53 2.9 40.7 56.4 Rural 0.52 2.8 41.5 55.7 Estate 0.53 3.4 39.2 57.5
24
Table 5.16: Income receiver’s median income by sector and income receiver’s income decile - 2009 Income receiver's income decile
Sri Lanka Urban Rural Estate
Income range Median income Income range Median income Income range Median income Income range Median income
(Rs.) (Rs.) (Rs.) (Rs.) (Rs.) (Rs.) (Rs.) (Rs.)All groups 12268 15000 12293 7275
1 Less than 2721 1333 Less than 3500 1667 Less than 2664 1250 Less than 2150 1350 2 2721-5000 3988 350-6900 5083 2665-5000 3870 2150-3750 3000 3 5001-7500 6264 6901-9517 8000 5001-7500 6306 3751-5290 4814 4 7501-9976 8501 9518-12189 10800 7501-10000 8957 5291-6264 5903 5 9977-12268 10980 12190-15000 14043 10001-12293 11214 6265-7275 6700 6 12269-15686 14021 15001-19080 17173 12294-15656 14000 7276-8784 8000 7 15687-20000 17900 19081-23657 20833 15657-20000 17786 8785-10900 9911 8 2001-25373 22523 23658-30267 26833 20001-25000 22410 10901-15058 13181 9 25374-37367 29817 30268-45790 38474 25001-36221 29317 15059-21610 17860
10 More than 37367 53513 More than 45790 69329 More than 36221 51600 More than 21610 32633
Table 5.17: Share of income receiver’s income to total household income by sector and income receiver’s income decile - 2009 Income receiver's income decile
Sri Lanka Urban Rural Estate
Income range Share of income Income range Share of income Income range Share of income Income range Share of income
(Rs.) (%) (Rs.) (%) (Rs.) (%) (Rs.) (%) All groups 100 100 100 100
1 Less than 2721 0.7 Less than 3500 0.7 Less than 2664 0.7 Less than 2150 1.0 2 2721-5000 2.0 350-6900 2.2 2665-5000 2.1 2150-3750 2.4 3 5001-7500 3.3 6901-9517 3.4 5001-7500 3.2 3751-5290 3.9 4 7501-9976 4.3 9518-12189 4.6 7501-10000 5.5 5291-6264 4.7 5 9977-12268 5.6 12190-15000 5.7 10001-12293 4.7 6265-7275 5.5 6 12269-15686 7.2 15001-19080 7.1 12294-15656 7.3 7276-8784 6.6 7 15687-20000 9.8 19081-23657 8.7 15657-20000 9.9 8785-10900 7.8 8 2001-25373 10.7 23658-30267 11.2 20001-25000 10.9 10901-15058 10.8 9 25374-37367 15.5 30268-45790 15.5 25001-36221 15.5 15059-21610 14.2 10 More than 37367 40.8 More than 45790 40.9 More than 36221 40.2 More than 21610 43.2
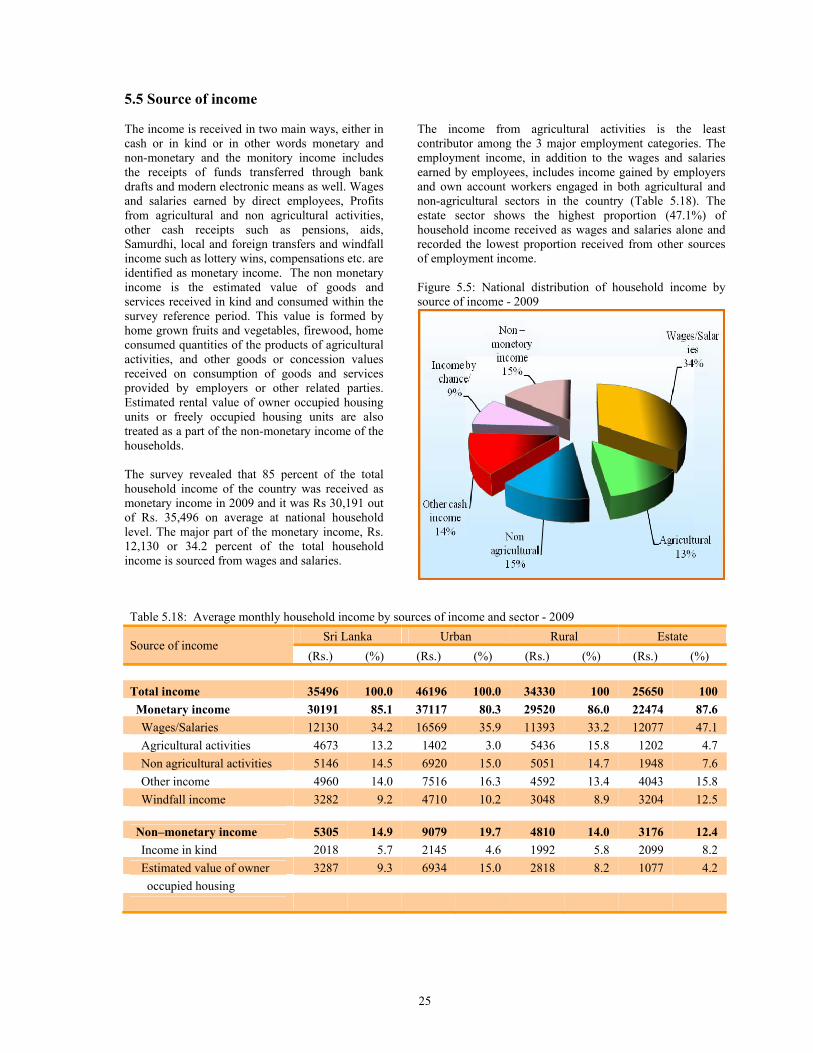
25
5.5 Source of income The income is received in two main ways, either in cash or in kind or in other words monetary and non-monetary and the monitory income includes the receipts of funds transferred through bank drafts and modern electronic means as well. Wages and salaries earned by direct employees, Profits from agricultural and non agricultural activities, other cash receipts such as pensions, aids, Samurdhi, local and foreign transfers and windfall income such as lottery wins, compensations etc. are identified as monetary income. The non monetary income is the estimated value of goods and services received in kind and consumed within the survey reference period. This value is formed by home grown fruits and vegetables, firewood, home consumed quantities of the products of agricultural activities, and other goods or concession values received on consumption of goods and services provided by employers or other related parties. Estimated rental value of owner occupied housing units or freely occupied housing units are also treated as a part of the non-monetary income of the households. The survey revealed that 85 percent of the total household income of the country was received as monetary income in 2009 and it was Rs 30,191 out of Rs. 35,496 on average at national household level. The major part of the monetary income, Rs. 12,130 or 34.2 percent of the total household income is sourced from wages and salaries.
The income from agricultural activities is the least contributor among the 3 major employment categories. The employment income, in addition to the wages and salaries earned by employees, includes income gained by employers and own account workers engaged in both agricultural and non-agricultural sectors in the country (Table 5.18). The estate sector shows the highest proportion (47.1%) of household income received as wages and salaries alone and recorded the lowest proportion received from other sources of employment income. Figure 5.5: National distribution of household income by source of income - 2009
Table 5.18: Average monthly household income by sources of income and sector - 2009
Source of income Sri Lanka Urban Rural Estate
(Rs.) (%) (Rs.) (%) (Rs.) (%) (Rs.) (%) Total income 35496 100.0 46196 100.0 34330 100 25650 100 Monetary income 30191 85.1 37117 80.3 29520 86.0 22474 87.6 Wages/Salaries 12130 34.2 16569 35.9 11393 33.2 12077 47.1 Agricultural activities 4673 13.2 1402 3.0 5436 15.8 1202 4.7 Non agricultural activities 5146 14.5 6920 15.0 5051 14.7 1948 7.6 Other income 4960 14.0 7516 16.3 4592 13.4 4043 15.8 Windfall income 3282 9.2 4710 10.2 3048 8.9 3204 12.5
Non–monetary income 5305 14.9 9079 19.7 4810 14.0 3176 12.4 Income in kind 2018 5.7 2145 4.6 1992 5.8 2099 8.2 Estimated value of owner 3287 9.3 6934 15.0 2818 8.2 1077 4.2occupied housing
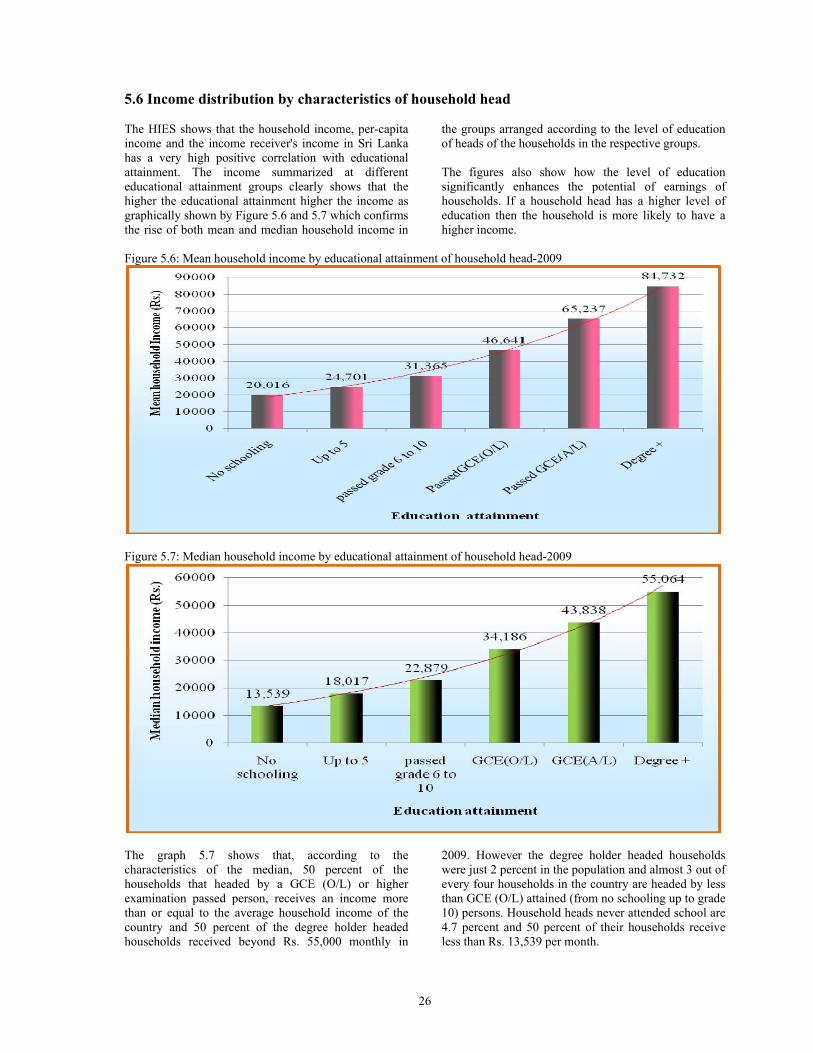
26
5.6 Income distribution by characteristics of household head The HIES shows that the household income, per-capita income and the income receiver's income in Sri Lanka has a very high positive correlation with educational attainment. The income summarized at different educational attainment groups clearly shows that the higher the educational attainment higher the income as graphically shown by Figure 5.6 and 5.7 which confirms the rise of both mean and median household income in
the groups arranged according to the level of education of heads of the households in the respective groups. The figures also show how the level of education significantly enhances the potential of earnings of households. If a household head has a higher level of education then the household is more likely to have a higher income.
Figure 5.6: Mean household income by educational attainment of household head-2009
Figure 5.7: Median household income by educational attainment of household head-2009
The graph 5.7 shows that, according to the characteristics of the median, 50 percent of the households that headed by a GCE (O/L) or higher examination passed person, receives an income more than or equal to the average household income of the country and 50 percent of the degree holder headed households received beyond Rs. 55,000 monthly in
2009. However the degree holder headed households were just 2 percent in the population and almost 3 out of every four households in the country are headed by less than GCE (O/L) attained (from no schooling up to grade 10) persons. Household heads never attended school are 4.7 percent and 50 percent of their households receive less than Rs. 13,539 per month.
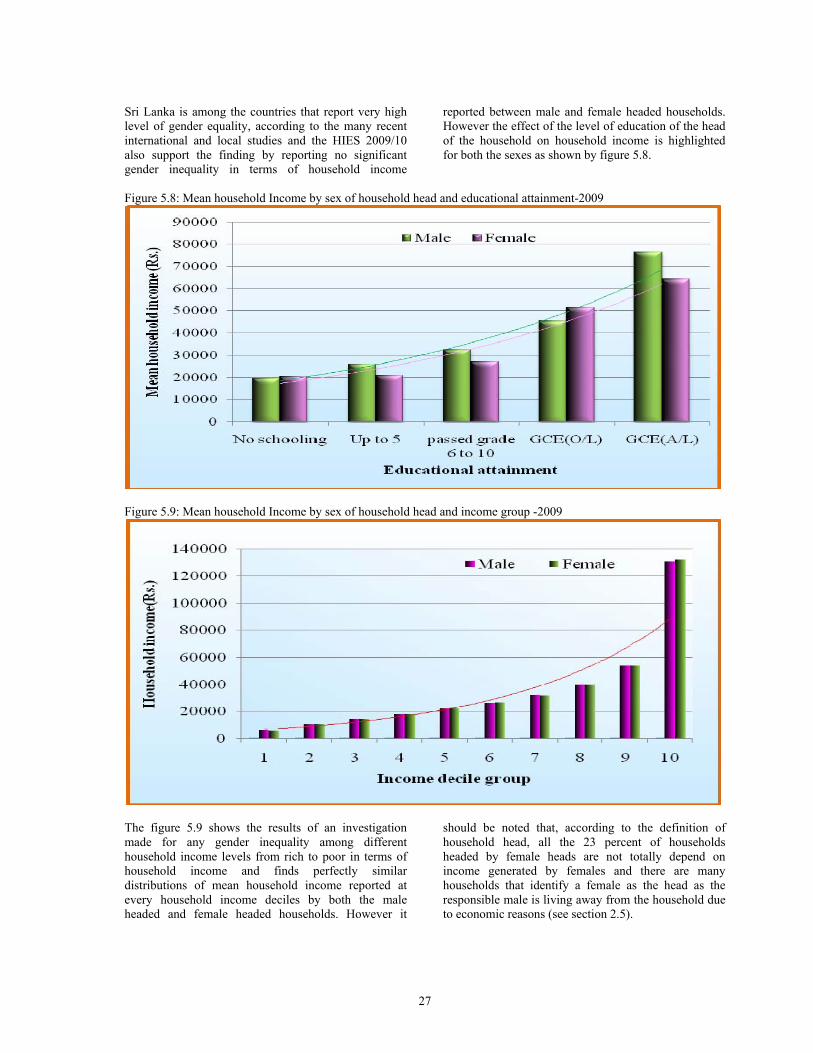
27
Sri Lanka is among the countries that report very high level of gender equality, according to the many recent international and local studies and the HIES 2009/10 also support the finding by reporting no significant gender inequality in terms of household income
reported between male and female headed households. However the effect of the level of education of the head of the household on household income is highlighted for both the sexes as shown by figure 5.8.
Figure 5.8: Mean household Income by sex of household head and educational attainment-2009
Figure 5.9: Mean household Income by sex of household head and income group -2009
The figure 5.9 shows the results of an investigation made for any gender inequality among different household income levels from rich to poor in terms of household income and finds perfectly similar distributions of mean household income reported at every household income deciles by both the male headed and female headed households. However it
should be noted that, according to the definition of household head, all the 23 percent of households headed by female heads are not totally depend on income generated by females and there are many households that identify a female as the head as the responsible male is living away from the household due to economic reasons (see section 2.5).
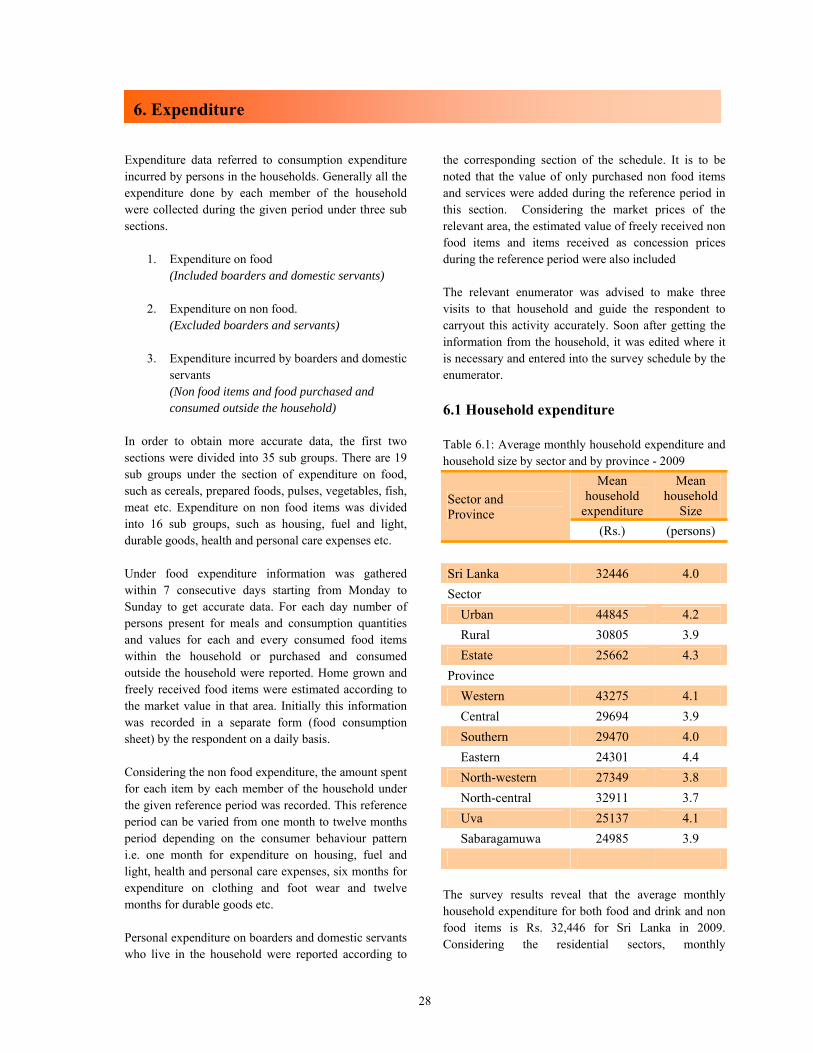
28
Expenditure data referred to consumption expenditure incurred by persons in the households. Generally all the expenditure done by each member of the household were collected during the given period under three sub sections.
1. Expenditure on food (Included boarders and domestic servants)
2. Expenditure on non food.
(Excluded boarders and servants) 3. Expenditure incurred by boarders and domestic
servants (Non food items and food purchased and consumed outside the household)
In order to obtain more accurate data, the first two sections were divided into 35 sub groups. There are 19 sub groups under the section of expenditure on food, such as cereals, prepared foods, pulses, vegetables, fish, meat etc. Expenditure on non food items was divided into 16 sub groups, such as housing, fuel and light, durable goods, health and personal care expenses etc. Under food expenditure information was gathered within 7 consecutive days starting from Monday to Sunday to get accurate data. For each day number of persons present for meals and consumption quantities and values for each and every consumed food items within the household or purchased and consumed outside the household were reported. Home grown and freely received food items were estimated according to the market value in that area. Initially this information was recorded in a separate form (food consumption sheet) by the respondent on a daily basis. Considering the non food expenditure, the amount spent for each item by each member of the household under the given reference period was recorded. This reference period can be varied from one month to twelve months period depending on the consumer behaviour pattern i.e. one month for expenditure on housing, fuel and light, health and personal care expenses, six months for expenditure on clothing and foot wear and twelve months for durable goods etc. Personal expenditure on boarders and domestic servants who live in the household were reported according to
the corresponding section of the schedule. It is to be noted that the value of only purchased non food items and services were added during the reference period in this section. Considering the market prices of the relevant area, the estimated value of freely received non food items and items received as concession prices during the reference period were also included The relevant enumerator was advised to make three visits to that household and guide the respondent to carryout this activity accurately. Soon after getting the information from the household, it was edited where it is necessary and entered into the survey schedule by the enumerator. 6.1 Household expenditure Table 6.1: Average monthly household expenditure and household size by sector and by province - 2009
Sector and Province
Mean household
expenditure
Mean household
Size (Rs.) (persons)
Sri Lanka 32446 4.0 Sector
Urban 44845 4.2 Rural 30805 3.9 Estate 25662 4.3
Province Western 43275 4.1 Central 29694 3.9 Southern 29470 4.0 Eastern 24301 4.4 North-western 27349 3.8 North-central 32911 3.7 Uva 25137 4.1 Sabaragamuwa 24985 3.9
The survey results reveal that the average monthly household expenditure for both food and drink and non food items is Rs. 32,446 for Sri Lanka in 2009. Considering the residential sectors, monthly
6. Expenditure
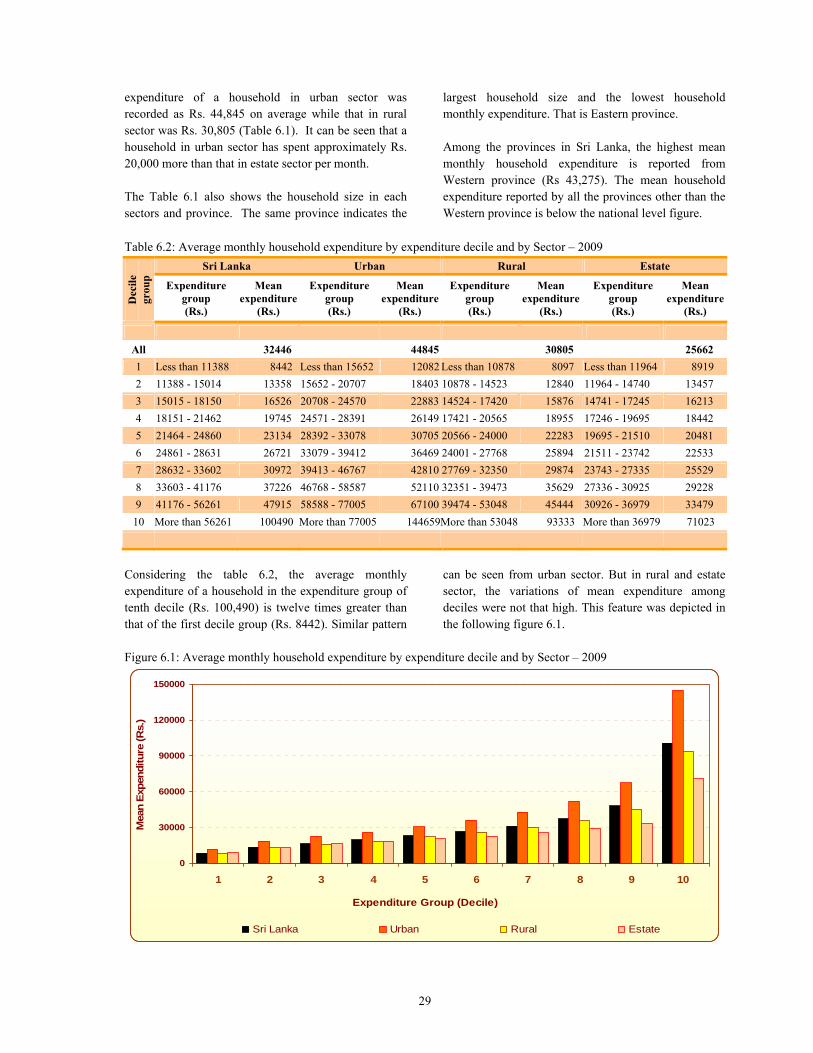
29
expenditure of a household in urban sector was recorded as Rs. 44,845 on average while that in rural sector was Rs. 30,805 (Table 6.1). It can be seen that a household in urban sector has spent approximately Rs. 20,000 more than that in estate sector per month. The Table 6.1 also shows the household size in each sectors and province. The same province indicates the
largest household size and the lowest household monthly expenditure. That is Eastern province. Among the provinces in Sri Lanka, the highest mean monthly household expenditure is reported from Western province (Rs 43,275). The mean household expenditure reported by all the provinces other than the Western province is below the national level figure.
Table 6.2: Average monthly household expenditure by expenditure decile and by Sector – 2009
Dec
ile
grou
p
Sri Lanka Urban Rural Estate
Expenditure group (Rs.)
Mean expenditure
(Rs.)
Expenditure group (Rs.)
Mean expenditure
(Rs.)
Expenditure group (Rs.)
Mean expenditure
(Rs.)
Expenditure group (Rs.)
Mean expenditure
(Rs.)
All 32446 44845 30805 25662 1 Less than 11388 8442 Less than 15652 12082 Less than 10878 8097 Less than 11964 8919 2 11388 - 15014 13358 15652 - 20707 18403 10878 - 14523 12840 11964 - 14740 13457 3 15015 - 18150 16526 20708 - 24570 22883 14524 - 17420 15876 14741 - 17245 16213 4 18151 - 21462 19745 24571 - 28391 26149 17421 - 20565 18955 17246 - 19695 18442 5 21464 - 24860 23134 28392 - 33078 30705 20566 - 24000 22283 19695 - 21510 20481 6 24861 - 28631 26721 33079 - 39412 36469 24001 - 27768 25894 21511 - 23742 22533 7 28632 - 33602 30972 39413 - 46767 42810 27769 - 32350 29874 23743 - 27335 25529 8 33603 - 41176 37226 46768 - 58587 52110 32351 - 39473 35629 27336 - 30925 29228 9 41176 - 56261 47915 58588 - 77005 67100 39474 - 53048 45444 30926 - 36979 33479 10 More than 56261 100490 More than 77005 144659More than 53048 93333 More than 36979 71023
Considering the table 6.2, the average monthly expenditure of a household in the expenditure group of tenth decile (Rs. 100,490) is twelve times greater than that of the first decile group (Rs. 8442). Similar pattern
can be seen from urban sector. But in rural and estate sector, the variations of mean expenditure among deciles were not that high. This feature was depicted in the following figure 6.1.
Figure 6.1: Average monthly household expenditure by expenditure decile and by Sector – 2009
0
30000
60000
90000
120000
150000
1 2 3 4 5 6 7 8 9 10
Expenditure Group (Decile)
Mea
n Ex
pend
iture
(Rs.
)
Sri Lanka Urban Rural Estate
30
Table 6.3: Share of household expenditure to total household expenditure by sector and by expenditure decile - 2009
Dec
ile
grou
p Sri Lanka Urban Rural Estate
Expenditure group
Share of expenditure
Expenditure group
Share of expenditure
Expenditure group
Share of expenditure
Expenditure group
Share of expenditure
(Rs.) (%) (Rs.) (%) (Rs.) (%) (Rs.) (%)
All 100.0 100.0 100.0 100.0 1 Less than 11388 2.6 Less than 15652 2.7 Less than 10878 2.6 Less than 11964 3.5 2 11388 - 15014 4.1 15652 - 20707 4.1 10878 - 14523 4.2 11964 - 14740 5.6 3 15015 - 18150 5.1 20708 - 24570 5.1 14524 - 17420 5.2 14741 - 17245 6.1 4 18151 - 21462 6.1 24571 - 28391 5.9 17421 - 20565 6.1 17246 - 19695 7.2 5 21464 - 24860 7.1 28392 - 33078 6.9 20566 - 24000 7.2 19695 - 21510 7.8 6 24861 - 28631 8.2 33079 - 39412 8.0 24001 - 27768 8.4 21511 - 23742 8.7 7 28632 - 33602 9.5 39413 - 46767 9.5 27769 - 32350 9.7 23743 - 27335 10.6 8 33603 - 41176 11.5 46768 - 58587 11.8 32351 - 39473 11.5 27336 - 30925 10.7 9 41176 - 56261 14.8 58588 - 77005 15.6 39474 - 53048 14.7 30926 - 36979 13.6 10 More than 56261 31.0 More than 77005 30.4 More than 53048 30.2 More than 36979 26.2
According to table 6.3 above, the shares of expenditure to total expenditure among deciles calculated for Sri Lanka, urban and rural sectors show a similar pattern.
But it behaves differently in the estate sector in which relatively more proportion of the total consumption of the respective sector is shared by the first 5 deciles.
Table 6.4: Household size and percentage of households by national household expenditure decile - 2009
Dec
ile
grou
p
National household
Expenditure group (Rs.)
Percentage of households Household size
Sri Lanka Urban Rural Estate Sri
Lanka Urban Rural Estate
1 Less than 11388 10.0 3.4 11.1 9.3 2.4 2.6 2.4 2.4
2 11388 - 15014 10.0 5.5 10.7 11.3 3.3 3.5 3.3 3.1
3 15015 - 18150 10.0 5.1 10.6 13.5 3.7 3.4 3.7 4.1
4 18151 - 21462 10.0 7.8 10.1 14.9 3.9 3.4 3.9 4.6
5 21464 - 24860 10.0 9.5 9.8 14.2 4.1 4.1 4.0 4.5
6 24861 - 28631 10.0 9.0 10.1 11.1 4.5 4.1 4.5 5.4
7 28632 - 33602 10.0 10.5 9.8 12.2 4.4 4.2 4.4 4.7
8 33603 - 41176 10.0 11.6 10.0 6.5 4.4 4.5 4.4 4.9
9 41176 - 56261 10.0 16.6 9.3 2.8 4.6 4.4 4.6 4.6
10 More than 56261 10.0 21.0 8.5 4.0 4.6 4.6 4.5 5.2
According to Table 6.4, when income decile group increases, the household size also increases, in all the sectors. Considering the percentage proportions of households fall in national household expenditure deciles by sector, the tenth decile group contains 21 percent of the urban households which is the highest
proportion among sectors. The relevant proportions for the rural and the estate sectors are relatively low (8.5% and 4.0% respectively) confirming with the high sector disparity exists in the country in terms of the household expenditure as shown in table 6.1.
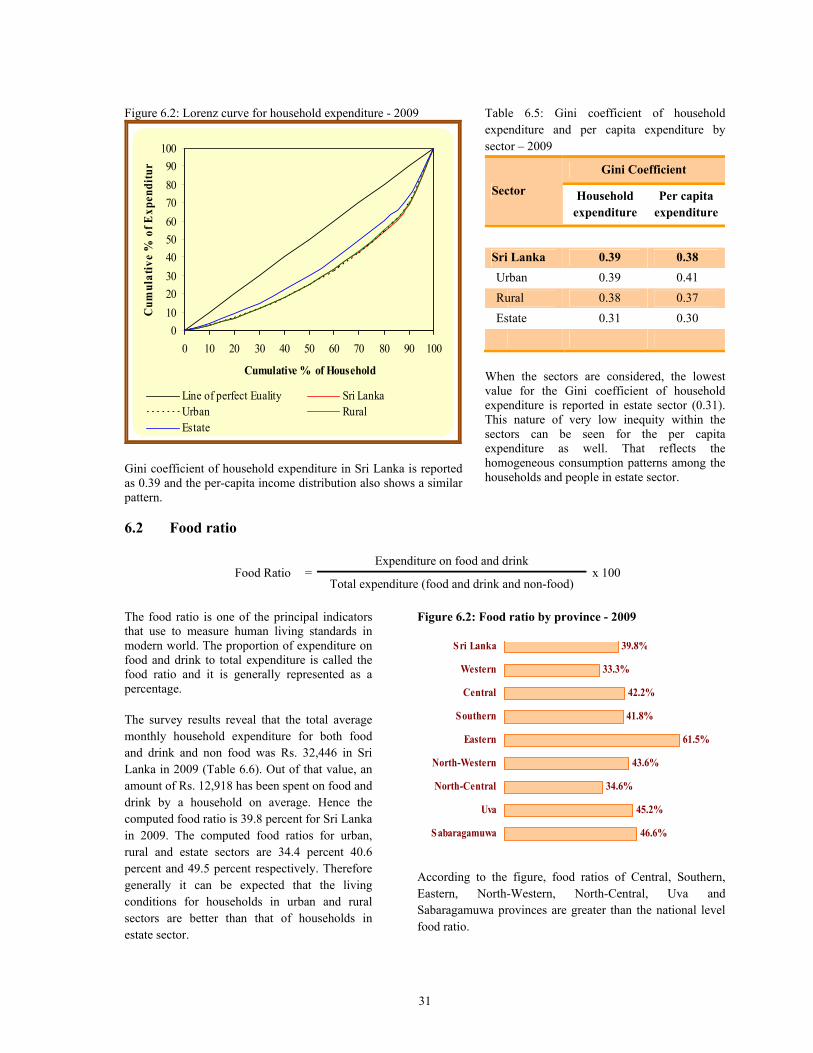
31
Figure 6.2: Lorenz curve for household expenditure - 2009
0102030405060708090
100
0 10 20 30 40 50 60 70 80 90 100
Cumulative % of Household
Cum
ulat
ive
% o
f Exp
endi
tur
Line of perfect Euality Sri LankaUrban RuralEstate
Gini coefficient of household expenditure in Sri Lanka is reported as 0.39 and the per-capita income distribution also shows a similar pattern.
Table 6.5: Gini coefficient of household expenditure and per capita expenditure by sector – 2009
Sector
Gini Coefficient
Household expenditure
Per capita expenditure
Sri Lanka 0.39 0.38 Urban 0.39 0.41 Rural 0.38 0.37 Estate 0.31 0.30
When the sectors are considered, the lowest value for the Gini coefficient of household expenditure is reported in estate sector (0.31). This nature of very low inequity within the sectors can be seen for the per capita expenditure as well. That reflects the homogeneous consumption patterns among the households and people in estate sector.
6.2 Food ratio
Food Ratio = Expenditure on food and drink
x 100 Total expenditure (food and drink and non-food)
The food ratio is one of the principal indicators that use to measure human living standards in modern world. The proportion of expenditure on food and drink to total expenditure is called the food ratio and it is generally represented as a percentage. The survey results reveal that the total average monthly household expenditure for both food and drink and non food was Rs. 32,446 in Sri Lanka in 2009 (Table 6.6). Out of that value, an amount of Rs. 12,918 has been spent on food and drink by a household on average. Hence the computed food ratio is 39.8 percent for Sri Lanka in 2009. The computed food ratios for urban, rural and estate sectors are 34.4 percent 40.6 percent and 49.5 percent respectively. Therefore generally it can be expected that the living conditions for households in urban and rural sectors are better than that of households in estate sector.
Figure 6.2: Food ratio by province - 2009
46.6%
45.2%
34.6%
43.6%
61.5%
41.8%
42.2%
33.3%
39.8%
Sabaragamuwa
Uva
North-Central
North-Western
Eastern
Southern
Central
Western
Sri Lanka
According to the figure, food ratios of Central, Southern, Eastern, North-Western, North-Central, Uva and Sabaragamuwa provinces are greater than the national level food ratio.
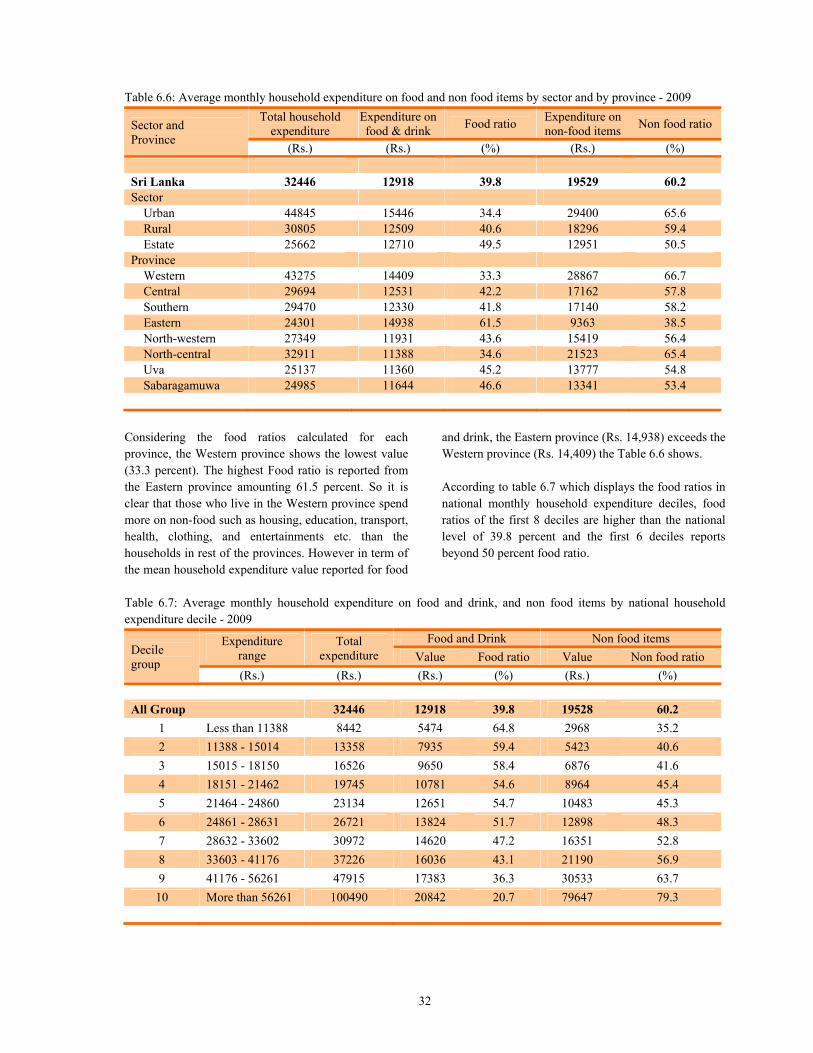
32
Table 6.6: Average monthly household expenditure on food and non food items by sector and by province - 2009
Sector and Province
Total household expenditure
Expenditure on food & drink Food ratio Expenditure on
non-food items Non food ratio
(Rs.) (Rs.) (%) (Rs.) (%)
Sri Lanka 32446 12918 39.8 19529 60.2 Sector
Urban 44845 15446 34.4 29400 65.6 Rural 30805 12509 40.6 18296 59.4 Estate 25662 12710 49.5 12951 50.5
Province Western 43275 14409 33.3 28867 66.7 Central 29694 12531 42.2 17162 57.8 Southern 29470 12330 41.8 17140 58.2 Eastern 24301 14938 61.5 9363 38.5 North-western 27349 11931 43.6 15419 56.4 North-central 32911 11388 34.6 21523 65.4 Uva 25137 11360 45.2 13777 54.8 Sabaragamuwa 24985 11644 46.6 13341 53.4
Considering the food ratios calculated for each province, the Western province shows the lowest value (33.3 percent). The highest Food ratio is reported from the Eastern province amounting 61.5 percent. So it is clear that those who live in the Western province spend more on non-food such as housing, education, transport, health, clothing, and entertainments etc. than the households in rest of the provinces. However in term of the mean household expenditure value reported for food
and drink, the Eastern province (Rs. 14,938) exceeds the Western province (Rs. 14,409) the Table 6.6 shows. According to table 6.7 which displays the food ratios in national monthly household expenditure deciles, food ratios of the first 8 deciles are higher than the national level of 39.8 percent and the first 6 deciles reports beyond 50 percent food ratio.
Table 6.7: Average monthly household expenditure on food and drink, and non food items by national household expenditure decile - 2009
Decile group
Expenditure range
Total expenditure
Food and Drink Non food items Value Food ratio Value Non food ratio
(Rs.) (Rs.) (Rs.) (%) (Rs.) (%) All Group 32446 12918 39.8 19528 60.2
1 Less than 11388 8442 5474 64.8 2968 35.2 2 11388 - 15014 13358 7935 59.4 5423 40.6 3 15015 - 18150 16526 9650 58.4 6876 41.6 4 18151 - 21462 19745 10781 54.6 8964 45.4 5 21464 - 24860 23134 12651 54.7 10483 45.3 6 24861 - 28631 26721 13824 51.7 12898 48.3 7 28632 - 33602 30972 14620 47.2 16351 52.8 8 33603 - 41176 37226 16036 43.1 21190 56.9 9 41176 - 56261 47915 17383 36.3 30533 63.7 10 More than 56261 100490 20842 20.7 79647 79.3
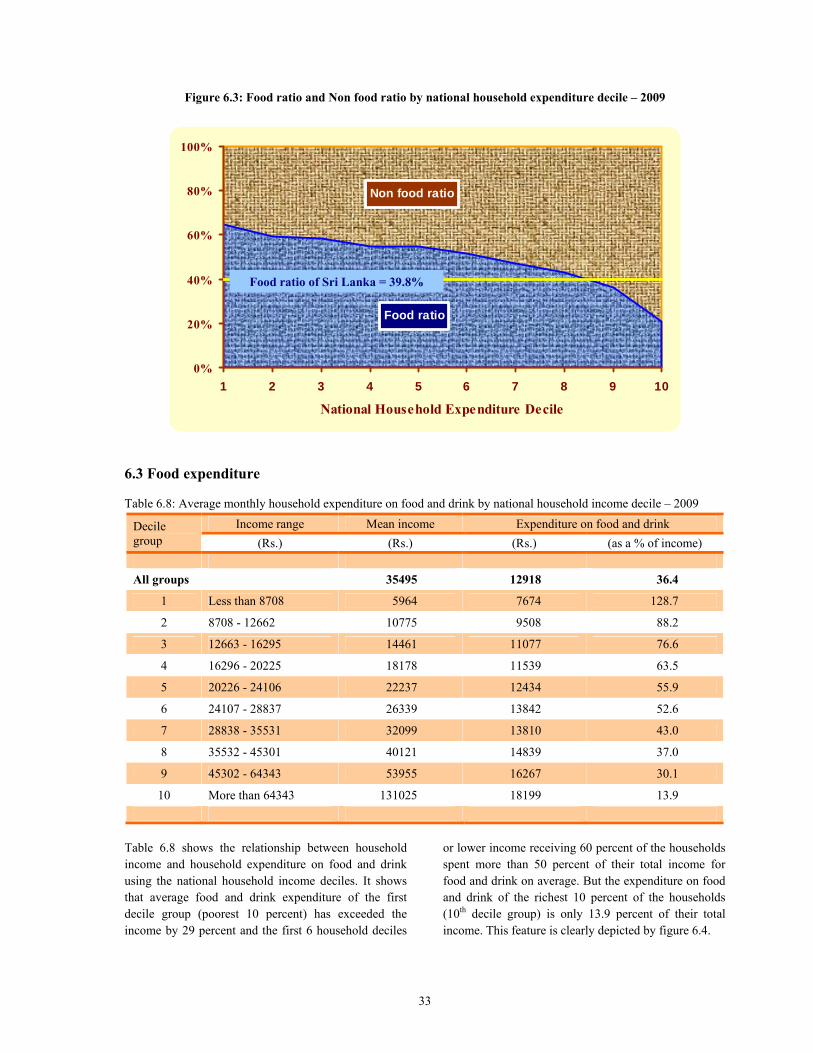
33
Figure 6.3: Food ratio and Non food ratio by national household expenditure decile – 2009
Food ratio
Non food ratio
0%
20%
40%
60%
80%
100%
1 2 3 4 5 6 7 8 9 10
National Household Expenditure Decile
6.3 Food expenditure Table 6.8: Average monthly household expenditure on food and drink by national household income decile – 2009
Decile group
Income range Mean income Expenditure on food and drink (Rs.) (Rs.) (Rs.) (as a % of income)
All groups 35495 12918 36.4
1 Less than 8708 5964 7674 128.7
2 8708 - 12662 10775 9508 88.2
3 12663 - 16295 14461 11077 76.6
4 16296 - 20225 18178 11539 63.5
5 20226 - 24106 22237 12434 55.9
6 24107 - 28837 26339 13842 52.6
7 28838 - 35531 32099 13810 43.0
8 35532 - 45301 40121 14839 37.0
9 45302 - 64343 53955 16267 30.1
10 More than 64343 131025 18199 13.9
Table 6.8 shows the relationship between household income and household expenditure on food and drink using the national household income deciles. It shows that average food and drink expenditure of the first decile group (poorest 10 percent) has exceeded the income by 29 percent and the first 6 household deciles
or lower income receiving 60 percent of the households spent more than 50 percent of their total income for food and drink on average. But the expenditure on food and drink of the richest 10 percent of the households (10th decile group) is only 13.9 percent of their total income. This feature is clearly depicted by figure 6.4.
Food ratio of Sri Lanka = 39.8%
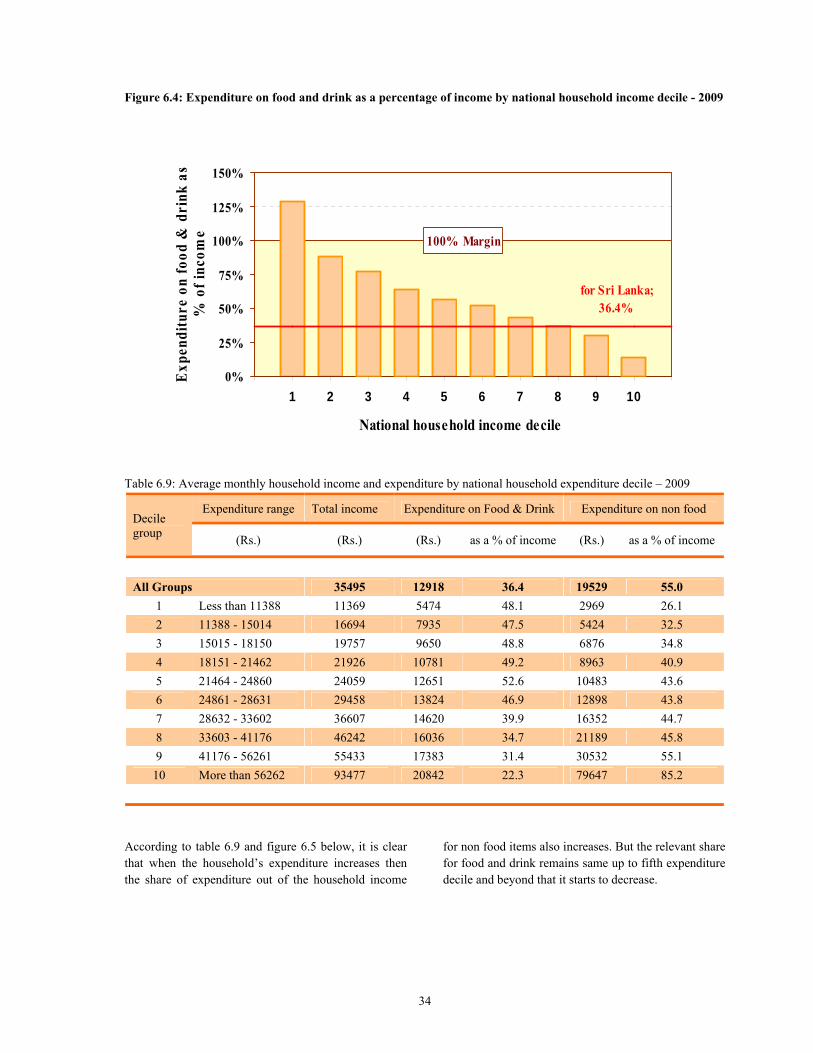
34
Figure 6.4: Expenditure on food and drink as a percentage of income by national household income decile - 2009
100% Margin
for Sri Lanka; 36.4%
0%
25%
50%
75%
100%
125%
150%
1 2 3 4 5 6 7 8 9 10
National household income decile
Exp
endi
ture
on
food
& d
rink
as
% o
f inc
ome
Table 6.9: Average monthly household income and expenditure by national household expenditure decile – 2009
Decile group
Expenditure range Total income Expenditure on Food & Drink Expenditure on non food
(Rs.) (Rs.) (Rs.) as a % of income (Rs.) as a % of income
All Groups 35495 12918 36.4 19529 55.0
1 Less than 11388 11369 5474 48.1 2969 26.1 2 11388 - 15014 16694 7935 47.5 5424 32.5 3 15015 - 18150 19757 9650 48.8 6876 34.8 4 18151 - 21462 21926 10781 49.2 8963 40.9 5 21464 - 24860 24059 12651 52.6 10483 43.6 6 24861 - 28631 29458 13824 46.9 12898 43.8 7 28632 - 33602 36607 14620 39.9 16352 44.7 8 33603 - 41176 46242 16036 34.7 21189 45.8 9 41176 - 56261 55433 17383 31.4 30532 55.1 10 More than 56262 93477 20842 22.3 79647 85.2
According to table 6.9 and figure 6.5 below, it is clear that when the household’s expenditure increases then the share of expenditure out of the household income
for non food items also increases. But the relevant share for food and drink remains same up to fifth expenditure decile and beyond that it starts to decrease.
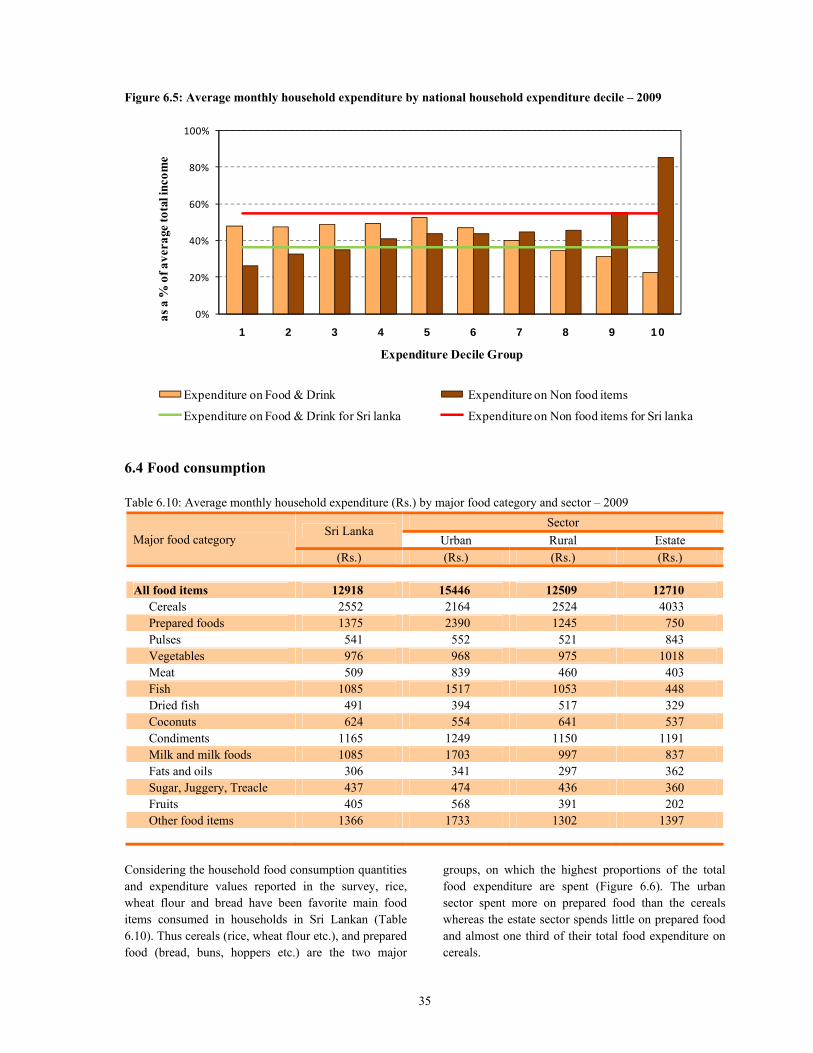
35
Figure 6.5: Average monthly household expenditure by national household expenditure decile – 2009
0%
20%
40%
60%
80%
100%
1 2 3 4 5 6 7 8 9 10
as a
% o
f ave
rage
tota
l inc
ome
Expenditure Decile Group
Expenditure on Food & Drink Expenditure on Non food items
Expenditure on Food & Drink for Sri lanka Expenditure on Non food items for Sri lanka
6.4 Food consumption Table 6.10: Average monthly household expenditure (Rs.) by major food category and sector – 2009
Major food category Sri Lanka
Sector Urban Rural Estate
(Rs.) (Rs.) (Rs.) (Rs.)
All food items 12918 15446 12509 12710 Cereals 2552 2164 2524 4033 Prepared foods 1375 2390 1245 750 Pulses 541 552 521 843 Vegetables 976 968 975 1018 Meat 509 839 460 403 Fish 1085 1517 1053 448 Dried fish 491 394 517 329 Coconuts 624 554 641 537 Condiments 1165 1249 1150 1191 Milk and milk foods 1085 1703 997 837 Fats and oils 306 341 297 362 Sugar, Juggery, Treacle 437 474 436 360 Fruits 405 568 391 202 Other food items 1366 1733 1302 1397
Considering the household food consumption quantities and expenditure values reported in the survey, rice, wheat flour and bread have been favorite main food items consumed in households in Sri Lankan (Table 6.10). Thus cereals (rice, wheat flour etc.), and prepared food (bread, buns, hoppers etc.) are the two major
groups, on which the highest proportions of the total food expenditure are spent (Figure 6.6). The urban sector spent more on prepared food than the cereals whereas the estate sector spends little on prepared food and almost one third of their total food expenditure on cereals.
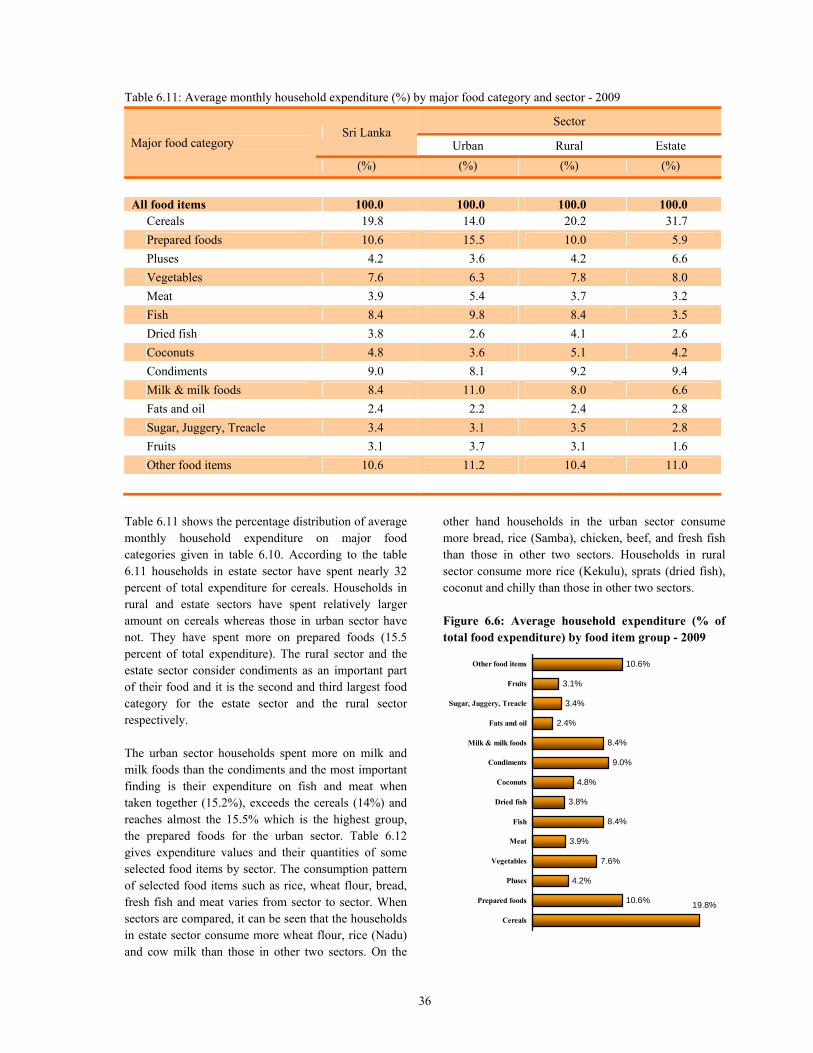
36
Table 6.11: Average monthly household expenditure (%) by major food category and sector - 2009
Major food category Sri Lanka
Sector
Urban Rural Estate (%) (%) (%) (%)
All food items 100.0 100.0 100.0 100.0
Cereals 19.8 14.0 20.2 31.7 Prepared foods 10.6 15.5 10.0 5.9 Pluses 4.2 3.6 4.2 6.6 Vegetables 7.6 6.3 7.8 8.0 Meat 3.9 5.4 3.7 3.2 Fish 8.4 9.8 8.4 3.5 Dried fish 3.8 2.6 4.1 2.6 Coconuts 4.8 3.6 5.1 4.2 Condiments 9.0 8.1 9.2 9.4 Milk & milk foods 8.4 11.0 8.0 6.6 Fats and oil 2.4 2.2 2.4 2.8 Sugar, Juggery, Treacle 3.4 3.1 3.5 2.8 Fruits 3.1 3.7 3.1 1.6 Other food items 10.6 11.2 10.4 11.0
Table 6.11 shows the percentage distribution of average monthly household expenditure on major food categories given in table 6.10. According to the table 6.11 households in estate sector have spent nearly 32 percent of total expenditure for cereals. Households in rural and estate sectors have spent relatively larger amount on cereals whereas those in urban sector have not. They have spent more on prepared foods (15.5 percent of total expenditure). The rural sector and the estate sector consider condiments as an important part of their food and it is the second and third largest food category for the estate sector and the rural sector respectively. The urban sector households spent more on milk and milk foods than the condiments and the most important finding is their expenditure on fish and meat when taken together (15.2%), exceeds the cereals (14%) and reaches almost the 15.5% which is the highest group, the prepared foods for the urban sector. Table 6.12 gives expenditure values and their quantities of some selected food items by sector. The consumption pattern of selected food items such as rice, wheat flour, bread, fresh fish and meat varies from sector to sector. When sectors are compared, it can be seen that the households in estate sector consume more wheat flour, rice (Nadu) and cow milk than those in other two sectors. On the
other hand households in the urban sector consume more bread, rice (Samba), chicken, beef, and fresh fish than those in other two sectors. Households in rural sector consume more rice (Kekulu), sprats (dried fish), coconut and chilly than those in other two sectors. Figure 6.6: Average household expenditure (% of total food expenditure) by food item group - 2009
19.8%10.6%
4.2%
7.6%
3.9%
8.4%
3.8%
4.8%
9.0%
8.4%
2.4%
3.4%
3.1%
10.6%
Cereals
Prepared foods
Pluses
Vegetables
Meat
Fish
Dried fish
Coconuts
Condiments
Milk & milk foods
Fats and oil
Sugar, Juggery, Treacle
Fruits
Other food items
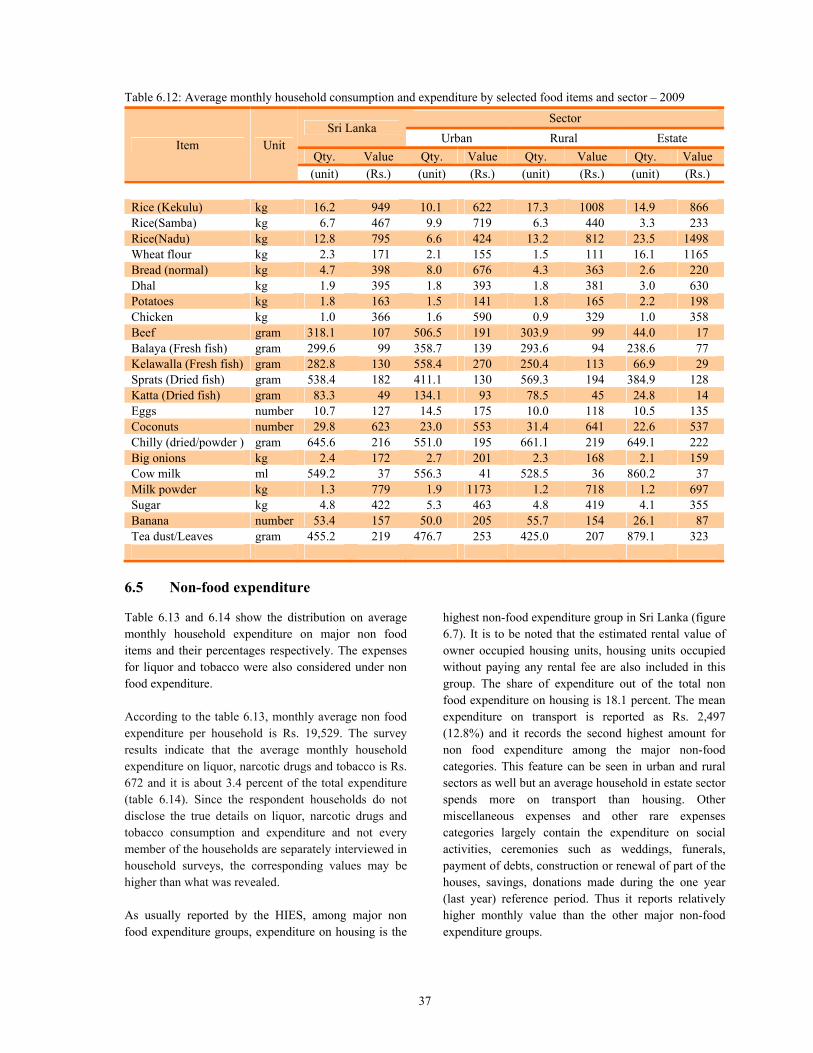
37
Table 6.12: Average monthly household consumption and expenditure by selected food items and sector – 2009
Item Unit Sri Lanka
Sector Urban Rural Estate
Qty. Value Qty. Value Qty. Value Qty. Value (unit) (Rs.) (unit) (Rs.) (unit) (Rs.) (unit) (Rs.)
Rice (Kekulu) kg 16.2 949 10.1 622 17.3 1008 14.9 866 Rice(Samba) kg 6.7 467 9.9 719 6.3 440 3.3 233 Rice(Nadu) kg 12.8 795 6.6 424 13.2 812 23.5 1498 Wheat flour kg 2.3 171 2.1 155 1.5 111 16.1 1165 Bread (normal) kg 4.7 398 8.0 676 4.3 363 2.6 220 Dhal kg 1.9 395 1.8 393 1.8 381 3.0 630 Potatoes kg 1.8 163 1.5 141 1.8 165 2.2 198 Chicken kg 1.0 366 1.6 590 0.9 329 1.0 358 Beef gram 318.1 107 506.5 191 303.9 99 44.0 17 Balaya (Fresh fish) gram 299.6 99 358.7 139 293.6 94 238.6 77 Kelawalla (Fresh fish) gram 282.8 130 558.4 270 250.4 113 66.9 29 Sprats (Dried fish) gram 538.4 182 411.1 130 569.3 194 384.9 128 Katta (Dried fish) gram 83.3 49 134.1 93 78.5 45 24.8 14 Eggs number 10.7 127 14.5 175 10.0 118 10.5 135 Coconuts number 29.8 623 23.0 553 31.4 641 22.6 537 Chilly (dried/powder ) gram 645.6 216 551.0 195 661.1 219 649.1 222 Big onions kg 2.4 172 2.7 201 2.3 168 2.1 159 Cow milk ml 549.2 37 556.3 41 528.5 36 860.2 37 Milk powder kg 1.3 779 1.9 1173 1.2 718 1.2 697 Sugar kg 4.8 422 5.3 463 4.8 419 4.1 355 Banana number 53.4 157 50.0 205 55.7 154 26.1 87 Tea dust/Leaves gram 455.2 219 476.7 253 425.0 207 879.1 323
6.5 Non-food expenditure Table 6.13 and 6.14 show the distribution on average monthly household expenditure on major non food items and their percentages respectively. The expenses for liquor and tobacco were also considered under non food expenditure. According to the table 6.13, monthly average non food expenditure per household is Rs. 19,529. The survey results indicate that the average monthly household expenditure on liquor, narcotic drugs and tobacco is Rs. 672 and it is about 3.4 percent of the total expenditure (table 6.14). Since the respondent households do not disclose the true details on liquor, narcotic drugs and tobacco consumption and expenditure and not every member of the households are separately interviewed in household surveys, the corresponding values may be higher than what was revealed. As usually reported by the HIES, among major non food expenditure groups, expenditure on housing is the
highest non-food expenditure group in Sri Lanka (figure 6.7). It is to be noted that the estimated rental value of owner occupied housing units, housing units occupied without paying any rental fee are also included in this group. The share of expenditure out of the total non food expenditure on housing is 18.1 percent. The mean expenditure on transport is reported as Rs. 2,497 (12.8%) and it records the second highest amount for non food expenditure among the major non-food categories. This feature can be seen in urban and rural sectors as well but an average household in estate sector spends more on transport than housing. Other miscellaneous expenses and other rare expenses categories largely contain the expenditure on social activities, ceremonies such as weddings, funerals, payment of debts, construction or renewal of part of the houses, savings, donations made during the one year (last year) reference period. Thus it reports relatively higher monthly value than the other major non-food expenditure groups.
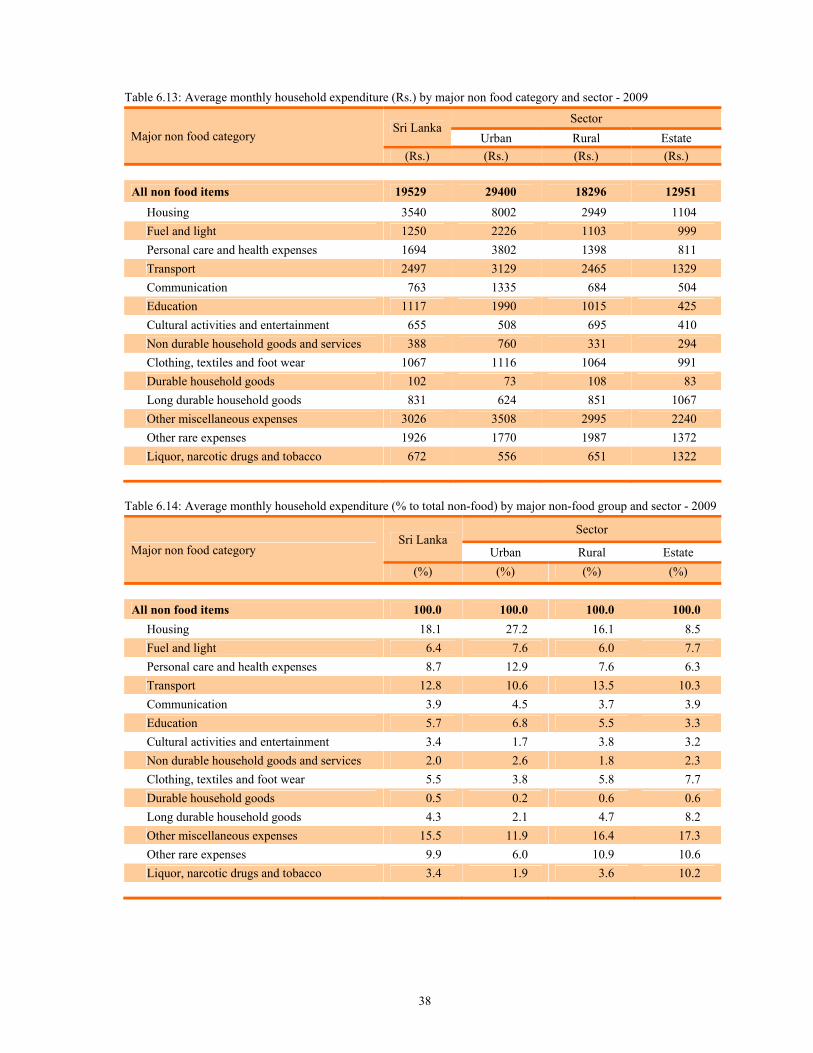
38
Table 6.13: Average monthly household expenditure (Rs.) by major non food category and sector - 2009
Major non food category Sri Lanka
Sector Urban Rural Estate
(Rs.) (Rs.) (Rs.) (Rs.)
All non food items 19529 29400 18296 12951 Housing 3540 8002 2949 1104 Fuel and light 1250 2226 1103 999 Personal care and health expenses 1694 3802 1398 811 Transport 2497 3129 2465 1329 Communication 763 1335 684 504 Education 1117 1990 1015 425 Cultural activities and entertainment 655 508 695 410 Non durable household goods and services 388 760 331 294 Clothing, textiles and foot wear 1067 1116 1064 991 Durable household goods 102 73 108 83 Long durable household goods 831 624 851 1067 Other miscellaneous expenses 3026 3508 2995 2240 Other rare expenses 1926 1770 1987 1372 Liquor, narcotic drugs and tobacco 672 556 651 1322
Table 6.14: Average monthly household expenditure (% to total non-food) by major non-food group and sector - 2009
Major non food category Sri Lanka
Sector
Urban Rural Estate (%) (%) (%) (%)
All non food items 100.0 100.0 100.0 100.0
Housing 18.1 27.2 16.1 8.5 Fuel and light 6.4 7.6 6.0 7.7 Personal care and health expenses 8.7 12.9 7.6 6.3 Transport 12.8 10.6 13.5 10.3 Communication 3.9 4.5 3.7 3.9 Education 5.7 6.8 5.5 3.3 Cultural activities and entertainment 3.4 1.7 3.8 3.2 Non durable household goods and services 2.0 2.6 1.8 2.3 Clothing, textiles and foot wear 5.5 3.8 5.8 7.7 Durable household goods 0.5 0.2 0.6 0.6 Long durable household goods 4.3 2.1 4.7 8.2 Other miscellaneous expenses 15.5 11.9 16.4 17.3 Other rare expenses 9.9 6.0 10.9 10.6 Liquor, narcotic drugs and tobacco 3.4 1.9 3.6 10.2
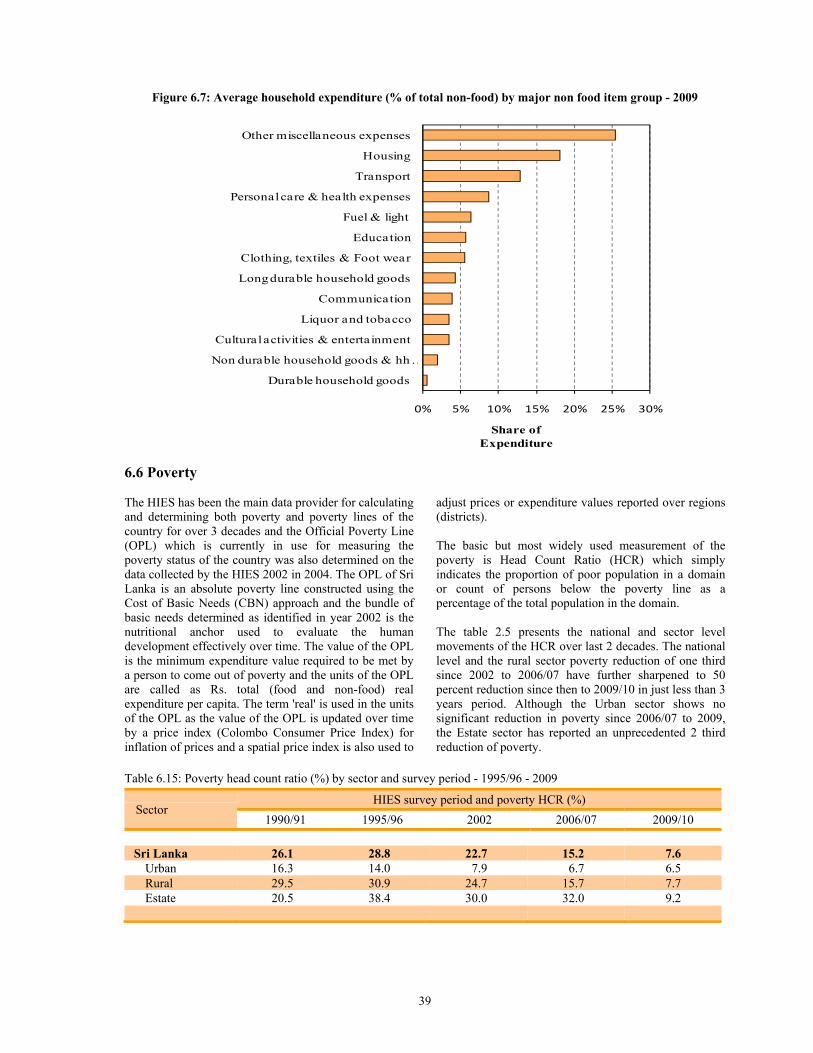
39
Figure 6.7: Average household expenditure (% of total non-food) by major non food item group - 2009
0% 5% 10% 15% 20% 25% 30%
Durable household goods
Non durable household goods & hh …
Cultural activities & entertainment
Liquor and tobacco
Communication
Long durable household goods
Clothing, textiles & Foot wear
Education
Fuel & light
Personal care & health expenses
Transport
Housing
Other miscellaneous expenses
Share of Expenditure
6.6 Poverty The HIES has been the main data provider for calculating and determining both poverty and poverty lines of the country for over 3 decades and the Official Poverty Line (OPL) which is currently in use for measuring the poverty status of the country was also determined on the data collected by the HIES 2002 in 2004. The OPL of Sri Lanka is an absolute poverty line constructed using the Cost of Basic Needs (CBN) approach and the bundle of basic needs determined as identified in year 2002 is the nutritional anchor used to evaluate the human development effectively over time. The value of the OPL is the minimum expenditure value required to be met by a person to come out of poverty and the units of the OPL are called as Rs. total (food and non-food) real expenditure per capita. The term 'real' is used in the units of the OPL as the value of the OPL is updated over time by a price index (Colombo Consumer Price Index) for inflation of prices and a spatial price index is also used to
adjust prices or expenditure values reported over regions (districts). The basic but most widely used measurement of the poverty is Head Count Ratio (HCR) which simply indicates the proportion of poor population in a domain or count of persons below the poverty line as a percentage of the total population in the domain. The table 2.5 presents the national and sector level movements of the HCR over last 2 decades. The national level and the rural sector poverty reduction of one third since 2002 to 2006/07 have further sharpened to 50 percent reduction since then to 2009/10 in just less than 3 years period. Although the Urban sector shows no significant reduction in poverty since 2006/07 to 2009, the Estate sector has reported an unprecedented 2 third reduction of poverty.
Table 6.15: Poverty head count ratio (%) by sector and survey period - 1995/96 - 2009
Sector HIES survey period and poverty HCR (%)
1990/91 1995/96 2002 2006/07 2009/10
Sri Lanka 26.1 28.8 22.7 15.2 7.6 Urban 16.3 14.0 7.9 6.7 6.5 Rural 29.5 30.9 24.7 15.7 7.7 Estate 20.5 38.4 30.0 32.0 9.2
40
Household income and expenditure survey collects comprehensive housing information of all occupied households which were selected in the sample for the survey throughout the country since HIES 2006/07. The HIES 2009/10 excludes Jaffna, Mannar, Kilinochchi and Mulaithive districts in the Northern province and according to this latest survey results, the estimated total number of households in Sri Lanka excluding the above 4 district was 4.9 million in 2009. 7.1 Housing unit structure There are 6 types of housing unit structures as identified and defined by the HIES. The six basic types are single houses, flats, attached or annexed, line rooms or row houses, slums or shanties and others that does not explained by any the first 5 types as shown in Figure 7.1. Table 7.1 indicates the percentage distribution of households by the type of the structure of the housing unit and sector. With respect to the table nearly 89 percent of the households in Sri Lanka live in a single
housing unit and percentage of slums or shanties are less than 1 percent. At sector level, 56 percent of the households in the estate sector live in line rooms or row houses and 11 percent of the urban households live in flats. Figure 7.1 Basic structure types of housing units
Table 7.1: Percentage distribution of households by type of structure and sector - 2009
Type of structure
Sector Total Single housing unit Flat Attached
house/Annex
Line rooms or row houses
Slums/ Shanties and
others
(%) (%) (%) (%) (%) (%)
Sri Lanka 100 89.2 2.8 3.1 4.1 0.8 Urban 100 71.7 10.9 11.3 4.8 1.4 Rural 100 95.6 1.6 1.4 0.7 0.7 Estate 100 33.4 0.4 8.8 56.1 1.3
7.2 Availability of bed rooms Table 7.2 shows the percentages of households by number of bed rooms (rooms used mostly for sleeping purposes) and sector. The table shows that 1.6 percent or nearly 78,000 households do not have any separate room as bed rooms and 21.4 percent of the households possess only 1 bedroom in Sri Lanka. However, 77 percent of the households in Sri Lanka own 2 or more number of bedrooms for their use in the unit.
When the sectors are compared for this statistic, in the estate sector, more than one half (50.7%) of the households live in units made with less than 2 bed rooms whereas in the rural sector which reports the best figures in this regard, nearly 80 percent of the households have 2 or more number of bed rooms and high majority of them (47 percent of all) has the luxury of 3 or more number of bed rooms.
7. Housing Characteristics
Single house
Attached/Annexed
Row houses/Line rooms
Flats
Slums/Shanties Other
41
Table 7.2: Percentage distribution of households by number of bed rooms the occupy and sector - 2009
Number of bed rooms
Sector Total No rooms 1 room 2 rooms 3 rooms 4 rooms 5 and more rooms
(%) (%) (%) (%) (%) (%) (%)
Sri Lanka 100 1.6 21.4 33.5 29.2 11.2 3.2
Urban 100 2.2 27.6 37.0 20.2 10.5 2.5 Rural 100 1.3 18.8 32.8 31.9 11.8 3.4 Estate 100 4.6 46.1 34.2 9.5 4.4 1.1
8.3 Floor area The proportion of households occupying housing units with floor area more than or equal to 500 square feet in Sri Lanka is 63.5 percent and therefore almost one out of every 3 households live in units with floor area less than 500 square feet. Urban and rural sectors show no big disparity in their size of the housing units and
therefore the statistics stands close to the national figures. But the estate sector housing conditions are far behind that and still 3 estate households in every 4 (77.5%), live in units less than the floor area size of 500 square feet.
Table 7.3 Percentage distribution of households by size of the floor area and sector - 2009
Floor area (square foots)
Sector Total Less than 100 100 - 250 250 - 500 500 - 750 750 and above
(%) (%) (%) (%) (%) (%) Sri Lanka 100 5.1 13.6 17.8 23.8 39.7 Urban 100 5.3 12.9 17.9 20.4 43.5 Rural 100 5.2 12.1 16.7 25.1 40.9 Estate 100 2.3 40.0 35.2 13.2 9.2
7.4 Principal materials of wall, floor and roof Based on the materials used for the construction, walls, floor and roof of the housing units are divided into the basic two types i.e. permanent and semi permanent to ease the understanding of the housing conditions of the country.
1. Permanent materials of construction Walls - Bricks, Cabok, Cement blocks,
Pressed soil blocks etc. Floor - Cement, Terrazzo, Tile, Granite etc. Roof - Tile, Asbestos, Concrete 2. Semi permanent materials of construction
Wall - Mud, Planks, Metal sheets, Cadjan, Palmyrah etc.
Floor - Mud and similar basic floors Roof - Metal sheets, Cadjan, Palmyrah etc.
Table 7.4 shows the percentages of households, compiled according to the above categorizations and displays no big disparity among the sectors in regards to the conditions of the Walls and Floors of the housing units. However more of the estate sector households (67.5%) have stated that the units they live are roofed with metal sheets which according to the above segregation, falls in to the category of semi permanent and stays way behind the other sectors that reported less than 12 percent of the roofs of the households are made with semi permanent materials. However, the use of Metal sheets for the roofs as used in the most urban sector shanties is not always considered as an indicator of living in a unit constructed with semi permanent materials mainly in the hilly areas of the country where the metal sheets being the most common roofing arrangement.
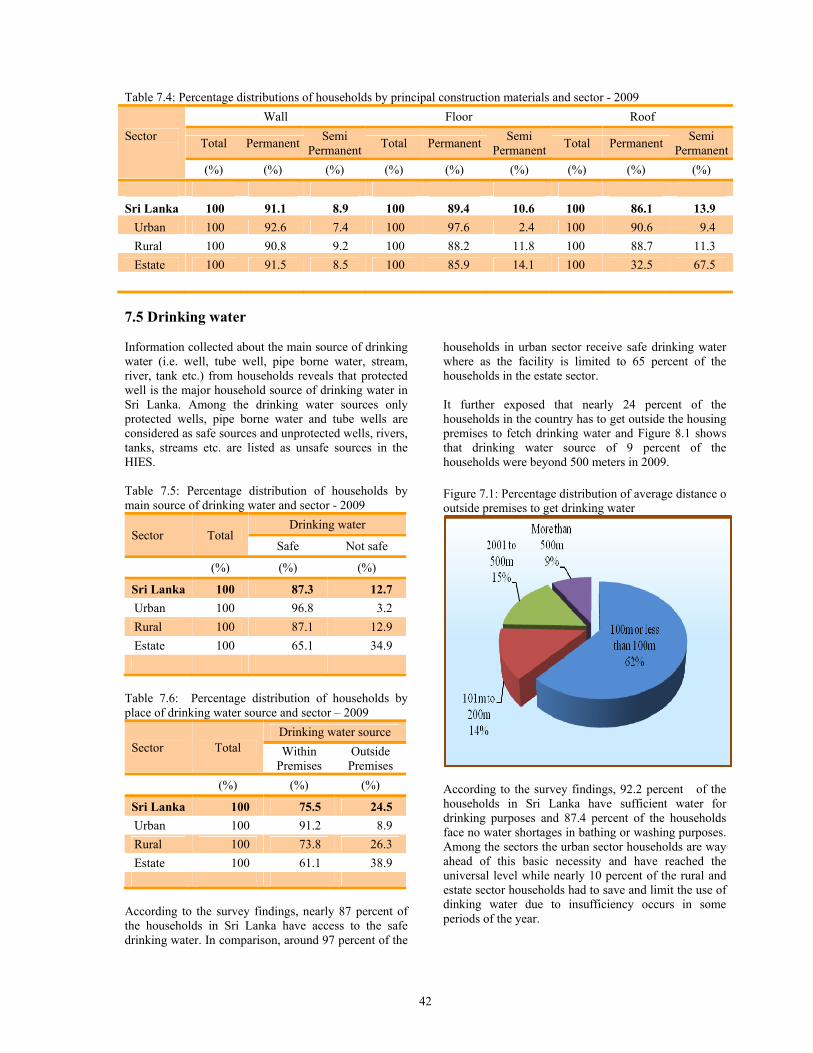
42
Table 7.4: Percentage distributions of households by principal construction materials and sector - 2009
Sector
Wall Floor Roof
Total Permanent Semi Permanent Total Permanent Semi
Permanent Total Permanent Semi Permanent
(%) (%) (%) (%) (%) (%) (%) (%) (%) Sri Lanka 100 91.1 8.9 100 89.4 10.6 100 86.1 13.9
Urban 100 92.6 7.4 100 97.6 2.4 100 90.6 9.4 Rural 100 90.8 9.2 100 88.2 11.8 100 88.7 11.3 Estate 100 91.5 8.5 100 85.9 14.1 100 32.5 67.5
7.5 Drinking water Information collected about the main source of drinking water (i.e. well, tube well, pipe borne water, stream, river, tank etc.) from households reveals that protected well is the major household source of drinking water in Sri Lanka. Among the drinking water sources only protected wells, pipe borne water and tube wells are considered as safe sources and unprotected wells, rivers, tanks, streams etc. are listed as unsafe sources in the HIES. Table 7.5: Percentage distribution of households by main source of drinking water and sector - 2009
Sector Total Drinking water
Safe Not safe
(%) (%) (%)
Sri Lanka 100 87.3 12.7 Urban 100 96.8 3.2 Rural 100 87.1 12.9 Estate 100 65.1 34.9
Table 7.6: Percentage distribution of households by place of drinking water source and sector – 2009
Sector Total Drinking water source Within
Premises Outside Premises
(%) (%) (%)
Sri Lanka 100 75.5 24.5 Urban 100 91.2 8.9 Rural 100 73.8 26.3 Estate 100 61.1 38.9
According to the survey findings, nearly 87 percent of the households in Sri Lanka have access to the safe drinking water. In comparison, around 97 percent of the
households in urban sector receive safe drinking water where as the facility is limited to 65 percent of the households in the estate sector. It further exposed that nearly 24 percent of the households in the country has to get outside the housing premises to fetch drinking water and Figure 8.1 shows that drinking water source of 9 percent of the households were beyond 500 meters in 2009. Figure 7.1: Percentage distribution of average distance o outside premises to get drinking water
According to the survey findings, 92.2 percent of the households in Sri Lanka have sufficient water for drinking purposes and 87.4 percent of the households face no water shortages in bathing or washing purposes. Among the sectors the urban sector households are way ahead of this basic necessity and have reached the universal level while nearly 10 percent of the rural and estate sector households had to save and limit the use of dinking water due to insufficiency occurs in some periods of the year.
43
Table 7.7: Percentage distribution of households by sufficiency of water and sector - 2009 For drinking Bathing/Washing
Sector Total Sufficient Not sufficient Total Sufficient not sufficient
(%) (%) (%) (%) (%) (%)
Sri Lanka 100 92.7 7.3 100 87.4 12.6 Urban 100 98.9 1.1 100 97.3 2.6 Rural 100 91.8 8.1 100 85.6 14.3Estate 100 89.7 10.3 100 88.3 11.7
7.6 Toilet facilities Survey reveals that nearly 89 percent of the households at national level has their own toilet and about 8 percent of the households share with another household or uses a public facility. The survey also exposed, the worse
scenario, that 3.2 percent of the households, mainly the rural households did not have access to any toilet in 2009 and 12.1 percent of the estate sector households used public facilities.
Table 7.8: Percentage distribution of households by availability of toilet and by sector - 2009
Toilet facilities
Sector total Exclusive for the household
Sharing with another
household
Public convenience
No toilet facilities
(%) (%) (%) (%) (%)
Sri Lanka 100 89.0 6.0 1.8 3.2 Urban 100 85.1 7.7 6.8 0.4 Rural 100 90.3 5.6 0.3 3.7 Estate 100 77.5 8.6 12.1 1.8
7.7 Disposal of garbage Disposal of garbage is a severe problem for most of the urban sector like households in Sri Lanka as the facility of public garbage collection is mostly limited to the urban sector. Considerable differences exhibited in ways of disposing garbage collected in households between the sectors. In urban sector, the highest
percentage of households (71 percent) removes their garbage with assistance provided by publicly operated garbage collecting trucks. In comparison, majority of the households in rural sector and the estate sector burn or bury their garbage.
Table 7.9: Percentage distribution of households by disposal of garbage and sector – 2009
Sector
Disposal of garbage
Total Collected
by garbage truck
Buried/burned
Process for fertilizer
Dumped within
premises
Throwing outside
premises Other
(%) (%) (%) (%) (%) (%) (%)
Sri Lanka 100 15.5 54.7 6.8 17.2 4.9 0.9 Urban 100 70.9 16.1 2.6 1.5 6.1 2.8 Rural 100 7.2 62.1 7.2 19.9 3.0 0.7 Estate 100 0.0 38.4 12.8 16.3 32.5 0.0
44
7.8 Lighting Having the electricity as the source of lighting is the ultimate goal of the households and in Sri Lanka every 6 out of 7 households (85 percent) had the facility in 2009, which is 5% increase from 80% reported in 2006/07. Almost all the rest of the households use kerosene as the source of lighting (12.8 percent). When
the sectors are considered, the proportion of households with electricity in urban, rural and estate sector households are 96.5%, 83.2%, and 84% respectively and the estate sector surpassing the rural sector within this development indicator is a major highlight in 2009.
Table 7.10: Percentage distribution of households by principal type of lighting and sector - 2009 Lighting
Sector Total Electricity Kerosene Solar power
(%) (%) (%) (%) Sri Lanka 100 85.1 12.8 2.1
Urban 100 96.5 3.5 0.0 Rural 100 83.2 14.2 2.6 Estate 100 84.0 15.5 0.4
7.9 Cooking fuel Table 7.10 shows that majority of the households in Sri Lanka has used firewood as their cooking fuel (80.7 percent). L.P. gas was used by 15.8% households and only 3.5 percent used Kerosene and other types of fuels. It is obvious that most urban sector households used L.P. gas as the main type of cooking fuel (48.8 percent). Firewood is commonly and highly used as cooking fuel in both rural sector and estate sector households and the firewood use is 96.5 percent in the estate sector.
Table 7.11: Percentage distribution of households by principal type of cooking fuel and sector - 2009
Sector
Cooking fuel
Total Firewood LP Gas Kerosene and other
(%) (%) (%) (%)
Sri Lanka 100 80.7 15.8 3.5 Urban 100 36.2 48.8 15.0 Rural 100 87.1 11.2 1.7Estate 100 96.5 2.3 1.3
7.10 Tenure Most of the occupied housing units are owned (constructed, purchased or inherited) by a member of the household (82.2 percent). In Sri Lanka, rented or leased households are reported as 3.9 percent only. In
estates, it is very common to provide line rooms for its workers free of rent and thus most of the households in estate sector live in housing units on rent free basis (56.9 percent).
Table 7.12 Percentage distribution of households by tenure and by sector - 2006
Sector
Tenure
Total Constructed/ Purchased/ Inherited (Own) Rent free Rent/Lease other
(%) (%) (%) (%) (%)
Sri Lanka 100 82.2 5.2 3.9 8.8 Urban 100 73.5 5.6 12.2 8.7 Rural 100 87.6 1.9 2.6 7.8 Estate 100 18.3 56.9 1.6 23.2
45
8. Supplementary Tables
Table 9.1: Food items consumption and expenditure (average monthly per person) – Sri Lanka – 2009
Food item/ Group Unit Quantity(Unit) Value(Rs.)
Total food items Cereals Rice - (Kekulu) grams 4079.56 238.7Rice - (Samba) grams 1680.41 117.57 Rice - (Nadu) grams 3230.21 199.91Rice - (Basmathi) grams 4.79 0.42 Rice flour grams 107.14 9.29 Wheat flour grams 581.40 42.97 Kurakkan flour grams 24.26 2.50 Ulundu flour grams 7.25 1.38 Maize grams 10.77 0.69 Samaposha grams 14.22 3.37 Noodles grams 72.62 12.74 Papadam grams 35.84 9.66 Infants cereal foods / Malt etc. grams 2.06 0.96 Barley grams 0.16 0.04 Sago grams 0.93 0.18Corn flakes grams 0.14 0.10 Other cereals grams 13.36 1.71 Prepared foods (outside) Bread (Normal) grams 1183.72 100.19 Bread (Special) 2.76 Roasted Bread number 0.19 2.12 Buns/ Spunchi number 1.21 20.55 Hoppers number 1.28 9.62 String hoppers number 15.92 27.72 Pittu number 0.26 3.24 Rotti number 0.38 5.20 Thosai/ Itly number 0.29 3.61 Rice (meat and vegetables) number 0.33 35.60Rice (fish and vegetables) number 0.91 73.43 Rice (only vegetables ) number 0.54 34.27Curry (meat) 2.34 Curry (fish) 3.05 Curry (vegetables) 2.62 Other prepared foods 19.65 Pulses Dhal grams 470.16 99.49 Green gram grams 55.34 7.91
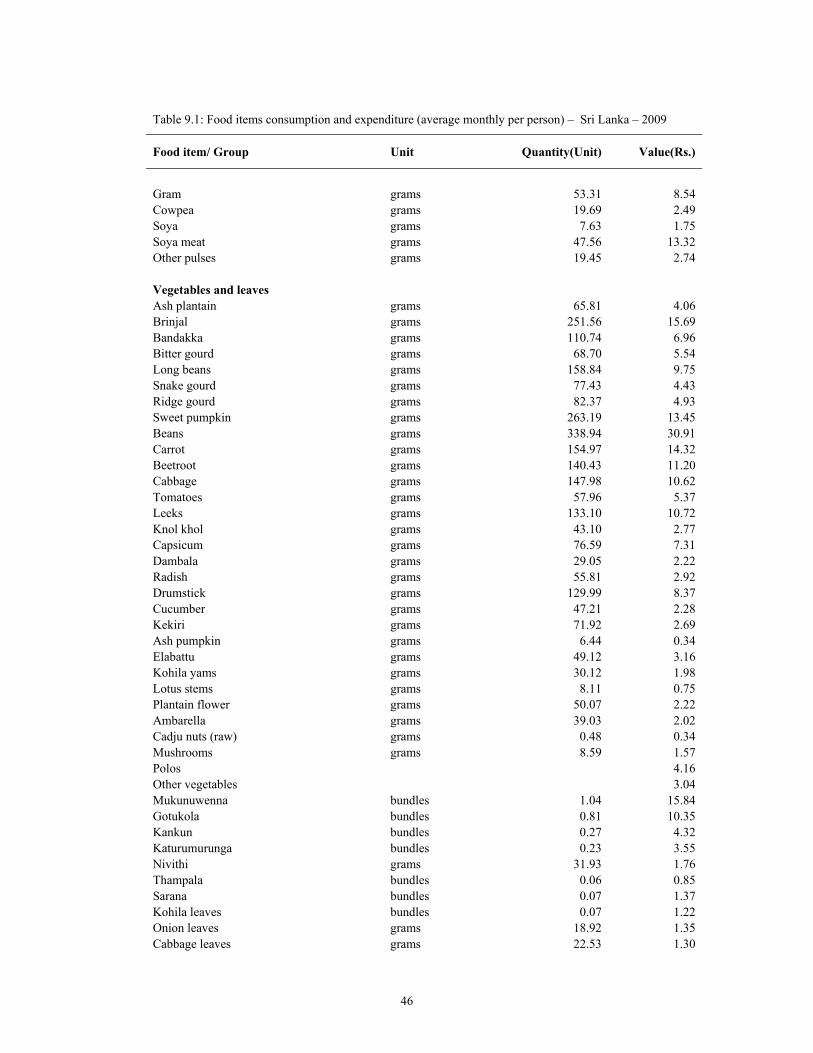
46
Table 9.1: Food items consumption and expenditure (average monthly per person) – Sri Lanka – 2009
Food item/ Group Unit Quantity(Unit) Value(Rs.)
Gram grams 53.31 8.54 Cowpea grams 19.69 2.49 Soya grams 7.63 1.75 Soya meat grams 47.56 13.32 Other pulses grams 19.45 2.74 Vegetables and leaves Ash plantain grams 65.81 4.06Brinjal grams 251.56 15.69 Bandakka grams 110.74 6.96Bitter gourd grams 68.70 5.54 Long beans grams 158.84 9.75 Snake gourd grams 77.43 4.43 Ridge gourd grams 82.37 4.93 Sweet pumpkin grams 263.19 13.45 Beans grams 338.94 30.91 Carrot grams 154.97 14.32 Beetroot grams 140.43 11.20 Cabbage grams 147.98 10.62 Tomatoes grams 57.96 5.37 Leeks grams 133.10 10.72 Knol khol grams 43.10 2.77Capsicum grams 76.59 7.31 Dambala grams 29.05 2.22Radish grams 55.81 2.92 Drumstick grams 129.99 8.37 Cucumber grams 47.21 2.28 Kekiri grams 71.92 2.69 Ash pumpkin grams 6.44 0.34 Elabattu grams 49.12 3.16 Kohila yams grams 30.12 1.98 Lotus stems grams 8.11 0.75 Plantain flower grams 50.07 2.22 Ambarella grams 39.03 2.02Cadju nuts (raw) grams 0.48 0.34 Mushrooms grams 8.59 1.57Polos 4.16 Other vegetables 3.04 Mukunuwenna bundles 1.04 15.84 Gotukola bundles 0.81 10.35 Kankun bundles 0.27 4.32 Katurumurunga bundles 0.23 3.55 Nivithi grams 31.93 1.76 Thampala bundles 0.06 0.85 Sarana bundles 0.07 1.37 Kohila leaves bundles 0.07 1.22 Onion leaves grams 18.92 1.35 Cabbage leaves grams 22.53 1.30
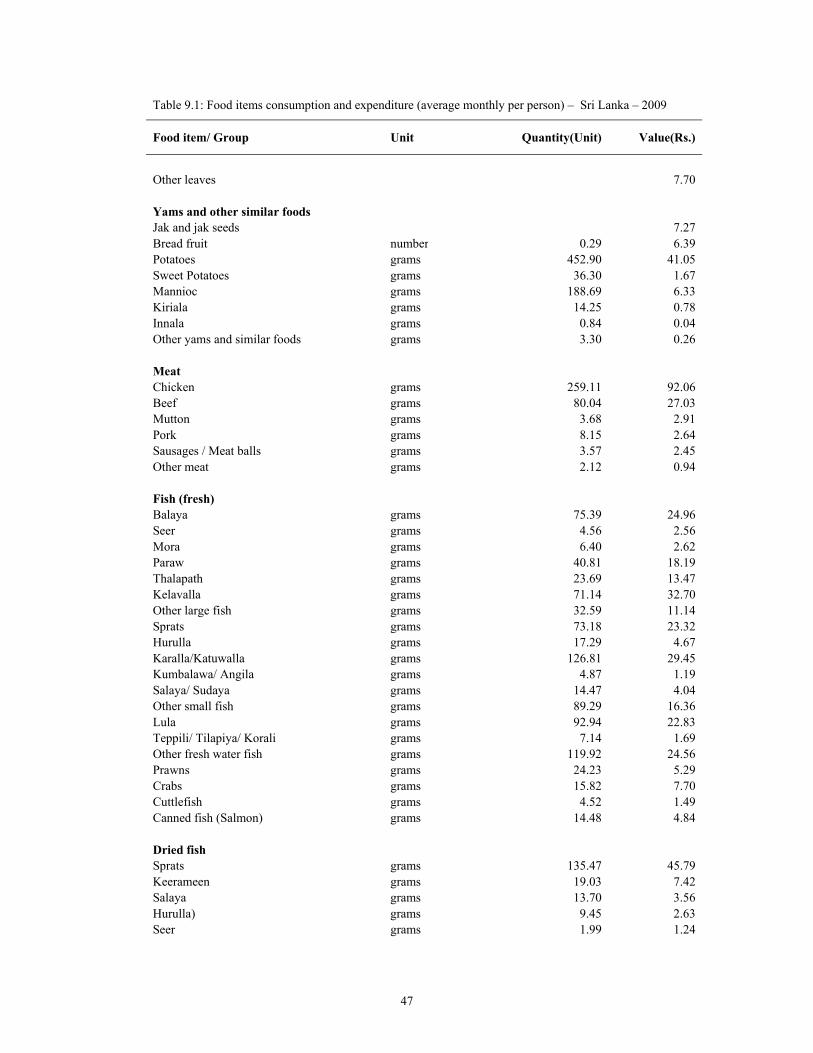
47
Table 9.1: Food items consumption and expenditure (average monthly per person) – Sri Lanka – 2009
Food item/ Group Unit Quantity(Unit) Value(Rs.)
Other leaves 7.70 Yams and other similar foods Jak and jak seeds 7.27 Bread fruit number 0.29 6.39Potatoes grams 452.90 41.05 Sweet Potatoes grams 36.30 1.67Mannioc grams 188.69 6.33 Kiriala grams 14.25 0.78 Innala grams 0.84 0.04 Other yams and similar foods grams 3.30 0.26 Meat Chicken grams 259.11 92.06 Beef grams 80.04 27.03 Mutton grams 3.68 2.91 Pork grams 8.15 2.64 Sausages / Meat balls grams 3.57 2.45 Other meat grams 2.12 0.94 Fish (fresh) Balaya grams 75.39 24.96 Seer grams 4.56 2.56 Mora grams 6.40 2.62 Paraw grams 40.81 18.19 Thalapath grams 23.69 13.47 Kelavalla grams 71.14 32.70 Other large fish grams 32.59 11.14 Sprats grams 73.18 23.32 Hurulla grams 17.29 4.67 Karalla/Katuwalla grams 126.81 29.45 Kumbalawa/ Angila grams 4.87 1.19 Salaya/ Sudaya grams 14.47 4.04Other small fish grams 89.29 16.36 Lula grams 92.94 22.83Teppili/ Tilapiya/ Korali grams 7.14 1.69 Other fresh water fish grams 119.92 24.56 Prawns grams 24.23 5.29 Crabs grams 15.82 7.70 Cuttlefish grams 4.52 1.49 Canned fish (Salmon) grams 14.48 4.84 Dried fish Sprats grams 135.47 45.79 Keerameen grams 19.03 7.42 Salaya grams 13.70 3.56 Hurulla) grams 9.45 2.63Seer grams 1.99 1.24
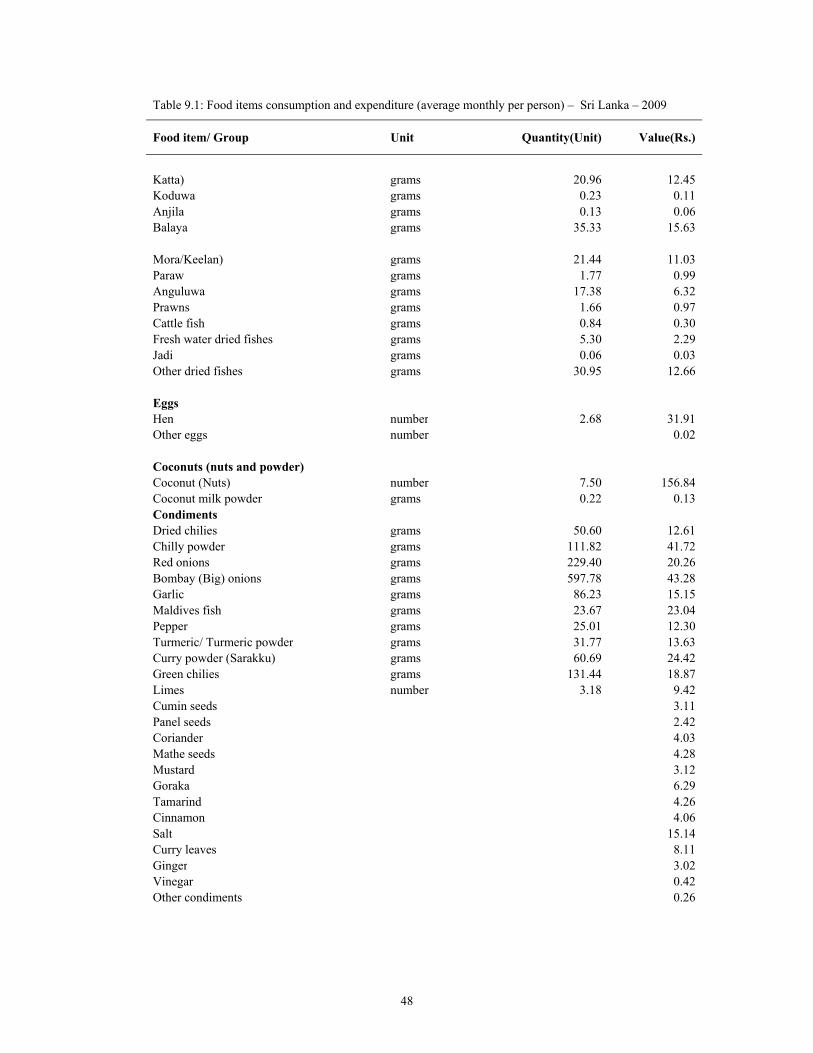
48
Table 9.1: Food items consumption and expenditure (average monthly per person) – Sri Lanka – 2009
Food item/ Group Unit Quantity(Unit) Value(Rs.)
Katta) grams 20.96 12.45 Koduwa grams 0.23 0.11 Anjila grams 0.13 0.06 Balaya grams 35.33 15.63 Mora/Keelan) grams 21.44 11.03 Paraw grams 1.77 0.99Anguluwa grams 17.38 6.32 Prawns grams 1.66 0.97 Cattle fish grams 0.84 0.30 Fresh water dried fishes grams 5.30 2.29 Jadi grams 0.06 0.03 Other dried fishes grams 30.95 12.66 Eggs Hen number 2.68 31.91Other eggs number 0.02 Coconuts (nuts and powder) Coconut (Nuts) number 7.50 156.84 Coconut milk powder grams 0.22 0.13 Condiments Dried chilies grams 50.60 12.61 Chilly powder grams 111.82 41.72 Red onions grams 229.40 20.26 Bombay (Big) onions grams 597.78 43.28 Garlic grams 86.23 15.15 Maldives fish grams 23.67 23.04Pepper grams 25.01 12.30 Turmeric/ Turmeric powder grams 31.77 13.63Curry powder (Sarakku) grams 60.69 24.42 Green chilies grams 131.44 18.87 Limes number 3.18 9.42 Cumin seeds 3.11 Panel seeds 2.42 Coriander 4.03 Mathe seeds 4.28 Mustard 3.12 Goraka 6.29 Tamarind 4.26 Cinnamon 4.06 Salt 15.14Curry leaves 8.11 Ginger 3.02Vinegar 0.42 Other condiments 0.26
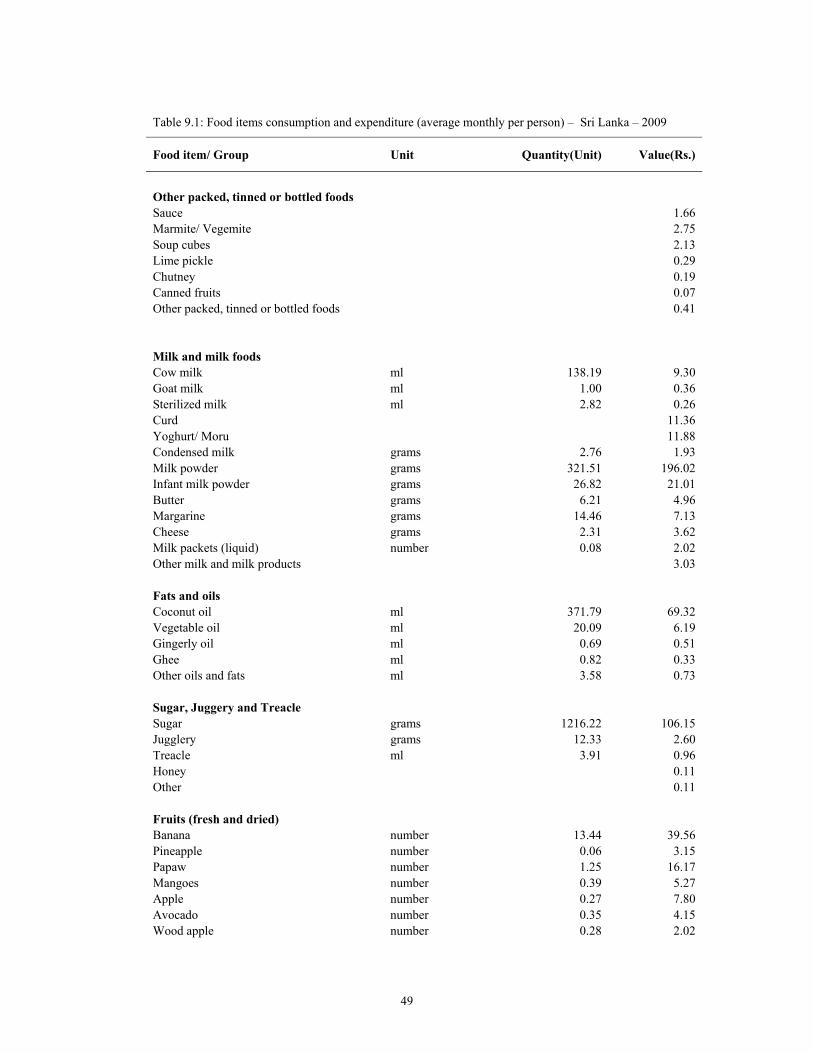
49
Table 9.1: Food items consumption and expenditure (average monthly per person) – Sri Lanka – 2009
Food item/ Group Unit Quantity(Unit) Value(Rs.)
Other packed, tinned or bottled foods Sauce 1.66 Marmite/ Vegemite 2.75 Soup cubes 2.13 Lime pickle 0.29 Chutney 0.19 Canned fruits 0.07 Other packed, tinned or bottled foods 0.41 Milk and milk foods Cow milk ml 138.19 9.30 Goat milk ml 1.00 0.36 Sterilized milk ml 2.82 0.26 Curd 11.36 Yoghurt/ Moru 11.88 Condensed milk grams 2.76 1.93 Milk powder grams 321.51 196.02 Infant milk powder grams 26.82 21.01 Butter grams 6.21 4.96 Margarine grams 14.46 7.13 Cheese grams 2.31 3.62 Milk packets (liquid) number 0.08 2.02 Other milk and milk products 3.03 Fats and oils Coconut oil ml 371.79 69.32 Vegetable oil ml 20.09 6.19 Gingerly oil ml 0.69 0.51 Ghee ml 0.82 0.33 Other oils and fats ml 3.58 0.73 Sugar, Juggery and Treacle Sugar grams 1216.22 106.15 Jugglery grams 12.33 2.60 Treacle ml 3.91 0.96 Honey 0.11 Other 0.11 Fruits (fresh and dried) Banana number 13.44 39.56 Pineapple number 0.06 3.15 Papaw number 1.25 16.17 Mangoes number 0.39 5.27 Apple number 0.27 7.80 Avocado number 0.35 4.15 Wood apple number 0.28 2.02
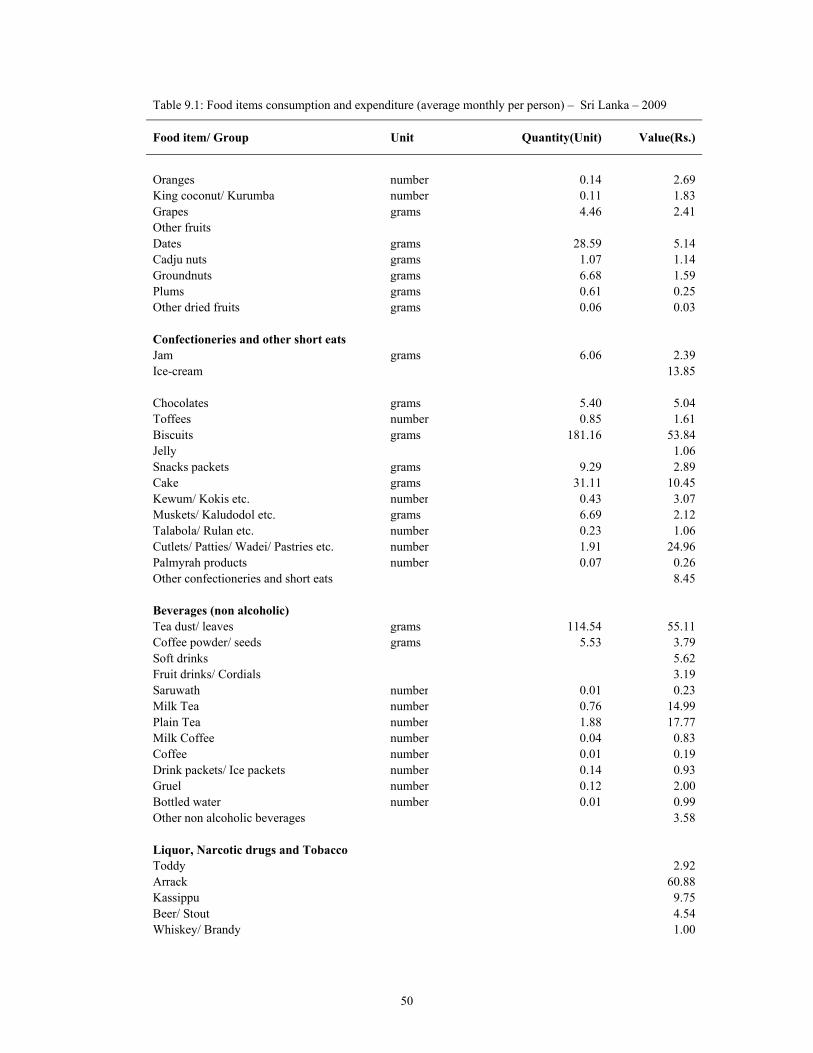
50
Table 9.1: Food items consumption and expenditure (average monthly per person) – Sri Lanka – 2009
Food item/ Group Unit Quantity(Unit) Value(Rs.)
Oranges number 0.14 2.69 King coconut/ Kurumba number 0.11 1.83 Grapes grams 4.46 2.41 Other fruits Dates grams 28.59 5.14Cadju nuts grams 1.07 1.14 Groundnuts grams 6.68 1.59Plums grams 0.61 0.25 Other dried fruits grams 0.06 0.03 Confectioneries and other short eats Jam grams 6.06 2.39 Ice-cream 13.85 Chocolates grams 5.40 5.04 Toffees number 0.85 1.61 Biscuits grams 181.16 53.84 Jelly 1.06 Snacks packets grams 9.29 2.89Cake grams 31.11 10.45 Kewum/ Kokis etc. number 0.43 3.07Muskets/ Kaludodol etc. grams 6.69 2.12 Talabola/ Rulan etc. number 0.23 1.06 Cutlets/ Patties/ Wadei/ Pastries etc. number 1.91 24.96 Palmyrah products number 0.07 0.26 Other confectioneries and short eats 8.45 Beverages (non alcoholic) Tea dust/ leaves grams 114.54 55.11 Coffee powder/ seeds grams 5.53 3.79 Soft drinks 5.62 Fruit drinks/ Cordials 3.19 Saruwath number 0.01 0.23Milk Tea number 0.76 14.99 Plain Tea number 1.88 17.77Milk Coffee number 0.04 0.83 Coffee number 0.01 0.19 Drink packets/ Ice packets number 0.14 0.93 Gruel number 0.12 2.00 Bottled water number 0.01 0.99 Other non alcoholic beverages 3.58 Liquor, Narcotic drugs and Tobacco Toddy 2.92 Arrack 60.88 Kassippu 9.75 Beer/ Stout 4.54Whiskey/ Brandy 1.00
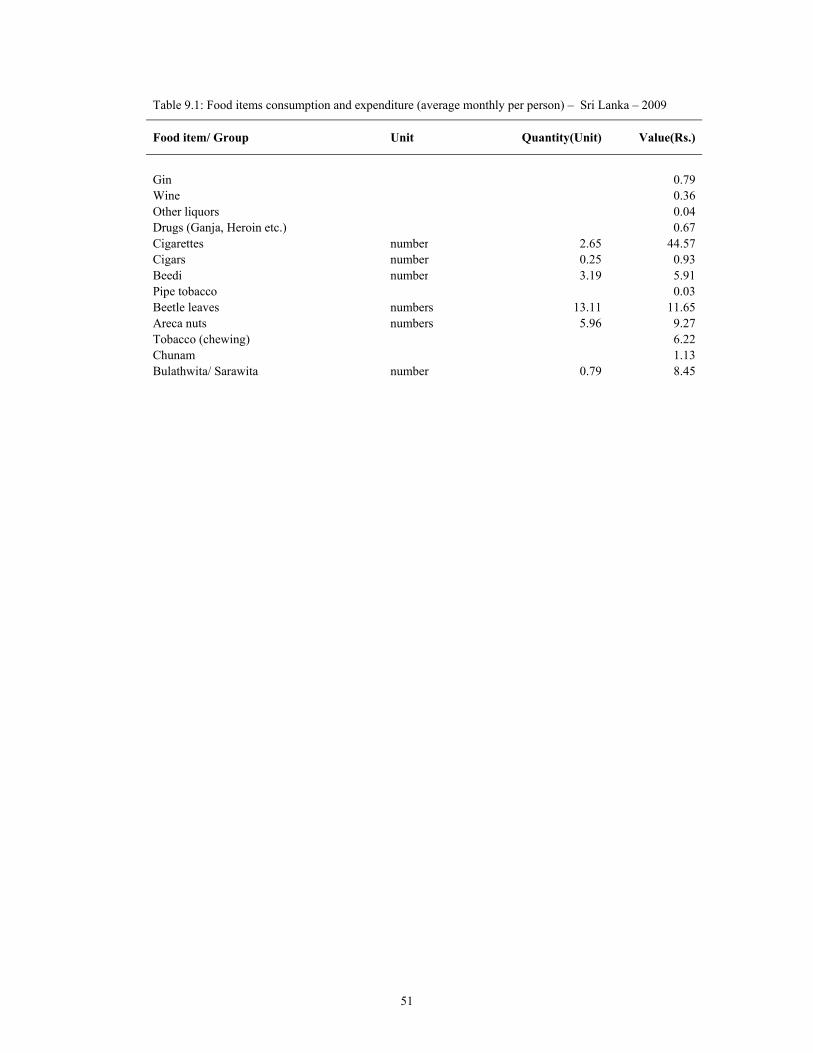
51
Table 9.1: Food items consumption and expenditure (average monthly per person) – Sri Lanka – 2009
Food item/ Group Unit Quantity(Unit) Value(Rs.)
Gin 0.79 Wine 0.36 Other liquors 0.04 Drugs (Ganja, Heroin etc.) 0.67 Cigarettes number 2.65 44.57Cigars number 0.25 0.93 Beedi number 3.19 5.91Pipe tobacco 0.03 Beetle leaves numbers 13.11 11.65 Areca nuts numbers 5.96 9.27 Tobacco (chewing) 6.22 Chunam 1.13 Bulathwita/ Sarawita number 0.79 8.45
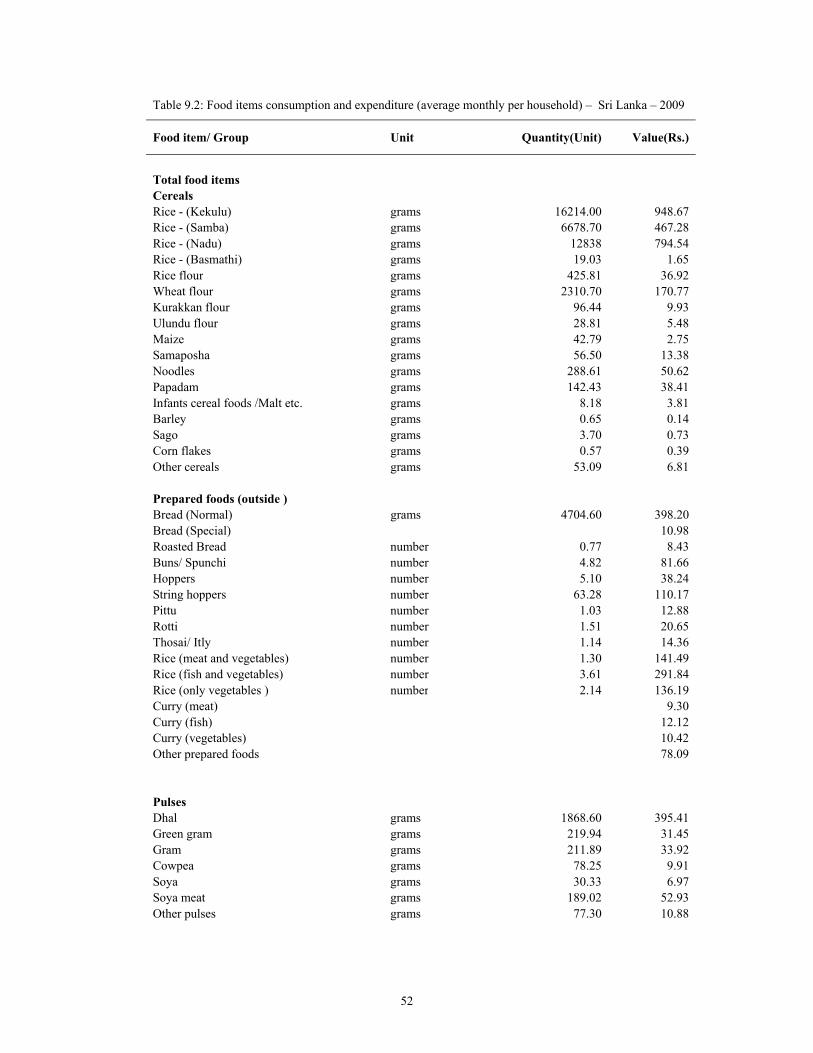
52
Table 9.2: Food items consumption and expenditure (average monthly per household) – Sri Lanka – 2009
Food item/ Group Unit Quantity(Unit) Value(Rs.)
Total food items Cereals Rice - (Kekulu) grams 16214.00 948.67 Rice - (Samba) grams 6678.70 467.28 Rice - (Nadu) grams 12838 794.54Rice - (Basmathi) grams 19.03 1.65 Rice flour grams 425.81 36.92Wheat flour grams 2310.70 170.77 Kurakkan flour grams 96.44 9.93 Ulundu flour grams 28.81 5.48 Maize grams 42.79 2.75 Samaposha grams 56.50 13.38 Noodles grams 288.61 50.62 Papadam grams 142.43 38.41 Infants cereal foods /Malt etc. grams 8.18 3.81 Barley grams 0.65 0.14 Sago grams 3.70 0.73 Corn flakes grams 0.57 0.39 Other cereals grams 53.09 6.81 Prepared foods (outside ) Bread (Normal) grams 4704.60 398.20 Bread (Special) 10.98 Roasted Bread number 0.77 8.43 Buns/ Spunchi number 4.82 81.66 Hoppers number 5.10 38.24 String hoppers number 63.28 110.17 Pittu number 1.03 12.88 Rotti number 1.51 20.65 Thosai/ Itly number 1.14 14.36 Rice (meat and vegetables) number 1.30 141.49 Rice (fish and vegetables) number 3.61 291.84 Rice (only vegetables ) number 2.14 136.19Curry (meat) 9.30 Curry (fish) 12.12Curry (vegetables) 10.42 Other prepared foods 78.09 Pulses Dhal grams 1868.60 395.41 Green gram grams 219.94 31.45 Gram grams 211.89 33.92 Cowpea grams 78.25 9.91 Soya grams 30.33 6.97 Soya meat grams 189.02 52.93 Other pulses grams 77.30 10.88
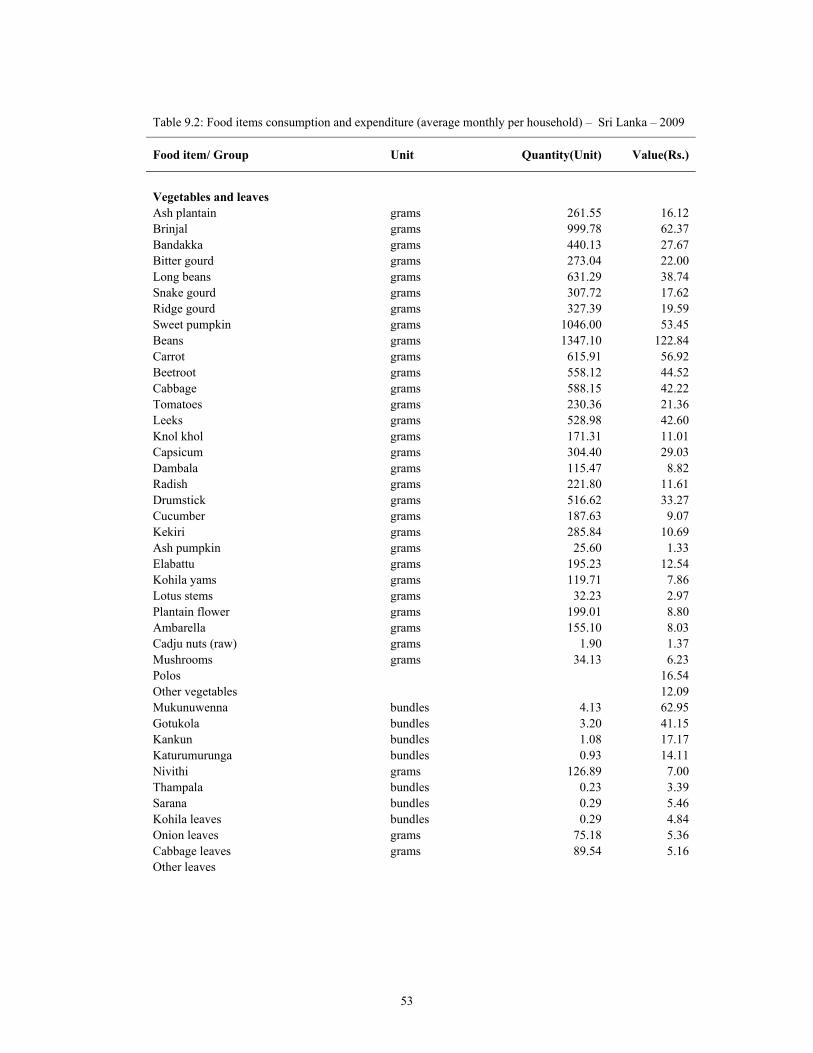
53
Table 9.2: Food items consumption and expenditure (average monthly per household) – Sri Lanka – 2009
Food item/ Group Unit Quantity(Unit) Value(Rs.)
Vegetables and leaves Ash plantain grams 261.55 16.12 Brinjal grams 999.78 62.37 Bandakka grams 440.13 27.67 Bitter gourd grams 273.04 22.00 Long beans grams 631.29 38.74 Snake gourd grams 307.72 17.62 Ridge gourd grams 327.39 19.59 Sweet pumpkin grams 1046.00 53.45 Beans grams 1347.10 122.84 Carrot grams 615.91 56.92 Beetroot grams 558.12 44.52 Cabbage grams 588.15 42.22 Tomatoes grams 230.36 21.36 Leeks grams 528.98 42.60 Knol khol grams 171.31 11.01 Capsicum grams 304.40 29.03 Dambala grams 115.47 8.82 Radish grams 221.80 11.61 Drumstick grams 516.62 33.27 Cucumber grams 187.63 9.07 Kekiri grams 285.84 10.69 Ash pumpkin grams 25.60 1.33 Elabattu grams 195.23 12.54 Kohila yams grams 119.71 7.86 Lotus stems grams 32.23 2.97 Plantain flower grams 199.01 8.80 Ambarella grams 155.10 8.03 Cadju nuts (raw) grams 1.90 1.37 Mushrooms grams 34.13 6.23 Polos 16.54 Other vegetables 12.09 Mukunuwenna bundles 4.13 62.95 Gotukola bundles 3.20 41.15 Kankun bundles 1.08 17.17 Katurumurunga bundles 0.93 14.11 Nivithi grams 126.89 7.00 Thampala bundles 0.23 3.39 Sarana bundles 0.29 5.46 Kohila leaves bundles 0.29 4.84 Onion leaves grams 75.18 5.36 Cabbage leaves grams 89.54 5.16 Other leaves
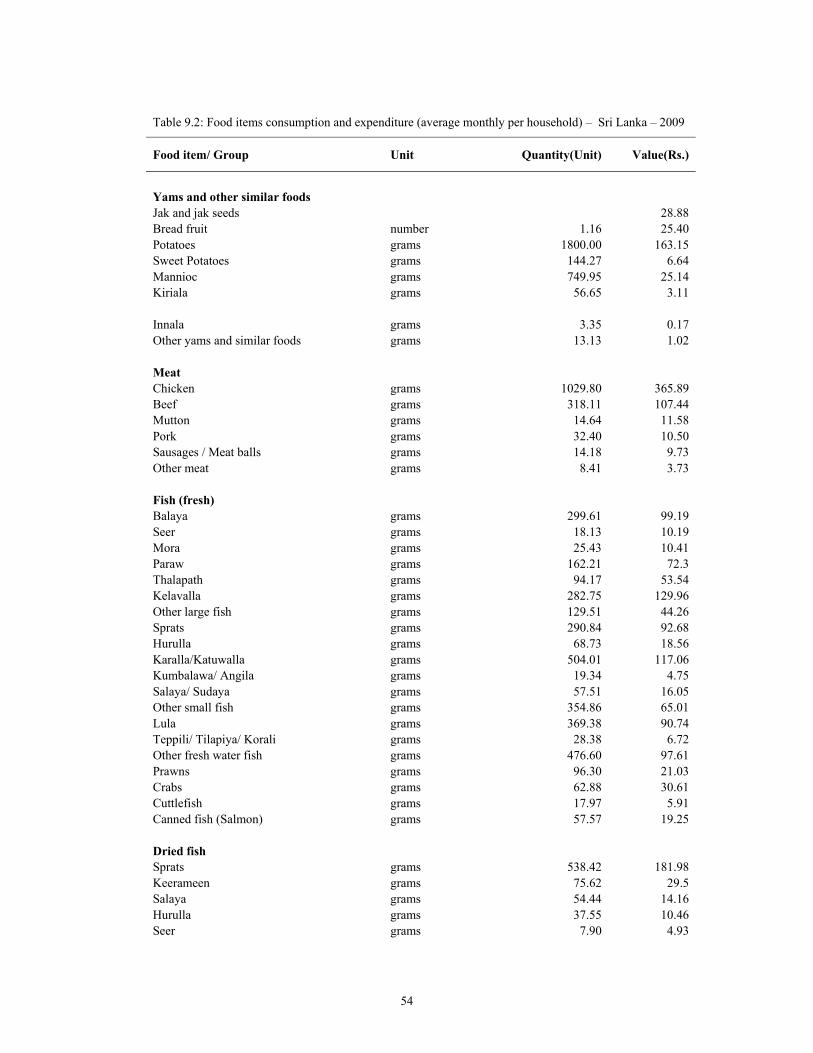
54
Table 9.2: Food items consumption and expenditure (average monthly per household) – Sri Lanka – 2009
Food item/ Group Unit Quantity(Unit) Value(Rs.)
Yams and other similar foods Jak and jak seeds 28.88 Bread fruit number 1.16 25.40 Potatoes grams 1800.00 163.15 Sweet Potatoes grams 144.27 6.64 Mannioc grams 749.95 25.14 Kiriala grams 56.65 3.11 Innala grams 3.35 0.17 Other yams and similar foods grams 13.13 1.02 Meat Chicken grams 1029.80 365.89 Beef grams 318.11 107.44 Mutton grams 14.64 11.58 Pork grams 32.40 10.50 Sausages / Meat balls grams 14.18 9.73 Other meat grams 8.41 3.73 Fish (fresh) Balaya grams 299.61 99.19 Seer grams 18.13 10.19 Mora grams 25.43 10.41 Paraw grams 162.21 72.3 Thalapath grams 94.17 53.54 Kelavalla grams 282.75 129.96 Other large fish grams 129.51 44.26 Sprats grams 290.84 92.68 Hurulla grams 68.73 18.56 Karalla/Katuwalla grams 504.01 117.06 Kumbalawa/ Angila grams 19.34 4.75 Salaya/ Sudaya grams 57.51 16.05 Other small fish grams 354.86 65.01 Lula grams 369.38 90.74 Teppili/ Tilapiya/ Korali grams 28.38 6.72 Other fresh water fish grams 476.60 97.61 Prawns grams 96.30 21.03 Crabs grams 62.88 30.61 Cuttlefish grams 17.97 5.91 Canned fish (Salmon) grams 57.57 19.25 Dried fish Sprats grams 538.42 181.98 Keerameen grams 75.62 29.5 Salaya grams 54.44 14.16 Hurulla grams 37.55 10.46 Seer grams 7.90 4.93
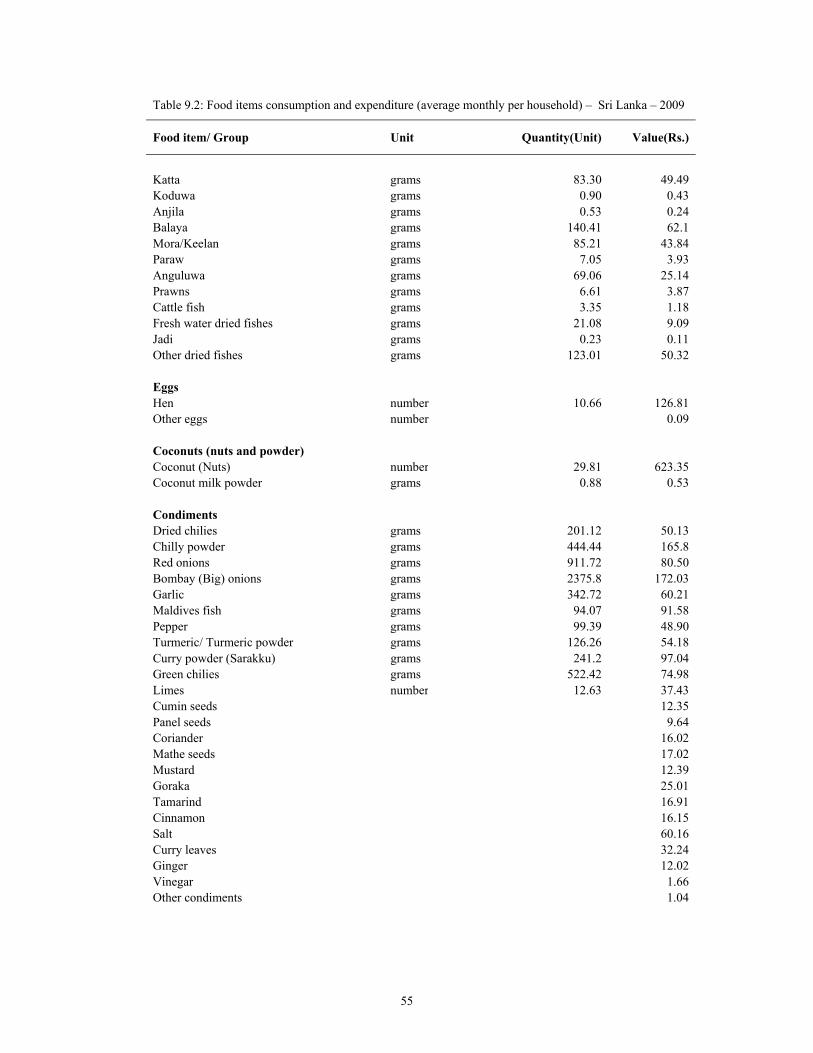
55
Table 9.2: Food items consumption and expenditure (average monthly per household) – Sri Lanka – 2009
Food item/ Group Unit Quantity(Unit) Value(Rs.)
Katta grams 83.30 49.49 Koduwa grams 0.90 0.43 Anjila grams 0.53 0.24 Balaya grams 140.41 62.1 Mora/Keelan grams 85.21 43.84Paraw grams 7.05 3.93 Anguluwa grams 69.06 25.14Prawns grams 6.61 3.87 Cattle fish grams 3.35 1.18 Fresh water dried fishes grams 21.08 9.09 Jadi grams 0.23 0.11 Other dried fishes grams 123.01 50.32 Eggs Hen number 10.66 126.81 Other eggs number 0.09 Coconuts (nuts and powder) Coconut (Nuts) number 29.81 623.35Coconut milk powder grams 0.88 0.53 Condiments Dried chilies grams 201.12 50.13 Chilly powder grams 444.44 165.8 Red onions grams 911.72 80.50 Bombay (Big) onions grams 2375.8 172.03 Garlic grams 342.72 60.21 Maldives fish grams 94.07 91.58 Pepper grams 99.39 48.90 Turmeric/ Turmeric powder grams 126.26 54.18 Curry powder (Sarakku) grams 241.2 97.04 Green chilies grams 522.42 74.98 Limes number 12.63 37.43Cumin seeds 12.35 Panel seeds 9.64Coriander 16.02 Mathe seeds 17.02 Mustard 12.39 Goraka 25.01 Tamarind 16.91 Cinnamon 16.15 Salt 60.16 Curry leaves 32.24 Ginger 12.02 Vinegar 1.66 Other condiments 1.04
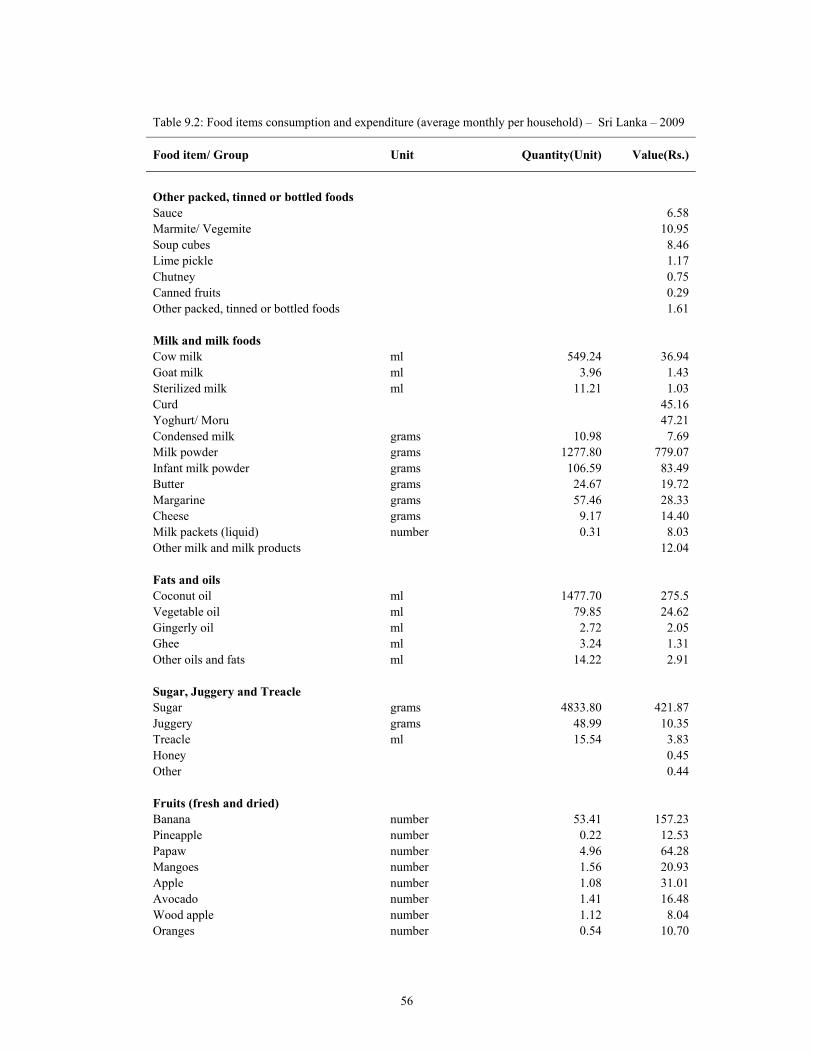
56
Table 9.2: Food items consumption and expenditure (average monthly per household) – Sri Lanka – 2009
Food item/ Group Unit Quantity(Unit) Value(Rs.)
Other packed, tinned or bottled foods Sauce 6.58 Marmite/ Vegemite 10.95 Soup cubes 8.46 Lime pickle 1.17 Chutney 0.75 Canned fruits 0.29 Other packed, tinned or bottled foods 1.61 Milk and milk foods Cow milk ml 549.24 36.94 Goat milk ml 3.96 1.43 Sterilized milk ml 11.21 1.03 Curd 45.16 Yoghurt/ Moru 47.21 Condensed milk grams 10.98 7.69 Milk powder grams 1277.80 779.07 Infant milk powder grams 106.59 83.49 Butter grams 24.67 19.72 Margarine grams 57.46 28.33 Cheese grams 9.17 14.40 Milk packets (liquid) number 0.31 8.03 Other milk and milk products 12.04 Fats and oils Coconut oil ml 1477.70 275.5 Vegetable oil ml 79.85 24.62 Gingerly oil ml 2.72 2.05 Ghee ml 3.24 1.31 Other oils and fats ml 14.22 2.91 Sugar, Juggery and Treacle Sugar grams 4833.80 421.87 Juggery grams 48.99 10.35 Treacle ml 15.54 3.83 Honey 0.45 Other 0.44 Fruits (fresh and dried) Banana number 53.41 157.23 Pineapple number 0.22 12.53 Papaw number 4.96 64.28 Mangoes number 1.56 20.93 Apple number 1.08 31.01 Avocado number 1.41 16.48 Wood apple number 1.12 8.04 Oranges number 0.54 10.70
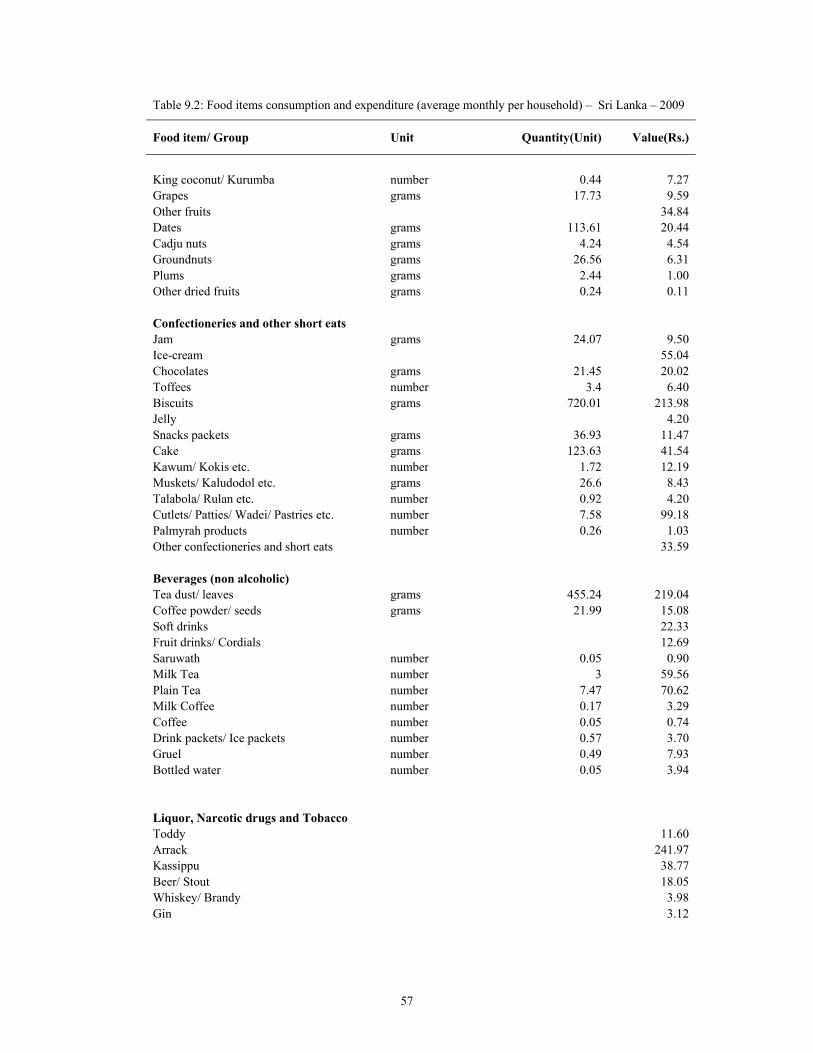
57
Table 9.2: Food items consumption and expenditure (average monthly per household) – Sri Lanka – 2009
Food item/ Group Unit Quantity(Unit) Value(Rs.)
King coconut/ Kurumba number 0.44 7.27 Grapes grams 17.73 9.59 Other fruits 34.84 Dates grams 113.61 20.44 Cadju nuts grams 4.24 4.54Groundnuts grams 26.56 6.31 Plums grams 2.44 1.00Other dried fruits grams 0.24 0.11 Confectioneries and other short eats Jam grams 24.07 9.50 Ice-cream 55.04 Chocolates grams 21.45 20.02 Toffees number 3.4 6.40 Biscuits grams 720.01 213.98 Jelly 4.20 Snacks packets grams 36.93 11.47 Cake grams 123.63 41.54 Kawum/ Kokis etc. number 1.72 12.19Muskets/ Kaludodol etc. grams 26.6 8.43 Talabola/ Rulan etc. number 0.92 4.20Cutlets/ Patties/ Wadei/ Pastries etc. number 7.58 99.18 Palmyrah products number 0.26 1.03 Other confectioneries and short eats 33.59 Beverages (non alcoholic) Tea dust/ leaves grams 455.24 219.04 Coffee powder/ seeds grams 21.99 15.08 Soft drinks 22.33 Fruit drinks/ Cordials 12.69 Saruwath number 0.05 0.90 Milk Tea number 3 59.56 Plain Tea number 7.47 70.62Milk Coffee number 0.17 3.29 Coffee number 0.05 0.74Drink packets/ Ice packets number 0.57 3.70 Gruel number 0.49 7.93 Bottled water number 0.05 3.94 Liquor, Narcotic drugs and Tobacco Toddy 11.60 Arrack 241.97 Kassippu 38.77 Beer/ Stout 18.05 Whiskey/ Brandy 3.98 Gin 3.12
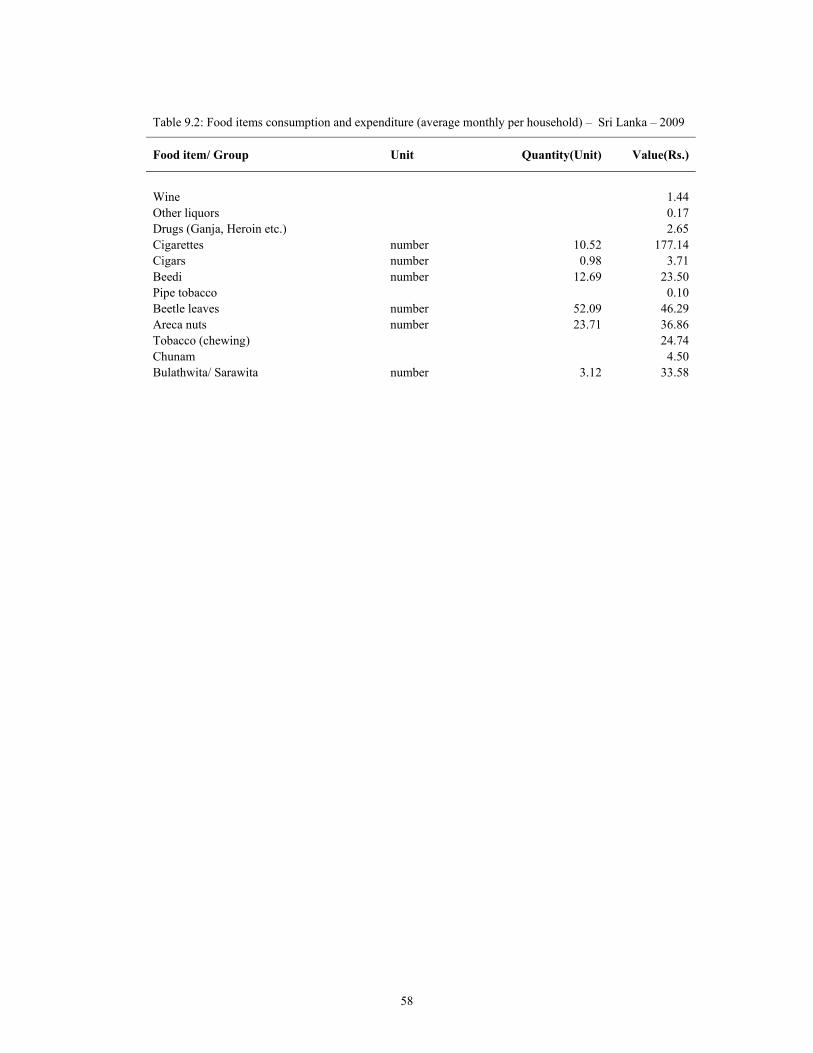
58
Table 9.2: Food items consumption and expenditure (average monthly per household) – Sri Lanka – 2009
Food item/ Group Unit Quantity(Unit) Value(Rs.)
Wine 1.44 Other liquors 0.17 Drugs (Ganja, Heroin etc.) 2.65 Cigarettes number 10.52 177.14 Cigars number 0.98 3.71 Beedi number 12.69 23.50 Pipe tobacco 0.10 Beetle leaves number 52.09 46.29 Areca nuts number 23.71 36.86 Tobacco (chewing) 24.74 Chunam 4.50 Bulathwita/ Sarawita number 3.12 33.58
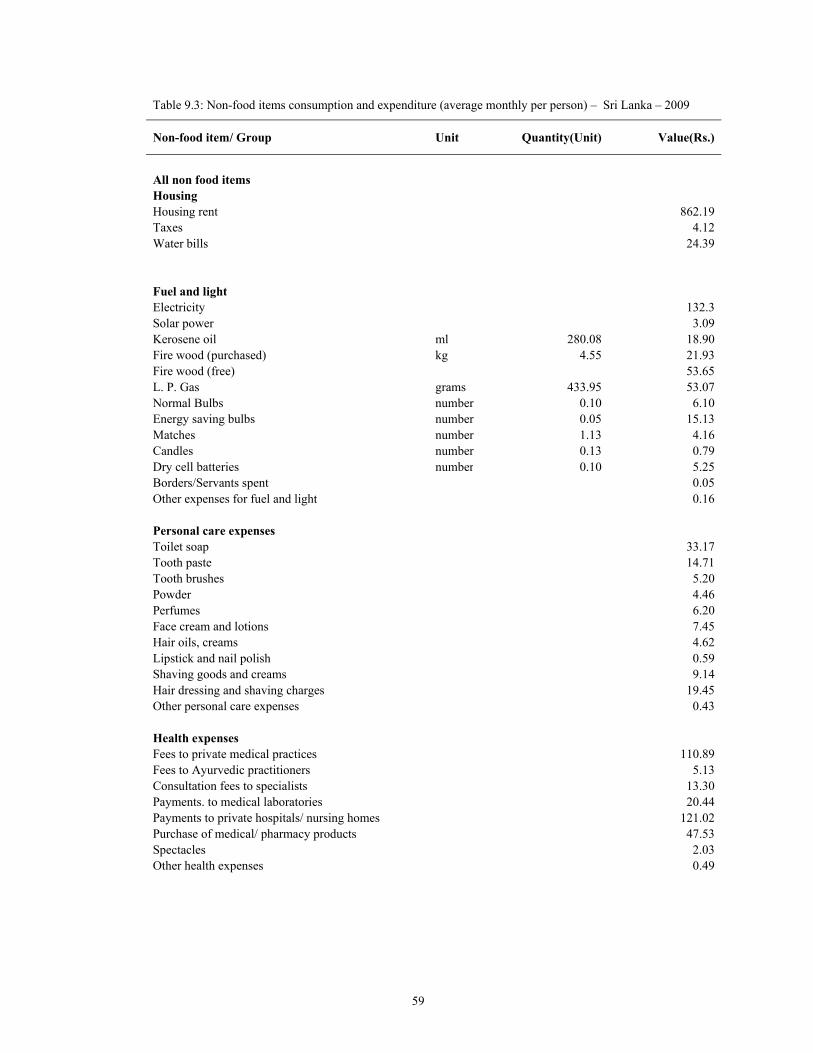
59
Table 9.3: Non-food items consumption and expenditure (average monthly per person) – Sri Lanka – 2009
Non-food item/ Group Unit Quantity(Unit) Value(Rs.)
All non food items Housing Housing rent 862.19 Taxes 4.12 Water bills 24.39 Fuel and light Electricity 132.3 Solar power 3.09 Kerosene oil ml 280.08 18.90 Fire wood (purchased) kg 4.55 21.93 Fire wood (free) 53.65 L. P. Gas grams 433.95 53.07 Normal Bulbs number 0.10 6.10 Energy saving bulbs number 0.05 15.13 Matches number 1.13 4.16 Candles number 0.13 0.79 Dry cell batteries number 0.10 5.25Borders/Servants spent 0.05 Other expenses for fuel and light 0.16 Personal care expenses Toilet soap 33.17 Tooth paste 14.71 Tooth brushes 5.20 Powder 4.46 Perfumes 6.20 Face cream and lotions 7.45 Hair oils, creams 4.62 Lipstick and nail polish 0.59 Shaving goods and creams 9.14 Hair dressing and shaving charges 19.45Other personal care expenses 0.43 Health expenses Fees to private medical practices 110.89 Fees to Ayurvedic practitioners 5.13 Consultation fees to specialists 13.30 Payments. to medical laboratories 20.44 Payments to private hospitals/ nursing homes 121.02 Purchase of medical/ pharmacy products 47.53 Spectacles 2.03 Other health expenses 0.49
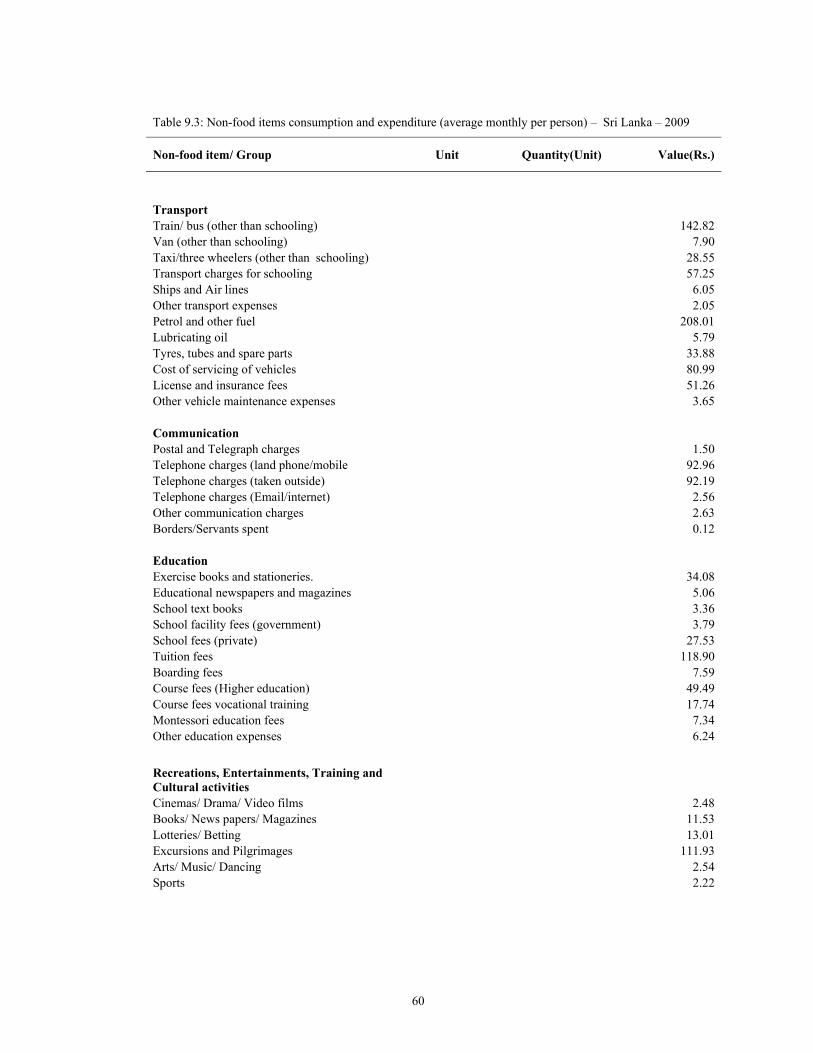
60
Table 9.3: Non-food items consumption and expenditure (average monthly per person) – Sri Lanka – 2009
Non-food item/ Group Unit Quantity(Unit) Value(Rs.)
Transport Train/ bus (other than schooling) 142.82Van (other than schooling) 7.90 Taxi/three wheelers (other than schooling) 28.55Transport charges for schooling 57.25 Ships and Air lines 6.05 Other transport expenses 2.05 Petrol and other fuel 208.01 Lubricating oil 5.79 Tyres, tubes and spare parts 33.88 Cost of servicing of vehicles 80.99 License and insurance fees 51.26 Other vehicle maintenance expenses 3.65 Communication Postal and Telegraph charges 1.50Telephone charges (land phone/mobile 92.96 Telephone charges (taken outside) 92.19Telephone charges (Email/internet) 2.56 Other communication charges 2.63 Borders/Servants spent 0.12 Education Exercise books and stationeries. 34.08 Educational newspapers and magazines 5.06 School text books 3.36 School facility fees (government) 3.79 School fees (private) 27.53 Tuition fees 118.90 Boarding fees 7.59Course fees (Higher education) 49.49 Course fees vocational training 17.74Montessori education fees 7.34 Other education expenses 6.24
Recreations, Entertainments, Training and Cultural activities Cinemas/ Drama/ Video films 2.48Books/ News papers/ Magazines 11.53 Lotteries/ Betting 13.01Excursions and Pilgrimages 111.93 Arts/ Music/ Dancing 2.54 Sports 2.22
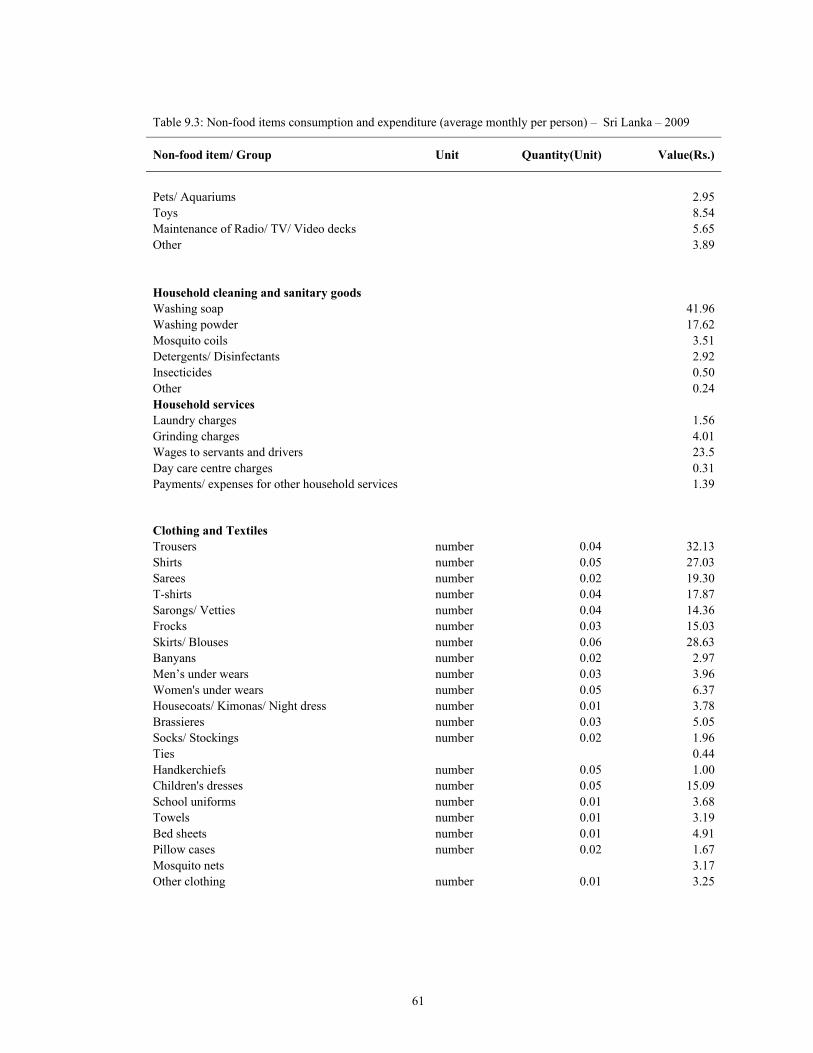
61
Table 9.3: Non-food items consumption and expenditure (average monthly per person) – Sri Lanka – 2009
Non-food item/ Group Unit Quantity(Unit) Value(Rs.)
Pets/ Aquariums 2.95 Toys 8.54 Maintenance of Radio/ TV/ Video decks 5.65 Other 3.89 Household cleaning and sanitary goods Washing soap 41.96 Washing powder 17.62 Mosquito coils 3.51 Detergents/ Disinfectants 2.92 Insecticides 0.50 Other 0.24 Household services Laundry charges 1.56 Grinding charges 4.01 Wages to servants and drivers 23.5 Day care centre charges 0.31 Payments/ expenses for other household services 1.39 Clothing and Textiles Trousers number 0.04 32.13 Shirts number 0.05 27.03 Sarees number 0.02 19.30 T-shirts number 0.04 17.87 Sarongs/ Vetties number 0.04 14.36Frocks number 0.03 15.03 Skirts/ Blouses number 0.06 28.63Banyans number 0.02 2.97 Men’s under wears number 0.03 3.96 Women's under wears number 0.05 6.37 Housecoats/ Kimonas/ Night dress number 0.01 3.78 Brassieres number 0.03 5.05 Socks/ Stockings number 0.02 1.96 Ties 0.44 Handkerchiefs number 0.05 1.00 Children's dresses number 0.05 15.09 School uniforms number 0.01 3.68 Towels number 0.01 3.19 Bed sheets number 0.01 4.91Pillow cases number 0.02 1.67 Mosquito nets 3.17Other clothing number 0.01 3.25
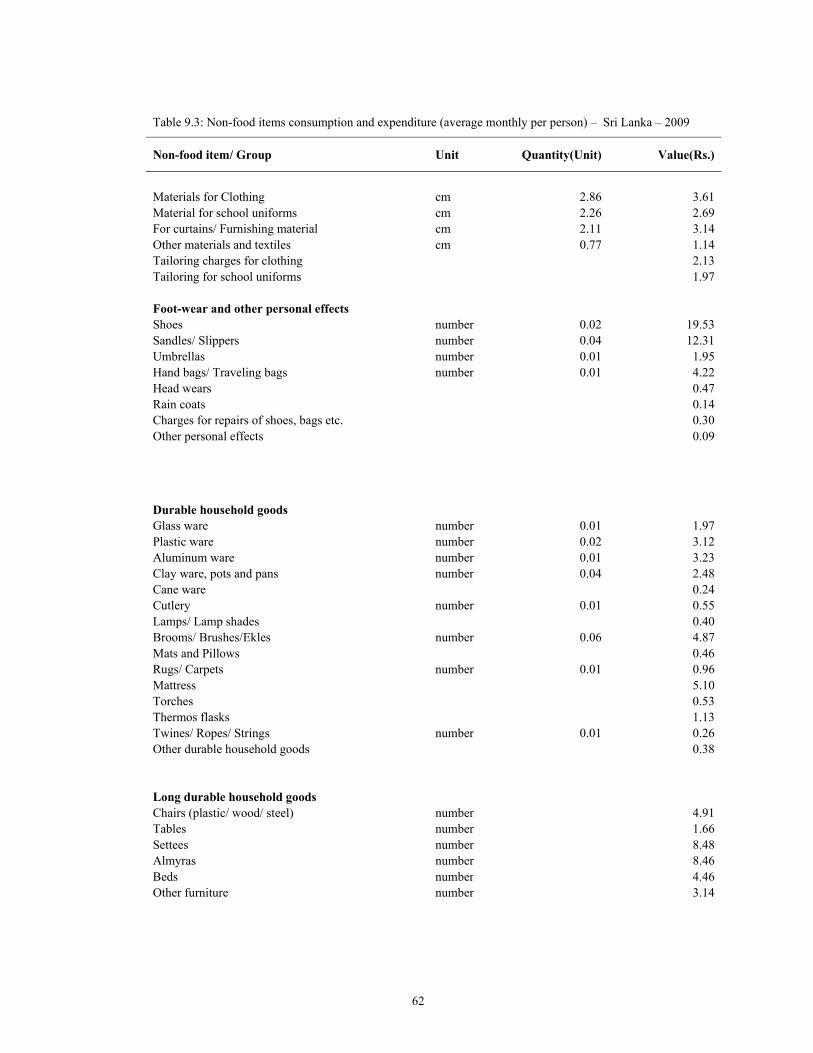
62
Table 9.3: Non-food items consumption and expenditure (average monthly per person) – Sri Lanka – 2009
Non-food item/ Group Unit Quantity(Unit) Value(Rs.)
Materials for Clothing cm 2.86 3.61 Material for school uniforms cm 2.26 2.69 For curtains/ Furnishing material cm 2.11 3.14 Other materials and textiles cm 0.77 1.14 Tailoring charges for clothing 2.13 Tailoring for school uniforms 1.97 Foot-wear and other personal effects Shoes number 0.02 19.53 Sandles/ Slippers number 0.04 12.31 Umbrellas number 0.01 1.95 Hand bags/ Traveling bags number 0.01 4.22 Head wears 0.47 Rain coats 0.14 Charges for repairs of shoes, bags etc. 0.30 Other personal effects 0.09 Durable household goods Glass ware number 0.01 1.97 Plastic ware number 0.02 3.12 Aluminum ware number 0.01 3.23 Clay ware, pots and pans number 0.04 2.48 Cane ware 0.24 Cutlery number 0.01 0.55 Lamps/ Lamp shades 0.40 Brooms/ Brushes/Ekles number 0.06 4.87 Mats and Pillows 0.46Rugs/ Carpets number 0.01 0.96 Mattress 5.10Torches 0.53 Thermos flasks 1.13 Twines/ Ropes/ Strings number 0.01 0.26 Other durable household goods 0.38 Long durable household goods Chairs (plastic/ wood/ steel) number 4.91 Tables number 1.66 Settees number 8.48 Almyras number 8.46 Beds number 4.46Other furniture number 3.14
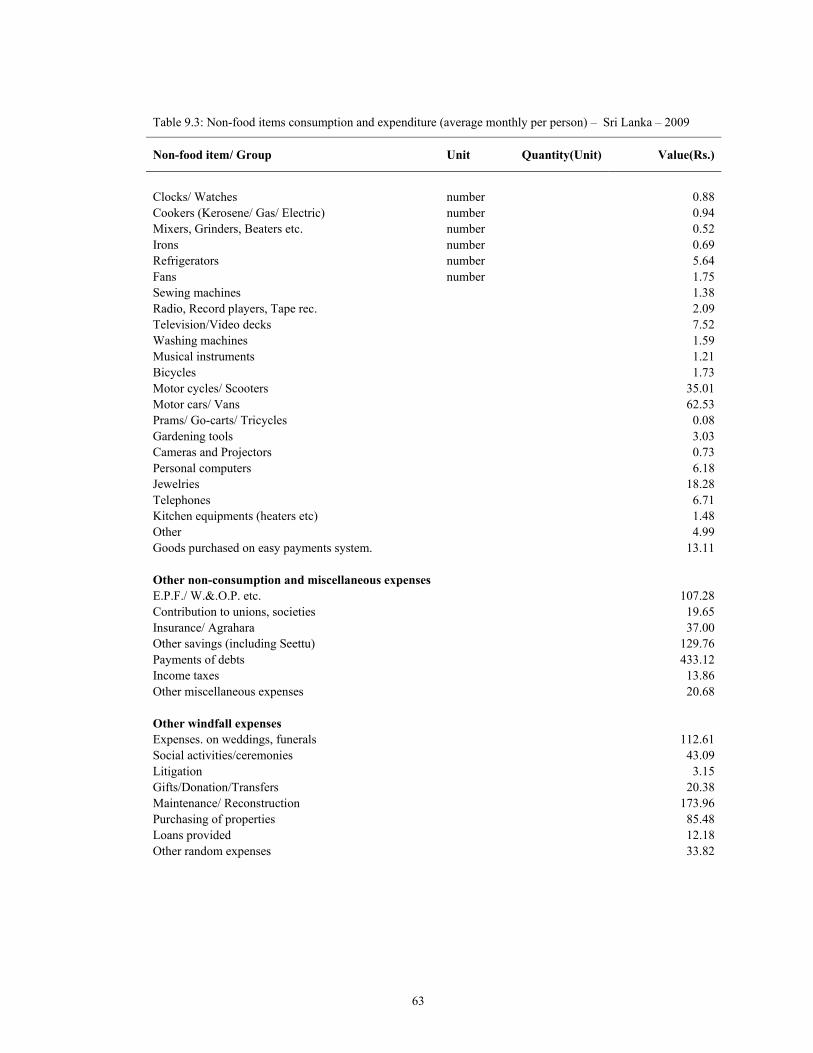
63
Table 9.3: Non-food items consumption and expenditure (average monthly per person) – Sri Lanka – 2009
Non-food item/ Group Unit Quantity(Unit) Value(Rs.)
Clocks/ Watches number 0.88 Cookers (Kerosene/ Gas/ Electric) number 0.94 Mixers, Grinders, Beaters etc. number 0.52 Irons number 0.69 Refrigerators number 5.64 Fans number 1.75 Sewing machines 1.38 Radio, Record players, Tape rec. 2.09 Television/Video decks 7.52 Washing machines 1.59 Musical instruments 1.21 Bicycles 1.73 Motor cycles/ Scooters 35.01 Motor cars/ Vans 62.53 Prams/ Go-carts/ Tricycles 0.08 Gardening tools 3.03 Cameras and Projectors 0.73 Personal computers 6.18 Jewelries 18.28 Telephones 6.71 Kitchen equipments (heaters etc) 1.48 Other 4.99 Goods purchased on easy payments system. 13.11 Other non-consumption and miscellaneous expenses E.P.F./ W.&.O.P. etc. 107.28 Contribution to unions, societies 19.65 Insurance/ Agrahara 37.00 Other savings (including Seettu) 129.76 Payments of debts 433.12 Income taxes 13.86 Other miscellaneous expenses 20.68 Other windfall expenses Expenses. on weddings, funerals 112.61 Social activities/ceremonies 43.09 Litigation 3.15 Gifts/Donation/Transfers 20.38 Maintenance/ Reconstruction 173.96 Purchasing of properties 85.48 Loans provided 12.18 Other random expenses 33.82
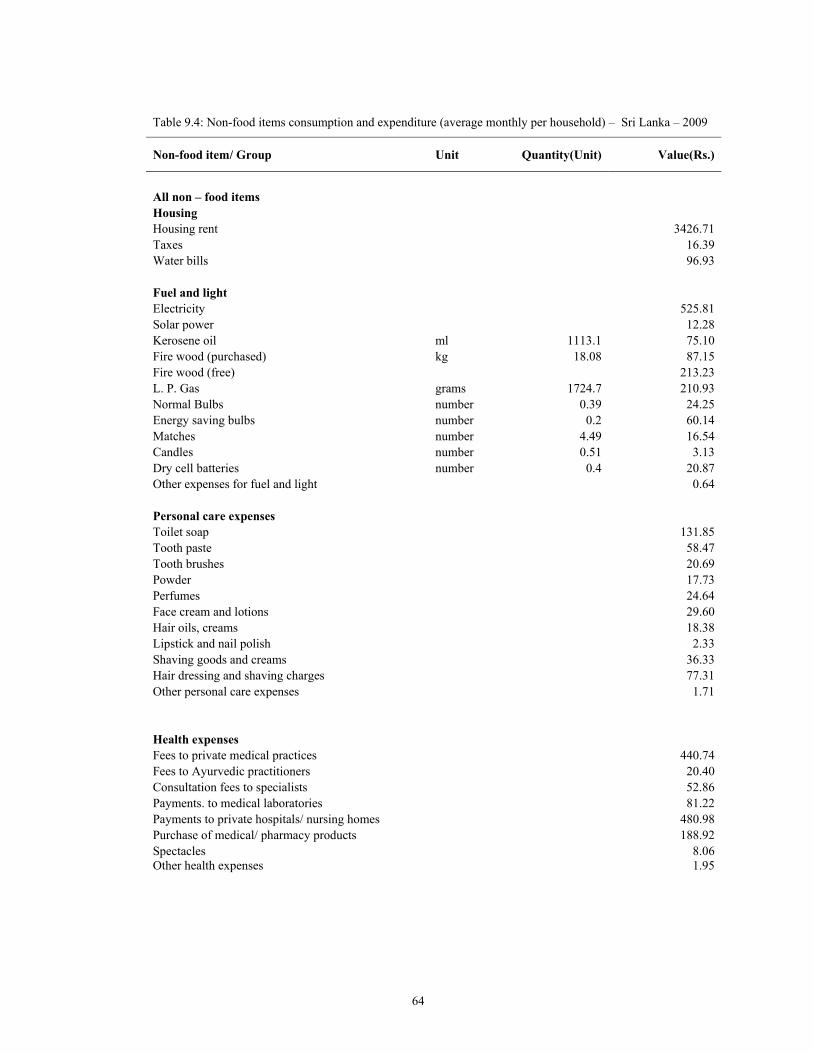
64
Table 9.4: Non-food items consumption and expenditure (average monthly per household) – Sri Lanka – 2009
Non-food item/ Group Unit Quantity(Unit) Value(Rs.)
All non – food items Housing Housing rent 3426.71 Taxes 16.39 Water bills 96.93 Fuel and light Electricity 525.81 Solar power 12.28 Kerosene oil ml 1113.1 75.10 Fire wood (purchased) kg 18.08 87.15 Fire wood (free) 213.23 L. P. Gas grams 1724.7 210.93 Normal Bulbs number 0.39 24.25 Energy saving bulbs number 0.2 60.14 Matches number 4.49 16.54 Candles number 0.51 3.13 Dry cell batteries number 0.4 20.87 Other expenses for fuel and light 0.64 Personal care expenses Toilet soap 131.85 Tooth paste 58.47 Tooth brushes 20.69 Powder 17.73 Perfumes 24.64 Face cream and lotions 29.60 Hair oils, creams 18.38 Lipstick and nail polish 2.33 Shaving goods and creams 36.33 Hair dressing and shaving charges 77.31 Other personal care expenses 1.71 Health expenses Fees to private medical practices 440.74 Fees to Ayurvedic practitioners 20.40 Consultation fees to specialists 52.86 Payments. to medical laboratories 81.22 Payments to private hospitals/ nursing homes 480.98 Purchase of medical/ pharmacy products 188.92 Spectacles 8.06 Other health expenses 1.95
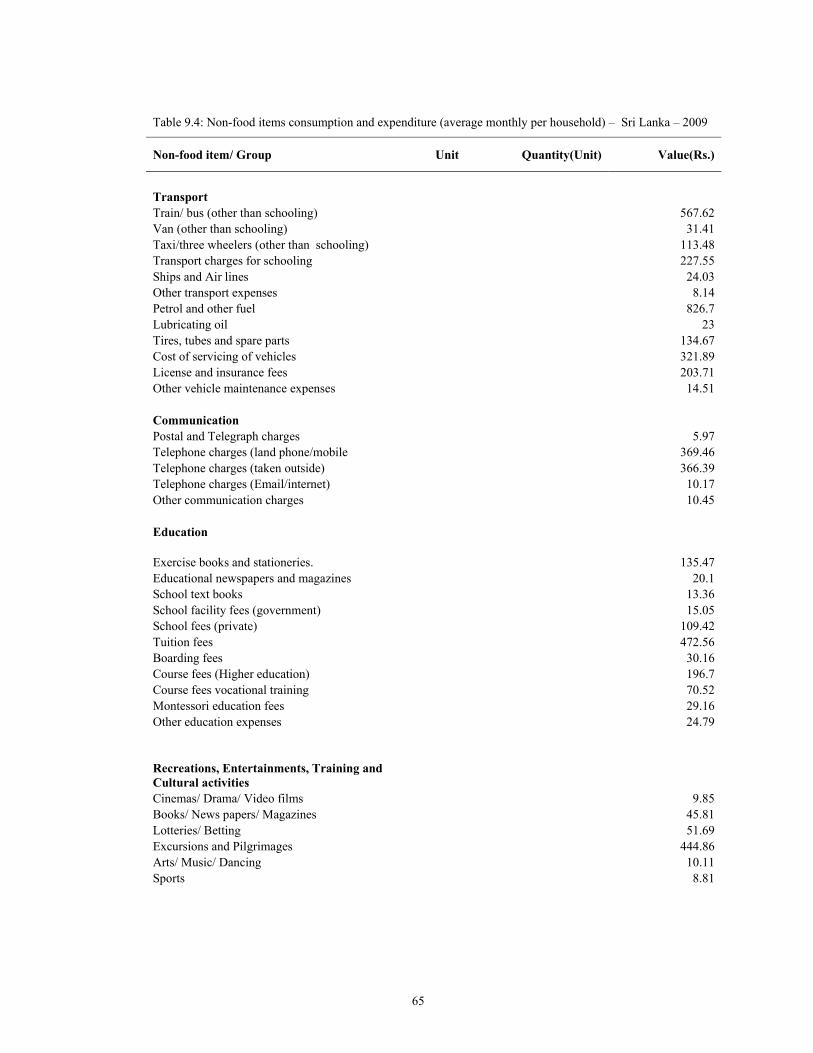
65
Table 9.4: Non-food items consumption and expenditure (average monthly per household) – Sri Lanka – 2009
Non-food item/ Group Unit Quantity(Unit) Value(Rs.)
Transport Train/ bus (other than schooling) 567.62 Van (other than schooling) 31.41 Taxi/three wheelers (other than schooling) 113.48 Transport charges for schooling 227.55 Ships and Air lines 24.03 Other transport expenses 8.14 Petrol and other fuel 826.7 Lubricating oil 23 Tires, tubes and spare parts 134.67 Cost of servicing of vehicles 321.89 License and insurance fees 203.71 Other vehicle maintenance expenses 14.51 Communication Postal and Telegraph charges 5.97 Telephone charges (land phone/mobile 369.46 Telephone charges (taken outside) 366.39 Telephone charges (Email/internet) 10.17 Other communication charges 10.45 Education Exercise books and stationeries. 135.47 Educational newspapers and magazines 20.1 School text books 13.36 School facility fees (government) 15.05School fees (private) 109.42 Tuition fees 472.56Boarding fees 30.16 Course fees (Higher education) 196.7 Course fees vocational training 70.52 Montessori education fees 29.16 Other education expenses 24.79 Recreations, Entertainments, Training and Cultural activities Cinemas/ Drama/ Video films 9.85 Books/ News papers/ Magazines 45.81 Lotteries/ Betting 51.69 Excursions and Pilgrimages 444.86 Arts/ Music/ Dancing 10.11 Sports 8.81
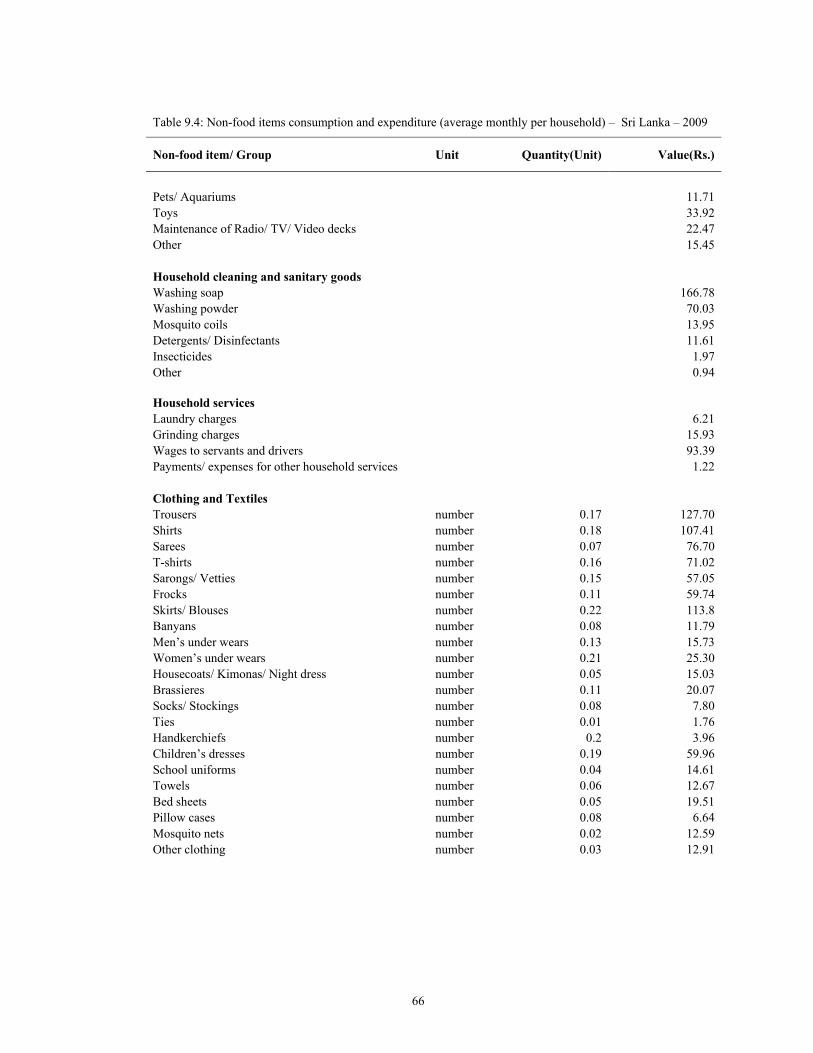
66
Table 9.4: Non-food items consumption and expenditure (average monthly per household) – Sri Lanka – 2009
Non-food item/ Group Unit Quantity(Unit) Value(Rs.)
Pets/ Aquariums 11.71 Toys 33.92 Maintenance of Radio/ TV/ Video decks 22.47 Other 15.45 Household cleaning and sanitary goods Washing soap 166.78 Washing powder 70.03 Mosquito coils 13.95 Detergents/ Disinfectants 11.61 Insecticides 1.97 Other 0.94 Household services Laundry charges 6.21Grinding charges 15.93 Wages to servants and drivers 93.39 Payments/ expenses for other household services 1.22 Clothing and Textiles Trousers number 0.17 127.70 Shirts number 0.18 107.41 Sarees number 0.07 76.70 T-shirts number 0.16 71.02 Sarongs/ Vetties number 0.15 57.05 Frocks number 0.11 59.74 Skirts/ Blouses number 0.22 113.8Banyans number 0.08 11.79 Men’s under wears number 0.13 15.73Women’s under wears number 0.21 25.30 Housecoats/ Kimonas/ Night dress number 0.05 15.03 Brassieres number 0.11 20.07 Socks/ Stockings number 0.08 7.80 Ties number 0.01 1.76 Handkerchiefs number 0.2 3.96 Children’s dresses number 0.19 59.96 School uniforms number 0.04 14.61 Towels number 0.06 12.67 Bed sheets number 0.05 19.51 Pillow cases number 0.08 6.64 Mosquito nets number 0.02 12.59Other clothing number 0.03 12.91
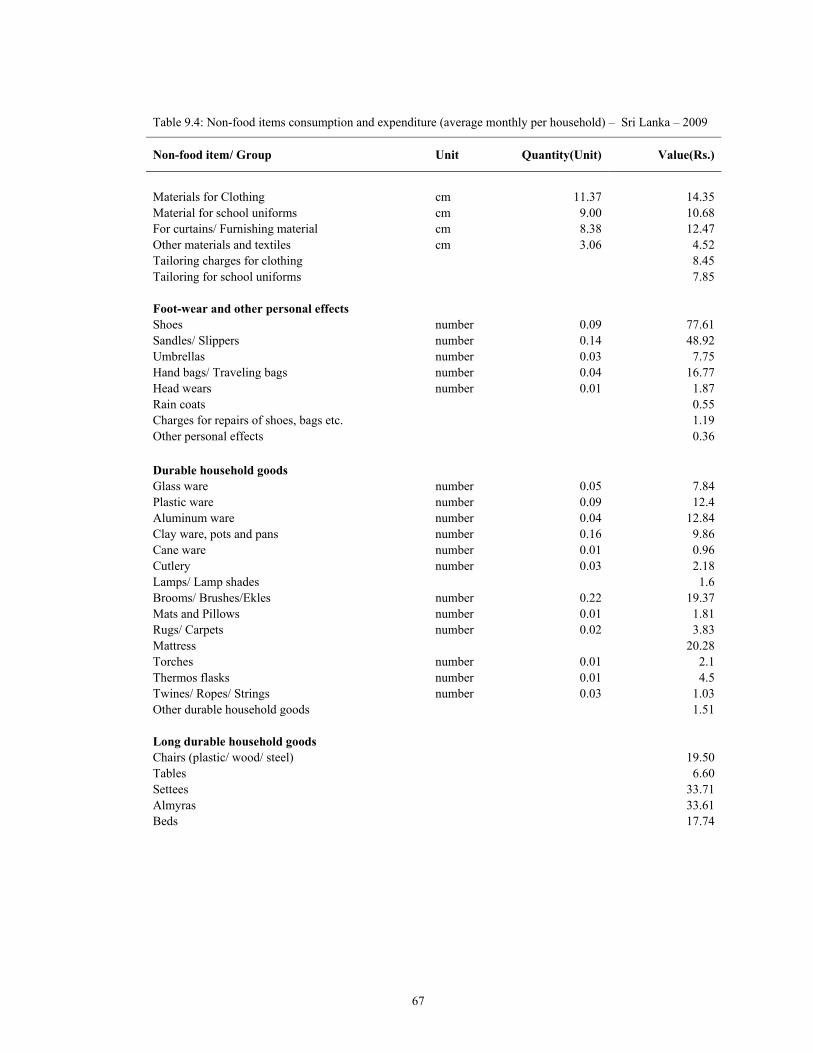
67
Table 9.4: Non-food items consumption and expenditure (average monthly per household) – Sri Lanka – 2009
Non-food item/ Group Unit Quantity(Unit) Value(Rs.)
Materials for Clothing cm 11.37 14.35 Material for school uniforms cm 9.00 10.68 For curtains/ Furnishing material cm 8.38 12.47 Other materials and textiles cm 3.06 4.52 Tailoring charges for clothing 8.45 Tailoring for school uniforms 7.85 Foot-wear and other personal effects Shoes number 0.09 77.61 Sandles/ Slippers number 0.14 48.92 Umbrellas number 0.03 7.75 Hand bags/ Traveling bags number 0.04 16.77 Head wears number 0.01 1.87 Rain coats 0.55 Charges for repairs of shoes, bags etc. 1.19 Other personal effects 0.36 Durable household goods Glass ware number 0.05 7.84 Plastic ware number 0.09 12.4 Aluminum ware number 0.04 12.84 Clay ware, pots and pans number 0.16 9.86 Cane ware number 0.01 0.96 Cutlery number 0.03 2.18 Lamps/ Lamp shades 1.6 Brooms/ Brushes/Ekles number 0.22 19.37 Mats and Pillows number 0.01 1.81 Rugs/ Carpets number 0.02 3.83 Mattress 20.28 Torches number 0.01 2.1 Thermos flasks number 0.01 4.5 Twines/ Ropes/ Strings number 0.03 1.03 Other durable household goods 1.51 Long durable household goods Chairs (plastic/ wood/ steel) 19.50 Tables 6.60 Settees 33.71 Almyras 33.61 Beds 17.74
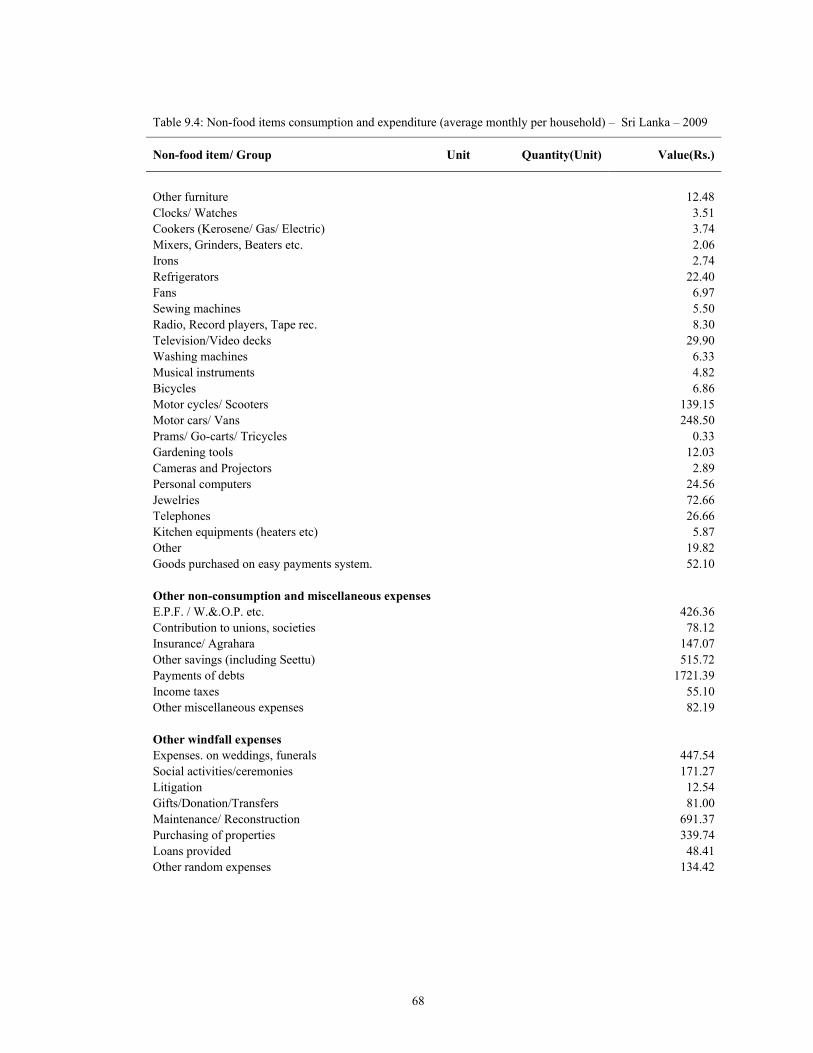
68
Table 9.4: Non-food items consumption and expenditure (average monthly per household) – Sri Lanka – 2009
Non-food item/ Group Unit Quantity(Unit) Value(Rs.)
Other furniture 12.48 Clocks/ Watches 3.51 Cookers (Kerosene/ Gas/ Electric) 3.74 Mixers, Grinders, Beaters etc. 2.06 Irons 2.74 Refrigerators 22.40 Fans 6.97 Sewing machines 5.50 Radio, Record players, Tape rec. 8.30 Television/Video decks 29.90 Washing machines 6.33 Musical instruments 4.82 Bicycles 6.86 Motor cycles/ Scooters 139.15 Motor cars/ Vans 248.50 Prams/ Go-carts/ Tricycles 0.33 Gardening tools 12.03 Cameras and Projectors 2.89 Personal computers 24.56 Jewelries 72.66 Telephones 26.66 Kitchen equipments (heaters etc) 5.87 Other 19.82 Goods purchased on easy payments system. 52.10 Other non-consumption and miscellaneous expenses E.P.F. / W.&.O.P. etc. 426.36 Contribution to unions, societies 78.12 Insurance/ Agrahara 147.07 Other savings (including Seettu) 515.72 Payments of debts 1721.39 Income taxes 55.10 Other miscellaneous expenses 82.19 Other windfall expenses Expenses. on weddings, funerals 447.54 Social activities/ceremonies 171.27 Litigation 12.54 Gifts/Donation/Transfers 81.00 Maintenance/ Reconstruction 691.37 Purchasing of properties 339.74 Loans provided 48.41 Other random expenses 134.42
Annexure: Survey schedule
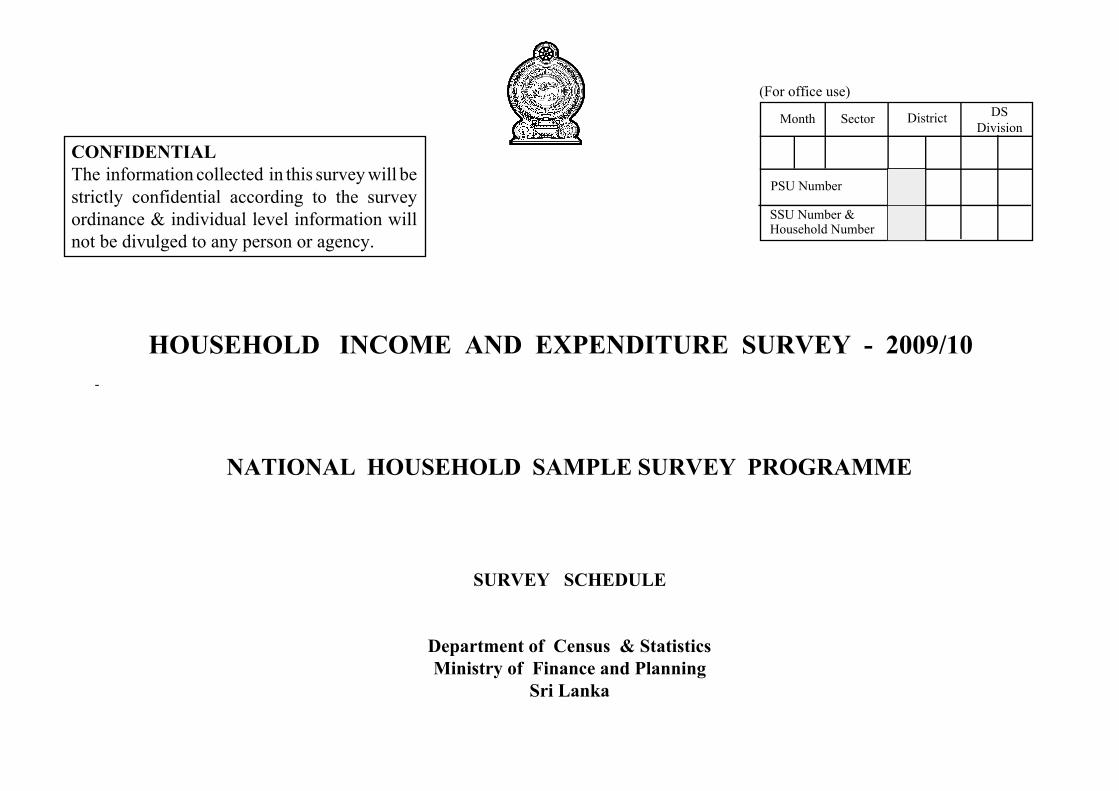
CONFIDENTIALThe information collected in this survey will bestrictly confidential according to the surveyordinance & individual level information willnot be divulged to any person or agency.
Month Sector DSDivision
Department of Census & StatisticsMinistry of Finance and Planning
Sri Lanka
HOUSEHOLD INCOME AND EXPENDITURE SURVEY - 2009/10
(For office use)
NATIONAL HOUSEHOLD SAMPLE SURVEY PROGRAMME
SURVEY SCHEDULE
District
SSU Number &Household Number
PSU Number
-
11
12 Number of Households in this unit
13 Result
14 Name of the Head of the Household :- .................................
.............................................................................
15 Interviewer's
Name :- .................................................................................
16 Supervising Officer's
Name :- .................................................................................
Signature :- ........................................ Date :- .......................
*
* For Office Use Only
1. Address (Location) :-................................................................
............................................................................................
2. Province :- .......................................................................................
3. District :- ...........................................................................................
4. DS Division :- ..................................................................................
5. Name of MC / UC...........................................................................
(If urban sector only )
Ward No :- ........................................................................................6. GN Division : Number :- ................ Name :- .................................7. Name of Village :- ...........................................................................
(If rural sector only )
8. Name of Estate :- ..............................................................................
(If estate sector only )
9. C.B.No. :- ..........................................................................................
Completed ................................................... 1
Deferred ...................................................... 2
Not competent respondant at home ........... 3
Refused ........................................................ 4
Household is temporarily closed ................. 5
Household is demolished / Vacant ............. 6
Other (Specify) ............................................ 9
* * Result Code
District
10
Sector DS Division
1IDENTIFICATION INFORMATIONS
SurveyMonth
PSUNumber
SSUNumber
HouseholdNumber
Male .......................................1Female ....................................2
Col. 7 - Ethnicity
Col. 3 - Relationship to head ofthe household
Never Married ........................1Married ...................................2Widowed ................................3Divorced .................................4Separated ................................5
Col. 15 - Employment status
Government employee.............................1 Semi government employee ..................2 Private sector employee ........................3 Employer ................................................4 Own account worker ..............................5 Unpaid family worker...........................6
Col. 4 - SexCol. 10 -Level of Education
Col. 12 -Current Activity
Employed.....................................1 Unemployed.................................2 Student ........................................3 Household work...........................4 Unable / Too old to work.............5 Other ...........................................9
Col. 11 - Marital Status
Studing in Grade 1................................... 00Passed Grade 1..........................................01Passed Grade 2..........................................02Passed Grade 3..........................................03Passed Grade 4..........................................04Passed Grade 5..........................................05Passed Grade 6..........................................06Passed Grade 7..........................................07Passed Grade 8...........................................08Passed Grade 9..........................................09Passed Grade 10........................................10Passed G.C.E. (O/L) orequivalent ..................................................11Passed Grade 12........................................12Passed G.C.E.(A/L) .orequivalent ..................................................13Passed GAQ/GSQ .....................................14Passed Degree ...........................................15Passed Post Graduate Degree / Diploma....16Special Education unit ...............................17No Schooling .............................................19
Wife/ Husband .......................................2Son/ Daughter ........................................3Parents ....................................................4Other Relative ........................................5Domestic Servants .................................6Boarder ..................................................7Other ......................................................9
Sinhala................................1 Sri LankaTamil..................2 Indian Tamil.......................3 Sri Lanka Moors ................4 Malay .................................5 Burgher ..............................6 Other ..................................9
Head of the household.............................1
Col. 9 -Attendance at School or OtherEducational Institution
Pre school ...........................................1 School .................................................2 University ............................................3 Other educational institution ...............4 Vocational/ Technical institution ........5 Pending results G.C.E. (O.L/A.L) .........6 Does not attend ...................................7
Codes for Section 1
2
Col. 8 - Religion
Buddhist ...............................1 Hindu ...................................2 Islam ....................................3 Roman Catholic/ Other Christian ..................4 Other .....................................9
010203040506070809101112131415
1 2 3 4 5 6 7 8 9 10
Name of all persons who usuallylive in this household
11
SerialNumber
Main Occupation(Describe)
* * *Name the persons who are member of thishousehold and usually live elsewhere in the
country or abroad
For Persons 10 years and over
Main Industry(Describe)
41
4342
44
12
For employed persons only( Column 12 code = 1)
Usual residenceIn the country - 1Abroad - 2
Section 1 - Demographic Characteristics 3
Date of Birth
13 14 15
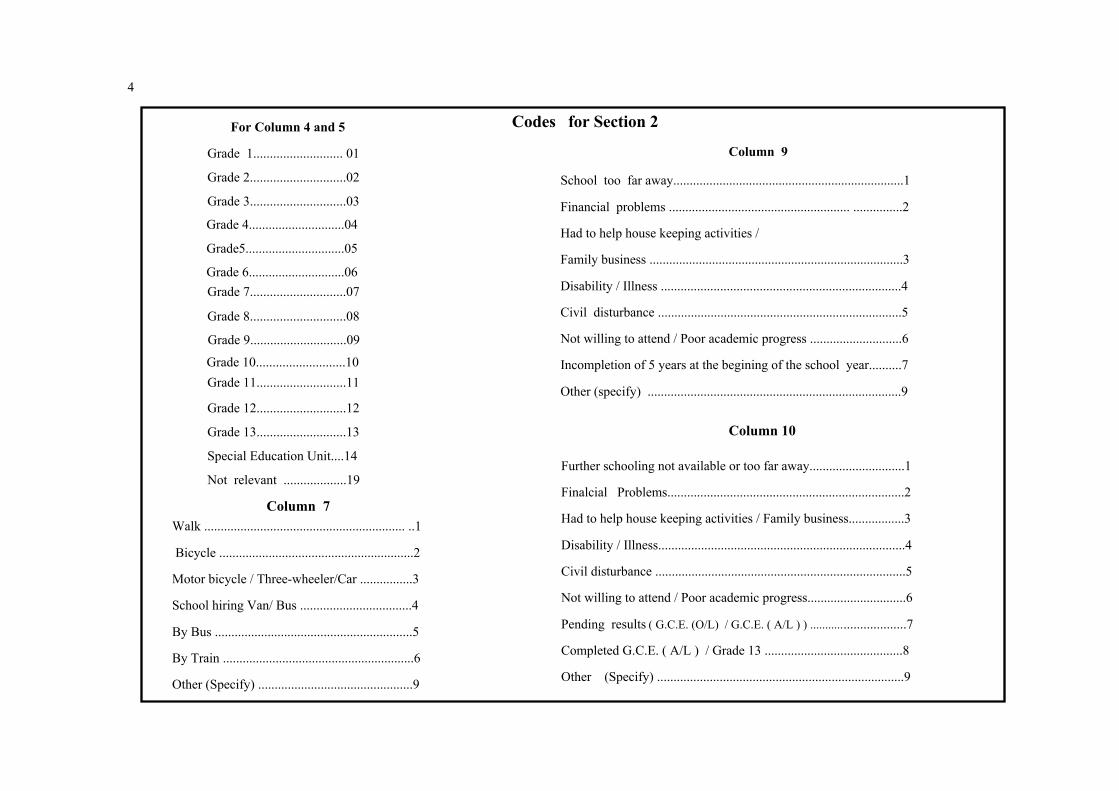
Grade 1........................... 01
Grade 2.............................02
Grade 3.............................03
Grade 6.............................06
Grade 4.............................04
Grade5..............................05
Grade 7.............................07
Grade 8.............................08
Grade 11...........................11 Grade 10...........................10
Grade 9.............................09
Grade 12...........................12
Grade 13...........................13
Special Education Unit....14
Not relevant ...................19
Walk ............................................................. ..1
Bicycle ...........................................................2
Motor bicycle / Three-wheeler/Car ................3
School hiring Van/ Bus ..................................4
By Bus ............................................................5
By Train ..........................................................6
Other (Specify) ...............................................9
School too far away......................................................................1
Financial problems ....................................................... ...............2
Had to help house keeping activities /
Family business .............................................................................3
Disability / Illness .........................................................................4
Civil disturbance ..........................................................................5
Not willing to attend / Poor academic progress ............................6
Incompletion of 5 years at the begining of the school year..........7
Other (specify) .............................................................................9
Further schooling not available or too far away.............................1
Finalcial Problems........................................................................2
Had to help house keeping activities / Family business.................3
Disability / Illness...........................................................................4
Civil disturbance ............................................................................5
Not willing to attend / Poor academic progress..............................6
Pending results ( G.C.E. (O/L) / G.C.E. ( A/L ) ) ..............................7
Completed G.C.E. ( A/L ) / Grade 13 ..........................................8
Other (Specify) ...........................................................................9
For Column 4 and 5
Column 9
Codes for Section 2
4
Column 7
Column 10
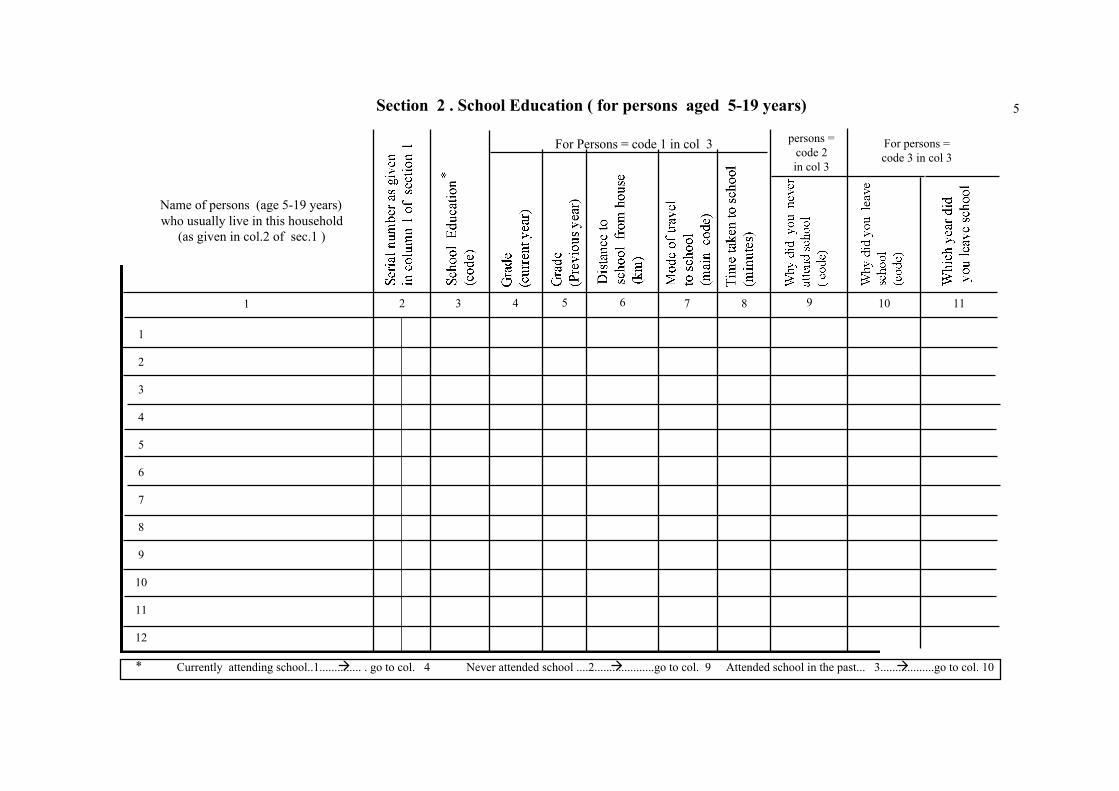
Section 2 . School Education ( for persons aged 5-19 years)
àCurrently attending school..1.............. . go to col. 4
Name of persons (age 5-19 years)who usually live in this household
(as given in col.2 of sec.1 )
1 2 3 4 5 6 7 9 118 10
1
2
3
4
5
6
7
8
9
10
11
12
à à Never attended school ....2....................go to col. 9 Attended school in the past... 3..................go to col. 10*
For Persons = code 1 in col 3 persons =code 2in col 3
For persons =code 3 in col 3
5
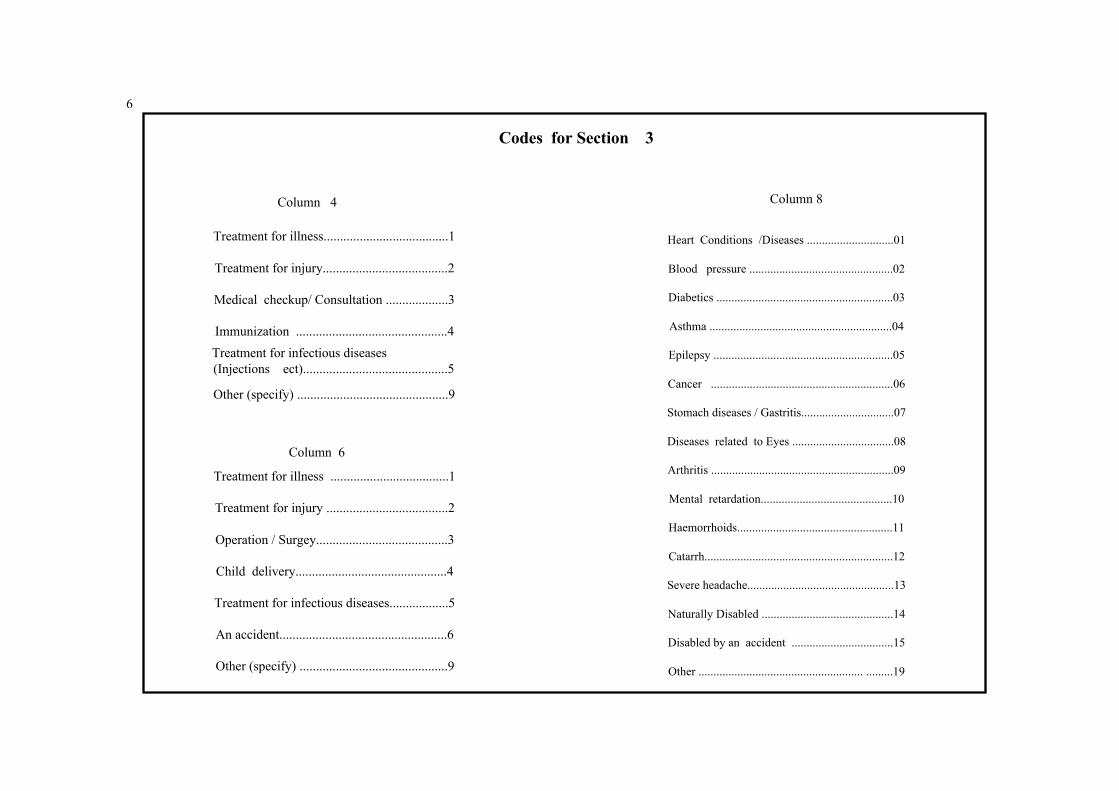
Heart Conditions /Diseases .............................01
Blood pressure ................................................02
Diabetics ...........................................................03
Asthma .............................................................04
Epilepsy ............................................................05
Cancer .............................................................06
Stomach diseases / Gastritis...............................07
Diseases related to Eyes ..................................08
Arthritis .............................................................09
Mental retardation............................................10
Haemorrhoids....................................................11
Catarrh...............................................................12
Severe headache.................................................13
Naturally Disabled ............................................14
Disabled by an accident ..................................15
Other ....................................................... .........19
Column 6
Treatment for illness ....................................1
Treatment for injury .....................................2
Operation / Surgey........................................3
Child delivery..............................................4
Treatment for infectious diseases..................5
An accident...................................................6
Other (specify) .............................................9
Treatment for illness......................................1
Treatment for injury......................................2
Medical checkup/ Consultation ...................3
Immunization ..............................................4
Other (specify) ..............................................9
Treatment for infectious diseases (Injections ect)............................................5
Column 8Column 4
Codes for Section 3
6
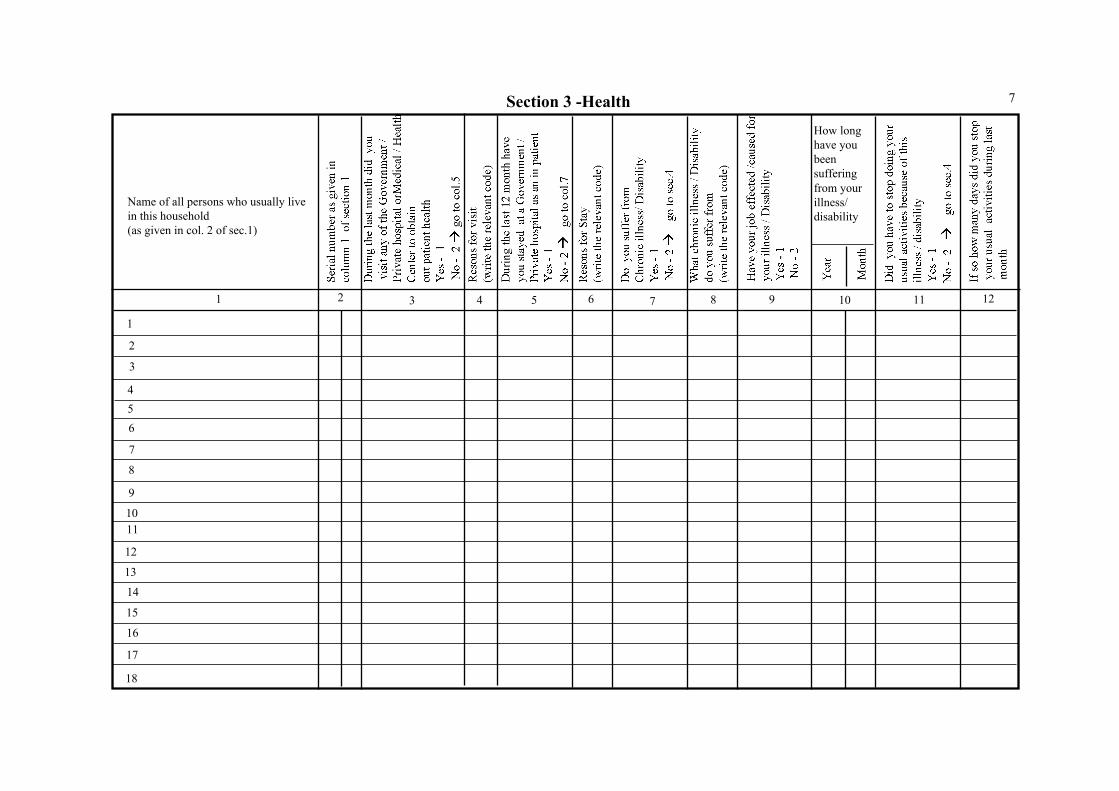
7
2
56
10
13
12
11
14
17
1 2 3 4 5 6 7 8 109 11 12
How longhave youbeensufferingfrom yourillness/disability
Name of all persons who usually livein this household(as given in col. 2 of sec.1)
18
16
15
9
8
4
3
1
Section 3 -Health 7
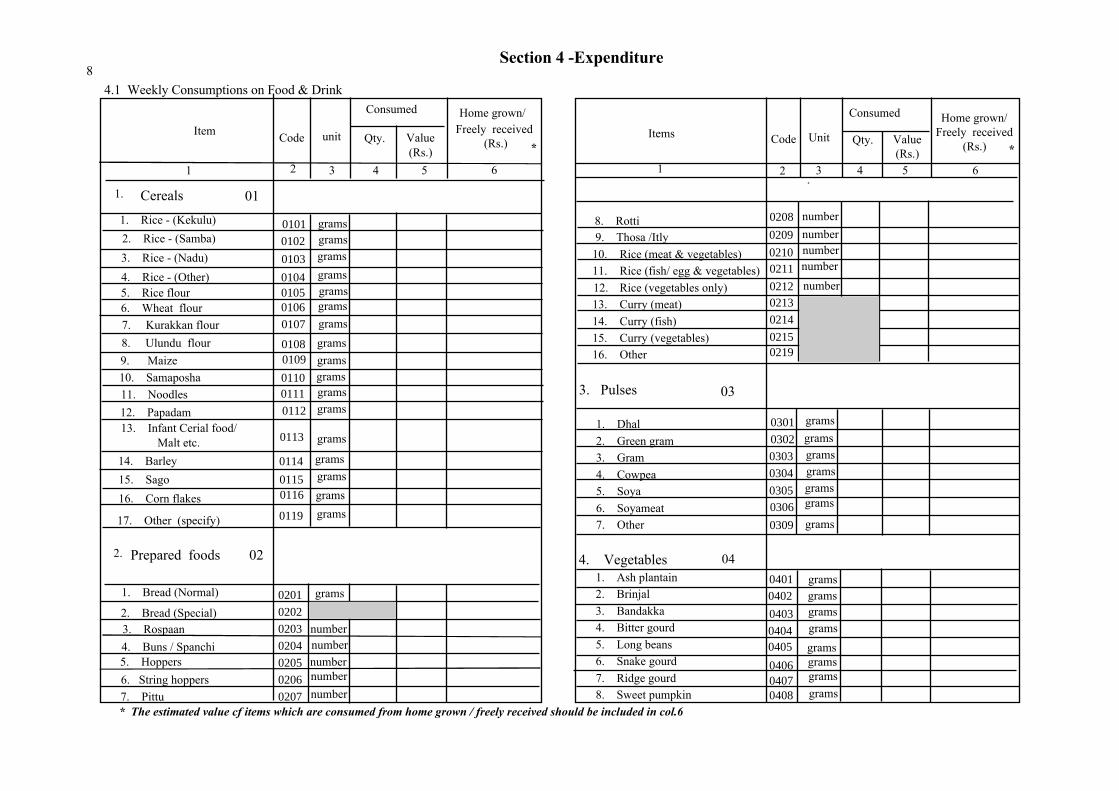
Section 4 -Expenditure
2
0102
0106
0201
0202
0203
0204
0205
0206
0207
1 3 4 5
0119
0115
0114
0113
0116
1 5 66
4.1 Weekly Consumptions on Food & Drink
Item
1. Cereals 011. Rice - (Kekulu)
3. Rice - (Nadu)2. Rice - (Samba)
4. Rice - (Other)5. Rice flour6. Wheat flour7. Kurakkan flour
8. Ulundu flour
11. Noodles12. Papadam13. Infant Cerial food/
Malt etc.14. Barley15. Sago16. Corn flakes
0101
grams
gramsgrams
grams
gramsgramsgramsgramsgramsgramsgrams
grams
gramsgrams
gramsgrams
grams
number
number
02Prepared foods2.
1. Bread (Normal)
2. Bread (Special)
4. Buns / Spanchi5. Hoppers6. String hoppers
*Value(Rs.)
Value(Rs.)
04
Consumed
17. Other (specify)
3. Rospaan
* The estimated value cf items which are consumed from home grown / freely received should be included in col.6
grams
numbernumber
number
9. Maize10. Samaposha
0104
0103
0111
ConsumedFreely received
(Rs.)
4. Vegetables1. Ash plantain2. Brinjal3. Bandakka4. Bitter gourd5. Long beans6. Snake gourd7. Ridge gourd8. Sweet pumpkin
32
gramsgramsgramsgramsgramsgrams
grams
gramsgramsgramsgramsgramsgramsgramsgrams
0401
0403
0402
0405
04070408
0404
4
numbernumbernumbernumbernumber
0208
0209
02100211
0214
0219
0301
0304
0303
0302
03050306
0309
033. Pulses
1. Dhal2. Green gram3. Gram4. Cowpea5. Soya6. Soyameat7. Other
7. Pittu
8. Rotti 9. Thosa /Itly10. Rice (meat & vegetables)11. Rice (fish/ egg & vegetables)
12. Rice (vegetables only)13. Curry (meat)14. Curry (fish)15. Curry (vegetables)16. Other
02130212
0112
0110
01090108
0107
0105
0406
Qty.unitCode Unit Qty.Code*
Home grown/Freely received
(Rs.)
Home grown/
Items
8
0215
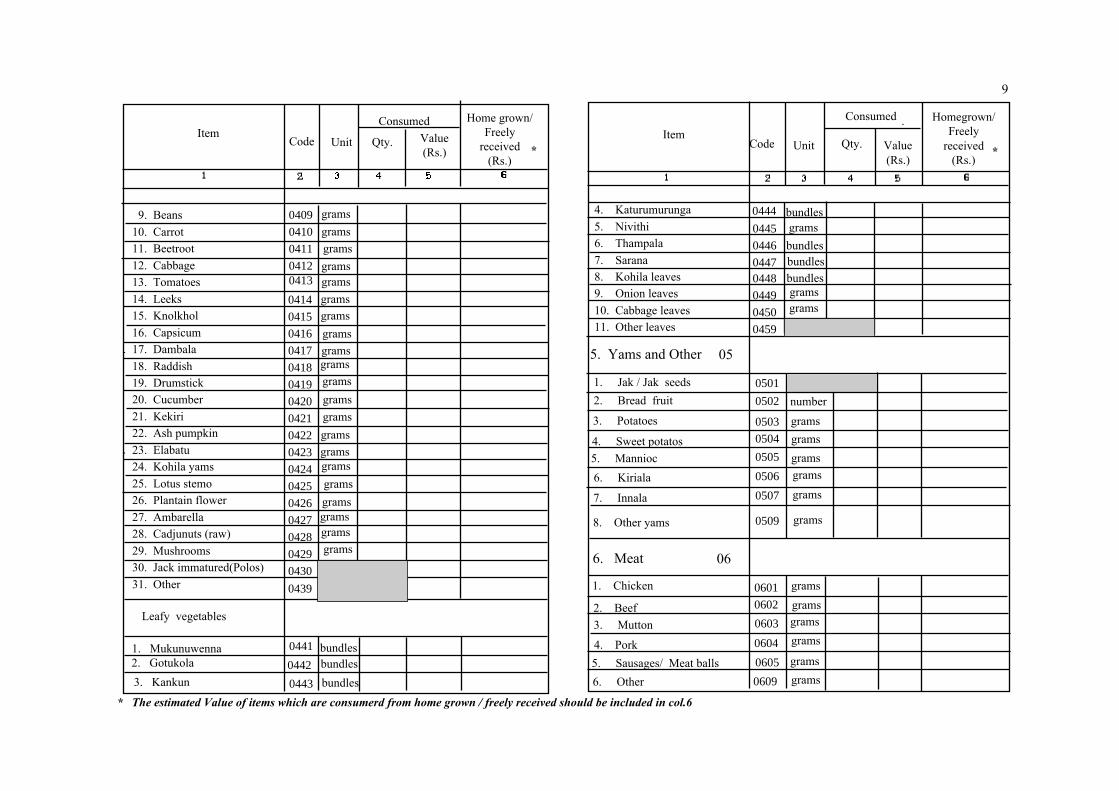
0414
0415
0416
0417
0418
0419
0420
0421
0422
0423
0424
0425
0426
0427
0428
0429
0430
0439
0409
0410
0411
04120413
0445
0446
04470448
0449
0450
0459
0442
0443
0601
0602
0604
0501
0502
0503
0504
0505
0506
0507
0509
0603
0609
0605
0444
06
* The estimated Value of items which are consumerd from home grown / freely received should be included in col.6
* *
ItemCode Unit Qty. Value
(Rs.)
Consumed Home grown/Freely
received(Rs.)
gramsgramsgrams
gramsgramsgramsgrams
gramsgramsgramsgramsgramsgramsgramsgrams
gramsgrams
grams
bundlesbundlesbundles
ItemCode Unit Qty. Value
(Rs.)
Consumed Homegrown/Freely
received(Rs.)
gramsgrams
Leafy vegetables
grams
grams
grams
1. Chicken
2. Beef3. Mutton
5. Sausages/ Meat balls
gramsgramsgrams
grams
bundlesgrams
9. Beans 10. Carrot 11. Beetroot 12. Cabbage 13. Tomatoes 14. Leeks 15. Knolkhol 16. Capsicum 17. Dambala 18. Raddish 19. Drumstick 20. Cucumber 21. Kekiri 22. Ash pumpkin 23. Elabatu 24. Kohila yams 25. Lotus stemo 26. Plantain flower 27. Ambarella 28. Cadjunuts (raw) 29. Mushrooms 30. Jack immatured(Polos) 31. Other
4. Sweet potatos
7. Innala
8. Other yams
4. Pork
5. Mannioc
4. Katurumurunga5. Nivithi6. Thampala7. Sarana8. Kohila leaves9. Onion leaves10. Cabbage leaves11. Other leaves
6. Kiriala
3. Potatoes
2. Bread fruit1. Jak / Jak seeds
5. Yams and Other
6. Meat
05
1. Mukunuwenna 2. Gotukola
3. Kankun
0441
gramsgramsgrams bundles
bundlesbundles
grams
gramsgrams
number
grams
grams6. Other
9
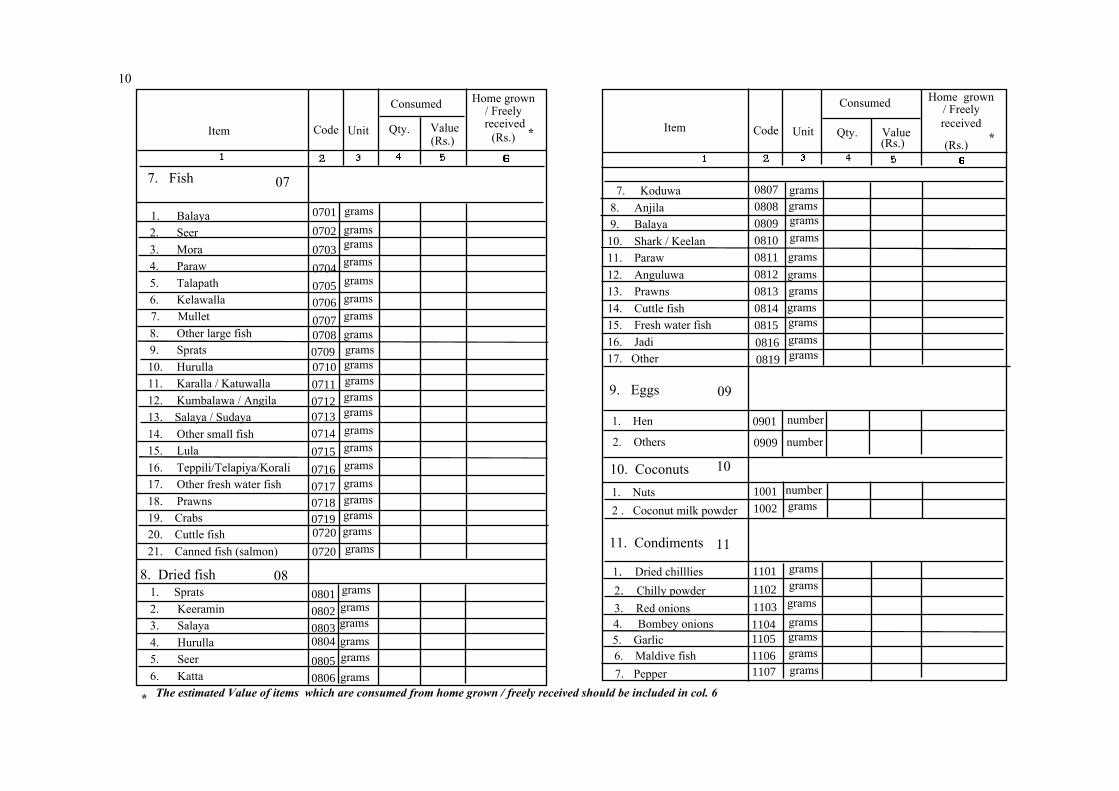
0701
0702
0703
0704
07050706
070707080709
0711
07120713
0714
0715
0716
071707180719
0801
0802
08030804
0805
0806
0807
0808
0710
0809
0810
0811
0812
0813
0814
0815
1101
0901
1001
1002
1106
10
110720
0816
0819
Item Qty.(Rs.)
Unit
07
08
09
Item Code Unit Qty. Value
Home grown/ Freelyreceived
(Rs.)(Rs.)Value
0909
*
7. Fish
1. Balaya2. Seer3. Mora4. Paraw5. Talapath6. Kelawalla
7. Mullet8. Other large fish9. Sprats
10. Hurulla 11. Karalla / Katuwalla 12. Kumbalawa / Angila 13. Salaya / Sudaya 14. Other small fish 15. Lula 16. Teppili/Telapiya/Korali 17. Other fresh water fish 18. Prawns 19. Crabs 20. Cuttle fish 21. Canned fish (salmon)
*
The estimated Value of items which are consumed from home grown / freely received should be included in col. 6 *
gramsgramsgrams
gramsgramsgramsgramsgramsgrams
9. Eggs
10. Coconuts
number
number
numbergrams
grams
gramsgramsgrams
grams
Code
grams
grams
gramsgrams
gramsgramsgramsgramsgramsgramsgramsgramsgramsgrams
gramsgrams
gramsgramsgramsgramsgramsgrams
gramsgrams
gramsgrams
gramsgramsgrams
grams 1107
1102
1103
11051104
7. Koduwa 8. Anjila 9. Balaya 10. Shark / Keelan 11. Paraw 12. Anguluwa 13. Prawns 14. Cuttle fish 15. Fresh water fish 16. Jadi 17. Other
1. Hen
2. Others
1. Nuts2 . Coconut milk powder
2. Chilly powder1. Dried chilllies
4. Bombey onions5. Garlic6. Maldive fish7. Pepper
3. Red onions
Home grown/ Freely
received(Rs.)
Consumed Consumed
8. Dried fish1. Sprats2. Keeramin3. Salaya4. Hurulla5. Seer6. Katta
11. Condiments
10
0720 grams
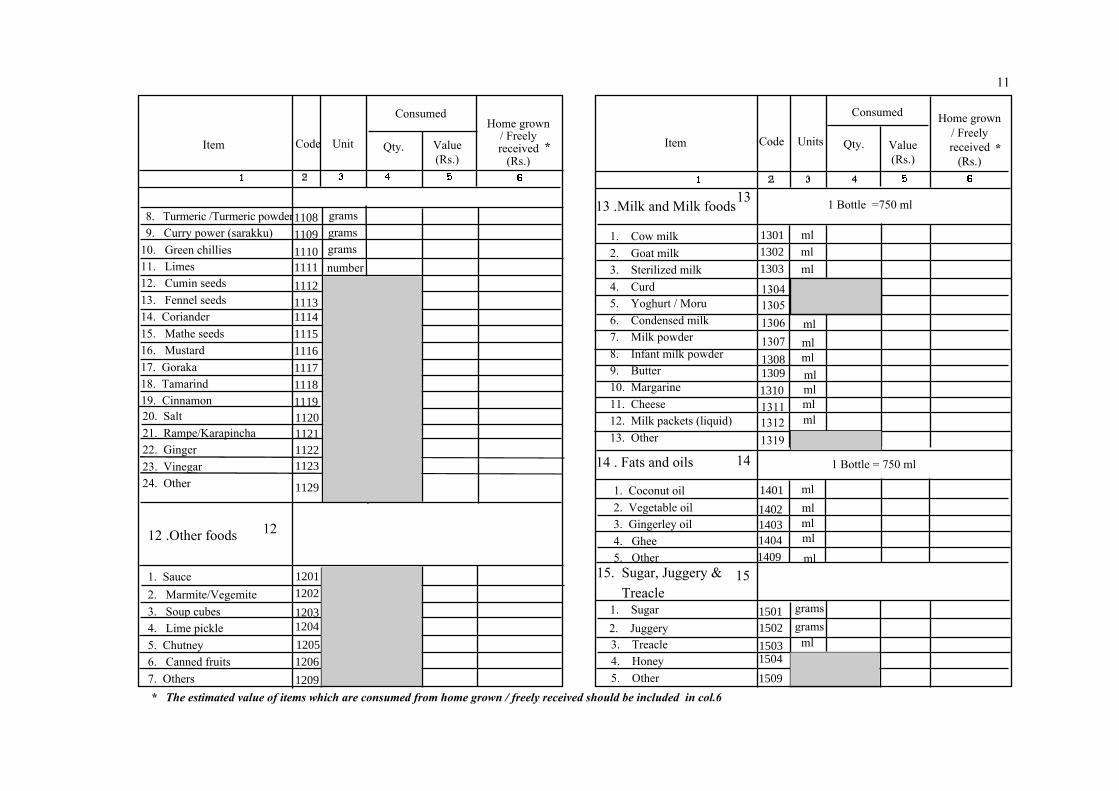
1108
1109
11101111
1112
11131114
1115
1116
1117
1118
11191120112111221123
1129
1203
1205
1206
1209
Code Units
1401
1402140314041409
14
UnitItem ItemQty. Qty. Value(Rs.)
1 Bottle =750 ml
1 Bottle = 750 ml
* The estimated value of items which are consumed from home grown / freely received should be included in col.6
11
* *Value(Rs.)
ConsumedConsumed
ml
3. Treacle 4. Honey 5. Other
15
Code
1201
1202
1204
14 . Fats and oils
Home grown/ Freelyreceived
(Rs.)
Home grown/ Freelyreceived
(Rs.)
numbergramsgramsgrams
mlml
ml
mlmlmlmlml
mlml
mlgramsgrams
mlmlml
ml
1. Coconut oil2. Vegetable oil3. Gingerley oil4. Ghee5. Other
12 .Other foods
1. Sauce2. Marmite/Vegemite3. Soup cubes4. Lime pickle5. Chutney6. Canned fruits7. Others
1313 .Milk and Milk foods
19. Cinnamon
12
15. Sugar, Juggery & Treacle
1509
15041503
15021501
13011302
1303
130413051306130713081309
1310131113121319
2. Juggery1. Sugar
1. Cow milk2. Goat milk3. Sterilized milk4. Curd5. Yoghurt / Moru6. Condensed milk7. Milk powder8. Infant milk powder9. Butter10. Margarine11. Cheese12. Milk packets (liquid)13. Other
8. Turmeric /Turmeric powder9. Curry power (sarakku)
10. Green chillies 11. Limes 12. Cumin seeds 13. Fennel seeds 14. Coriander 15. Mathe seeds 16. Mustard 17. Goraka 18. Tamarind
20. Salt21. Rampe/Karapincha22. Ginger23. Vinegar24. Other
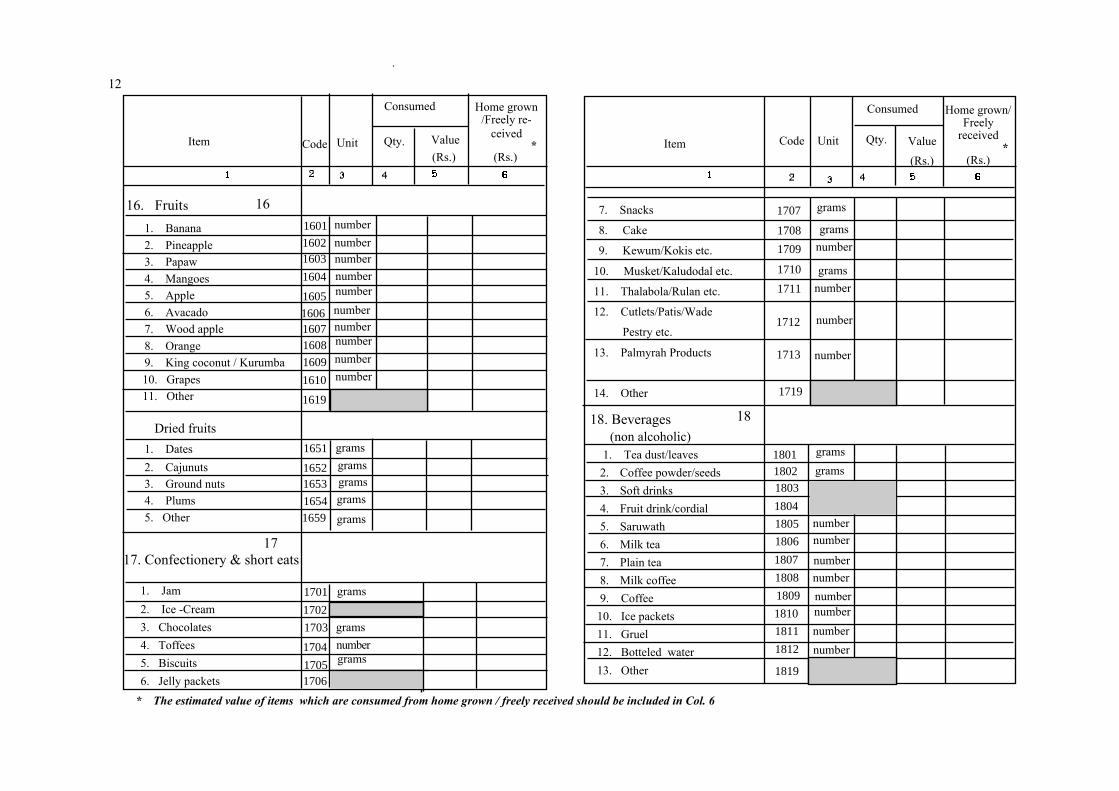
Home grown/Freely re-
ceived
(Rs.)Item
Home grown/Freely
received
(Rs.)
16
1. Jam2. Ice -Cream3. Chocolates4. Toffees5. Biscuits6. Jelly packets
Item
* The estimated value of items which are consumed from home grown / freely received should be included in Col. 6
**Qty. Value(Rs.)
Unit
grams
grams
gramsgramsgramsgrams
grams
grams
number
numbernumber
numbernumbernumbernumber
number
Qty.
grams
grams
Unit
gramsnumber
number
Code
number
gramsgrams
number
numbernumber
numbernumbernumber
numbernumber
Consumed
1. Banana2. Pineapple3. Papaw4. Mangoes5. Apple6. Avacado7. Wood apple8. Orange9. King coconut / Kurumba
10. Grapes 11. Other
number
number
Dried fruits1. Dates2. Cajunuts3. Ground nuts4. Plums5. Other
17
16. Fruits 7. Snacks
8. Cake
9. Kewum/Kokis etc.
10. Musket/Kaludodal etc.
11. Thalabola/Rulan etc.
12. Cutlets/Patis/Wade
Pestry etc.
13. Palmyrah Products
14. Other
1818. Beverages (non alcoholic)
1. Tea dust/leaves 2. Coffee powder/seeds 3. Soft drinks 4. Fruit drink/cordial 5. Saruwath 6. Milk tea 7. Plain tea 8. Milk coffee 9. Coffee10. Ice packets11. Gruel12. Botteled water13. Other
number
1659
1601
16021603
1604
1605
160616071608
1609
1610
1619
1651
16521653
1654
1704
1705
Code
1706
1703
1702
1701
Value(Rs.)
17. Confectionery & short eats
1801
18031802
1804
1805
1806
1810
1809
1808
1807
1811
1812
1819
1711
1710
1712
1713 number
1719
1709
1708
1707
Consumed
12
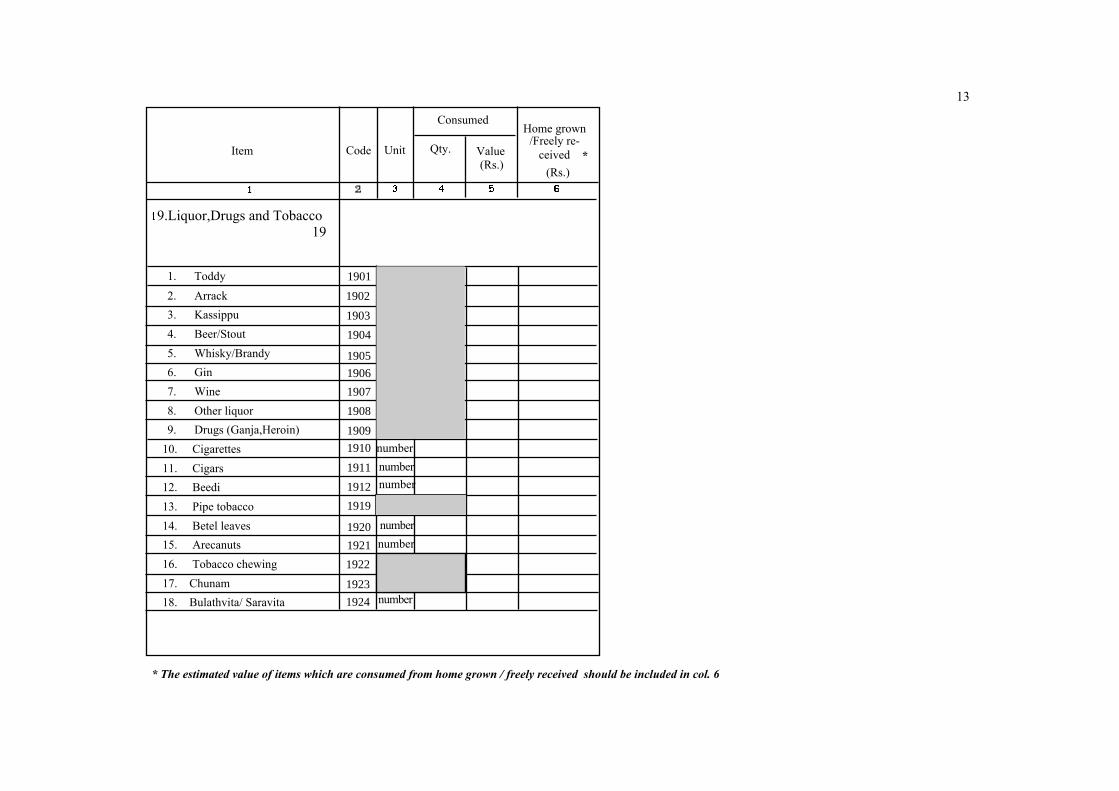
Qty.
1906
1901
1902
1903
1924
1923
1922
1921
1920
1919
1912
1911
1910
1909
1908
1907
1905
1904
number
numbernumber
number
Item(Rs.) (Rs.)
UnitCode
Consumed
number
number
Value *
Home grown/Freely re-
ceived
9.Liquor,Drugs and Tobacco
1. Toddy2. Arrack3. Kassippu4. Beer/Stout5. Whisky/Brandy6. Gin7. Wine8. Other liquor9. Drugs (Ganja,Heroin)
10. Cigarettes 11. Cigars 12. Beedi 13. Pipe tobacco 14. Betel leaves 15. Arecanuts 16. Tobacco chewing 17. Chunam 18. Bulathvita/ Saravita
19
13
* The estimated value of items which are consumed from home grown / freely received should be included in col. 6
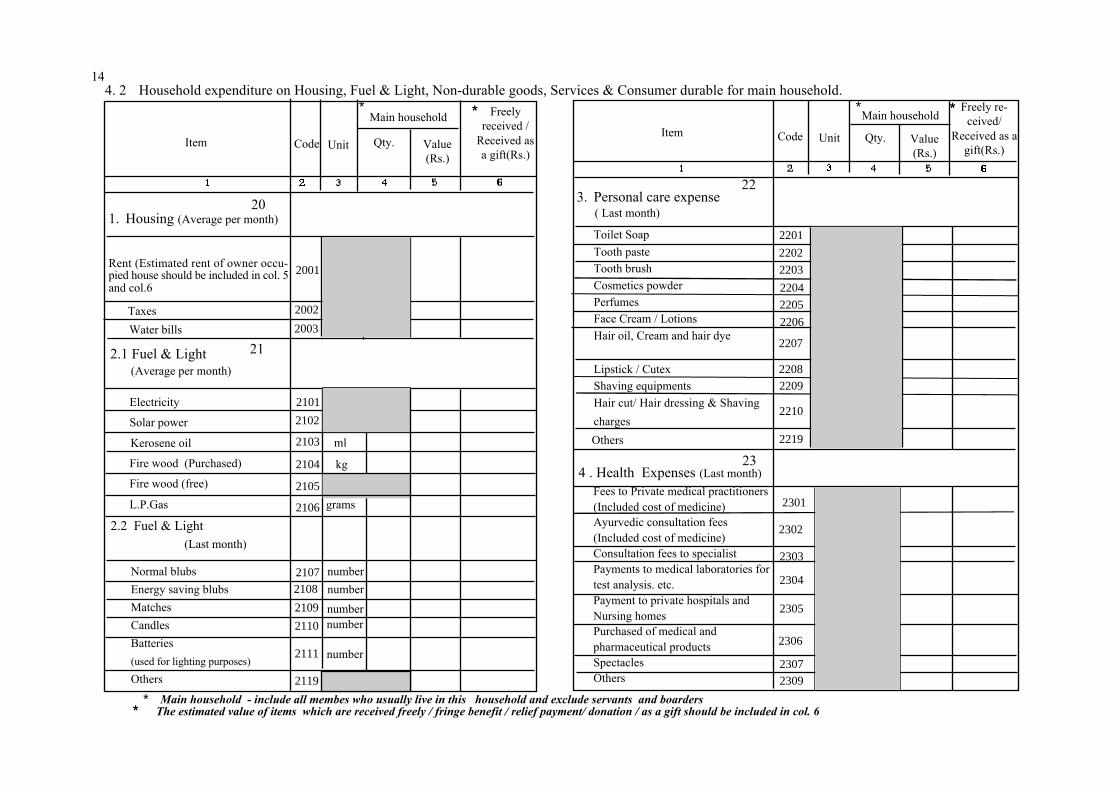
∗∗ The estimated value of items which are received freely / fringe benefit / relief payment/ donation / as a gift should be included in col. 6
Qty.
4. 2 Household expenditure on Housing, Fuel & Light, Non-durable goods, Services & Consumer durable for main household.
Unit Qty.
∗Main household
Item
2101
2103
2201
2202
2203
2204
2205
2206
2207
22082209
2210
2219
2302
2303
2304
2305
2306
23072309
2301
∗
∗∗ ∗
2109
2110
2119
2102
2105
grams
kg
2106
2104
2111
2107
(Last month)2.2 Fuel & Light
Main household
UnitCodeItemCode
numbernumbernumbernumber
number
20
23
Freelyreceived /
Received asa gift(Rs.)
Value(Rs.)
Value(Rs.)
1. Housing (Average per month)
Rent (Estimated rent of owner occu-pied house should be included in col. 5and col.6
2.1 Fuel & Light 21
Fees to Private medical practitioners (Included cost of medicine) Ayurvedic consultation fees (Included cost of medicine) Consultation fees to specialist Payments to medical laboratories for test analysis. etc. Payment to private hospitals and Nursing homes Purchased of medical and pharmaceutical products Spectacles Others
Main household - include all membes who usually live in this household and exclude servants and boarders
3. Personal care expense ( Last month)
4 . Health Expenses (Last month)
(Average per month)
∗∗Freely re-ceived/
Received as agift(Rs.)
Toilet SoapTooth pasteTooth brushCosmetics powderPerfumesFace Cream / LotionsHair oil, Cream and hair dye
Lipstick / CutexShaving equipmentsHair cut/ Hair dressing & Shavingcharges
Others
22
Electricity
Solar power
Kerosene oil
Fire wood (Purchased)
Fire wood (free)
L.P.Gas
TaxesWater bills
Normal blubsEnergy saving blubsMatchesCandlesBatteries(used for lighting purposes)Others
2001
2002
2003
14
ml
2108
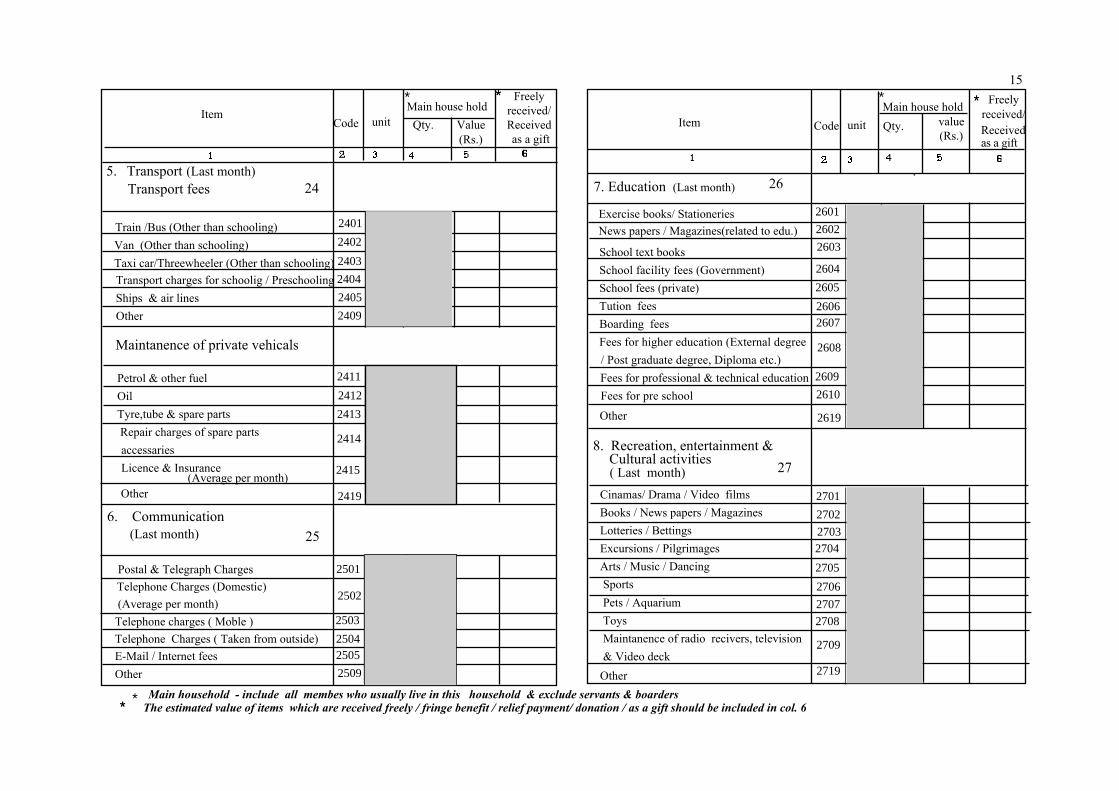
Item∗∗
∗
5. Transport (Last month) Transport fees
ItemMain house holdQty. Value
(Rs.)unit
2401
2402
2403
2404
2405
2409
Code
2411
2412
2413
2414
2415
2501
2502
2503
2504
2509
(Average per month)
27032704
2705
2707
2708
2709
2719
value(Rs.)
unitCode
24
2419
25
∗∗ The estimated value of items which are received freely / fringe benefit / relief payment/ donation / as a gift should be included in col. 6
26
Qty.
2702
∗∗
Train /Bus (Other than schooling) Van (Other than schooling) Taxi car/Threewheeler (Other than schooling)
Maintanence of private vehicals
Transport charges for schoolig / Preschooling Ships & air lines Other
Other
6. Communication (Last month)
Postal & Telegraph ChargesTelephone Charges (Domestic)
(Average per month) Telephone charges ( Moble ) Telephone Charges ( Taken from outside) E-Mail / Internet fees Other
∗ ∗
Main household - include all membes who usually live in this household & exclude servants & boarders
8. Recreation, entertainment & Cultural activities ( Last month) 27
Petrol & other fuelOilTyre,tube & spare parts
Repair charges of spare parts accessaries Licence & Insurance
2701
2706
Main house hold Freelyreceived/Receivedas a gift
Freelyreceived/Received as a gift
Cinamas/ Drama / Video films Books / News papers / Magazines Lotteries / Bettings Excursions / Pilgrimages Arts / Music / Dancing Sports Pets / Aquarium Toys Maintanence of radio recivers, television & Video deck Other
7. Education (Last month)
15
Exercise books/ StationeriesNews papers / Magazines(related to edu.)
School text booksSchool facility fees (Government)School fees (private)Tution feesBoarding feesFees for higher education (External degree
/ Post graduate degree, Diploma etc.) Fees for professional & technical education Fees for pre school
Other
2602
2619
2609
2608
26072606
2605
2604
2601
2603
2610
2505
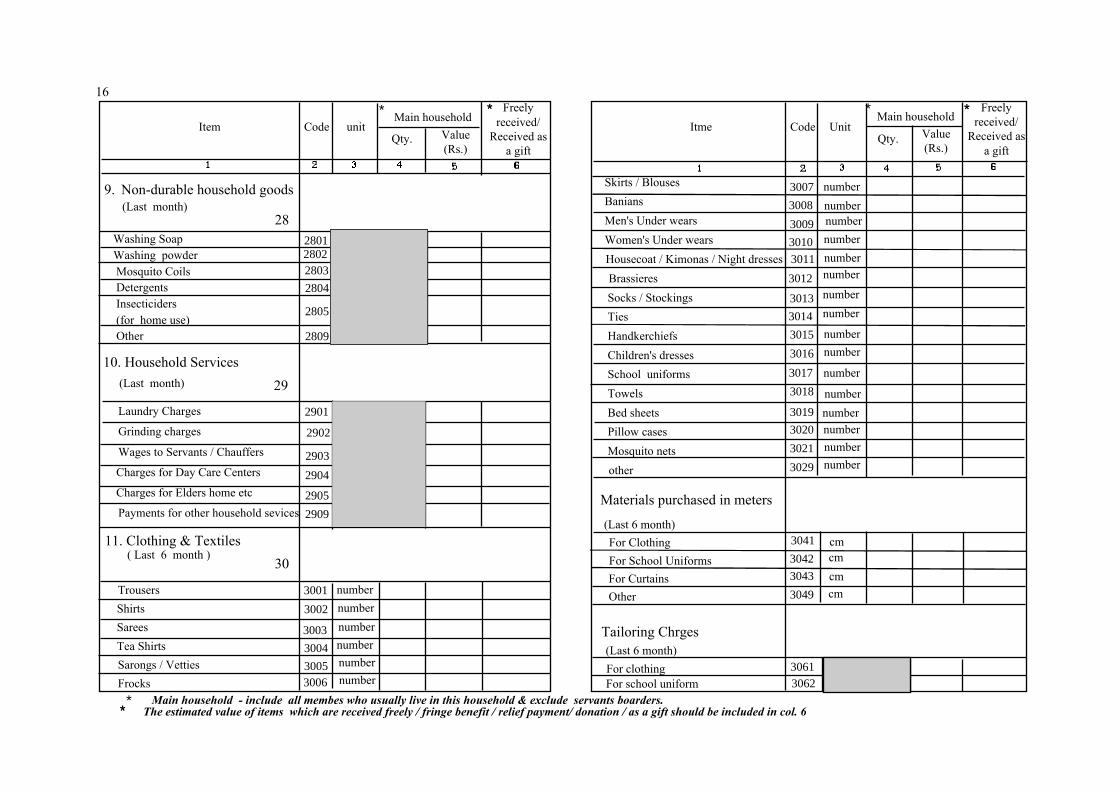
Item Code unitQty. Value
(Rs.)
Itme Code UnitQty.
∗ ∗
3002
3003
3004
3005
3042
3043
3049
3016
3029
28012802
3001
3006
Skirts / BlousesBaniansMen's Under wearsWomen's Under wears
3011
3017
3015
3014
3013
3012
3018
3019
3020
3021
3041
3007
3010
3009
3008
30613062
∗∗Main householdValue(Rs.)
2804
2805
∗∗
2809
Freelyreceived/
Received asa gift
numbernumbernumbernumbernumbernumber
Freelyreceived/
Received asa gift
Main household
number
number
numbernumber
numbernumber
number
numbernumbernumbernumbernumber
Housecoat / Kimonas / Night dresses Brassieres
Socks / StockingsTiesHandkerchiefsChildren's dressesSchool uniformsTowelsBed sheetsPillow casesMosquito nets
other
(Last 6 month) For Clothing For School Uniforms For Curtains Other
Tailoring Chrges (Last 6 month)
2910. Household Services (Last month)
For school uniform For clothing
numbernumber
numbernumber
∗∗∗ The estimated value of items which are received freely / fringe benefit / relief payment/ donation / as a gift should be included in col. 6
TrousersShirtsSareesTea Shirts
Sarongs / Vetties Frocks
cmcmcm
Main household - include all membes who usually live in this household & exclude servants boarders.
28
9. Non-durable household goods (Last month)
Washing Soap Washing powder Mosquito Coils Detergents Insecticiders (for home use) Other
Laundry Charges
Grinding charges
Wages to Servants / Chauffers
Charges for Day Care Centers
Charges for Elders home etc
Payments for other household sevices
11. Clothing & Textiles ( Last 6 month )
Materials purchased in meters
16
cm
30
2901
2902
2903
2909
2904
2905
2803
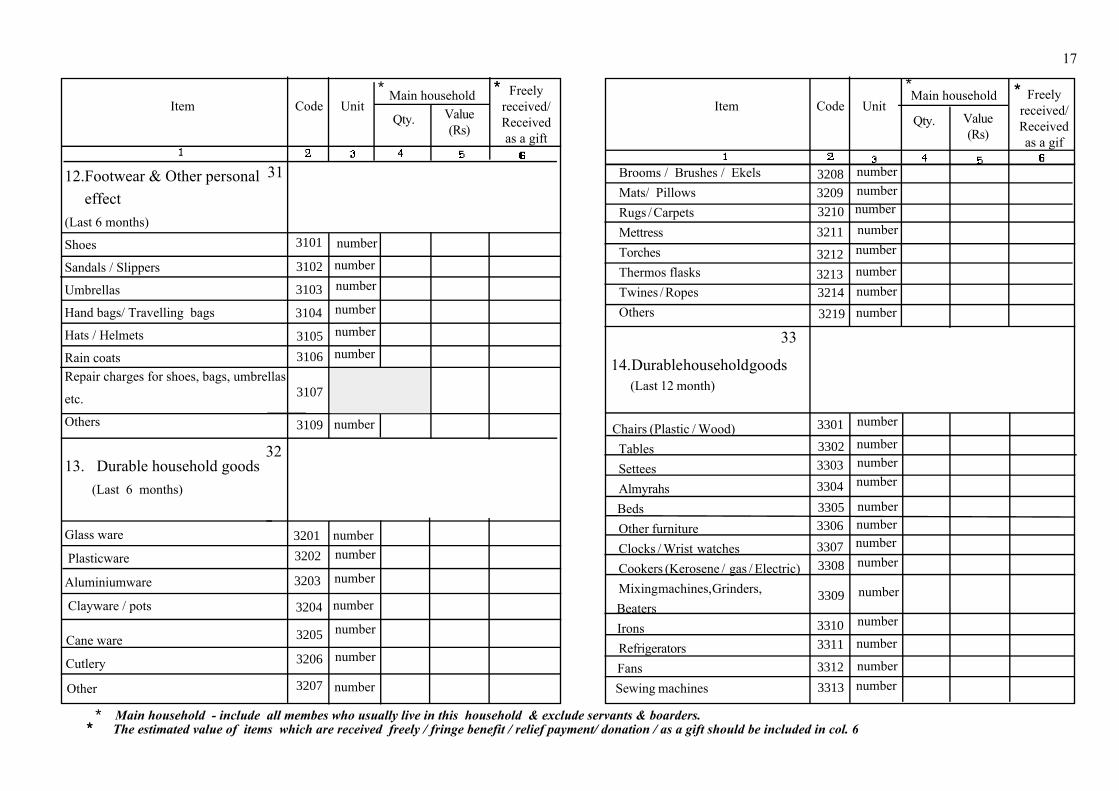
Repair charges for shoes, bags, umbrellas
etc.
Others
13. Durable household goods (Last 6 months)
Glass ware
Plasticware
Aluminiumware
Value(Rs)
Item Code UnitQty.
Item Code Unit∗
3101
3102
3103
3105
3210
3211
3212
32133214
3219
3302
3303
3301
3305
3106
3304
3306
3307
3308
3310
3311
3313
3107
3104
3109
3205
3206
3207
3209
3312
3208
Main household ∗∗
3309
∗∗
Value(Rs)
Qty.
Main household
∗
Freelyreceived/Receivedas a gift
number
numbernumber
number
number
number
number
numbernumber
number
number
number
number
number
numbernumbernumbernumbernumbernumbernumbernumber
number
number
numbernumbernumber
number
number
number
number
number
numbernumber
∗∗ The estimated value of items which are received freely / fringe benefit / relief payment/ donation / as a gift should be included in col. 6
31
32
33
number
Cane ware
Cutlery
Other
Clayware / pots
14. Durable household goods (Last 12 month)
Main household - include all membes who usually live in this household & exclude servants & boarders.
12.Footwear & Other personal effect(Last 6 months)
Shoes
Sandals / Slippers
Umbrellas
Hand bags/ Travelling bags
Hats / Helmets
Rain coats
3201
3202
3203
3204
Freelyreceived/Receivedas a gif
∗
Brooms / Brushes / EkelsMats/ PillowsRugs / CarpetsMettressTorchesThermos flasksTwines / RopesOthers
17
Chairs (Plastic / Wood)TablesSetteesAlmyrahs
BedsOther furnitureClocks / Wrist watchesCookers (Kerosene / gas / Electric)Mixing machines, Grinders,
Beaters Irons
Refrigerators Fans Sewing machines
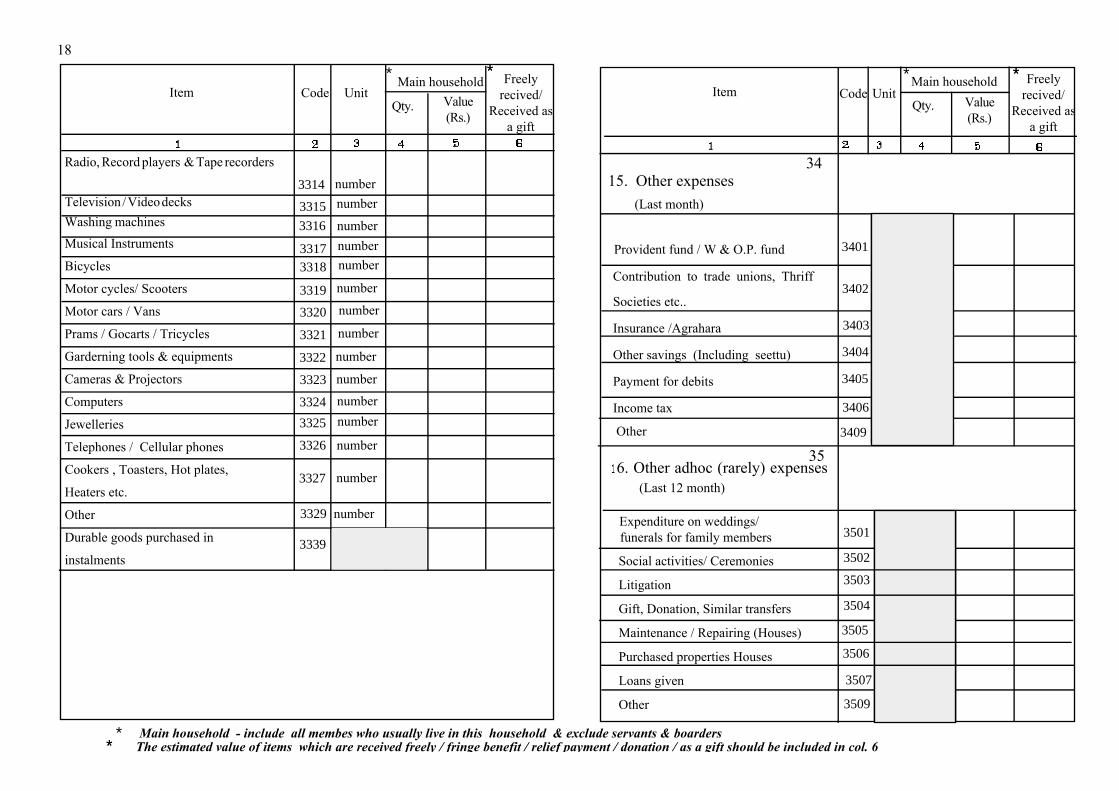
18
Value(Rs.)
Item Code UnitQty.
Item∗∗ ∗
Qty.
Main household ∗∗
Value(Rs.)
∗
Contribution to trade unions, Thriff
Societies etc..
Insurance /Agrahara
Other savings (Including seettu)
Payment for debits
Income tax
Freelyrecived/
Received asa gift
Main household∗
number
numbernumbernumber
number
number
number
number
number
numbernumber
number
number
Other
3401
number34
15. Other expenses (Last month)
Provident fund / W & O.P. fund
Expenditure on weddings/ funerals for family members
Main household - include all membes who usually live in this household & exclude servants & boarders
356. Other adhoc (rarely) expenses
(Last 12 month)
3409
3406
3405
3404
3402
3501
3509
number
∗∗ The estimated value of items which are received freely / fringe benefit / relief payment / donation / as a gift should be included in col. 6
Freelyrecived/
Received asa gift
3315
3316
33173318
3319
3320
3321
3322
3323
3324
3325
3326
3327
3329
3339
3403
Radio, Record players & Tape recorders
Television / Video decksWashing machinesMusical Instruments
Bicycles
Motor cycles/ Scooters
Motor cars / Vans
Prams / Gocarts / Tricycles
Garderning tools & equipments
Cameras & Projectors
Computers
Jewelleries
Telephones / Cellular phones
Cookers , Toasters, Hot plates,
Heaters etc.
Other
Durable goods purchased in
instalments
3314
UnitCode
Social activities/ Ceremonies
Litigation
Gift, Donation, Similar transfers
Maintenance / Repairing (Houses)
Purchased properties Houses
Loans given
Other
3505
3507
3506
3504
3503
3502
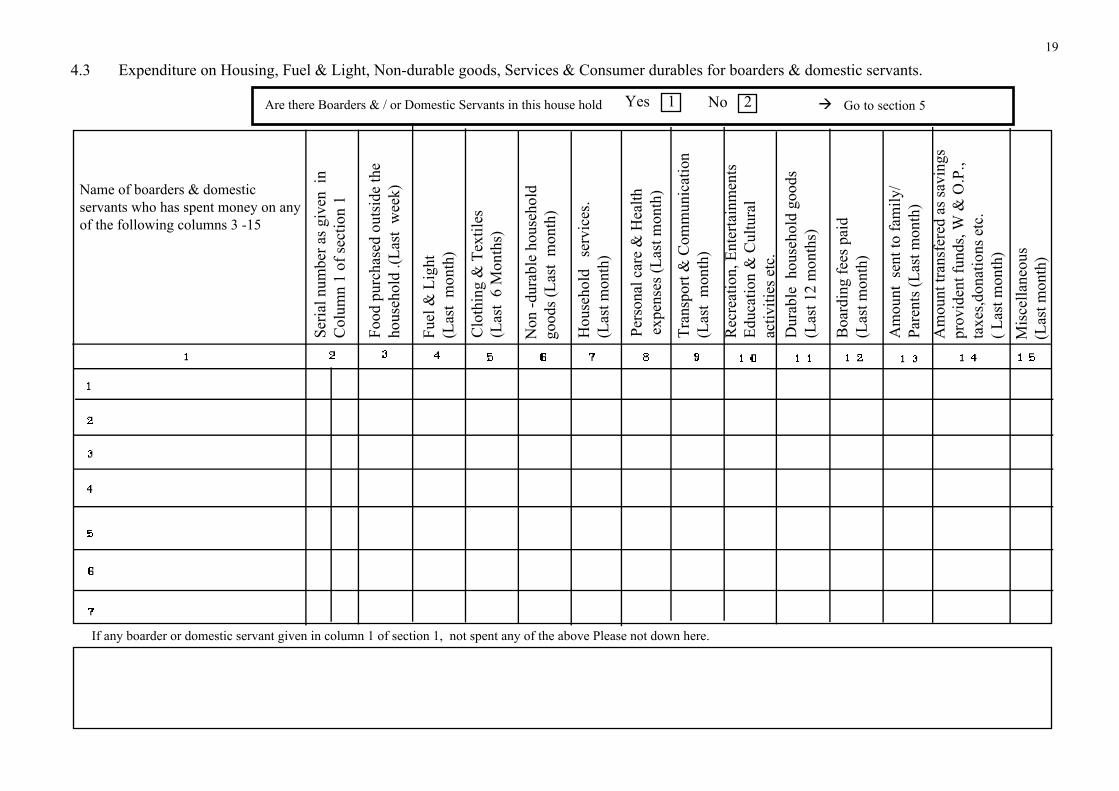
Name of boarders & domesticservants who has spent money on anyof the following columns 3 -15
4.3 Expenditure on Housing, Fuel & Light, Non-durable goods, Services & Consumer durables for boarders & domestic servants.
If any boarder or domestic servant given in column 1 of section 1, not spent any of the above Please not down here.
NoYes 1 2Are there Boarders & / or Domestic Servants in this house hold à Go to section 5
Am
ount
sen
t to
fam
ily/
Pare
nts (
Last
mon
th)
Boa
rdin
g fe
es p
aid
(Las
t mon
th)
Tran
spor
t & C
omm
unic
atio
n(L
ast
mon
th)
Non
-dur
able
hou
seho
ldgo
ods (
Last
mon
th)
Fuel
& L
ight
(Las
t m
onth
)
Food
pur
chas
ed o
utsi
de th
eho
useh
old
.(Las
t w
eek)
Seria
l num
ber a
s giv
en i
nC
olum
n 1
of se
ctio
n 1
Clo
thin
g &
Tex
tiles
(Las
t 6
Mon
ths)
Hou
seho
ld
serv
ices
.(L
ast m
onth
)
Pers
onal
car
e &
Hea
lthex
pens
es (L
ast m
onth
)
Dur
able
hou
seho
ld g
oods
(Las
t 12
mon
ths)
Rec
reat
ion,
Ent
erta
inm
ents
Educ
atio
n &
Cul
tura
lac
tiviti
es e
tc.
Mis
cella
neou
s(L
ast m
onth
)
19
Am
ount
tran
sfer
ed a
s sav
ings
prov
iden
t fun
ds, W
& O
.P.,
taxe
s,don
atio
ns e
tc.
( Las
t mon
th)
20
1
List all household members (usually live in thishousehold ) including boarders & domestic servantswho were paid employees during last four weeks /last calendar month
(Rs.)
5.1 Income from paid employments / During last weeks / Last calendar month
(Rs.) (Rs.)
Main 1
Secondary 2
Secondary occupationPrincipal /
Did any of the household members (usually live) engage as an employee during last 4 weeks / last calendar month
Yes
Section 5 - Income
Last month
2 à go to section 5.2 No
Seria
l num
ber a
s giv
enin
Col
umn
1 of
sect
ion
1
Wages /Salaries
Tips,CommissionsOvertime payetc.
Bonus, ArrearsPayment
Last 12 months
Hired LabourSeedsFertilizerChemicals
Transport / Tractor Other
21
Last Cultivation year-
Last two cultivation seasons
(yala / Maha or Maha / yala)
**
Did any of the household members cultivate paddy, other seasonal crops as an employer or own account worker for sale and / or household consumption during last cultivation year.
Total
5.2 Income from agricultural activities - (Paddy, Other seasonal crops)
** Last cultivation yearList all household members (usually live) includingboarders & domestic servants who have cultivatedpaddy & / or other seasonal crops as employers or ownaccount workers.
* *
Yes 1 No 2 à 5 go to section 5.3
Value ofamount
Consumedby this
household(Rs.)
+ Code for column 3Paddy............................................1Chillies. ........................................2Onions ..........................................3Vegetables....................................4Cereals..........................................5Yams........ ...................................'6Tobacco........................................7Other.... ........................................9
Value ofoutput(Rs.)
* Cost
(Rs.)
Paddy / Otherseasonal crops
( Describe)
Serialnumberas given
incolumn 1
ofsection 1
Cod
e
+
Cultivatedarea
*
Hired labourSeedsFertilizerChemicalsTransport/ Tractor chargesOther
Fish .......................................06
5.3 Income from other agricultural activities.
31 4
Tea , Rubber ............................01Coconuts .................................02Coffee, Pepper Betel etc.........03Banana / Fruits ........................04Meat ........................................05
*
2
List all household members (usually live)including boarders & domestic servants whohave engaged any other agricultural activites /Livestock as employers or own account workers
Not necessary for cultivated area under the codes from 05-10 in column 4.
Last month / Average per month
Value ofOut put
Did any of the household members engage in other agricultural activities /Livestock as an employer or own account worker for sale during last 12 months
*
Milk.......................................08Other food items....................09Horticulture...........................10Other.....................................19
5 6 7 8 9
Yes No à
+
1
9
10'
Total
Codes for column+ Eggs ..................................07
Serialnumberas given
incolumn
1 ofsection 1
Agricultural product(Describe) C
ode Cost
(Rs.) (Rs.)
5
7
8
2
34
6
22
Cultivated area
go to section 5.4
23
Economic activity(Describe)
*
*
Last calendar month
à
Did any of the household members engage in any non- agricultural activities as an employer or own account worker for sale during last calendar month.
Hired labour
Inputs
Transport
Other
Total
List all household members (usually live)including boarders & domestic servants whohave engaged Non- agricultural activities asemployers or own account workers.
Yes 1 No; 2 go to section 5.5.1
+ Codes for coloumn 3Mining & Quarrying. ....................................1Manufacturing.... ..........................................2Construction. ................................................3Trade.............................................................4Transport. .....................................................5Guest house, restaurants, bars , hotels etc..................................................6Other services.. .............................................7
5.4 Income From Non- agricultural activities
Cod
e
+
Value ofoutput
Cost
(Rs.) (Rs.)
Serialnumber asgiven in
coloumn 1of section
1
5.5.2 Income by Chance or adhoc gains during last 12 months
24
5.5.1. Income from Other cash receipt during last calendar month / last 12 month
Income form last calendar month
withinthe
Country
outsidethe country
Last 12 month
(Rs.) (Rs.) (Rs.) (Rs.) (Rs.) (Rs.) (Rs.) (Rs.)
(Rs.) (Rs.) (Rs.) (Rs.) (Rs.) (Rs.)
Yes 1 No 2 à go to section 6
yes 1 No 2 go to 5.5.2à
Seria
l num
ber a
sgi
ven
in c
olum
n 1
of s
ectio
n 1
Current remittance& transfers
Seria
l num
ber a
sgi
ven
in c
olom
n 1o
fse
ctio
n 1
(Rs.)
Withdrawal fromsavings & bank
deposits.
Sales of assets(Land , house,
jewellary)
Loans takenfrom banks/
moneylenders etc.
Seettu /Repayments
of loansgiven
Compersationhealth /
insurance etc
Otherlottery &
other adhocgains
List all household members (usually live)excluding boarders & servants who havereceived income by chance or rarely.
List all household members (usually live)including boarders & servants who havereceived any other cash receipt.
PensionPayment
Disability/relief
payments
SamurdhiRents fromproperties/
boarding feesetc.
Dividents /Interests
Other
Incomereceives frombirths, deaths,
marriages /welfare
society, etc
Code
Section 6A - Inventry of durable goods Have - 1 Have not - 2
50125013501450155016
50175018501950205021
50225023
Items
Household EquipmentsRadio / Cassette playerTelevisionV.C.D. / D.V.D.Sewing machinesWashing machinesRefrigeratorsCookers ( Gas, Kerosene, Electric)Electric fansTelephone (Domestic)Telephone (mobile)Personal Computers
For Transport purposeBicyclesMotor cycles / ScootersThree wheelersMotor cars / VansBus / Lorry
Agricultural EquipmentsTractors (Two wheel)Tractors (Four wheel)SprayersThreshersWater pumps (Only for agricultural purpose)
Fishing EquipmentsBoatsFishing nets
50015002500350045005500650075008500950105011
25
Debited toHave any of the household
members debited to the followingsYes -1 go to col. 3
1 2 3
No -2
(Departments ,Boards , Private Companies etc.)
5 Retail outlets
6 Sales of assets (Land , houses, jewelleries etc.)
7 Durable goods purchased in instalments
9 Other (Specify)
Amount to pay(Rs.)
4 Money Lenders
1 Banks (Government / Private)
2 Finance Companies / Leasing Companies
3 Own Place of work
26
Section 6 B . Debts (Excluding boarders & Servants)
Place of FacilitsSerialNo.
01
02
03
04
05
06
07
08
09
10
11
12
13
1. Do you have electricity supply (main line) nearby your area. .........................................................................2. Do you have telephone facilities in your area. .................................................................................................3. Do you have pipe borne line (main line) nearby your area ..............................................................................
Section 7.1
Section -7.2
Section 7 - Access to facilities
Bus Halt (nearest)
Pre school / Montessori
Primary School
Maha Vidyalaya/ M.M.V. / Jathika Pasala
Base Hospital / Teaching Hospital /District Hospital
Maternity Home
Government Dispensary
Private Dispensary
Clinic (Maternity / Infancy)
M.O.H. office
M.C. / U.C. / P. S.
Divisional Secretariat office
G.N.Office
14 Post office / Sub post office
15 Bank (Govt. / Private)
16 Agrarian Service Center
NoYes
Distance from yourhouse to this closestfacility(km)
Time taken from yourhouse to this closestfacility(Minutes)
27
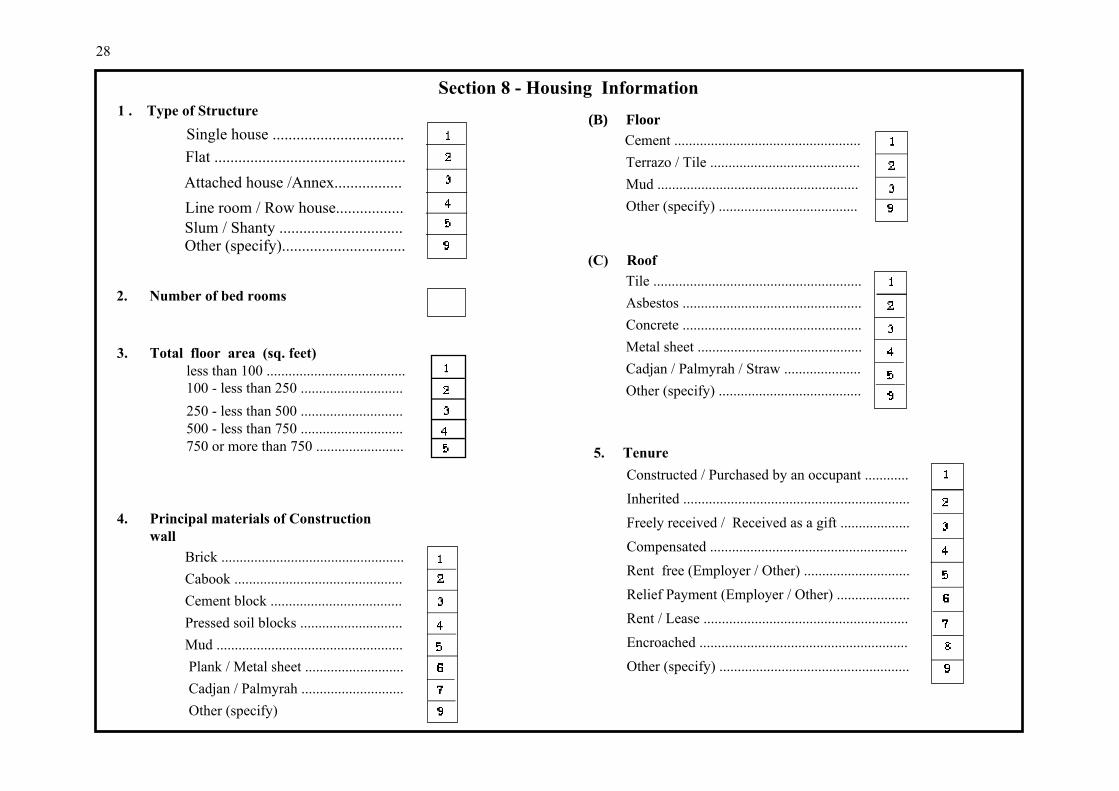
2. Number of bed rooms
1 . Type of Structure
4. Principal materials of Construction wall
Brick ..................................................Cabook ..............................................Cement block ....................................Pressed soil blocks ............................Mud ................................................... Plank / Metal sheet ........................... Cadjan / Palmyrah ............................ Other (specify)
Section 8 - Housing Information
(B) FloorCement ...................................................Terrazo / Tile .........................................Mud .......................................................Other (specify) ......................................
Slum / Shanty ............................... Other (specify)...............................
Line room / Row house................. Attached house /Annex.................
(C) Roof Tile ......................................................... Asbestos ................................................. Concrete ................................................. Metal sheet ............................................. Cadjan / Palmyrah / Straw ..................... Other (specify) .......................................
Single house .................................Flat ................................................
5. Tenure Constructed / Purchased by an occupant ............ Inherited .............................................................. Freely received / Received as a gift ................... Compensated ...................................................... Rent free (Employer / Other) ............................. Relief Payment (Employer / Other) .................... Rent / Lease ........................................................ Encroached ......................................................... Other (specify) ....................................................
250 - less than 500 ............................ 500 - less than 750 ............................ 750 or more than 750 ........................
3. Total floor area (sq. feet) less than 100 ...................................... 100 - less than 250 ............................
28
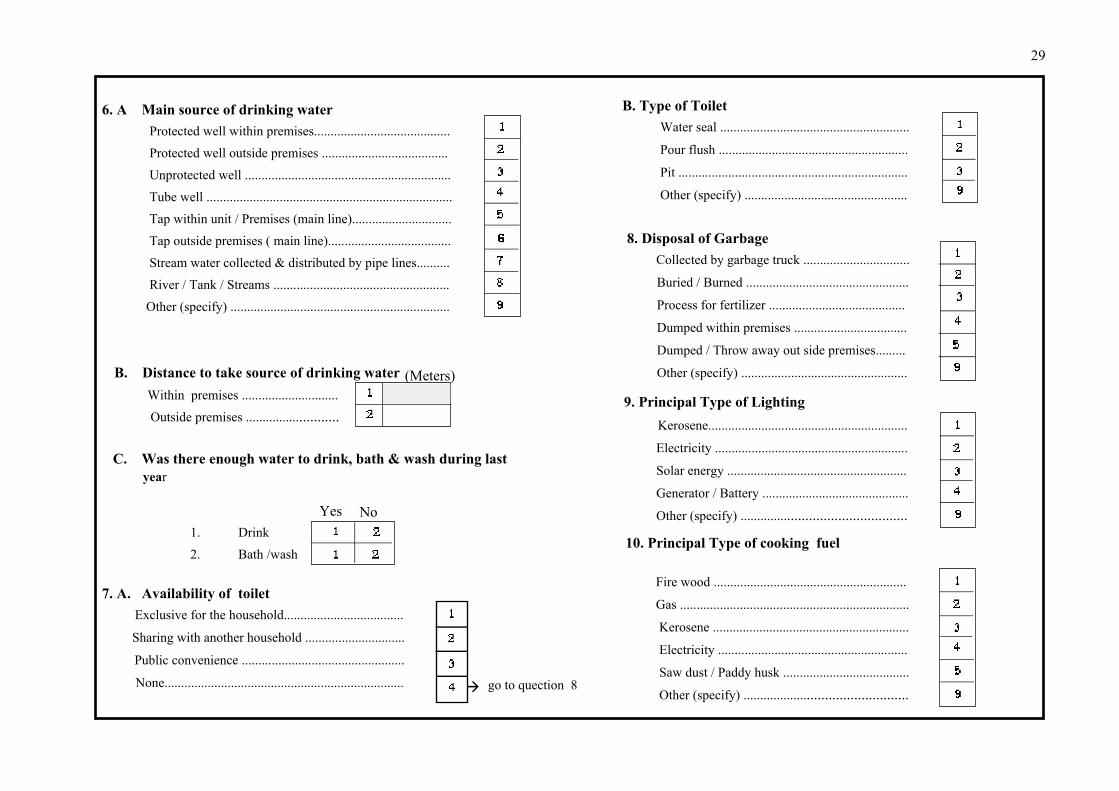
go to quection 8
9. Principal Type of Lighting
6. A Main source of drinking water Protected well within premises.........................................
Protected well outside premises ......................................
Unprotected well ..............................................................
Tube well ..........................................................................
Tap within unit / Premises (main line)..............................
Tap outside premises ( main line).....................................
Stream water collected & distributed by pipe lines..........
River / Tank / Streams .....................................................
Other (specify) ..................................................................
NoYes
C. Was there enough water to drink, bath & wash during last year
1. Drink
2. Bath /wash
7. A. Availability of toilet Exclusive for the household....................................
Sharing with another household ..............................
Public convenience .................................................
None........................................................................
B. Type of ToiletWater seal .........................................................
Pour flush .........................................................
Pit .....................................................................
Other (specify) .................................................
8. Disposal of Garbage Collected by garbage truck ................................
Buried / Burned .................................................
Process for fertilizer .........................................
Dumped within premises ..................................
Dumped / Throw away out side premises.........
Other (specify) ..................................................
Kerosene............................................................
Electricity ..........................................................
Solar energy ......................................................
Generator / Battery ............................................
Other (specify) ...............................................
(Meters) B. Distance to take source of drinking water Within premises .............................
Outside premises ...........................
10. Principal Type of cooking fuel
Fire wood ..........................................................
Gas .....................................................................
Kerosene ...........................................................
Electricity .........................................................
Saw dust / Paddy husk ......................................
Other (specify) ...............................................
29
à
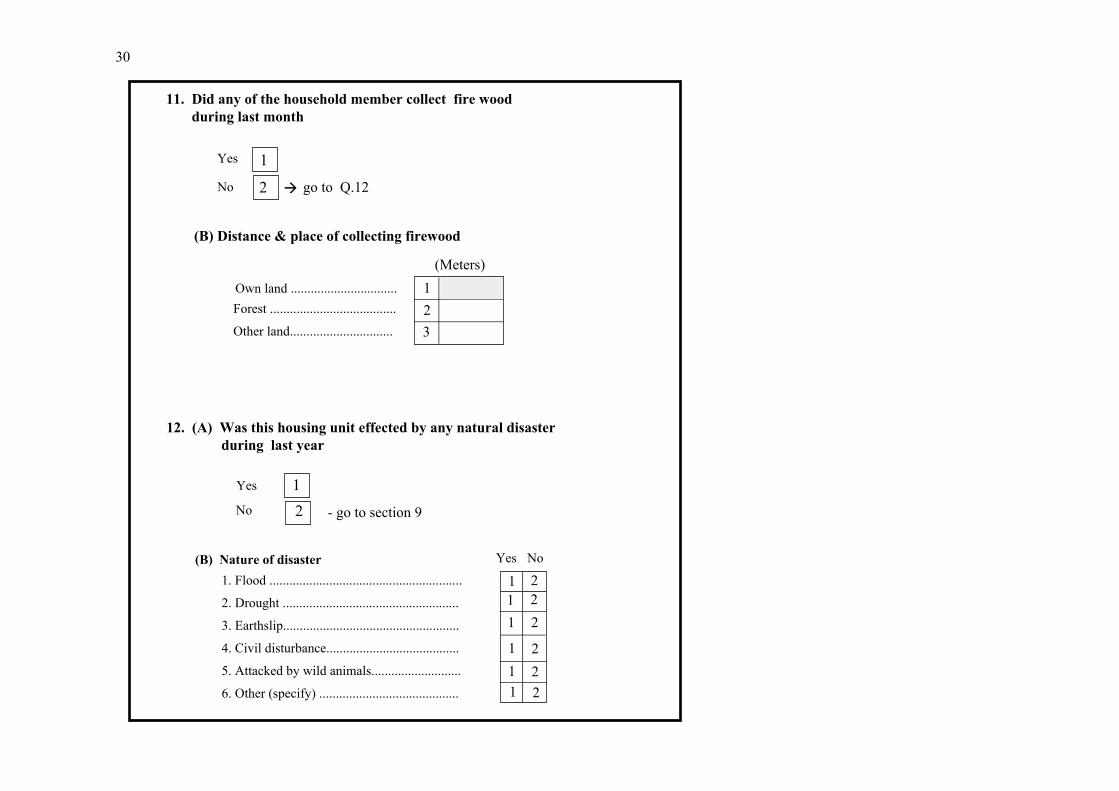
(B) Nature of disaster1. Flood ..........................................................
2. Drought .....................................................
3. Earthslip.....................................................
4. Civil disturbance........................................
5. Attacked by wild animals...........................
6. Other (specify) ..........................................
222
22
111
11
à
123
go to Q.12
21
2
1
(B) Distance & place of collecting firewood
Own land ................................ Forest ......................................
Other land...............................
(Meters)
- go to section 9
12. (A) Was this housing unit effected by any natural disaster during last year
Yes
No
12
11. Did any of the household member collect fire wood during last month
Yes
No
NoYes
30
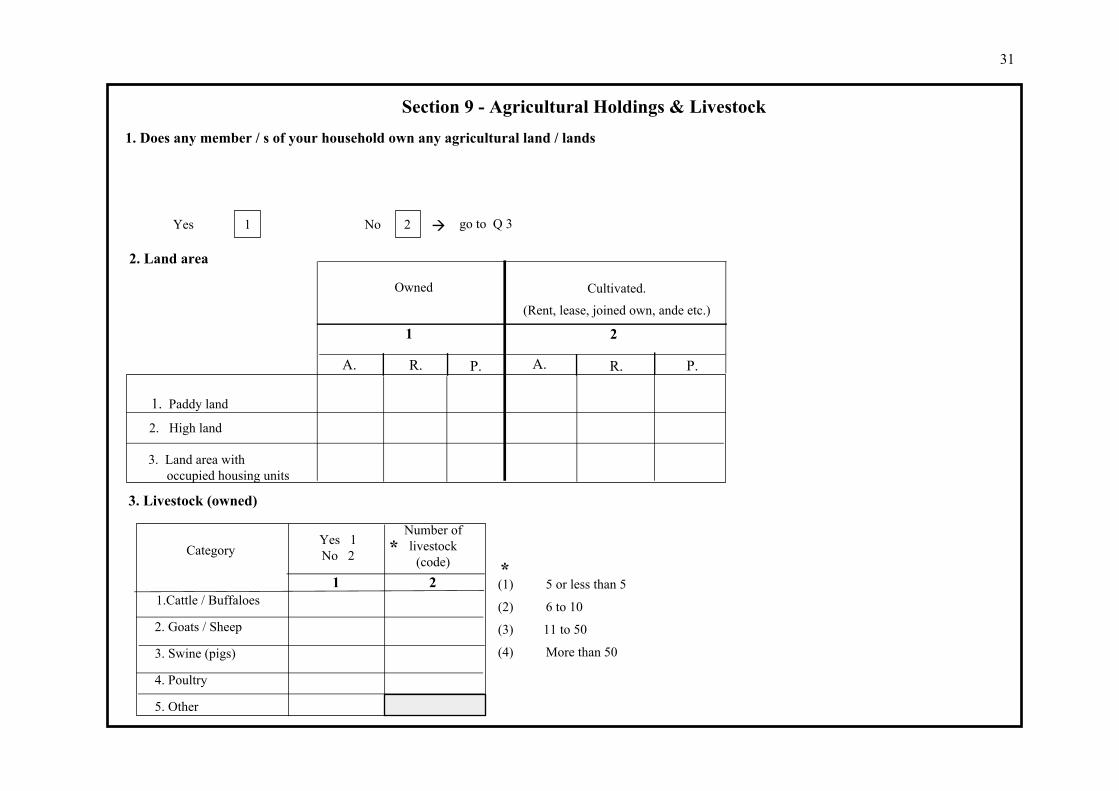
1.Cattle / Buffaloes
2. Goats / Sheep
3. Swine (pigs)
4. Poultry
5. Other
1. Does any member / s of your household own any agricultural land / lands
Yes 1 No 2
Category **(1) 5 or less than 5
(2) 6 to 10
(3) 11 to 50
(4) More than 50
3. Livestock (owned)
2
Number oflivestock
(code)1
Yes 1No 2
Section 9 - Agricultural Holdings & Livestock
go to Q 3
Cultivated.
(Rent, lease, joined own, ande etc.)
Owned
A.
1 2
A. R. P.P.R.
3. Land area with occupied housing units
2. Land area
1. Paddy land
2. High land
à
31