Embed Size (px)
Citation preview
Finance and Economics Discussion SeriesDivisions of Research & Statistics and Monetary Affairs
Federal Reserve Board, Washington, D.C.
Household Incomes in Tax Data: Using Addresses to Move fromTax Unit to Household Income Distributions
Jeff Larrimore, Jacob Mortenson, and David Splinter
2017-002
Please cite this paper as:Larrimore, Jeff, Jacob Mortenson, and David Splinter (2017). “Household Incomes in TaxData: Using Addresses to Move from Tax Unit to Household Income Distributions,” Financeand Economics Discussion Series 2017-002. Washington: Board of Governors of the FederalReserve System, https://doi.org/10.17016/FEDS.2017.002.
NOTE: Staff working papers in the Finance and Economics Discussion Series (FEDS) are preliminarymaterials circulated to stimulate discussion and critical comment. The analysis and conclusions set forthare those of the authors and do not indicate concurrence by other members of the research staff or theBoard of Governors. References in publications to the Finance and Economics Discussion Series (other thanacknowledgement) should be cleared with the author(s) to protect the tentative character of these papers.
Household Incomes in Tax Data: Using Addresses to Move from Tax Unit to Household Income
Distributions
Jeff Larrimore
Federal Reserve Board
Jacob Mortenson Joint Committee on Taxation
David Splinter
Joint Committee on Taxation
January 3, 2017
Tax return data are increasingly the standard for tracking income statistics in the United States. However, these data have traditionally been limited by their inability to capture non-filers and to identify members of separate tax units living in the same household. We overcome these obstacles and create household records directly in the tax data using mailing address information included on tax forms. We then present the first set of tax-based household income and inequality measures for the entire income distribution. When comparing household income inequality results in the tax data to those using the March CPS, we confirm previous findings that the March CPS understates the inequality of household income. However, we also find that the previous approach of using tax units in the IRS data to proxy for households leads to an overstatement of household income inequality. Finally, using households in the IRS tax records, we illustrate how focusing on tax units rather than households alters the observed distribution of tax programs such as the Earned Income Tax Credit.
JEL Codes: D31, H24 Keywords: Household Income, Tax Unit Income, EITC, Income Inequality, IRS Data ______________________________________________________________________________ The results and opinions expressed in this paper reflect the views of the authors and should not be attributed to the Federal Reserve Board. This paper embodies work undertaken for the staff of the Joint Committee on Taxation, but as members of both parties and both houses of Congress comprise the Joint Committee on Taxation, this work should not be construed to represent the position of any member of the Committee. For helpful comments, we thank Jesse Bricker, Richard Burkhauser, Jim Cilke, Scott Winship, Gabriel Zucman and participants of presentations at the Federal Reserve Board and annual conference of the Association for Public Policy Analysis & Management.
2
I. Introduction
Over the past decade, research based on administrative IRS tax return data has greatly
expanded our understanding of incomes at the top of the U.S. income distribution (see e.g.
Piketty and Saez (2003) and Atkinson, Piketty and Saez (2011) for a review of the literature
using tax record data). Despite these advances in observing top incomes, researchers using tax
data have been forced to adapt their analysis to fit the limitations of IRS tax return data. In
particular, an inability to observe information on non-filers in the tax return data have largely
restricted analyses using tax records to the upper end of the income distribution. Additionally,
the inability to observe households, which may contain several tax units or non-filers, have
precluded analyses at the household level – which are standard in both national and cross-
national distributional studies.
This paper uses a new approach for analyzing tax record data in order to overcome both
of these limitations, thereby allowing for the first set of tax-based income distributional statistics
analyzed at the household level rather than the tax unit level. In doing so, we compare the
distribution of income using this new tax record based household data with more traditional IRS
tax unit results and with survey based household results from the March Current Population
Survey (CPS) and the decennial census. Finally we use these data to provide the first tax record
based measure of how the Earned Income Tax Credit (EITC) is distributed across U.S.
households.
The inability of tax records to capture certain information on non-filers is a well-known
limitation of the tax data. The standard administrative tax data excludes the nearly 15 percent of
adults and 13 percent of household heads who do not file a tax return and are not claimed as
dependents each year (Auten and Gee, 2009; Molloy, Smith, and Wozniak, 2011). These non-
3
filers are not missing at random, and are instead primarily concentrated in the lower-tail of the
distribution – which means that researchers using tax return data observe only a truncated
version of the income distribution. Most researchers partially overcome this problem by using
tax return data only to analyze the top of the distribution and assuming that all non-filers have an
income equal to 20 or 30 percent of average filer income (Piketty and Saez, 2003; Auten and
Splinter, 2016). However, such an approach cannot be expanded to analyze lower-tail or broad-
based inequality measures because it does not capture observation-level incomes for these non-
filers. A more sophisticated approach, which we build on, is that of Chetty et al. (2014), who use
information returns (such as Forms W-2 and 1099) to observe income data for non-filers. But
information returns are at the individual level so they lack links to even close relatives such as a
spouse or child.1 This paper develops these links, so non-filers can now be treated equivalently
to those who file a return.
A similarly important, but less discussed limitation of tax record data is that they fail to
observe complete households and instead use tax units – the set of individuals appearing on the
same tax return as a primary or secondary filer or as a dependent – as proxies for households (see
e.g. DeBacker et al., 2013 and Chetty, Hendren, and Katz, 2015).2 As a result, researchers using
tax return data have treated adult children who file their own tax returns but live with their
parents as independent households. Similarly, two cohabitating adults are treated as independent
households. This contrasts with the U.S. Census Bureau’s official income statistics based on the
1 More broadly, we are unaware of previous research that combines non-filers together in any way other than random pairing. The Joint Committee on Taxation Individual Tax Model uses a mostly random process to join male and female non-filing individuals together in order to create the correct number of resident married couples (Joint Committee on Taxation, 2015). Since they do not have access to non-filer information returns, Piketty and Saez (2003) estimate the total number of tax units and determine the number of non-filing tax units as the residual – although they do not correct for the large number of dependent filers younger than 20 years old. 2 Atkinson, Piketty, and Saez (2011) outline some of the challenges of this assumption for cross-national comparisons.

4
March CPS, where individuals who live together but file separate tax returns would be treated as
a joint entity (Proctor, Semega and Kollar, 2016).
Numerous researchers have argued that the household is the sharing unit most closely
resembling how individuals share economic resources (see e.g. Atkinson, Rainwater and
Smeeding, 1995; Sheridan and Macedrie, 1999; and Smeeding and Weinberg, 2001;
Congressional Budget Office, 2016). The household is also the traditional sharing unit that is
recommended by the Canberra Group for measuring income (United Nations Economic
Commission for Europe, 2011) and used by researchers considering national and cross-national
inequality statistics (see e.g. Atkinson and Brandolini, 2001 and Burkhauser et al., 2011). This
distinction is made more important because it has been observed that the choice of sharing units
can greatly impact observed inequality trends (see e.g. Burkhauser, Larrimore and Simon,
2012).3
Due to data limitations few researchers using tax data have attempted to create
households in the tax data. Previous efforts to link tax units into households focused on statistical
matches based on identifiable characteristics (Congressional Budget Office, 2014, 2016) or
direct links between Census Bureau survey data to administrative records (see e.g. Abowd and
Stinson, 2013; Wagner and Layne, 2014). While a direct link between Census Bureau survey
data and administrative records is a promising avenue, the match is imperfect, as Bond et al.
(2014) report that between 8 and 12 percent of survey records cannot be matched to
administrative data, with the unmatched observations disproportionately occurring among
children, minorities, and low income individuals. Furthermore, both the direct linking and
statistical matching techniques may suffer from non-response error in surveys at both tails of the
3 In section III of this paper, we provide further evidence of the substantial effects on measures of inequality of using households versus tax units as the unit of observation.
5
distribution.4 Outside of these efforts to link administrative data to survey records, virtually all
research based on tax return data assumes that resources are only shared within a tax unit rather
than among an entire household.
These two problems – the lack of data for non-filers and the inability to organize
individuals in the tax data into true households – present overlapping challenges. Since non-filers
do not appear on a tax return, they also have no natural tax unit. Therefore, any reasonable
correction to the problem of non-filers also requires determining with whom they share
resources. In this paper, we first address the issue of non-filers by supplementing tax return data
with information returns, which contain income data for individuals regardless of whether they
file an annual tax return. We then address the issue of sharing units by creating households using
address data from tax forms, thereby allowing us to observe the incomes of complete households.
In addressing these previous limitations of tax data, we make use of new data linkages to
develop a Tax Household Sample (THS). The THS is a five percent sample of every household
in the United States, where households include all individuals listed on a tax form at a given
address. With this new data series, it is now possible to observe household-level income
distributions directly in the tax data. This includes inequality statistics that focus on the middle-
and lower-end of the income distribution, which have not previously been explored in the tax
return based inequality literature.
When comparing income distributions of households in our new THS data to previous
inequality estimates, household income inequality in the tax data is higher than has been
estimated previously using March CPS data. However, it is also lower than that seen among tax
4 See Atkinson, Piketty and Saez (2011) for a discussion of these concerns at the top end of the distribution. Also see Bollinger et al. (2015) and Hokayem, Bollinger and Ziliak (2014) for discussions of these concerns at the lower end of the distribution.
6
units in the tax record data. This suggests that researchers who opt to use tax units as a proxy for
households – taking advantage of more accurate top incomes in tax data relative to surveys –
may be fixing the downward inequality bias in the CPS data by introducing a new bias in the
other direction. We also find the distribution of EITC benefits at the household level contains
significantly more mass in the top two quintiles than the analogous tax unit distribution.
II. Data and Methods
a. Forming households in tax return data
The primary data for this paper come from the IRS Compliance Data Warehouse (CDW),
which contains the universe of federal income tax data collected by the IRS for their
administrative records. In contrast to the public use and confidential versions of SOI Individual
Income Tax Files, which have historically been used as the principal datasets of tax researchers
(see e.g. Piketty and Saez, 2003; Auten and Gee, 2009), the CDW data contains tax returns for
all individuals rather than subsampling select returns. This universal coverage ensures that all
individuals within households appear in our data, which is a necessary condition for aggregating
observations to the household level.5
The CDW data contain annual income tax returns (e.g. Form 1040 or Form 1040-EZ) as
well as information returns including: Form W-2 (wage income), Form SSA-1099 (Social
Security income), Form 1099-G (unemployment income), Form 1099-INT (interest income),
Form 1099-DIV (dividend income), Form 1099-R (retirement savings distributions), Form 5498
5 One limitation of the CDW, however, is that it contains unedited data fields. To address the absence of editing, which could result in incorrect incomes for top households, we explored removing households with incomes larger than the largest tax unit income in confidential IRS Statistics of Income (SOI) annual files, which include the population of top earners (over about $7.5 million). While there are extreme outliers in other years that exceed the maximum income in the cleaned cases, in 2010, which is the focus of this paper, no such cases exist.
7
(retirement savings rollovers), and Form 1099-MISC (miscellaneous income). Every tax form in
the file contains information on annual income for an individual or married couple from
specified sources or, in the case of the annual income tax returns, income from all taxable
sources. Each form also contains individual identifiers, such as the Taxpayer Identification
Numbers (TINs, usually Social Security Numbers), and mailing addresses. While annual income
tax returns appear only for those who file a return, information returns are generated on behalf of
individual taxpayers who have the type of income captured on the form without their direct
action. Since information returns are generated for almost all adults, these forms capture nearly
all U.S. residents and they are commonly used to observe information on the non-filing
population (see e.g. Mortenson et al., 2009; Chetty, Hendren, Kline and Saez, 2014; Cilke, 2014;
Heim, Lurie and Pearce, 2014; and Larrimore, Mortenson and Splinter, 2016).
Using these administrative data, we link tax forms in order to create the Tax Household
Sample (THS) file. We first construct a complete profile of individual-level income by linking
all records for the same individual by his or her TIN. Only individuals alive on December 31 for
a given year are included. For individuals who file an annual tax return, their personal income is
determined based on the income reported on that form. For non-filers, their personal income is
determined based on the sum of all income captured on information return forms with an
adjustment for 1099-MISC income as described below.
Individuals are then aggregated into households using the reported address and zip code,
and income is summed among those in the household. Household addresses are recoded into a
standard form (e.g. recoding “1ST ST” or “FIRST STREET to “FIRST ST”) and individuals are
considered to live together if their address and 5-digit zip code both match. For individuals living
in an apartment or multi-unit building, the unit number must match as well as the main address.

8
Filer addresses come from tax returns. Non-filer street addresses, as opposed to PO Boxes, are
chosen preferentially if an individual has multiple information returns.6
When constructing households, spouses and dependents claimed on a tax return are all
considered to have the same address as the primary filer. Some dependents included as part of
their claimant’s household may include college students, who for part of the year reside at an
address different than the person claiming them.7 After merging individuals into households, we
extract annual random five-percent samples of households based on the last four digits of the
TIN of one member of each household.8,9
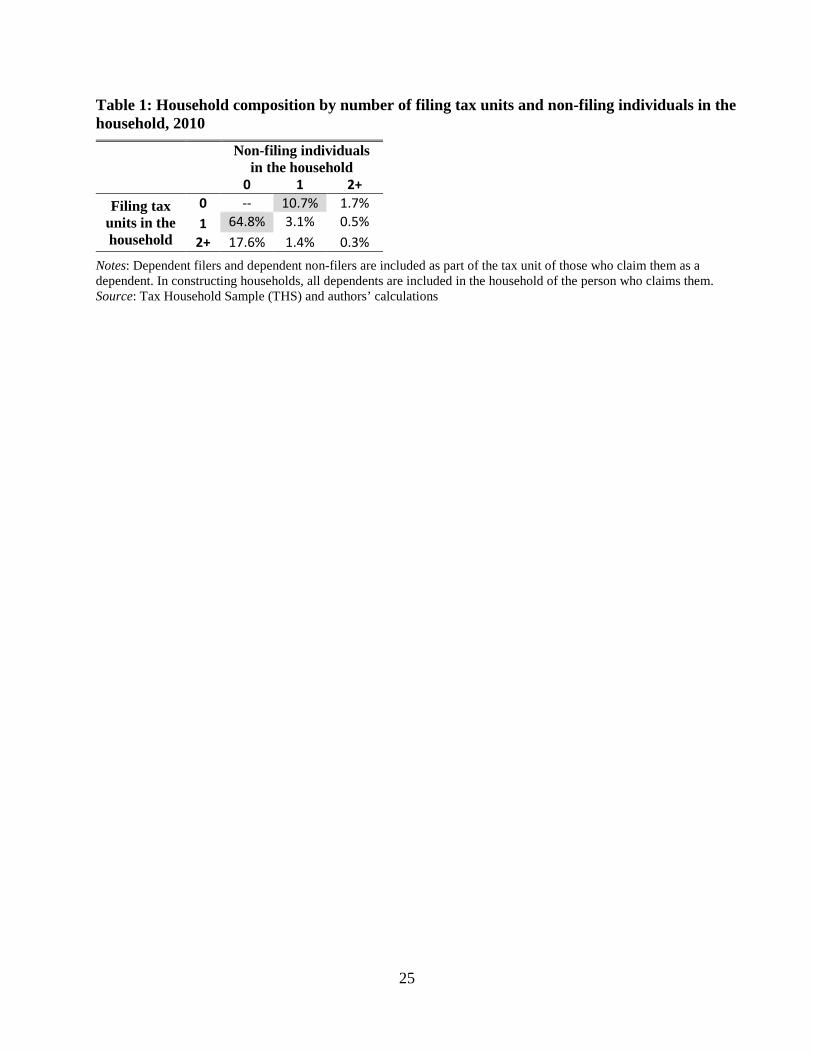
Table 1 provides a first look at the substantial difference between households and tax
units in our THS data. Were households and tax units the same, and each filed a tax return, then
all households would consist of one filing tax unit and zero non-filing individuals. Instead, only
65 percent of households consist of just one filing tax unit and zero non-filers. In other words, 35
percent of households are not properly proxied by filing tax units according to these data. Eleven
percent of households contain no tax filers and one non-filing individual. The remaining 24
percent of households contain at least two separate filing tax units or non-filing individuals.
While we cannot separate in the tax data the type of relationships that exist in these multi-tax
We sort non-empty addresses from information returns numerically and alphabetically and select the first address after sorting. This method preferentially selects street addresses starting with a number over PO Box addresses. 7 An individual up to the age of 23 years old may be claimed as a dependent if they are a full-time student for at least 5 months of the year. Some dependents may file their own tax returns with a different address. As these dependent filers must receive at least half of their support from the taxpayer claiming them, they are not independent economic units and so we consider them part of the household claiming them. 8 The representative of each household is the household member with the largest TIN. All representative individuals whose TIN ends in one of 500 possible combinations is selected into the household sample. Since no TINs end with all zeros, there are technically 9,999 possible endings so the sample is just slightly over a 5 percent sample. Sampling on four-digit TIN endings is an established random sampling method, regularly used by both the Social Security Administration and the IRS Statistics of Income division for the creation of their random samples (Smith, 1989 and Internal Revenue Service, 2015). 9 A potential concern with a random sample, raised by Bricker et al. (2016a), is that at the very high-end of the distribution the thin tail leads to substantial sampling variability. Since the focus of this paper is not the very top of the distribution, and since the 5% probability of selection far exceeds the selection rate of any surveys, including the SCF which oversamples high-wealth individuals, we do not view this as a substantial concern.

9
unit households, both adult children living with their parents and cohabitation of unmarried
partners has risen in recent years (see e.g. Dettling and Hsu, 2014; Lundberg, Pollak and Stearns,
2016) and represent a sizeable portion of these households.10
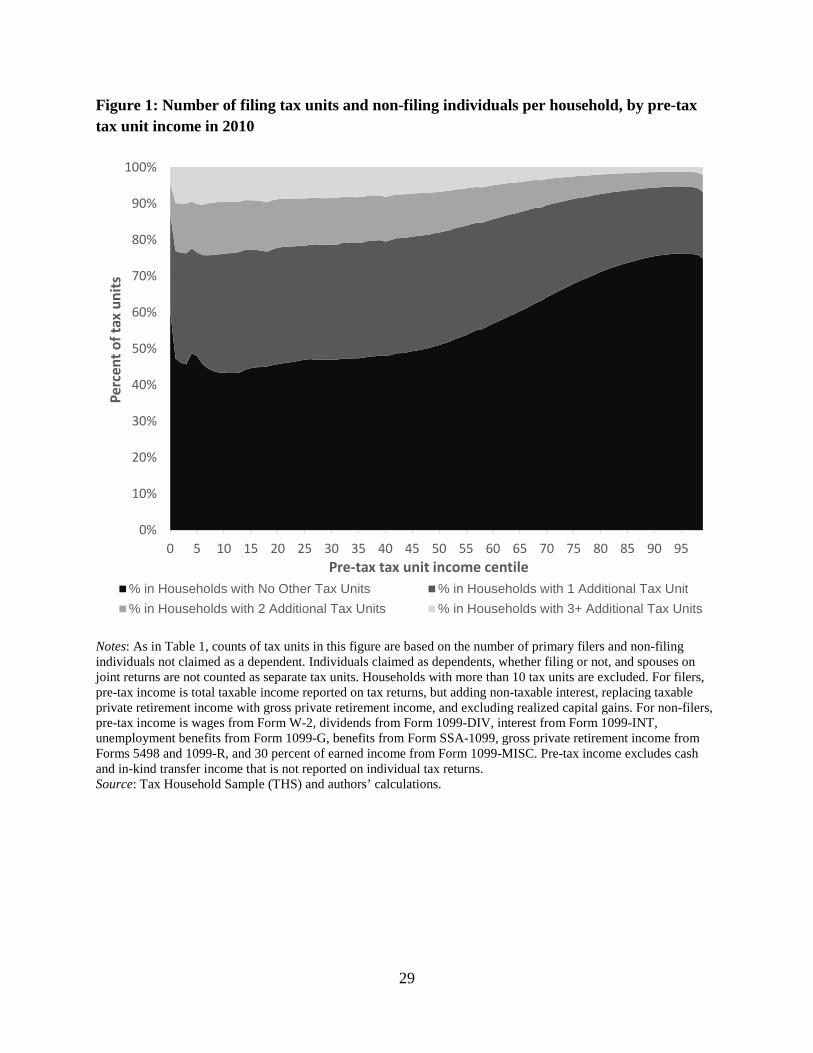
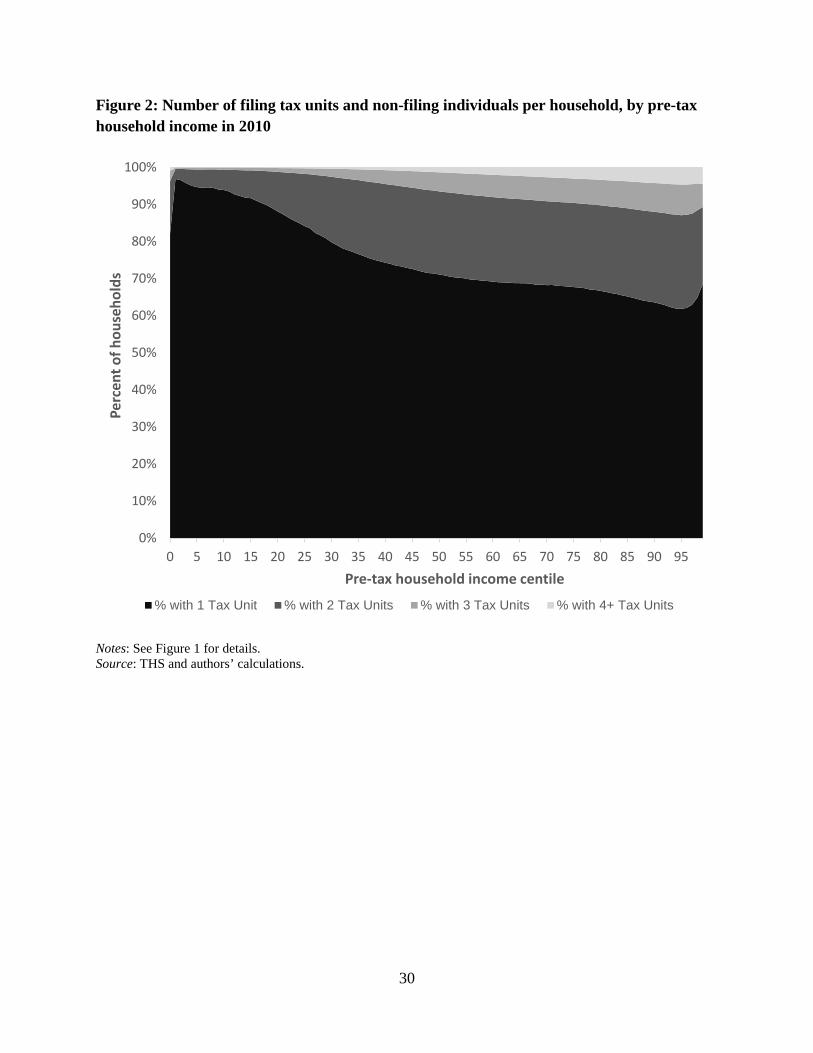
Figure 1 illustrates where in the tax unit income distribution those in multiple tax unit
households come from and Figure 2 illustrates where in the household income distribution they
then fall. From Figure 1, we observe that many of the tax units who live with others have
relatively low incomes. Over half (54%) of tax units in the bottom quintile of the income
distribution live in a household with at least one other tax unit. The likelihood of a tax unit living
with others then declines as the tax unit income increases. Many of these tax units living with
others, however, fall into relatively high income households (Figure 2). In part, this reflects that
multi-tax-unit households have more earners, which can push their joint resources further up the
household income distribution. But it also reflects that some low income tax units are living in
the same household as tax units whose income is much higher. As we will observe in greater
detail below, this difference between tax units and households as well as where in the
distribution the combined households land can greatly impact inequality measures and the
measured distribution of social safety net programs.
b. Calculating income of filers and non-filers
The income comparisons in this paper focus on pre-tax income excluding capital gains, as
captured on annual tax returns. This definition starts with the total income from line 22 of IRS
10 Using March CPS data, and creating tax units within households through the procedure from Burkhauser et al. (2011) and Burkhauser, Larrimore, and Simon (2012), it is possible to estimate the share of multiple tax unit households that contain these relationships. Forty-nine percent of these households contain a non-dependent adult living with his or her parents and 29 percent contain a cohabiting couple (3 percent of which also contain an adult living with his or her parents). The remaining 24 percent of households with multiple tax units have neither a non-dependent adult living with his or her parents nor a cohabiting couple – and therefore include either roommates or relatives besides parents/children who are living together.
10
Form 1040 – which includes income from wages, salaries, taxable interest, dividends, alimony,
business income, rents and royalties, taxable Social Security, taxable private retirement income,
and unemployment compensation. Four adjustments are made to this income from the Form
1040: (1) non-taxable interest reported on Form 1040 is added, (2) realized Schedule D capital
gains are removed, (3) taxable Social Security benefits are replaced by total Social Security
benefits reported on Form SSA-1099, (4) taxable private retirement income is replaced with
gross private retirement income, which reflects retirement savings distributions less rollovers
from Forms 5498 and 1099-R.11 This income measure is broader than the tax return income
definition used by Piketty and Saez (2003), since it includes Social Security income and
unemployment compensation, and comes as close as possible to the pre-tax income measure
from the March CPS and used by the Census Bureau for their official income statistics.12
Among non-filers, income is calculated as the sum of income reported on information
returns that would be included in the income definition for filers were they to file a tax return.
Following Chetty et al. (2014), who also derive income for non-filers based on information
returns, we include income from wages and salaries reported on Form W-2, unemployment
benefits from Form 1099-G, and Social Security and disability benefits from Form SSA-1099. In
addition to these income sources incorporated by Chetty et al., we include interest income from
Form 1099-INT, gross private retirement income as retirement savings distributions less
11 The inclusion of gross private retirement income results in a difference from incomes measured by the Census Bureau definitions because the March CPS asks respondents about regular payments from IRA, 401(k), and Keogh accounts whereas the IRS includes all withdrawals. Munnell and Chen (2014) observe that in 2012 the March CPS captured $18 billion of income from defined contribution plans, whereas IRS data observed $229 billion from these plans. 12 While this is the closest income measure to that from the March CPS which is observable directly in the tax data, it excludes several non-taxable transfers such as public assistance and SSI income. These excluded income measures are discussed in greater detail in section IV of this paper and in Appendix Table A1. Our income measure, for both filers and non-filers, will also exclude some “off the books” income that is neither captured on tax returns or information returns.
11
rollovers from Forms 5498 and 1099-R, and 30 percent of income from Form 1099-MISC, which
captures net self-employment income. The offset of 70 percent of income reported on Form
1099-MISC when calculating total income for non-filers reflects that gross income from self-
employment activities appear on the 1099-MISC information returns, but the associated business
expenses do not. As a result, an offset is necessary to convert the gross self-employment income
to net self-employment income. To determine the 70 percent offset, we observe that among low-
income tax-filers, Schedule C income from self-employment averages approximately 30 percent
of the total 1099-MISC income. Hence, when using information returns to estimate the income
of non-filers, we assume a similar offset to Form 1099-MISC income while preserving all
income from other sources that appear on information returns.13
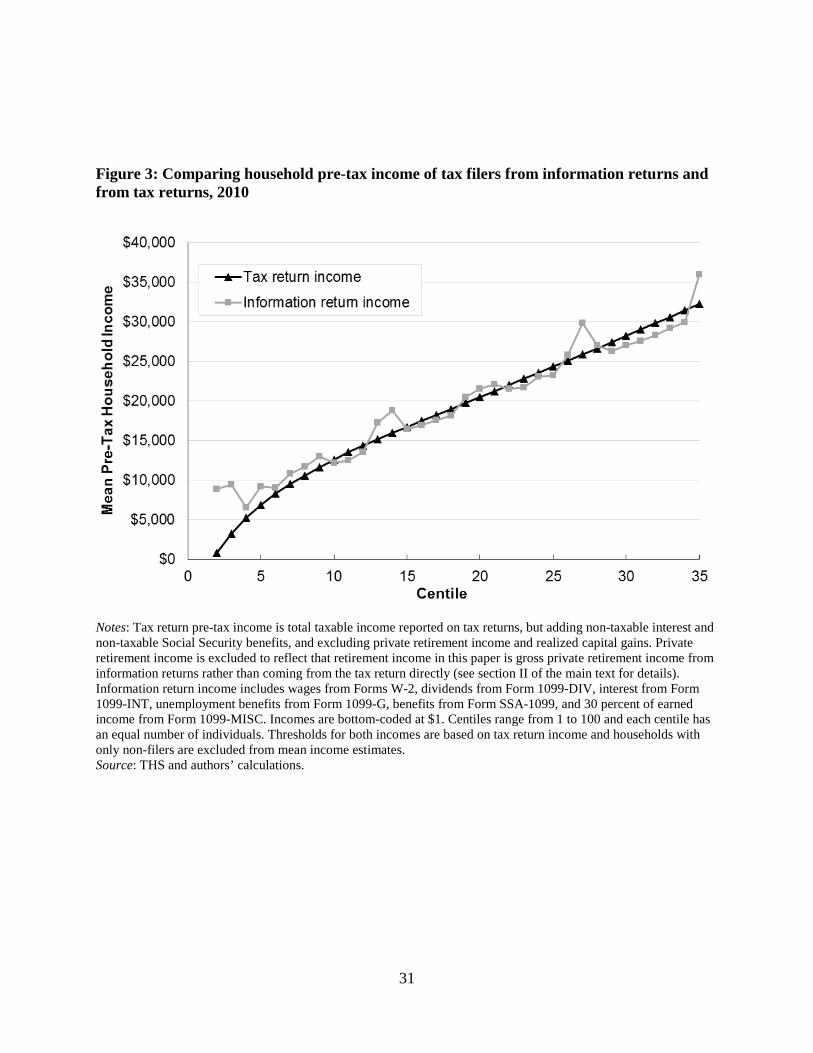
This use of information returns for non-filers implicitly assumes that information returns
accurately reflect the income that they would report, were they to file an annual tax return. To
gain insight into the validity of this assumption, Figure 3 compares the household income on
information returns for low income tax-filers to that which they actually report on annual tax
returns. If information return income accurately proxies the income of low-income filers, it
should increase the confidence in using information returns to capture the income of non-filers.
In this figure, centiles are defined based on the income reported on the annual tax return
form, so the individuals in each centile are the same across the two series. Both series also
exclude any income in the households derived from non-filing individuals. When aggregating all
income from information returns, with the 70 percent offset of 1099-MISC income to reflect
their estimated business expenses associated with that income, the two sources of income data
13 Recognizing that the filing threshold for net-earnings from self-employment is only $400, most self-employment income should be captured on annual tax returns. Since we include non-filers with apparent self-employment income above this threshold and non-filers with total income above the general filing threshold, this accepts that there is some degree of filing non-compliance among those both with and without self-employment income.
12
track closely together, with the exception of the bottom 5 percent of the distribution where there
is more income reported on information returns than on tax returns.14 However, there is no
evidence that the information returns are systematically missing substantial income among the
low income filing population.
III. Comparison of Tax Data to Census Bureau results
In order to assess the capacity of the IRS tax data to capture the entire U.S. population,
we start by comparing the population count and number of households in the THS with the
analogous estimates reported by the U.S. Census Bureau from the decennial census. In 2010,
307.4 million individuals living in the United States appear in the tax data. This includes 282.3
million individuals who appear on a tax return as a primary filer (132.7) or as a spouse or
dependent (149.6), along with 25.1 million non-filers for whom there is at least one information
return. The 307.4 million people observed in the tax data is comparable to the 308.7 million
individuals in the United States observed in the 2010 decennial census. Hence, while only 91
percent of individuals appear on an annual income tax return, when including both the filing
population and the non-filing population with information returns, the tax return data observe
over 99.5 percent of the overall U.S. population in 2010. This is consistent with the findings of
Cilke (2014) that 99.5 percent of the 2011 resident population had at least one source of tax
information on either an annual tax return filing or an information return.
In addition to matching the aggregate count of individuals, the tax record data including
information returns also produces a similar age distribution to that seen from the decennial
14 The lower income reported on tax returns for these individuals relative to the information returns may reflect additional business deductions (which may lead to net business losses) that are not observed on the information returns. For some individuals, it may also reflect non-compliance in income reporting if they do not report their full income on the annual tax return.
13
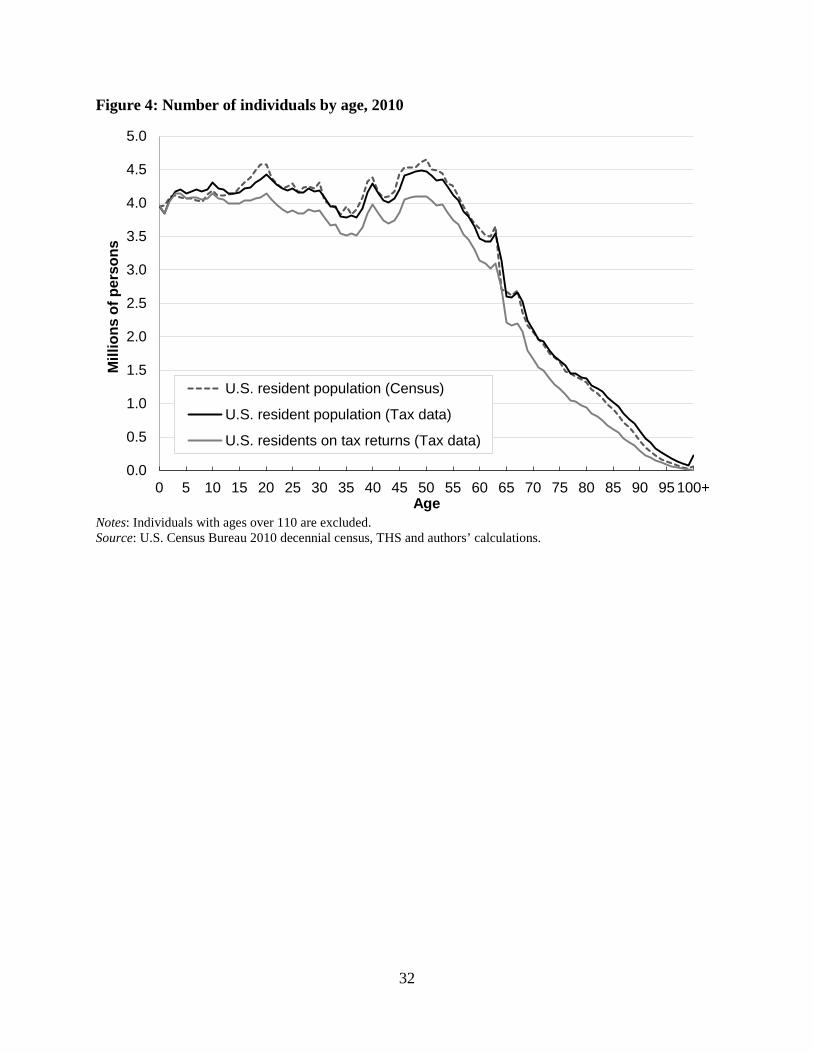
census. This similarity, as well as the importance of incorporating non-filers in the analysis, can
be observed in Figure 4. The dashed gray line represents the age distribution of the U.S. resident
population from the 2010 decennial census. When considering only the resident tax-filing
population (solid gray line), a sizeable number of individuals at almost every age are missing
from the data. In contrast, in our tax record based THS (solid black line), which includes all
individuals for whom there is an information return, the age distribution closely mirrors that
observed in the decennial census. To the extent that deviations exist between the THS results and
the decennial census results, the THS observes somewhat more children under age 15 and elderly
over age 80, whereas it observes somewhat fewer teenagers ages 15 to 21 and middle-age adults
ages 40 to 55.15
Having confirmed that the population counts are comparable in the two datasets, we now
turn to comparing the number of households created through the address-matching algorithm in
the THS to that reported in the 2010 decennial census and the 2011 March CPS (which covers
income year 2010).16 In doing so, we remove individuals living in group quarters from the
sample, as these are usually not economic sharing units and are typically excluded from results
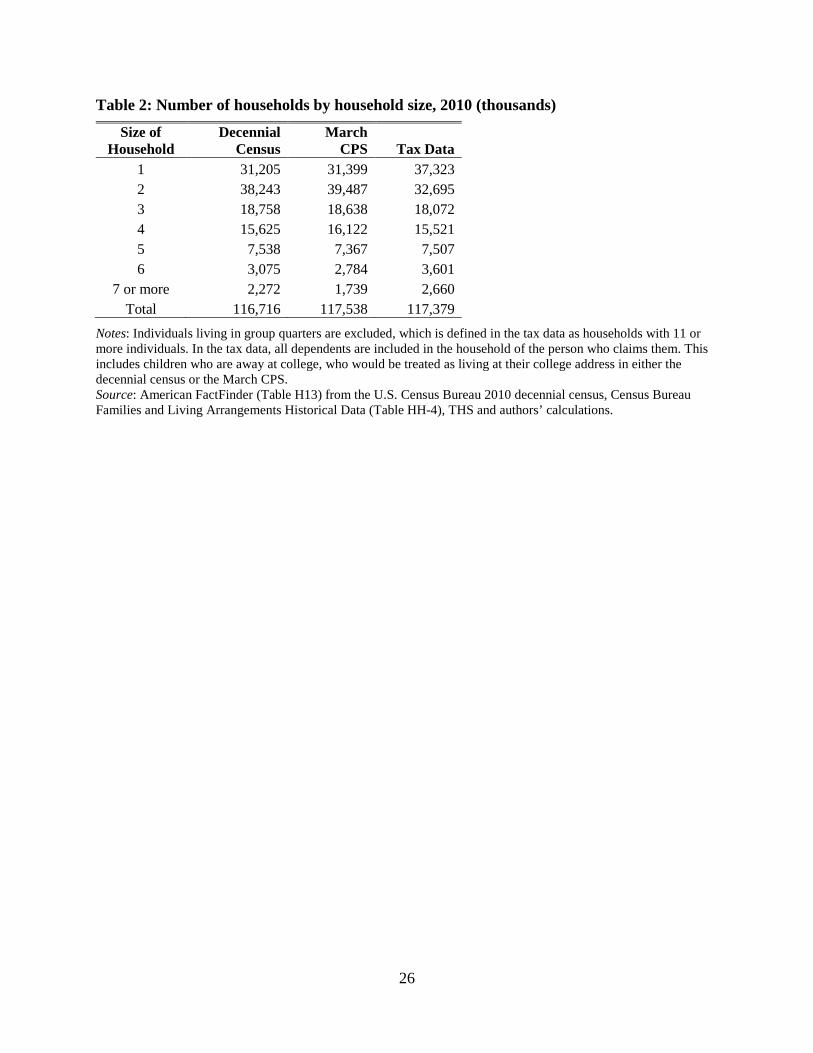
using March CPS data.17 Excluding these group quarters, in 2010 there are 117.4 million
15 The administrative tax data used only include up to four dependents on a tax return. There may be incomplete reporting of teenagers relative to children on tax returns because children over age 16 do not qualify for the child tax credit. These two effects will bias downward the number of dependents. A much larger effect, however, results in an upward bias in the number of dependents. As individuals filing tax returns may legally claim a child exemption for children living in Canada or Mexico, there was a surge in these children on tax returns coinciding with immigration leading up the 2008 recession (and expansions in the refundable child tax credit). As these children are not authorized to work in the U.S., they cannot receive Social Security Numbers, but instead Individual Taxpayer Identification Numbers (ITINs). To limit the number of these non-resident dependents, we remove a tax return’s third and fourth dependents if they have ITINs. This adjustment corrects for the large overstatement of resident children in the IRS tax data that was observed by Cilke (2014). 16 The 2011 March CPS is used here since it represents the 2010 income year. It also likely is the closest survey to the expected 2010 population from IRS data which should reflect addresses from the end of the 2010 calendar year. 17 Since the IRS tax data do not classify the type of housing unit, addresses with 11 or more individuals are treated here as group quarters, which captures 8 million individuals at 500 thousand addresses. This matches the 8 million individuals listed as living in group quarters in the 2010 decennial census. Removing group quarters reduces total observed income by about 1.5%.
14
households in the THS data, roughly 660 thousand more than the 116.7 million households in the
2010 decennial census, but roughly 160 thousand fewer than in the 2011 March CPS. However,
despite the similarities in the number of housing units across these datasets, the THS has more
single-person households and fewer households with six or more individuals than is observed in
either of the Census Bureau datasets. Conversely, it has fewer households with two individuals
(Table 2). There are several potential reasons for this difference in the household size
distributions, including that dependent college students living in off-campus housing will
typically be counted as part of their parents household in our data but as part of their household
near campus in the Census data. Any remaining difference is likely attributable to limits of the
address matching algorithm, including non-filers who use a PO Box as their mailing address so
may not appear with the same address as those individuals living with them.
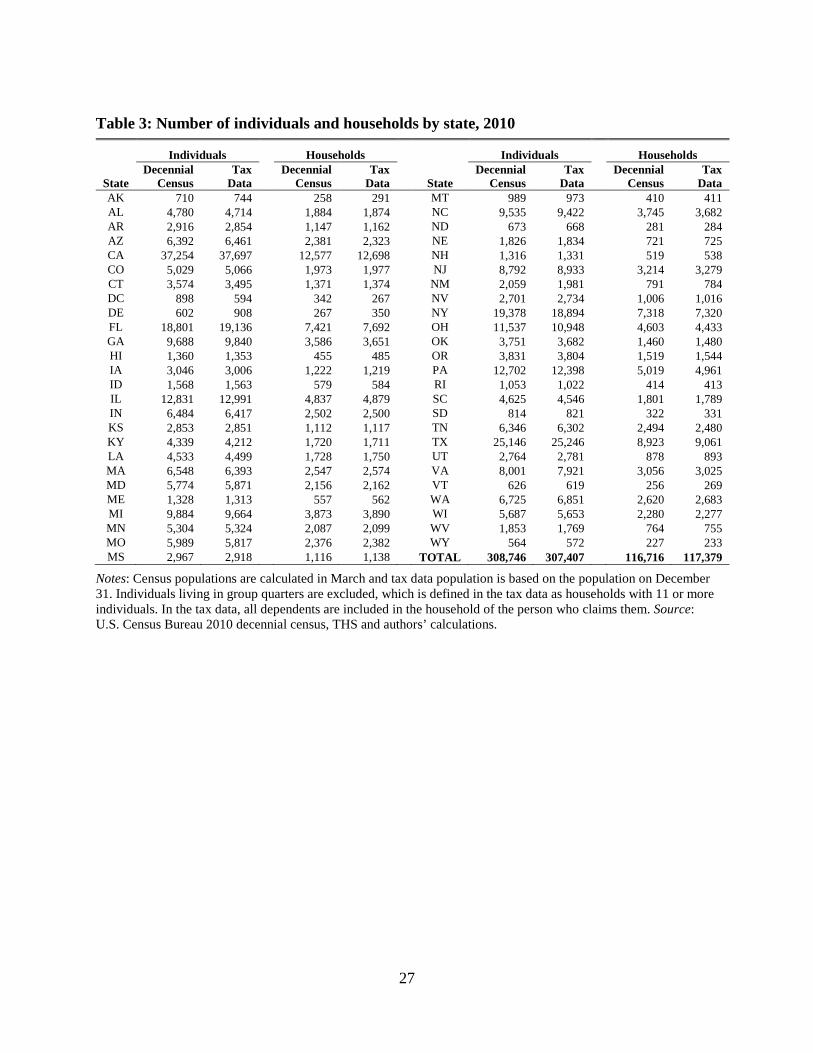
Comparing the spatial distribution of individuals and households across states in Table 3,
the population distribution across states is similar in the THS to that observed in the decennial
census. In most cases, the counts of both individuals and households in the tax data are within 1
to 2 percent of that seen in the decennial census. States with substantial differences between the
numbers of households in the two files may reflect residency preferences for tax purposes. In
particular, Delaware and Alaska have substantially more households (in percentage terms) in the
tax data than in the decennial census – which could be evidence of individuals selectively
choosing their residencies for Delaware’s low taxes or Alaska’s Permanent Dividend Fund
payments.
IV. Comparison of Income Distributions to Census Bureau results

15
Using the tax record based THS it is now possible to evaluate the pre-tax household
income distribution, and compare it to that which would be obtained using the traditional
approach of aggregating income to the tax-unit level as well as to that found by looking at pre-
tax household incomes in the 2011 March CPS, which covers income year 2010.
In making this comparison across sharing units and across datasets, there are several
differences between how income is captured in the IRS and CPS data that must be reconciled to
allow for a valid comparison. Specifically, SSI, child support income, educational assistance,
financial assistance, survivor’s benefits, veteran’s benefits, workers compensation, and public
assistance income are removed from the CPS income definition since they cannot be observed on
IRS tax forms.18 In 2010, these excluded income sources represented 2.5 percent of total pre-tax
income in the March CPS (see Appendix Table A1 for details).
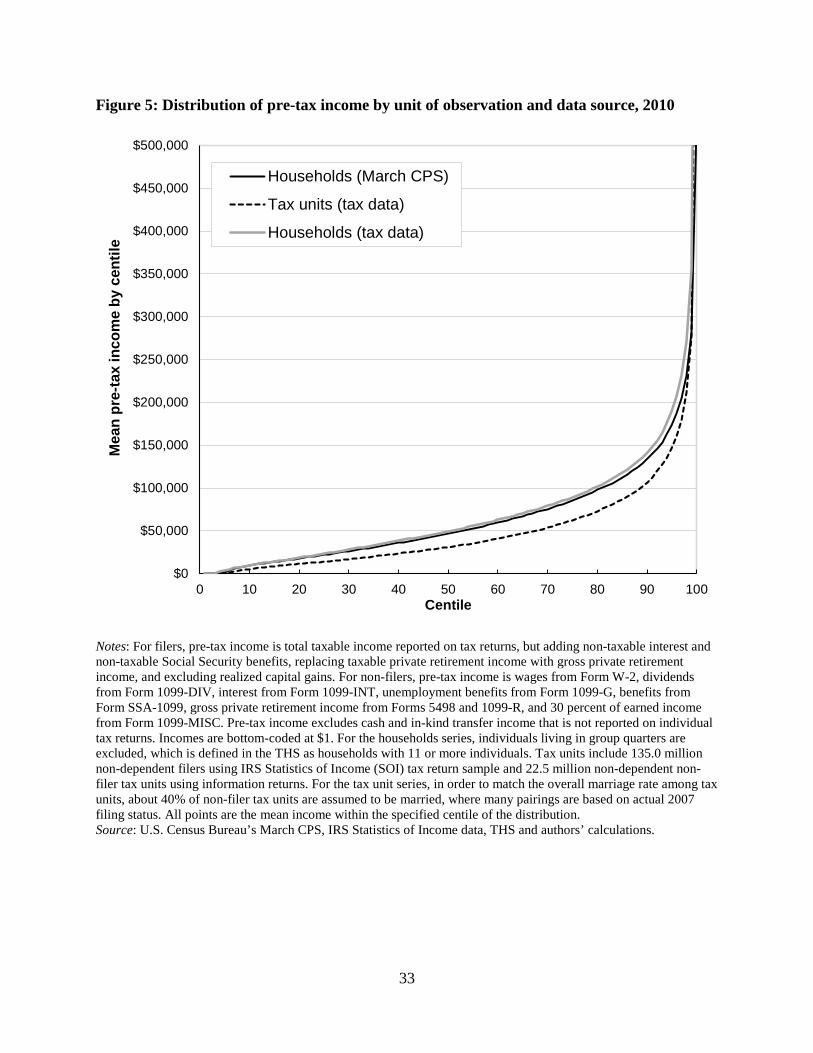
Figure 5 compares the pre-tax household income distribution in the tax record based THS
data to the household income distribution from the March CPS data and the tax unit income
distribution from the tax data. For the tax unit series here, and in future results, dependent filers
are considered part of the return on which they are claimed so are excluded, and non-filing
individuals are paired semi-randomly to match the total number of married couples. This
approach approximates the number of total tax units from the updates to Piketty and Saez
(2003).19
18 In order to create a tax-based household income measure that matches the full pre-tax, post-transfer income definition used by the Census Bureau for their official income statistics in Proctor, Semega, and Kollar (2016), one approach used by the Congressional Budget Office (2016) and by Larrimore et al. (2016) is to impute these sources into the tax data based on a statistical matches. However, in order to focus solely on the income observed in tax records, we exclude these sources from both datasets while recognizing that including them would lower the observed levels of inequality. 19 Were all dependent filers included and non-filers treated as single individuals, the difference between the tax-unit series and the household series would be even greater.
16
First comparing the two household income series, it is apparent that the distribution of
household incomes are similar across the two datasets with the exception of the top centiles of
the distribution. Largely reflecting the more comprehensive coverage of retirement income in the
IRS data relative to the March CPS, household incomes are slightly higher in each centile of the
tax-based household income distribution than in the CPS data - but outside of the top decile of
the distribution, this difference is always less than $7,500.20 The primary differences between the
IRS-based and CPS-based household income series occur in the top two percent of the household
income distribution where household incomes in the March CPS fall well below that seen in the
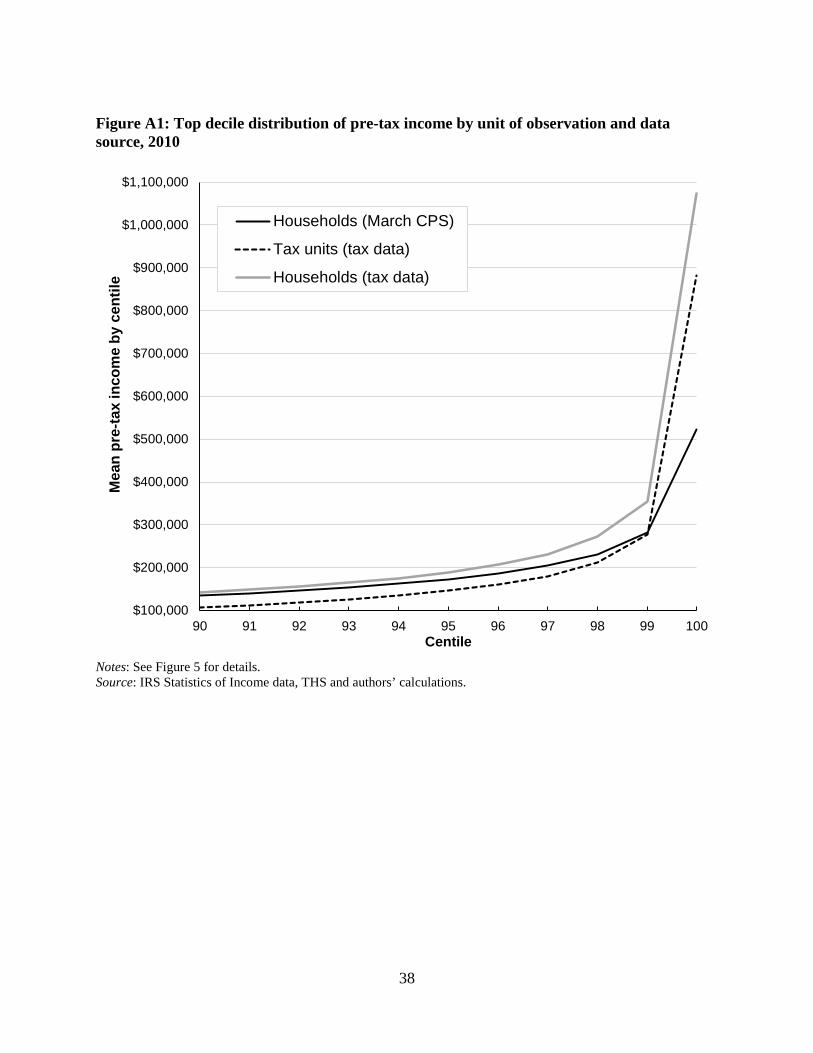
tax data. In particular, the March CPS understates the mean income of the 98th percentile of the
distribution by 21 percent ($282,000 compared to $355,000) and the mean income of the top 1
percent of households by 51 percent ($524,000 compared to $1,073,000), as shown in Figure A1.
This is consistent with the view of many researchers, including Atkinson, Piketty, and Saez
(2011), that the CPS data fails to fully capture the income of high income individuals.
Turning to the comparison between household incomes and tax unit incomes in the tax
record data, we see more substantial differences throughout the distribution. Here the income of
tax units is typically well below that seen at the same centile of the distribution using the tax-
record based household income. For example, while the median household in tax record data has
an income of $49,602, the median tax unit has an income of $31,160.21 This indicates the extent
to which proxying for households using tax-units will fail to accurately capture the incomes of
households throughout the income distribution.
20 Were we to remove retirement income from both series, CPS incomes are slightly above IRS incomes up until the 95th percentile of the distribution, with the remaining difference likely reflecting pre-tax deductions from income that do not appear on tax returns. This alternate series is available upon request. 21 In order to incorporate the additional individuals living in households who draw upon available resources, we also considered the size-adjusted incomes of households and tax units by dividing by the square root of the number of individuals in the sharing unit. When doing so, the large gap between the income of households and tax units remained.

17
The ability to observe households directly in tax return data also offers a refined
perspective on income inequality, relative to previous calculations using tax units as a proxy for
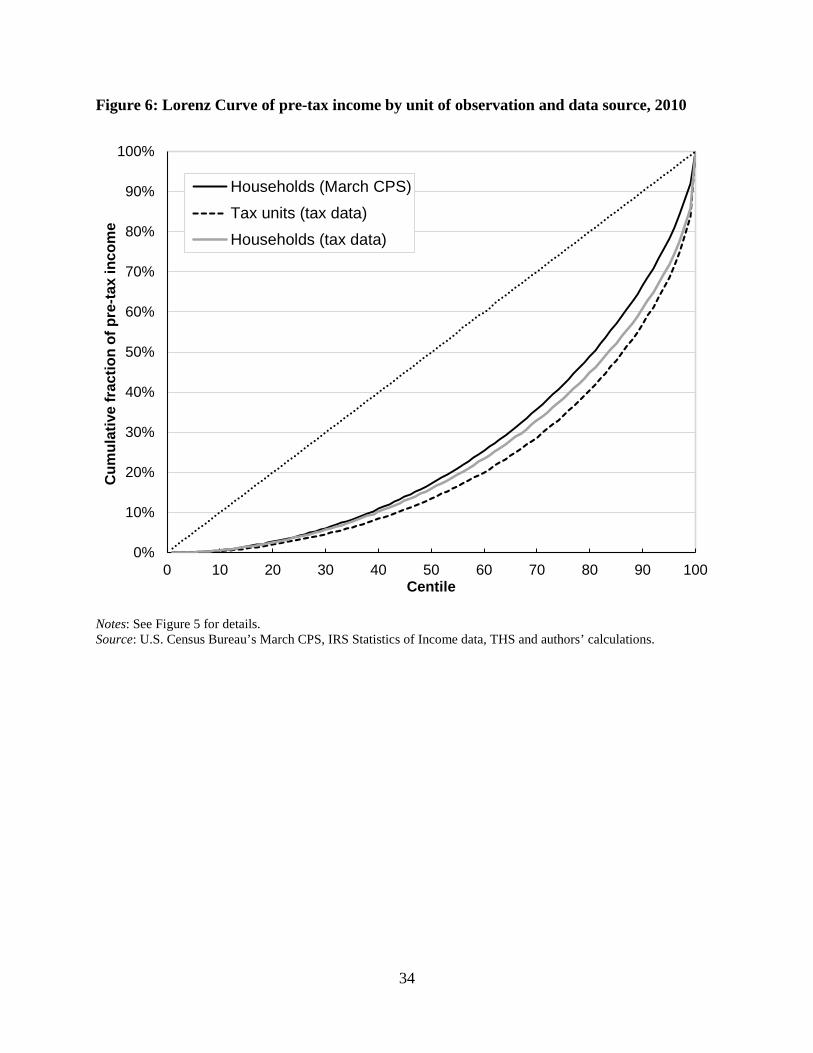
households or using the survey-based March CPS data. This is seen in Figure 6, which presents
the Lorenz curves for each income series. The Lorenz curve represents the share of income held
by those at or below each centile of the distribution, so the closer that the line is to the 45 degree
line, the more equal is the distribution. Reflecting the better ability of the IRS data to observe
income at the top of the distribution, the tax record based household income series observes a
higher concentration of income among the top centiles than does the March CPS data. This
provides further evidence that household incomes are less equally distributed than is observed in
the official income statistics released by the Census Bureau based on the March CPS data.22
However, Figure 6 also illustrates the extent to which researchers using tax units to proxy
for households will overstate the true level of household income inequality. The tax unit series
exhibits a substantially lower share of income held at or below each centile outside of the top 1
percent than is seen using the same tax data but aggregating individuals to the household level.
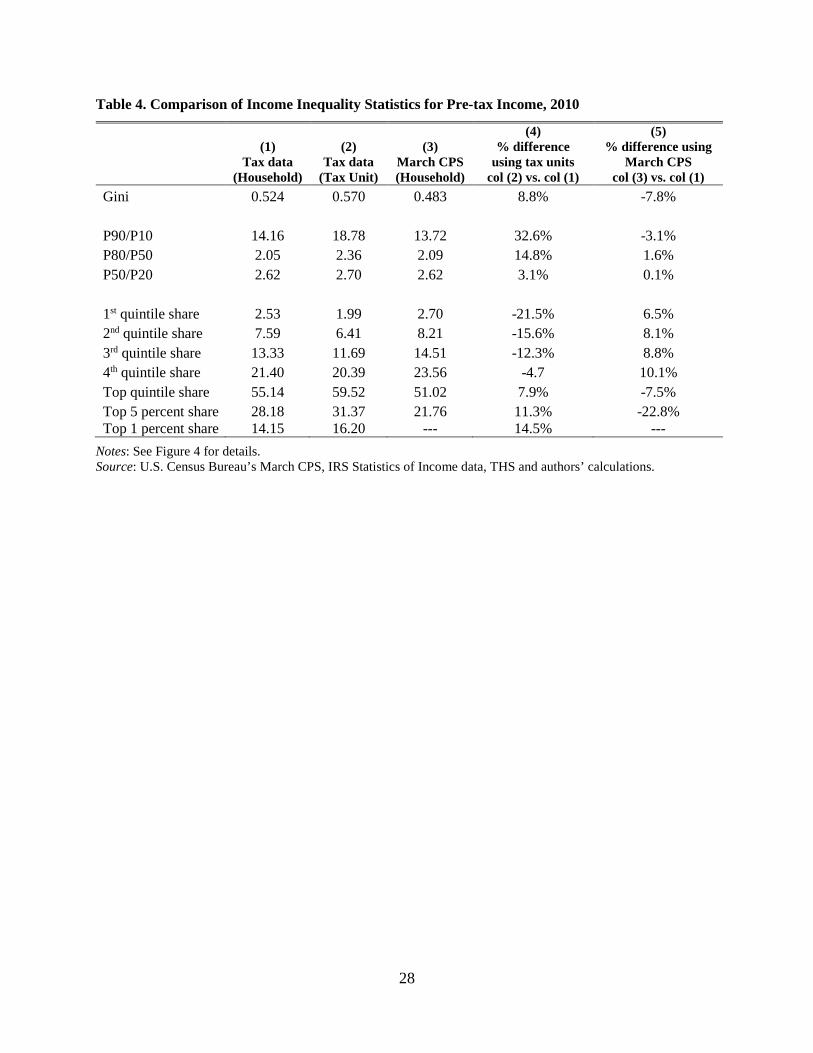
The impact on the observed level of inequality from aggregating tax records into
households is further apparent in Table 4, which presents key inequality statistics across the three
basic income series. Consistent with Figure 6, relative to our new tax record based household
income series using tax units overstates the level of inequality and using the March CPS data
understates the level of income inequality. For example, the Gini coefficient for the new
household series in tax data is 0.524, which is below the 0.570 Gini coefficient for tax units but
above the Gini coefficient for households in the CPS of 0.483. Hence, proxying for households
22 Highlighting the importance of the top 2 percent of the distribution to the Lorenz curve, were you to replace the top 2 percent of the Census Bureau household income distribution with the top 2 percent of the tax record household income distribution, the gap between the Census and tax data household income Lorenz curves in Figure 6 would nearly disappear.

18
using tax-units in the tax data will overstate the household income Gini coefficient by 9 percent
and using the March CPS data will understate the household income Gini coefficient seen in the
tax data by 8 percent.
Whether the findings using tax units in the tax record data or using households in the
March CPS come closer to our tax record based household income inequality metrics will
depend on where in the distribution the inequality metrics is focused. For income and inequality
metrics that are not influenced by the very top of the distribution – including the P90/P10 ratio –
the household income inequality results in tax data are much more closely aligned with the
household income inequality results in the CPS than they are with the tax unit results. However,
looking at the top 5 percent income share results, where the known errors in the March CPS data
are greatest, the quintile shares for tax units in the tax data come closer to our observed
household results.
Moving even higher up the income distribution, we find the top 1 percent of households
constructed from tax data earn smaller income shares than the top 1 percent of tax units: 14.2
percent versus 16.2 percent of income.23 This is in spite of the top 1 percent of households
having a slightly larger average income than tax units (Figure A1). This result emerges because
there are far fewer households than tax units (117.4 vs. 157.5 million), and fewer total
households means fewer households in the top one percent. The increase in top shares from
larger household average incomes is outweighed by the decrease from having fewer households
than tax units in the top one percent.24
23 Bricker et al. (2016b) find similar effects of switching from tax units to families when using the 2010 Survey of Consumer Finances, estimating a decrease in top 1 percent income shares by 2.4 percentage points. 24 The difference between the total number of tax units and the number of households does not on its own imply a change in top income shares. It is only the non-random combination of tax units into households that causes this result. Since 1.17 million households make up each centile of the household income distribution, whereas 1.57 million tax units make up each centile of the tax unit distribution, the average income per household in the top centile would need to be 34 percent higher than is seen among tax units for there to be no change in the top 1 percent
19
VII. Distribution of Earned Income Tax Credits
Since they rely on tax record data, most analyses of the distributional effects of tax
provisions focus on the distribution across tax units (see e.g. Joint Committee on Taxation, 2012;
Tax Policy Center, 2016). But in addition to impacting inequality measures, one should expect
the distributional impacts of specific tax provisions to differ depending on whether one focuses
on the household income distribution or the tax unit income distribution. Here we consider how
the observed distributional impacts of one of the most important social safety net programs – the
Earned Income Tax Credit (EITC) – differs when focusing on household incomes rather than tax
unit incomes.
The EITC is a refundable credit that is intended to target low income workers. This credit
is available to tax filers with at least some earned income but whose adjusted gross income is
below income limits that vary based on the number of dependent children (for a married tax filer
with 2 qualifying dependents in 2010, their adjusted gross income had to be below $40,363). In
2012, nearly 28 million tax filers claimed over $64 billion of EITC credits. This means the EITC
has over 10 times the number of recipients and over 7 times the cash benefits than the traditional
cash welfare program Temporary Assistance for Needy Families (TANF) (Bitler, Hoynes, and
Kuka, forthcoming).
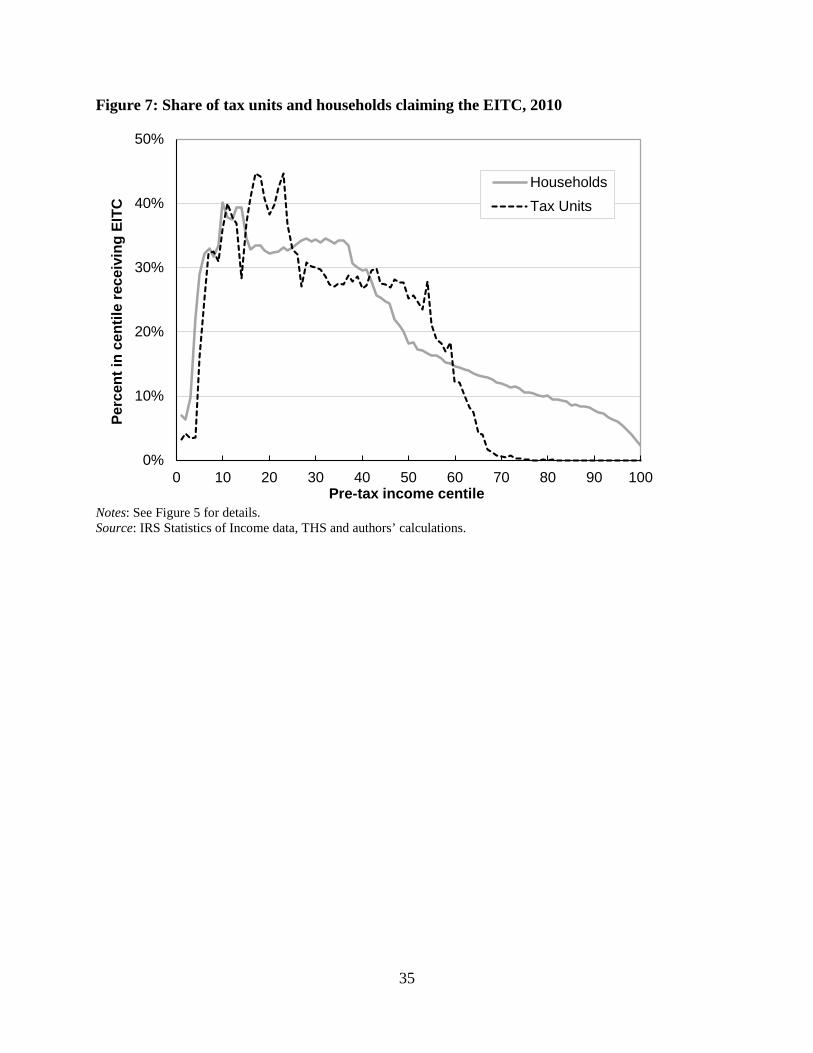
The importance of how income is measured when evaluating the distributional impacts of
the EITC can be seen in Figure 7. This figure shows the fraction of tax units in each centile of
the pre-tax income distribution that claim the credit. While earnings requirements for the credit
mean that very few tax units in the bottom 5 percent claim the credit, forty percent of those in the
income share. Because the average household income in the top centile is only 21 percent higher than was seen for the top 1 percent of tax units, the top 1 percent income share among households is lower than among tax units.
20
2nd decile of the tax unit income distribution claim the EITC and 30 percent of tax units in the 3rd
through 5th decile claim it. Higher in the distribution, claiming rates fall sharply and nearly no
tax units in the top three deciles of the tax unit distribution receive the EITC. This contrasts with
the incidence seen when income is measured at the household level. Here, while the majority of
claimants remain in the lower deciles of the distribution, we also see that about 10 percent of
households in the 8th and 9th deciles and 5 percent of those in the top decile are receiving EITC
benefits. Hence, a non-trivial number of individuals who are in relatively low income tax units
(thereby qualifying for the credits) are living as part of households that are nearer the top of the
income distribution.
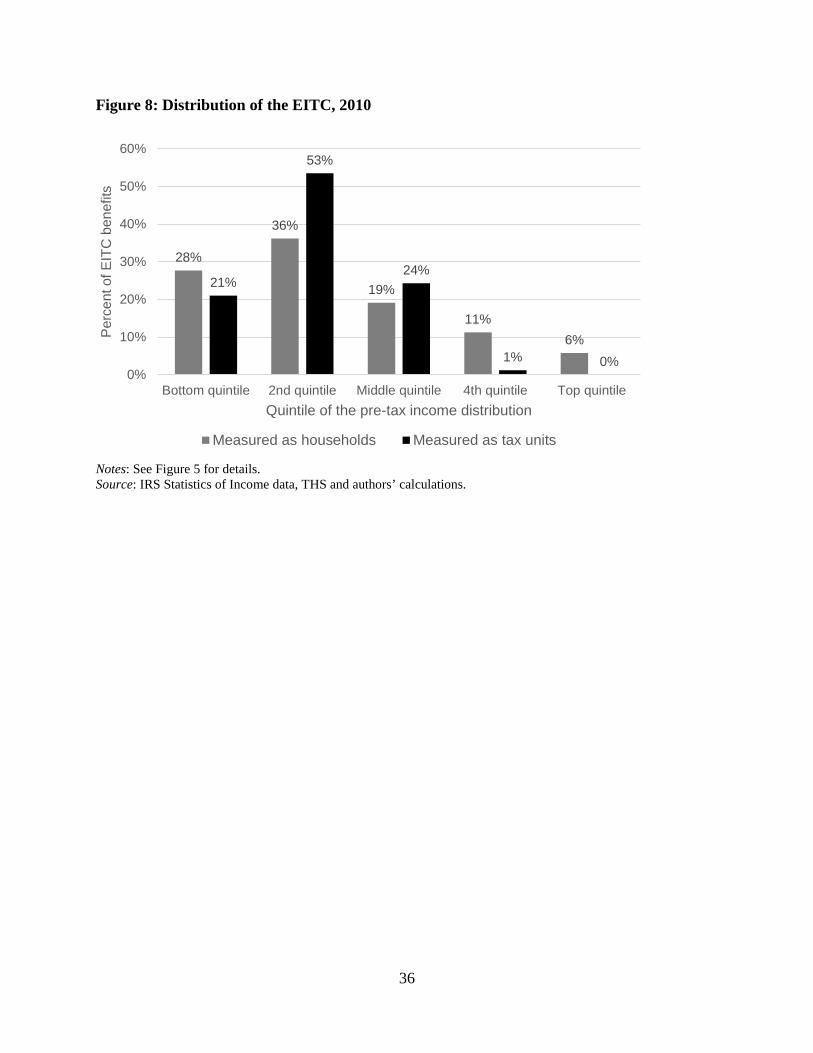
Figure 8 shifts from considering the fraction of individuals in each quintile who take
credits to the fraction of total credits claimed going to each segment of the pre-tax income
distribution. This distribution of benefits incorporates both how many individuals claim credits
as well as the amount of the credits that they claim. At the tax unit level, again, the benefits are
well targeted at those in the bottom half of the distribution. Seventy-four percent of benefits are
received by those in the bottom two quintiles of the pre-tax income distribution and just 1
percent go to those in the top two quintiles. But by linking the tax units into households, it is
apparent that a non-trivial fraction of benefits are going to those living in higher income
households. At the household level, 17 percent of EITC benefits are going to those in the top two
quintiles. Hence, while the benefits still appear to be targeted at those with lower incomes – even
at the household level a majority of EITC benefits go to the bottom two quintiles – the
redistributive impacts are less pronounced than previously believed.
VIII. Conclusion

21
Advances in administrative tax data have provided an increasingly detailed picture of the
income distribution, but have previously been unable to capture income at the household level or
fully incorporate the income of non-filers. Using address information on IRS tax records, as well
as data on the universe of tax forms, we overcome both of these limitations and observe the first
household level income distribution computed entirely using IRS tax records. In doing so, we
confirm the failure of March CPS data to fully capture the incomes of households in the top 2
centiles of the income distribution. This limitation reduces the observed pre-tax household
income Gini coefficient in the CPS data by 4 Gini points in 2010, which is an 8 percent
understatement of inequality relative to that observed in the tax data. However, we also observe
that proxying for households in the tax data by focusing on tax units leads to an overstatement of
pre-tax household income inequality of 5 Gini points (9 percent). This inability of tax units to
properly proxy for households reflects the finding that only 76 percent of households consist of
just one filing tax return or non-filing individual.
The difference between tax units and households is also important for understanding the
distributional impacts of tax provisions such as the EITC. The EITC is concentrated among
lower-income individuals irrespective of how income is measured, although it is notably less
progressive when income is captured at the household level. In particular, the share of these
credits going to the top two quintiles of the income distribution rises from 1 percent to 17 percent
when we shift from measuring incomes at the tax unit level to measuring them at the household
level. This suggests that whether income is measured at the household level or at the tax unit
level will have important implications for the perceived progressivity of tax provisions.

22
References Abowd, John and Martha Stinson. 2013. “Estimating Measurement Error in Annual Job Earnings: A Comparison of Survey and Administrative Data.” Review of Economics and Statistics 95(5): 1451-1467.
Atkinson, Anthony B. and Andrea Brandolini. 2001. “Promises and Pitfalls in the Use of Secondary Data Sets: Income Inequality in OECD Countries as a Case Study.” Journal of Economic Literature 39(3), 771–799.
Atkinson, Anthony B., Thomas Piketty, and Emmanuel Saez. 2011. “Top Incomes in the Long Run of History.” Journal of Economic Literature 49(1): 3-71.
Atkinson, Anthony B., Lee Rainwater, and Timothy M. Smeeding. 1995. “Income Distribution in OECD Countries: The Evidence from the Luxembourg Income Study.” Social Policy Studies No. 18. Paris: Organization for Economic Cooperation and Development.
Auten, Gerald and Geoff Gee. 2009. “Income Mobility in the United States: New Evidence from Income Tax Data.” National Tax Journal 62(2): 301-328.
Auten, Gerald and David Splinter. 2016. “Using Tax Data to Measure Income Inequality: Effects of the Tax Reform Act of 1986.” Working paper.
Bitler, Marianne, Hilary Hoynes, and Elira Kuka. Forthcoming. “Do In-Work Tax Credits Serve as a Safety Net.” Journal of Human Resources.
Bollinger, Christopher R., Barry T. Hirsch, Charles M. Hokayem, and James P. Ziliak. 2015. “Trouble in the Tails? Earnings Non-Response and Response Bias across the Distribution” Working paper.
Bond, Brittany, J. David Brown, Adela Luque, and Amy O’Hara. 2014. “The Nature of the Bias when Studying only Linkable Person Records: Evidence from the American Community Survey.” Census Bureau CARRA Working Paper 2014-08.
Bricker, Jesse, Alice Henriques, Jacob Krimmel, and John Sabelhaus. 2016a. “Measuring Income and Wealth at the Top Using Administrative Data” Brookings Papers on Economic Activity, Spring: 261-312.
Bricker, Jesse, Alice Henriques, Jacob Krimmel, and John Sabelhaus. 2016b. “Estimating Top Income and Wealth Shares: Sensitivity to Data and Methods.” American Economic Review 106(5): 641-645.
Burkhauser, Richard V., Shuaizhang Feng, Stephen P. Jenkins, and Jeff Larrimore. 2011. “Trends in United States Income Inequality Using the March Current Population Survey: The Importance of Controlling for Censoring.” Journal of Economic Inequality 9(3): 393–415.
Burkhauser, Richard V., Shuaizhang Feng, Stephen P. Jenkins, and Jeff Larrimore. 2012. “Recent Trends in Top Income Shares in the United States: Reconciling Estimates from March CPS and IRS Tax Return Data.” The Review of Economics and Statistics 44(2): 371-388.
Burkhauser, Richard V., Jeff Larrimore, and Kosali I. Simon. 2012. “A ‘Second Opinion’ on the Economic Health of the American Middle Class.” National Tax Journal 65(1): 7-32.
23
Chetty, Raj, Nathaniel Hendren, and Lawrence Katz. 2016. “The Effects of Exposure to Better Neighborhoods on Children: New Evidence from the Moving to Opportunity Experiment.” American Economic Review 106(4): 855-902.
Chetty, Raj, Nathaniel Hendren, Patrick Kline, and Emmanuel Saez. 2014. “Where is the Land of Opportunity? The Geography of Intergenerational Mobility in the United States.” Quarterly Journal of Economics 129(4): 1553-1623.
Cilke, James. 2014. “The Case of the Missing Strangers: What we Know and Don’t Know about Non-Filers.” Paper presented at the 107th Annual Conference of the National Tax Association. https://www.ntanet.org/conference/2014/11/107th-annual-conference-proceedings-2014/ Congressional Budget Office 2014. “The Distribution of Household Income and Federal Taxes, 2011.” Congressional Budget Office Research Report. https://www.cbo.gov/sites/default/files/113th-congress-2013-2014/reports/49440-Distribution-of-Income-and-Taxes-2.pdf
Congressional Budget Office 2016. “The Distribution of Household Income and Federal Taxes, 2013.” Congressional Budget Office Research Report. https://www.cbo.gov/sites/default/files/114th-congress-2015-2016/reports/51361-HouseholdIncomeFedTaxes.pdf
Dettling, Lisa and Joanne Hsu. 2014. “Returning to the Nest: Debt and Parental Co-residence among Young Adults.” Federal Reserve Board Working Paper 2014-80.
DeBacker, Jason, Bradley Heim, Vasia Panousi, Shanthi Ramnath, and Ivan Vidangos. 2013. “Rising Inequality: Transitory or Permanent? New Evidence from a Panel of U.S. Tax Returns 1987-2006.” Brookings Papers on Economic Activity Spring 2013, 67-122.
Heim, Bradley T., Ithai Z. Lurie, and James Pearce. 2014. “Who Pays Taxes? A Dynamic Perspective.” National Tax Journal 67(4): 755-778.
Hokayem, Charles, Christopher Bollinger, and James P. Ziliak. 2014. “The Role of CPS Nonresponse on the Level and Trend in Poverty.” University of Kentucky Center for Poverty Research Discussion Paper Series. Paper 1. http://uknowledge.uky.edu/ukcpr_papers/1/
Internal Revenue Service. 2015. “Statistics of Income – 2013 Individual Income Tax Returns.” Internal Revenue Service publication 1304 (Rev. 08-2015).
Joint Committee on Taxation. 2012. “Overview of the Definition of Income Used by the Staff of the Joint Committee on Taxation in Distributional Analyses.” Joint Committee on Taxation: JCX-15-12. Joint Committee on Taxation. 2015. “Estimating Changes in the Federal Income Tax: Description of the Individual Tax Model.” Joint Committee on Taxation: JCX-75-15. Larrimore, Jeff, Richard V. Burkhauser, Gerald Auten, and Philip Armour. 2016. “Recent Trends in U.S. Top Income Shares in Tax Record Data Using More Comprehensive Measures of Income Including Accrued Capital Gains.” NBER Working Paper 23007.
Larrimore, Jeff, Jacob Mortenson and David Splinter. 2016. “Income and Earnings Mobility in U.S. Tax Data.” In Federal Reserve Bank of St. Louis and the Board of Governors of the Federal Reserve System (eds.), Economic Mobility: Research & Ideas on Strengthening Families, Communities & the Economy, 481-516.

24
Lundberg, Shelly, Robert A. Pollak and Jenna Stearns. 2016. “Family Inequality: Diverging Patterns in Marriage, Cohabitation, and Childbearing.” Journal of Economic Literature 30 (2): 79-102.
Molloy, Raven, Christopher L. Smith, and Abigail Wozniak, 2011. “Internal Migration in the United States.” Journal of Economic Perspectives 25(3): 173-196.
Mortenson, Jacob, James Cilke, Jonathan Zytnick and Michael Udell. 2009. “Attaching the Left Tail: A New Profile of Income for Persons who do not Appear on Federal Income Tax Returns.” in the 2009 National Tax Association Proceedings. Munnell, Alicia H. and Anqi Chen. 2014. “Do Census Data Underestimate Retirement Income?” Center for Retirement Research report 14-19. http://crr.bc.edu/wp-content/uploads/2014/12/IB_14-19-508.pdf
Proctor, Bernadette D., Jessica L. Semega and Melissa A. Kollar. 2015. Income and Poverty in the United States: 2014.” Current Population Reports P60–256, U.S. Census Bureau, Washington, DC.
Piketty, Thomas, and Emmanuel Saez. 2003. “Income Inequality in the United States, 1913–1998.” Quarterly Journal of Economics 118 (1): 1–39.
Sheridan M. and I. Macredie. 1999. “Revisiting Statistical Units: Concepts, Definitions and Use, in International Expert [Canberra] Group on Household Income Statistics.” Third Meeting on Household Income Statistics: Papers and Final Report, Ottawa, Canada, Statistics Canada, 305-316, June.
Smeeding, Timothy M. and Daniel H. Weinberg. 2001. “Toward a Uniform Definition of Household Income.” Review of Income and Wealth 47(1): 1-24.
Smith, Creston M. 1989. “The Social Security Administration’s Continuous Work History Sample.” Social Security Bulletin 52(10): 20-28.
Tax Policy Center. 2016. The Tax Policy Center’s Briefing Book: A Citizen’s Guide to the Fascinating (Though Often Complex) Elements of the Federal Tax System. Accessed Nov. 21, 2016 via http://www.taxpolicycenter.org/briefing-book/what-earned-income-tax-credit-eitc
United Nations Economic Commission for Europe. 2011. Canberra Group Handbook on Household Income Statistics: Second Edition. Accessed online via: https://www.unece.org/fileadmin/DAM/stats/groups/cgh/Canbera_Handbook_2011_WEB.pdf
Wagner, Deborah and Mary Layne. 2014. “The Person Identification Validation System (PVS): Applying the Center for Administrative Records Research and Applications’ (CARRA) Record Linkage Software.” CARRA Working Paper 2014-01.
25
Table 1: Household composition by number of filing tax units and non-filing individuals in the household, 2010
Non-filing individuals in the household
0 1 2+ Filing tax
units in the household
0 -- 10.7% 1.7% 1 64.8% 3.1% 0.5%
2+ 17.6% 1.4% 0.3%
Notes: Dependent filers and dependent non-filers are included as part of the tax unit of those who claim them as a dependent. In constructing households, all dependents are included in the household of the person who claims them. Source: Tax Household Sample (THS) and authors’ calculations
26
Table 2: Number of households by household size, 2010 (thousands)
Size of Household
Decennial Census
March CPS Tax Data
1 31,205 31,399 37,323 2 38,243 39,487 32,695 3 18,758 18,638 18,072 4 15,625 16,122 15,521 5 7,538 7,367 7,507 6 3,075 2,784 3,601
7 or more 2,272 1,739 2,660 Total 116,716 117,538 117,379
Notes: Individuals living in group quarters are excluded, which is defined in the tax data as households with 11 or more individuals. In the tax data, all dependents are included in the household of the person who claims them. This includes children who are away at college, who would be treated as living at their college address in either the decennial census or the March CPS. Source: American FactFinder (Table H13) from the U.S. Census Bureau 2010 decennial census, Census Bureau Families and Living Arrangements Historical Data (Table HH-4), THS and authors’ calculations.
27
Table 3: Number of individuals and households by state, 2010
Individuals Households Individuals Households
State Decennial
Census Tax
Data Decennial
Census Tax
Data
State Decennial
Census Tax
Data Decennial
Census Tax
Data AK 710 744 258 291 MT 989 973 410 411 AL 4,780 4,714 1,884 1,874 NC 9,535 9,422 3,745 3,682 AR 2,916 2,854 1,147 1,162 ND 673 668 281 284 AZ 6,392 6,461 2,381 2,323 NE 1,826 1,834 721 725 CA 37,254 37,697 12,577 12,698 NH 1,316 1,331 519 538 CO 5,029 5,066 1,973 1,977 NJ 8,792 8,933 3,214 3,279 CT 3,574 3,495 1,371 1,374 NM 2,059 1,981 791 784 DC 898 594 342 267 NV 2,701 2,734 1,006 1,016 DE 602 908 267 350 NY 19,378 18,894 7,318 7,320 FL 18,801 19,136 7,421 7,692 OH 11,537 10,948 4,603 4,433 GA 9,688 9,840 3,586 3,651 OK 3,751 3,682 1,460 1,480 HI 1,360 1,353 455 485 OR 3,831 3,804 1,519 1,544 IA 3,046 3,006 1,222 1,219 PA 12,702 12,398 5,019 4,961 ID 1,568 1,563 579 584 RI 1,053 1,022 414 413 IL 12,831 12,991 4,837 4,879 SC 4,625 4,546 1,801 1,789 IN 6,484 6,417 2,502 2,500 SD 814 821 322 331 KS 2,853 2,851 1,112 1,117 TN 6,346 6,302 2,494 2,480 KY 4,339 4,212 1,720 1,711 TX 25,146 25,246 8,923 9,061 LA 4,533 4,499 1,728 1,750 UT 2,764 2,781 878 893 MA 6,548 6,393 2,547 2,574 VA 8,001 7,921 3,056 3,025 MD 5,774 5,871 2,156 2,162 VT 626 619 256 269 ME 1,328 1,313 557 562 WA 6,725 6,851 2,620 2,683 MI 9,884 9,664 3,873 3,890 WI 5,687 5,653 2,280 2,277 MN 5,304 5,324 2,087 2,099 WV 1,853 1,769 764 755 MO 5,989 5,817 2,376 2,382 WY 564 572 227 233 MS 2,967 2,918 1,116 1,138 TOTAL 308,746 307,407 116,716 117,379
Notes: Census populations are calculated in March and tax data population is based on the population on December 31. Individuals living in group quarters are excluded, which is defined in the tax data as households with 11 or more individuals. In the tax data, all dependents are included in the household of the person who claims them. Source: U.S. Census Bureau 2010 decennial census, THS and authors’ calculations.
28
Table 4. Comparison of Income Inequality Statistics for Pre-tax Income, 2010
(1) Tax data
(Household)
(2) Tax data
(Tax Unit)
(3) March CPS (Household)
(4) % difference
using tax units col (2) vs. col (1)
(5) % difference using
March CPS col (3) vs. col (1)
Gini 0.524 0.570 0.483 8.8% -7.8% P90/P10 14.16 18.78 13.72 32.6% -3.1% P80/P50 2.05 2.36 2.09 14.8% 1.6% P50/P20 2.62 2.70 2.62 3.1% 0.1% 1st quintile share 2.53 1.99 2.70 -21.5% 6.5% 2nd quintile share 7.59 6.41 8.21 -15.6% 8.1% 3rd quintile share 13.33 11.69 14.51 -12.3% 8.8% 4th quintile share 21.40 20.39 23.56 -4.7 10.1% Top quintile share 55.14 59.52 51.02 7.9% -7.5% Top 5 percent share 28.18 31.37 21.76 11.3% -22.8% Top 1 percent share 14.15 16.20 --- 14.5% ---
Notes: See Figure 4 for details. Source: U.S. Census Bureau’s March CPS, IRS Statistics of Income data, THS and authors’ calculations.
29
Figure 1: Number of filing tax units and non-filing individuals per household, by pre-tax tax unit income in 2010
Notes: As in Table 1, counts of tax units in this figure are based on the number of primary filers and non-filing individuals not claimed as a dependent. Individuals claimed as dependents, whether filing or not, and spouses on joint returns are not counted as separate tax units. Households with more than 10 tax units are excluded. For filers, pre-tax income is total taxable income reported on tax returns, but adding non-taxable interest, replacing taxable private retirement income with gross private retirement income, and excluding realized capital gains. For non-filers, pre-tax income is wages from Form W-2, dividends from Form 1099-DIV, interest from Form 1099-INT, unemployment benefits from Form 1099-G, benefits from Form SSA-1099, gross private retirement income from Forms 5498 and 1099-R, and 30 percent of earned income from Form 1099-MISC. Pre-tax income excludes cash and in-kind transfer income that is not reported on individual tax returns. Source: Tax Household Sample (THS) and authors’ calculations.
0%
10%
20%
30%
40%
50%
60%
70%
80%
90%
100%
0 5 10 15 20 25 30 35 40 45 50 55 60 65 70 75 80 85 90 95
Perc
ent o
f tax
uni
ts
Pre-tax tax unit income centile% in Households with No Other Tax Units % in Households with 1 Additional Tax Unit% in Households with 2 Additional Tax Units % in Households with 3+ Additional Tax Units
30
Figure 2: Number of filing tax units and non-filing individuals per household, by pre-tax household income in 2010
Notes: See Figure 1 for details. Source: THS and authors’ calculations.
0%
10%
20%
30%
40%
50%
60%
70%
80%
90%
100%
0 5 10 15 20 25 30 35 40 45 50 55 60 65 70 75 80 85 90 95
Perc
ent o
f hou
seho
lds
Pre-tax household income centile
% with 1 Tax Unit % with 2 Tax Units % with 3 Tax Units % with 4+ Tax Units
31
Figure 3: Comparing household pre-tax income of tax filers from information returns and from tax returns, 2010
Notes: Tax return pre-tax income is total taxable income reported on tax returns, but adding non-taxable interest and non-taxable Social Security benefits, and excluding private retirement income and realized capital gains. Private retirement income is excluded to reflect that retirement income in this paper is gross private retirement income from information returns rather than coming from the tax return directly (see section II of the main text for details). Information return income includes wages from Forms W-2, dividends from Form 1099-DIV, interest from Form 1099-INT, unemployment benefits from Form 1099-G, benefits from Form SSA-1099, and 30 percent of earned income from Form 1099-MISC. Incomes are bottom-coded at $1. Centiles range from 1 to 100 and each centile has an equal number of individuals. Thresholds for both incomes are based on tax return income and households with only non-filers are excluded from mean income estimates. Source: THS and authors’ calculations.
32
Figure 4: Number of individuals by age, 2010
Notes: Individuals with ages over 110 are excluded. Source: U.S. Census Bureau 2010 decennial census, THS and authors’ calculations.
0.0
0.5
1.0
1.5
2.0
2.5
3.0
3.5
4.0
4.5
5.0
0 5 10 15 20 25 30 35 40 45 50 55 60 65 70 75 80 85 90 95 100+
Mill
ions
of p
erso
ns
Age
U.S. resident population (Census)
U.S. resident population (Tax data)
U.S. residents on tax returns (Tax data)
33
Figure 5: Distribution of pre-tax income by unit of observation and data source, 2010
Notes: For filers, pre-tax income is total taxable income reported on tax returns, but adding non-taxable interest and non-taxable Social Security benefits, replacing taxable private retirement income with gross private retirement income, and excluding realized capital gains. For non-filers, pre-tax income is wages from Form W-2, dividends from Form 1099-DIV, interest from Form 1099-INT, unemployment benefits from Form 1099-G, benefits from Form SSA-1099, gross private retirement income from Forms 5498 and 1099-R, and 30 percent of earned income from Form 1099-MISC. Pre-tax income excludes cash and in-kind transfer income that is not reported on individual tax returns. Incomes are bottom-coded at $1. For the households series, individuals living in group quarters are excluded, which is defined in the THS as households with 11 or more individuals. Tax units include 135.0 million non-dependent filers using IRS Statistics of Income (SOI) tax return sample and 22.5 million non-dependent non-filer tax units using information returns. For the tax unit series, in order to match the overall marriage rate among tax units, about 40% of non-filer tax units are assumed to be married, where many pairings are based on actual 2007 filing status. All points are the mean income within the specified centile of the distribution. Source: U.S. Census Bureau’s March CPS, IRS Statistics of Income data, THS and authors’ calculations.
$0
$50,000
$100,000
$150,000
$200,000
$250,000
$300,000
$350,000
$400,000
$450,000
$500,000
0 10 20 30 40 50 60 70 80 90 100
Mea
n pr
e-ta
x in
com
e by
cen
tile
Centile
Households (March CPS)
Tax units (tax data)
Households (tax data)
34
Figure 6: Lorenz Curve of pre-tax income by unit of observation and data source, 2010
Notes: See Figure 5 for details. Source: U.S. Census Bureau’s March CPS, IRS Statistics of Income data, THS and authors’ calculations.
0%
10%
20%
30%
40%
50%
60%
70%
80%
90%
100%
0 10 20 30 40 50 60 70 80 90 100
Cum
ulat
ive
frac
tion
of p
re-ta
x in
com
e
Centile
Households (March CPS)Tax units (tax data)Households (tax data)
35
Figure 7: Share of tax units and households claiming the EITC, 2010
Notes: See Figure 5 for details. Source: IRS Statistics of Income data, THS and authors’ calculations.
0%
10%
20%
30%
40%
50%
0 10 20 30 40 50 60 70 80 90 100
Perc
ent i
n ce
ntile
rece
ivin
g EI
TC
Pre-tax income centile
HouseholdsTax Units
36
Figure 8: Distribution of the EITC, 2010
Notes: See Figure 5 for details. Source: IRS Statistics of Income data, THS and authors’ calculations.
28%
36%
19%
11%6%
21%
53%
24%
1% 0%0%
10%
20%
30%
40%
50%
60%
Bottom quintile 2nd quintile Middle quintile 4th quintile Top quintile
Per
cent
of E
ITC
ben
efits
Quintile of the pre-tax income distribution
Measured as households Measured as tax units
37
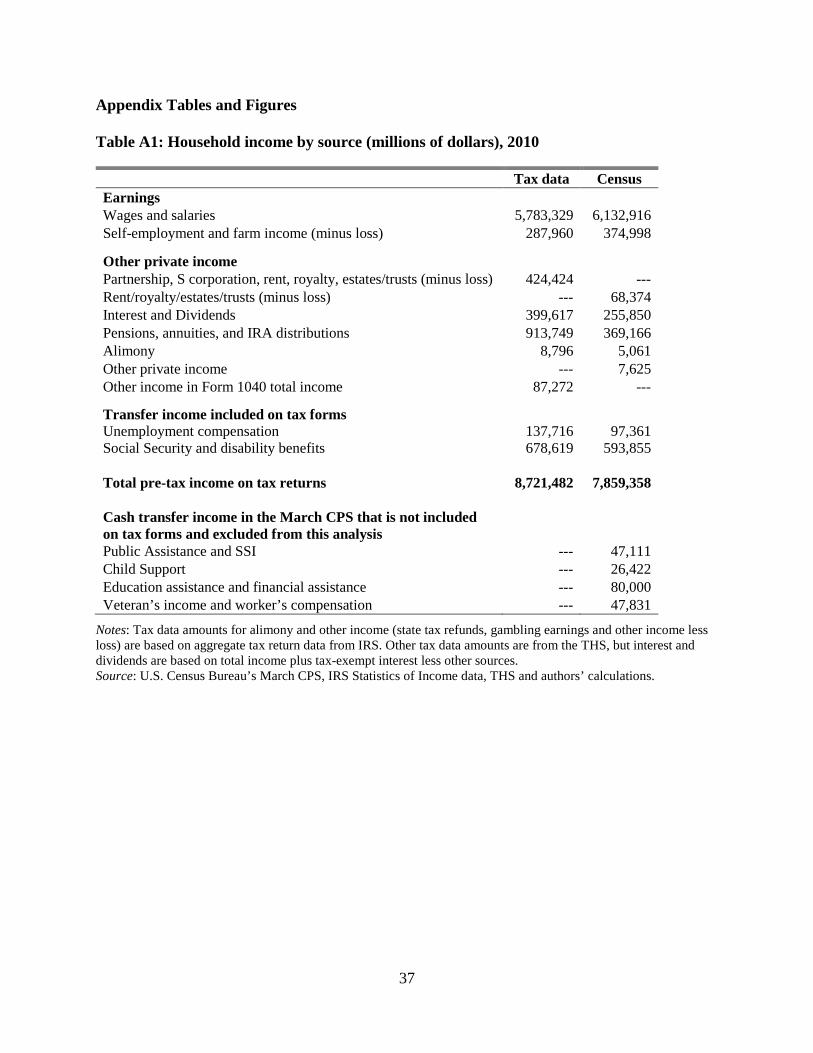
Appendix Tables and Figures Table A1: Household income by source (millions of dollars), 2010
Tax data Census Earnings
Wages and salaries 5,783,329 6,132,916 Self-employment and farm income (minus loss) 287,960 374,998 Other private income
Partnership, S corporation, rent, royalty, estates/trusts (minus loss) 424,424 --- Rent/royalty/estates/trusts (minus loss) --- 68,374 Interest and Dividends 399,617 255,850 Pensions, annuities, and IRA distributions 913,749 369,166 Alimony 8,796 5,061 Other private income --- 7,625 Other income in Form 1040 total income 87,272 --- Transfer income included on tax forms Unemployment compensation 137,716 97,361 Social Security and disability benefits 678,619 593,855
Total pre-tax income on tax returns 8,721,482 7,859,358
Cash transfer income in the March CPS that is not included on tax forms and excluded from this analysis
Public Assistance and SSI --- 47,111 Child Support --- 26,422 Education assistance and financial assistance --- 80,000 Veteran’s income and worker’s compensation --- 47,831
Notes: Tax data amounts for alimony and other income (state tax refunds, gambling earnings and other income less loss) are based on aggregate tax return data from IRS. Other tax data amounts are from the THS, but interest and dividends are based on total income plus tax-exempt interest less other sources. Source: U.S. Census Bureau’s March CPS, IRS Statistics of Income data, THS and authors’ calculations.
38
Figure A1: Top decile distribution of pre-tax income by unit of observation and data source, 2010
Notes: See Figure 5 for details. Source: IRS Statistics of Income data, THS and authors’ calculations.
$100,000
$200,000
$300,000
$400,000
$500,000
$600,000
$700,000
$800,000
$900,000
$1,000,000
$1,100,000
90 91 92 93 94 95 96 97 98 99 100
Mea
n pr
e-ta
x in
com
e by
cen
tile
Centile
Households (March CPS)
Tax units (tax data)
Households (tax data)