Embed Size (px)
Citation preview
Housing Affordability: What Are Best Practices and Why Are They Important?
James Wood Ivory-Boyer Senior Fellow
Dejan Eskic Senior Research Analyst
DJ Benway Research Analyst
Kathryn Macdonald-Poelman Graduate Assistant
A survey of leading housing practitioners identified five “best practices” for meeting the housing affordability challenge in Utah. This study examines why these practices are “best practices,” the implementation of the practice, and the outcomes produced.
November 2020
411 East South Temple Street Salt Lake City, Utah 84111 801-585-5618 I gardner.utah.edu

gardner.utah.edu I November 2020I N F O R M E D D E C I S I O N S TM
Housing Affordability: What Are Best Practices and Why Are They Important?
Utah’s housing shortage and escalating prices reflect local housing policies. To be sure, market conditions—land, labor, and material costs—affect housing production and prices, but these factors offer scant opportunity for policy intervention. The best chance to shrink the shortage and improve affordability depends on local policies and practices. This study identifies five best practices developed by local jurisdictions to improve housing affordability. They include practices targeted at redevelopment agencies (RDAs), transit-oriented developments (TODs), accessory dwelling units (ADUs), preservation of existing affordable units, and changes in land use.
Key Findings• No Single Practice Answers the Growing Threat of Housing
Affordability—Addressing the housing crisis requires a multi-practice approach. Successful housing strategies involve a set of practices tailored to the city’s political climate, development history, and socioeconomic conditions. While a city’s housing practices are unique to that city’s needs, there are a few universal elements for successful housing strategies: community outreach, commitment, and flexibility.
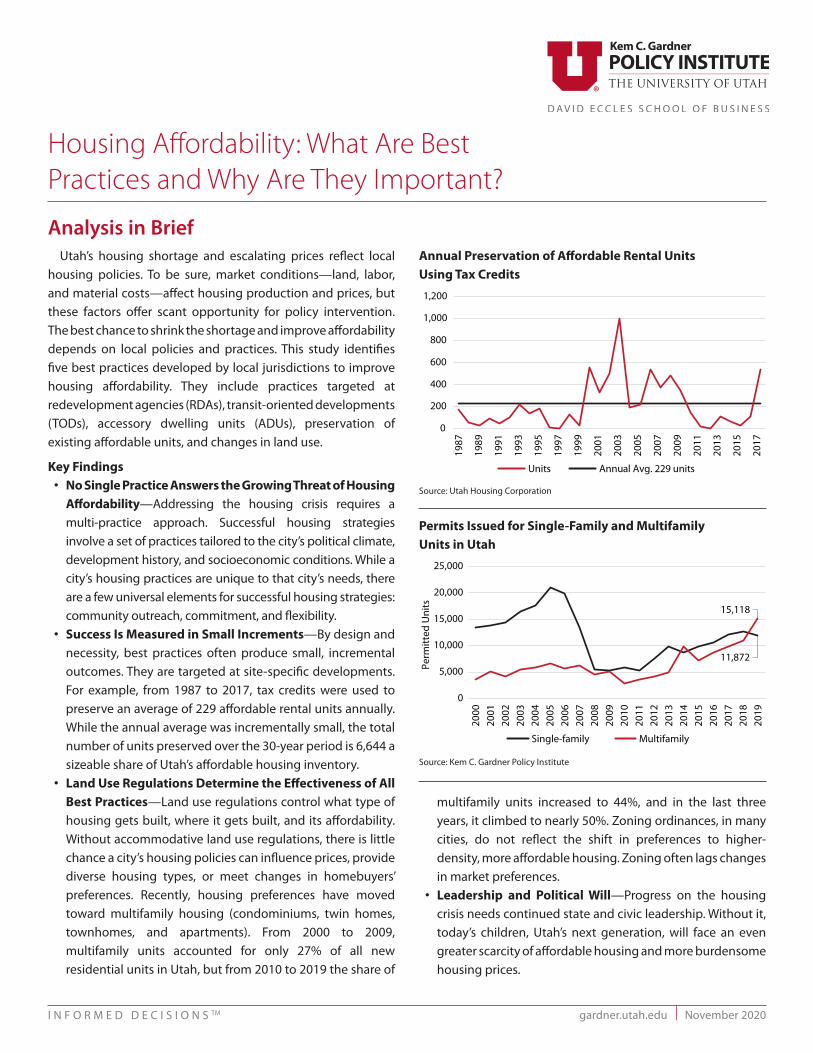
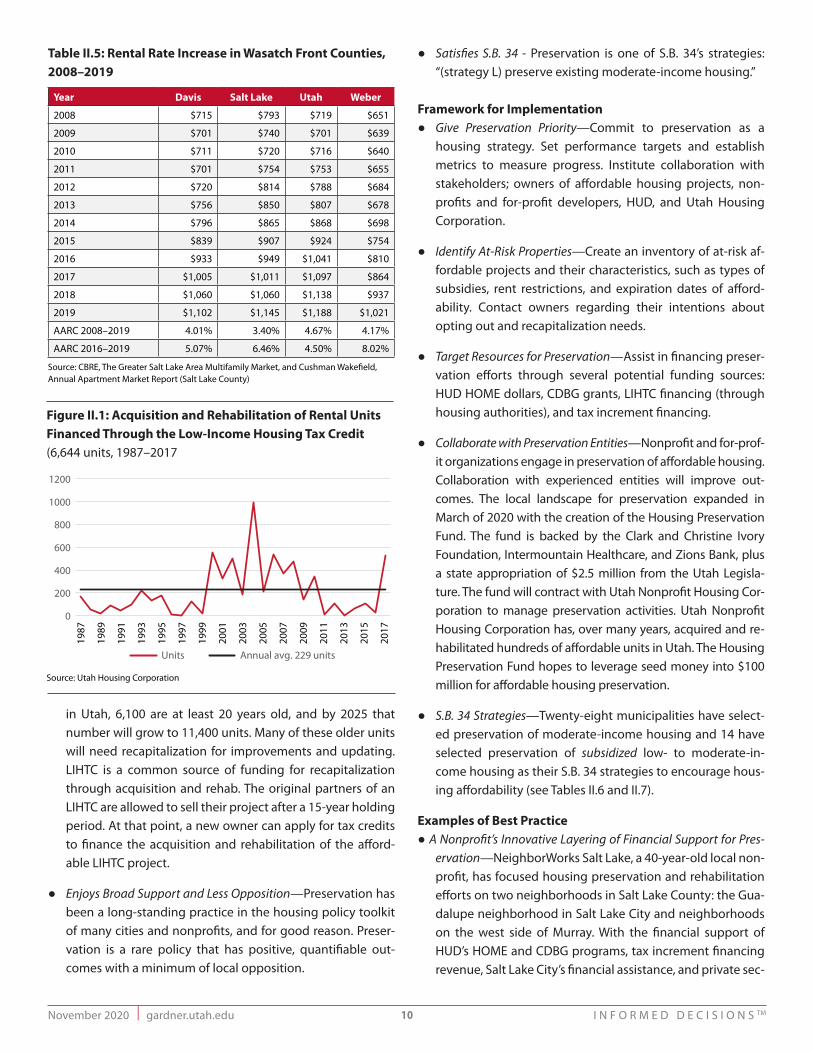
• Success Is Measured in Small Increments—By design and necessity, best practices often produce small, incremental outcomes. They are targeted at site-specific developments. For example, from 1987 to 2017, tax credits were used to preserve an average of 229 affordable rental units annually. While the annual average was incrementally small, the total number of units preserved over the 30-year period is 6,644 a sizeable share of Utah’s affordable housing inventory.
• Land Use Regulations Determine the Effectiveness of All Best Practices—Land use regulations control what type of housing gets built, where it gets built, and its affordability. Without accommodative land use regulations, there is little chance a city’s housing policies can influence prices, provide diverse housing types, or meet changes in homebuyers’ preferences. Recently, housing preferences have moved toward multifamily housing (condominiums, twin homes, townhomes, and apartments). From 2000 to 2009, multifamily units accounted for only 27% of all new residential units in Utah, but from 2010 to 2019 the share of
Analysis in Brief
multifamily units increased to 44%, and in the last three years, it climbed to nearly 50%. Zoning ordinances, in many cities, do not reflect the shift in preferences to higher-density, more affordable housing. Zoning often lags changes in market preferences.
• Leadership and Political Will—Progress on the housing crisis needs continued state and civic leadership. Without it, today’s children, Utah’s next generation, will face an even greater scarcity of affordable housing and more burdensome housing prices.
Permits Issued for Single-Family and Multifamily Units in Utah
0
200
400
600
800
1,000
1,200
1987
1989
1991
1993
1995
1997
1999
2001
2003
2005
2007
2009
2011
2013
2015
2017
1987
1989
1991
1993
1995
1997
1999
2001
2003
2005
2007
2009
2011
2013
2015
2017
Units Annual Avg. 229 units
11,872
15,118
0
5,000
10,000
15,000
20,000
25,000
2000
2001
2002
2003
2004
2005
2006
2007
2008
2009
2010
2011
2012
2013
2014
2015
2016
2017
2018
2019
Perm
itted
Uni
ts
Single-family Multifamily
9.3%10.7%10.9%11.7%
16.8%17.7%18.7%19.0%19.1%19.2%19.3%19.5%
22.3%23.0%23.6%
25.3%26.0%26.1%26.5%27.5%28.2%28.3%29.3%
31.2%31.4%31.4%31.5%32.6%32.6%32.8%33.4%33.5%33.9%34.2%34.5%34.5%34.7%35.2%35.8%36.7%
38.2%39.2%40.4%41.5%
46.2%47.1%48.3%49.1%
53.0%55.7%
59.1%69.6%
0.0% 10.0% 20.0% 30.0% 40.0% 50.0% 60.0% 70.0% 80.0%
North DakotaAlaska
ConnecticutWest Virgina
LouisianaIllinois
MississippiWyoming
New JerseyMaryland
OklahomaDelaware
IowaArkansasVermont
VirginiaPennsylvaniaNew Mexico
New YorkSouth Dakota
KansasKentuckyAlabama
New HampshireHawaii
NebraskaMassachusetts
OhioWisconsin
MontanaUS
MissouriRhode Island
MinnesotaTexas
IndianaMaine
South CarolinaDC
CaliforniaNorth Carolina
MichiganTennessee
GeorgiaArizonaOregonFlorida
ColoradoUtah
NevadaWashington
Idaho
0
200
400
600
800
1000
1200
Units Annual avg. 229 units
Detached Attached
Garage ConversionAbove Garage
Interior (upper level)
Interior (lower level)
54%Long-term rental (rental)
19%Short-term rental (vacation)
65%Primary residence (for owner)
40%Other*
Source: Kem C. Gardner Policy Institute
Annual Preservation of Affordable Rental Units Using Tax Credits
Source: Utah Housing Corporation
0
200
400
600
800
1,000
1,200
1987
1989
1991
1993
1995
1997
1999
2001
2003
2005
2007
2009
2011
2013
2015
2017
1987
1989
1991
1993
1995
1997
1999
2001
2003
2005
2007
2009
2011
2013
2015
2017
Units Annual Avg. 229 units
11,872
15,118
0
5,000
10,000
15,000
20,000
25,000
2000
2001
2002
2003
2004
2005
2006
2007
2008
2009
2010
2011
2012
2013
2014
2015
2016
2017
2018
2019
Perm
itted
Uni
ts
Single-family Multifamily
9.3%10.7%10.9%11.7%
16.8%17.7%18.7%19.0%19.1%19.2%19.3%19.5%
22.3%23.0%23.6%
25.3%26.0%26.1%26.5%27.5%28.2%28.3%29.3%
31.2%31.4%31.4%31.5%32.6%32.6%32.8%33.4%33.5%33.9%34.2%34.5%34.5%34.7%35.2%35.8%36.7%
38.2%39.2%40.4%41.5%
46.2%47.1%48.3%49.1%
53.0%55.7%
59.1%69.6%
0.0% 10.0% 20.0% 30.0% 40.0% 50.0% 60.0% 70.0% 80.0%
North DakotaAlaska
ConnecticutWest Virgina
LouisianaIllinois
MississippiWyoming
New JerseyMaryland
OklahomaDelaware
IowaArkansasVermont
VirginiaPennsylvaniaNew Mexico
New YorkSouth Dakota
KansasKentuckyAlabama
New HampshireHawaii
NebraskaMassachusetts
OhioWisconsin
MontanaUS
MissouriRhode Island
MinnesotaTexas
IndianaMaine
South CarolinaDC
CaliforniaNorth Carolina
MichiganTennessee
GeorgiaArizonaOregonFlorida
ColoradoUtah
NevadaWashington
Idaho
0
200
400
600
800
1000
1200
Units Annual avg. 229 units
Detached Attached
Garage ConversionAbove Garage
Interior (upper level)
Interior (lower level)
54%Long-term rental (rental)
19%Short-term rental (vacation)
65%Primary residence (for owner)
40%Other*
November 2020 I gardner.utah.edu I N F O R M E D D E C I S I O N S TM
Table of ContentsI. Zoning Changes and Housing Affordability . . . . . . . . . . 1
Background . . . . . . . . . . . . . . . . . . . . . . . . . . . . . . . . . . . . . . . . . . . .1Why Zoning Changes Are a Best Practice . . . . . . . . . . . . . . . .1Framework for Implementation . . . . . . . . . . . . . . . . . . . . . . . . .5Examples of Best Practice . . . . . . . . . . . . . . . . . . . . . . . . . . . . . . .6
II. Preservation of Affordable Housing . . . . . . . . . . . . . . . . . 8Background . . . . . . . . . . . . . . . . . . . . . . . . . . . . . . . . . . . . . . . . . . . .8Why Preservation is a Best Practice . . . . . . . . . . . . . . . . . . . . . .8Framework for Implementation . . . . . . . . . . . . . . . . . . . . . . . 10Examples of Best Practice . . . . . . . . . . . . . . . . . . . . . . . . . . . . . 10Variations on a Theme . . . . . . . . . . . . . . . . . . . . . . . . . . . . . . . . 11
III. Redevelopment Agencies, Tax Increment Financing, and Housing Affordability . . . . . . . . . . . . . .12Background . . . . . . . . . . . . . . . . . . . . . . . . . . . . . . . . . . . . . . . . . . 12Why Tax Increment Financing Is a Best Practice . . . . . . . . 12Framework for Implementation . . . . . . . . . . . . . . . . . . . . . . . 14Examples of Best Practice . . . . . . . . . . . . . . . . . . . . . . . . . . . . . 14
IV. Accessory Dwelling Units and Housing Affordability 16Background . . . . . . . . . . . . . . . . . . . . . . . . . . . . . . . . . . . . . . . . . . 16Why ADUs Are a Best Practice . . . . . . . . . . . . . . . . . . . . . . . . . 16Framework for Implementation . . . . . . . . . . . . . . . . . . . . . . . 17Examples of Best Practice . . . . . . . . . . . . . . . . . . . . . . . . . . . . . 17
V. Transit-Oriented Development and Housing Affordability . . . . . . . . . . . . . . . . . . . . . . . . . . . . . . . . . . . . .19Background . . . . . . . . . . . . . . . . . . . . . . . . . . . . . . . . . . . . . . . . . . 19Why Transit-Oriented Developments
Are a Best Practice . . . . . . . . . . . . . . . . . . . . . . . . . . . . . . . . . . 19Framework for Implementation . . . . . . . . . . . . . . . . . . . . . . . 20Examples of Best Practice . . . . . . . . . . . . . . . . . . . . . . . . . . . . . 20Variations on a Theme . . . . . . . . . . . . . . . . . . . . . . . . . . . . . . . . 21
VI. Survey of Best Practices . . . . . . . . . . . . . . . . . . . . . . . . . . .22
VII. Examples of Best Practices Outside of Utah . . . . . . . . .23A. Public Asset Management and Housing
Affordability . . . . . . . . . . . . . . . . . . . . . . . . . . . . . . . . . . 23B. Up-Zoning and Housing Affordability . . . . . . . . . . . . . 24C. Housing Affordability and Adaptive Reuse of
Commercial for Residential . . . . . . . . . . . . . . . . . . . . 24D. Housing Trust Funds and Affordable Housing . . . . . . 25E. State Leadership and Housing Affordability . . . . . . . 26
Other Local Studies on Housing Affordability . . . . . . . . . . .27
FiguresFigure I.1: Change in Housing Price Index by State . . . . . . . . .2Figure I.2: Top 25 Metro Areas Ranked by Median
Sales Price of Single-Family Homes, Q1 2020 . . . . . . . . . . . . .3Figure I.3: Market-Rate Apartment Projects
Completed in Salt Lake County, 2000–2019 . . . . . . . . . . . . . .4Figure I.4: Comparison of Form-Based Code to
Conventional Zoning . . . . . . . . . . . . . . . . . . . . . . . . . . . . . . . . . . .7
Figure II.1: Acquisition and Rehabilitation of Rental Units Financed Through the Low-Income Housing Tax Credit . . . . . . . . . . . . . . . . . . . . . . . . . . . . . . . . . . . . . . . . . . . . 10
Figure IV.1: Different Ways to Integrate ADUs with Existing Housing . . . . . . . . . . . . . . . . . . . . . . . . . . . . . . . . . . . . . . 16
Figure IV.2: Permitted ADU Occupancy in Cities that Allow ADUs . . . . . . . . . . . . . . . . . . . . . . . . . . . . . . . . . . . . . . 18
Figure A.1: Copenhagen Mechanism for CPH City & Port Development . . . . . . . . . . . . . . . . . . . . . . . . . . . . . . . . . . 23
TablesTable I.1: Utah Households for Selected Years, 2009–2025 . .1Table I.2: Permits Issued for Residential Units in Utah . . . . . . .2Table I.3: Top Five Large Metropolitan Areas Ranked by
Change in Price Index . . . . . . . . . . . . . . . . . . . . . . . . . . . . . . . . . . .2Table I.4: Developed Residential Acreage by Type of
Use, Salt Lake County, 2019 . . . . . . . . . . . . . . . . . . . . . . . . . . . . .4Table I.5: S.B. 34 Strategies Selected by Municipalities . . . . . .6Table II.1: Rental Properties at Risk of Opting Out,
2020–2025 . . . . . . . . . . . . . . . . . . . . . . . . . . . . . . . . . . . . . . . . . . . . .8Table II.2: Expiration Date and At-Risk Units in HUD
Apartment Communities in Utah . . . . . . . . . . . . . . . . . . . . . . . .8Table II.3: Expiration Date of Low-Income Housing
Tax Credit Projects in Utah, 2020–2025 . . . . . . . . . . . . . . . . . .9Table II.4: Gap of Affordable and Available Rental
Units for Renters at 0–50% AMI in Utah . . . . . . . . . . . . . . . . . .9Table II.5: Rental Rate Increase in Wasatch Front
Counties, 2008–2019 . . . . . . . . . . . . . . . . . . . . . . . . . . . . . . . . . 10Table II.6: Cities That Have Selected Preserving Existing
Moderate-Income Housing as an S.B. 34 Strategy . . . . . . 11Table II.7: Cities That Have Selected to Preserve
Subsidized Low- to Moderate-Income Units on a Long-Term Basis as an S.B. 34 Strategy . . . . . . . . . . . . . . . . . . . . . . . 11
Table III.1: Housing Units Facilitated by Tax Increment Financing in Selected Cities . . . . . . . . . . . . . . . . . . . . . . . . . . . 12
Table III.2: Project Areas by Type in Cities and Counties, 2018 . . . . . . . . . . . . . . . . . . . . . . . . . . . . . . . . . . . . . . . . 12
Table III.3: Project Areas by County and City . . . . . . . . . . . . . . 13Table IV.1: Share of Attached Renter-Occupied Units in
Single-Unit Structures for Cities with 20,000 or More Residents in Utah, 2014–2018 . . . . . . . . . . . . . . . . . . . 18
Table V.1: Market Rate Apartments Near UTA Rail Stations in Cities and Towns in Salt Lake County, 2018 . . 19
Table V.2: Low-Income Housing Tax Credit Units Near UTA Rail Stations in Cities and Towns in Salt Lake County, 2017 . . . . . . . . . . . . . . . . . . . . . . . . . . . . . . . . . . . . . . . . . 19
Table VI.1: Respondents to Best Practices Survey . . . . . . . . . 22
gardner.utah.edu I November 2020I N F O R M E D D E C I S I O N S TM 1
I. Zoning Changes and Housing Affordability
BackgroundIn 1908, Los Angeles became the first city to adopt a local
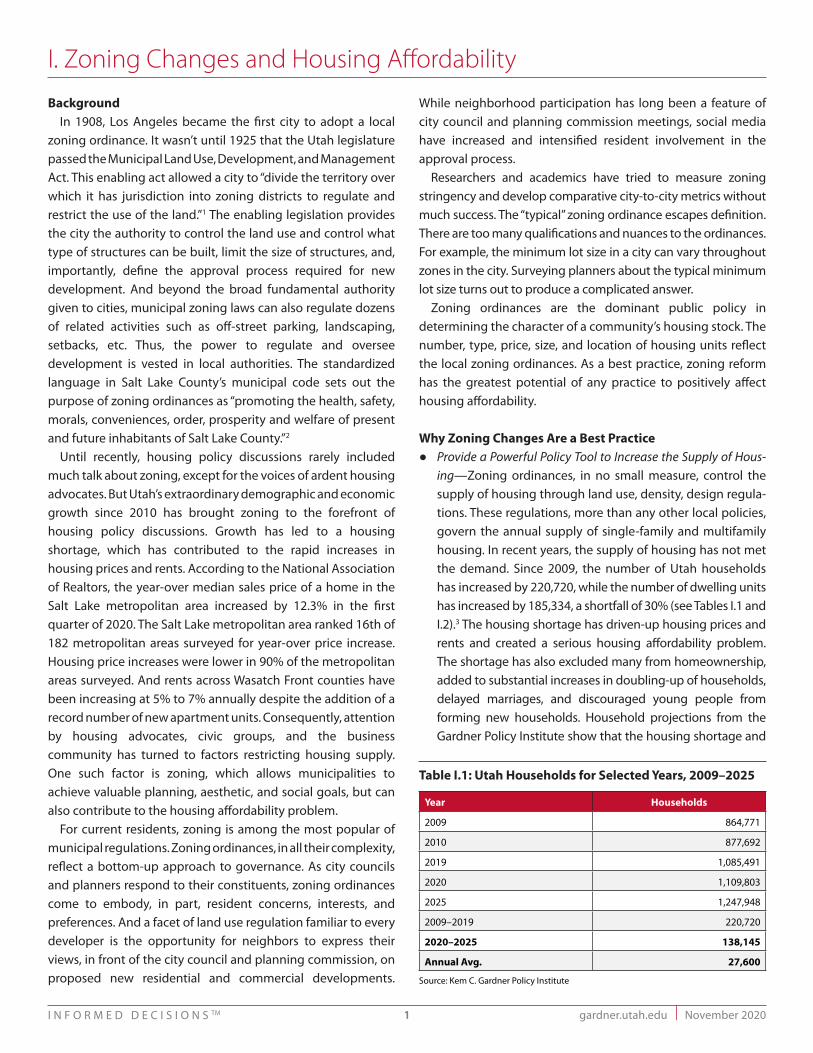
zoning ordinance. It wasn’t until 1925 that the Utah legislature passed the Municipal Land Use, Development, and Management Act. This enabling act allowed a city to “divide the territory over which it has jurisdiction into zoning districts to regulate and restrict the use of the land.”1 The enabling legislation provides the city the authority to control the land use and control what type of structures can be built, limit the size of structures, and, importantly, define the approval process required for new development. And beyond the broad fundamental authority given to cities, municipal zoning laws can also regulate dozens of related activities such as off-street parking, landscaping, setbacks, etc. Thus, the power to regulate and oversee development is vested in local authorities. The standardized language in Salt Lake County’s municipal code sets out the purpose of zoning ordinances as “promoting the health, safety, morals, conveniences, order, prosperity and welfare of present and future inhabitants of Salt Lake County.”2
Until recently, housing policy discussions rarely included much talk about zoning, except for the voices of ardent housing advocates. But Utah’s extraordinary demographic and economic growth since 2010 has brought zoning to the forefront of housing policy discussions. Growth has led to a housing shortage, which has contributed to the rapid increases in housing prices and rents. According to the National Association of Realtors, the year-over median sales price of a home in the Salt Lake metropolitan area increased by 12.3% in the first quarter of 2020. The Salt Lake metropolitan area ranked 16th of 182 metropolitan areas surveyed for year-over price increase. Housing price increases were lower in 90% of the metropolitan areas surveyed. And rents across Wasatch Front counties have been increasing at 5% to 7% annually despite the addition of a record number of new apartment units. Consequently, attention by housing advocates, civic groups, and the business community has turned to factors restricting housing supply. One such factor is zoning, which allows municipalities to achieve valuable planning, aesthetic, and social goals, but can also contribute to the housing affordability problem.
For current residents, zoning is among the most popular of municipal regulations. Zoning ordinances, in all their complexity, reflect a bottom-up approach to governance. As city councils and planners respond to their constituents, zoning ordinances come to embody, in part, resident concerns, interests, and preferences. And a facet of land use regulation familiar to every developer is the opportunity for neighbors to express their views, in front of the city council and planning commission, on proposed new residential and commercial developments.
While neighborhood participation has long been a feature of city council and planning commission meetings, social media have increased and intensified resident involvement in the approval process.
Researchers and academics have tried to measure zoning stringency and develop comparative city-to-city metrics without much success. The “typical” zoning ordinance escapes definition. There are too many qualifications and nuances to the ordinances. For example, the minimum lot size in a city can vary throughout zones in the city. Surveying planners about the typical minimum lot size turns out to produce a complicated answer.
Zoning ordinances are the dominant public policy in determining the character of a community’s housing stock. The number, type, price, size, and location of housing units reflect the local zoning ordinances. As a best practice, zoning reform has the greatest potential of any practice to positively affect housing affordability.
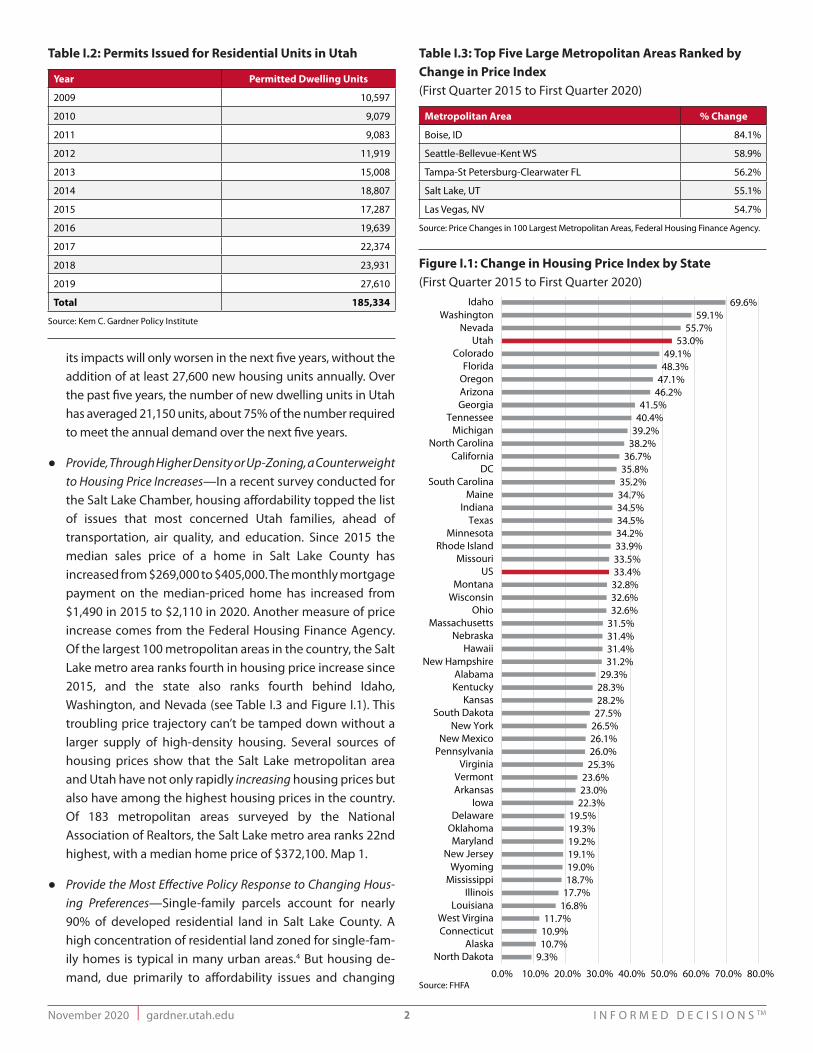
Why Zoning Changes Are a Best Practice● Provide a Powerful Policy Tool to Increase the Supply of Hous-
ing—Zoning ordinances, in no small measure, control the supply of housing through land use, density, design regula-tions. These regulations, more than any other local policies, govern the annual supply of single-family and multifamily housing. In recent years, the supply of housing has not met the demand. Since 2009, the number of Utah households has increased by 220,720, while the number of dwelling units has increased by 185,334, a shortfall of 30% (see Tables I.1 and I.2).3 The housing shortage has driven-up housing prices and rents and created a serious housing affordability problem. The shortage has also excluded many from homeownership, added to substantial increases in doubling-up of households, delayed marriages, and discouraged young people from forming new households. Household projections from the Gardner Policy Institute show that the housing shortage and
Table I.1: Utah Households for Selected Years, 2009–2025
Year Households
2009 864,771
2010 877,692
2019 1,085,491
2020 1,109,803
2025 1,247,948
2009–2019 220,720
2020–2025 138,145
Annual Avg. 27,600
Source: Kem C. Gardner Policy Institute
November 2020 I gardner.utah.edu I N F O R M E D D E C I S I O N S TM2
its impacts will only worsen in the next five years, without the addition of at least 27,600 new housing units annually. Over the past five years, the number of new dwelling units in Utah has averaged 21,150 units, about 75% of the number required to meet the annual demand over the next five years.
● Provide, Through Higher Density or Up-Zoning, a Counterweight to Housing Price Increases—In a recent survey conducted for the Salt Lake Chamber, housing affordability topped the list of issues that most concerned Utah families, ahead of transportation, air quality, and education. Since 2015 the median sales price of a home in Salt Lake County has increased from $269,000 to $405,000. The monthly mortgage payment on the median-priced home has increased from $1,490 in 2015 to $2,110 in 2020. Another measure of price increase comes from the Federal Housing Finance Agency. Of the largest 100 metropolitan areas in the country, the Salt Lake metro area ranks fourth in housing price increase since 2015, and the state also ranks fourth behind Idaho, Washington, and Nevada (see Table I.3 and Figure I.1). This troubling price trajectory can’t be tamped down without a larger supply of high-density housing. Several sources of housing prices show that the Salt Lake metropolitan area and Utah have not only rapidly increasing housing prices but also have among the highest housing prices in the country. Of 183 metropolitan areas surveyed by the National Association of Realtors, the Salt Lake metro area ranks 22nd highest, with a median home price of $372,100. Map 1.
● Provide the Most Effective Policy Response to Changing Hous-ing Preferences—Single-family parcels account for nearly 90% of developed residential land in Salt Lake County. A high concentration of residential land zoned for single-fam-ily homes is typical in many urban areas.4 But housing de-mand, due primarily to affordability issues and changing
Table I.2: Permits Issued for Residential Units in Utah
Year Permitted Dwelling Units
2009 10,597
2010 9,079
2011 9,083
2012 11,919
2013 15,008
2014 18,807
2015 17,287
2016 19,639
2017 22,374
2018 23,931
2019 27,610
Total 185,334
Source: Kem C. Gardner Policy Institute
Table I.3: Top Five Large Metropolitan Areas Ranked by Change in Price Index(First Quarter 2015 to First Quarter 2020)
Metropolitan Area % Change
Boise, ID 84.1%
Seattle-Bellevue-Kent WS 58.9%
Tampa-St Petersburg-Clearwater FL 56.2%
Salt Lake, UT 55.1%
Las Vegas, NV 54.7%
Source: Price Changes in 100 Largest Metropolitan Areas, Federal Housing Finance Agency.
Figure I.1: Change in Housing Price Index by State (First Quarter 2015 to First Quarter 2020)
0
200
400
600
800
1,000
1,200
1987
1989
1991
1993
1995
1997
1999
2001
2003
2005
2007
2009
2011
2013
2015
2017
1987
1989
1991
1993
1995
1997
1999
2001
2003
2005
2007
2009
2011
2013
2015
2017
Units Annual Avg. 229 units
11,872
15,118
0
5,000
10,000
15,000
20,000
25,000
2000
2001
2002
2003
2004
2005
2006
2007
2008
2009
2010
2011
2012
2013
2014
2015
2016
2017
2018
2019
Perm
itted
Uni
ts
Single-family Multifamily
9.3%10.7%10.9%11.7%
16.8%17.7%18.7%19.0%19.1%19.2%19.3%19.5%
22.3%23.0%23.6%
25.3%26.0%26.1%26.5%27.5%28.2%28.3%29.3%
31.2%31.4%31.4%31.5%32.6%32.6%32.8%33.4%33.5%33.9%34.2%34.5%34.5%34.7%35.2%35.8%36.7%
38.2%39.2%40.4%41.5%
46.2%47.1%48.3%49.1%
53.0%55.7%
59.1%69.6%
0.0% 10.0% 20.0% 30.0% 40.0% 50.0% 60.0% 70.0% 80.0%
North DakotaAlaska
ConnecticutWest Virgina
LouisianaIllinois
MississippiWyoming
New JerseyMaryland
OklahomaDelaware
IowaArkansasVermont
VirginiaPennsylvaniaNew Mexico
New YorkSouth Dakota
KansasKentuckyAlabama
New HampshireHawaii
NebraskaMassachusetts
OhioWisconsin
MontanaUS
MissouriRhode Island
MinnesotaTexas
IndianaMaine
South CarolinaDC
CaliforniaNorth Carolina
MichiganTennessee
GeorgiaArizonaOregonFlorida
ColoradoUtah
NevadaWashington
Idaho
0
200
400
600
800
1000
1200
Units Annual avg. 229 units
Detached Attached
Garage ConversionAbove Garage
Interior (upper level)
Interior (lower level)
54%Long-term rental (rental)
19%Short-term rental (vacation)
65%Primary residence (for owner)
40%Other*
Source: FHFA
gardner.utah.edu I November 2020I N F O R M E D D E C I S I O N S TM 3
preferences, has shifted toward multifamily living (condo-miniums, townhomes, twin homes, and apartments). From 2000 to 2009, multifamily units accounted for only 27% of all new residential units in Utah, but from 2010 to 2019 the share of multifamily units increased to 44%, and in the last three years it climbed to 50%. Zoning ordinances in many cities lag market preferences. Some cities and states are ad-dressing the issue of outdated zoning ordinances with ag-gressive responses. Oregon and Minneapolis have ended the single-family zone and allowed higher density develop-ment on formerly single-family parcels. Massachusetts, Maryland, Washington, Virginia, and Nebraska are also con-
sidering proposals to change the single-family zone. With-out changes in zoning ordinances that allow more multi-family housing, little progress will be made on easing Utah’s housing shortage and tempering the increase in housing prices and rental rates.
Developed residential acreage in Salt Lake County is heavily concentrated in single-family lots. High-density, multifamily acreage represents a little less than 10% of developed land (see Table I.4). To accommodate shifting preferences for affordable, high-density housing, the future share of developed multifamily acreage will likely increase.
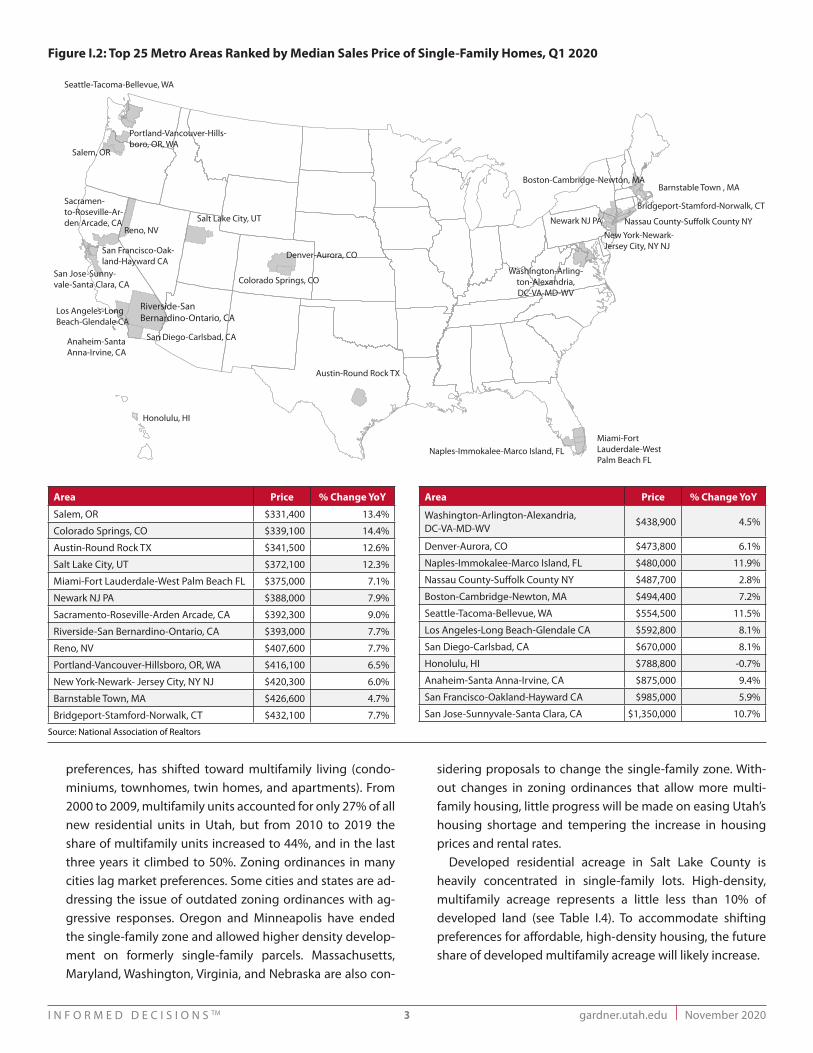
Figure I.2: Top 25 Metro Areas Ranked by Median Sales Price of Single-Family Homes, Q1 2020
Area Price % Change YoY
Salem, OR $331,400 13.4%
Colorado Springs, CO $339,100 14.4%
Austin-Round Rock TX $341,500 12.6%
Salt Lake City, UT $372,100 12.3%
Miami-Fort Lauderdale-West Palm Beach FL $375,000 7.1%
Newark NJ PA $388,000 7.9%
Sacramento-Roseville-Arden Arcade, CA $392,300 9.0%
Riverside-San Bernardino-Ontario, CA $393,000 7.7%
Reno, NV $407,600 7.7%
Portland-Vancouver-Hillsboro, OR, WA $416,100 6.5%
New York-Newark- Jersey City, NY NJ $420,300 6.0%
Barnstable Town, MA $426,600 4.7%
Bridgeport-Stamford-Norwalk, CT $432,100 7.7%
Area Price % Change YoY
Washington-Arlington-Alexandria, DC-VA-MD-WV
$438,900 4.5%
Denver-Aurora, CO $473,800 6.1%
Naples-Immokalee-Marco Island, FL $480,000 11.9%
Nassau County-Suffolk County NY $487,700 2.8%
Boston-Cambridge-Newton, MA $494,400 7.2%
Seattle-Tacoma-Bellevue, WA $554,500 11.5%
Los Angeles-Long Beach-Glendale CA $592,800 8.1%
San Diego-Carlsbad, CA $670,000 8.1%
Honolulu, HI $788,800 -0.7%
Anaheim-Santa Anna-Irvine, CA $875,000 9.4%
San Francisco-Oakland-Hayward CA $985,000 5.9%
San Jose-Sunnyvale-Santa Clara, CA $1,350,000 10.7%
Source: National Association of Realtors
San Jose-Sunny-vale-Santa Clara, CA
Nassau County-Su�olk County NY
Boston-Cambridge-Newton, MA
Denver-Aurora, CO
Los Angeles-Long Beach-Glendale CA
San Diego-Carlsbad, CAAnaheim-Santa Anna-Irvine, CA
San Francisco-Oak-land-Hayward CA
New York-Newark- Jersey City, NY NJ
Washington-Arling-ton-Alexandria, DC-VA-MD-WV
Bridgeport-Stamford-Norwalk, CT
Barnstable Town , MA
Portland-Vancouver-Hills-boro, OR, WA
Reno, NV
Honolulu, HI
Seattle-Tacoma-Bellevue, WA
Riverside-San Bernardino-Ontario, CA
Sacramen-to-Roseville-Ar-den Arcade, CA
Miami-Fort Lauderdale-West Palm Beach FL
Newark NJ PASalt Lake City, UT
Austin-Round Rock TX
Colorado Springs, CO
Salem, OR
Naples-Immokalee-Marco Island, FL
November 2020 I gardner.utah.edu I N F O R M E D D E C I S I O N S TM4
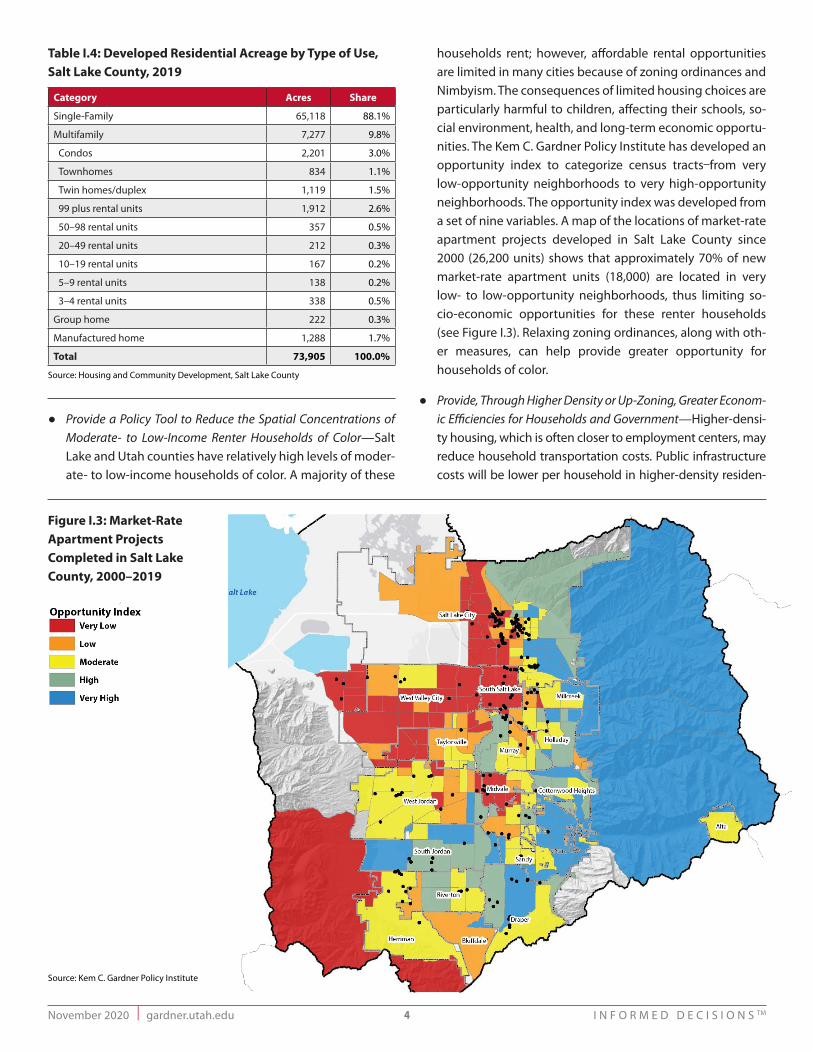
● Provide a Policy Tool to Reduce the Spatial Concentrations of Moderate- to Low-Income Renter Households of Color—Salt Lake and Utah counties have relatively high levels of moder-ate- to low-income households of color. A majority of these
households rent; however, affordable rental opportunities are limited in many cities because of zoning ordinances and Nimbyism. The consequences of limited housing choices are particularly harmful to children, affecting their schools, so-cial environment, health, and long-term economic opportu-nities. The Kem C. Gardner Policy Institute has developed an opportunity index to categorize census tracts from very low-opportunity neighborhoods to very high-opportunity neighborhoods. The opportunity index was developed from a set of nine variables. A map of the locations of market-rate apartment projects developed in Salt Lake County since 2000 (26,200 units) shows that approximately 70% of new market-rate apartment units (18,000) are located in very low- to low-opportunity neighborhoods, thus limiting so-cio-economic opportunities for these renter households (see Figure I.3). Relaxing zoning ordinances, along with oth-er measures, can help provide greater opportunity for households of color.
● Provide, Through Higher Density or Up-Zoning, Greater Econom-ic Efficiencies for Households and Government—Higher-densi-ty housing, which is often closer to employment centers, may reduce household transportation costs. Public infrastructure costs will be lower per household in higher-density residen-
Table I.4: Developed Residential Acreage by Type of Use, Salt Lake County, 2019
Category Acres Share
Single-Family 65,118 88.1%
Multifamily 7,277 9.8%
Condos 2,201 3.0%
Townhomes 834 1.1%
Twin homes/duplex 1,119 1.5%
99 plus rental units 1,912 2.6%
50–98 rental units 357 0.5%
20–49 rental units 212 0.3%
10–19 rental units 167 0.2%
5–9 rental units 138 0.2%
3–4 rental units 338 0.5%
Group home 222 0.3%
Manufactured home 1,288 1.7%
Total 73,905 100.0%
Source: Housing and Community Development, Salt Lake County
Figure I.3: Market-Rate Apartment Projects Completed in Salt Lake County, 2000–2019
Source: Kem C. Gardner Policy Institute
gardner.utah.edu I November 2020I N F O R M E D D E C I S I O N S TM 5
tial developments. Higher housing densities, particularly sur-rounding transit-oriented developments (TODs), improve public transportation efficiency. And high-density housing is an essential component of a walkable community.
● Facilitate Long-Term Economic Growth and Employment Opportunities—In Silicon Valley and New York City, restrictive zoning ordinances have constrained the housing supply, limited employment growth, and left many workers poorer due to the mismatch between where people live and where they work. While Utah’s economic growth has not yet been curbed by housing supply constraints, without modifications of local zoning ordinances, its long-term economic potential will not be realized.
● Facilitate the Effectiveness of Other Best Practices—The other best practices discussed in this report depend on revisions or adaptations in existing zoning ordinances. Pursuing measures to address housing affordability through the development of TODs, redevelopment agencies, accessory dwelling units, or preservation will likely require conditional use permits and at least some minor changes in the zoning ordinances. And at a broader level, two of Utah’s leading planning organizations, Wasatch Front Regional Council and Envision Utah, both see metropolitan centers, urban centers, and city centers as key to the future of land use development. A concept of centered development includes high-density residential development.
● Facilitate, Through Increased Rates of Homeownership, Wealth Creation—Homeownership is the major source of wealth for moderate-income households. Harvard’s Joint Center for Housing Studies found that, nationally, moderate-income households ($39,500 to $45,570 in household income) with a household head between 50 and 64 years old have median home equity of $75,000, while a renter has no wealth from home equity.5 Nationally, housing wealth accounts for about half the net wealth of moderate-income households. In Utah, where housing prices over the last 30 years have increased at more than double the national rate, the moderate-income homeowner could have as much as $150,000 in home equity or housing wealth. Zoning that allows for more affordable homeownership opportunities reduces wealth inequality and provides housing security in some cases for multiple generations.6
● Satisfy S.B. 34—The 2019 Utah Legislature passed S.B. 34 Affordable Housing Modifications. The bill requires local communities to develop a moderate-income housing (MIH) plan as part of their general plan. The MIH plan requires local communities to adopt at least three strategies from a list of 23 strategies targeted at improving housing affordability.
Communities are then required to report on the implementation and outcomes of their selected strategies annually. Failure to implement the strategies will exclude the community from state transportation funds. The first strategy listed in S.B. 34 encourages a city “to rezone for densities necessary to assure the production of moderate-income housing.” 7 Up-zoning meets one of the requirements of S.B. 34.
Framework for Implementation● Political and Civic Engagement—The level of participation in
housing issues by the Utah Legislature, cities and counties, the Salt Lake Chamber, nonprofit organizations, and corporations is unprecedented. The convergence of three issues has prompted this engagement: (1) the homeless crisis, (2) the housing shortage, and (3) the housing affordability challenge. These related issues pose near- and long-term threats to the economic well-being of Utah households, individual opportunity, and the state’s economic prosperity. But given the more favorable political and civic environment, the chances of meaningful local land-use revisions, to mitigate these threats, are the best in years.
● Community Engagement—New residential or commercial de-velopments often require a zoning variance and/or condi-tional use permit. Approval for the variance will trigger public hearings. Thus, land use regulations provide opportunities for neighborhoods and individuals to be involved in the ap-proval process, to voice their support or opposition to a pro-posed high-density development. Consequently, communi-ty engagement and coalition building become an essential component of the implementation framework. In addition to stakeholder outreach, another critical component is proj-ect design; careful design, compatible with zoning ordi-nances and neighborhood expectations, increases the likeli-hood of approval.
● Complementary Policies—Less restrictive zoning is a necessary condition for improved housing affordability and increased housing production. Complementary policies that would enhance less restrictive zoning include streamlining and standardizing the uncertain and time-consuming approval process and adopting form-based code for selected zones.
● S.B. 34 Incentivizes Zoning Changes—The 2019 Utah Legislature passed S.B. 34 Affordable Housing Modifications. The bill enacted new policies for cities to encourage local officials to plan and zone for affordable housing. The legislation provided a list of 23 strategies to encourage housing affordability. Cities are required to select at least three strategies to be eligible to apply for $700 million in
November 2020 I gardner.utah.edu I N F O R M E D D E C I S I O N S TM6
state transportation funds. While outcomes of policy changes will not be documented until 2021, it’s encouraging that three of the four most frequently selected strategies applied to zoning (see Table I.5).
Examples of Best Practice● Salt Lake City’s Affordable Housing Overlay—The American
Planning Association defines an overlay zone as “a zoning district applied over one or more previously established zoning districts, establishing additional or stricter standards and criteria for covered properties in addition to those of the underlying zoning district. Overlay zones can be used to promote specific development projects such as mixed-use developments, waterfront developments, housing along transit corridors, or affordable housing.”
Table I.5: S.B. 34 Strategies Selected by Municipalities
StrategiesNumber of Municipalities Committing to Strategy
Create or allow for, and reduce regulations related to, accessory dwelling units in residential zones 57
Rezone for densities necessary to assure the production of MIH (moderate-income housing) 50
Allow for higher density or moderate-income residential development in commercial and mixed-use zones, commercial centers, or employment centers
46
Encourage higher density or moderate-income residential development near major transit investment corridors 39
Facilitate the rehabilitation or expansion of infrastructure that will encourage the construction of MIH 32
Preserve existing MIH 28
Implement zoning incentives for low- to moderate-income units in new developments 26
Any other program or strategy implemented by the municipality to address the housing needs of residents of the municipality who earn less than 80% of the area median income
22
Eliminate or reduce parking requirements for residential development where a resident is less likely to rely on their own vehicle, e.g. residential development near major transit investment corridors or senior living facilities
21
Facilitate the rehabilitation of existing uninhabitable housing stock into MIH 17
Utilize strategies that preserve subsidized low- to moderate-income units on a long-term basis 15
Apply for or partner with an entity that applies for services provided by a public housing authority to preserve and create MIH 14
Utilize an MIH set aside from a community reinvestment agency, redevelopment agency, or community development and renewal agency
13
Consider general fund subsidies or other sources of revenue to waive construction-related fees that are otherwise generally imposed by the city
12
Reduce impact fees, as defined in Section 11-36a-102, related to low and MIH 12
Apply for or partner with an entity that applies for state or federal funds or tax incentives to promote the construction of MIH 12
Apply for or partner with an entity that applies for programs offered by the Utah Housing Corporation within that agency’s funding capacity
12
Apply for or partner with an entity that applies for programs administered by an association of governments established by an interlocal agreement under Title 11, Chapter 13, Interlocal Cooperation Act.
11
Implement a mortgage assistance program for employees of the municipality or of an employer that provides contracted services to the municipality
10
Apply for or partner with an entity that applies for programs administered by a metropolitan planning organization or other transportation agency that provides technical planning assistance
10
Apply for or partner with an entity that applies for affordable housing programs administered by the Department of Workforce Services
9
Allow for single-room-occupancy developments 6
Participate in a community land trust program for low or MIH 4
Source: Utah Department of Workforce Services
Salt Lake City is the first municipality in Utah to pursue an overlay zone for affordable housing. While Salt Lake City’s overlay zone has not yet been finalized, the city is in the final stages of community engagement and input. In 2019 the city surveyed residents regarding an overlay zone. The survey results have helped the city develop the overlay’s preliminary criteria. In July 2020, the city held a virtual open house to discuss the survey results and overlay zone’s criteria. The city has made an extensive effort at resident and stakeholder engagement. The city’s goal is to modify zoning to promote more affordable housing and increase the residential density in the city. The overlay zone will have three basic elements: modification of density limits, modification of lot requirements, and accommodation of adaptive reuse.
gardner.utah.edu I November 2020I N F O R M E D D E C I S I O N S TM 7
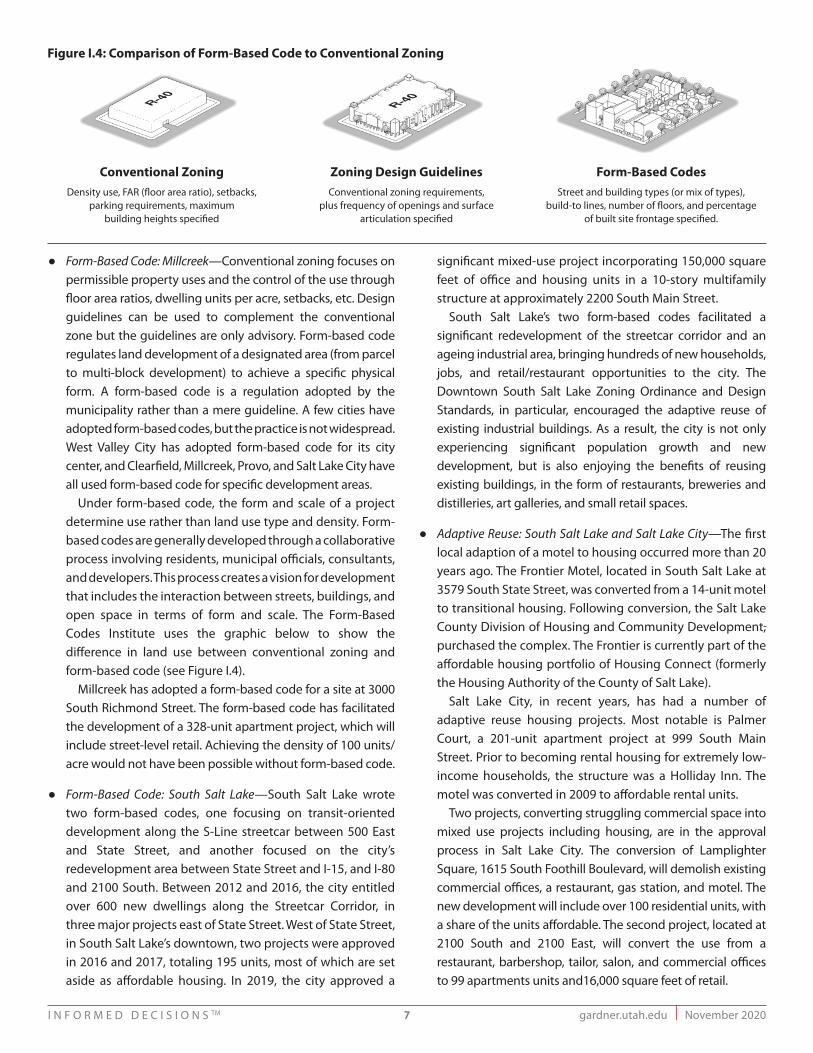
● Form-Based Code: Millcreek—Conventional zoning focuses on permissible property uses and the control of the use through floor area ratios, dwelling units per acre, setbacks, etc. Design guidelines can be used to complement the conventional zone but the guidelines are only advisory. Form-based code regulates land development of a designated area (from parcel to multi-block development) to achieve a specific physical form. A form-based code is a regulation adopted by the municipality rather than a mere guideline. A few cities have adopted form-based codes, but the practice is not widespread. West Valley City has adopted form-based code for its city center, and Clearfield, Millcreek, Provo, and Salt Lake City have all used form-based code for specific development areas.
Under form-based code, the form and scale of a project determine use rather than land use type and density. Form-based codes are generally developed through a collaborative process involving residents, municipal officials, consultants, and developers. This process creates a vision for development that includes the interaction between streets, buildings, and open space in terms of form and scale. The Form-Based Codes Institute uses the graphic below to show the difference in land use between conventional zoning and form-based code (see Figure I.4).
Millcreek has adopted a form-based code for a site at 3000 South Richmond Street. The form-based code has facilitated the development of a 328-unit apartment project, which will include street-level retail. Achieving the density of 100 units/acre would not have been possible without form-based code.
● Form-Based Code: South Salt Lake—South Salt Lake wrote two form-based codes, one focusing on transit-oriented development along the S-Line streetcar between 500 East and State Street, and another focused on the city’s redevelopment area between State Street and I-15, and I-80 and 2100 South. Between 2012 and 2016, the city entitled over 600 new dwellings along the Streetcar Corridor, in three major projects east of State Street. West of State Street, in South Salt Lake’s downtown, two projects were approved in 2016 and 2017, totaling 195 units, most of which are set aside as affordable housing. In 2019, the city approved a
significant mixed-use project incorporating 150,000 square feet of office and housing units in a 10-story multifamily structure at approximately 2200 South Main Street.
South Salt Lake’s two form-based codes facilitated a significant redevelopment of the streetcar corridor and an ageing industrial area, bringing hundreds of new households, jobs, and retail/restaurant opportunities to the city. The Downtown South Salt Lake Zoning Ordinance and Design Standards, in particular, encouraged the adaptive reuse of existing industrial buildings. As a result, the city is not only experiencing significant population growth and new development, but is also enjoying the benefits of reusing existing buildings, in the form of restaurants, breweries and distilleries, art galleries, and small retail spaces.
● Adaptive Reuse: South Salt Lake and Salt Lake City—The first local adaption of a motel to housing occurred more than 20 years ago. The Frontier Motel, located in South Salt Lake at 3579 South State Street, was converted from a 14-unit motel to transitional housing. Following conversion, the Salt Lake County Division of Housing and Community Development, purchased the complex. The Frontier is currently part of the affordable housing portfolio of Housing Connect (formerly the Housing Authority of the County of Salt Lake).
Salt Lake City, in recent years, has had a number of adaptive reuse housing projects. Most notable is Palmer Court, a 201-unit apartment project at 999 South Main Street. Prior to becoming rental housing for extremely low-income households, the structure was a Holliday Inn. The motel was converted in 2009 to affordable rental units.
Two projects, converting struggling commercial space into mixed use projects including housing, are in the approval process in Salt Lake City. The conversion of Lamplighter Square, 1615 South Foothill Boulevard, will demolish existing commercial offices, a restaurant, gas station, and motel. The new development will include over 100 residential units, with a share of the units affordable. The second project, located at 2100 South and 2100 East, will convert the use from a restaurant, barbershop, tailor, salon, and commercial offices to 99 apartments units and16,000 square feet of retail.
Figure I.4: Comparison of Form-Based Code to Conventional Zoning
Conventional ZoningDensity use, FAR (floor area ratio), setbacks,
parking requirements, maximum building heights specified
Zoning Design GuidelinesConventional zoning requirements,
plus frequency of openings and surface articulation specified
Form-Based CodesStreet and building types (or mix of types),
build-to lines, number of floors, and percentage of built site frontage specified.
November 2020 I gardner.utah.edu I N F O R M E D D E C I S I O N S TM8
II. Preservation of Affordable HousingBackground
Affordable housing preservation programs usually, but not always, target privately owned subsidized rental housing. The subsidies most often include HUD’s Project-Based Rental Assistance (PBRA) program and the Low-Income Housing Tax Credit (LIHTC) program. Privately owned subsidized rental properties are required to remain affordable for a specific period, depending on the program. Once the time requirement has expired, the property owner has three options: (1) renew the original subsidy, (2) secure a different subsidy that maintains the property’s affordability, or (3) opt out of the subsidy program. Opting out almost always leads to a loss of affordable units as rents at the once-affordable project are increased to near market-rate levels. In high-rent markets, owners of subsidized rental properties have a strong incentive to opt out when their subsidy expires.
As indicated above, preservation efforts are not solely limited to subsidized rental property. Unsubsidized affordable rental properties and owner-occupied single-family homes also have been targeted for preservation. Generally, nonprofits and for-profit, private entities are involved in the preservation of unsubsidized affordable housing.
Why Preservation is a Best Practice● Preserves Low Costs—The preservation and rehabilitation of
existing affordable units typically cost, at least, 40% less than the cost of new affordable rental units. Preservation avoids the high development costs of new construction and the neighborhood opposition (Nimbyism) associated with developing new units.
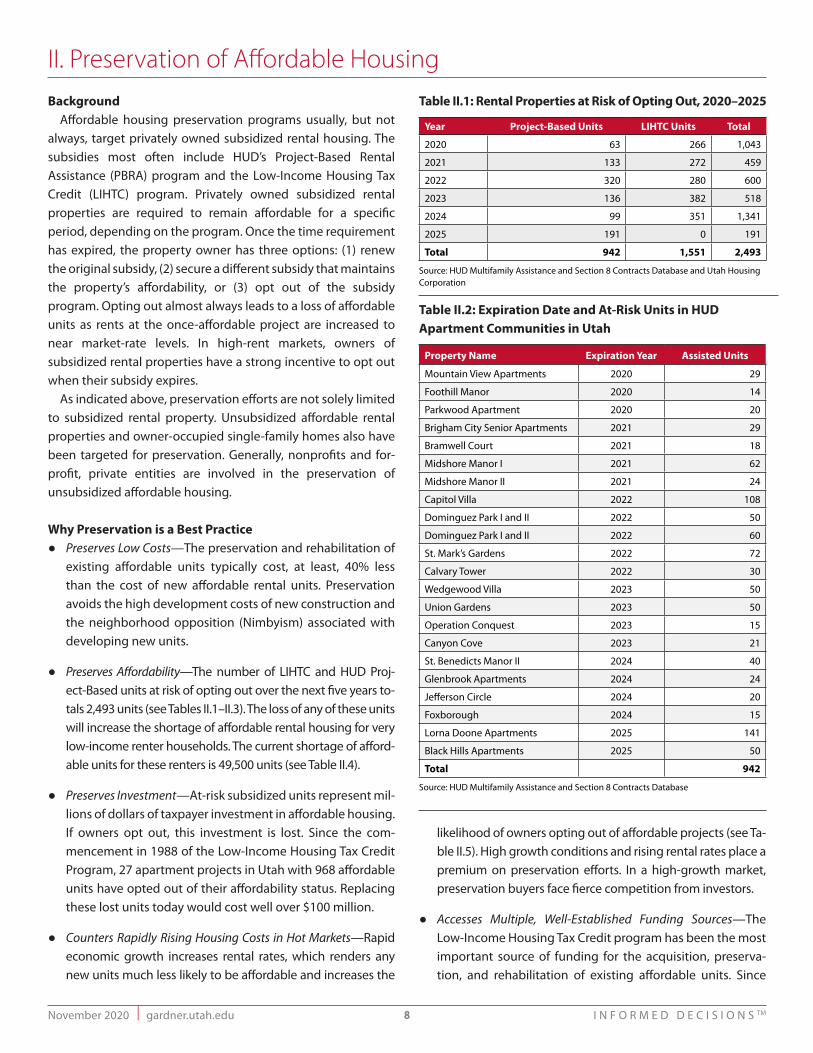
● Preserves Affordability—The number of LIHTC and HUD Proj-ect-Based units at risk of opting out over the next five years to-tals 2,493 units (see Tables II.1–II.3). The loss of any of these units will increase the shortage of affordable rental housing for very low-income renter households. The current shortage of afford-able units for these renters is 49,500 units (see Table II.4).
● Preserves Investment—At-risk subsidized units represent mil-lions of dollars of taxpayer investment in affordable housing. If owners opt out, this investment is lost. Since the com-mencement in 1988 of the Low-Income Housing Tax Credit Program, 27 apartment projects in Utah with 968 affordable units have opted out of their affordability status. Replacing these lost units today would cost well over $100 million.
● Counters Rapidly Rising Housing Costs in Hot Markets—Rapid economic growth increases rental rates, which renders any new units much less likely to be affordable and increases the
likelihood of owners opting out of affordable projects (see Ta-ble II.5). High growth conditions and rising rental rates place a premium on preservation efforts. In a high-growth market, preservation buyers face fierce competition from investors.
● Accesses Multiple, Well-Established Funding Sources—The Low-Income Housing Tax Credit program has been the most important source of funding for the acquisition, preserva-tion, and rehabilitation of existing affordable units. Since
Table II.1: Rental Properties at Risk of Opting Out, 2020–2025
Year Project-Based Units LIHTC Units Total
2020 63 266 1,043
2021 133 272 459
2022 320 280 600
2023 136 382 518
2024 99 351 1,341
2025 191 0 191
Total 942 1,551 2,493
Source: HUD Multifamily Assistance and Section 8 Contracts Database and Utah Housing Corporation
Table II.2: Expiration Date and At-Risk Units in HUD Apartment Communities in Utah
Property Name Expiration Year Assisted Units
Mountain View Apartments 2020 29
Foothill Manor 2020 14
Parkwood Apartment 2020 20
Brigham City Senior Apartments 2021 29
Bramwell Court 2021 18
Midshore Manor I 2021 62
Midshore Manor II 2021 24
Capitol Villa 2022 108
Dominguez Park I and II 2022 50
Dominguez Park I and II 2022 60
St. Mark’s Gardens 2022 72
Calvary Tower 2022 30
Wedgewood Villa 2023 50
Union Gardens 2023 50
Operation Conquest 2023 15
Canyon Cove 2023 21
St. Benedicts Manor II 2024 40
Glenbrook Apartments 2024 24
Jefferson Circle 2024 20
Foxborough 2024 15
Lorna Doone Apartments 2025 141
Black Hills Apartments 2025 50
Total 942
Source: HUD Multifamily Assistance and Section 8 Contracts Database
gardner.utah.edu I November 2020I N F O R M E D D E C I S I O N S TM 9
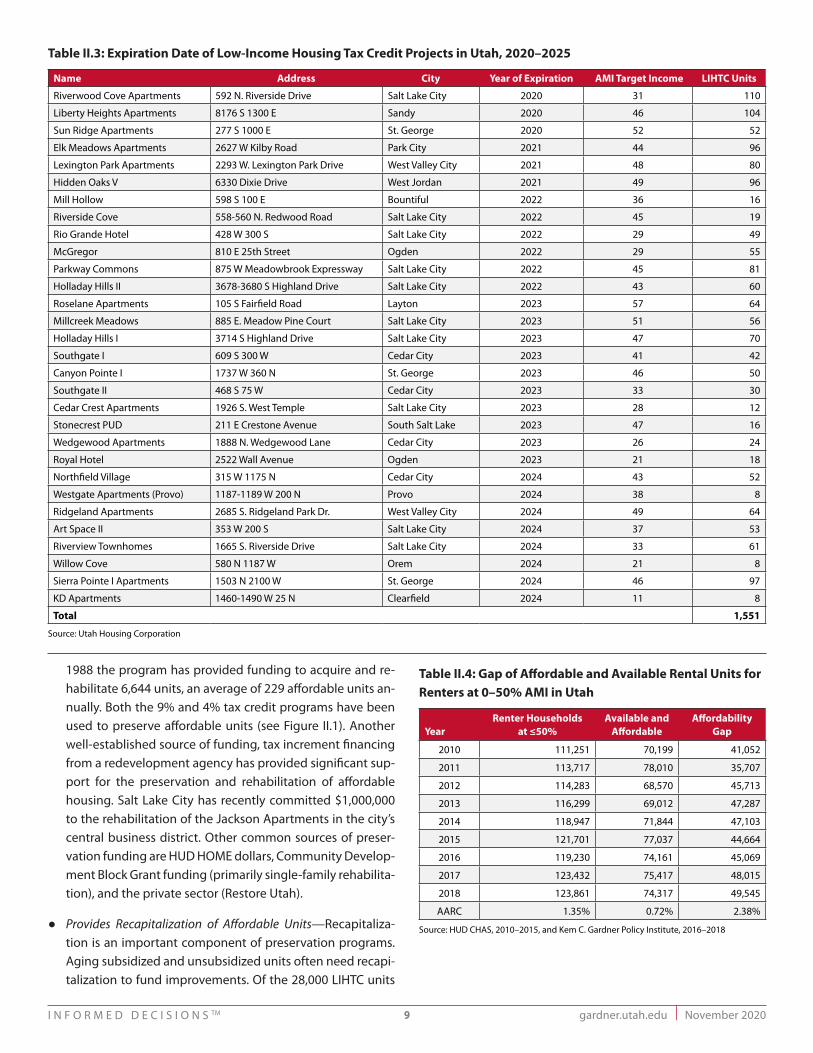
1988 the program has provided funding to acquire and re-habilitate 6,644 units, an average of 229 affordable units an-nually. Both the 9% and 4% tax credit programs have been used to preserve affordable units (see Figure II.1). Another well-established source of funding, tax increment financing from a redevelopment agency has provided significant sup-port for the preservation and rehabilitation of affordable housing. Salt Lake City has recently committed $1,000,000 to the rehabilitation of the Jackson Apartments in the city’s central business district. Other common sources of preser-vation funding are HUD HOME dollars, Community Develop-ment Block Grant funding (primarily single-family rehabilita-tion), and the private sector (Restore Utah).
● Provides Recapitalization of Affordable Units—Recapitaliza-tion is an important component of preservation programs. Aging subsidized and unsubsidized units often need recapi-talization to fund improvements. Of the 28,000 LIHTC units
Table II.3: Expiration Date of Low-Income Housing Tax Credit Projects in Utah, 2020–2025
Name Address City Year of Expiration AMI Target Income LIHTC Units
Riverwood Cove Apartments 592 N. Riverside Drive Salt Lake City 2020 31 110
Liberty Heights Apartments 8176 S 1300 E Sandy 2020 46 104
Sun Ridge Apartments 277 S 1000 E St. George 2020 52 52
Elk Meadows Apartments 2627 W Kilby Road Park City 2021 44 96
Lexington Park Apartments 2293 W. Lexington Park Drive West Valley City 2021 48 80
Hidden Oaks V 6330 Dixie Drive West Jordan 2021 49 96
Mill Hollow 598 S 100 E Bountiful 2022 36 16
Riverside Cove 558-560 N. Redwood Road Salt Lake City 2022 45 19
Rio Grande Hotel 428 W 300 S Salt Lake City 2022 29 49
McGregor 810 E 25th Street Ogden 2022 29 55
Parkway Commons 875 W Meadowbrook Expressway Salt Lake City 2022 45 81
Holladay Hills II 3678-3680 S Highland Drive Salt Lake City 2022 43 60
Roselane Apartments 105 S Fairfield Road Layton 2023 57 64
Millcreek Meadows 885 E. Meadow Pine Court Salt Lake City 2023 51 56
Holladay Hills I 3714 S Highland Drive Salt Lake City 2023 47 70
Southgate I 609 S 300 W Cedar City 2023 41 42
Canyon Pointe I 1737 W 360 N St. George 2023 46 50
Southgate II 468 S 75 W Cedar City 2023 33 30
Cedar Crest Apartments 1926 S. West Temple Salt Lake City 2023 28 12
Stonecrest PUD 211 E Crestone Avenue South Salt Lake 2023 47 16
Wedgewood Apartments 1888 N. Wedgewood Lane Cedar City 2023 26 24
Royal Hotel 2522 Wall Avenue Ogden 2023 21 18
Northfield Village 315 W 1175 N Cedar City 2024 43 52
Westgate Apartments (Provo) 1187-1189 W 200 N Provo 2024 38 8
Ridgeland Apartments 2685 S. Ridgeland Park Dr. West Valley City 2024 49 64
Art Space II 353 W 200 S Salt Lake City 2024 37 53
Riverview Townhomes 1665 S. Riverside Drive Salt Lake City 2024 33 61
Willow Cove 580 N 1187 W Orem 2024 21 8
Sierra Pointe I Apartments 1503 N 2100 W St. George 2024 46 97
KD Apartments 1460-1490 W 25 N Clearfield 2024 11 8
Total 1,551
Source: Utah Housing Corporation
Table II.4: Gap of Affordable and Available Rental Units for Renters at 0–50% AMI in Utah
YearRenter Households
at ≤50%Available and
AffordableAffordability
Gap
2010 111,251 70,199 41,052
2011 113,717 78,010 35,707
2012 114,283 68,570 45,713
2013 116,299 69,012 47,287
2014 118,947 71,844 47,103
2015 121,701 77,037 44,664
2016 119,230 74,161 45,069
2017 123,432 75,417 48,015
2018 123,861 74,317 49,545
AARC 1.35% 0.72% 2.38%
Source: HUD CHAS, 2010–2015, and Kem C. Gardner Policy Institute, 2016–2018
November 2020 I gardner.utah.edu I N F O R M E D D E C I S I O N S TM10
in Utah, 6,100 are at least 20 years old, and by 2025 that number will grow to 11,400 units. Many of these older units will need recapitalization for improvements and updating. LIHTC is a common source of funding for recapitalization through acquisition and rehab. The original partners of an LIHTC are allowed to sell their project after a 15-year holding period. At that point, a new owner can apply for tax credits to finance the acquisition and rehabilitation of the afford-able LIHTC project.
● Enjoys Broad Support and Less Opposition—Preservation has been a long-standing practice in the housing policy toolkit of many cities and nonprofits, and for good reason. Preser-vation is a rare policy that has positive, quantifiable out-comes with a minimum of local opposition.
● Satisfies S.B. 34 - Preservation is one of S.B. 34’s strategies: “(strategy L) preserve existing moderate-income housing.”
Framework for Implementation ● Give Preservation Priority—Commit to preservation as a
housing strategy. Set performance targets and establish metrics to measure progress. Institute collaboration with stakeholders; owners of affordable housing projects, non-profits and for-profit developers, HUD, and Utah Housing Corporation.
● Identify At-Risk Properties—Create an inventory of at-risk af-fordable projects and their characteristics, such as types of subsidies, rent restrictions, and expiration dates of afford-ability. Contact owners regarding their intentions about opting out and recapitalization needs.
● Target Resources for Preservation—Assist in financing preser-vation efforts through several potential funding sources: HUD HOME dollars, CDBG grants, LIHTC financing (through housing authorities), and tax increment financing.
● Collaborate with Preservation Entities—Nonprofit and for-prof-it organizations engage in preservation of affordable housing. Collaboration with experienced entities will improve out-comes. The local landscape for preservation expanded in March of 2020 with the creation of the Housing Preservation Fund. The fund is backed by the Clark and Christine Ivory Foundation, Intermountain Healthcare, and Zions Bank, plus a state appropriation of $2.5 million from the Utah Legisla-ture. The fund will contract with Utah Nonprofit Housing Cor-poration to manage preservation activities. Utah Nonprofit Housing Corporation has, over many years, acquired and re-habilitated hundreds of affordable units in Utah. The Housing Preservation Fund hopes to leverage seed money into $100 million for affordable housing preservation.
● S.B. 34 Strategies—Twenty-eight municipalities have select-ed preservation of moderate-income housing and 14 have selected preservation of subsidized low- to moderate-in-come housing as their S.B. 34 strategies to encourage hous-ing affordability (see Tables II.6 and II.7).
Examples of Best Practice● A Nonprofit’s Innovative Layering of Financial Support for Pres-
ervation—NeighborWorks Salt Lake, a 40-year-old local non-profit, has focused housing preservation and rehabilitation efforts on two neighborhoods in Salt Lake County: the Gua-dalupe neighborhood in Salt Lake City and neighborhoods on the west side of Murray. With the financial support of HUD’s HOME and CDBG programs, tax increment financing revenue, Salt Lake City’s financial assistance, and private sec-
Table II.5: Rental Rate Increase in Wasatch Front Counties, 2008–2019
Year Davis Salt Lake Utah Weber
2008 $715 $793 $719 $651
2009 $701 $740 $701 $639
2010 $711 $720 $716 $640
2011 $701 $754 $753 $655
2012 $720 $814 $788 $684
2013 $756 $850 $807 $678
2014 $796 $865 $868 $698
2015 $839 $907 $924 $754
2016 $933 $949 $1,041 $810
2017 $1,005 $1,011 $1,097 $864
2018 $1,060 $1,060 $1,138 $937
2019 $1,102 $1,145 $1,188 $1,021
AARC 2008–2019 4.01% 3.40% 4.67% 4.17%
AARC 2016–2019 5.07% 6.46% 4.50% 8.02%
Source: CBRE, The Greater Salt Lake Area Multifamily Market, and Cushman Wakefield, Annual Apartment Market Report (Salt Lake County)
Figure II.1: Acquisition and Rehabilitation of Rental Units Financed Through the Low-Income Housing Tax Credit (6,644 units, 1987–2017
Source: Utah Housing Corporation
0
200
400
600
800
1,000
1,200
1987
1989
1991
1993
1995
1997
1999
2001
2003
2005
2007
2009
2011
2013
2015
2017
1987
1989
1991
1993
1995
1997
1999
2001
2003
2005
2007
2009
2011
2013
2015
2017
Units Annual Avg. 229 units
11,872
15,118
0
5,000
10,000
15,000
20,000
25,000
2000
2001
2002
2003
2004
2005
2006
2007
2008
2009
2010
2011
2012
2013
2014
2015
2016
2017
2018
2019
Perm
itted
Uni
ts
Single-family Multifamily
9.3%10.7%10.9%11.7%
16.8%17.7%18.7%19.0%19.1%19.2%19.3%19.5%
22.3%23.0%23.6%
25.3%26.0%26.1%26.5%27.5%28.2%28.3%29.3%
31.2%31.4%31.4%31.5%32.6%32.6%32.8%33.4%33.5%33.9%34.2%34.5%34.5%34.7%35.2%35.8%36.7%
38.2%39.2%40.4%41.5%
46.2%47.1%48.3%49.1%
53.0%55.7%
59.1%69.6%
0.0% 10.0% 20.0% 30.0% 40.0% 50.0% 60.0% 70.0% 80.0%
North DakotaAlaska
ConnecticutWest Virgina
LouisianaIllinois
MississippiWyoming
New JerseyMaryland
OklahomaDelaware
IowaArkansasVermont
VirginiaPennsylvaniaNew Mexico
New YorkSouth Dakota
KansasKentuckyAlabama
New HampshireHawaii
NebraskaMassachusetts
OhioWisconsin
MontanaUS
MissouriRhode Island
MinnesotaTexas
IndianaMaine
South CarolinaDC
CaliforniaNorth Carolina
MichiganTennessee
GeorgiaArizonaOregonFlorida
ColoradoUtah
NevadaWashington
Idaho
0
200
400
600
800
1000
1200
Units Annual avg. 229 units
Detached Attached
Garage ConversionAbove Garage
Interior (upper level)
Interior (lower level)
54%Long-term rental (rental)
19%Short-term rental (vacation)
65%Primary residence (for owner)
40%Other*
gardner.utah.edu I November 2020I N F O R M E D D E C I S I O N S TM 11
tor contributions, NeighborWorks Salt Lake has preserved and rehabilitated dozens of homes through acquisition and rehab financing in the Guadalupe neighborhood, along with home improvement loans, and home improvement grants. NeighborWorks Salt Lake has also revitalized, through similar innovative funding, neighborhoods on the west side of Murray. Twelve deteriorating homes were pur-chased for $1.98 million, rehabbed at a cost of $718,000, and sold to moderate-income households. NeighborWorks Salt Lake also provided $179,500 in favorable home loans to eight Murray homeowners and $44,761 in home improve-ment grants to seven Murray homeowners.
This example demonstrates the value of a collaborative effort, spearheaded by a dedicated nonprofit, targeting public and private resources for the preservation of afford-able housing.
● Two Public Housing Authorities’ $21 Million Rehabilitation Project—A joint venture with Housing Connect, formerly the Housing Authority of the County of Salt Lake, and the Hous-ing Authority of Salt Lake City has secured $21 million in tax credit funding for the hard costs to rehabilitate 299 afford-able units in two high-rise projects; City Plaza and the Coun-ty High Rise. These two projects were developed in the 1970s as traditional public housing properties and owned by the two public housing authorities. City Plaza, with 150 units, provided subsidized housing for very low– and ex-tremely low–income disabled and elderly households, while the 149-unit County High Rise provided housing for very low– and extremely low–income households of all ages.
The joint venture is known as New City Plaza, LLC, and made use of HUD’s Rental Assistance Demonstration (RAD) program, which “gives public housing authorities a powerful tool to preserve and improve public housing properties.” Through the RAD program, the 299 units move from public housing to HUD project-based vouchers. The vouchers were critical as a revenue source, making the tax credit program financially feasible and paving the way for $21 million in funding for rehabilitation of the units. As public housing units, City Plaza and the County High Rise were losing mon-ey and had become cost burdens for the housing authori-ties. This raised the inevitable question, Should the units be sold? Housing authorities do sell their public housing units when costs become too burdensome. If the buyer is a for-profit developer, the affordable units are most likely lost to the affordable housing inventory. However, in the case of City Plaza and the County High Rise, affordability will be pre-served through the use of HUD’s RAD program and tax cred-it funding. These two programs make the rehabilitation of 299 units possible and relieve two housing authorities of fi-nancially troublesome public housing properties.
This example demonstrates the role that aggressive pub-lic housing authorities can play in the preservation and re-habilitation of affordable housing units. Utah has 18 public housing authorities, each with its priority for preservation.
Variations on a Theme● Incentives—Some preservation programs in municipalities
outside of Utah include incentives through property tax re-bates or tax exemptions on the incremental increase in a property’s value due to rehabilitation and preservation.
● Preservation Compacts—The largest compact, The Chicago Preservation Compact brings together Cook County’s pub-lic, private, and nonprofit leaders to address the loss of af-fordable housing.
● Preservation Funds—There are several dozen preservation funds throughout the country. Operational geographies vary from nation, region, states, and cities. The funding level is of-ten tens of millions of dollars with the largest fund being the Partnership for the Bay’s Future Fund, which has funding commitments of $500 million. Seed funding was provided by Facebook, the Ford Foundation, and Kaiser Permanente. Kai-ser Permanente is also involved with two other preservation funds, both operating in Oakland, California. Most funds tar-get low- to very low-income households, and their missions include production and preservation of affordable housing.
Table II.6: Cities That Have Selected Preserving Existing Moderate-Income Housing as an S.B. 34 Strategy
Source: Utah Department of Workforce Services
Table II.7: Cities That Have Selected to Preserve Subsidized Low- to Moderate-Income Units on a Long-Term Basis as an S.B. 34 Strategy
Source: Utah Department of Workforce Services
AlpineBountifulCentervilleClearfieldFarmingtonFarr WestFruit HeightsGrantsville
HarrisvilleHeberHerrimanKaysvilleMidvaleMillcreekMurrayNorth Salt Lake
Pleasant ViewProvoSalt Lake CountySandySouth OgdenSouth Salt LakeTaylorsvilleWashington
TerraceWest BountifulWest JordanWest Valley CityWhite City
Cedar CityHarrisvilleHeberKearns
LoganMagnaOremPleasant Grove
ProvidenceProvoSmithfieldTremonton
Washington CityWest Valley City
November 2020 I gardner.utah.edu I N F O R M E D D E C I S I O N S TM12
BackgroundRedevelopment agencies (RDAs) in Utah have used tax
increment financing or over 50 years to spur economic development. Tax increment financing is used to help finance investment, generally for 20 to 25 years, in a targeted geographical area designated as a project area. At the establishment of a project area, the current local property tax revenue from the land and structures within the project area becomes the “base” amount of property tax revenue. As economic development occurs in the project area, property values rise, and property tax revenues increase. The incremental increase in property taxes above the “base” amount provides the funding for redevelopment. The tax increment funds often finance an RDA bond for infrastructure development—roads, sidewalk, utilities, sewer, etc.—or the funds can be used to pay for land and construction of affordable housing within the RDA.
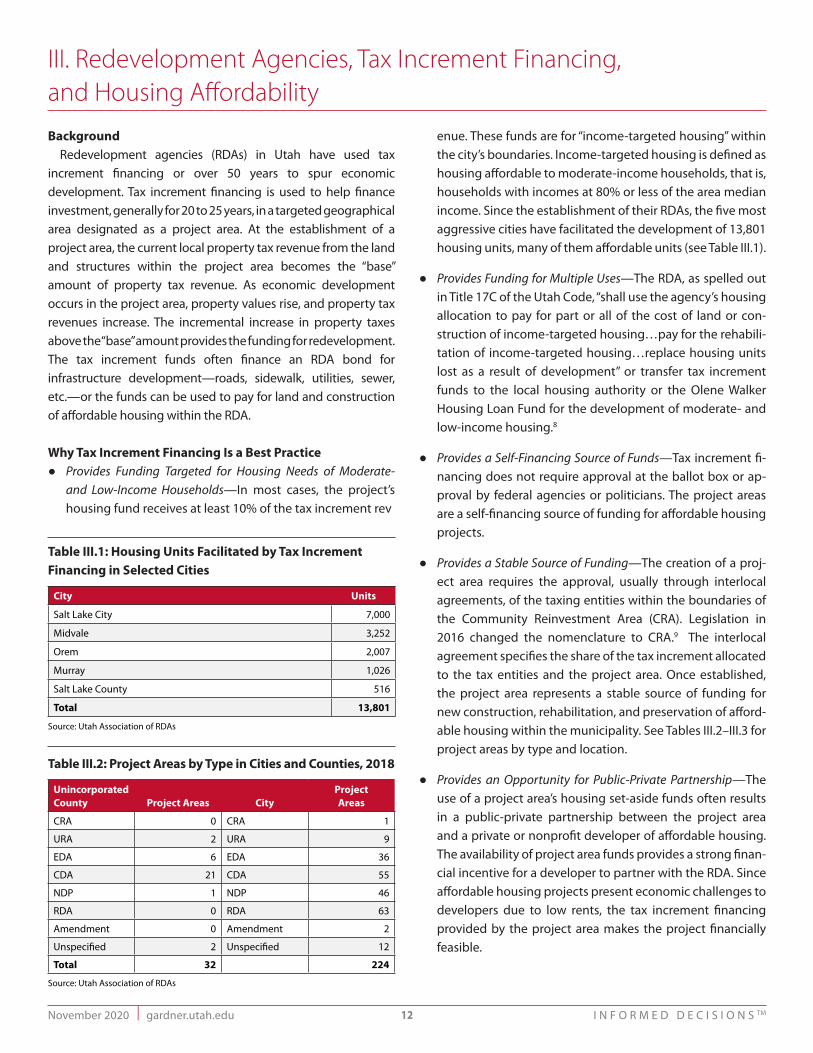
Why Tax Increment Financing Is a Best Practice● Provides Funding Targeted for Housing Needs of Moderate-
and Low-Income Households—In most cases, the project’s housing fund receives at least 10% of the tax increment rev
enue. These funds are for “income-targeted housing” within the city’s boundaries. Income-targeted housing is defined as housing affordable to moderate-income households, that is, households with incomes at 80% or less of the area median income. Since the establishment of their RDAs, the five most aggressive cities have facilitated the development of 13,801 housing units, many of them affordable units (see Table III.1).
● Provides Funding for Multiple Uses—The RDA, as spelled out in Title 17C of the Utah Code, “shall use the agency’s housing allocation to pay for part or all of the cost of land or con-struction of income-targeted housing…pay for the rehabili-tation of income-targeted housing…replace housing units lost as a result of development” or transfer tax increment funds to the local housing authority or the Olene Walker Housing Loan Fund for the development of moderate- and low-income housing.8
● Provides a Self-Financing Source of Funds—Tax increment fi-nancing does not require approval at the ballot box or ap-proval by federal agencies or politicians. The project areas are a self-financing source of funding for affordable housing projects.
● Provides a Stable Source of Funding—The creation of a proj-ect area requires the approval, usually through interlocal agreements, of the taxing entities within the boundaries of the Community Reinvestment Area (CRA). Legislation in 2016 changed the nomenclature to CRA.9 The interlocal agreement specifies the share of the tax increment allocated to the tax entities and the project area. Once established, the project area represents a stable source of funding for new construction, rehabilitation, and preservation of afford-able housing within the municipality. See Tables III.2–III.3 for project areas by type and location.
● Provides an Opportunity for Public-Private Partnership—The use of a project area’s housing set-aside funds often results in a public-private partnership between the project area and a private or nonprofit developer of affordable housing. The availability of project area funds provides a strong finan-cial incentive for a developer to partner with the RDA. Since affordable housing projects present economic challenges to developers due to low rents, the tax increment financing provided by the project area makes the project financially feasible.
III. Redevelopment Agencies, Tax Increment Financing, and Housing Affordability
Table III.1: Housing Units Facilitated by Tax Increment Financing in Selected Cities
City Units
Salt Lake City 7,000
Midvale 3,252
Orem 2,007
Murray 1,026
Salt Lake County 516
Total 13,801
Source: Utah Association of RDAs
Table III.2: Project Areas by Type in Cities and Counties, 2018
Unincorporated County Project Areas City
Project Areas
CRA 0 CRA 1
URA 2 URA 9
EDA 6 EDA 36
CDA 21 CDA 55
NDP 1 NDP 46
RDA 0 RDA 63
Amendment 0 Amendment 2
Unspecified 2 Unspecified 12
Total 32 224
Source: Utah Association of RDAs
gardner.utah.edu I November 2020I N F O R M E D D E C I S I O N S TM 13
● Provides an Opportunity to Offset Higher Housing Prices from Gentrification—RDAs were first created, some 50 years ago, to spur local economic development and neighborhood re-vitalization, or “urban renewal” in the parlance of the day. Economic development continues as the primary mission of RDAs; however, economic development often comes from neighborhood gentrification and higher housing costs. The housing funds generated by a CRAs project area can help preserve existing affordable housing.
County/City RDA
CDA
EDA
URA
ND
P
Unspecified
Beaver County Unincorporated 8
Box Elder County Unincorporated 4
Cache County Unincorporated 1
Brigham City 1 1 2
Perry City 1
Tremonton City 1 1
Logan City 4 2
North Logan City 1 1 1
Smithfield
Carbon County Unincorporated 1
Price 1
Wellington 1
Davis County Unincorporated 0 0 0 0 0 0
Bountiful 2
Centerville 2 1
Clearfield 1 1 3 2
Farmington 1 2
Layton 1 3
North Layton 3
Syracuse 2 1
West Bountiful 3 1
West Point 1
Woods Cross 3 5
Iron County Unincorporated 10 1
Brian Head 1
Cedar City 1 1 1
Morgan County Unincorporated 0 0 0 0 0 0
Morgan 1 1
Rich County Unincorporated
Garden City 1
Salt Lake County Unincorporated 2 1
Cottonwood Heights 1
Draper 2 5
Herriman 2
Holladay 1 1
Midvale 2
Murray 2 1 2
Table III.3: Project Areas by County and City
County/City RDA
CDA
EDA
URA
ND
P
Unspecified
Riverton 1
Salt Lake City 3 2 1 4
Sandy 1 4 1 2
South Jordan 3 2 2 3
South Salt Lake 2 2
Taylorsville 1 2
West Jordan 1 2 5
West Valley
Sanpete County 0 0 0 0 0 0
Mount Pleasant 1
Salina 1
Summit County Unincorporated 0 0 0 0 0 0
Park City 2 1
Tooele City 1 1
Uintah County Unincorporated
Naples City 1
Vernal City 1
Utah County Unincorporated 0 0 0 0 0 0
American Fork 2 1
Eagle Mountain 2 1
Lehi City
Lindon 1 1
Orem
Pleasant Grove 2
Provo 3 2
Spanish Fork 2 1 1
Springville 1
Vineyard 3
Washington County Unincorporated 0 0 0 0 0 0
St. George 2 4
Weber County Unincorporated 1 1
Ogden 13 1 3 1
Pleasant View 1
Riverdale 1 1
Roy 2
South Ogden 1 1
Total 59 67 32 12 37 11
Source: Utah RDA Association.
● Provides an Opportunity for Local Officials to Hand-Pick Devel-oper and Location of Affordable Housing—In June 2018, the Redevelopment Agency of Salt Lake City invited developers to submit proposals for developing affordable housing in the city to be supported by $10 million in RDA financial as-sistance. The RDA selected developers and reserved $4.5 million in funding for projects in high-opportunity neigh-borhoods—areas with higher quality-of-life measures for schools, housing, jobs, and income. This example under-
November 2020 I gardner.utah.edu I N F O R M E D D E C I S I O N S TM14
scores how RDA funding can guide affordable housing de-velopment, its location, and the selection of the most quali-fied developer.
● Satisfies S.B. 34—Using a Redevelopment Agency’s Tax Incre-ment Financing for moderate and low-income housing meets one of the requirements of S.B. 34.
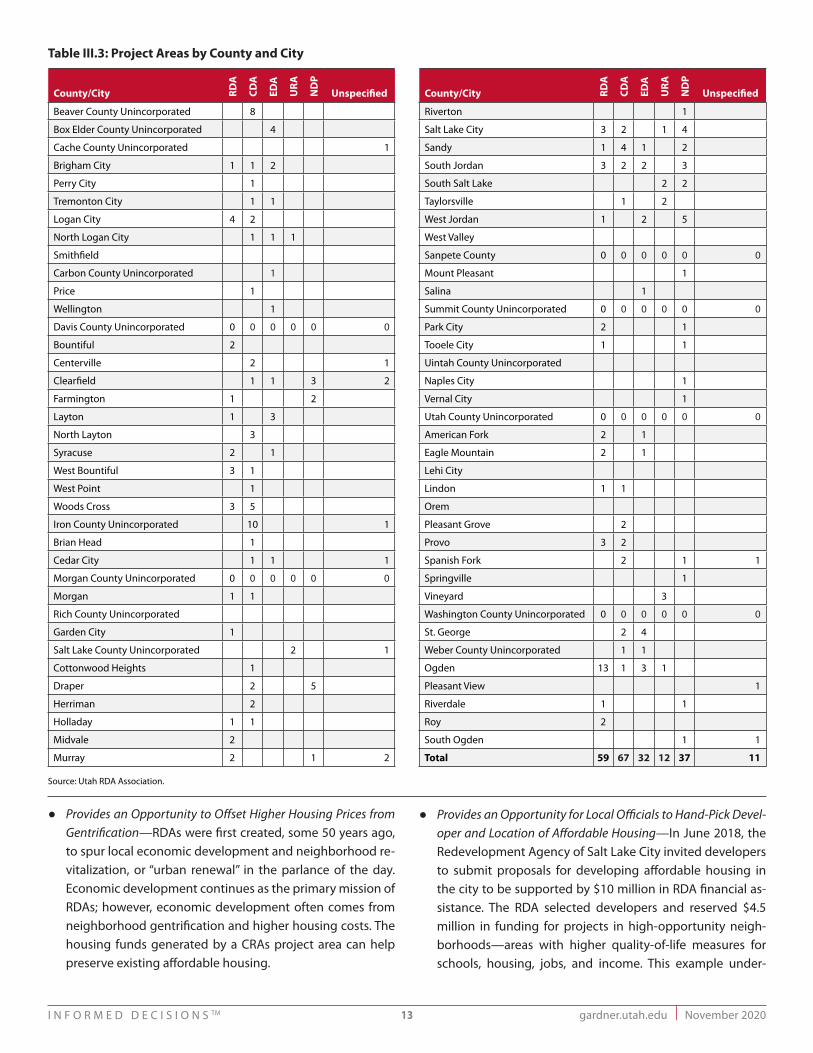
Framework for Implementation ● Establish a Project Area—Sixty-three cities and 8 counties in
Utah have RDAs, with a combined total of 256 project areas (Tables III.2–III.3). State statutory guidelines govern the es-tablishment of project areas. The guidelines require a gener-al description of the proposed project area’s current social and economic conditions and how establishing a project area will promote economic development that “but for” RDA assistance would not occur. The project area must be consis-tent with the municipality’s general plan, and the financial assistance anticipated described. While project areas differ widely in scope and projected tax revenue, the sheer num-ber of project areas demonstrates the potential of tax incre-ment financing as a tool for developing and preserving af-fordable housing. In addition to meeting statutory guidelines, a project area must have approval from the tax entities within the proposed project area.
● Develop a Strategy for Housing Fund Expenditures—For most of the project areas, a housing fund was created at incep-tion. The share of tax increment revenue earmarked for the housing fund varies by project area, from at least 10% to as much as 20%. As mentioned above, RDAs have a fair amount of latitude regarding housing fund expenditures, including the purchase of land, construction, infrastructure, preserva-tion, etc. The one restriction is funds must assist moderate- and low-income households with affordable housing.
Many cities have project areas that don’t generate signifi-cant amounts of housing funds. Nevertheless, low annual dollar amounts can be accumulated over a few years, pro-viding sufficient funding for down payment assistance, pres-ervation loans and grants, or rental assistance. If an RDA lacks a strategy for disbursing tax increment funds, the funds can be transferred to the Olene Walker Housing Loan Fund to support statewide programs for affordable housing. Most important, housing funds should not sit idle on the side-lines. With a severe shortage of housing, particularly afford-able housing, aggressive housing fund strategies should employ tax increment dollars.
● Assess Policy Considerations—In Utah, RDAs and tax incre-ment financing have been relatively free of controversy; however, in many states, there has been sharp criticism of tax increment financing. Some principal policy consider-ations should include transparency, absence of favoritism, demonstration of public benefit, and sensitivity to the im-pacts of economic development on local government enti-ties, notably increased enrollment at public schools.
Examples of Best Practice● West Capitol Hill Project Area—In 1996, the RDA of Salt Lake
City created the West Capitol Hill Project Area. The boundar-ies are 300 North to 800 North and 400 West to 200 West. This 18-block area includes Salt Lake City’s Marmalade neighborhood. The project area has generated $5.8 million in tax increment financing, which has helped revitalize the neighborhood, preserve a historic building, and develop 12 owner-occupied townhomes, a plaza, city library, and, cur-rently under construction, 252 market-rate rental units and 12 two-bedroom live/work units. In addition to assisting in development costs, the Salt Lake City RDA provided a land write-down on the sale of the property. The tax increment financing meets several goals of the RDA: “stabilization through the rehabilitation of single-family, owner-occupied homes, preservation of the neighborhood’s historic fabric, and diversification of the tax base.”10
● Central Business District Project Area—The RDA of Salt Lake City created the Central Business District Project Area in 1983. The trigger year—the first year tax increment funds were disbursed—was 2009. In 2018, the RDA received $25 million in tax increment funding from the Central Business District, the largest single-year funding level of any of the 256 project areas in Utah. The RDA has recently provided substantial support for a large housing development at 255 South Main. The site had become blighted due to a half-fin-ished mixed-use development. In 2012, the developer ran into financial problems and structural engineering issues and eventually lost the project to bankruptcy. Over the next five-years, the abandoned site and structure sat idle and be-came a well-known eyesore in downtown Salt Lake City.
In 2017 the parcel was put up for auction, and the RDA purchased the site for $4 million. A year later, the RDA en-tered into a purchase agreement with Brinshore Develop-ment, LLC of Chicago, for the 1.1-acre site. The RDA agreed to issue a seller’s note for $4 million to the developer for the land and provide a $9.2 million loan for the construction of a
gardner.utah.edu I November 2020I N F O R M E D D E C I S I O N S TM 15
190 unit mixed-income housing project. Only 15 rental units are market-rate while 175 are tax credit units affordable to renters at 57% AMI. The total value of the project is $46.7 million. The one-bedroom tax credit units will rent for $930 and the two-bedroom units for $1,110. These rents, which include utilities, are at least 30% below market-rate rents for new units in the Central Business District. For the many low-income employees working in downtown retail, offices, or restaurants, 175 new affordable units will be a welcome addition to the “tight” and expensive housing market.
● The Redevelopment Agency of Murray—The Redevelopment Agency of Murray created the Fireclay Redevelopment Area in 2005. The tax increment was triggered in 2014. Since then, the tax increment funding has been about $800,000 annual-ly. The project area’s boundaries are State Street on the east, 4500 South on the south, the heavy rail line on the west, and Big Cottonwood Creek (4000 South) on the north. The proj-ect area facilitates mixed-use development in a blighted area dominated by deteriorating commercial buildings.
Since 2012 the project area has seen several large apart-ment communities with affordable and market-rate units. The RDA entered into development agreements with Ham-let Homes, Fireclay Investment Partners, and Parley’s Part-ners. Hamlet Homes developed 41 condominium units, and 10 townhomes live/work units. Fireclay Investment Partners completed two of three phases of development. The com-pleted phases included two large apartment communities with a total of 400 market-rate units and 268 tax credit units. The third development agreement was with Parley’s Part-ners. Phase I is a 137-unit family apartment community. Phases II and III include a 65-unit family apartment commu-nity and a 105-unit senior community. Three-quarters of the units developed by Parley’s Partners (228 units) are tax cred-it units. The RDA’s development agreements reimbursed the developers for roads and environmental remediation.
In 1999, the Redevelopment Agency of Murray created the Smelter Site Redevelopment Area to improve a blighted area that included the smokestacks of American Smelting and Refining Company. The project area is now the location of Costco and the Intermountain Medical Center. Tax incre-ment at the Smelter project area was triggered in 2009 and generates about $900,000 annually.
In contrast to the large housing projects discussed above, tax increment financing from the Smelter project area has helped facilitate the acquisition and rehabilitation of nearly 50 homes for moderate- to low-income families.
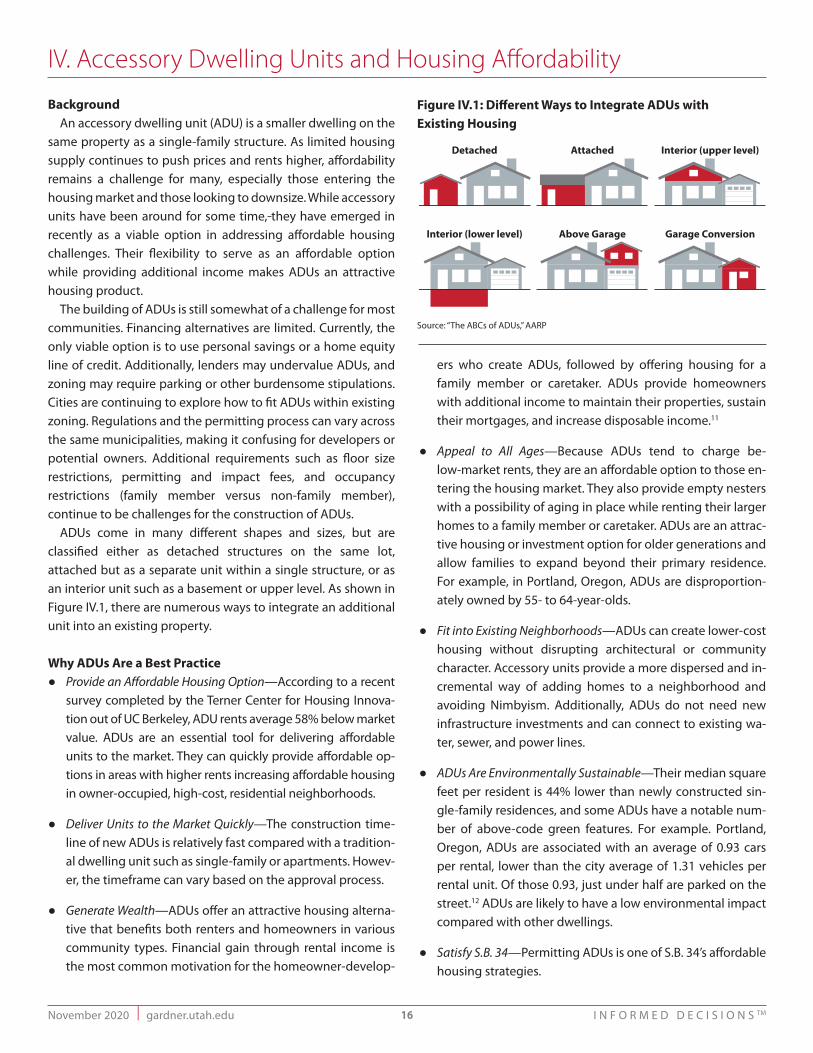
November 2020 I gardner.utah.edu I N F O R M E D D E C I S I O N S TM16
BackgroundAn accessory dwelling unit (ADU) is a smaller dwelling on the
same property as a single-family structure. As limited housing supply continues to push prices and rents higher, affordability remains a challenge for many, especially those entering the housing market and those looking to downsize. While accessory units have been around for some time, they have emerged in recently as a viable option in addressing affordable housing challenges. Their flexibility to serve as an affordable option while providing additional income makes ADUs an attractive housing product.
The building of ADUs is still somewhat of a challenge for most communities. Financing alternatives are limited. Currently, the only viable option is to use personal savings or a home equity line of credit. Additionally, lenders may undervalue ADUs, and zoning may require parking or other burdensome stipulations. Cities are continuing to explore how to fit ADUs within existing zoning. Regulations and the permitting process can vary across the same municipalities, making it confusing for developers or potential owners. Additional requirements such as floor size restrictions, permitting and impact fees, and occupancy restrictions (family member versus non-family member), continue to be challenges for the construction of ADUs.
ADUs come in many different shapes and sizes, but are classified either as detached structures on the same lot, attached but as a separate unit within a single structure, or as an interior unit such as a basement or upper level. As shown in Figure IV.1, there are numerous ways to integrate an additional unit into an existing property.
Why ADUs Are a Best Practice● Provide an Affordable Housing Option—According to a recent
survey completed by the Terner Center for Housing Innova-tion out of UC Berkeley, ADU rents average 58% below market value. ADUs are an essential tool for delivering affordable units to the market. They can quickly provide affordable op-tions in areas with higher rents increasing affordable housing in owner-occupied, high-cost, residential neighborhoods.
● Deliver Units to the Market Quickly—The construction time-line of new ADUs is relatively fast compared with a tradition-al dwelling unit such as single-family or apartments. Howev-er, the timeframe can vary based on the approval process.
● Generate Wealth—ADUs offer an attractive housing alterna-tive that benefits both renters and homeowners in various community types. Financial gain through rental income is the most common motivation for the homeowner-develop-
ers who create ADUs, followed by offering housing for a family member or caretaker. ADUs provide homeowners with additional income to maintain their properties, sustain their mortgages, and increase disposable income.11
● Appeal to All Ages—Because ADUs tend to charge be-low-market rents, they are an affordable option to those en-tering the housing market. They also provide empty nesters with a possibility of aging in place while renting their larger homes to a family member or caretaker. ADUs are an attrac-tive housing or investment option for older generations and allow families to expand beyond their primary residence. For example, in Portland, Oregon, ADUs are disproportion-ately owned by 55- to 64-year-olds.
● Fit into Existing Neighborhoods—ADUs can create lower-cost housing without disrupting architectural or community character. Accessory units provide a more dispersed and in-cremental way of adding homes to a neighborhood and avoiding Nimbyism. Additionally, ADUs do not need new infrastructure investments and can connect to existing wa-ter, sewer, and power lines.
● ADUs Are Environmentally Sustainable—Their median square feet per resident is 44% lower than newly constructed sin-gle-family residences, and some ADUs have a notable num-ber of above-code green features. For example. Portland, Oregon, ADUs are associated with an average of 0.93 cars per rental, lower than the city average of 1.31 vehicles per rental unit. Of those 0.93, just under half are parked on the street.12 ADUs are likely to have a low environmental impact compared with other dwellings.
● Satisfy S.B. 34—Permitting ADUs is one of S.B. 34’s affordable housing strategies.
IV. Accessory Dwelling Units and Housing Affordability
Figure IV.1: Different Ways to Integrate ADUs with Existing Housing
0
200
400
600
800
1,000
1,200
1987
1989
1991
1993
1995
1997
1999
2001
2003
2005
2007
2009
2011
2013
2015
2017
1987
1989
1991
1993
1995
1997
1999
2001
2003
2005
2007
2009
2011
2013
2015
2017
Units Annual Avg. 229 units
11,872
15,118
0
5,000
10,000
15,000
20,000
25,000
2000
2001
2002
2003
2004
2005
2006
2007
2008
2009
2010
2011
2012
2013
2014
2015
2016
2017
2018
2019
Perm
itted
Uni
ts
Single-family Multifamily
9.3%10.7%10.9%11.7%
16.8%17.7%18.7%19.0%19.1%19.2%19.3%19.5%
22.3%23.0%23.6%
25.3%26.0%26.1%26.5%27.5%28.2%28.3%29.3%
31.2%31.4%31.4%31.5%32.6%32.6%32.8%33.4%33.5%33.9%34.2%34.5%34.5%34.7%35.2%35.8%36.7%
38.2%39.2%40.4%41.5%
46.2%47.1%48.3%49.1%
53.0%55.7%
59.1%69.6%
0.0% 10.0% 20.0% 30.0% 40.0% 50.0% 60.0% 70.0% 80.0%
North DakotaAlaska
ConnecticutWest Virgina
LouisianaIllinois
MississippiWyoming
New JerseyMaryland
OklahomaDelaware
IowaArkansasVermont
VirginiaPennsylvaniaNew Mexico
New YorkSouth Dakota
KansasKentuckyAlabama
New HampshireHawaii
NebraskaMassachusetts
OhioWisconsin
MontanaUS
MissouriRhode Island
MinnesotaTexas
IndianaMaine
South CarolinaDC
CaliforniaNorth Carolina
MichiganTennessee
GeorgiaArizonaOregonFlorida
ColoradoUtah
NevadaWashington
Idaho
0
200
400
600
800
1000
1200
Units Annual avg. 229 units
Detached Attached
Garage ConversionAbove Garage
Interior (upper level)
Interior (lower level)
54%Long-term rental (rental)
19%Short-term rental (vacation)
65%Primary residence (for owner)
40%Other*
Source: “The ABCs of ADUs,” AARP
gardner.utah.edu I November 2020I N F O R M E D D E C I S I O N S TM 17
Framework of Implementation● Zoning & Approvals—Allowing ADUs is an essential step in
the implementation of this strategy. While some cities allow detached and attached ADUs, others allow only attached ac-cessory units or forbid them entirely, particularly in sin-gle-family zones.
Most ADUs are built by homeowners who are typically un-familiar with the development process, so navigating the permitting and building process can be a barrier. The ap-proval of ADUs can be difficult, with parking, infrastructure, and neighborhood character some of the more noted con-cerns. Regulations on parking, lot size, and setbacks, as well as impact fees, often increase the costs, making ADU con-struction financially unfeasible at times.
Often homeowners aren’t aware of ADU opportunities, and cities around the country are beginning to promote and market their ADU programs. Educating residents about the approval process and design challenges facilitates bringing more ADUs to the market. For example, the city of Hillsbor-ough, California, formed a 22-person advisory committee to identify neighborhoods where ADUs would be a good fit. The committee also provided input on design elements and overall neighborhood fit. By doing this, the city was able to get greater acceptance of ADU zoning upgrades, which can often be the biggest obstacle to overcome. Another California city, Santa Cruz, provides several tools to encourage ADU con-struction. These include ADU manuals, architectural proto-types, a loan fund, fee waivers, and community workshops.
● Financing—ADUs are an investment, and like any invest-ment, the numbers have to be appealing. Currently, there are limited financial tools for existing homeowners to use to build accessory units. Existing financing vehicles include personal savings, a cash-out refinance, a home equity loan, and renovation financing. A recent study out of Oregon found that the majority of homeowners who built an ADU financed it through personal cash savings. Traditional home builders may not see a big enough profit margin to add an ADU to new single-family construction projects. Many homeowners already have a mortgage on their existing property, therefore borrowing against it may be limited de-pending on their loan-to-value ratio.
The debt-to-income ratio of the homeowner may be im-proved by rental revenue generated by the ADU. Since lend-ers assess individuals’ debt-to-income ratio, the potential rental income from an ADU may allow borrowers to obtain a larger loan and reduce out-of-pocket costs.
Another financial constraint is municipal fees. ADUs’ im-pact on municipal infrastructure and services is different from those created by traditional development, such as sin-gle-family homes or multifamily units. Often, cities charge
the same fees for ADUs as for larger projects. Proportional municipal fees are vital in keeping ADUs affordable.
Some cities across the United States are developing low-interest or forgivable loan programs for ADUs. For ex-ample, Santa Cruz offers 20-year loans up to $40,000 with interest-only payment. At the end of the 20-year term the principal can be forgiven if the ADU has been rented at spec-ified affordable guidelines.
Examples of Best Practice● The Alley Flat Initiative—The Alley Flat Initiative is a nonprofit
created in 2005 by the University of Texas School of Archi-tecture and Austin Community Design and Development Center, in Austin, Texas. The goal of the initiative is to pro-vide planning and design of ADUs that specifically target affordable housing. The nonprofit works with homeowners and guides them through the construction and financing, with the goal of providing an affordable rental unit to low- and moderate-income households.
● State of California Reforms—In 2016 and 2017, California passed ADU reforms that require cities to permit one ADU per single-family home, streamlined ADU permitting, set utility fees proportional to the burden of ADUs, and further reduced fees for ADUs built inside an existing home. The law also waived parking requirements for ADUs located within a half-mile of a transit stop or within a block of a car-share stop. Oth-er reforms addressed structure setbacks and floor space. As a result of these reforms, ADU applications increased, especially in Los Angeles. Before these reforms, the city was permitting 100 to 200 ADUs per year. After the reforms, permits increased to 2,326 in 2017 and nearly doubled to 4,171 in 2018, ac-counting for 20% of all new housing permits for the year.
● Portland, Oregon Reforms—The city of Portland added almost 2,000 units between 2010 and 2016. Portland began reform-ing housing regulations to encourage more ADUs in 1997, when it revised minimum square footage and owner-occu-pancy requirements. By 2004, citywide garage conversions were permitted with no on-site parking requirements, and the code relaxed design standards. In 2010, the System Devel-opment Charges were waived, leading to a spike in permits; and in 2014, short-term-rentals were permitted. By 2015, de-sign and setback standards had been further relaxed, leading 2016 to be a record year for ADU permitting in the city.
In Portland, ADU construction costs range from a few thousand dollars to nearly $300,000, averaging approxi-mately $150,000. One intervention that stood out for Port-land was the fee waiver, which allowed the construction of more affordable ADUs. As a result of these combined policy changes, ADU permits are issued at about the same rate as single-family permits.
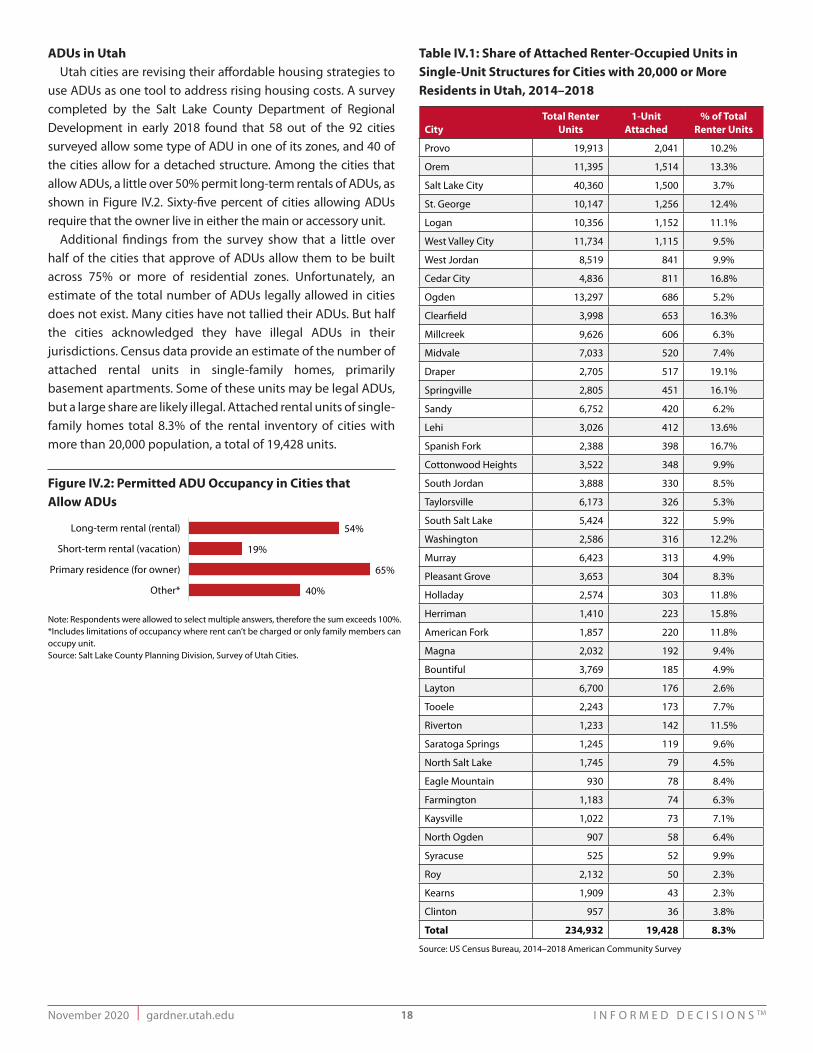
November 2020 I gardner.utah.edu I N F O R M E D D E C I S I O N S TM18
ADUs in UtahUtah cities are revising their affordable housing strategies to
use ADUs as one tool to address rising housing costs. A survey completed by the Salt Lake County Department of Regional Development in early 2018 found that 58 out of the 92 cities surveyed allow some type of ADU in one of its zones, and 40 of the cities allow for a detached structure. Among the cities that allow ADUs, a little over 50% permit long-term rentals of ADUs, as shown in Figure IV.2. Sixty-five percent of cities allowing ADUs require that the owner live in either the main or accessory unit.
Additional findings from the survey show that a little over half of the cities that approve of ADUs allow them to be built across 75% or more of residential zones. Unfortunately, an estimate of the total number of ADUs legally allowed in cities does not exist. Many cities have not tallied their ADUs. But half the cities acknowledged they have illegal ADUs in their jurisdictions. Census data provide an estimate of the number of attached rental units in single-family homes, primarily basement apartments. Some of these units may be legal ADUs, but a large share are likely illegal. Attached rental units of single-family homes total 8.3% of the rental inventory of cities with more than 20,000 population, a total of 19,428 units.
Note: Respondents were allowed to select multiple answers, therefore the sum exceeds 100%.*Includes limitations of occupancy where rent can’t be charged or only family members can occupy unit.Source: Salt Lake County Planning Division, Survey of Utah Cities.
Table IV.1: Share of Attached Renter-Occupied Units in Single-Unit Structures for Cities with 20,000 or More Residents in Utah, 2014–2018
CityTotal Renter
Units1-Unit
Attached% of Total
Renter Units
Provo 19,913 2,041 10.2%
Orem 11,395 1,514 13.3%
Salt Lake City 40,360 1,500 3.7%
St. George 10,147 1,256 12.4%
Logan 10,356 1,152 11.1%
West Valley City 11,734 1,115 9.5%
West Jordan 8,519 841 9.9%
Cedar City 4,836 811 16.8%
Ogden 13,297 686 5.2%
Clearfield 3,998 653 16.3%
Millcreek 9,626 606 6.3%
Midvale 7,033 520 7.4%
Draper 2,705 517 19.1%
Springville 2,805 451 16.1%
Sandy 6,752 420 6.2%
Lehi 3,026 412 13.6%
Spanish Fork 2,388 398 16.7%
Cottonwood Heights 3,522 348 9.9%
South Jordan 3,888 330 8.5%
Taylorsville 6,173 326 5.3%
South Salt Lake 5,424 322 5.9%
Washington 2,586 316 12.2%
Murray 6,423 313 4.9%
Pleasant Grove 3,653 304 8.3%
Holladay 2,574 303 11.8%
Herriman 1,410 223 15.8%
American Fork 1,857 220 11.8%
Magna 2,032 192 9.4%
Bountiful 3,769 185 4.9%
Layton 6,700 176 2.6%
Tooele 2,243 173 7.7%
Riverton 1,233 142 11.5%
Saratoga Springs 1,245 119 9.6%
North Salt Lake 1,745 79 4.5%
Eagle Mountain 930 78 8.4%
Farmington 1,183 74 6.3%
Kaysville 1,022 73 7.1%
North Ogden 907 58 6.4%
Syracuse 525 52 9.9%
Roy 2,132 50 2.3%
Kearns 1,909 43 2.3%
Clinton 957 36 3.8%
Total 234,932 19,428 8.3%
Source: US Census Bureau, 2014–2018 American Community Survey
Figure IV.2: Permitted ADU Occupancy in Cities that Allow ADUs
0
200
400
600
800
1,000
1,200
1987
1989
1991
1993
1995
1997
1999
2001
2003
2005
2007
2009
2011
2013
2015
2017
1987
1989
1991
1993
1995
1997
1999
2001
2003
2005
2007
2009
2011
2013
2015
2017
Units Annual Avg. 229 units
11,872
15,118
0
5,000
10,000
15,000
20,000
25,000
2000
2001
2002
2003
2004
2005
2006
2007
2008
2009
2010
2011
2012
2013
2014
2015
2016
2017
2018
2019
Perm
itted
Uni
ts
Single-family Multifamily
9.3%10.7%10.9%11.7%
16.8%17.7%18.7%19.0%19.1%19.2%19.3%19.5%
22.3%23.0%23.6%
25.3%26.0%26.1%26.5%27.5%28.2%28.3%29.3%
31.2%31.4%31.4%31.5%32.6%32.6%32.8%33.4%33.5%33.9%34.2%34.5%34.5%34.7%35.2%35.8%36.7%
38.2%39.2%40.4%41.5%
46.2%47.1%48.3%49.1%
53.0%55.7%
59.1%69.6%
0.0% 10.0% 20.0% 30.0% 40.0% 50.0% 60.0% 70.0% 80.0%
North DakotaAlaska
ConnecticutWest Virgina
LouisianaIllinois
MississippiWyoming
New JerseyMaryland
OklahomaDelaware
IowaArkansasVermont
VirginiaPennsylvaniaNew Mexico
New YorkSouth Dakota
KansasKentuckyAlabama
New HampshireHawaii
NebraskaMassachusetts
OhioWisconsin
MontanaUS
MissouriRhode Island
MinnesotaTexas
IndianaMaine
South CarolinaDC
CaliforniaNorth Carolina
MichiganTennessee
GeorgiaArizonaOregonFlorida
ColoradoUtah
NevadaWashington
Idaho
0
200
400
600
800
1000
1200
Units Annual avg. 229 units
Detached Attached
Garage ConversionAbove Garage
Interior (upper level)
Interior (lower level)
54%Long-term rental (rental)
19%Short-term rental (vacation)
65%Primary residence (for owner)
40%Other*
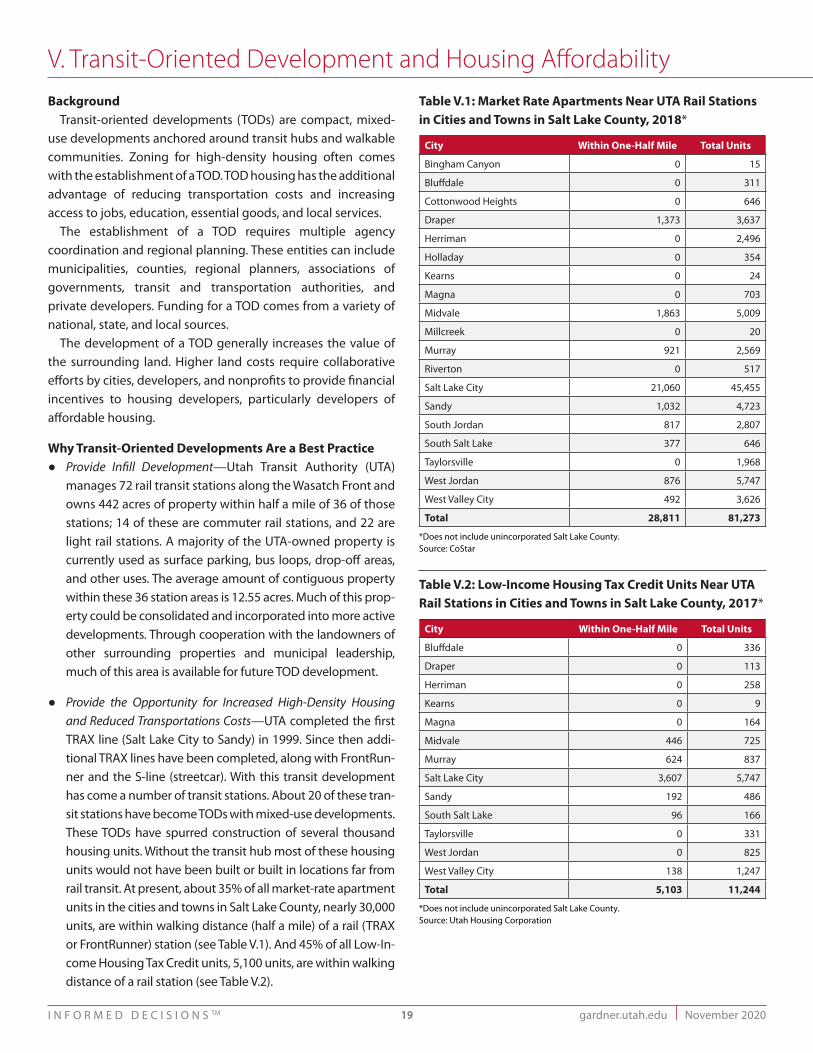
gardner.utah.edu I November 2020I N F O R M E D D E C I S I O N S TM 19
BackgroundTransit-oriented developments (TODs) are compact, mixed-
use developments anchored around transit hubs and walkable communities. Zoning for high-density housing often comes with the establishment of a TOD. TOD housing has the additional advantage of reducing transportation costs and increasing access to jobs, education, essential goods, and local services.
The establishment of a TOD requires multiple agency coordination and regional planning. These entities can include municipalities, counties, regional planners, associations of governments, transit and transportation authorities, and private developers. Funding for a TOD comes from a variety of national, state, and local sources.
The development of a TOD generally increases the value of the surrounding land. Higher land costs require collaborative efforts by cities, developers, and nonprofits to provide financial incentives to housing developers, particularly developers of affordable housing.
Why Transit-Oriented Developments Are a Best Practice● Provide Infill Development—Utah Transit Authority (UTA)
manages 72 rail transit stations along the Wasatch Front and owns 442 acres of property within half a mile of 36 of those stations; 14 of these are commuter rail stations, and 22 are light rail stations. A majority of the UTA-owned property is currently used as surface parking, bus loops, drop-off areas, and other uses. The average amount of contiguous property within these 36 station areas is 12.55 acres. Much of this prop-erty could be consolidated and incorporated into more active developments. Through cooperation with the landowners of other surrounding properties and municipal leadership, much of this area is available for future TOD development.
● Provide the Opportunity for Increased High-Density Housing and Reduced Transportations Costs—UTA completed the first TRAX line (Salt Lake City to Sandy) in 1999. Since then addi-tional TRAX lines have been completed, along with FrontRun-ner and the S-line (streetcar). With this transit development has come a number of transit stations. About 20 of these tran-sit stations have become TODs with mixed-use developments. These TODs have spurred construction of several thousand housing units. Without the transit hub most of these housing units would not have been built or built in locations far from rail transit. At present, about 35% of all market-rate apartment units in the cities and towns in Salt Lake County, nearly 30,000 units, are within walking distance (half a mile) of a rail (TRAX or FrontRunner) station (see Table V.1). And 45% of all Low-In-come Housing Tax Credit units, 5,100 units, are within walking distance of a rail station (see Table V.2).
V. Transit-Oriented Development and Housing AffordabilityTable V.1: Market Rate Apartments Near UTA Rail Stations in Cities and Towns in Salt Lake County, 2018*
City Within One-Half Mile Total Units
Bingham Canyon 0 15
Bluffdale 0 311
Cottonwood Heights 0 646
Draper 1,373 3,637
Herriman 0 2,496
Holladay 0 354
Kearns 0 24
Magna 0 703
Midvale 1,863 5,009
Millcreek 0 20
Murray 921 2,569
Riverton 0 517
Salt Lake City 21,060 45,455
Sandy 1,032 4,723
South Jordan 817 2,807
South Salt Lake 377 646
Taylorsville 0 1,968
West Jordan 876 5,747
West Valley City 492 3,626
Total 28,811 81,273
*Does not include unincorporated Salt Lake County.Source: CoStar
Table V.2: Low-Income Housing Tax Credit Units Near UTA Rail Stations in Cities and Towns in Salt Lake County, 2017*
City Within One-Half Mile Total Units
Bluffdale 0 336
Draper 0 113
Herriman 0 258
Kearns 0 9
Magna 0 164
Midvale 446 725
Murray 624 837
Salt Lake City 3,607 5,747
Sandy 192 486
South Salt Lake 96 166
Taylorsville 0 331
West Jordan 0 825
West Valley City 138 1,247
Total 5,103 11,244
*Does not include unincorporated Salt Lake County.Source: Utah Housing Corporation
November 2020 I gardner.utah.edu I N F O R M E D D E C I S I O N S TM20
● Utilize Existing Transportation Infrastructure—Utilizing the ex-isting infrastructure, municipalities and regional authorities can focus TOD growth around existing transit hubs, minimiz-ing the need for significant new transportation infrastructure.
● Access Multiple, Well-Established Funding Sources—Financing for TODs comes from a variety of public and private sources, including federal grant funds from the Federal Transit Ad-ministration. Many regions, including Atlanta and Denver, have partnered with municipalities, financial institutions, state and federal government, and nonprofits to create TOD-specific funds.
In Utah, the Utah Equitable TOD Loan Fund will have an initial two-year origination period and a total term of five years, with the intent of renewing these terms annually. The fund is made possible by the support of $5 million from the State of Utah Division of Housing and Community Develop-ment and $2 million from Salt Lake County. Envision Utah, Morgan Stanley, Synchrony Financial, Zions Bank, the Utah Center for Affordable Housing, and other partners have also made this fund possible.
● Revitalize Neighborhoods/Create a Sense of Space—The pro-motion of TOD on urban infill parcels can create opportuni-ties to revitalize older communities and neighborhoods. Mixed-use developments at TODs can also serve as an es-sential tool in achieving broader community strategies. TOD neighborhoods provide gathering places, open spaces, and community resources that may not otherwise be available to the community.
● Satisfy S.B. 34—TODs are included in S.B. 34’s strategies: “(G) encourage higher density or moderate-income residential development near major transit investment corridors.”
Framework for Implementation ● Multiple Stakeholder Coordination—Municipal leadership,
regional authorities, transportation agencies, private devel-opers, and other community stakeholders coordinate efforts to bring affordable housing to TODs. Inclusion of low- to very low-income housing in TODs is rare and generally re-quires the development of Low-Income Housing Tax Credit projects. Private-public partnership can facilitate affordable housing with land write-downs, tax increment financing, and federal assistance.
● Accommodative Zoning—TOD zoning, in a number of cities, has facilitated the development of high-density housing. Some of the most successful are American Fork, Sandy, Mid-vale, Millcreek, Salt Lake City, Farmington, and Ogden. These cities are a ready resource in the implementation and devel-opment of TOD housing.
Examples of Best Practice● American Fork—In 2018, American Fork lifted a moratorium
on new development in its TOD zone surrounding the Amer-ican Fork FrontRunner station. With the repeal and replace-ment of Section 17.4.608 of the American Fork City Develop-ment Code, the city council issued revised design guidelines for the TOD section of its municipal code. American Fork’s plans allow for housing development that ranges from high-intensity urban designs to low-intensity designs, in-cluding single-family homes. The city plans to incorporate affordable housing opportunities and create housing com-munities that accommodate a variety of economic and de-mographic segments. Currently, two notable residential projects are in the review process: the Castlewood Apart-ments located at 900 West 200 South, and the Edgewater TOD residential development at 1150 West 200 South.
● Farmington—Station Park opened in 2011 and has been a commercial anchor of transit-oriented development in Farmington. Farmington City has adopted a mixed-use dis-trict development plan that encourages a compatible mix of uses. By allowing for flexibility in design, the plan promotes a transit- and pedestrian-oriented pattern of development that is consistent with the objectives of the Farmington City General Plan. Specifically, the Transit Mixed Use District (TMU) is intended to develop retail and mixed-use projects in a manner that promotes walkability and enhances the de-sirability of transit use. The TMU allows for higher-intensity development as long as it doesn’t impair walkability or tran-sit use and helps create a viable TOD that transitions smooth-ly into the surrounding communities.
● Denver Transit-Oriented Development Fund—Led by the Of-fice of Economic Development (OED), Denver established a TOD fund to provide a new financing mechanism allowing for the acquisition and preservation of affordable housing along existing and new transit corridors. The TOD fund brought funds from the City of Denver, the MacArthur Foun-dation, U.S. Bank, Wells Fargo, Colorado Housing and Fi-
gardner.utah.edu I November 2020I N F O R M E D D E C I S I O N S TM 21
nance Authority, Rose Community Foundation, and the Mile High Community Loan Fund, among others. OED also lever-aged other federal funds, including the Neighborhood Sta-bilization Program, to maximize the fund’s impact. The Ur-ban Land Conservancy, a local nonprofit, acts as the fund’s sole borrower and oversees land purchases to target three types of properties in TOD areas: existing federally assisted rental properties, existing unsubsidized but below-mar-ket-rate rental properties, and vacant or commercial proper-ties to be converted to new affordable housing. Since its in-ception, 17 loans have been made through the Denver Regional TOD Fund, providing a total of $34 million in financ-ing for property acquisitions near public transit in the Denver metro area. As a result, more than 1,450 affordable homes near public transportation have been created or preserved.
Variations on a Theme● Land Value Capture—Potential value capture tools include
special assessments and taxes, tax increment financing, varying forms of developer contributions, and joint devel-opment or other public sector real estate transactions. These tools are used to help offset the significant upfront invest-ment needed to develop TODs, including public infrastruc-ture, connectivity improvements, affordable housing, and other community features, including parks and open space. Value capture tools work best in areas where there is a ro-bust real estate market, significant development potential, strong political and community support, one (or few) juris-dictions involved, and a strong municipal fiscal position.
November 2020 I gardner.utah.edu I N F O R M E D D E C I S I O N S TM22
To identify “best practices” the Gardner Policy Institute conducted a survey of 35 practitioners. The survey included a list of 16 potential practices gleaned from a literature search. The survey asked the practitioner to identify practices that in their experience were most effective in addressing the issue of housing affordability. Thirty of the 35 practitioners responded. The selection of best practices for this study was confirmed by the results of the survey. See below for the survey and the list of practitioners.
Table VI.1: Respondents to Best Practices SurveyPractitioner/Respondent Organization
Ackerow, Mike Executive Director, Community Development Corporation of Utah
Bishop, Brad Executive Director, Self-Help Homes
Brereton, John Consultant to Utah Private Activity Bond Authority
Corroon, Peter Former mayor of Salt Lake County, developer of affordable housing
Dahl, Matt Redevelopment Agency Director, Midvale City
Datwyler, Kim Former Executive Director, Neighborhood Housing Solutions
Diehl, Cameron Executive Director of Utah League of Cities and Towns
Erickson, Steve Housing advocate
Funk, Tim Director of Community Housing Assistance Programs, Crossroads Urban Center
Gallegos, Mike Director of Housing and Community Development, Salt Lake County
Garciaz, Maria CEO, NeighborWorks Salt Lake
Goff, Lani Director, Salt Lake City Housing and Neighborhood Development
Gray, Lilly National Development Council Greater Salt Lake Area
Jepperson, Randy Housing Program Manager, Salt Lake County
Jones, Jeff Economic Development and Housing Director, Summit County
Kimball, Janice CEO, Housing Connect (formerly the Housing Authority of the County of Salt Lake)
Lofgren, Dan President and CEO, Cowboy Partners
Loomis, Scott Executive Director, Mountainlands Community Housing Trust
Milligan, Marci Development Consultant, Utah Nonprofit Housing Corporation
Nelson, Chris Professor of Planning & Real Estate Development, University of Arizona
Parker, Chris Executive Director, GIV Group
Price, Tim Executive Director, Ogden City Housing Authority
Rollins, Tara Executive Director, Utah Housing Coalition
Royall, Heather West Valley City Grants Division
Schulte, Jim President, Restore Utah
Smith, Lynell CEO, Housing Authority of Utah County
Springmeyer, Bob Bonneville Research
Stauffer, Rhoda Director, Park City Affordable Housing Program
Tippits, Bill Associate Director, Crossroads Urban Center
Weaver, Michele Rural Community Assistance Corporation
VI. Survey of Best Practices
Best Practices Survey
The Gardner Policy Institute is engaged in a study of “best practices” used by Utah’s cities and counties to improve housing affordability and increase the supply of affordable housing. I’ve conducted a literature search to identify some best practices used in other states; see below. I need help in identifying the practices that have been most effective in Utah. I’d appreciate it if you’d take a few minutes and identify, from your experience, a couple practices that you feel have been most effective. Please return your comments by email. Any specific examples of implementation, outcomes, and jurisdictions with best practices would be very helpful.
List of some possible best practicesAccessory Dwelling UnitsUse of RDAs, CRAs, tax increment financingTODs as source of housing developmentPreservation and rehabilitation of existing
affordable housingDensity bonusesUp-zoning and land use regulationsInclusionary zoningDevelopment incentives for city (S.B. 34)Repurposing of underutilized commercial space Streamlining approval processReduced fees for affordable housingLand trustHousing trust fund Olene Walker, Pamela Atkinson
HomelessTax or fee rebatesUse of innovative materials to reduce costRental assistance/down payment assistanceOther practices you are familiar with
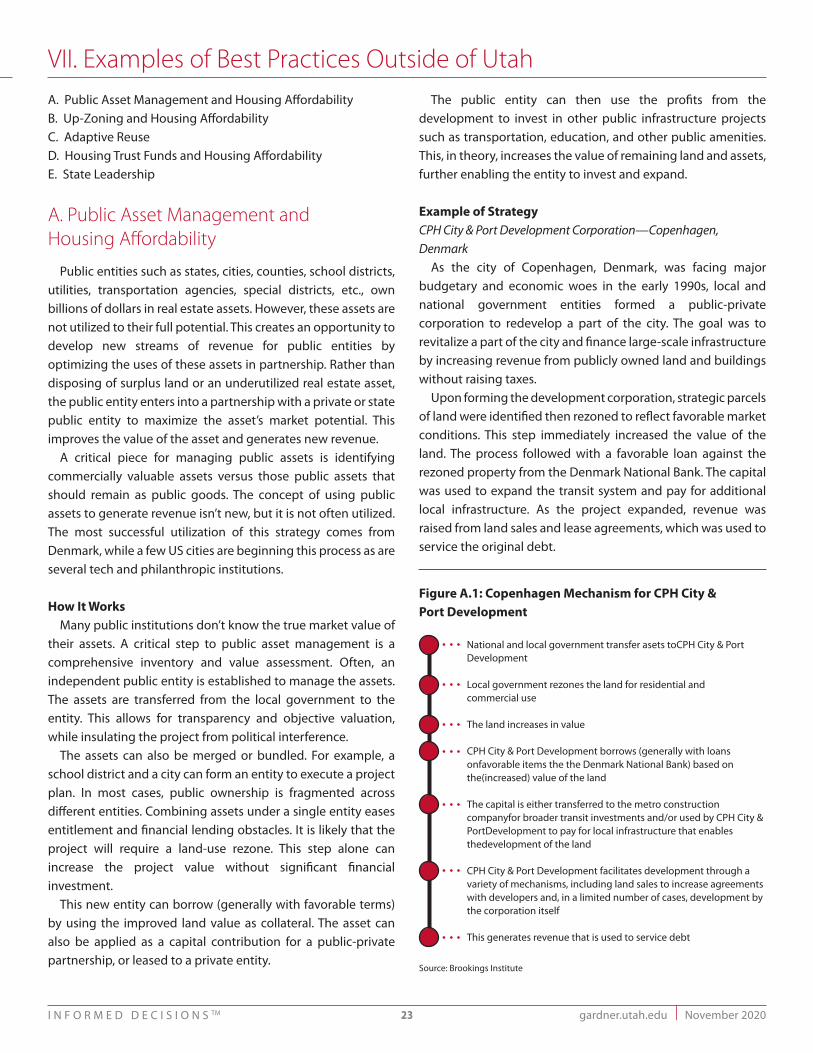
gardner.utah.edu I November 2020I N F O R M E D D E C I S I O N S TM 23
VII. Examples of Best Practices Outside of UtahA. Public Asset Management and Housing AffordabilityB. Up-Zoning and Housing AffordabilityC. Adaptive ReuseD. Housing Trust Funds and Housing AffordabilityE. State Leadership
A. Public Asset Management and Housing Affordability
Public entities such as states, cities, counties, school districts, utilities, transportation agencies, special districts, etc., own billions of dollars in real estate assets. However, these assets are not utilized to their full potential. This creates an opportunity to develop new streams of revenue for public entities by optimizing the uses of these assets in partnership. Rather than disposing of surplus land or an underutilized real estate asset, the public entity enters into a partnership with a private or state public entity to maximize the asset’s market potential. This improves the value of the asset and generates new revenue.
A critical piece for managing public assets is identifying commercially valuable assets versus those public assets that should remain as public goods. The concept of using public assets to generate revenue isn’t new, but it is not often utilized. The most successful utilization of this strategy comes from Denmark, while a few US cities are beginning this process as are several tech and philanthropic institutions.
How It WorksMany public institutions don’t know the true market value of
their assets. A critical step to public asset management is a comprehensive inventory and value assessment. Often, an independent public entity is established to manage the assets. The assets are transferred from the local government to the entity. This allows for transparency and objective valuation, while insulating the project from political interference.
The assets can also be merged or bundled. For example, a school district and a city can form an entity to execute a project plan. In most cases, public ownership is fragmented across different entities. Combining assets under a single entity eases entitlement and financial lending obstacles. It is likely that the project will require a land-use rezone. This step alone can increase the project value without significant financial investment.
This new entity can borrow (generally with favorable terms) by using the improved land value as collateral. The asset can also be applied as a capital contribution for a public-private partnership, or leased to a private entity.
The public entity can then use the profits from the development to invest in other public infrastructure projects such as transportation, education, and other public amenities. This, in theory, increases the value of remaining land and assets, further enabling the entity to invest and expand.
Example of StrategyCPH City & Port Development Corporation—Copenhagen, Denmark
As the city of Copenhagen, Denmark, was facing major budgetary and economic woes in the early 1990s, local and national government entities formed a public-private corporation to redevelop a part of the city. The goal was to revitalize a part of the city and finance large-scale infrastructure by increasing revenue from publicly owned land and buildings without raising taxes.
Upon forming the development corporation, strategic parcels of land were identified then rezoned to reflect favorable market conditions. This step immediately increased the value of the land. The process followed with a favorable loan against the rezoned property from the Denmark National Bank. The capital was used to expand the transit system and pay for additional local infrastructure. As the project expanded, revenue was raised from land sales and lease agreements, which was used to service the original debt.
VI. Survey of Best Practices
National and local government transfer asets to CPH City & Port Development
Local government rezones the land for residential and commercial use
The land increases in value
CPH City & Port Development borrows (generally with loans on favorable items the the Denmark National Bank) based on the (increased) value of the land
The capital is either transferred to the metro construction company for broader transit investments and/or used by CPH City & Port Development to pay for local infrastructure that enables the development of the land
CPH City & Port Development facilitates development through a variety of mechanisms, including land sales to increase agreements with developers and, in a limited number of cases, development by the corporation itself
This generates revenue that is used to service debt
Figure A.1: Copenhagen Mechanism for CPH City & Port Development
Source: Brookings Institute
November 2020 I gardner.utah.edu I N F O R M E D D E C I S I O N S TM24
Applications to UtahUtah’s public entities are uniquely positioned to utilize the
public asset, public-private partnership model. There are numerous public universities, utilities, and even health care providers that could provide a wide range of public benefits such as affordable housing or health care services.
This could involve making land available for critical public needs such as providing affordable housing, addressing food deserts, increasing education and job training, and expanding green or open space. Public asset management could also involve commercial endeavors, generating returns that flow back into government budgets to be invested in transportation, infrastructure, public housing, behavioral health care, public education, or other government services.
B. Up-Zoning and Housing Affordability
BackgroundUp-zoning is defined as land use change that allows for higher
development intensity. During the 1970s cities rezoned land to increase restrictiveness of land use intensity, such as housing. Today, the opposite philosophy is applied to up-zoning. Cities use the policy to increase housing density and provide options for affordable housing. As housing affordability continues to be a burden, policy makers are using up-zoning as one of the solutions to decrease displacement as well as provide new opportunities to lower-income residents in amenity-rich areas.
Examples of Up-ZoningMinneapolis, Minnesota—Over the last three years the city
worked on the Minneapolis 2040 plan, which includes strategies aimed at addressing climate change, density, and affordable housing. The plan went into effect at the beginning of 2020 and included at least two drafts and over 100 amendments.
The major affordable housing intervention includes a two-strategy approach. First, the plan allocates $25 million in subsidies to a housing fund and requires that 10% of apartment units must be reserved for moderate-income households. Second, the plan effectively up-zones the whole city to allow denser development with more units to be built in areas that previously contained only single-family homes.
The plan also focuses on providing higher density near transit stops and eliminating off-street minimum parking requirements to free up land for denser multifamily development.
State of Oregon—Because Oregon has defined urban growth boundaries, metropolitan and state regulatory authorities regularly assess whether cities are meeting their population needs to accommodate 20 years of growth.
In 2019 the Oregon State Legislature passed H.B. 2001, allowing for increased housing density in residential areas where only single-family building was previously approved, thus up-zoning the whole state. The policy eliminates any local bans on duplexes in low-density residential areas that have more than 10,000 residents. In cities with more than 25,000 residents, the policy allows triplexes, fourplexes, and attached townhomes. The bill gives cities the ability to regulate design characteristics and size, and allows for flexibility to incentivize projects that create new, below-market units.
Seattle, Washington—The city established a Mandatory Housing Affordability (MHA) policy with new zoning guidelines ensuring that new commercial and multifamily residential developments provide affordable housing units. This policy change is expected to produce over 6,000 low-income units over the next decade.
There are five zones throughout the city requiring different levels of development density, ranging from low-rise detached and row house neighborhoods to taller mixed-use districts, where buildings will be allowed to rise to a height of 95 feet or more. Approximately 6% of Seattle’s single-family zones will be up zoned.
For builders, there are options to opt out of these regulations; however, required fees in lieu of on-site affordable housing construction start at $5.58 per square foot for developments located in low-rise areas outside downtown and increase to a maximum of $35.75 per square foot for larger mixed-use developments.
C. Housing Affordability and Adaptive Reuse of Commercial for Residential
BackgroundAdaptive reuse or repurposing of office, industrial, and retail
properties for residential use is not a new idea. It has been a redevelopment staple in major metropolitan areas like New York City and San Francisco for years. Salt Lake City has several examples of adaptive reuse in the Central Business District (CBD). The 2002 Olympics spurred the adaptive reuse of aging warehouses to residential use, including the Dakota Lofts, Artspace, Broadway Lofts, and Pierpont Lofts. The city has adopted a D-3 Downtown zone that allows for the adaptive reuse or replacement of warehouse space with mixed-use, multifamily spaces. Repurposing commercial space to residential in Utah has been limited to Salt Lake City’s CBD. But the recent closures of big box locations by Shopko, Kmart, Sears, J.C. Penney, and Toys-R-Us provides adaptive reuse opportunities for suburban and even some rural communities.
gardner.utah.edu I November 2020I N F O R M E D D E C I S I O N S TM 25
In the past two years Shopko has closed 19 locations in Utah. A review of commercial listings shows Shopko properties for sale in four cities: Ogden, Nephi, Roosevelt, and Brigham City.
The continued growth of online shopping, along with the impact of COVID-19, will likely open up more opportunities to convert retail space to residential uses. But the conversion can be difficult. A different use will require a zoning change. The best prospects for conversion are freestanding buildings that require demolition, which can cost as much as $500,000. There can be local tax issues. Additionally, there could be many interested parties in the “dark space.” Amazon, At Home, and Dick’s Sporting Goods have all expressed interest in former Sears and Kmart locations. Despite these complications, collaborative efforts by cities and developers have created additional housing through adaptive reuse in markets facing housing shortages.
Examples of Adaptive Reuse—In Burbank, California, the relocation of an IKEA store left an abandoned site that was developed into a mixed-use location with several hundred housing units. A 94-unit apartment complex in Westport, Connecticut, was developed after demolition of an abandoned office building. The Howard Hughes Corp., landlord of a shuttered mall in Alexandria, Virginia, donated a Macy’s store to temporarily house the homeless. Converted office space in downtown Dallas provided over 500 new rental units. Numerous examples of commercial-to-residential conversion can be found through a web search. Crucial to all conversions is the receptivity of the local planning commission and city council to a change in land use.
D. Housing Trust Funds and Affordable Housing
BackgroundFunding is one of the many challenges facing affordable
housing projects in Utah. One way to address funding challenges is through housing trust funds (HTFs). These state and local funds secure ongoing dedicated public funds for affordable housing needs. Common revenue sources for HTFs include developer fees, penalties on late payments of real estate taxes, a dedicated portion of the local real estate transfer tax, and fees from other real estate–related transactions. Most often, HTFs address affordable housing needs by providing financing for affordable housing construction and preservation through techniques like zero-interest loans or gap financing. Other tactics may include demand-side solutions such as subsidizing down payments for low- to moderate-income households.
The National Housing Trust Fund, created in 2008, complements existing local efforts to preserve and produce affordable housing. The program provides block grants to states to increase or preserve the supply of rental housing affordable to extremely low-income households (30% of the area median income or less, or below the federal poverty guideline). The national HTF requires 90% of awarded funds to be used for rental housing. The first awards of the national HTF began in 2016, with Utah awarded funds for three projects for a total of 39 units.
Housing Trust Funds in UtahThe Olene Walker Housing Loan Fund (OWHLF) is Utah’s state
housing trust fund. The fund supports quality affordable housing options to meet the needs of Utah’s individuals and families, with a focus on developing housing for very low-income, low-income, and moderate-income persons. The program is administered by the Utah Housing and Community Development Division. It combines federal HOME funding, USDA rural development funding, annual appropriations from the state legislature, and, recently, program income and loan repayments. For the 2018–2019 program year, the OWHLF had 933 current loans, a $146.4 million total portfolio value, and assisted 1,217 units for a lifetime total of 20,703 units funded.
Salt Lake City also has a housing trust fund, and while it acts similar to a traditional HTF, it is not subject to the same rules and regulations from HUD. This fund provides loans to housing sponsors and developers to support affordable and special needs housing within the city. It is funded through the general fund of the city and functions as a revolving loan fund that accepts applications year-round and requires detailed descriptions of the project and how it will assist with the city’s affordable and special needs housing. Since 2009, 2,330 affordable units in 29 developments have been assisted by Salt Lake City’s HTF. From July 2018 to June 2019, 65 new units and 95 rehabilitated units in three developments were completed. As of March 2020, 11 developments, including two rehabilitation projects, were in the development process and 10 projects in the pipeline for HTF funding. Currently, the city’s Housing and Neighborhood Development department is working with the RDA under the direction of the city council to streamline the funding process for multifamily developments.
Housing Trust Funds in Other RegionsNationally, there are over 800 state and local HTFs generating
more than $2.5 billion a year to support critical housing needs. These funds are a result of state and local action led by community organizers, housing advocates, elected officials,
November 2020 I gardner.utah.edu I N F O R M E D D E C I S I O N S TM26
and other allies who have agreed that the development of a permanent stream of revenues dedicated to affordable housing is a public priority. For HTFs to be effective on a local level, there needs to be persistent advocacy, ongoing revenue support, and administrative direction.
In King County, Washington, the county collaborated with cities to create a regional HTF, A Regional Coalition for Housing (ARCH), to address the affordability crisis driven by robust economic growth in the region. Each jurisdiction contributes funds to the HTF, and all members receive an equitable distribution of ARCH resources. Additional revenue sources include general funds, federal Community Development Block Grant funds, payments by developers, loan repayments, earned interest, fee waivers, infrastructure improvements, and contributions of land. Since 1993, the ARCH HTF has funded over 3,250 units of housing for families, seniors, and persons with special needs.
The Sadowski Fund operates as an HTF in Florida and is administered by the Sadowski Coalition. The coalition of 32 statewide organizations began in 1991 to obtain a dedicated revenue source to fund the state’s affordable housing programs. Initially, Florida’s housing programs were funded when the “document stamp tax” paid on all real estate transactions was increased in 1992. All monies generated were dedicated to state and local housing trust funds.
E. State Leadership and Housing Affordability
Local opposition often impedes progress on Utah’s housing shortage. Any housing development that requires a special permit or variance will likely trigger a public meeting. Public meetings have their virtues. They allow those who are most affected to voice their views and can act as a check on developer excesses. But they can also allow a small group of unrepresentative neighbors to amplify opposition to new developments. In addition to being relatively few in number, the opponents may not be representative demographically or socioeconomically of the jurisdiction. Their interests may not reflect the larger community’s interests and housing needs.
A large share of those who would benefit from a new development almost always live outside the jurisdiction. Their voices in support of additional housing go unheard. This imbalance between staunch opposition and widely diffused support underscores the need for the state to step in and balance the scales. Local governments are often limited in their ability to make meaningful progress on the challenges of affordability. State support can help. An example, in 2019 the Utah Legislature passed S.B. 34, the most consequential affordable housing legislation to date. S.B. 34 incentivizes affordable housing development by tying state transportation funding to strategies aimed at encouraging affordable housing.
State leadership, as a best practice, is exemplified by Oregon and California. In 2019 the Oregon Legislature passed H.B. 2001 that eliminates single-family zoning in much of the state. “Under the new bill, cities of more than 1,000 in the Portland metropolitan area and those of more than 25,000 in the rest of the state will have to allow up to fourplexes in single-family neighborhoods. Cities between 10,000 and 25,000 would have to at least allow duplexes.”13 Oregon will be a test case for other cities and states contemplating eliminating the single-family zone.
In 2016 and 2017, California passed accessory dwelling unit reforms that require cities to permit one ADU per single-family home, streamline ADU permitting, set utility fees proportional to the burden of ADUs, and further reduce fees for ADUs built inside an existing home. The law also waived parking requirements for ADUs located within half a mile of a transit stop or within a block of a car-share stop. After passage of the ADU legislation, the annual number of ADU units receiving building permits in Los Angeles increased from a few hundred to almost 4,200 in 2018.
Progress on the housing crisis needs continued state and civic leadership. Without it, today’s children, Utah’s next generation, will face an even greater scarcity of affordable housing and more burdensome housing prices.
gardner.utah.edu I November 2020I N F O R M E D D E C I S I O N S TM 27
Other Local Studies on Housing AffordabilityUtah League of Cities and Towns
In 2018, the Utah League of Cities and Towns published Keys to Housing Policy in Utah. The first section of this report is devoted to housing terminology: common housing terms, land use terms, and financial terms. The second section includes brief descriptions of 15 strategies followed by four case studies briefly describing the implementation of a strategy: Clearfield (form-based code for downtown housing), Park City (workforce deed-restricted housing), South Salt Lake (TOD/Community Redevelopment Area), and Ogden (Community Reinvestment Area and zoning code updates).https://site.utah.gov/ulct/wp-content/uploads/sites/4/2018/06/Keys-to-Housing-Report.pdf
In November 2019 the Utah League of Cities and Towns published One Key to Housing, Accessory Dwelling Units: A Resource Guide for Municipal Officials and Staff. This is a how-to publication for municipalities considering adopting an ADU ordinance. http://www.ulct.org/wp-content/uploads/sites/4/2019/08/One-Key-ADUs_Updated-8.13.2019.pdf
University of Utah, Department of City & Metropolitan Planning
Graduate students have produced a 50-page draft report titled Affordable Housing Strategies: State-of-the-Practice in Ten Utah Cities. The study identifies 15 housing strategies and then examines the use of those strategies in 10 major cities in Utah. The report was produced and published under the direction of Professor Reid Ewing.
Utah Foundation This study will address the issue of housing affordability and
the “missing middle.” In this report, missing middle is defined as those households who earn too much to qualify for subsidized housing but not enough to cover the costs of market-rate housing. This study will examine the scope of the problem, identify geographic problem areas where the issue is most acute, and analyze the pros and cons of various strategies that could help alleviate it. Particular emphasis will be placed on exploring homeownership options.
Endnotes1. Utah Code Ann., 10-9a-5.2. Salt Lake County Municipal Code, Chapter 19.02.020.3. Kem C. Gardner Policy Institute, Demographics, and Ivory-Boyer Construction Database. 4. “Cities Start to Question an American Ideal: A House with a Yard on Every Lot,” New York Times, June 18, 2019.5. Housing America’s Older Adults 2019, Harvard Joint Center for Housing Studies.6. “One Home, a Lifetime of Impact,” Washington Post, July 23, 2020.7. Utah Code Ann., 10-9a-403.8. Utah Code Ann., 17C-1-412.9. Original Redevelopment Agency legislation used the nomenclature of RDA. In 2006, legislation created Urban Renewal Areas (URA), Community Development
Areas (CDA) and Economic Development Areas (EDA). In 2016 Legislation collapse URA, CDA, and EDA into a single designation of Community Reinvestment Area (CRA). Project areas retain the nomenclature used at the time of their creation.
10. The Redevelopment Agency of Salt Lake City, 2019 Annual Report.11. Karen Chapple, et al., Jumpstarting the Market for Accessory Dwelling Units: Lessons Learned from Portland, Seattle, and Vancouver (Terner Center for Housing
Innovation, UC Berkeley: 2017).12. Tara Horn, Debi Elliott, and Amber Johnson, Accessory Dwelling Unit Survey for Portland, Eugene, and Ashland, Oregon (Survey Research Lab for the State of
Oregon Department of Environmental Quality: September 2013).13. “Oregon Strikes Exclusive Single-Family Zoning, But Effects May Take Years,” Oregon Public Broadcasting, July 3, 2019.
Kem C. Gardner Policy Institute I 411 East South Temple Street, Salt Lake City, Utah 84111 I 801-585-5618 I gardner.utah.edu
Kem C. Gardner Policy Institute Staff and AdvisorsLeadership TeamNatalie Gochnour, Associate Dean and DirectorJennifer Robinson, Associate DirectorShelley Kruger, Accounting and Finance ManagerColleen Larson, Administrative ManagerDianne Meppen, Director of Survey ResearchPamela S. Perlich, Director of Demographic ResearchJuliette Tennert, Chief EconomistNicholas Thiriot, Communications Director James A. Wood, Ivory-Boyer Senior Fellow
StaffMax Backlund, Senior Research AssociateSamantha Ball, Senior Research AssociateMallory Bateman, Senior Research Analyst Andrea Brandley, Research AssociateMarin Christensen, Research Associate Mike Christensen, Scholar-in-ResidenceJohn C. Downen, Deputy Director of Economic
and Public Policy ResearchDejan Eskic, Senior Research AnalystEmily Harris, DemographerMichael T. Hogue, Senior Research StatisticianMike Hollingshaus, Senior DemographerThomas Holst, Senior Energy Analyst
Meredith King, Research Associate Jennifer Leaver, Senior Tourism AnalystLevi Pace, Senior Research EconomistShannon Simonsen, Research CoordinatorJoshua Spolsdoff, Research Economist Paul Springer, Senior Graphic DesignerLaura Summers, Senior Health Care AnalystNatalie Young, Research Analyst
Faculty AdvisorsMatt Burbank, Faculty AdvisorAdam Meirowitz, Faculty Advisor
Senior AdvisorsJonathan Ball, Office of the Legislative Fiscal AnalystGary Cornia, Marriott School of BusinessTheresa Foxley, EDCUtahDan Griffiths, Tanner LLCRoger Hendrix, Hendrix ConsultingJoel Kotkin, Chapman UniversityDarin Mellott, CBREChris Redgrave, Zions BankBud Scruggs, Cynosure GroupWesley Smith, Western Governors University
Kem C. Gardner Policy Institute Advisory BoardConvenersMichael O. LeavittMitt Romney
BoardScott Anderson, Co-ChairGail Miller, Co-ChairDoug AndersonDeborah BayleCynthia A. BergRoger BoyerWilford ClydeSophia M. DiCaro
Cameron DiehlLisa EcclesSpencer P. EcclesChristian GardnerKem C. GardnerKimberly GardnerNatalie GochnourBrandy GraceClark IvoryMike S. LeavittDerek MillerAnn MillnerSterling Nielsen
Cristina OrtegaJason PerryRay PickupGary B. PorterTaylor RandallJill Remington LoveJosh RomneyCharles W. SorensonJames Lee SorensonVicki VarelaRuth V. WatkinsTed Wilson
Ex Officio (invited)Governor Gary HerbertSpeaker Brad WilsonSenate President
Stuart AdamsRepresentative Brian KingSenator Karen MayneMayor Jenny WilsonMayor Erin Mendenhall
Partners in the Community The following individuals and entities help support the research mission of the Kem C. Gardner Policy Institute.
Legacy PartnersThe Gardner CompanyIntermountain HealthcareClark and Christine Ivory FoundationKSL and Deseret NewsLarry H. & Gail Miller Family FoundationMountain America Credit UnionMitt and Ann RomneySalt Lake City CorporationSalt Lake CountyUniversity of Utah HealthUtah Governor’s Office of Economic Development
WCF Insurance
Zions Bank
Executive PartnersMark and Karen BouchardThe Boyer CompanySalt Lake Chamber
Sustaining PartnersClyde CompaniesDominion Energy
Kem C. Gardner Policy Institute Health Care Advisory CouncilNathan CheckettsEdward ClarkJoseph Miner
Mikelle MoorePhillip SingerEric Hales
Stephen L. WalstonChad Westover