Embed Size (px)
Citation preview
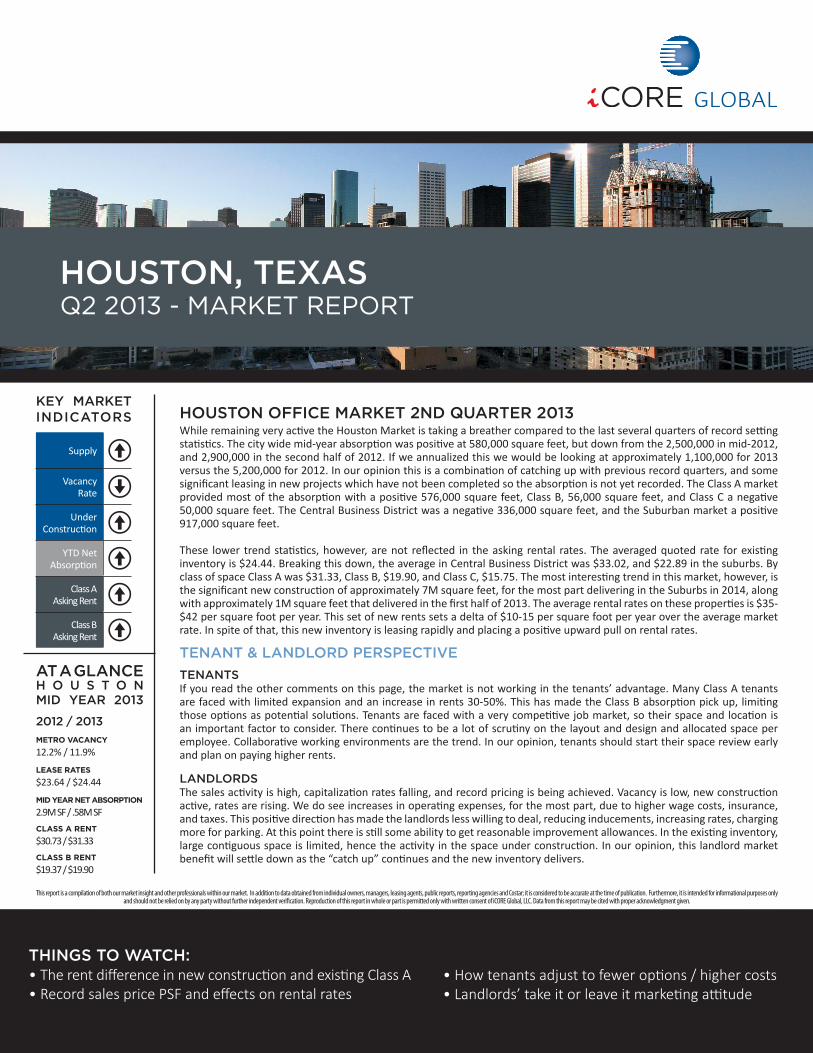
HOUSTON, TEXAS Q2 2013 - MARKET REPORT
KEY MARKET INDICATORS
Supply
Vacancy Rate
Under Construction
YTD Net Absorption
Class A Asking Rent
Class B Asking Rent
This report is a compilation of both our market insight and other professionals within our market. In addition to data obtained from individual owners, managers, leasing agents, public reports, reporting agencies and Costar; it is considered to be accurate at the time of publication. Furthermore, it is intended for informational purposes only and should not be relied on by any party without further independent verification. Reproduction of this report in whole or part is permitted only with written consent of iCORE Global, LLC. Data from this report may be cited with proper acknowledgment given.
AT A GLANCE H O U S T O NMID YEAR 2013
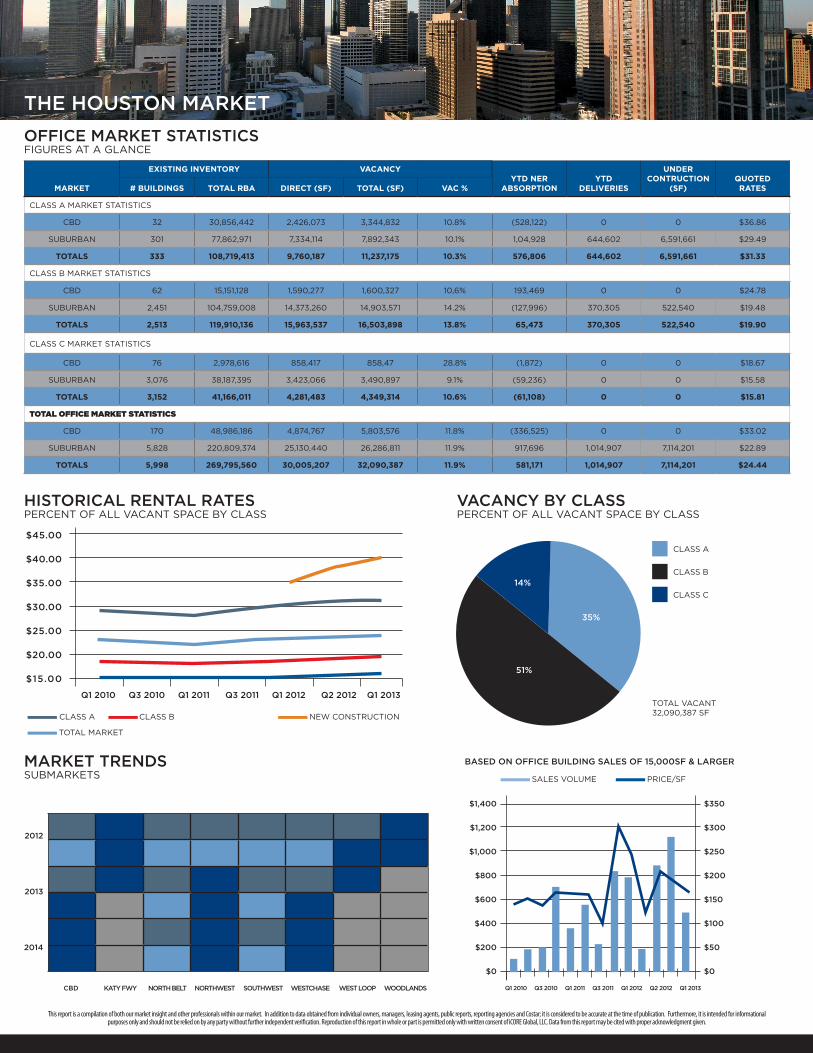
HOUSTON OFFICE MARKET 2ND QUARTER 2013While remaining very active the Houston Market is taking a breather compared to the last several quarters of record setting statistics. The city wide mid-year absorption was positive at 580,000 square feet, but down from the 2,500,000 in mid-2012, and 2,900,000 in the second half of 2012. If we annualized this we would be looking at approximately 1,100,000 for 2013 versus the 5,200,000 for 2012. In our opinion this is a combination of catching up with previous record quarters, and some significant leasing in new projects which have not been completed so the absorption is not yet recorded. The Class A market provided most of the absorption with a positive 576,000 square feet, Class B, 56,000 square feet, and Class C a negative 50,000 square feet. The Central Business District was a negative 336,000 square feet, and the Suburban market a positive 917,000 square feet.
These lower trend statistics, however, are not reflected in the asking rental rates. The averaged quoted rate for existing inventory is $24.44. Breaking this down, the average in Central Business District was $33.02, and $22.89 in the suburbs. By class of space Class A was $31.33, Class B, $19.90, and Class C, $15.75. The most interesting trend in this market, however, is the significant new construction of approximately 7M square feet, for the most part delivering in the Suburbs in 2014, along with approximately 1M square feet that delivered in the first half of 2013. The average rental rates on these properties is $35-$42 per square foot per year. This set of new rents sets a delta of $10-15 per square foot per year over the average market rate. In spite of that, this new inventory is leasing rapidly and placing a positive upward pull on rental rates.
TENANT & LANDLORD PERSPECTIVETENANTSIf you read the other comments on this page, the market is not working in the tenants’ advantage. Many Class A tenants are faced with limited expansion and an increase in rents 30-50%. This has made the Class B absorption pick up, limiting those options as potential solutions. Tenants are faced with a very competitive job market, so their space and location is an important factor to consider. There continues to be a lot of scrutiny on the layout and design and allocated space per employee. Collaborative working environments are the trend. In our opinion, tenants should start their space review early and plan on paying higher rents.
LANDLORDSThe sales activity is high, capitalization rates falling, and record pricing is being achieved. Vacancy is low, new construction active, rates are rising. We do see increases in operating expenses, for the most part, due to higher wage costs, insurance, and taxes. This positive direction has made the landlords less willing to deal, reducing inducements, increasing rates, charging more for parking. At this point there is still some ability to get reasonable improvement allowances. In the existing inventory,large contiguous space is limited, hence the activity in the space under construction. In our opinion, this landlord market benefit will settle down as the “catch up” continues and the new inventory delivers.
2012 / 2013 METRO VACANCY 12.2% / 11.9%
LEASE RATES $23.64 / $24.44
MID YEAR NET ABSORPTION 2.9M SF / .58M SFCLASS A RENT $30.73 / $31.33CLASS B RENT $19.37 / $19.90
THINGS TO WATCH:• The rent difference in new construction and existing Class A• Record sales price PSF and effects on rental rates
• How tenants adjust to fewer options / higher costs• Landlords’ take it or leave it marketing attitude
THE HOUSTON MARKET
This report is a compilation of both our market insight and other professionals within our market. In addition to data obtained from individual owners, managers, leasing agents, public reports, reporting agencies and Costar; it is considered to be accurate at the time of publication. Furthermore, it is intended for informational purposes only and should not be relied on by any party without further independent verification. Reproduction of this report in whole or part is permitted only with written consent of iCORE Global, LLC. Data from this report may be cited with proper acknowledgment given.
MARKET # BUILDINGS TOTAL RBA DIRECT (SF) TOTAL (SF) VAC %YTD NER
ABSORPTIONYTD
DELIVERIES
UNDER CONTRUCTION
(SF)QUOTED RATES
CLASS A MARKET STATISTICS
CBD 32 30,856,442 2,426,073 3,344,832 10.8% (528,122) 0 0 $36.86
SUBURBAN 301 77,862,971 7,334,114 7,892,343 10.1% 1,04,928 644,602 6,591,661 $29.49
TOTALS 333 108,719,413 9,760,187 11,237,175 10.3% 576,806 644,602 6,591,661 $31.33
CLASS B MARKET STATISTICS
CBD 62 15,151,128 1,590,277 1,600,327 10,6% 193,469 0 0 $24.78
SUBURBAN 2,451 104,759,008 14,373,260 14,903,571 14.2% (127,996) 370,305 522,540 $19.48
TOTALS 2,513 119,910,136 15,963,537 16,503,898 13.8% 65,473 370,305 522,540 $19.90
CLASS C MARKET STATISTICS
CBD 76 2,978,616 858,417 858,47 28.8% (1,872) 0 0 $18.67
SUBURBAN 3,076 38,187,395 3,423,066 3,490,897 9.1% (59,236) 0 0 $15.58
TOTALS 3,152 41,166,011 4,281,483 4,349,314 10.6% (61,108) 0 0 $15.81
TOTAL OFFICE MARKET STATISTICS
CBD 170 48,986,186 4,874,767 5,803,576 11.8% (336,525) 0 0 $33.02
SUBURBAN 5,828 220,809,374 25,130,440 26,286,811 11.9% 917,696 1,014,907 7,114,201 $22.89
TOTALS 5,998 269,795,560 30,005,207 32,090,387 11.9% 581,171 1,014,907 7,114,201 $24.44
OFFICE MARKET STATISTICS FIGURES AT A GLANCE
EXISTING INVENTORY VACANCY
CLASS A CLASS B
SALES VOLUME PRICE/SF
NEW CONSTRUCTION
TOTAL MARKET
Q1 2010 Q3 2010 Q1 2011 Q3 2011 Q1 2012 Q2 2012 Q1 2013
$45.00
$40.00
$35.00
$30.00
$25.00
$20.00
$15.00
HISTORICAL RENTAL RATESPERCENT OF ALL VACANT SPACE BY CLASS
MARKET TRENDSSUBMARKETS
BASED ON OFFICE BUILDING SALES OF 15,000SF & LARGER
VACANCY BY CLASSPERCENT OF ALL VACANT SPACE BY CLASS
51%
14%
35%
CLASS A
CLASS B
CLASS C
TOTAL VACANT32,090,387 SF
CBD KATY FWY NORTH BELT NORTHWEST SOUTHWEST WESTCHASE WEST LOOP WOODLANDS
2012
2013
2014
Q1 2010 Q3 2010 Q1 2011 Q3 2011 Q1 2012 Q2 2012 Q1 2013
$1,400
$1,200
$1,000
$800
$600
$400
$200
$0
$350
$300
$250
$200
$150
$100
$50
$0