Embed Size (px)
DESCRIPTION
Authors : Jason Minser, Abt SRBI Tim Yeo, Abt SRBI Randal ZuWallack , Abt SRBI Mindy Rhindress, Ph.D , Abt SRBI Jonathan Ehrlich, Metropolitan Council Kimon Proussaloglou , Cambridge Systematics. How Busy is Too Busy? - PowerPoint PPT Presentation
Citation preview
How Busy is Too Busy?
Investigating the Participation of “Busy” Households in Metro Area Household Travel Surveys14th TRB Planning Applications Conference 5-9 May 2013Columbus, OH
Authors:Jason Minser, Abt SRBITim Yeo, Abt SRBIRandal ZuWallack, Abt SRBIMindy Rhindress, Ph.D, Abt SRBIJonathan Ehrlich, Metropolitan CouncilKimon Proussaloglou, Cambridge Systematics
Abt SRBI | pg 2
Household Travel Survey (HTS) Overview
• Sponsoring agencies include MPOs, DOTs, and other planning agencies
• Comprehensive inventory of households’ 24-hour travel
• Two phase study designRecruitment: Inventory of household, vehicle and
person characteristics Follow-up: Inventory of individual household member
travel for a 24 hour period
• Data used for travel demand forecasting
Abt SRBI | pg 3
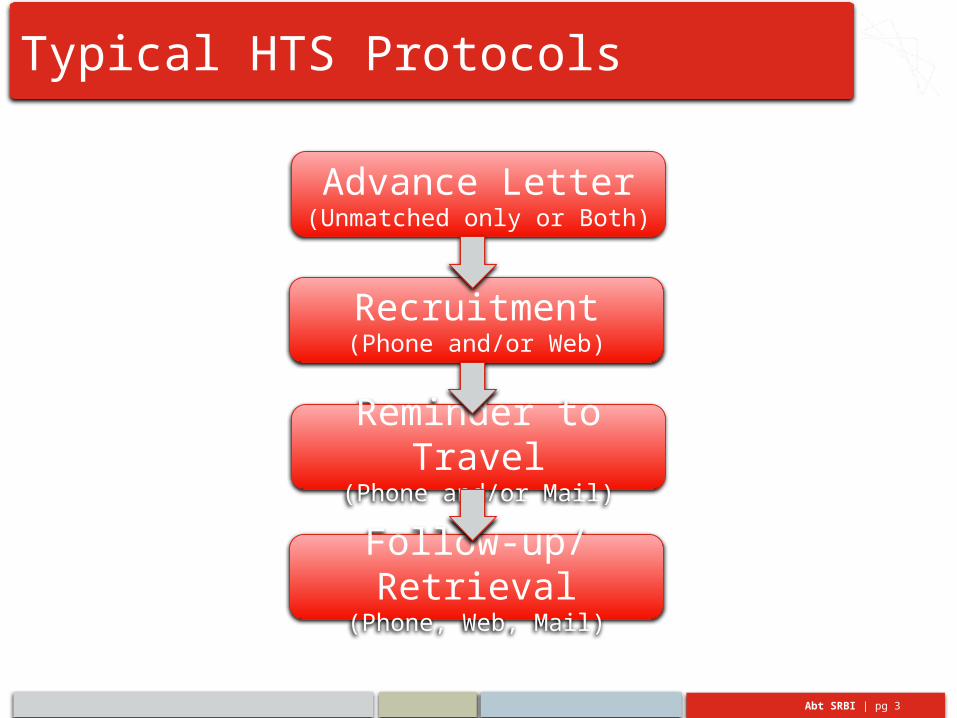
Typical HTS Protocols
Advance Letter(Unmatched only or Both)
Recruitment(Phone and/or Web)
Reminder to Travel(Phone and/or Mail)
Follow-up/Retrieval(Phone, Web, Mail)
Abt SRBI | pg 4
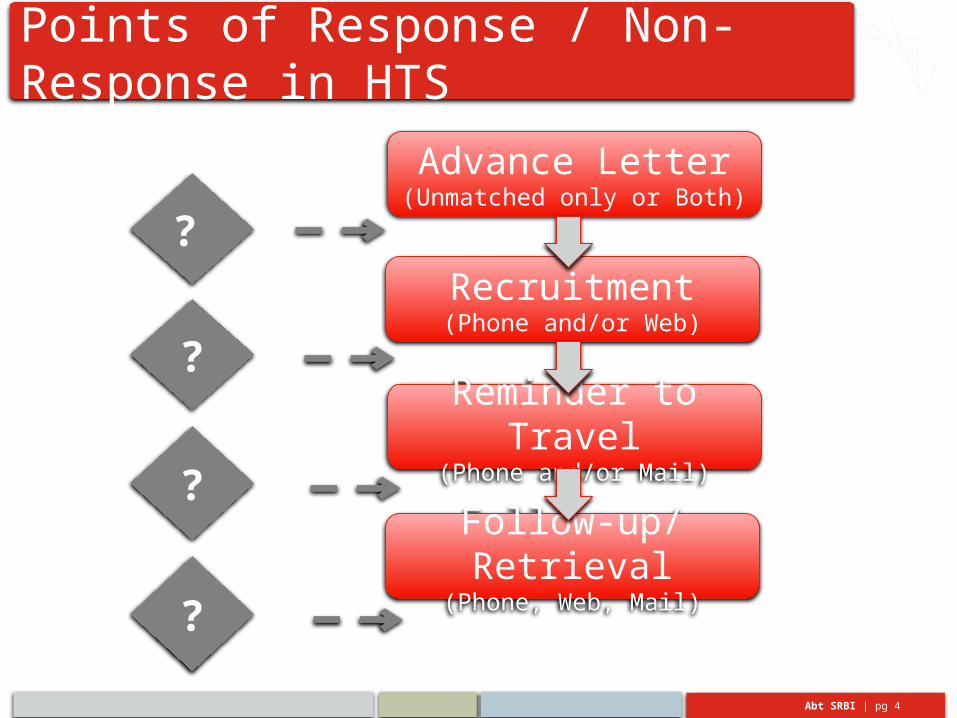
Points of Response / Non-Response in HTS
Advance Letter(Unmatched only or Both)
Recruitment(Phone and/or Web)
Reminder to Travel(Phone and/or Mail)
Follow-up/Retrieval(Phone, Web, Mail)
?
?
?
?
Abt SRBI | pg 5
Factors Affecting Non-Response Rates
• Trust of sponsoring government agency/agencies
• Ability to reach household representative(s)
• Perceived importance of survey
• Burden of reporting
• Household composition
• Travel day specifics (e.g., day of week, planned activities)
• Busyness?
Abt SRBI | pg 6
What is Busyness?
• Is actual or perceived influencers that obstruct a household from reporting on their travel day
• Influencers could include, but not be limited to:Hours workedTypes of activitiesHousehold compositionHome ownershipPresence of childrenEmployment statusOccupation status
• Filling out diaries is not an “essential task” for a household, if busyness is perceived, little to no recourse
Abt SRBI | pg 7
Importance of Understanding Busyness
• Helps transportation researchers: Determine the most effective corrective measures in order
to improve study participation Better predict trip characteristics of non-respondents Evaluate possible correlation between busyness and quality
of respondent-provided travel data
• Research Questions How do households’ travel days differ? What are they doing
to be so “busy”? Who are these households? What do they look like? What we know from who responded, can we predict what
kind of travel we missed?
Abt SRBI | pg 8
About the Data
• Address-based sampling – three tiered stratification by region, household size, and number of vehicles
• Multiple Methods Recruitment – phone and web Retrieval/Follow-up – phone, web, mail back
• 25,000+ households were recruited to participate in 24-hour travel diary (all persons 6 years of age or older)A total of 20 activities were available to choose from14,000+ households returned travel diaries
• Households were randomly assigned a weekday and distributed evenly throughout the week
Abt SRBI | pg 9
What we did . . .
• Analyze activities (from trip diary) to measure busyness – busyness classes
• Associate busyness with household characteristics
• Predict busyness based on household characteristics
• Apply model to non-responding and responding households
• Compare busyness distribution for non-responding and responding households
Abt SRBI | pg 10
Busyness Classes
• Grouped household days into activity classes
• Latent cluster analysis (LCA)
• Multinomial model predicting class membership based on activity participation
• Examined 3-6 classes
• Chose 5 classes based on best model fit
Abt SRBI | pg 11
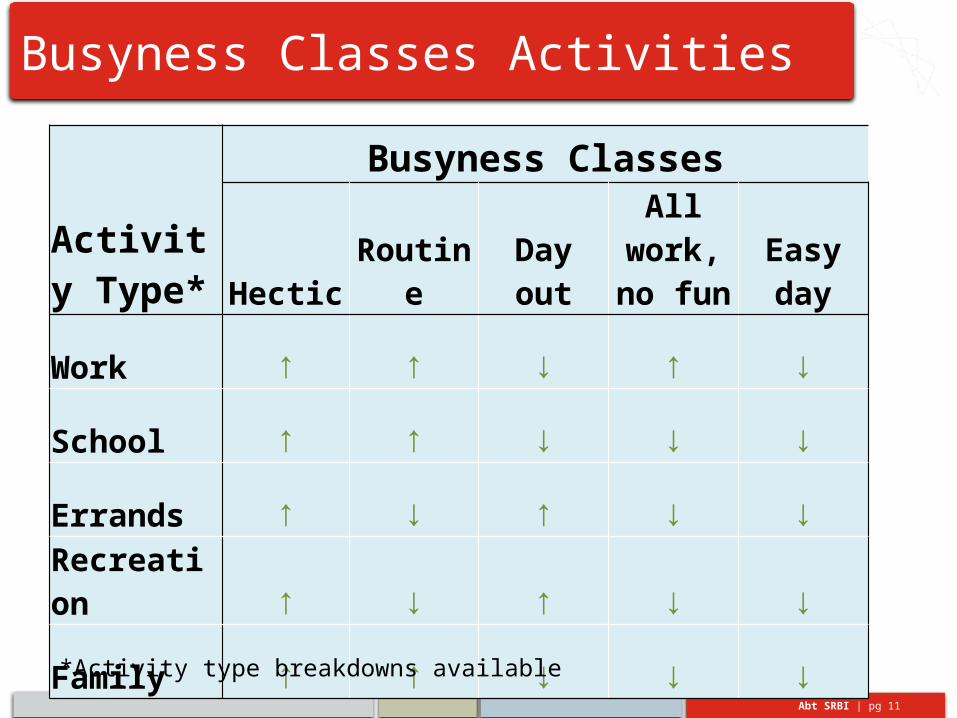
Activity Type*
Busyness Classes
Hectic Routine Day outAll work,
no fun Easy day
Work ↑ ↑ ↓ ↑ ↓
School ↑ ↑ ↓ ↓ ↓
Errands ↑ ↓ ↑ ↓ ↓
Recreation ↑ ↓ ↑ ↓ ↓
Family ↑ ↑ ↓ ↓ ↓
Busyness Classes Activities
*Activity type breakdowns available
Abt SRBI | pg 12
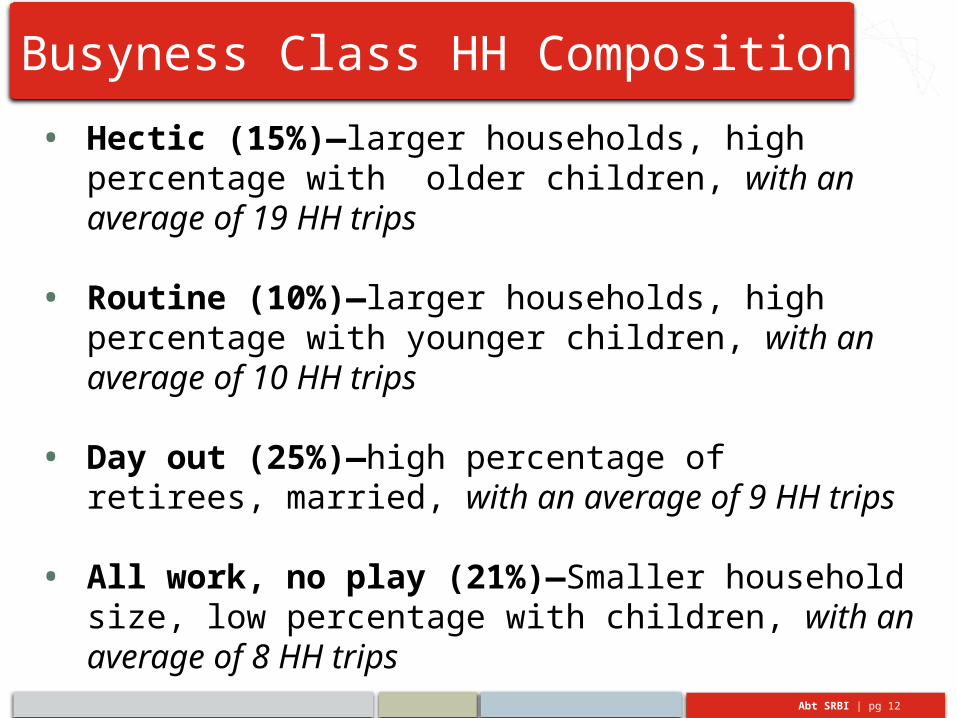
Busyness Class HH Composition
• Hectic (15%)—larger households, high percentage with older children, with an average of 19 HH trips
• Routine (10%)—larger households, high percentage with younger children, with an average of 10 HH trips
• Day out (25%)—high percentage of retirees, married, with an average of 9 HH trips
• All work, no play (21%)—Smaller household size, low percentage with children, with an average of 8 HH trips
• Easy day (29%)—high percentage of retirees, singletons, with an average of 3 HH trips
Abt SRBI | pg 13
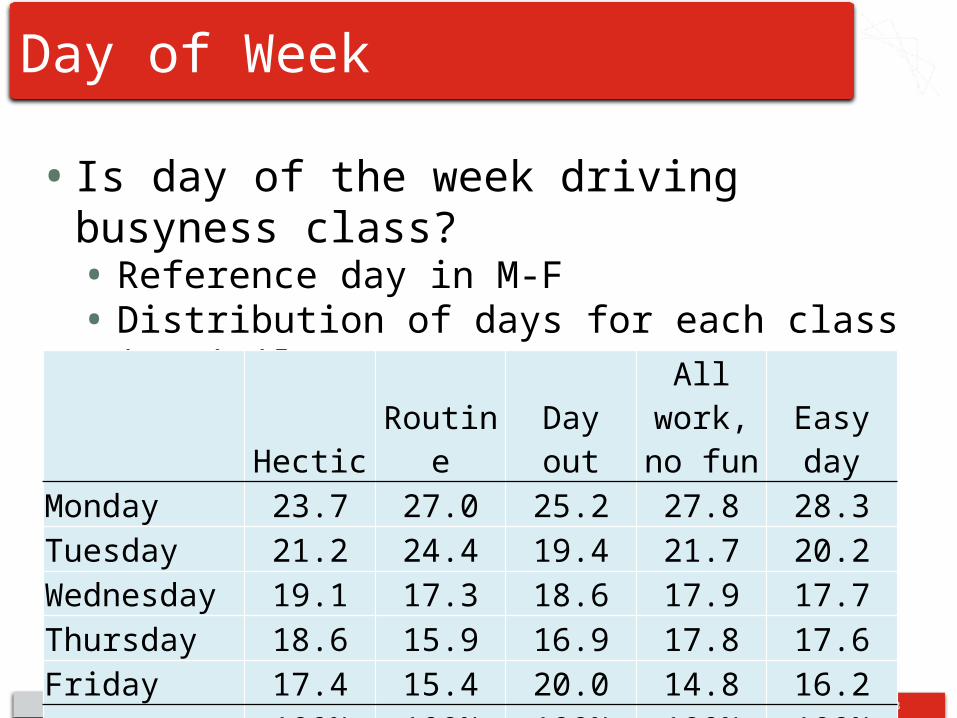
Day of Week
• Is day of the week driving busyness class?• Reference day in M-F• Distribution of days for each class is similar
• Mondays slightly over-represented
Hectic Routine Day outAll work,
no fun Easy dayMonday 23.7 27.0 25.2 27.8 28.3Tuesday 21.2 24.4 19.4 21.7 20.2Wednesday 19.1 17.3 18.6 17.9 17.7Thursday 18.6 15.9 16.9 17.8 17.6Friday 17.4 15.4 20.0 14.8 16.2
100% 100% 100% 100% 100%
Abt SRBI | pg 14
Predicting Busyness
• Anybody can have a day like any of these, but there are household characteristics that we can use to predict busyness
• Build a model to estimate the probability of having a hectic day, routine day,day out,an “all work, no fun day”, oran easy day
Abt SRBI | pg 15
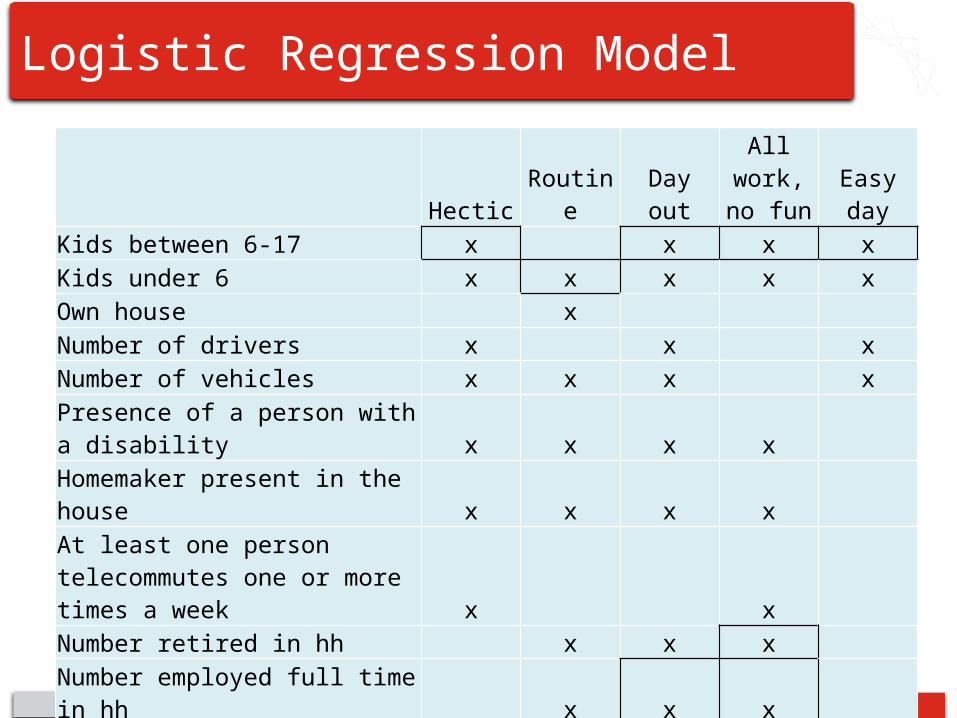
Logistic Regression Model
Hectic Routine Day outAll work, no fun Easy day
Kids between 6-17 x x x xKids under 6 x x x x xOwn house xNumber of drivers x x xNumber of vehicles x x x xPresence of a person with a disability x x x xHomemaker present in the house x x x xAt least one person telecommutes one or more times a week x xNumber retired in hh x x xNumber employed full time in hh x x xNumber unemployed in hh x x xMax education attainment in hh x x x x xMin education attainment in hh x x xYoungest adult in hh x x xHH Type x x x x
Abt SRBI | pg 16
Logistic Regression Model, cont’d
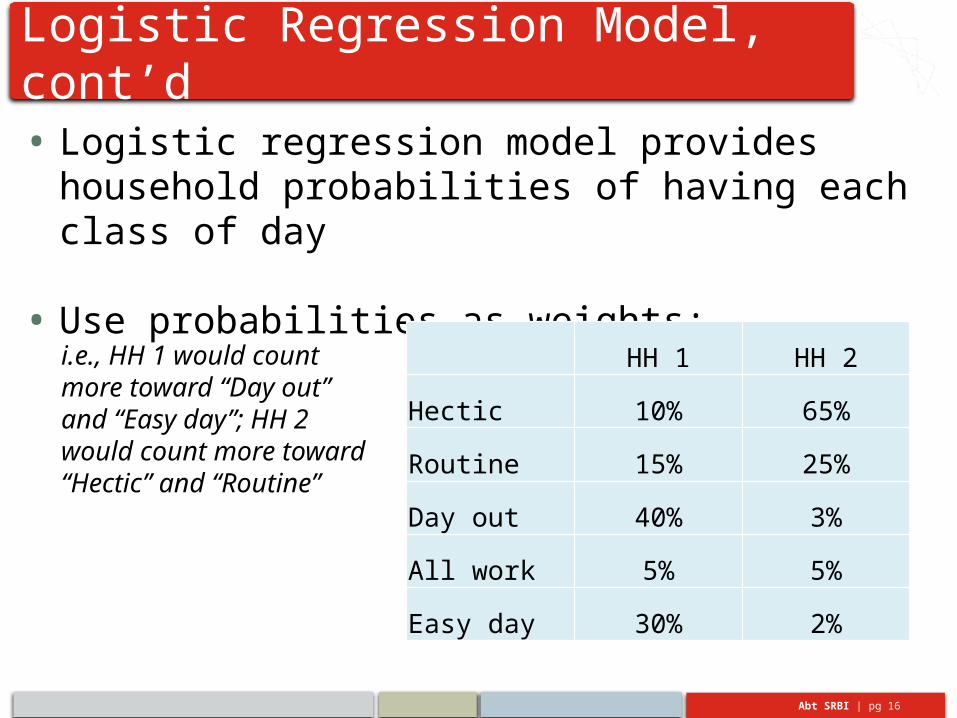
• Logistic regression model provides household probabilities of having each class of day
• Use probabilities as weights:
i.e., HH 1 would count more toward “Day out” and “Easy day”; HH 2 would count more toward “Hectic” and “Routine”
HH 1 HH 2
Hectic 10% 65%
Routine 15% 25%
Day out 40% 3%
All work 5% 5%
Easy day 30% 2%
Abt SRBI | pg 17
Logistic Regression Model, cont’d
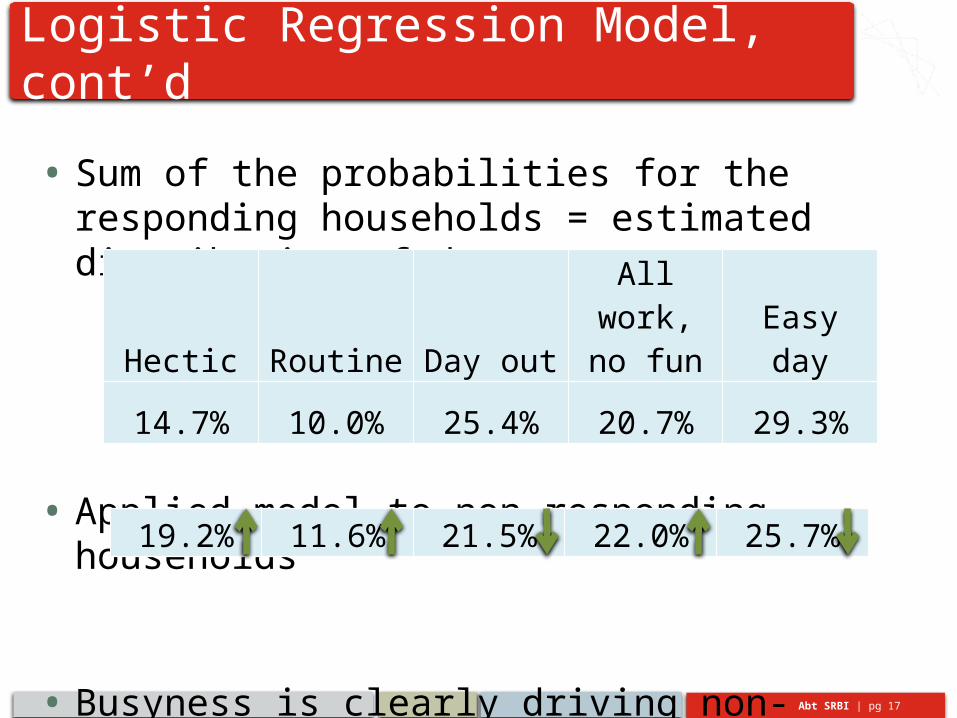
• Sum of the probabilities for the responding households = estimated distribution of days
• Applied model to non-responding households
• Busyness is clearly driving non-response for at least some households
Hectic Routine Day outAll work,
no fun Easy day
14.7% 10.0% 25.4% 20.7% 29.3%
19.2% 11.6% 21.5% 22.0% 25.7%
Abt SRBI | pg 18
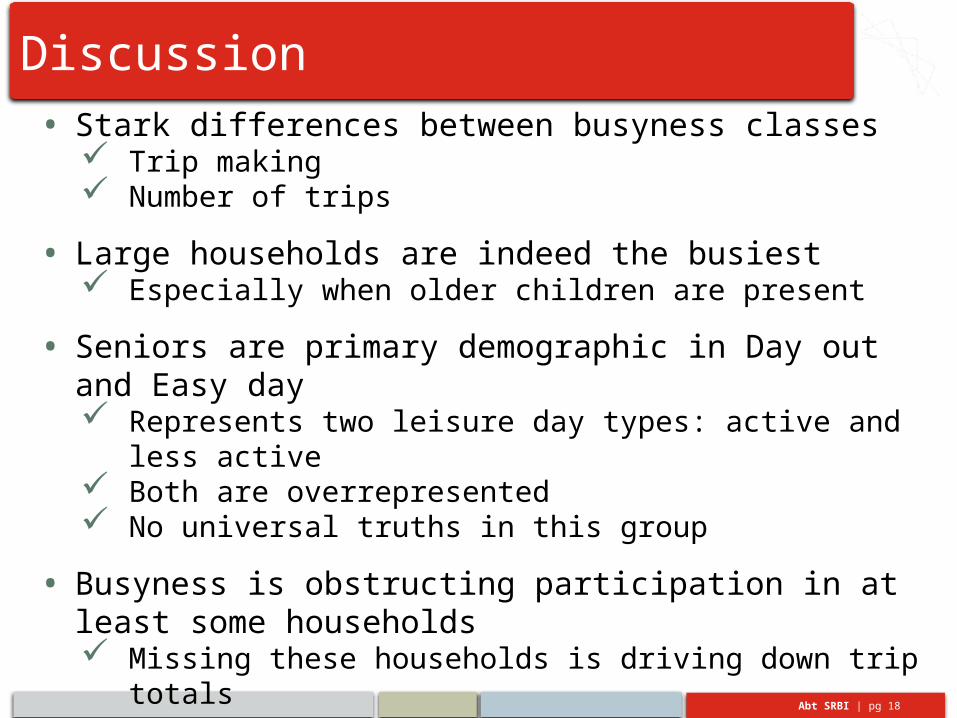
Discussion• Stark differences between busyness classes
Trip making Number of trips
• Large households are indeed the busiest Especially when older children are present
• Seniors are primary demographic in Day out and Easy day Represents two leisure day types: active and less active Both are overrepresented No universal truths in this group
• Busyness is obstructing participation in at least some households Missing these households is driving down trip totals
• Better consideration given to how much we ask households to tell us about their day
Abt SRBI | pg 19
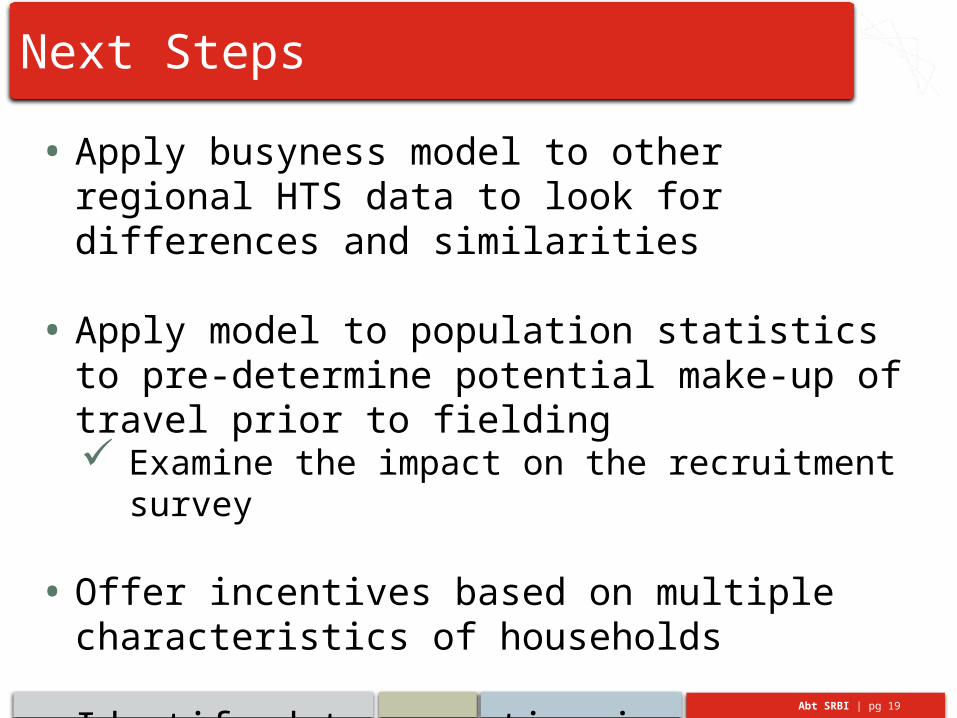
Next Steps
• Apply busyness model to other regional HTS data to look for differences and similarities
• Apply model to population statistics to pre-determine potential make-up of travel prior to fielding Examine the impact on the recruitment survey
• Offer incentives based on multiple characteristics of households
• Identify data reporting issues across the different classes
Abt SRBI | pg 20
Contact Information
Jason MinserAbt SRBI
Abt SRBI | pg 21
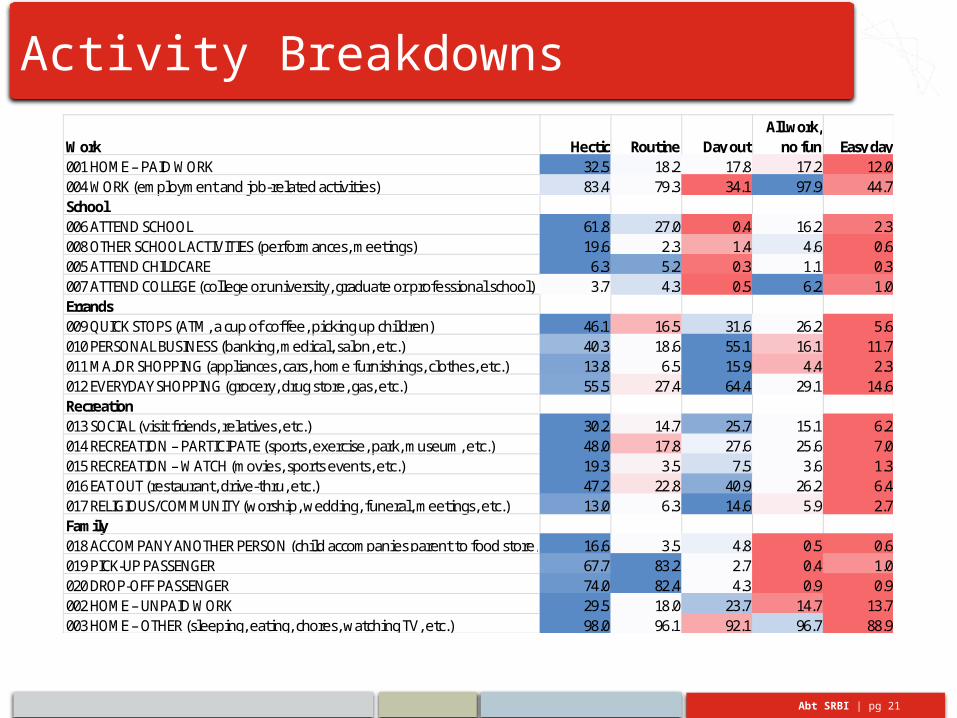
Activity Breakdowns
Work Hectic Routine Day outAll work,
no fun Easy day001 HOME – PAID WORK 32.5 18.2 17.8 17.2 12.0004 WORK (employment and job-related activities) 83.4 79.3 34.1 97.9 44.7School006 ATTEND SCHOOL 61.8 27.0 0.4 16.2 2.3008 OTHER SCHOOL ACTIVITIES (performances, meetings) 19.6 2.3 1.4 4.6 0.6005 ATTEND CHILDCARE 6.3 5.2 0.3 1.1 0.3007 ATTEND COLLEGE (college or university, graduate or professional school) 3.7 4.3 0.5 6.2 1.0Errands009 QUICK STOPS (ATM, a cup of coffee, picking up children) 46.1 16.5 31.6 26.2 5.6010 PERSONAL BUSINESS (banking, medical, salon, etc.) 40.3 18.6 55.1 16.1 11.7011 MAJOR SHOPPING (appliances, cars, home furnishings, clothes, etc.) 13.8 6.5 15.9 4.4 2.3012 EVERYDAY SHOPPING (grocery, drug store, gas, etc.) 55.5 27.4 64.4 29.1 14.6Recreation013 SOCIAL (visit friends, relatives, etc.) 30.2 14.7 25.7 15.1 6.2014 RECREATION – PARTICIPATE (sports, exercise, park, museum, etc.) 48.0 17.8 27.6 25.6 7.0015 RECREATION – WATCH (movies, sports events, etc.) 19.3 3.5 7.5 3.6 1.3016 EAT OUT (restaurant, drive-thru, etc.) 47.2 22.8 40.9 26.2 6.4017 RELIGIOUS/COMMUNITY (worship, wedding, funeral, meetings, etc.) 13.0 6.3 14.6 5.9 2.7Family018 ACCOMPANY ANOTHER PERSON (child accompanies parent to food store, etc.) 16.6 3.5 4.8 0.5 0.6019 PICK-UP PASSENGER 67.7 83.2 2.7 0.4 1.0020 DROP-OFF PASSENGER 74.0 82.4 4.3 0.9 0.9002 HOME – UNPAID WORK 29.5 18.0 23.7 14.7 13.7003 HOME – OTHER (sleeping, eating, chores, watching TV, etc.) 98.0 96.1 92.1 96.7 88.9