Embed Size (px)
Citation preview
��
Copyright 2016, Nagoya University Sato Laboratory!c! Nagoya University Confidential!
HPSR/iPOP 2016 June 15, 2016
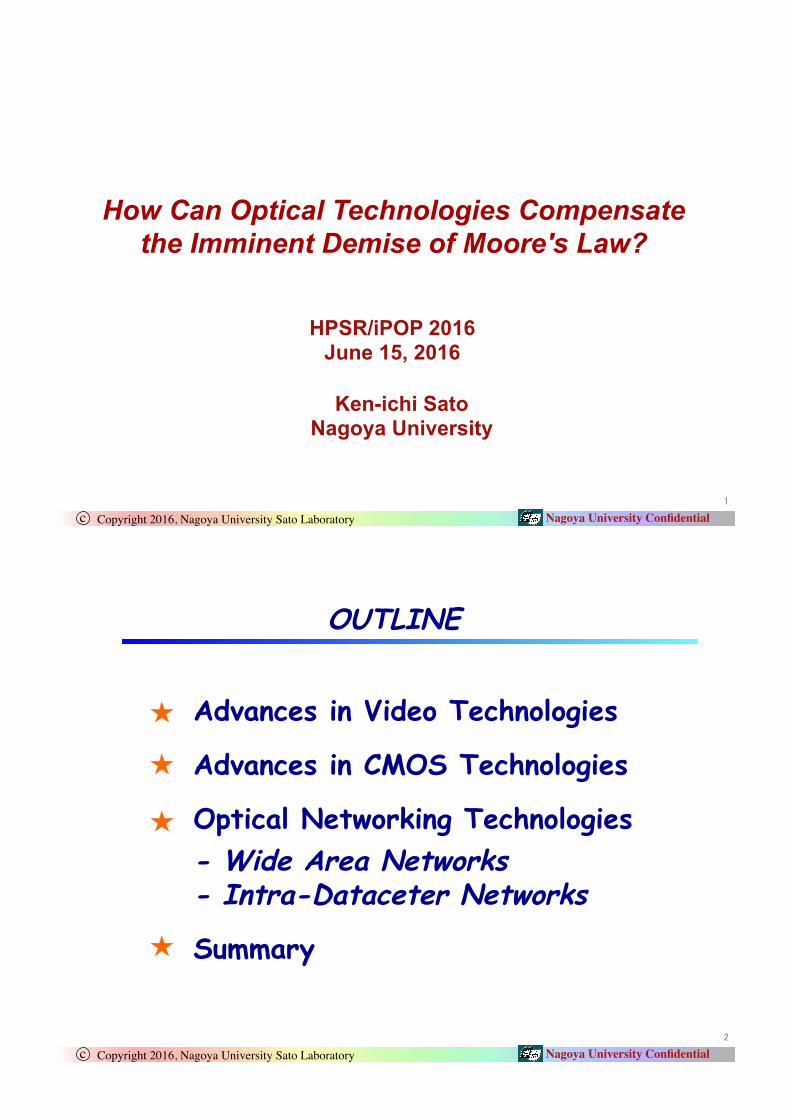
How Can Optical Technologies Compensate the Imminent Demise of Moore's Law?
Ken-ichi Sato Nagoya University
�
Copyright 2016, Nagoya University Sato Laboratory!c! Nagoya University Confidential!
OUTLINE�
Advances in Video Technologies
Advances in CMOS Technologies
Optical Networking Technologies
- Wide Area Networks - Intra-Dataceter Networks�
Summary�
��
Copyright 2016, Nagoya University Sato Laboratory!c! Nagoya University Confidential!The$Ministry$of$Internal$Affairs$and$Communica8ons,$White$Paper,$2016$
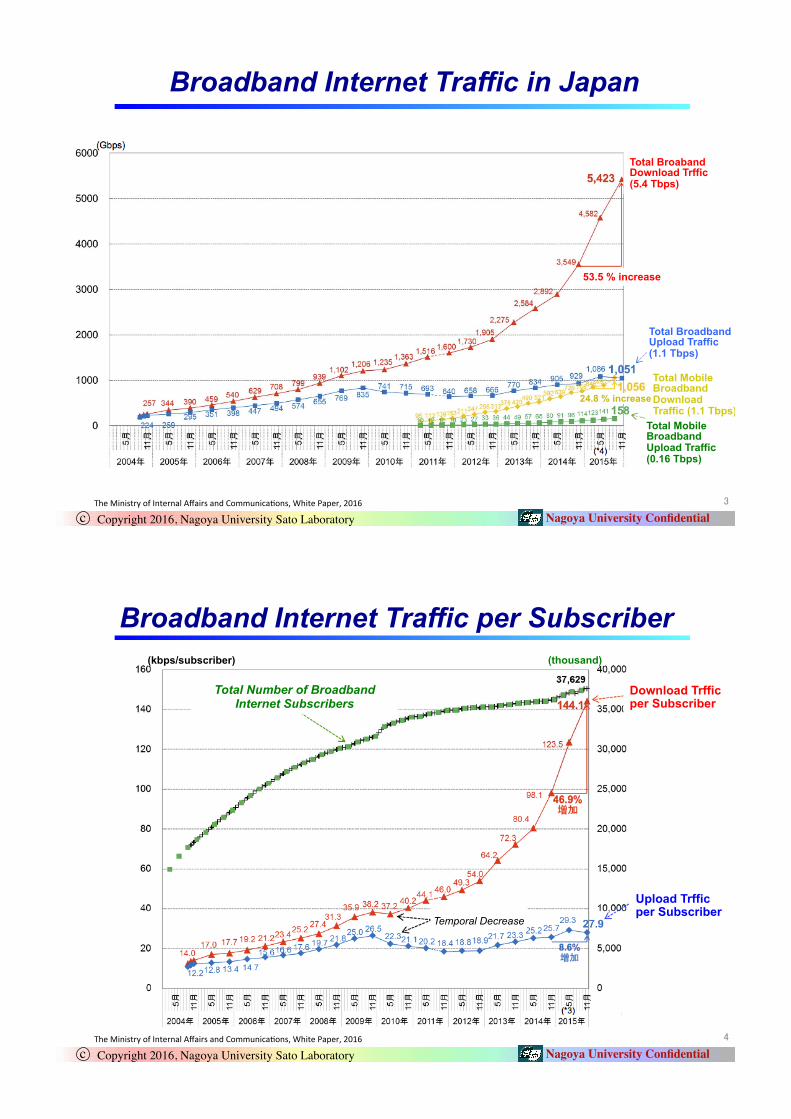
Broadband Internet Traffic in Japan
CY
Total Broaband Download Trffic (5.4 Tbps)
Total Broadband Upload Traffic (1.1 Tbps)
Total Mobile Broadband Download Traffic (1.1 Tbps)
Total Mobile Broadband Upload Traffic (0.16 Tbps)
53.5 % increase
Broadband Internet Traffic in Japan
24.8 % increase
��
Copyright 2016, Nagoya University Sato Laboratory!c! Nagoya University Confidential!The$Ministry$of$Internal$Affairs$and$Communica8ons,$White$Paper,$2016$
Broadband Internet Traffic per Subscriber
Total Number of Broadband Internet Subscribers
Temporal Decrease
Download Trffic per Subscriber
Upload Trffic per Subscriber
(thousand) (kbps/subscriber)
Download Trffic per Subscriber
��
Copyright 2016, Nagoya University Sato Laboratory!c! Nagoya University Confidential!
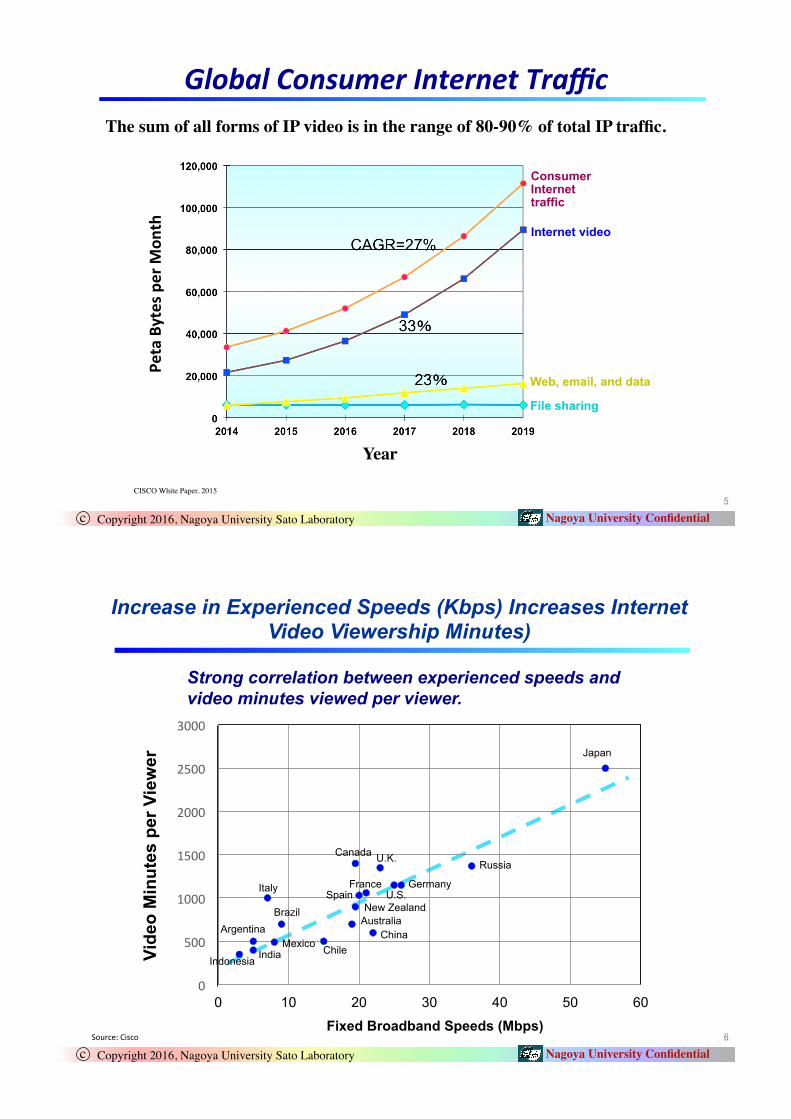
Global&Consumer&Internet&Traffic&
Internet video
File sharing
Web, email, and data
Consumer Internet traffic
Year�
Peta%Bytes%per%M
onth%
CISCO White Paper, 2015!
The sum of all forms of IP video is in the range of 80-90% of total IP traffic. �
��
Copyright 2016, Nagoya University Sato Laboratory!c! Nagoya University Confidential!
0$
500$
1000$
1500$
2000$
2500$
3000$
0 10 20 30 40 50 60
Italy�
China�
Spain�France�
U.K.�Canada�
U.S.�Germany�
Russia�
Japan�
Increase in Experienced Speeds (Kbps) Increases Internet Video Viewership Minutes)�
Indonesia�India�
Argentina�Mexico�
Brazil�
Chile�
Australia�New Zealand�
Source:$Cisco�
Vide
o M
inut
es p
er V
iew
er
Fixed Broadband Speeds (Mbps)
Strong correlation between experienced speeds and video minutes viewed per viewer. �
��
Copyright 2016, Nagoya University Sato Laboratory!c! Nagoya University Confidential!
��
����
�����
�����
�����
�����
�����
��� ��� ��� ��� ��� ��� ��� ��� ��� ��� ��� ��� ��� ��� ��� ��� ��� 2007 ! 2008! 2009! 2010! 2011!
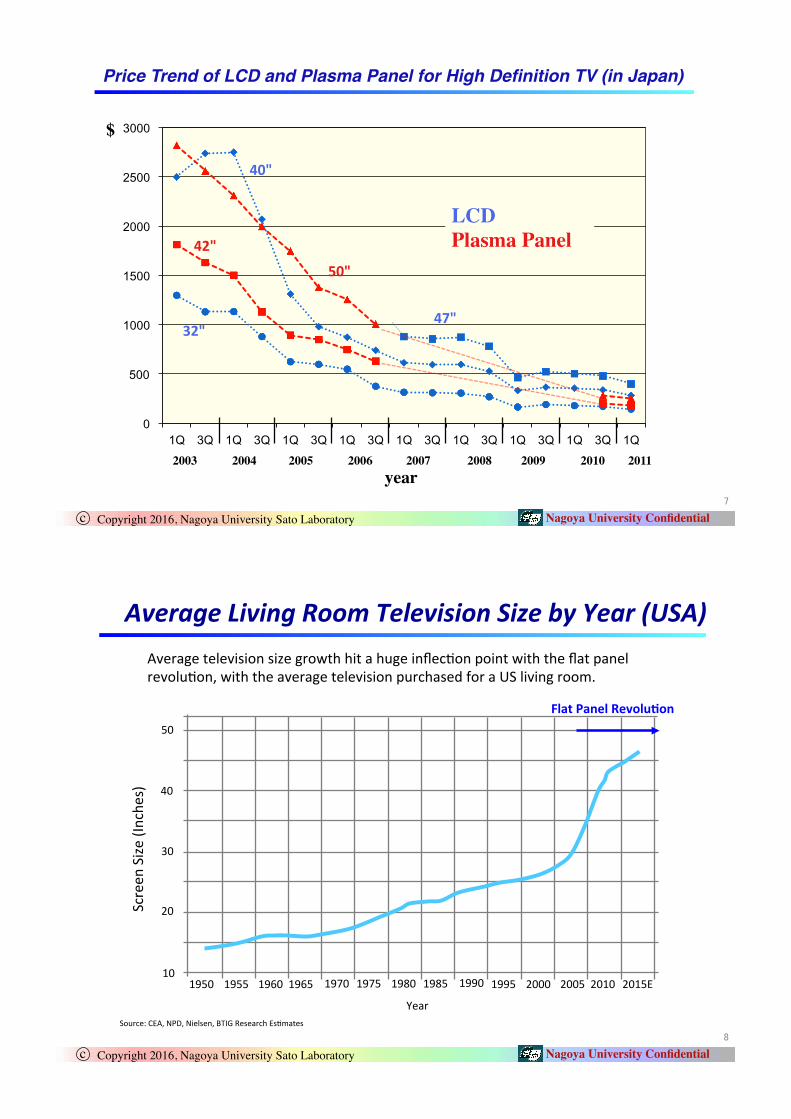
LCD!Plasma Panel!
%32"%
%40"%
%47"%
42"%
$ !
year !
50"%
2003! 2004! 2005! 2006!
Price Trend of LCD and Plasma Panel for High Definition TV (in Japan) !
��
Copyright 2016, Nagoya University Sato Laboratory!c! Nagoya University Confidential!
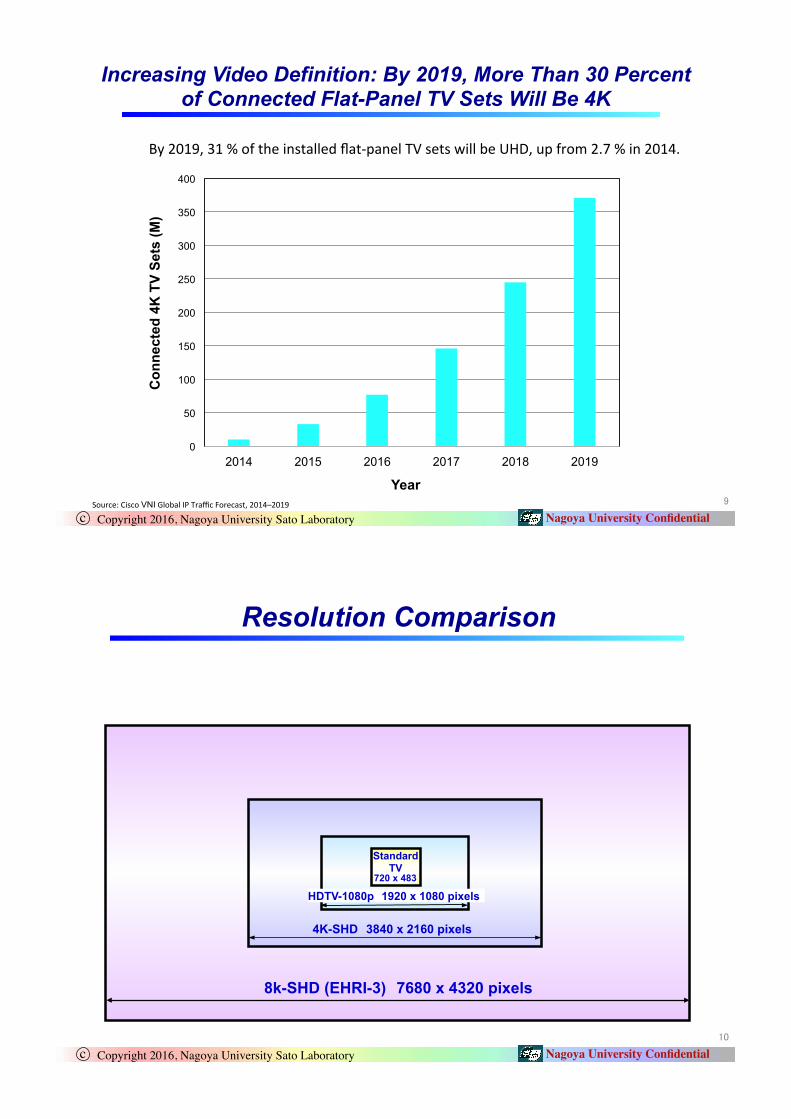
Average$television$size$growth$hit$a$huge$inflec8on$point$with$the$flat$panel$revolu8on,$with$the$average$television$purchased$for$a$US$living$room.�
1950� 1955� 1960�1965� 1970�1975� 1980�1985� 1990�1995� 2000� 2005�2010�2015E�
Year�
Screen
$Size$(Inche
s)�
10�
20�
30�
40�
50�
Average&Living&Room&Television&Size&by&Year&(USA)&
Source:$CEA,$NPD,$Nielsen,$BTIG$Research$Es8mates�
Flat%Panel%Revolu;on�
��
Copyright 2016, Nagoya University Sato Laboratory!c! Nagoya University Confidential!
0
50
100
150
200
250
300
350
400
2014 2015 2016 2017 2018 2019
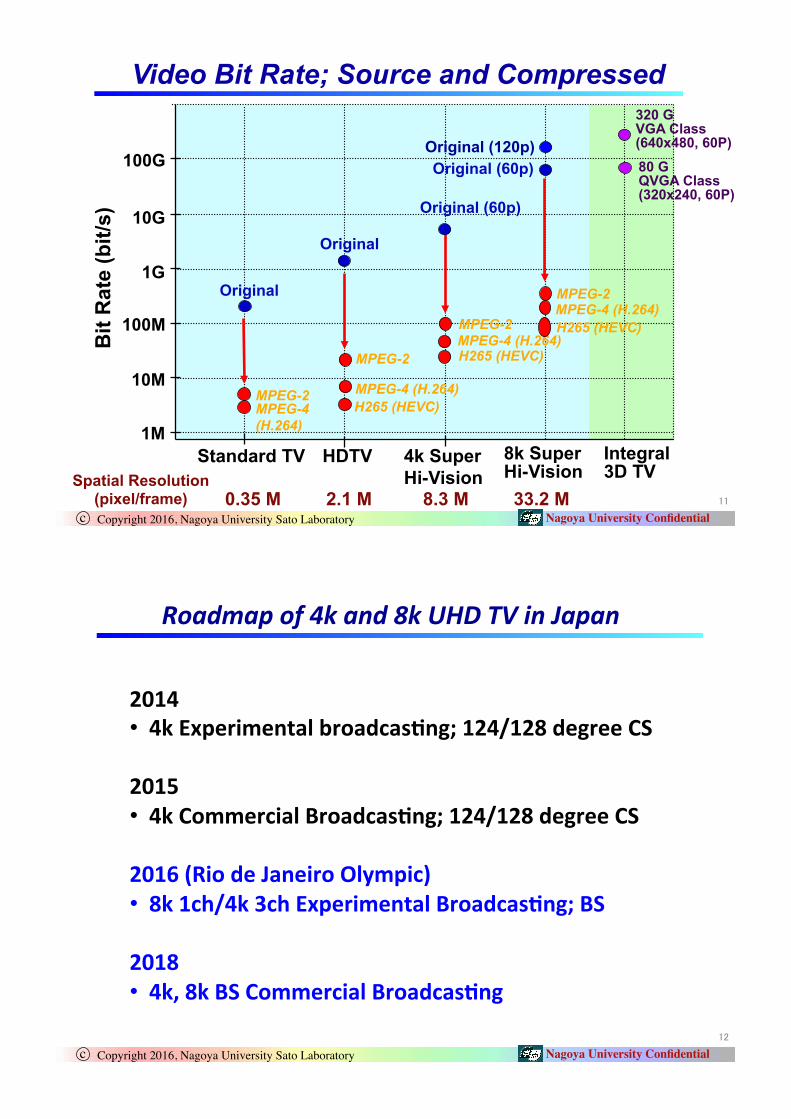
Increasing Video Definition: By 2019, More Than 30 Percent of Connected Flat-Panel TV Sets Will Be 4K�
Source:$Cisco$VNI$Global$IP$Traffic$Forecast,$2014–2019�
Con
nect
ed 4
K T
V Se
ts (M
)�By$2019,$31$%$of$the$installed$flat^panel$TV$sets$will$be$UHD,$up$from$2.7$%$in$2014.�
Year
���
Copyright 2016, Nagoya University Sato Laboratory!c! Nagoya University Confidential!
Resolution Comparison
HDTV-1080p91920 x 1080 pixels
4K-SHD93840 x 2160 pixels
720 x 483
Standard TV
8k-SHD (EHRI-3)97680 x 4320 pixels
���
Copyright 2016, Nagoya University Sato Laboratory!c! Nagoya University Confidential!
Video Bit Rate; Source and Compressed�
1M
10M
100M
1G
10G
Standard TV HDTV
Bit
Rat
e (b
it/s)
MPEG-2
Original
MPEG-4 (H.264)
Original
MPEG-2
MPEG-4 (H.264)
4k Super Hi-Vision 33.2 M 8.3 M 2.1 M
8k Super Hi-Vision
0.35 M Spatial Resolution
(pixel/frame)
100G
Original (60p)
Original (60p)
Integral 3D TV
320 G VGA Class (640x480, 60P) 80 G QVGA Class (320x240, 60P)
MPEG-4 (H.264)
Original (120p)
H265 (HEVC)
H265 (HEVC)
MPEG-2 MPEG-4 (H.264) H265 (HEVC)
MPEG-2
� �
Copyright 2016, Nagoya University Sato Laboratory!c! Nagoya University Confidential!
Roadmap&of&4k&and&8k&UHD&TV&in&Japan�
2014%• 4k%Experimental%broadcas;ng;%124/128%degree%CS%
2015%• 4k%Commercial%Broadcas;ng;%124/128%degree%CS%
2016%(Rio%de%Janeiro%Olympic)%• 8k%1ch/4k%3ch%Experimental%Broadcas;ng;%BS%
2018%• 4k,%8k%BS%Commercial%Broadcas;ng�
���
Copyright 2016, Nagoya University Sato Laboratory!c! Nagoya University Confidential!
OUTLINE�
Advances in Video Technologies
Advances in CMOS Technologies
Optical Networking Technologies
- Wide Area Networks - Intra-Dataceter Networks�
Summary�
���
Copyright 2016, Nagoya University Sato Laboratory!c! Nagoya University Confidential!
100 P�
10 P�
1 P�
100 T�
10 T�
1 T�
100 G�
10 G�
1 G�
100 M�
Per
form
ance
[Flo
ps]�
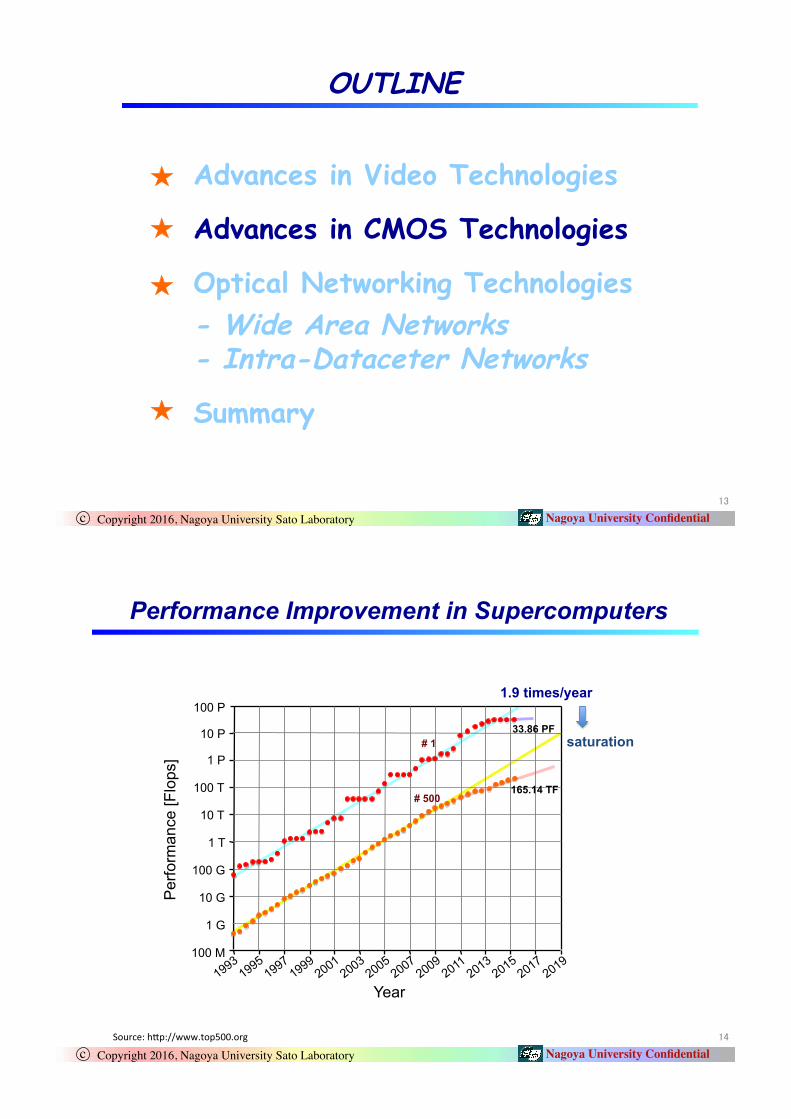
33.86 PF�
165.14 TF�
# 1�
# 500�
Year�
1.9 times/year�
saturation�
Performance Improvement in Supercomputers�
Source:$hap://www.top500.org�
���
Copyright 2016, Nagoya University Sato Laboratory!c! Nagoya University Confidential!
Rank
Num
ber o
f Cor
es�
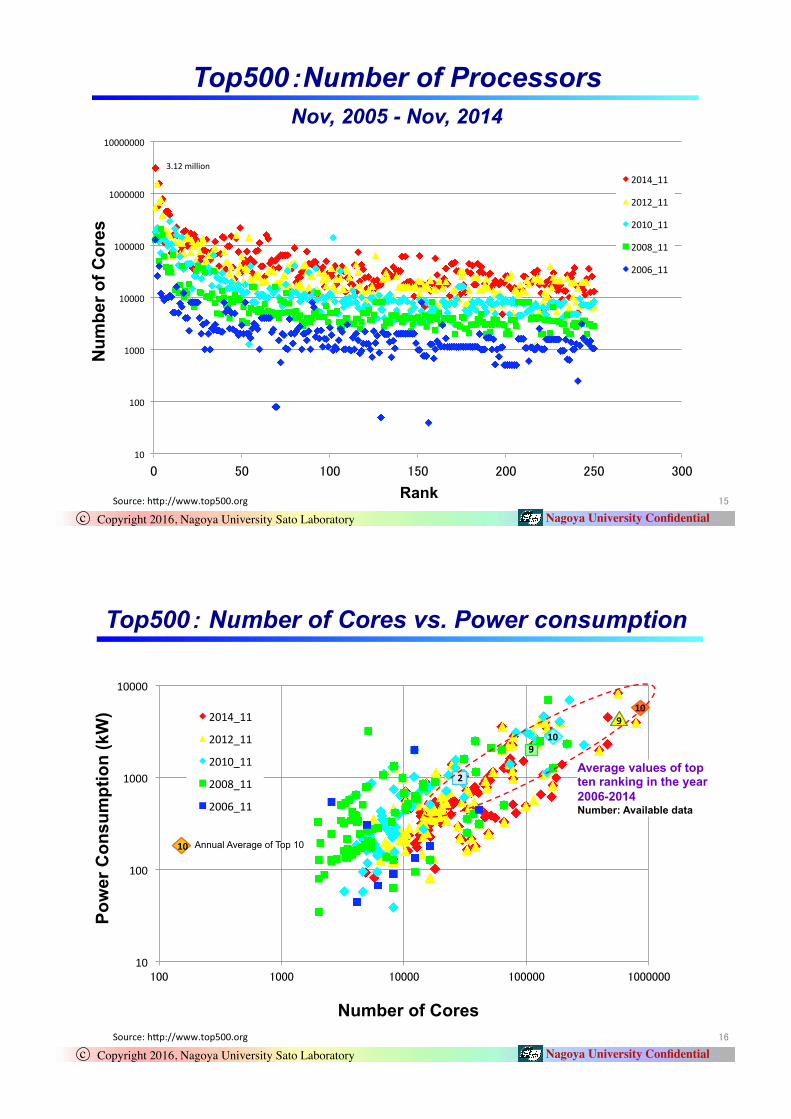
Top500�Number of Processors
Nov, 2005 - Nov, 2014
10$
100$
1000$
10000$
100000$
1000000$
10000000$
�� ��� ���� ���� ��� ��� ����
2014_11$
2012_11$
2010_11$
2008_11$
2006_11$
Source:$hap://www.top500.org�
3.12$million�
���
Copyright 2016, Nagoya University Sato Laboratory!c! Nagoya University Confidential!
Number of Cores�
Pow
er C
onsu
mpt
ion
(kW
)�
Top500� Number of Cores vs. Power consumption �
Source:$hap://www.top500.org�
10$
100$
1000$
10000$
���� ����� ������ ������� ��������
2014_11$
2012_11$
2010_11$
2008_11$
2006_11$
10�9�
10�9�
2�
10�
Average values of top ten ranking in the year 2006-2014 Number: Available data
Annual Average of Top 10�
���
Copyright 2016, Nagoya University Sato Laboratory!c! Nagoya University Confidential!
Aver
age
Pow
er C
onsu
mpt
ion
(kW
)�
Year�
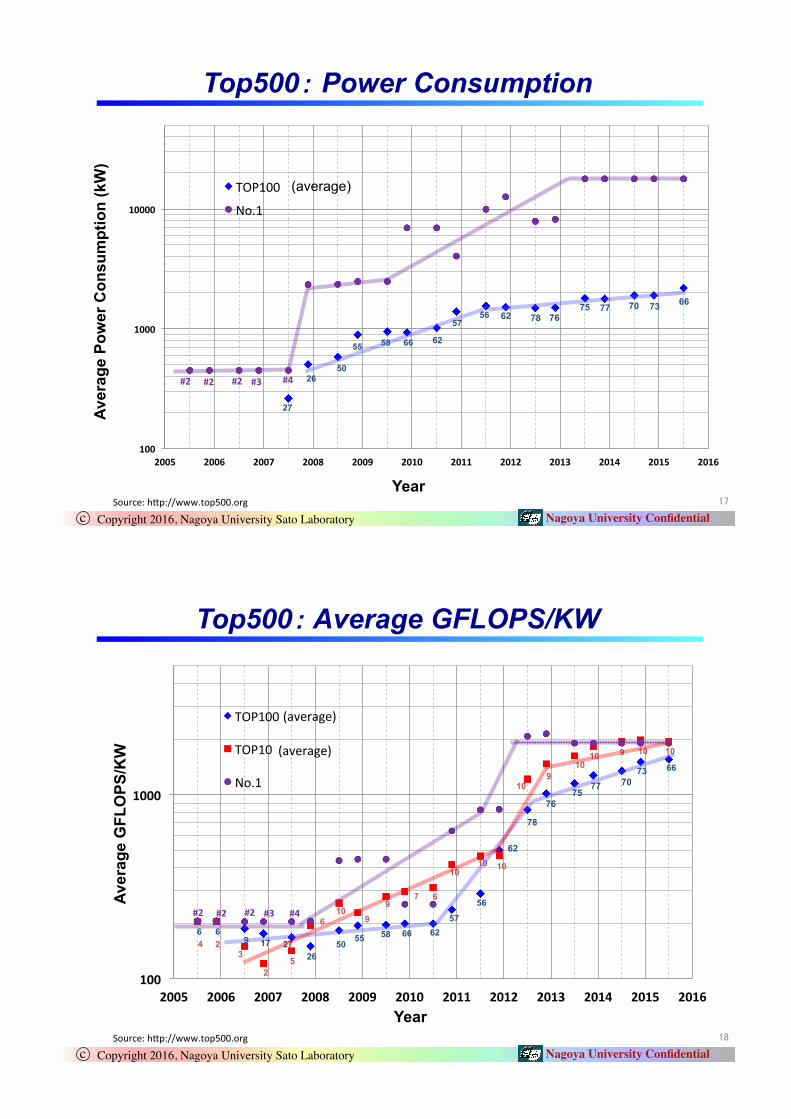
Top500��Power Consumption�
100%
1000%
10000%
2005% 2006% 2007% 2008% 2009% 2010% 2011% 2012% 2013% 2014% 2015% 2016%
TOP100$
No.1$
Source:$hap://www.top500.org�
#2% #3%#2% #2% #4%
27�
26�50�
55� 58� 66� 62�
57�56� 62 78 76
75 77 70 73 66
(average)�
���
Copyright 2016, Nagoya University Sato Laboratory!c! Nagoya University Confidential!
Aver
age
GFL
OPS
/KW
Year�
Top500� Average GFLOPS/KW�
Source:$hap://www.top500.org�
100%
1000%
2005% 2006% 2007% 2008% 2009% 2010% 2011% 2012% 2013% 2014% 2015% 2016%
TOP100$
TOP10$
No.1$
(average)�
(average)�
#2% #3%#2% #2% #4%
26�27� 50�
55� 58� 66� 62�57�
56�
62
78
76 75
77 70 73 66�
17�9�6� 6�4� 2�
3�
2�5�
6�10�
9�9�
7� 6�
10�10� 10�
10�9�
10�10� 9� 10� 10�
���
Copyright 2016, Nagoya University Sato Laboratory!c! Nagoya University Confidential!
OUTLINE�
Advances in Video Technologies
Advances in CMOS Technologies
Optical Networking Technologies
- Wide Area Networks - Intra-Dataceter Networks�
Summary�
��
Copyright 2016, Nagoya University Sato Laboratory!c! Nagoya University Confidential!
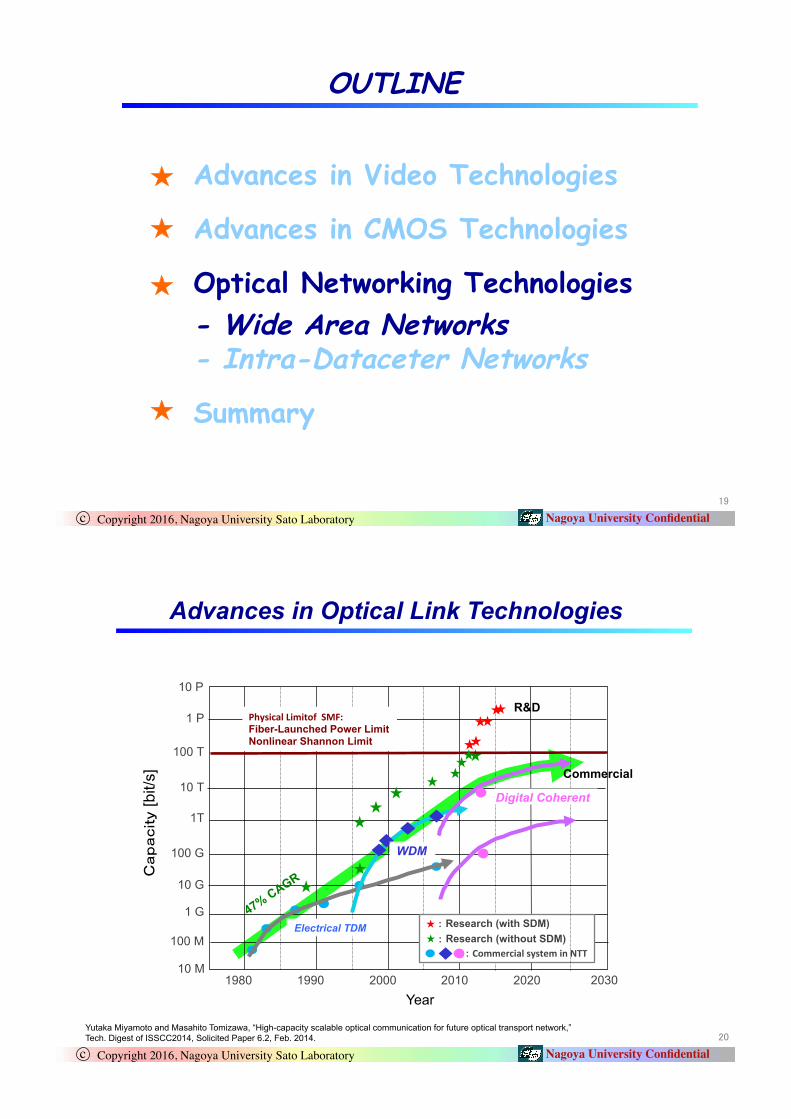
Advances in Optical Link Technologies
1980 1990 2000 2010 2020 Year�
2030
< Research (without SDM) 8�
<%Commercial%system%in%NTT%
8�< Research (with SDM)
8�8�
8�8�
8�
Electrical TDM �
8�
8�
WDM�
8�8�
8�
100 M
1 G
10 G
100 G
1T
10 T
100 T
1 P
=>A>?@BC�
[bit/
s]
10 P
10 M
Physical%Limitof%%SMF:%Fiber-Launched Power Limit Nonlinear Shannon Limit�
8�
8�8�8�
Digital Coherent�
8�8�R&D
Commercial
Yutaka Miyamoto and Masahito Tomizawa, “High-capacity scalable optical communication for future optical transport network,” Tech. Digest of ISSCC2014, Solicited Paper 6.2, Feb. 2014.�
��
Copyright 2016, Nagoya University Sato Laboratory!c! Nagoya University Confidential!
Transmission Capacity Increase Processing Performance Advance
Search Engine
Software e-commerce� SNS
Video
Hardware Based
New Value Creation Moving toward this direction�
ICT Technology Advances and New Value Creation�
Creating New Architecture and Software
$�$�
$�$�$�$�$�
$�
$�$�
$�$�
$�
$�
$�$�
$�
$�
$� $�
$�
$�
$�
$�
$�$�
�
Copyright 2016, Nagoya University Sato Laboratory!c! Nagoya University Confidential!
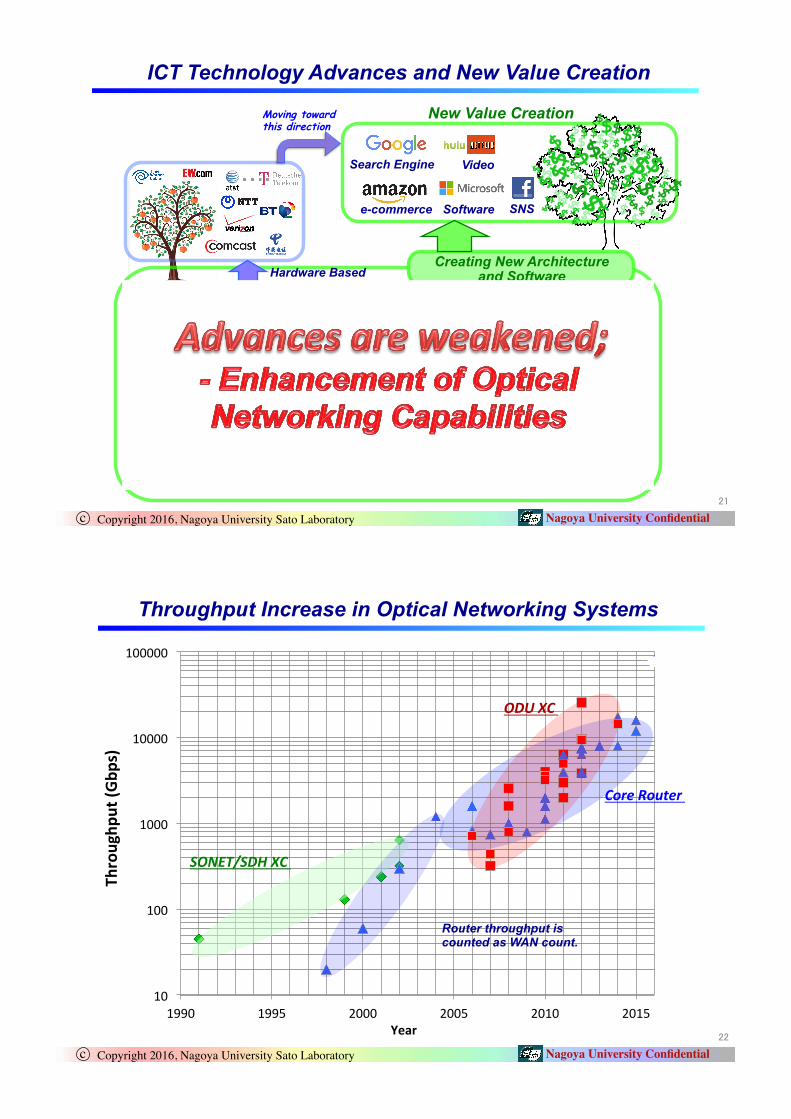
10$
100$
1000$
10000$
100000$
1990$ 1995$ 2000$ 2005$ 2010$ 2015$
SONET/SDH&XC�
Core&Router�
Router throughput is counted as WAN count. �
ODU&XC�
Throughput Increase in Optical Networking Systems�
Throughp
ut%(G
bps)�
Year�
��
Copyright 2016, Nagoya University Sato Laboratory!c! Nagoya University Confidential!
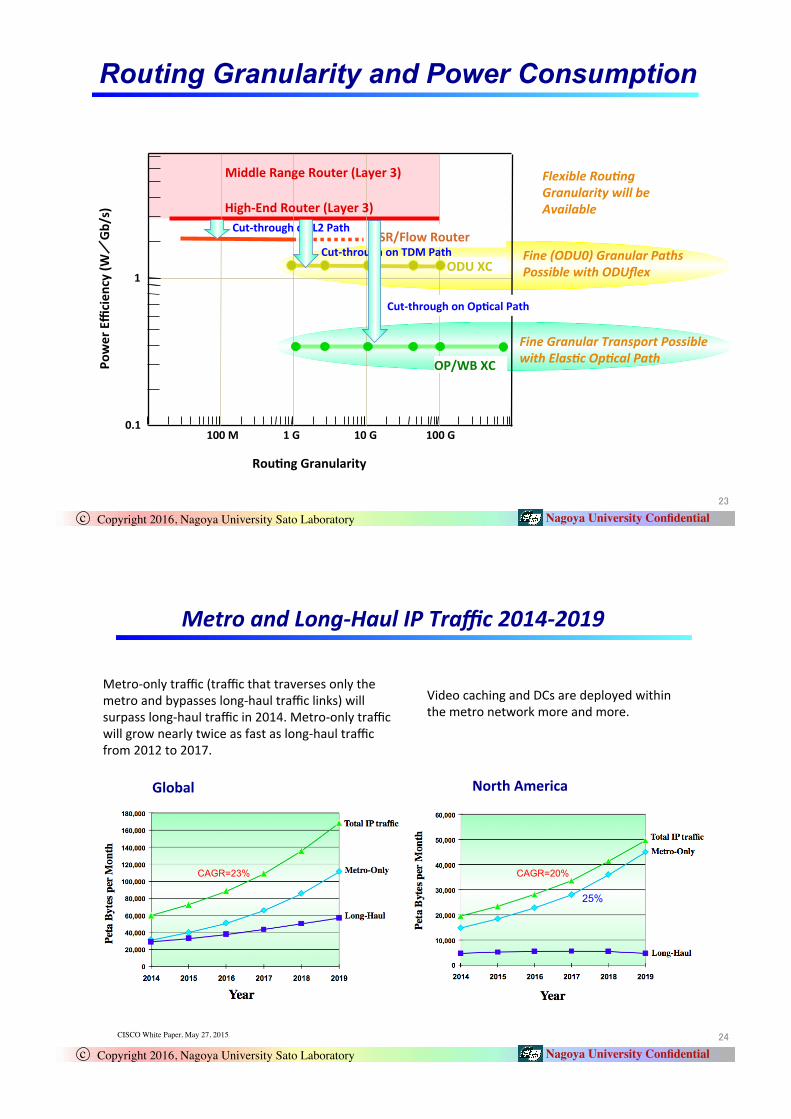
Fine&Granular&Transport&Possible&with&ElasSc&OpScal&Path�
Fine&(ODU0)&Granular&Paths&Possible&with&ODUflex�
Flexible&RouSng&Granularity&will&be&Available�
0.1�
1�
Rou;ng%Granularity�
Power%Efficien
cy%(W
;Gb
/s)� High_End%Router%(Layer%3)�
LSR/Flow%Router�
ODU%XC�
OP/WB%XC�
Cut_through%on%L2%Path�
Cut_through%on%TDM%Path�
Routing Granularity and Power Consumption
Middle%Range%Router%(Layer%3)�
Cut_through%on%Op;cal%Path�
100%M� 1%G� 10%G� 100%G�
��
Copyright 2016, Nagoya University Sato Laboratory!c! Nagoya University Confidential!
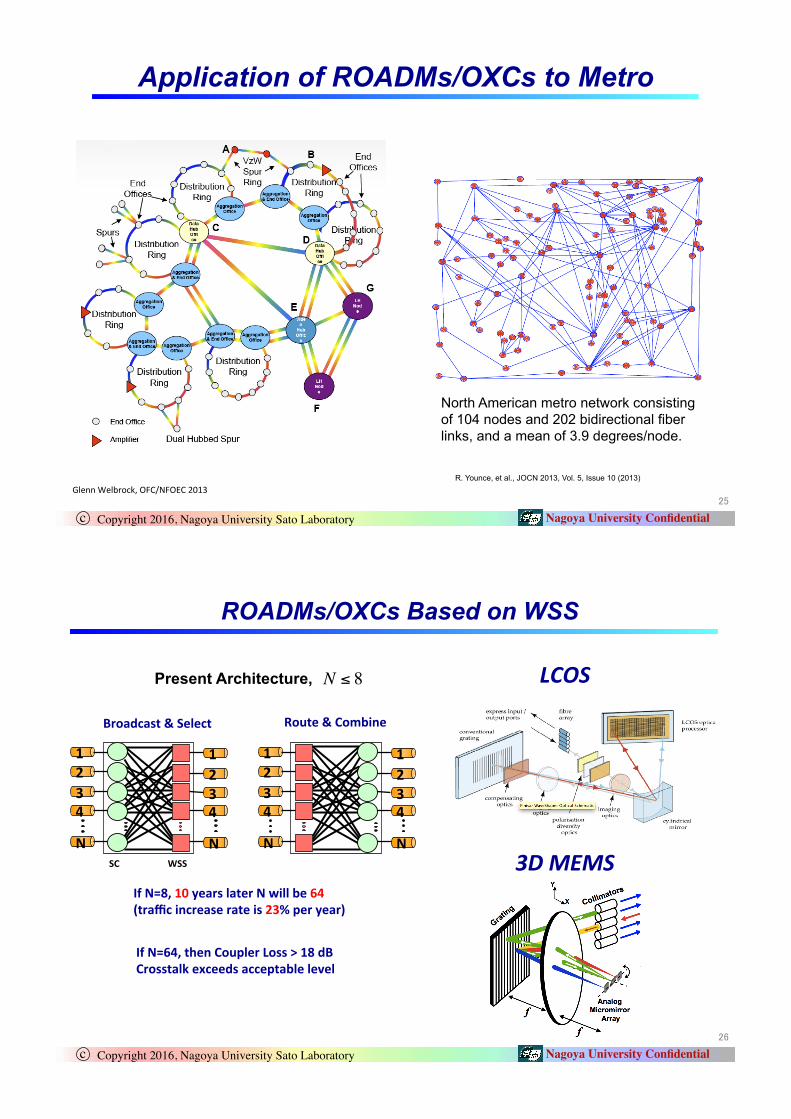
North%America�Global�
Metro^only$traffic$(traffic$that$traverses$only$the$metro$and$bypasses$long^haul$traffic$links)$will$surpass$long^haul$traffic$in$2014.$Metro^only$traffic$will$grow$nearly$twice$as$fast$as$long^haul$traffic$from$2012$to$2017.$$
Video$caching$and$DCs$are$deployed$within$the$metro$network$more$and$more.$$$
CAGR=23%� CAGR=20%�
25%�
CISCO White Paper, May 27, 2015!!
Metro&and&LongXHaul&IP&Traffic&2014X2019&
��
Copyright 2016, Nagoya University Sato Laboratory!c! Nagoya University Confidential!
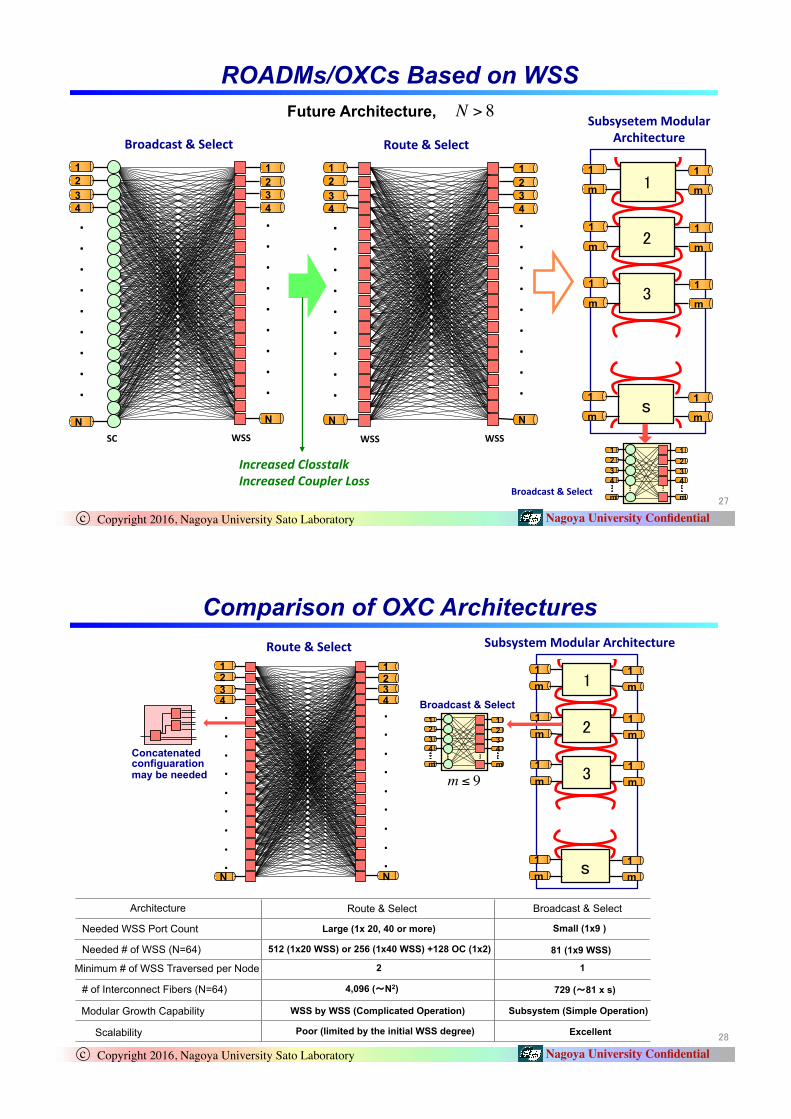
Glenn$Welbrock,$OFC/NFOEC$2013�
Application of ROADMs/OXCs to Metro�
North American metro network consisting of 104 nodes and 202 bidirectional fiber links, and a mean of 3.9 degrees/node.�
R. Younce, et al., JOCN 2013, Vol. 5, Issue 10 (2013) �
��
Copyright 2016, Nagoya University Sato Laboratory!c! Nagoya University Confidential!
ROADMs/OXCs Based on WSS
3%4%
N%
2%1%
3%4%
N%
2%1%
3%4%
N%
2%1%
3%4%
N%
2%1%
Present Architecture, �
Broadcast%&%Select� Route%&%Combine�
If%N=64,%then%Coupler%Loss%>%18%dB%Crosstalk%exceeds%acceptable%level�
If%N=8,%10%years%later%N%will%be%64%(traffic%increase%rate%is%23%%per%year)�
SC� WSS�
LCOS&
3D&MEMS&
€
N ≤ 8
��
Copyright 2016, Nagoya University Sato Laboratory!c! Nagoya University Confidential!
3 4
N
2 1
3 4
N
2 1
Future Architecture, �
Broadcast%&%Select� Route%&%Select�
SC� WSS�
N > 8
ROADMs/OXCs Based on WSS
.%
.%
.%
.%
.%
.%
.%
.%
.%�
.%
.%
.%
.%
.%
.%
.%
.%
.%�
3 4
N
2 1
3 4
N
2 1
WSS� WSS�
.%
.%
.%
.%
.%
.%
.%
.%
.%�
.%
.%
.%
.%
.%
.%
.%
.%
.%�
�
��
2�
m
1
m
1 ��
m
1
m
1
m
1
m
1
m
1
m
1
Subsysetem%Modular%Architecture�
3 4
m
2 1
3 4
m
2 1
Broadcast%&%Select�
Increased&Closstalk&Increased&Coupler&Loss�
��
Copyright 2016, Nagoya University Sato Laboratory!c! Nagoya University Confidential!
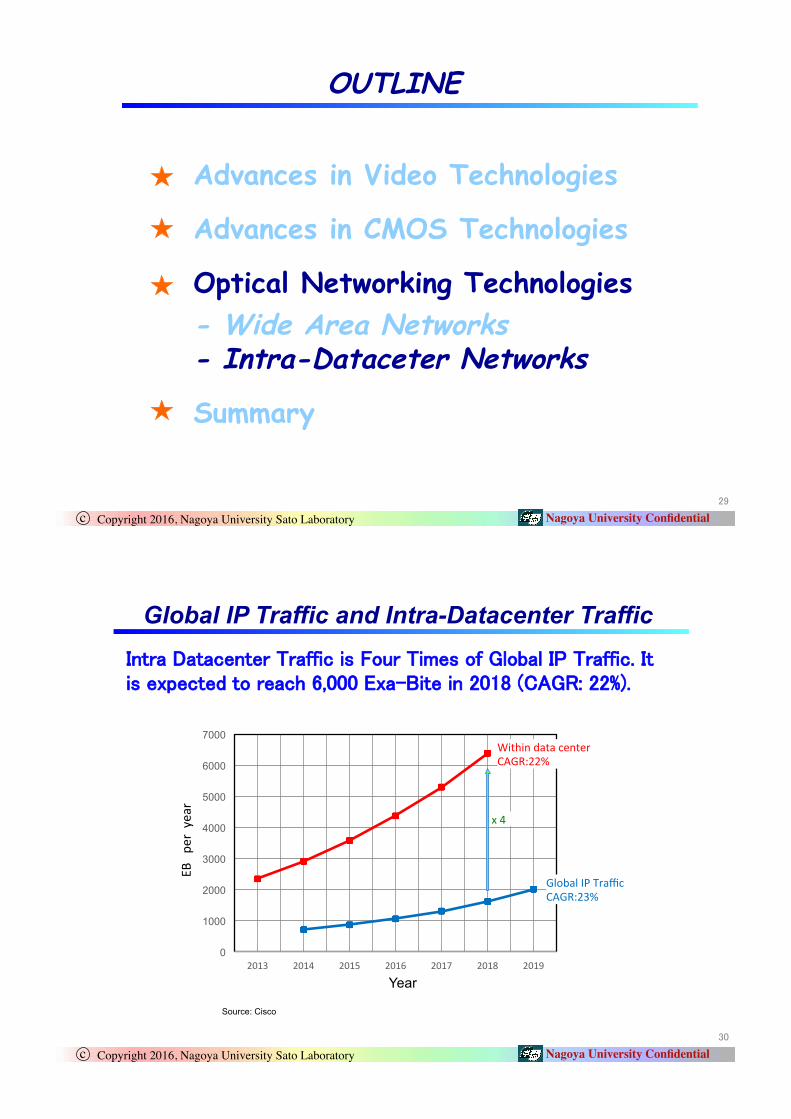
Comparison of OXC Architectures
3 4
N
2 1
3 4
N
2 1
.%
.%
.%
.%
.%
.%
.%
.%
.%�
.%
.%
.%
.%
.%
.%
.%
.%
.%�
�
��
2�
m 1
m 1
��
m 1
m 1
m 1
m 1
m 1
m 1
3 4
m
2 1
3 4
m
2 1
Broadcast & Select
m ≤ 9
Route%&%Select� Subsystem%Modular%Architecture�
Concatenated configuaration may be needed
Architecture� Route & Select� Broadcast & Select�
Needed # of WSS (N=64)� 512 (1x20 WSS) or 256 (1x40 WSS) +128 OC (1x2)� 81 (1x9 WSS)�
Minimum # of WSS Traversed per Node� 2� 1�
# of Interconnect Fibers (N=64)� 4,096 (�N2)� 729 (�81 x s)�
Modular Growth Capability� WSS by WSS (Complicated Operation)� Subsystem (Simple Operation)�
Scalability� Poor (limited by the initial WSS degree)�
Large (1x 20, 40 or more)�Needed WSS Port Count� Small (1x9 )�
Excellent�
��
Copyright 2016, Nagoya University Sato Laboratory!c! Nagoya University Confidential!
OUTLINE�
Advances in Video Technologies
Advances in CMOS Technologies
Optical Networking Technologies
- Wide Area Networks - Intra-Dataceter Networks�
Summary�
���
Copyright 2016, Nagoya University Sato Laboratory!c! Nagoya University Confidential!
0
1000
2000
3000
4000
5000
6000
7000
2013$ 2014$ 2015$ 2016$ 2017$ 2018$ 2019$
EB9pe
r$$year�
Within$data$center$CAGR:22%$�
Global$IP$Traffic$CAGR:23%$�
Global IP Traffic and Intra-Datacenter Traffic��.31$��$3$&(.3(1�#1$))+&�+2��/41�#+-(2�/)��,/%$,�� �#1$))+&��3�+2�(60(&3('�3/�1($&*��������6$��+3(�+.� ��������!�� ���
Source: Cisco�
Year�
x$4�
���
Copyright 2016, Nagoya University Sato Laboratory!c! Nagoya University Confidential!
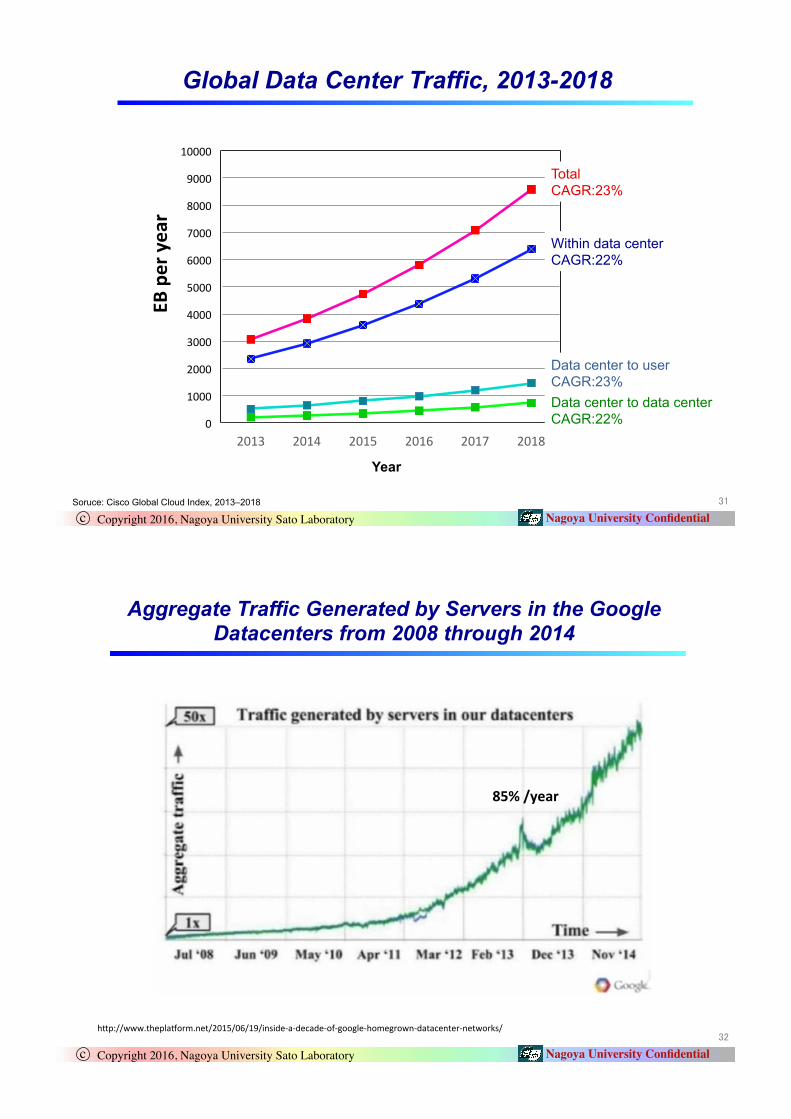
Global Data Center Traffic, 2013-2018�
Soruce: Cisco Global Cloud Index, 2013–2018�
0$
1000$
2000$
3000$
4000$
5000$
6000$
7000$
8000$
9000$
10000$
2013$ 2014$ 2015$ 2016$ 2017$ 2018$
EB%per%year�
Year
Within data center CAGR:22% �
Total CAGR:23% �
Data center to user CAGR:23% �Data center to data center CAGR:22% �
� �
Copyright 2016, Nagoya University Sato Laboratory!c! Nagoya University Confidential!
Aggregate Traffic Generated by Servers in the Google Datacenters from 2008 through 2014�
hap://www.theplagorm.net/2015/06/19/inside^a^decade^of^google^homegrown^datacenter^networks/�
85%%/year�
���
Copyright 2016, Nagoya University Sato Laboratory!c! Nagoya University Confidential!
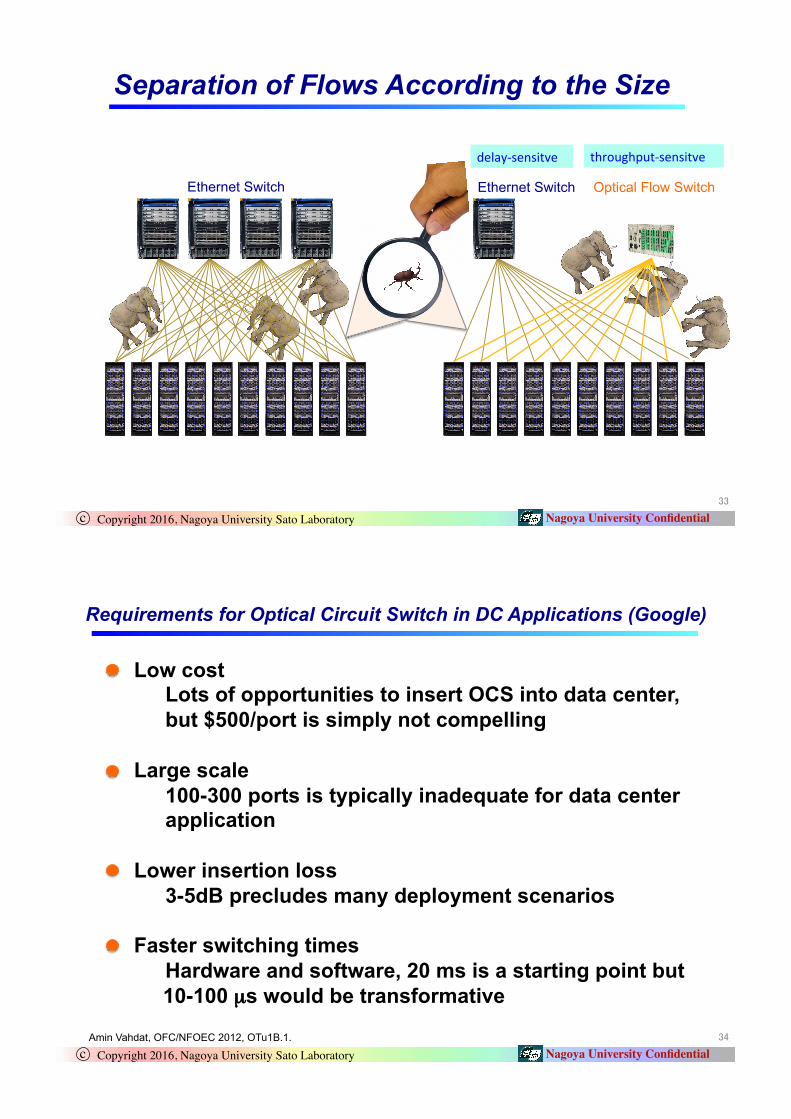
Optical Flow Switch Ethernet Switch Ethernet Switch
Separation of Flows According to the Size�
delay^sensitve� throughput^sensitve�
���
Copyright 2016, Nagoya University Sato Laboratory!c! Nagoya University Confidential!
Requirements for Optical Circuit Switch in DC Applications (Google)�
Low cost Lots of opportunities to insert OCS into data center, but $500/port is simply not compelling
Large scale
100-300 ports is typically inadequate for data center application
Lower insertion loss
3-5dB precludes many deployment scenarios Faster switching times
Hardware and software, 20 ms is a starting point but 10-100 µs would be transformative�
Amin Vahdat, OFC/NFOEC 2012, OTu1B.1.�
���
Copyright 2016, Nagoya University Sato Laboratory!c! Nagoya University Confidential!
1!
10!
100!
1,000!
10,000!
100,000!
1,000,000!
10,000,000!
10! 100! 1,000!
Three-Stage Clos�Crossbar�
"5+3&*� /13��/4.3�������6����
�4-%(1�/)��,(-(.3�"5+3&*(2��-(31+&���6 �25+3&*:�
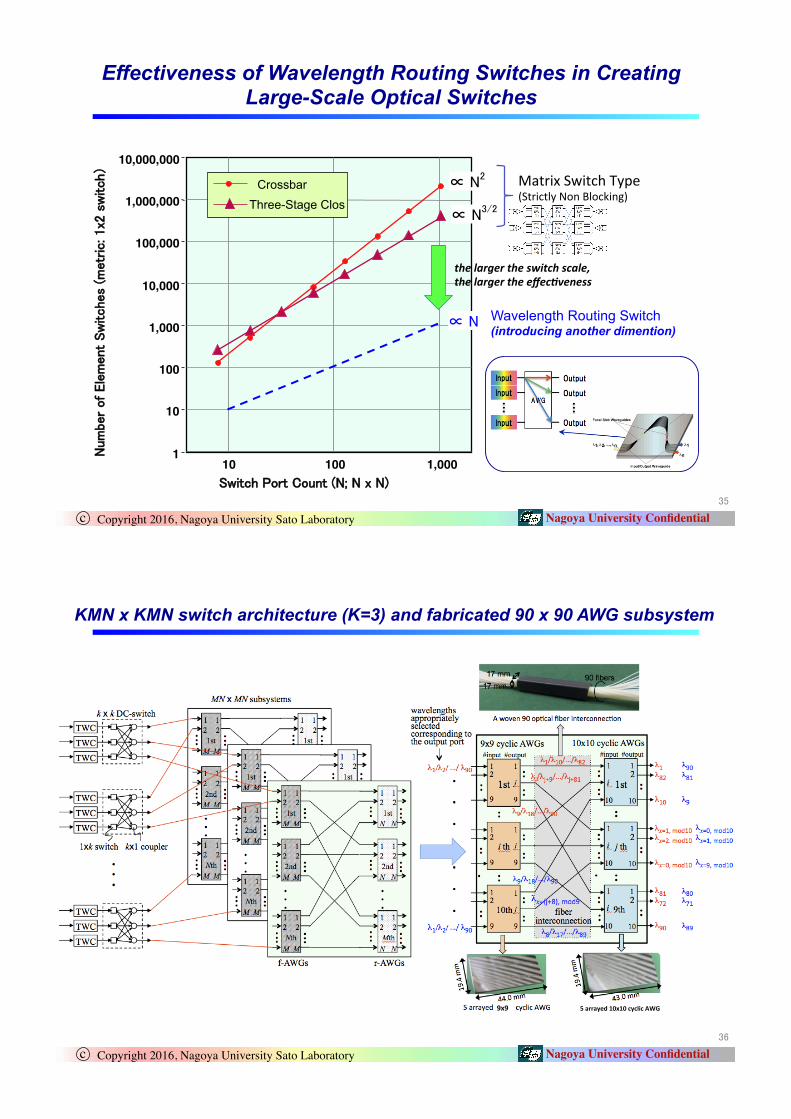
Effectiveness of Wavelength Routing Switches in Creating Large-Scale Optical Switches�
7�� !
7��� !
7��! Wavelength Routing Switch (introducing another dimention)
Matrix$Switch$Type$(Strictly$Non$Blocking)�
the&larger&the&switch&scale,&the&larger&the&effecSveness�
���
Copyright 2016, Nagoya University Sato Laboratory!c! Nagoya University Confidential!
KMN x KMN switch architecture (K=3) and fabricated 90 x 90 AWG subsystem�
%9x9%%%%%%� %5%arrayed%10x10%cyclic%AWG�
���
Copyright 2016, Nagoya University Sato Laboratory!c! Nagoya University Confidential!���
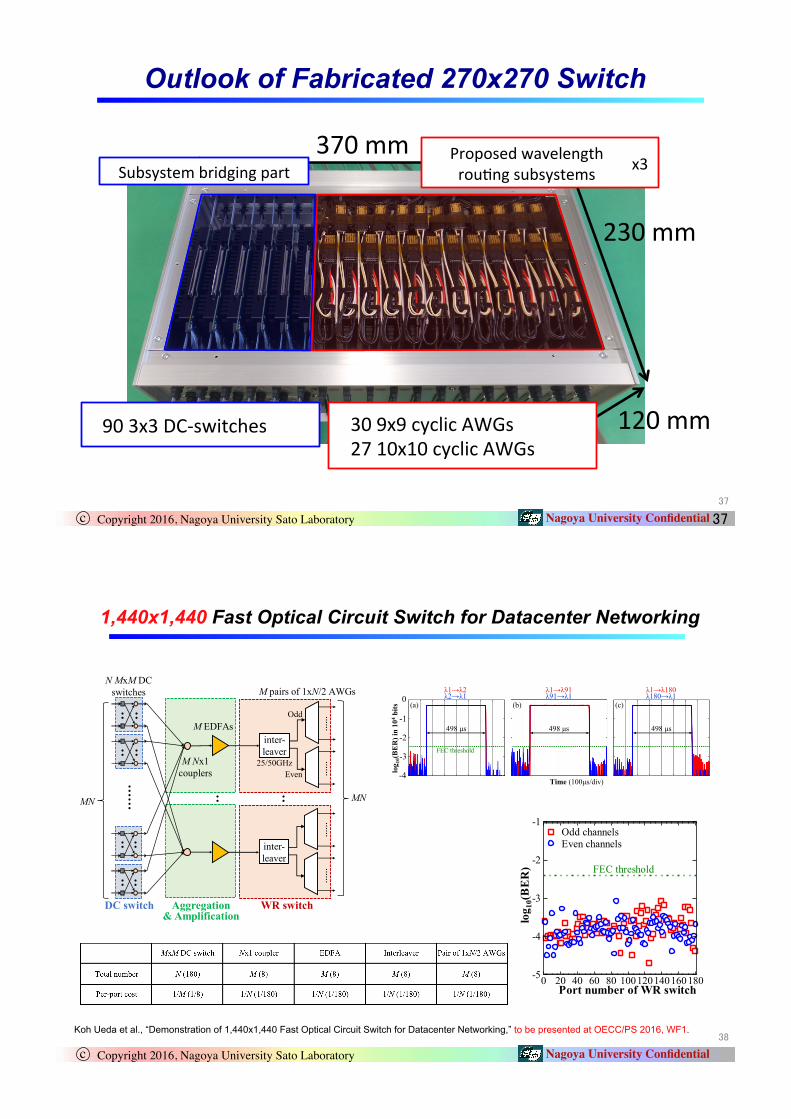
370$mm�
230$mm�
120$mm�
Subsystem$bridging$part�
90$3x3$DC^switches�
Proposed$wavelength$rou8ng$subsystems�
x3�
30$9x9$cyclic$AWGs$27$10x10$cyclic$AWGs�
Outlook of Fabricated 270x270 Switch�
���
Copyright 2016, Nagoya University Sato Laboratory!c! Nagoya University Confidential!
M EDFAsinter-leaver
25/50GHz
λ2N
inter-leaver
M pairs of 1xN/2 AWGs
M Nx1couplers
WR switchAggregation & Amplification
MN MN
N MxM DCswitches
Odd
Even
DC switch
498 µs 498 µs 498 µs
λ1→λ2λ2→λ1
λ1→λ91λ91→λ1
λ1→λ180λ180→λ1
FEC threshold
log 1
0(B
ER
) in
104
bits
Time (100µs/div)
0
-1
-2
-3
-4
(a) (b) (c)
Koh Ueda et al., “Demonstration of 1,440x1,440 Fast Optical Circuit Switch for Datacenter Networking,” to be presented at OECC/PS 2016, WF1.
1,440x1,440 Fast Optical Circuit Switch for Datacenter Networking�
Port number of WR switch
log 1
0(B
ER
)
Odd channelsEven channels
FEC threshold
0 20 40 60 80 100120140160180-5
-4
-3
-2
-1
���
Copyright 2016, Nagoya University Sato Laboratory!c! Nagoya University Confidential!
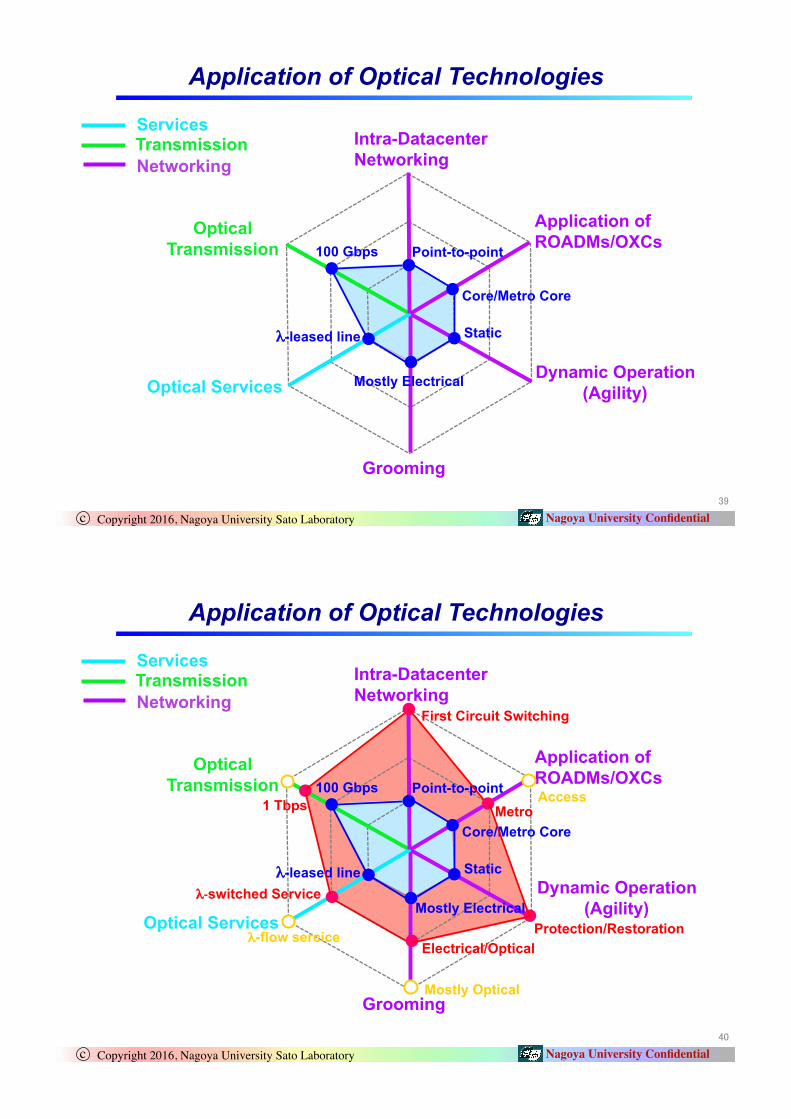
Optical Services
Optical Transmission
Dynamic Operation (Agility)
Application of Optical Technologies
λ-leased line �
100 Gbps �
Static �
Application of ROADMs/OXCs
Services�Transmission�Networking�
Grooming
Core/Metro Core �
Intra-Datacenter Networking
Point-to-point �
Mostly Electrical�
���
Copyright 2016, Nagoya University Sato Laboratory!c! Nagoya University Confidential!
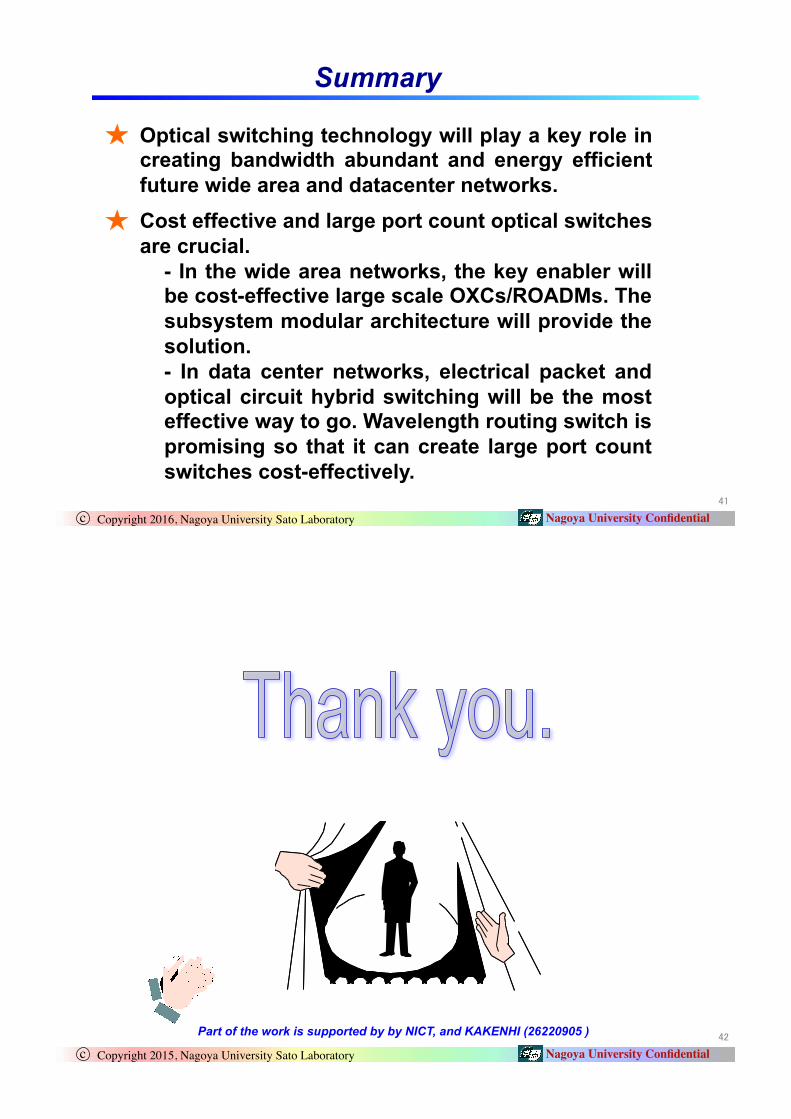
Optical Services
Optical Transmission
Dynamic Operation (Agility)
Application of Optical Technologies
λ-leased line �
100 Gbps �
Static �
Access�
Application of ROADMs/OXCs
Services�Transmission�Networking�
Grooming
Core/Metro Core �
Intra-Datacenter Networking
Point-to-point �
Mostly Electrical�
1 Tbps � Metro�
Mostly Optical�
λ_switched Service �
Electrical/Optical�λ-flow sercice� Protection/Restoration�
First Circuit Switching �
���
Copyright 2016, Nagoya University Sato Laboratory!c! Nagoya University Confidential!
Summary�
Optical switching technology will play a key role in creating bandwidth abundant and energy efficient future wide area and datacenter networks. Cost effective and large port count optical switches are crucial.
- In the wide area networks, the key enabler will be cost-effective large scale OXCs/ROADMs. The subsystem modular architecture will provide the solution. - In data center networks, electrical packet and optical circuit hybrid switching will be the most effective way to go. Wavelength routing switch is promising so that it can create large port count switches cost-effectively.
� �
Copyright 2016, Nagoya University Sato Laboratory!c! Nagoya University Confidential!Copyright 2015, Nagoya University Sato Laboratory!c! Nagoya University Confidential!
Part of the work is supported by by NICT, and KAKENHI (26220905 )�