Embed Size (px)
Citation preview
An International Benchmarking of Energy and CO2 Intensities
HOW CLEAN IS THE U.S.STEEL INDUSTRY?
NOVEMBER 2019
Ali Hasanbeigi & Cecilia Springer Global E�ciency Intelligence

How Clean Is the U.S. Steel Industry?: An International Benchmarking of Energy and CO2 Intensities 1
This report was made possible with the support from the BlueGreen Alliance Foundation and ClimateWorks Foundation. The authors would like to thank Mike Williams, Karsyn Kendrick, Joe Kendrick, and Katie Walloch of BlueGreen Alliance Foundation, Prodipto Roy and Jan Mazurek of ClimateWorks Foundation, Marlene Arens of Fraunhofer Institute for Systems and Innovation Research ISI in Germany and Alua Suleimenova of Climate Action Network for their valuable input to this study and/or their insightful comments on the earlier version of this document.
Acknowledgements
Global E�ciency Intelligence, LLC has provided the information in this publication for informational purposes only. Although great care has been taken to maintain the accuracy of information collected and presented, Global E�ciency Intelligence, LLC do not make any express or implied warranty concerning such information. Any estimates contained in the publication reflect Global E�ciency Intelligence, LLC’s current analyses and expectations based on available data and information. Any reference to a specific commercial product, process, or service by trade name, trademark, manufacturer, or otherwise, does not constitute or imply an endorsement, recommendation, or favoring by Global E�ciency Intelligence, LLC.
This document may be freely quoted or reprinted, but acknowledgment is requested.
Please cite as: Hasanbeigi, A. and Springer, C. 2019. How Clean is the U.S. Steel Industry? An International Benchmarking of Energy and CO2 Intensities. San Francisco CA: Global E�ciency Intelligence.
https://www.globale�ciencyintel.com
Disclaimer
How Clean Is the U.S. Steel Industry?: An International Benchmarking of Energy and CO2 Intensities 2
The iron and steel industry accounts for around a quarter of greenhouse gas (GHG) emissions from the global industrial sector. Global steel production has more than doubled between 2000 and 2018. China accounted for 51 percent of global steel production in 2018. The energy use and GHG emissions of the steel industry is likely to continue increasing because the increased demand for steel, particularly in developing countries, is outpacing the incremental decreases in energy and carbon dioxide (CO2) emissions intensity of steel production that are happening under the current policy and technology regime.
The iron and steel industry worldwide accounts for around 21% of global industrial energy use and about 24% of
industrial CO2 emissions in the world.International benchmarking of energy intensity and CO2 emissions intensity can provide a comparison point against which a company or industry’s performance can be measured to that of the same type of company or industry in other countries. Benchmarking can also be used for assessing the energy and emissions improvement potential that could be achieved by the implementation of energy e�ciency or CO2 reduction measures. Also, on a national level, policy makers can use benchmarking to prioritize energy saving and decarbonization options and to design policies to reduce energy and GHG emissions.
In this study we conduct a benchmarking analysis for energy and CO2 emissions intensity of the steel industry among the largest steel-producing countries. Because of the di�erence in the composition of the steel industry across countries and the variation in the share of electric arc furnace (EAF) steel production, a single intensity value for the overall steel industry is not a good indicator of e�ciency of the steel industry in a country. Therefore, in addition to calculating energy and CO2 intensities for the entire steel industry, we also calculated separately the intensities associated with the EAF and blast furnace–basic oxygen furnace (BF-BOF) production routes in each country.
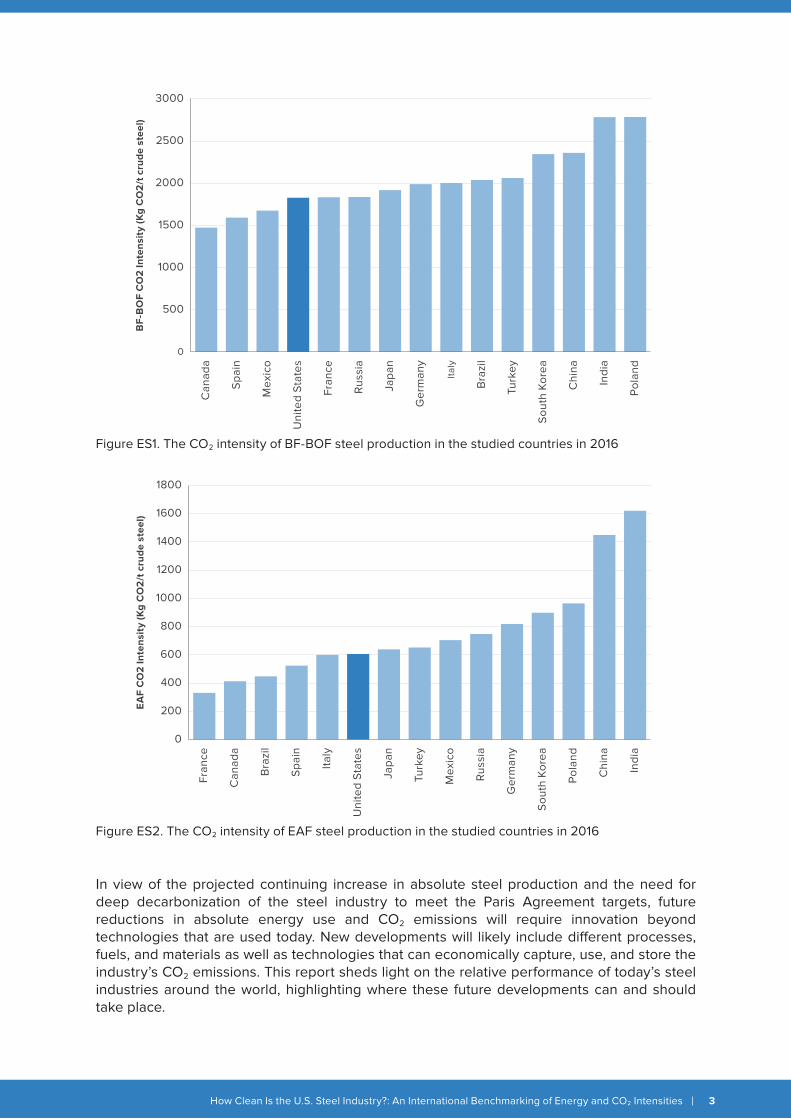
Our results show that when looking at the entire steel industry, Italy and Spain have the lowest and China has the highest energy and CO2 emissions intensities among the countries studied. Among several reasons, this is primarily because of a significantly higher share of EAF steel production from total steel production in Italy and Spain and a very low share of EAF steel production in China. The U.S. steel industry’s final energy and CO2 emissions intensities rank 4th lowest among the countries studied. Figures ES1 and ES2 show the CO2 emissions intensities for the BF-BOF and EAF steel production routes for the fifteen countries studied.
Some key factors that could explain why the steel industry’s energy and CO2 emissions intensity values di�er among the countries are: the share of EAF steel in total steel production, the fuel mixes in the iron and steel industry, the electricity grid CO2 emissions factor, the type of feedstocks for BF-BOF and EAF, the level of penetration of energy-e�cient technologies, the steel product mix in each country, the age of steel manufacturing facilities in each country, the Capacity utilization, environmental regulations, cost of energy and raw materials, and the boundary definition for the steel industry. These are discussed in section 5.4 of the report.
Executive Summary
In view of the projected continuing increase in absolute steel production and the need for deep decarbonization of the steel industry to meet the Paris Agreement targets, future reductions in absolute energy use and CO2 emissions will require innovation beyond technologies that are used today. New developments will likely include di�erent processes, fuels, and materials as well as technologies that can economically capture, use, and store the industry’s CO2 emissions. This report sheds light on the relative performance of today’s steel industries around the world, highlighting where these future developments can and should take place.
How Clean Is the U.S. Steel Industry?: An International Benchmarking of Energy and CO2 Intensities 3
Figure ES1. The CO2 intensity of BF-BOF steel production in the studied countries in 2016
0
500
1000
1500
2000
2500
3000
BF
-BO
F C
O2
Inte
nsit
y (K
g C
O2
/t c
rud
e st
eel)
Can
ada
Spa
in
Mex
ico
Uni
ted
Sta
tes
Fran
ce
Rus
sia
Japa
n
Ger
man
y
Italy
Bra
zil
Turk
ey
Sou
th K
orea
Chi
na
Indi
a
Pol
and
Figure ES2. The CO2 intensity of EAF steel production in the studied countries in 2016
EA
F C
O2
Inte
nsit
y (K
g C
O2
/t c
rud
e st
eel)
0
200
400
600
800
1000
1200
1400
1600
1800
Fran
ce
Can
ada
Bra
zil
Spa
in
Italy
Uni
ted
Sta
tes
Japa
n
Turk
ey
Mex
ico
Rus
sia
Ger
man
y
Sou
th K
orea
Pol
and
Chi
na
Indi
a
Executive Summary 2
1. Introduction 6
2. Steel production in the U.S. and the world 8
3. Energy use and CO2 emissions in the steel industry 10
4. Global steel trade and the U.S. 14
5. Benchmarking energy and CO2 emissions intensities of the steel industry 17
5.1. Benchmarking the total steel industry’s energy and CO2 emissions intensities 17
5.2. Benchmarking BF-BOF steel production’s energy and CO2 emissions intensities 20
5.3. Benchmarking EAF steel production’s energy and CO2 emissions intensities 23
5.4. Key factors influencing energy and CO2 emissions intensity of the steel industry 25
6. Conclusions 30
References 32
Appendices 34
Appendix 1. Methodology 34
Appendix 2. Description of Iron and Steel Production 36
Appendix 3. List of acronyms 40
Appendix 4. List of figures and tables 41
Table of Contents
How Clean Is the U.S. Steel Industry?: An International Benchmarking of Energy and CO2 Intensities 4
How Clean Is the U.S. Steel Industry?: An International Benchmarking of Energy and CO2 Intensities 6
Introduction1
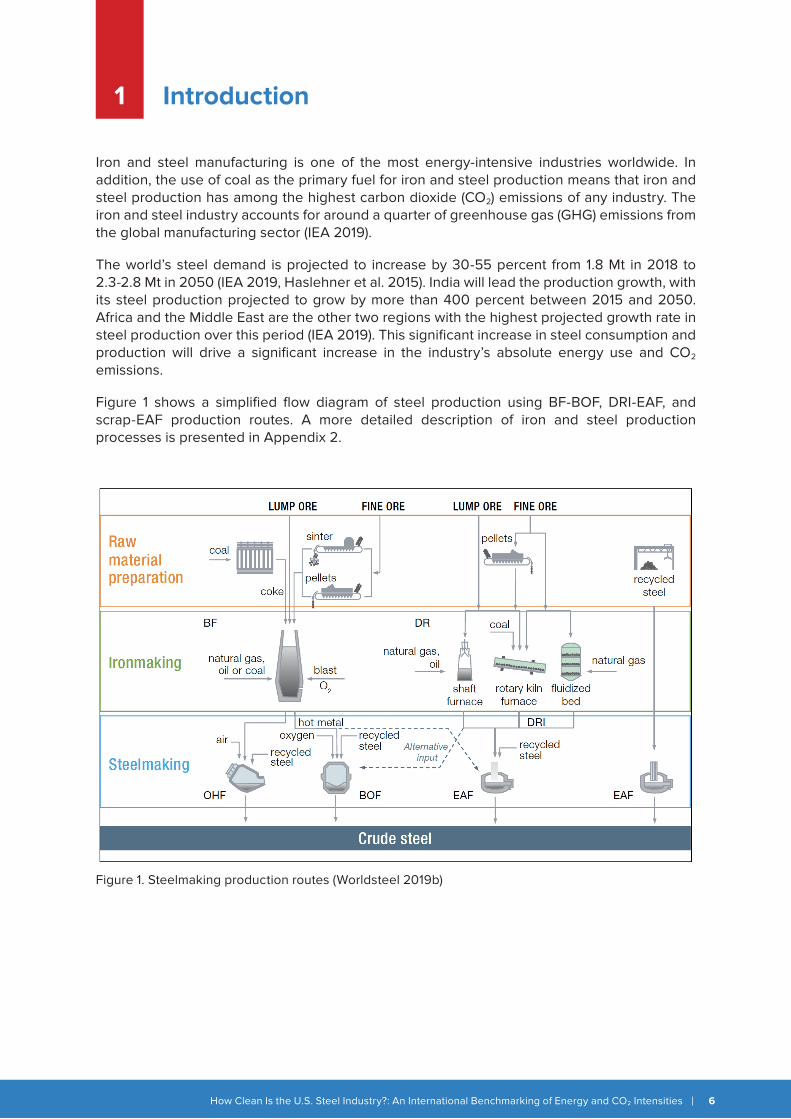
Iron and steel manufacturing is one of the most energy-intensive industries worldwide. In addition, the use of coal as the primary fuel for iron and steel production means that iron and steel production has among the highest carbon dioxide (CO2) emissions of any industry. The iron and steel industry accounts for around a quarter of greenhouse gas (GHG) emissions from the global manufacturing sector (IEA 2019).
The world’s steel demand is projected to increase by 30-55 percent from 1.8 Mt in 2018 to 2.3-2.8 Mt in 2050 (IEA 2019, Haslehner et al. 2015). India will lead the production growth, with its steel production projected to grow by more than 400 percent between 2015 and 2050. Africa and the Middle East are the other two regions with the highest projected growth rate in steel production over this period (IEA 2019). This significant increase in steel consumption and production will drive a significant increase in the industry’s absolute energy use and CO2 emissions.
Figure 1 shows a simplified flow diagram of steel production using BF-BOF, DRI-EAF, and scrap-EAF production routes. A more detailed description of iron and steel production processes is presented in Appendix 2.
Figure 1. Steelmaking production routes (Worldsteel 2019b)
How Clean Is the U.S. Steel Industry?: An International Benchmarking of Energy and CO2 Intensities 7
Iron ore is chemically reduced to produce steel by one of these three process routes: blast furnace (BF)/basic oxygen furnace (BOF), smelting reduction, or direct reduction. Steel is also produced by direct melting of scrap in an electric arc furnace (EAF). BF-BOF and EAF production routes are the most common today. In 2018, the BF-BOF production route accounted for approximately 74 percent of the crude steel manufactured worldwide, and EAF production accounted for approximately 26 percent (Worldsteel 2019a). Iron and steel can be produced at separate facilities or in an integrated steel mill, where the iron ore is reduced into pig iron/hot metal or direct reduced iron (DRI) and then processed into steel at the same site.
The goal of this study is to analyze the current status of the steel industry in the U.S. and conduct a benchmarking analysis for energy and CO2 emissions intensity of the steel industry in comparison with some other key steel-producing countries. In addition to calculating energy and CO2 intensities for the entire steel industry, we also calculated separately the intensities associated with the EAF and BF-BOF production routes in each country.
How Clean Is the U.S. Steel Industry?: An International Benchmarking of Energy and CO2 Intensities 8
Steel ProductionIn the U.S. and the World2
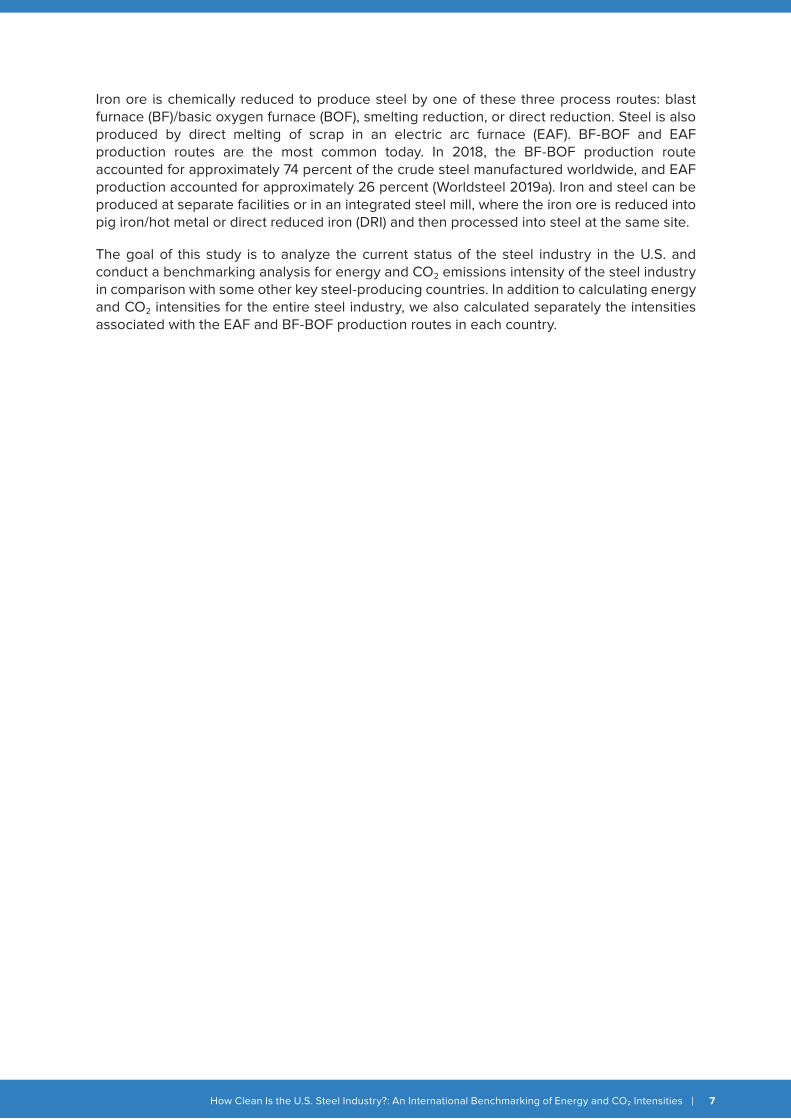
World steel production has more than doubled between 2000 and 2018 (Figure 2). In 2018, China accounted for 51 percent of global steel production while its share was only 15 percent in 2000. The 2008 drop in world steel production was because of the global economic recession. The 2014 drop was mainly caused by a slowdown in the Chinese economy and chronic overcapacity, which resulted in shutting down illegal induction furnaces and old steel plants in China.
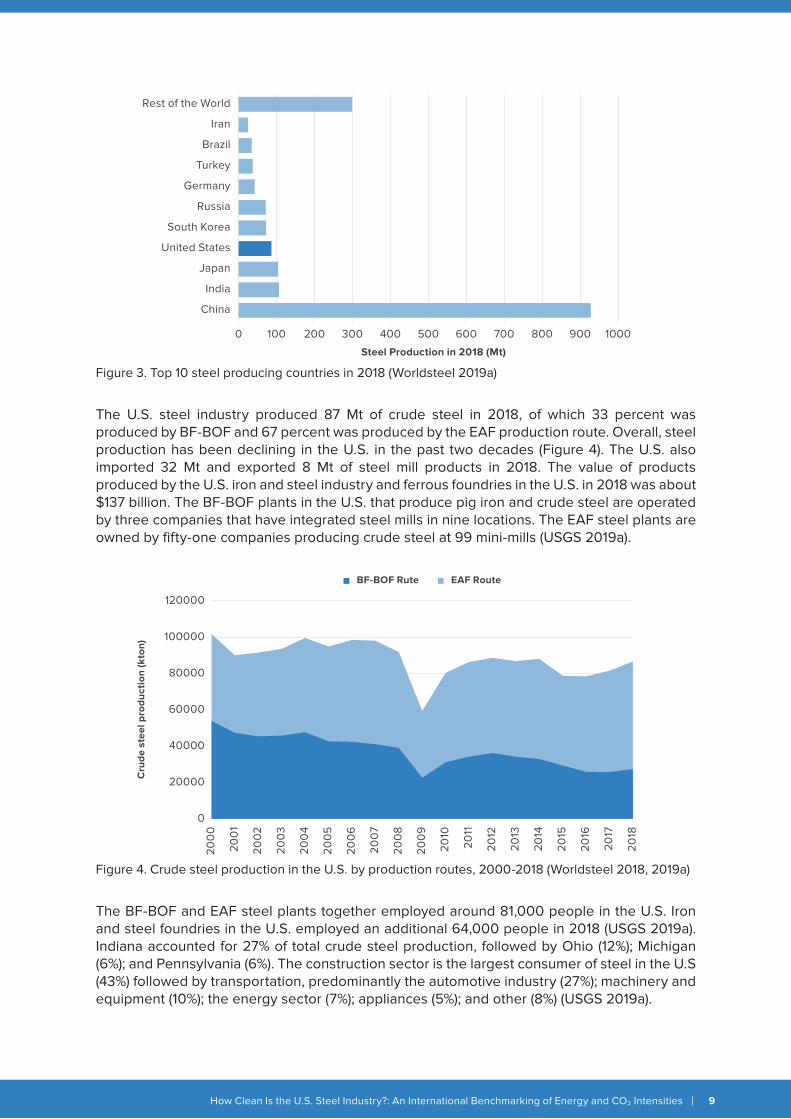
Figure 3 shows the top 10 steel producing countries in the world. In 2018, these top 10 producing countries accounted for 83 percent of world steel production (Worldsteel 2019a). The United States ranks 4th among steel producing countries.
Figure 2. Crude steel production in China and rest of the world, 2000-2018 (Worldsteel 2018, 2019a)
0
200000
400000
600000
800000
1000000
1200000
1400000
1600000
1800000
2000000
Cru
de
stee
l pro
duct
ion
(kto
n)
200
0
200
1
200
2
200
3
200
4
200
5
200
6
200
7
200
8
200
9
2010
2011
2012
2013
2014
2015
2016
2017
2018
China Rest of the World
How Clean Is the U.S. Steel Industry?: An International Benchmarking of Energy and CO2 Intensities 9
Figure 3. Top 10 steel producing countries in 2018 (Worldsteel 2019a)
The U.S. steel industry produced 87 Mt of crude steel in 2018, of which 33 percent was produced by BF-BOF and 67 percent was produced by the EAF production route. Overall, steel production has been declining in the U.S. in the past two decades (Figure 4). The U.S. also imported 32 Mt and exported 8 Mt of steel mill products in 2018. The value of products produced by the U.S. iron and steel industry and ferrous foundries in the U.S. in 2018 was about $137 billion. The BF-BOF plants in the U.S. that produce pig iron and crude steel are operated by three companies that have integrated steel mills in nine locations. The EAF steel plants are owned by fifty-one companies producing crude steel at 99 mini-mills (USGS 2019a).
The BF-BOF and EAF steel plants together employed around 81,000 people in the U.S. Iron and steel foundries in the U.S. employed an additional 64,000 people in 2018 (USGS 2019a). Indiana accounted for 27% of total crude steel production, followed by Ohio (12%); Michigan (6%); and Pennsylvania (6%). The construction sector is the largest consumer of steel in the U.S (43%) followed by transportation, predominantly the automotive industry (27%); machinery and equipment (10%); the energy sector (7%); appliances (5%); and other (8%) (USGS 2019a).
0 100 200 300 400 500 600 700 800 900 1000
Steel Production in 2018 (Mt)
Rest of the World
Iran
Brazil
Turkey
Germany
Russia
South Korea
United States
Japan
India
China
Figure 4. Crude steel production in the U.S. by production routes, 2000-2018 (Worldsteel 2018, 2019a)
0
20000
40000
60000
80000
100000
120000
200
0
200
1
200
2
200
3
200
4
200
5
200
6
200
7
200
8
200
9
2010
2011
2012
2013
2014
2015
2016
2017
2018
Cru
de
stee
l pro
duct
ion
(kto
n)
BF-BOF Rute EAF Route
How Clean Is the U.S. Steel Industry?: An International Benchmarking of Energy and CO2 Intensities 10
Energy Use and CO2 EmissionsIn the Steel Industry3
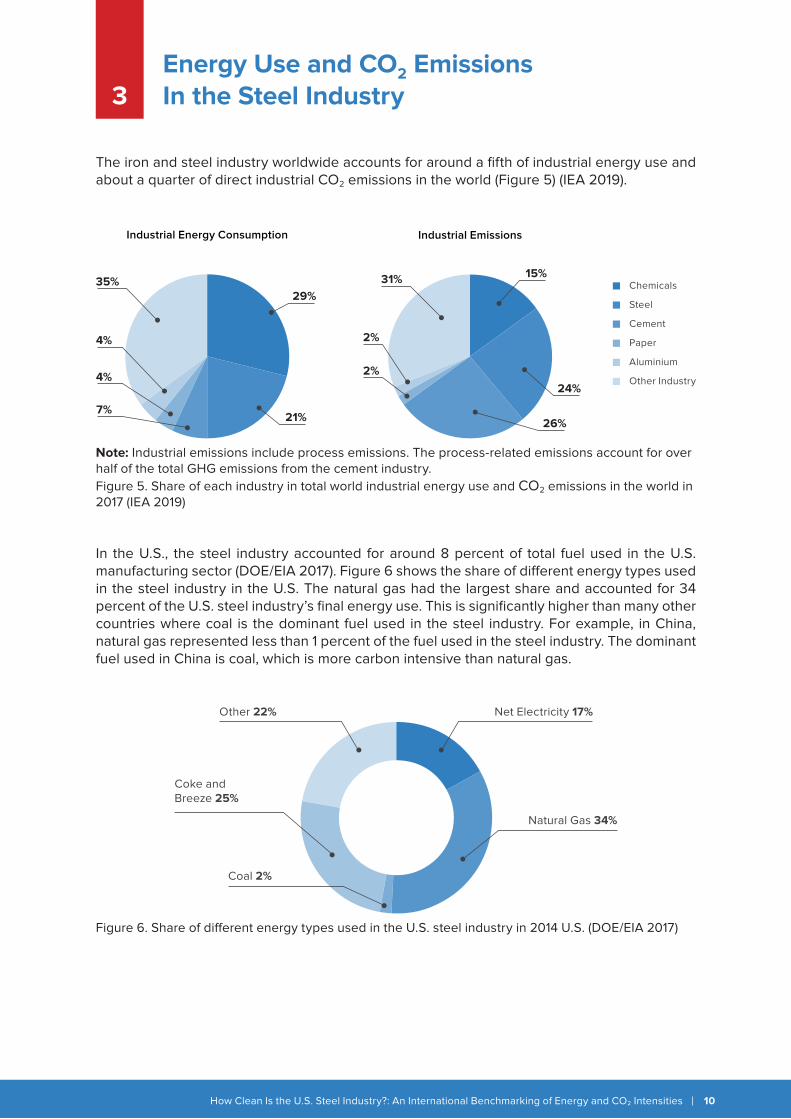
The iron and steel industry worldwide accounts for around a fifth of industrial energy use and about a quarter of direct industrial CO2 emissions in the world (Figure 5) (IEA 2019).
In the U.S., the steel industry accounted for around 8 percent of total fuel used in the U.S. manufacturing sector (DOE/EIA 2017). Figure 6 shows the share of di�erent energy types used in the steel industry in the U.S. The natural gas had the largest share and accounted for 34 percent of the U.S. steel industry’s final energy use. This is significantly higher than many other countries where coal is the dominant fuel used in the steel industry. For example, in China, natural gas represented less than 1 percent of the fuel used in the steel industry. The dominant fuel used in China is coal, which is more carbon intensive than natural gas.
Note: Industrial emissions include process emissions. The process-related emissions account for over half of the total GHG emissions from the cement industry.Figure 5. Share of each industry in total world industrial energy use and CO2 emissions in the world in 2017 (IEA 2019)
Figure 6. Share of di�erent energy types used in the U.S. steel industry in 2014 U.S. (DOE/EIA 2017)
Net Electricity 17%Other 22%
Coke andBreeze 25%
Coal 2%
Natural Gas 34%
Industrial Energy Consumption Industrial Emissions
15%
24%
26%
31%
2%
2%
29%
21%
35%
4%
4%
7%
Chemicals
Steel
Cement
Paper
Aluminium
Other Industry
How Clean Is the U.S. Steel Industry?: An International Benchmarking of Energy and CO2 Intensities 11
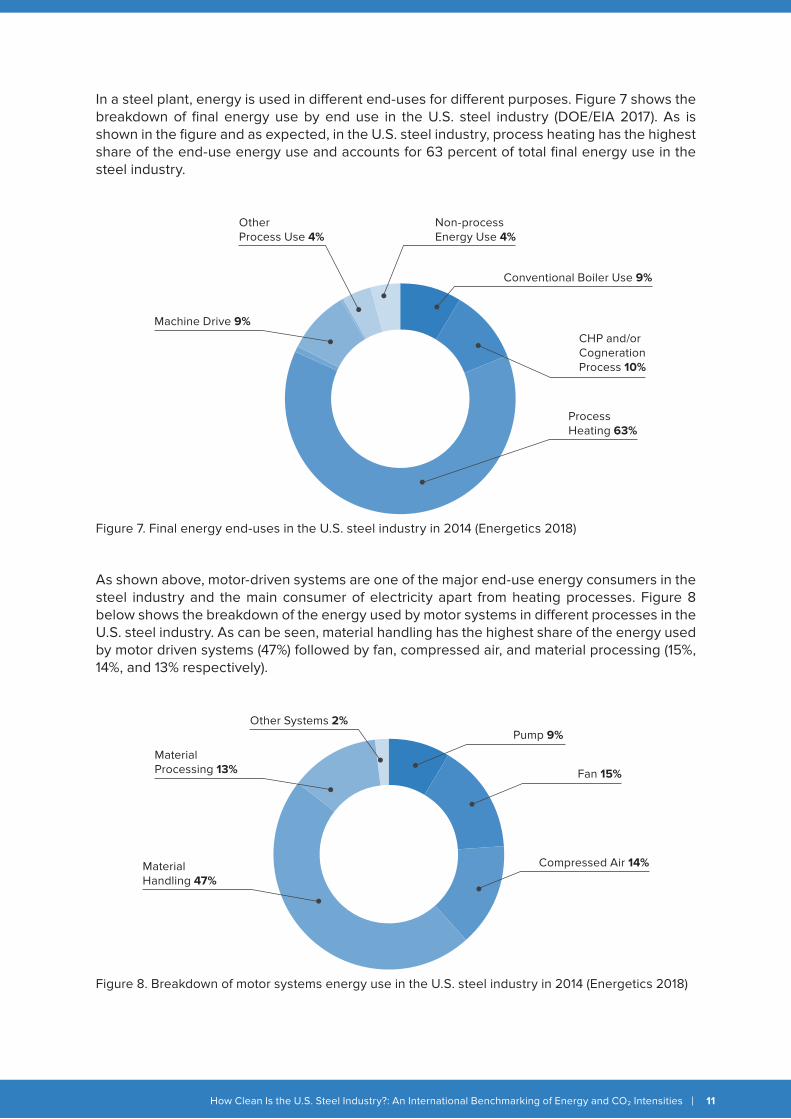
In a steel plant, energy is used in di�erent end-uses for di�erent purposes. Figure 7 shows the breakdown of final energy use by end use in the U.S. steel industry (DOE/EIA 2017). As is shown in the figure and as expected, in the U.S. steel industry, process heating has the highest share of the end-use energy use and accounts for 63 percent of total final energy use in the steel industry.
As shown above, motor-driven systems are one of the major end-use energy consumers in the steel industry and the main consumer of electricity apart from heating processes. Figure 8 below shows the breakdown of the energy used by motor systems in di�erent processes in the U.S. steel industry. As can be seen, material handling has the highest share of the energy used by motor driven systems (47%) followed by fan, compressed air, and material processing (15%, 14%, and 13% respectively).
Figure 7. Final energy end-uses in the U.S. steel industry in 2014 (Energetics 2018)
Figure 8. Breakdown of motor systems energy use in the U.S. steel industry in 2014 (Energetics 2018)
Conventional Boiler Use 9%
Non-processEnergy Use 4%
CHP and/orCognerationProcess 10%
ProcessHeating 63%
Machine Drive 9%
OtherProcess Use 4%
Pump 9%
Fan 15%
Compressed Air 14%MaterialHandling 47%
MaterialProcessing 13%
Other Systems 2%
How Clean Is the U.S. Steel Industry?: An International Benchmarking of Energy and CO2 Intensities 12
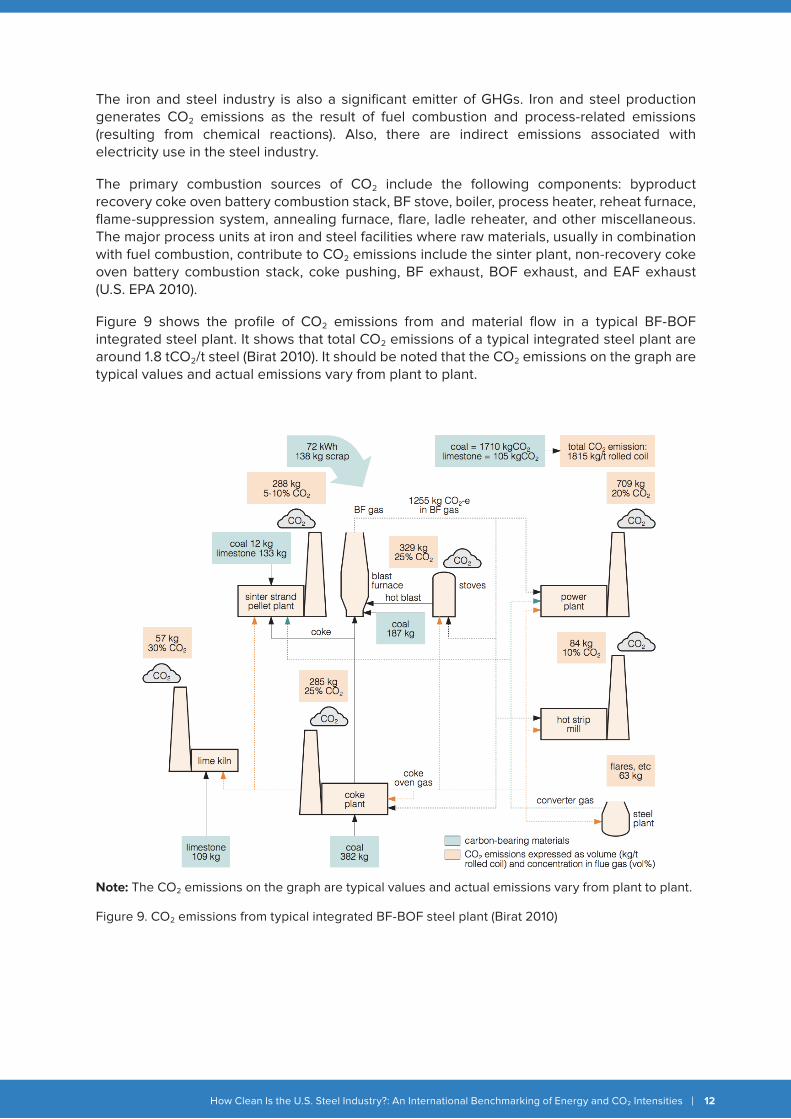
The iron and steel industry is also a significant emitter of GHGs. Iron and steel production generates CO2 emissions as the result of fuel combustion and process-related emissions (resulting from chemical reactions). Also, there are indirect emissions associated with electricity use in the steel industry.
The primary combustion sources of CO2 include the following components: byproduct recovery coke oven battery combustion stack, BF stove, boiler, process heater, reheat furnace, flame-suppression system, annealing furnace, flare, ladle reheater, and other miscellaneous. The major process units at iron and steel facilities where raw materials, usually in combination with fuel combustion, contribute to CO2 emissions include the sinter plant, non-recovery coke oven battery combustion stack, coke pushing, BF exhaust, BOF exhaust, and EAF exhaust (U.S. EPA 2010).
Figure 9 shows the profile of CO2 emissions from and material flow in a typical BF-BOF integrated steel plant. It shows that total CO2 emissions of a typical integrated steel plant are around 1.8 tCO2/t steel (Birat 2010). It should be noted that the CO2 emissions on the graph are typical values and actual emissions vary from plant to plant.
Note: The CO2 emissions on the graph are typical values and actual emissions vary from plant to plant.
Figure 9. CO2 emissions from typical integrated BF-BOF steel plant (Birat 2010)

How Clean Is the U.S. Steel Industry?: An International Benchmarking of Energy and CO2 Intensities 14
4
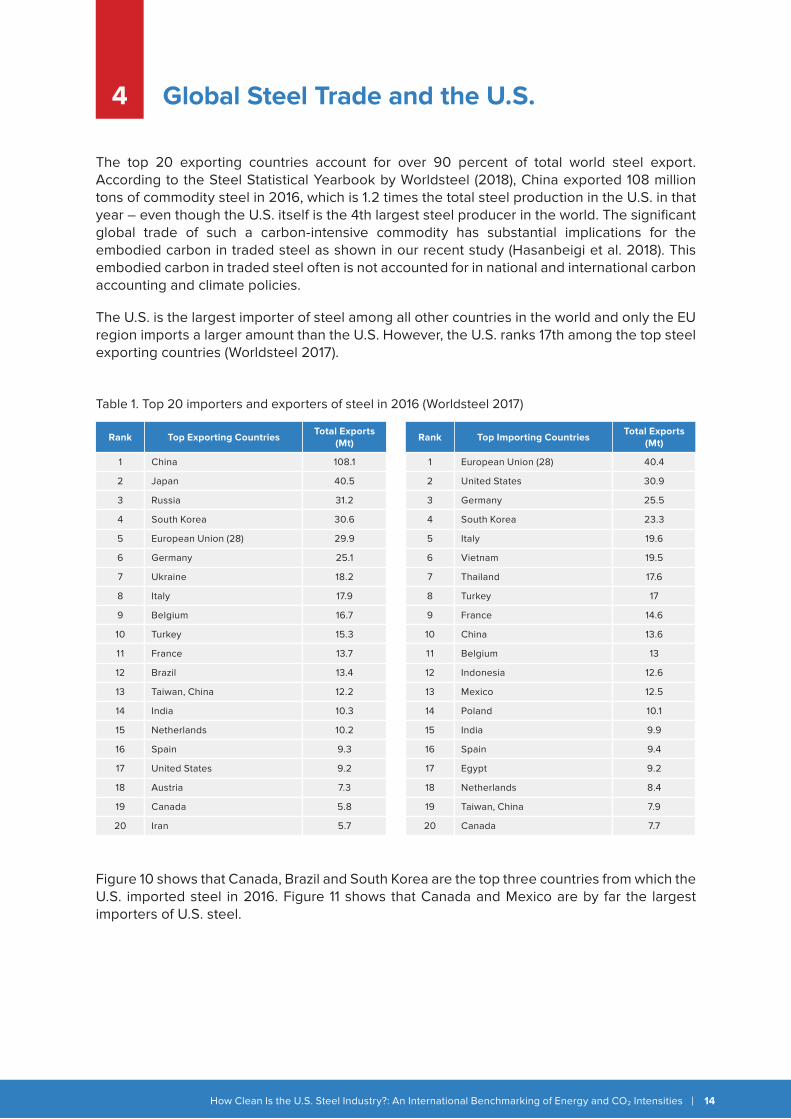
The top 20 exporting countries account for over 90 percent of total world steel export. According to the Steel Statistical Yearbook by Worldsteel (2018), China exported 108 million tons of commodity steel in 2016, which is 1.2 times the total steel production in the U.S. in that year – even though the U.S. itself is the 4th largest steel producer in the world. The significant global trade of such a carbon-intensive commodity has substantial implications for the embodied carbon in traded steel as shown in our recent study (Hasanbeigi et al. 2018). This embodied carbon in traded steel often is not accounted for in national and international carbon accounting and climate policies.
The U.S. is the largest importer of steel among all other countries in the world and only the EU region imports a larger amount than the U.S. However, the U.S. ranks 17th among the top steel exporting countries (Worldsteel 2017).
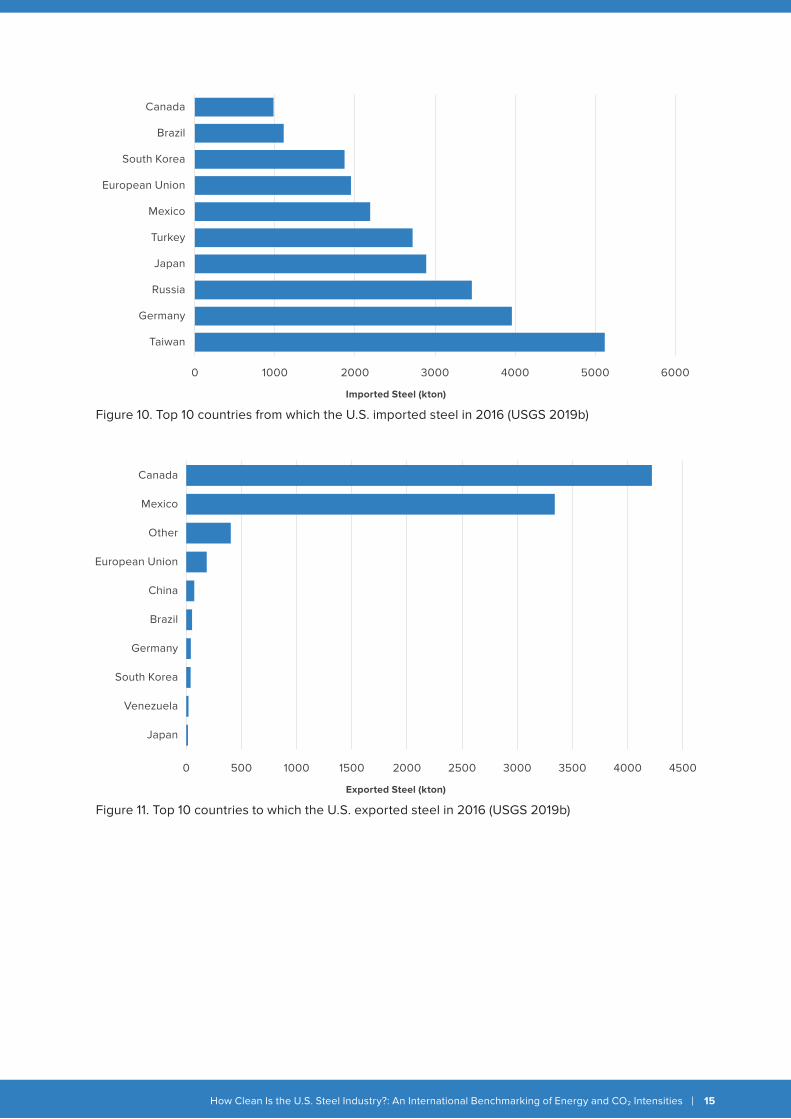
Figure 10 shows that Canada, Brazil and South Korea are the top three countries from which the U.S. imported steel in 2016. Figure 11 shows that Canada and Mexico are by far the largest importers of U.S. steel.
Global Steel Trade and the U.S.
Table 1. Top 20 importers and exporters of steel in 2016 (Worldsteel 2017)
Rank Top Exporting CountriesTotal Exports
(Mt)
1 China 108.1
2 Japan 40.5
3 Russia 31.2
4 South Korea 30.6
5 European Union (28) 29.9
6 Germany 25.1
7 Ukraine 18.2
8 Italy 17.9
9 Belgium 16.7
10 Turkey 15.3
11 France 13.7
12 Brazil 13.4
13 Taiwan, China 12.2
14 India 10.3
15 Netherlands 10.2
16 Spain 9.3
17 United States 9.2
18 Austria 7.3
19 Canada 5.8
20 Iran 5.7
Rank Top Importing CountriesTotal Exports
(Mt)
1 European Union (28) 40.4
2 United States 30.9
3 Germany 25.5
4 South Korea 23.3
5 Italy 19.6
6 Vietnam 19.5
7 Thailand 17.6
8 Turkey 17
9 France 14.6
10 China 13.6
11 Belgium 13
12 Indonesia 12.6
13 Mexico 12.5
14 Poland 10.1
15 India 9.9
16 Spain 9.4
17 Egypt 9.2
18 Netherlands 8.4
19 Taiwan, China 7.9
20 Canada 7.7
How Clean Is the U.S. Steel Industry?: An International Benchmarking of Energy and CO2 Intensities 15
Figure 10. Top 10 countries from which the U.S. imported steel in 2016 (USGS 2019b)
0 1000 2000 3000 4000 5000 6000
Canada
Brazil
South Korea
European Union
Mexico
Turkey
Japan
Russia
Germany
Taiwan
Imported Steel (kton)
Figure 11. Top 10 countries to which the U.S. exported steel in 2016 (USGS 2019b)
0 500 1000 1500 2000 2500 3000 3500 4000 4500
Canada
Mexico
Other
European Union
China
Brazil
Germany
South Korea
Venezuela
Japan
Exported Steel (kton)
How Clean Is the U.S. Steel Industry?: An International Benchmarking of Energy and CO2 Intensities 17
Benchmarking Energy and CO2 EmissionsIntensities of the Steel Industry5
International benchmarking of energy intensity and CO2 emissions intensity can provide a comparison point against which a company or industry’s performance can be measured to that of the same type of company or industry in other countries. Benchmarking can also be used for assessing the energy and emissions improvement potential that could be achieved by the implementation of energy e�ciency or CO2 reduction measures. Also, on a national level, policy makers can use benchmarking to prioritize energy saving and decarbonization options and to design policies to reduce energy and GHG emissions.
For this study, we have conducted benchmarking of the energy intensity and CO2 emissions intensity of the U.S. iron and steel industry against that of the steel industry in fourteen other major steel producing countries. All the countries included in this study are among the top twenty steel producing countries in the world and, combined, accounted for 88% of world steel production in 2016. In addition, all major U.S. steel trading partners are included in this study. We used 2016 as the base year for our analysis except for the U.S., for which the latest o�cial data available is for 2014.
For the benchmarking study, we compared the energy and CO2 emissions intensity of the entire steel industry in these fifteen countries. In addition, to provide more in-depth insight and take into account the di�erences in steel industry structure in terms of type of process used, we conducted energy and CO2 emissions intensity benchmarking for BF-BOF and EAF steel production, separately. To have a more accurate and fair comparison, we also took into account the embodied energy in net imported pig iron and DRI when calculating energy and CO2 emissions intensity for each country. Please see Appendix 1 for a description of the methodology. The subsections below show the results of these benchmarking analysis.
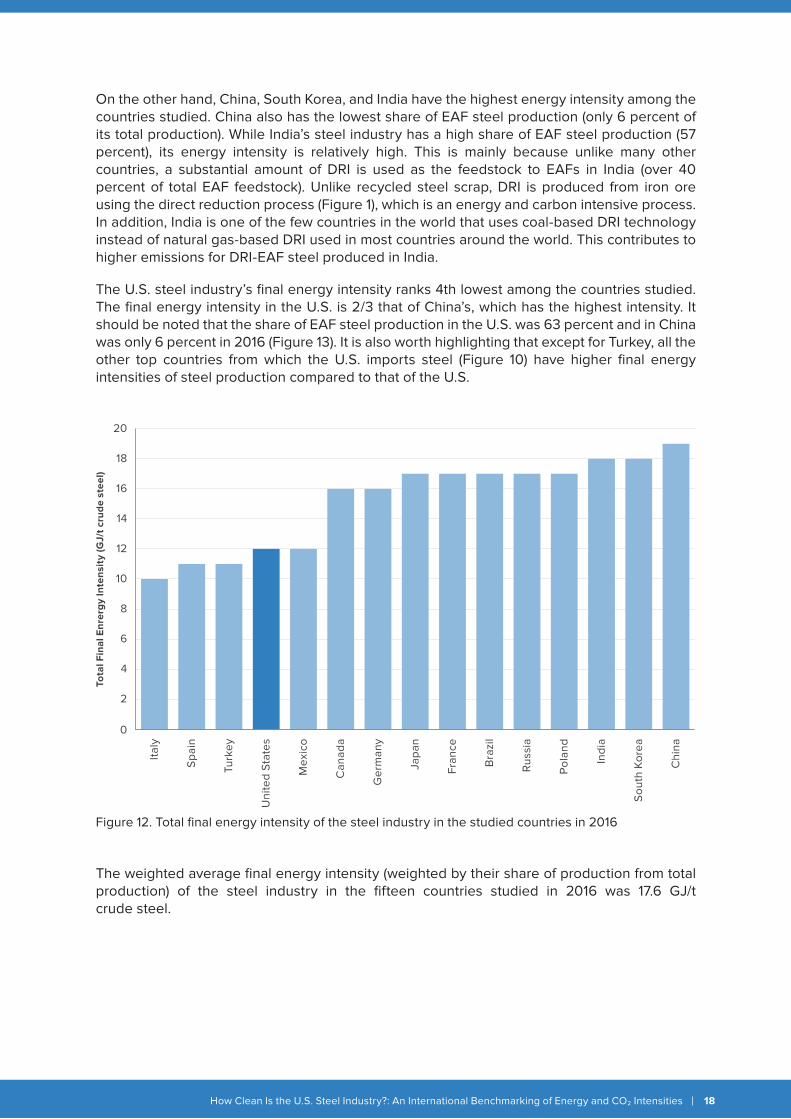
Figure 12 shows the total final energy intensity of the entire steel industry in these fifteen countries in 2016. Italy, Spain, and Turkey have the lowest energy intensity among the countries studied. This is primarily because of a significantly higher share of EAF steel production in total steel production in these countries (Figure 13). EAF is a secondary steel production process that primarily uses steel scrap and therefore uses less energy to produce a ton of steel compared to BF-BOF. In other words, the higher share of EAF production helps to reduce the overall energy intensity of the steel industry in a country. It should be noted that EAF can also use DRI or even pig iron, which are more energy-intensive feedstocks. In some countries like India, a high amount of DRI is used in EAFs, and in China, a large amount of pig iron is used in EAFs, both resulting in significantly higher energy and emissions intensities for the steel produced by EAF in those countries. However, other factors also impact the energy and CO2 emissions intensity of the steel industry, as is discussed in the rest of this report.
5.1. Benchmarking the Total Steel Industry’s Energy and CO2 Emissions Intensities
How Clean Is the U.S. Steel Industry?: An International Benchmarking of Energy and CO2 Intensities 18
On the other hand, China, South Korea, and India have the highest energy intensity among the countries studied. China also has the lowest share of EAF steel production (only 6 percent of its total production). While India’s steel industry has a high share of EAF steel production (57 percent), its energy intensity is relatively high. This is mainly because unlike many other countries, a substantial amount of DRI is used as the feedstock to EAFs in India (over 40 percent of total EAF feedstock). Unlike recycled steel scrap, DRI is produced from iron ore using the direct reduction process (Figure 1), which is an energy and carbon intensive process. In addition, India is one of the few countries in the world that uses coal-based DRI technology instead of natural gas-based DRI used in most countries around the world. This contributes to higher emissions for DRI-EAF steel produced in India.
The U.S. steel industry’s final energy intensity ranks 4th lowest among the countries studied. The final energy intensity in the U.S. is 2/3 that of China’s, which has the highest intensity. It should be noted that the share of EAF steel production in the U.S. was 63 percent and in China was only 6 percent in 2016 (Figure 13). It is also worth highlighting that except for Turkey, all the other top countries from which the U.S. imports steel (Figure 10) have higher final energy intensities of steel production compared to that of the U.S.
The weighted average final energy intensity (weighted by their share of production from total production) of the steel industry in the fifteen countries studied in 2016 was 17.6 GJ/t crude steel.
Figure 12. Total final energy intensity of the steel industry in the studied countries in 2016
0
2
4
6
8
10
12
14
16
18
20
Italy
Spa
in
Turk
ey
Uni
ted
Sta
tes
Mex
ico
Can
ada
Ger
man
y
Japa
n
Fran
ce
Bra
zil
Rus
sia
Pol
and
Indi
a
Sou
th K
orea
Chi
na
Tota
l Fin
al E
nrer
gy
Inte
nsit
y (G
J/t c
rud
e st
eel)
How Clean Is the U.S. Steel Industry?: An International Benchmarking of Energy and CO2 Intensities 19
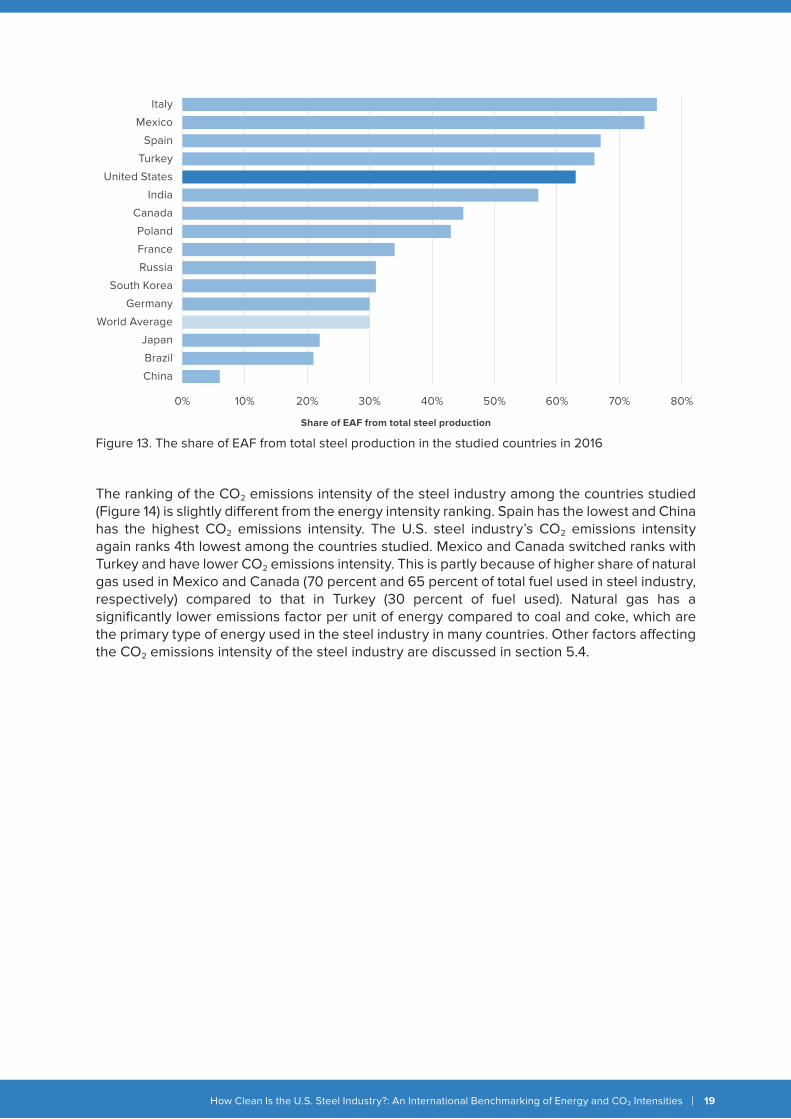
The ranking of the CO2 emissions intensity of the steel industry among the countries studied (Figure 14) is slightly di�erent from the energy intensity ranking. Spain has the lowest and China has the highest CO2 emissions intensity. The U.S. steel industry’s CO2 emissions intensity again ranks 4th lowest among the countries studied. Mexico and Canada switched ranks with Turkey and have lower CO2 emissions intensity. This is partly because of higher share of natural gas used in Mexico and Canada (70 percent and 65 percent of total fuel used in steel industry, respectively) compared to that in Turkey (30 percent of fuel used). Natural gas has a significantly lower emissions factor per unit of energy compared to coal and coke, which are the primary type of energy used in the steel industry in many countries. Other factors a�ecting the CO2 emissions intensity of the steel industry are discussed in section 5.4.
Figure 13. The share of EAF from total steel production in the studied countries in 2016
0% 10% 20% 30% 40% 50% 60% 70% 80%
Italy
Mexico
Spain
Turkey
United States
India
Canada
Poland
France
Russia
South Korea
Germany
World Average
Japan
Brazil
China
Share of EAF from total steel production
How Clean Is the U.S. Steel Industry?: An International Benchmarking of Energy and CO2 Intensities 20
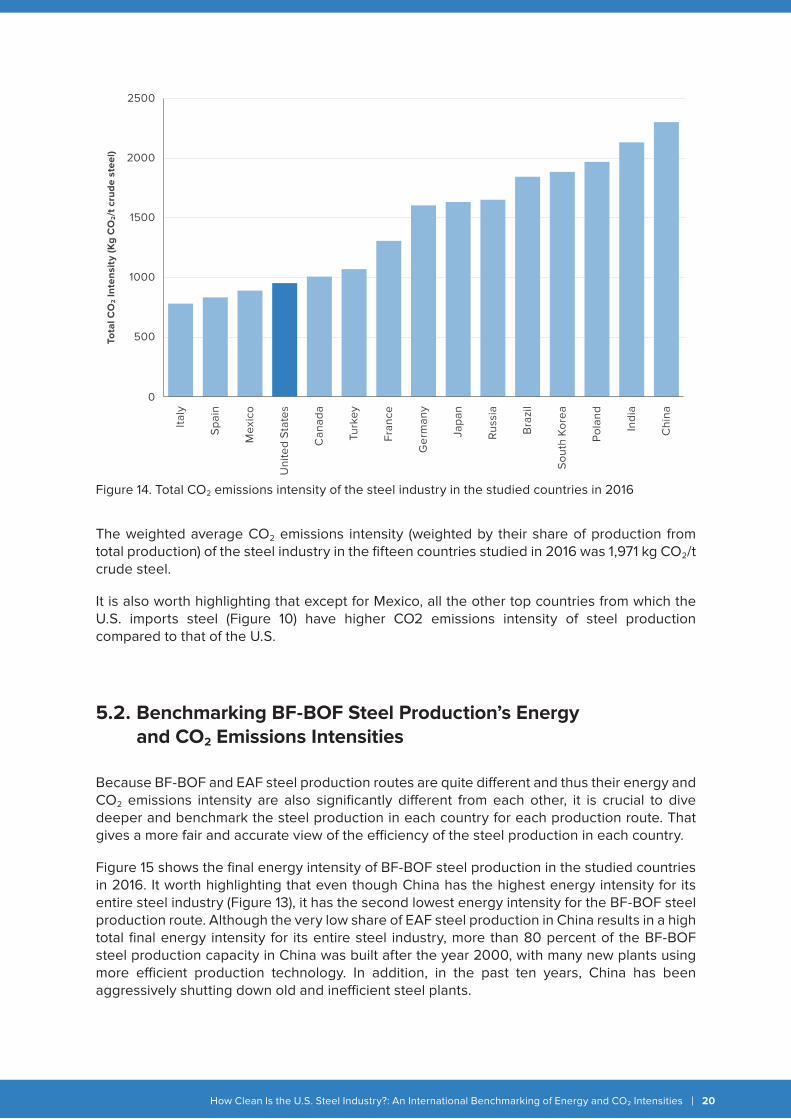
The weighted average CO2 emissions intensity (weighted by their share of production from total production) of the steel industry in the fifteen countries studied in 2016 was 1,971 kg CO2/t crude steel.
It is also worth highlighting that except for Mexico, all the other top countries from which the U.S. imports steel (Figure 10) have higher CO2 emissions intensity of steel production compared to that of the U.S.
Figure 14. Total CO2 emissions intensity of the steel industry in the studied countries in 2016
Because BF-BOF and EAF steel production routes are quite di�erent and thus their energy and CO2 emissions intensity are also significantly di�erent from each other, it is crucial to dive deeper and benchmark the steel production in each country for each production route. That gives a more fair and accurate view of the e�ciency of the steel production in each country.
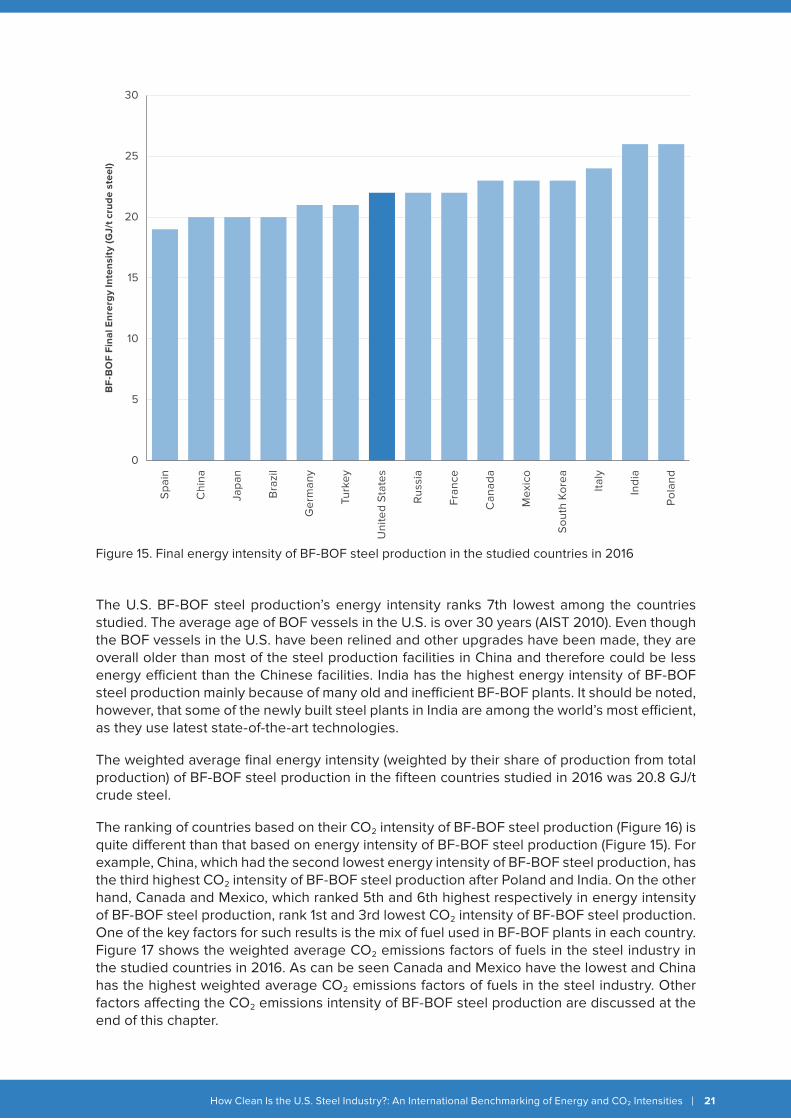
Figure 15 shows the final energy intensity of BF-BOF steel production in the studied countries in 2016. It worth highlighting that even though China has the highest energy intensity for its entire steel industry (Figure 13), it has the second lowest energy intensity for the BF-BOF steel production route. Although the very low share of EAF steel production in China results in a high total final energy intensity for its entire steel industry, more than 80 percent of the BF-BOF steel production capacity in China was built after the year 2000, with many new plants using more e�cient production technology. In addition, in the past ten years, China has been aggressively shutting down old and ine�cient steel plants.
5.2. Benchmarking BF-BOF Steel Production’s Energy and CO2 Emissions Intensities
0
500
1000
1500
2000
2500To
tal C
O2 In
tens
ity
(Kg
CO
2/t
cru
de
stee
l)
Italy
Spa
in
Mex
ico
Uni
ted
Sta
tes
Can
ada
Turk
ey
Fran
ce
Ger
man
y
Japa
n
Rus
sia
Bra
zil
Sou
th K
orea
Pol
and
Indi
a
Chi
na
How Clean Is the U.S. Steel Industry?: An International Benchmarking of Energy and CO2 Intensities 21
The U.S. BF-BOF steel production’s energy intensity ranks 7th lowest among the countries studied. The average age of BOF vessels in the U.S. is over 30 years (AIST 2010). Even though the BOF vessels in the U.S. have been relined and other upgrades have been made, they are overall older than most of the steel production facilities in China and therefore could be less energy e�cient than the Chinese facilities. India has the highest energy intensity of BF-BOF steel production mainly because of many old and ine�cient BF-BOF plants. It should be noted, however, that some of the newly built steel plants in India are among the world’s most e�cient, as they use latest state-of-the-art technologies.
The weighted average final energy intensity (weighted by their share of production from total production) of BF-BOF steel production in the fifteen countries studied in 2016 was 20.8 GJ/t crude steel.
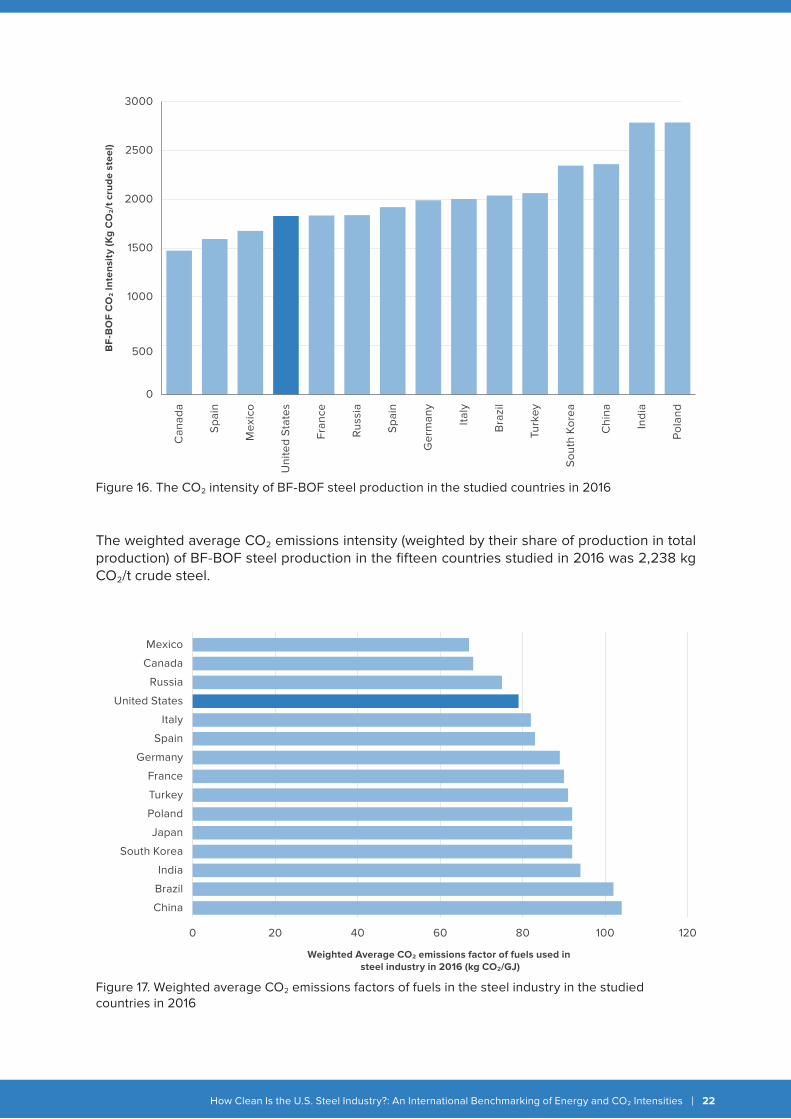
The ranking of countries based on their CO2 intensity of BF-BOF steel production (Figure 16) is quite di�erent than that based on energy intensity of BF-BOF steel production (Figure 15). For example, China, which had the second lowest energy intensity of BF-BOF steel production, has the third highest CO2 intensity of BF-BOF steel production after Poland and India. On the other hand, Canada and Mexico, which ranked 5th and 6th highest respectively in energy intensity of BF-BOF steel production, rank 1st and 3rd lowest CO2 intensity of BF-BOF steel production. One of the key factors for such results is the mix of fuel used in BF-BOF plants in each country. Figure 17 shows the weighted average CO2 emissions factors of fuels in the steel industry in the studied countries in 2016. As can be seen Canada and Mexico have the lowest and China has the highest weighted average CO2 emissions factors of fuels in the steel industry. Other factors a�ecting the CO2 emissions intensity of BF-BOF steel production are discussed at the end of this chapter.
Figure 15. Final energy intensity of BF-BOF steel production in the studied countries in 2016
0
5
10
15
20
25
30
Spa
in
Chi
na
Japa
n
Bra
zil
Ger
man
y
Turk
ey
Uni
ted
Sta
tes
Rus
sia
Fran
ce
Can
ada
Mex
ico
Sou
th K
orea
Italy
Indi
a
Pol
and
BF
-BO
F Fi
nal E
nrer
gy
Inte
nsit
y (G
J/t c
rud
e st
eel)
How Clean Is the U.S. Steel Industry?: An International Benchmarking of Energy and CO2 Intensities 22
The weighted average CO2 emissions intensity (weighted by their share of production in total production) of BF-BOF steel production in the fifteen countries studied in 2016 was 2,238 kg CO2/t crude steel.
Figure 16. The CO2 intensity of BF-BOF steel production in the studied countries in 2016
Figure 17. Weighted average CO2 emissions factors of fuels in the steel industry in the studied countries in 2016
0
500
1000
1500
2000
2500
3000
Can
ada
Spa
in
Mex
ico
Uni
ted
Sta
tes
Fran
ce
Rus
sia
Spa
in
Ger
man
y
Italy
Bra
zil
Turk
ey
Sou
th K
orea
Chi
na
Indi
a
Pol
and
BF
-BO
F C
O2 In
tens
ity
(Kg
CO
2/t
cru
de
stee
l)
0 20 40 60 80 100 120
China
Brazil
India
South Korea
Japan
Poland
Turkey
France
Germany
Spain
Italy
United States
Russia
Canada
Mexico
Weighted Average CO2 emissions factor of fuels used in steel industry in 2016 (kg CO2/GJ)
How Clean Is the U.S. Steel Industry?: An International Benchmarking of Energy and CO2 Intensities 23
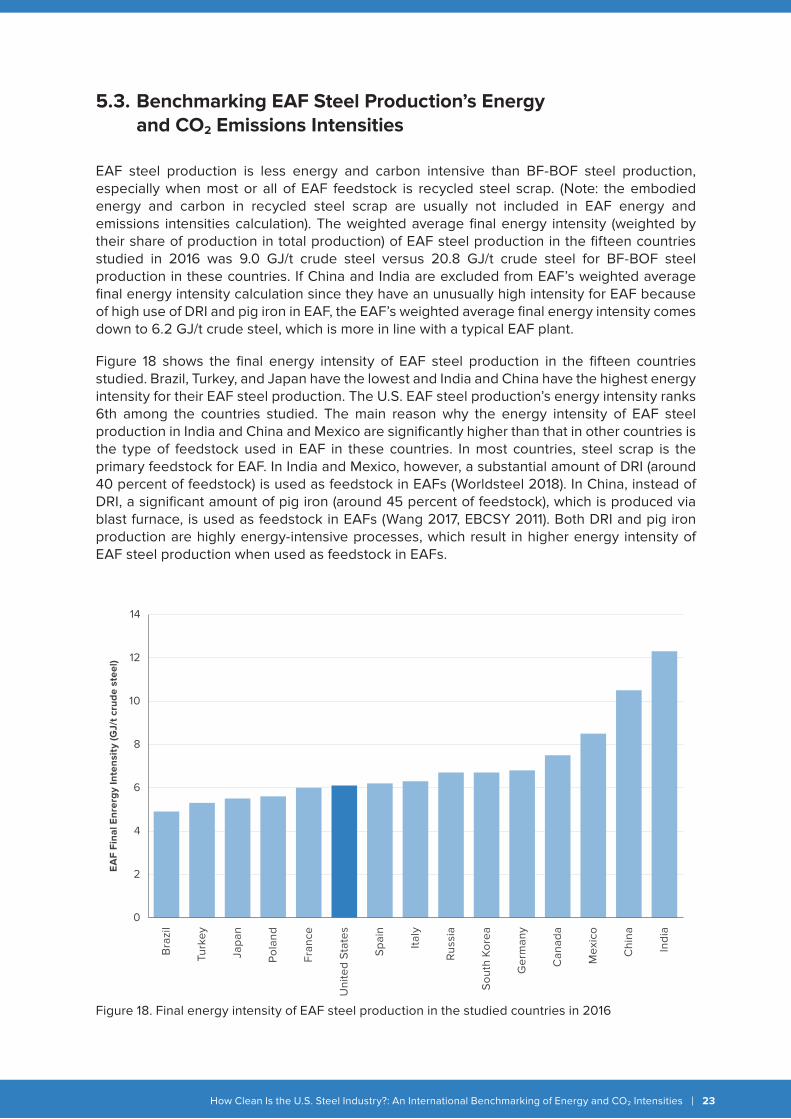
EAF steel production is less energy and carbon intensive than BF-BOF steel production, especially when most or all of EAF feedstock is recycled steel scrap. (Note: the embodied energy and carbon in recycled steel scrap are usually not included in EAF energy and emissions intensities calculation). The weighted average final energy intensity (weighted by their share of production in total production) of EAF steel production in the fifteen countries studied in 2016 was 9.0 GJ/t crude steel versus 20.8 GJ/t crude steel for BF-BOF steel production in these countries. If China and India are excluded from EAF’s weighted average final energy intensity calculation since they have an unusually high intensity for EAF because of high use of DRI and pig iron in EAF, the EAF’s weighted average final energy intensity comes down to 6.2 GJ/t crude steel, which is more in line with a typical EAF plant.
Figure 18 shows the final energy intensity of EAF steel production in the fifteen countries studied. Brazil, Turkey, and Japan have the lowest and India and China have the highest energy intensity for their EAF steel production. The U.S. EAF steel production’s energy intensity ranks 6th among the countries studied. The main reason why the energy intensity of EAF steel production in India and China and Mexico are significantly higher than that in other countries is the type of feedstock used in EAF in these countries. In most countries, steel scrap is the primary feedstock for EAF. In India and Mexico, however, a substantial amount of DRI (around 40 percent of feedstock) is used as feedstock in EAFs (Worldsteel 2018). In China, instead of DRI, a significant amount of pig iron (around 45 percent of feedstock), which is produced via blast furnace, is used as feedstock in EAFs (Wang 2017, EBCSY 2011). Both DRI and pig iron production are highly energy-intensive processes, which result in higher energy intensity of EAF steel production when used as feedstock in EAFs.
5.3. Benchmarking EAF Steel Production’s Energy and CO2 Emissions Intensities
Figure 18. Final energy intensity of EAF steel production in the studied countries in 2016
0
2
4
6
8
10
12
14
Bra
zil
Turk
ey
Japa
n
Pol
and
Fran
ce
Uni
ted
Sta
tes
Spa
in
Italy
Rus
sia
Sou
th K
orea
Ger
man
y
Can
ada
Mex
ico
Chi
na
Indi
a
EA
F Fi
nal E
nrer
gy
Inte
nsit
y (G
J/t c
rud
e st
eel)
How Clean Is the U.S. Steel Industry?: An International Benchmarking of Energy and CO2 Intensities 24
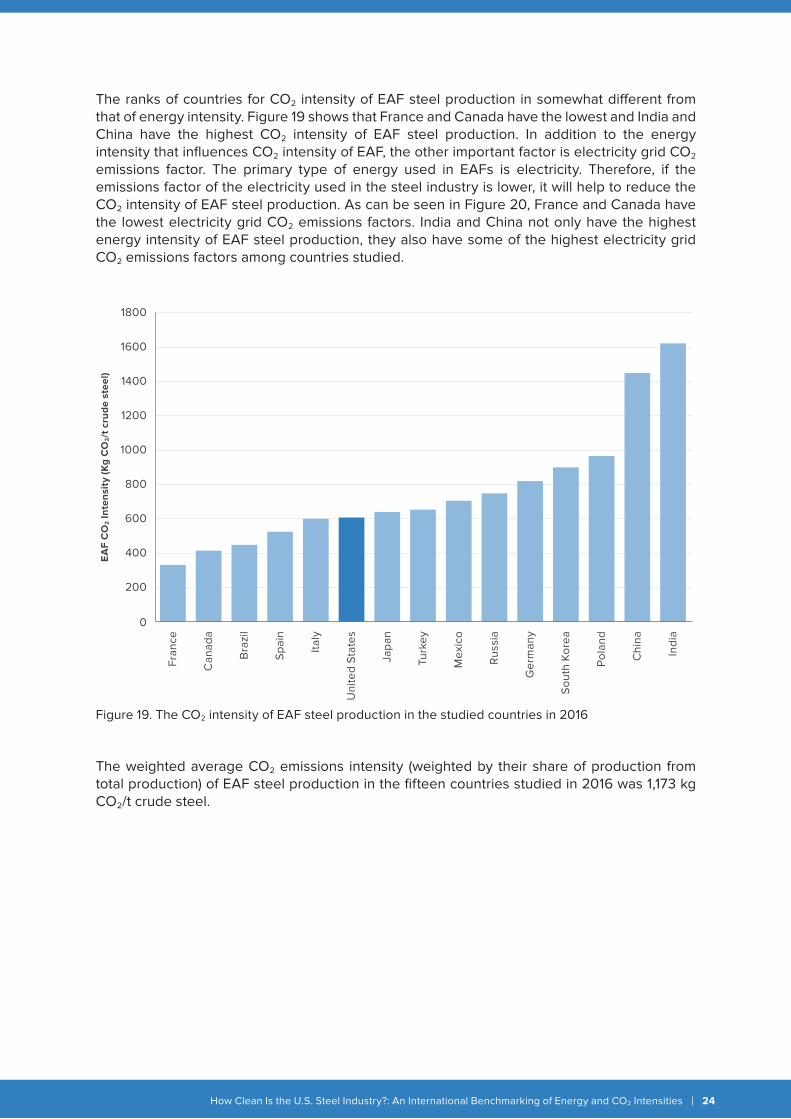
The ranks of countries for CO2 intensity of EAF steel production in somewhat di�erent from that of energy intensity. Figure 19 shows that France and Canada have the lowest and India and China have the highest CO2 intensity of EAF steel production. In addition to the energy intensity that influences CO2 intensity of EAF, the other important factor is electricity grid CO2 emissions factor. The primary type of energy used in EAFs is electricity. Therefore, if the emissions factor of the electricity used in the steel industry is lower, it will help to reduce the CO2 intensity of EAF steel production. As can be seen in Figure 20, France and Canada have the lowest electricity grid CO2 emissions factors. India and China not only have the highest energy intensity of EAF steel production, they also have some of the highest electricity grid CO2 emissions factors among countries studied.
The weighted average CO2 emissions intensity (weighted by their share of production from total production) of EAF steel production in the fifteen countries studied in 2016 was 1,173 kg CO2/t crude steel.
Figure 19. The CO2 intensity of EAF steel production in the studied countries in 2016
0
200
400
600
800
1000
1200
1400
1600
1800
EA
F C
O2 In
tens
ity
(Kg
CO
2/t
cru
de
stee
l)
Fran
ce
Can
ada
Bra
zil
Spa
in
Italy
Uni
ted
Sta
tes
Japa
n
Turk
ey
Mex
ico
Rus
sia
Ger
man
y
Sou
th K
orea
Pol
and
Chi
na
Indi
a
How Clean Is the U.S. Steel Industry?: An International Benchmarking of Energy and CO2 Intensities 25
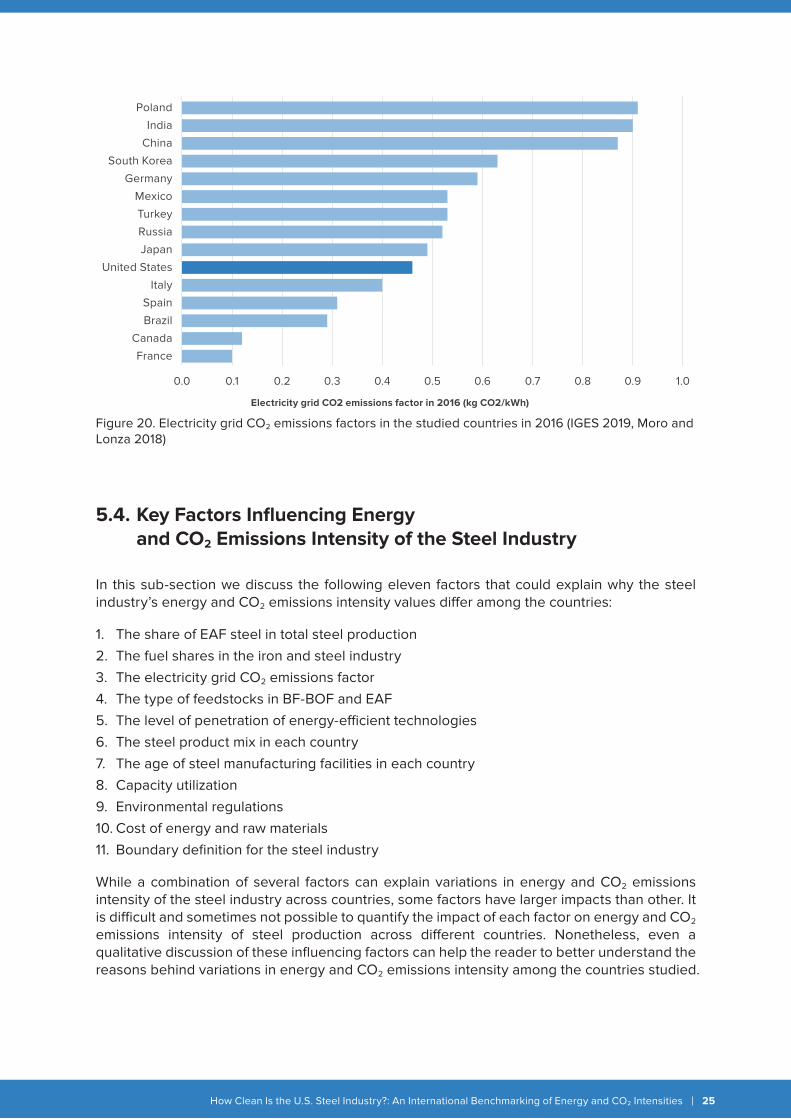
Figure 20. Electricity grid CO2 emissions factors in the studied countries in 2016 (IGES 2019, Moro and Lonza 2018)
In this sub-section we discuss the following eleven factors that could explain why the steel industry’s energy and CO2 emissions intensity values di�er among the countries:
1. The share of EAF steel in total steel production2. The fuel shares in the iron and steel industry3. The electricity grid CO2 emissions factor4. The type of feedstocks in BF-BOF and EAF5. The level of penetration of energy-e�cient technologies6. The steel product mix in each country7. The age of steel manufacturing facilities in each country8. Capacity utilization9. Environmental regulations10. Cost of energy and raw materials11. Boundary definition for the steel industry
While a combination of several factors can explain variations in energy and CO2 emissions intensity of the steel industry across countries, some factors have larger impacts than other. It is di�cult and sometimes not possible to quantify the impact of each factor on energy and CO2 emissions intensity of steel production across di�erent countries. Nonetheless, even a qualitative discussion of these influencing factors can help the reader to better understand the reasons behind variations in energy and CO2 emissions intensity among the countries studied.
5.4. Key Factors Influencing Energy and CO2 Emissions Intensity of the Steel Industry
0.0 0.1 0.2 0.3 0.4 0.5 0.6 0.7 0.8 0.9 1.0
Poland
India
China
South Korea
Germany
Mexico
Turkey
Russia
Japan
United States
Italy
Spain
Brazil
Canada
France
Electricity grid CO2 emissions factor in 2016 (kg CO2/kWh)
How Clean Is the U.S. Steel Industry?: An International Benchmarking of Energy and CO2 Intensities 26
5.4.1. The Share of EAF Steel in Total Steel ProductionThe structure of the steel manufacturing sector is one of the key variables that explains the di�erence in energy and CO2 emissions intensity. EAF is a secondary steel production process that primarily uses steel scrap and therefore uses less energy per unit of final product compared to BF-BOF. In other words, the higher share of EAF production help to reduce the overall energy intensity of the steel industry in a country. Figure 13 shows the di�erences in EAF steel production ratio across countries.
5.4.2. The Fuel Shares in the Iron and Steel IndustryThe share of di�erent fuels used in the iron and steel industry in the countries studied is an important factor that influences the industry CO2 emissions intensity because some fuels are more carbon intensive than others. For example, the higher share of natural gas used in Mexico and Canada (70 percent and 65 percent of total fuel used in steel industry, respectively) has helped the lower the CO2 emissions intensity of BF-BOF steel production in these two countries. Natural gas has a significantly lower emissions factor per unit of energy compared to coal and coke which are the primary type of energy used in the steel industry in many countries. Figure 17 shows the weighted average CO2 emissions factors of fuels in the steel industry in the studied countries in 2016.
5.4.3. The Electricity Grid CO2 Emissions FactorIn addition to the share of fuels used directly in the iron and steel industry, the fuel mix for power generation in each country is also an important factor, especially when we compare the CO2 emissions of the steel industry in the countries. The fuel mix becomes even more important in light of the significant di�erence in the share of EAF steel production among countries. Because the share of EAF steel production in Italy, Spain, Mexico, Turkey, and the U.S. is much higher than in the other countries, the share of steel-industry electricity use in total energy use is also higher in these four countries than in the other countries. In this case, the fuel mix for power generation in the country, and as the result the emissions factor of the grid (kg CO2/kWh), plays an important role when comparing the CO2 emissions of the iron and steel industry in these countries. Figure 20 shows the electricity grid CO2 emissions factors in the studied countries in 2016.
5.4.4. The Type of Feedstocks in BF-BOF and EAFThe main reason why the energy intensity of EAF steel production in India and China and Mexico are significantly higher than that in other countries is the type of feedstock used in EAF in these countries. In most countries, steel scrap is the primary feedstock to EAF. In India and Mexico, however, a substantial amount of DRI (around 40 percent of feedstock) is used as feedstock in EAFs (Worldsteel 2018). In China, instead of DRI, a significant amount of pig iron (around 45 percent of feedstock), which is produced by blast furnace, is used as feedstock in EAFs (Wang 2017, EBCSY 2011). Both DRI and pig iron production are highly energy-intensive processes, which result in higher energy intensity of EAF steel production when used as feedstock in EAFs. Finally, the quality of iron ore (Iron content, impurities, etc.) could also influence the energy use of the steel production.
5.4.5. The Level of Penetration of Energy-e�cient TechnologiesData on penetration of energy-e�cient and CO2 emissions reduction technologies and practices in countries are scarce and not fully comparable. The types of information available in these countries di�er, so direct comparison of the penetration of certain technologies is not possible. One direct comparison that is possible is the penetration of EAFs, which was presented above. The application of energy-e�cient and CO2 emissions reduction technologies depends on factors such as raw materials used, energy sources, energy and operation costs, product mix, and the regulatory regime in the country.
How Clean Is the U.S. Steel Industry?: An International Benchmarking of Energy and CO2 Intensities 27
For example, in China, the penetration of waste-heat and waste-energy recycling technologies and other energy e�cient technologies such as coke dry quenching (CDQ) for the coking process, top-pressure recovery turbines (TRTs) for BFs, pulverized coal injection, and continuous casting has helped to reduce the energy intensity of BF-BOF steel production in China. CDQ is a heat-recovery technology that produces electricity. Other technologies, such as low-temperature waste-heat recovery, are also being adopted in China. Many Chinese steel companies benefited from the Kyoto Protocol’s Clean Development Mechanism (CDM) and government financial incentives for additional funding to support CDQ and TRT projects in their plants. Such financial incentives may not be available in some of the countries studied.
5.4.6. The Steel Product Mix in Each CountryDi�erent steel products have di�erent energy requirements in the rolling/casting/finishing processes. Therefore, the product mix is another key factor that could influence the CO2 intensities among countries. Worldsteel (2018) shows the di�erences in the production of some of iron and steel industry products in the studied countries.
5.4.7. The Age of Steel Manufacturing Facilities in Each CountryThe average age of BOF vessels in the U.S. is over 30 years (AIST 2010). Even though the BOF vessels in the U.S. have been relined and other upgrades have been made, they are overall older than most of the steel production facilities in China and therefore could be less energy-e�cient than the Chinese facilities. India has the highest energy intensity of BF-BOF steel production mainly because of many old and ine�cient BF-BOF plants. It should be noted, however, that some of the newly built steel plants in India are among the world’s most e�cient, as they use latest state-of-the-art technologies.
5.4.8. Capacity UtilizationCapacity utilization of plants also a�ects the energy intensity and CO2 emissions intensity of steel production. Higher capacity utilization improves overall energy performance compared to lower capacity utilization if all other factors remain constant. Because it takes a long time and is costly to shut down and restart BFs, operators avoid shutting down for short periods and instead reduce production so that the BFs continue to work at less than full capacity. This reduces BF energy e�ciency and productivity and increases overall energy and CO2 intensities of steel production.
5.4.9. Environmental RegulationsThere are di�ering environmental requirements from country to country. Environmental regulations can a�ect industry CO2 emissions intensity by incentivizing di�erent operational and equipment choices. At the same time, operation of some pollution control equipment requires additional energy, which can also add CO2 emissions.
5.4.10. Cost of Energy and Raw MaterialsLow-cost energy and raw materials are key components of managing costs in the steel industry. Changing energy and materials sources in order to optimize costs can a�ect the CO2 and energy intensities of a plant. Also, the lower cost of energy in some countries provides less incentive for energy optimization and increases the payback period for energy e�ciency projects.
How Clean Is the U.S. Steel Industry?: An International Benchmarking of Energy and CO2 Intensities 28
5.4.11. Boundary DefinitionThe boundary definition for the steel industry might vary from country to country in their energy statistics. For example, some countries may report the energy use of the coke-making within the steel industry while some others may report it separately. For the countries we studied, we did not find separate data on energy use for coke-making in countries’ energy statistics, and we assumed it is reported under the steel industry. The steel industries in each country also vary in the amount of auxiliary/intermediary products such as sinter, coke, pig iron, DRI, oxygen, lime, etc. that they import from outside the industry (either domestically or internationally). Fortunately, for the main intermediary products, pig iron and DRI, we had the data for their net imports for each country. To have a more accurate and fair comparison, we took into account the embodied energy in net imported pig iron and DRI when calculating energy and CO2 emissions intensity for each country. For some other auxiliary/intermediary products, the net import data was not available for most countries and we could not include those in our analysis, but fortunately their impact on total energy and CO2 emissions intensity is not significant based on our earlier studies. Finally, the consumption of pellets in BFs can a�ect energy consumption. Pellets are produced at the iron ore mine sites and have a high iron content. If pellets replace sinter in BFs, the energy consumption decreases, since energy consumption for sinter making is omitted and also the higher iron content of the pellets.
How Clean Is the U.S. Steel Industry?: An International Benchmarking of Energy and CO2 Intensities 30
Conclusions6
The iron and steel industry accounts for around a quarter of GHG emissions from the global manufacturing sector. Global steel production has more than doubled between 2000 and 2018. China accounted for 51 percent of global steel production in 2018. The energy use and GHG emissions of the steel industry is likely to continue increasing because the increased demand for steel, particularly in developing countries, is outpacing the incremental decreases in energy and carbon dioxide (CO2) emissions intensity of steel production that are happening under the current policy and technology regime.
In this study we conduct a benchmarking analysis for energy and CO2 emissions intensity of the steel industry among the largest steel-producing countries. Because of the di�erence in structure of the steel industry among countries and variation in the share of EAF steel production, a single intensity value for the overall steel industry is not a good indicator of the e�ciency of the steel industry in a country. Therefore, in addition to calculating energy and CO2 intensities for the entire steel industry, we also calculated separately the intensities associated with the EAF and BF-BOF production routes in each country.
Our results show that when looking at the entire steel industry, Italy and Spain have the lowest and China has the highest energy and CO2 emissions intensities among the countries studied. Among several reasons, this is primarily because of significantly higher share of EAF steel production from total steel production in Italy and Spain and a very low share of EAF steel production in China. The U.S. steel industry’s final energy and CO2 emissions intensities rank 4th lowest among the countries studied.
When looking at the final energy intensity of BF-BOF steel production, Spain and China have the lowest and Poland and India have the highest energy intensity. For CO2 emissions intensity of BF-BOF steel production, however, Canada has the lowest and China has the third highest CO2 emissions intensity despite having a low energy intensity. One of the key factors for such results is the mix of fuel used in BF-BOF plants in each country. Canada has the second lowest and China has the highest weighted average CO2 emissions factors of fuels in the steel industry.
When looking at final energy intensity of EAF steel production, Brazil and Turkey have the lowest and China and India have the highest energy intensity. In China and India, a substantial amount of energy-intensive pig iron (in China) and DRI (in India) are used as feedstock in EAFs, which results in higher energy intensity steel produced by the EAF route in these countries. Finally, for the CO2 emissions intensity of EAF steel production, China and India still have the highest intensity, while France and Canada have the lowest CO2 emissions intensity of EAF steel production. One key factor that explains this is that the primary type of energy used in EAFs is electricity and France and Canada have the lowest electricity grid CO2 emissions factors. Their BF-BOF and EAF steel production’s energy and CO2 emissions intensities rank between 4th and 7th lowest among the countries studied.

How Clean Is the U.S. Steel Industry?: An International Benchmarking of Energy and CO2 Intensities 31
In view of the projected continuing increase in absolute steel production and the need for deep decarbonization of the steel industry to meet Paris Agreement targets, future reductions in absolute energy use and CO2 emissions will require innovation beyond technologies that are available today. New developments will likely include di�erent processes, fuels, and materials (e.g. hydrogen-direct reduction steelmaking using renewable energy to produce hydrogen and use it in DRI process) as well as technologies that can economically capture and store the industry’s CO2 emissions. Deployment of these new technologies in the market will be critical to the industry’s climate change mitigation strategies for the mid and long term. It should be noted that the technology adoption in regions around the world is also driven by other factors such as economic viability, raw materials availability, energy type used, and energy cost as well as regulatory regimes.
How Clean Is the U.S. Steel Industry?: An International Benchmarking of Energy and CO2 Intensities 32
AG Energiebilanzen e.V. (AGEB). 2017. Germany Energy Balance 2016.
Association for Iron and Steel Technology (AIST). 2010. 2010 North American BOF Roundup. Iron & Steel Technology. November.
Asia Pacific Partnership on Clean Development and Climate (APP). 2010. The State–of-the-Art Clean Technologies (SOACT) for Steelmaking Handbook. (2nd Edition).
General Directorate of Energy A�airs, Turkey (GDEA). 2017. national energy balance table in 2016 (in Turkish).
Birat, J.P., 2010. Steel sectoral report - Contribution to the UNIDO roadmap on CCS1 - fifth draft.
Central Statistics O�ce, India (CSO). 2018. Energy Statistics 2018 (twenty fifth issue). New Delhi.
Editorial Board of China Steel Yearbook (EBCSY). 2011. China Steel Yearbook-various years. Beijing, China (in Chinese)
Energetics. 2018. Manufacturing Energy and Carbon Footprint 2014- Iron and Steel Industry.
Eurostats. 2018. Energy Balances (2018 edition). Available at https://ec.europa.eu/eurostat/web/energy/data/energy-balances
Federal State Statistics Service of Russia (FSSS). 2017. Russian Statistical Yearbook 2016. (In Russian)
Hasanbeigi, A., Arens, M., Rojas-Cardenas, J., Price, L., Triolo, R. (2016). Comparison of Carbon Dioxide Emissions Intensity of Steel Industry in China, Germany, Mexico, and the United States. Resources, Conservation and Recycling. Volume 113, October 2016, Pages 127–139
Haslehner, R., Stelter, B., Osio, N. 2015. Steel as a Model for a Sustainable Metal Industry in 2050. Boston Consulting Group
Instituto Nacional de Estadistica y Geografía (INEGI). 2017. La industria Sidergúrgica en México. (in Spanish).
Institute for Global Environmental Strategies (IGES). 2019. IGES List of Grid Emission Factors. Available at https://iges.or.jp/en/pub/list-grid-emission-factor/en
Intergovernmental Panel on Climate Change (IPCC). 2006. 2006 IPCC Guidelines for National Greenhouse Gas Inventories, Prepared by the National Greenhouse Gas Inventories Programme, Eggleston H.S., Buendia L., Miwa K., Ngara T. and Tanabe K. (eds). Published: IGES, Japan.
International Energy Agency (IEA). 2019. IEA Technology Roadmap. The global iron and steel sector. International Energy Agency, 29th March 2019, Paris
International Energy Agency (IEA). 2018. World Energy Statistics 2018. Paris, France.
International Energy Agency (IEA). 2010. The Energy Technology Systems Analysis Program (ETSAP)- Technology Brief: Iron and Steel.
Korea Energy Economics Institute (KEEI). 2017. Energy Info Korea. Ulsan, South Korea.
References
How Clean Is the U.S. Steel Industry?: An International Benchmarking of Energy and CO2 Intensities 33
Hasanbeigi, A., Moran, D., Springer, C. 2018. The Carbon Loophole in Climate Policy: Quantifying the Embodied Carbon in Traded Products. San Francisco, CA. Global E�ciency Intelligence, LLC.
Ministry of Energy (MoE), Poland. 2017. Energy Statistics in 2015 and 2016.
Moro A. and Lonza, L. 2018. Electricity carbon intensity in European Member States: Impacts on GHG emissions of electric vehicles. Transportation Research Part D 64 (2018) 5–14.
National Bureau of Statistics (NBS), China. 2018. China energy statistical yearbook 2017.
Natural Resources Canada (NRC). 2018. Industrial Consumption of Energy Survey 2016.
Oda et al., 2012. International comparisons of energy e�ciency in power, steel, and cement industries, Energy Policy, 44, pp.118-129, 2012.
Research Institute of Innovative Technology for the Earth (RITE). 2012a. 2010 Energy intensity (Scrap-EAF; Iron and Steel Sector).
Research Institute of Innovative Technology for the Earth (RITE). 2012b. 2010 Energy intensity (Converter Steel; Iron and Steel Sector).
United Nations’ Statistics division (UN Statistics). 2018. Energy Balances of 2016. Available at https://unstats.un.org/unsd/energystats/pubs/balance/
U.S. Geological Survey (USGS). 2019a. Iron and Steel Summary.
U.S. Geological Survey (USGS). 2019b. Mineral Yearbook- 2016: Iron and Steel.
U.S. Department of Energy, Energy Information Administration (U.S. DOE/EIA). 2017. Manufacturing Energy Consumption Survey (MECS) - 2014 data. Washington, DC.
U.S. Environmental Protection Agency (U.S. EPA). 2010. Available and Emerging Technologies for Reducing. Greenhouse Gas Emissions from the Iron and Steel Industry.
Wang, W. 2017. 2016 China Steel Association unit steelmaking Technical review
Worldsteel Association. 2019a. World Crude Steel Production – Summary.
Worldsteel Association. 2019b. Fact sheet: Energy use in the steel industry.
Worldsteel Association. 2018. Steel statistical yearbook 2018.
Worldsteel Association. 2017. World steel in figures 2017.
How Clean Is the U.S. Steel Industry?: An International Benchmarking of Energy and CO2 Intensities 34
Appendices
For this study, we have conducted benchmarking of the energy intensity and CO2 emissions intensity of the U.S. iron and steel industry against that of the steel industry in fourteen other major steel producing countries. All the countries included in this study are among the top twenty steel producing countries in the world and combined accounted for 88% of world’s steel production in 2016. In addition, all major U.S. steel trading partners are included in this study. We used 2016 as the base year for our analysis except for the U.S., for which the latest o�cial data available is for 2014.
For the benchmarking study, we compared the energy and CO2 emissions intensity of the entire steel industry in these fifteen countries. In addition, to provide more in-depth insight and take into account the di�erences in steel industry structure in terms of type of process used, we conducted energy and CO2 emissions intensity benchmarking for BF-BOF and EAF steel production, separately. To have a more accurate and fair comparison, we also took into account the embodied energy in net imported pig iron and DRI when calculating energy and CO2 emissions intensity for each country.
Energy use of the steel industry by fuel type for each country is obtained from energy balances of each country: NBS (2018), CSO (2018), U.S. DOE/EIA (2017), GDEA (2017), FSSS (2017), AGEB (2017), INEGI (2017), NRC (2018), and MoE (2017). In some cases, the energy use of the steel industry reported in energy statistics of a country was either not available or not verifiable. In those cases, we used energy use data reported by Eurostats (2018), UN Statistics (2018), or IEA (2018). In a few cases, a combination of sources was used for energy use data of the steel industry that resulted in more accurate intensity values.
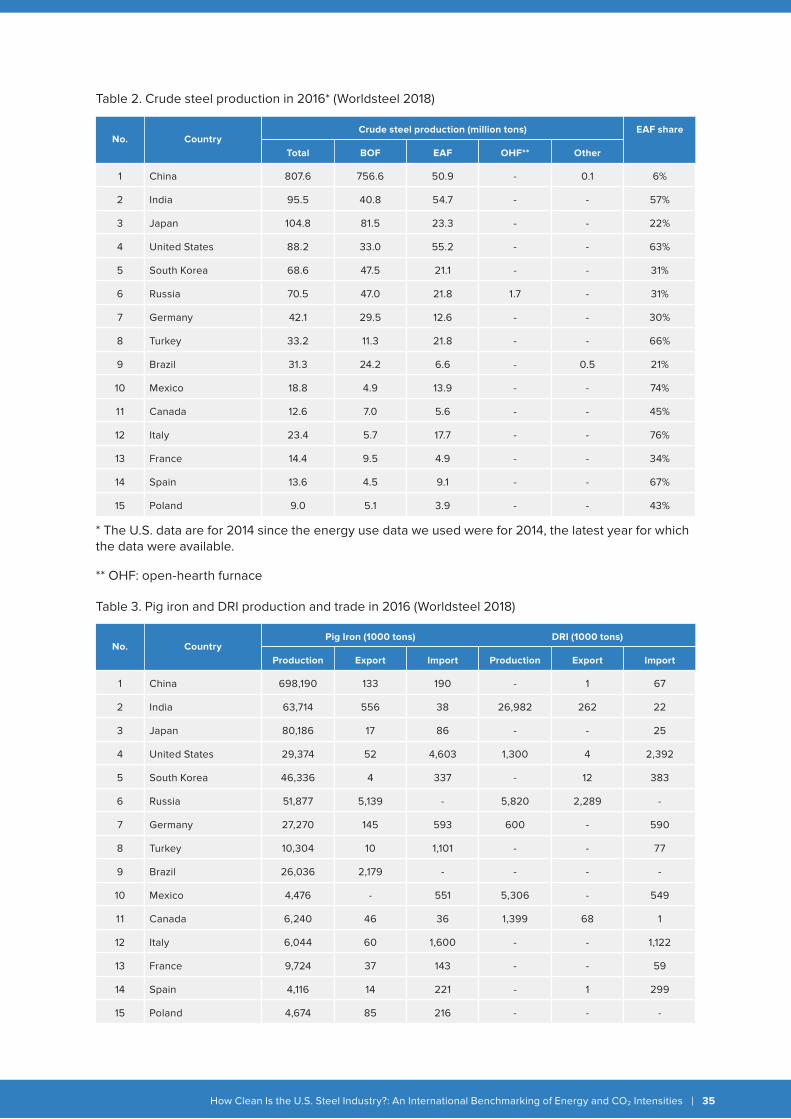
The production and trade data for the steel industry are from Worldsteel (2019a, 2018, 2017). Table 2 and Table 3 show the production and trade data for crude steel, pig iron, and DRI in the countries studied in 2016.
Fuel emissions factors are from the IPCC (2006) and electricity grid CO2 emissions factors in the studied countries in 2016 are from IGES (2019) and Moro and Lonza (2018).
First, we calculated the energy intensity of the entire steel industry in each country in 2016 using the steel industry energy use data we obtained from energy balances and production data from Worldsteel (2018). Then, we used the Fuel emissions factors and electricity grid CO2 emissions factors to convert energy intensities into CO2 emissions intensities.
Countries do not report the energy use of their steel industry by production route, i.e. BF-BOF and EAF, separately. Therefore, we had to estimate the energy intensity of BF-BOF and EAF steel production in each country using the following method. We used the energy intensity of BF-BOF and EAF steel production reported for di�erent countries in earlier studies such as RITE (2012a, b), Oda et al. (2012) and Hasanbeigi et al. (2016). Then, we adjusted these older energy intensities using overall energy intensity of the steel industry in 2016 calculated above and the share of EAF steel production in 2016. Other adjustments were made to calibrate the older BF-BOF and EAF energy intensities based on 2016 data. In addition, we used the values for net imported pig iron and DRI to adjust the BF-BOF and EAF intensities by taking into account the embodied energy in net imported pig iron and DRI.
Appendix 1. Methodology
How Clean Is the U.S. Steel Industry?: An International Benchmarking of Energy and CO2 Intensities 35
Table 2. Crude steel production in 2016* (Worldsteel 2018)
* The U.S. data are for 2014 since the energy use data we used were for 2014, the latest year for which the data were available.
** OHF: open-hearth furnace
Table 3. Pig iron and DRI production and trade in 2016 (Worldsteel 2018)
CountryCrude steel production (million tons) EAF share
Total BOF EAF OHF** OtherNo.
Poland 9.0 5.1 3.9 - - 43%15
Spain 13.6 4.5 9.1 - - 67%14
France 14.4 9.5 4.9 - - 34%13
Italy 23.4 5.7 17.7 - - 76%12
Canada 12.6 7.0 5.6 - - 45%11
Mexico 18.8 4.9 13.9 - - 74%10
Brazil 31.3 24.2 6.6 - 0.5 21%9
Turkey 33.2 11.3 21.8 - - 66%8
Germany 42.1 29.5 12.6 - - 30%7
Russia 70.5 47.0 21.8 1.7 - 31%6
South Korea 68.6 47.5 21.1 - - 31%5
United States 88.2 33.0 55.2 - - 63%4
Japan 104.8 81.5 23.3 - - 22%3
India 95.5 40.8 54.7 - - 57%2
China 807.6 756.6 50.9 - 0.1 6%1
CountryPig Iron (1000 tons) DRI (1000 tons)
Production Export Import Production Export ImportNo.
Poland 4,674 85 216 - - -15
Spain 4,116 14 221 - 1 29914
France 9,724 37 143 - - 5913
Italy 6,044 60 1,600 - - 1,12212
Canada 6,240 46 36 1,399 68 111
Mexico 4,476 - 551 5,306 - 54910
Brazil 26,036 2,179 - - - -9
Turkey 10,304 10 1,101 - - 778
Germany 27,270 145 593 600 - 5907
Russia 51,877 5,139 - 5,820 2,289 -6
South Korea 46,336 4 337 - 12 3835
United States 29,374 52 4,603 1,300 4 2,3924
Japan 80,186 17 86 - - 253
India 63,714 556 38 26,982 262 222
China 698,190 133 190 - 1 671
How Clean Is the U.S. Steel Industry?: An International Benchmarking of Energy and CO2 Intensities 36
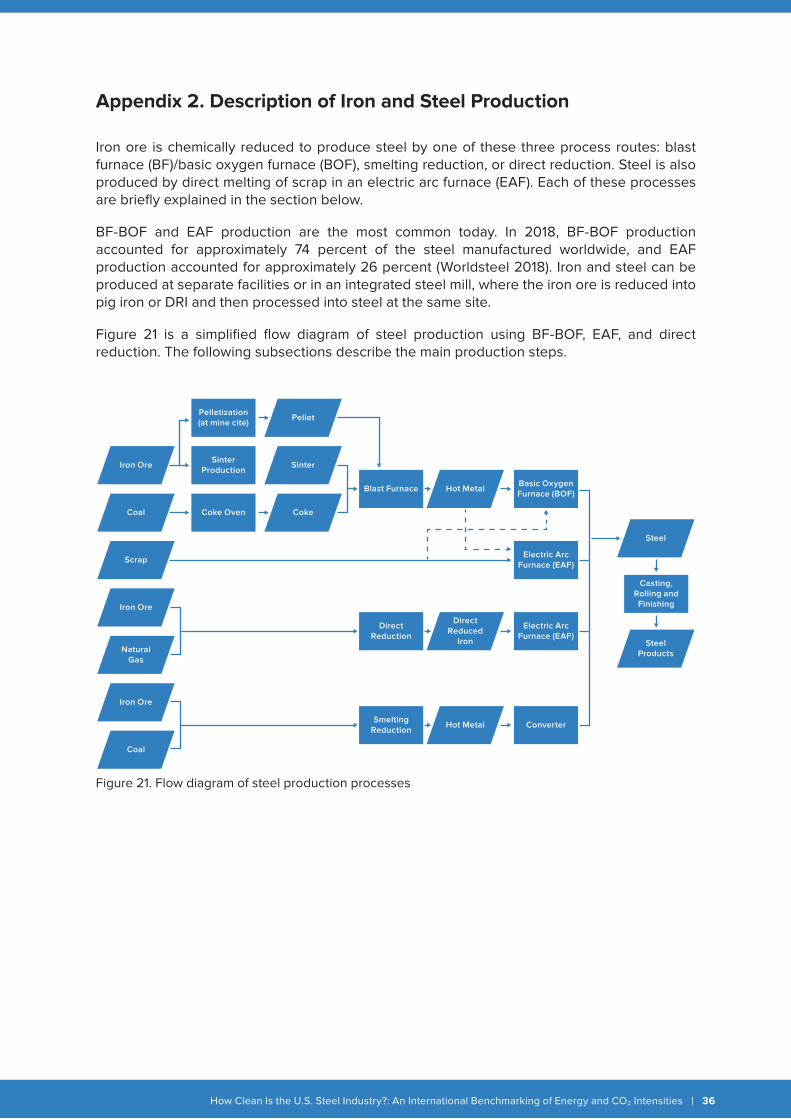
Iron ore is chemically reduced to produce steel by one of these three process routes: blast furnace (BF)/basic oxygen furnace (BOF), smelting reduction, or direct reduction. Steel is also produced by direct melting of scrap in an electric arc furnace (EAF). Each of these processes are briefly explained in the section below.
BF-BOF and EAF production are the most common today. In 2018, BF-BOF production accounted for approximately 74 percent of the steel manufactured worldwide, and EAF production accounted for approximately 26 percent (Worldsteel 2018). Iron and steel can be produced at separate facilities or in an integrated steel mill, where the iron ore is reduced into pig iron or DRI and then processed into steel at the same site.
Figure 21 is a simplified flow diagram of steel production using BF-BOF, EAF, and direct reduction. The following subsections describe the main production steps.
Appendix 2. Description of Iron and Steel Production
Figure 21. Flow diagram of steel production processes
Pelletization(at mine cite)
Pellet
Iron OreSinter
ProductionSinter
Coke
Blast Furnace Hot MetalBasic OxygenFurnace (BOF)
Steel
Casting,Rolling andFinishing
SteelProducts
Electric ArcFurnace (EAF)
Coke OvenCoal
Scrap
Iron Ore
DirectReduction
SmeltingReduction
Hot Metal Converter
DirectReduced
Iron
Electric ArcFurnace (EAF)
Iron Ore
NaturalGas
Coal
How Clean Is the U.S. Steel Industry?: An International Benchmarking of Energy and CO2 Intensities 37
A.2.1. Raw Materials The subsections below describe the preparation of raw materials for iron and steel production.
SinteringIn sintering, iron ore fines, other iron-bearing wastes, and coke dust are blended and combusted; the heat induces incipient fusion to convert the fines into coarse lumps (sinter) that can be used as raw material (charge) in a BF. Sintering enables manufacturers to use iron ore fines and other iron bearing wastes but requires a large capital investment and air pollution controls (APP 2010). Sinter plants are mostly located at integrated steelworks.
PelletizingIn pelletizing, iron ore is crushed and ground to remove impurities. The resulting beneficiated (iron-rich) ore is mixed with a binding agent and then heated to create durable, marble-sized pellets. These pellets can be used in both BF and direct reduction steel manufacturing (APP 2010). Pellet plants are mostly located at mining sites.
Coke MakingCoke is a carbon product formed by thermal distillation of metallurgical coal at high temperatures in the absence of air. Coke is produced in batteries of coke ovens. Coke is used to provide a reducing atmosphere in a BF and is also a source of fuel. One of the key characteristic of coke is its porosity which enables the gas exchange throughout the BF from the bottom to the top. Approximately one-third of the cleaned coke oven gas (COG) is used to fuel the coke ovens, and the remainder is used in other steel plant combustion units. Some newer coke plants use non-recovery coke ovens that burn rather than recover the byproducts. The new non-recovery coke plants capture combustion waste heat to generate steam and electricity. The primary CO2 emissions point at coke plants is the combustion stack from the ovens (U.S. EPA 2010).
A.2.2. IronmakingThe subsections below describe three ironmaking processes, i.e. the BF, direct reduction, and smelting reduction processes.
Blast FurnaceA BF is a huge shaft furnace that is top fed with iron ore, coke, and limestone. These materials form alternating layers in the furnace and are supported on a bed of incandescent coke. Hot air is blown through an opening into the bottom of the furnace and passes through the porous bed. The coke combusts, producing heat and carbon monoxide (CO) gas. The heat melts the charge, and the CO removes the oxygen from the iron ore, producing hot metal1. Hot metal is a solution of molten iron at approximately 1,480ºC, which contains 4 percent carbon and some Silicon. This hot metal flows to the bottom of the furnace, through the coke bed and is periodically “tapped” from the furnace into transfer cars and transported to the BOF where it is refined into steel. The BF is the most energy-intensive step in the BF-BOF steelmaking process, generating large quantities of CO2 (AISI 2010).
1 When hot metal is allowed to solidify in a pig iron casting machine, the resultant solid iron is called pig iron.
How Clean Is the U.S. Steel Industry?: An International Benchmarking of Energy and CO2 Intensities 38
Direct ReductionDirect reduction is the removal (reduction) of oxygen from iron ore in its solid state. This technology encompasses a broad group of processes based on di�erent feedstocks, furnaces, reducing agents, etc. Natural gas (and in some cases coal) is used as a reducing agent to enable this process. The metallization rate of the end product, called Direct Reduced Iron (DRI) or ‘sponge iron’, ranges from 85 percent to 95 percent (often even higher). Around two third of DRI is produced using the MIDREX technology. The MIDREX process typically consists of four stages: 1) reduction, 2) reforming, 3) heat recovery, and 4) briquette making. A mixture of pellets or lump ore, possibly including up to 10 percent fine ore, enters the furnace shaft. As the ore descends, oxygen is removed by counter-flowing reduction gas, which is enriched with hydrogen and CO. The iron is then formed into briquettes, and heat from the process is recovered (IEA 2010).
Smelting ReductionSmelting reduction iron (SRI) is an alternative to the BF, as it also produces liquid iron. Smelting reduction was developed to overcome the need for the energy-intensive products- coke and sinter (if sinter is used in BF). Instead smelting reduction is aimed to use coal and iron fines. Several processes are under development; some have been commercially proven (COREX, FINEX, ITmk3), others are under demonstration (e.g. Hismelt). Iron ore first undergoes a solid-state reduction in a pre-reduction unit. The resulting product at this stage - similar to DRI - is then smelted and further reduced in the smelting reduction vessel where coal is gasified, producing heat and CO-rich hot gas that can be further oxidized to generate additional heat to smelt the iron. Coal gasification is the result of a reaction with oxygen and iron ore in a liquid state. The heat is used to smelt iron and the hot gas is transported to the pre-reduction unit to reduce the iron oxides that enter the process. This process is called post-combustion and leads to a tradeo� in the utilization of the gas between increased pre-reduction potential or increased heat delivery for smelting. Commercial smelting reduction is still dominated by first-generation processes, notably the COREX process developed in Germany and Austria (IEA 2010).
A.2.3. SteelmakingThe subsections below describe the steelmaking process with BOF or EAF.
Basic Oxygen Furnace (BOF)The BOF converts liquid hot metal from the BF into steel. The main operation is the addition of oxygen to remove carbon from the hot metal. In recent years, extensive ladle metallurgy processes have been developed to improve steel quality. Few energy data are available for these operations. A BOF uses virtually no energy and does not produce net energy.
Electric Arc Furnace (EAF)EAFs are mainly used to produce steel by recycling ferrous scrap. But also DRI and pig iron can be fed to the EAF as a scrap substitute. EAFs are equipped with carbon electrodes that can be raised or lowered through the furnace roof to provide the necessary energy by an electric arc. Energy consumption in EAF-steelmaking is much lower, as the energy-intense reduction of iron ore has already been carried out in the BF (or in the DRI or SR plant). EAF steelmaking can use a wide range of scrap types, direct reduced iron (DRI), pig iron and molten iron (up to 30 percent) as the feed charge. The liquid steel from an EAF is generally sent to a Ladle Metallurgy Station (LMS) now-a-days to improve the steel quality. Recycling of scrap into steel saves virgin raw materials as well as the energy required for converting them (APP 2010).

How Clean Is the U.S. Steel Industry?: An International Benchmarking of Energy and CO2 Intensities 39
A.2.4. Casting, Rolling, and FinishingThe molten steel produced by both BOFs and EAFs follows similar routes after leaving the furnace: it is transferred from the LMS to the continuous caster, which forms the steel into semi-finished shapes (e.g., slabs, blooms, billets, rounds, and other special sections). Steel from the continuous caster is mainly processed in rolling mills to produce the final shapes that are sold by the steel mill. These shapes include coiled strips, rails, sheets, many structural shapes, rods and bars. Because rolling mills consume electricity, they contribute to indirect greenhouse gas emissions. Fossil fuels (e.g. natural gas) are consumed in furnaces to reheat the steel before rolling. The products from the hot rolling mill may be further processed in various ways, such as annealing, hot forming, cold rolling, heat treating (tempering), pickling, galvanizing, coating, or painting. The furnaces are custom designed for the type of steel, the dimensions of the semi-finished steel pieces, and the desired temperature (U.S. EPA 2010).
How Clean Is the U.S. Steel Industry?: An International Benchmarking of Energy and CO2 Intensities 40
BF blast furnace
BOF basic oxygen furnace
CDQ coke dry quenching
CO2 carbon dioxide
DRI direct-reduced iron
EAF electric arc furnace
EIA Energy Information Administration (U.S. Department of Energy)
EU European Union
GHG greenhouse gas
GJ gigajoule
IEA International Energy Agency
IPCC Intergovernmental Panel Climate Change
kton Kilo tonne (1000 metric tonne)
MJ megajoule
Mt million metric tonne
TRT top-pressure recovery turbine
Worldsteel Worldsteel Association
Appendix 3. List of Acronyms
How Clean Is the U.S. Steel Industry?: An International Benchmarking of Energy and CO2 Intensities 41
Figure 1. Steelmaking production routes (Worldsteel 2019b) 6
Figure 2. Crude steel production in China and rest of the world, 2000-2018 (Worldsteel 2018, 2019a) 8
Figure 3. Top 10 steel producing countries in 2018 (Worldsteel 2019a) 9
Figure 4. Crude steel production in the U.S. by production routes, 200-2018 (Worldsteel 2018, 2019a) 9
Figure 5. Share of each industry in total world industrial energy use and CO2 emissions in the world in 2017 (IEA 2019) 10
Figure 6. Share of di�erent energy types used in the U.S. steel industry in 2014 U.S. (DOE/EIA 2017) 10
Figure 7. Final energy end-uses in the U.S. steel industry in 2014 (Energetics 2018) 1 1
Figure 8. Breakdown of motor systems energy use in the U.S. steel industry in 2014 (Energetics 2018) 1 1
Figure 9. CO2 emissions from typical integrated BF-BOF steel plant (Birat 2010) 12
Figure 10. Top 10 countries from which the U.S. imported steel in 2016 (USGS 2019b) 15
Figure 11. Top 10 countries to which the U.S. exported steel in 2016 (USGS 2019b) 15
Figure 12. Total final energy intensity of the steel industry in the studied countries in 2016 18
Figure 13. The share of EAF from total steel production in the studied countries in 2016 19
Figure 14. Total CO2 emissions intensity of the steel industry in the studied countries in 2016 20
Figure 15. Final energy intensity of BF-BOF steel production in the studied countries in 2016 21
Figure 16. The CO2 intensity of BF-BOF steel production in the studied countries in 2016 22
Figure 17. Weighted average CO2 emissions factors of fuels in the steel industry in the studied countries in 2016 22
Figure 18. Final energy intensity of EAF steel production in the studied countries in 2016 23
Figure 19. The CO2 intensity of EAF steel production in the studied countries in 2016 24
Figure 20. Electricity grid CO2 emissions factors in the studied countries in 2016 (IGES 2019, Moro and Lonza 2018) 25
Figure 21. Flow diagram of steel production processes 36
Table 1. Top 20 importers and exporters of steel in 2016 (Worldsteel 2017) 14
Table 2. Crude steel production in 2016* (Worldsteel 2018) 35
Table 3. Pig iron and DRI production and trade in 2016 (Worldsteel 2018) 35
Appendix 4. List of Figures and Tables