Embed Size (px)
Citation preview

ISSN 1995-2848
OECD Journal: Economic Studies
Volume 2009
© OECD 2009
How Competitive is Product Market Regulation in India? An International
and Cross-state Comparison
byPaul Conway and Richard Herd
Paul Conway is an independent economist and consultant to the OECD
([email protected]). Richard Herd is Head of the India Desk at the OECD
([email protected]). We would like to thank Sean Dougherty, Vincent Koen, Willi Leibfritz,
Giuseppe Nicoletti, Stefano Scarpetta and Jean-Luc Schneider for useful comments on an
earlier draft of this paper. Thanks also go to Thomas Chalaux for statistical assistance and
Nadine Dufour for secretarial support. We are also most grateful to Dr. Simrit Kaur who was
the principal consultant based in Delhi working on the PMR indicators for India.
Introduction. . . . . . . . . . . . . . . . . . . . . . . . . . . . . . . . . . . . . . . . . . . . . . . . . . . . . 2
The overall stance of product market regulation in India . . . . . . . . . . . . . . 4
At the national level . . . . . . . . . . . . . . . . . . . . . . . . . . . . . . . . . . . . . . . . . . 4
At the state level . . . . . . . . . . . . . . . . . . . . . . . . . . . . . . . . . . . . . . . . . . . . . 4
Regulation and economic performance across Indian states . . . . . . . . . . . 6
Potential transmission channels . . . . . . . . . . . . . . . . . . . . . . . . . . . . . . . 8
The low-level indicators and areas in need of reform . . . . . . . . . . . . . . . . . 10
State control . . . . . . . . . . . . . . . . . . . . . . . . . . . . . . . . . . . . . . . . . . . . . . . . 10
Barriers to entrepreneurship. . . . . . . . . . . . . . . . . . . . . . . . . . . . . . . . . . . 14
Barriers to international trade and investment . . . . . . . . . . . . . . . . . . . 18
Notes. . . . . . . . . . . . . . . . . . . . . . . . . . . . . . . . . . . . . . . . . . . . . . . . . . . . . . . . . . . 20
Bibliography. . . . . . . . . . . . . . . . . . . . . . . . . . . . . . . . . . . . . . . . . . . . . . . . . . . . . 21
Annex A1. Data Annex. . . . . . . . . . . . . . . . . . . . . . . . . . . . . . . . . . . . . . . . . . . . 24
1

HOW COMPETITIVE IS PRODUCT MARKET REGULATION IN INDIA? AN INTERNATIONAL AND CROSS-STATE COMPARISON
IntroductionSince the mid-1980s, successive waves of reform have progressively moved India
away from its former dirigiste economic model towards a market-based system. The reform
of regulations that shape the business environment in markets for goods and services
– henceforth referred to as product market regulation – has been an integral part of this
transformation. As in a number of developed and developing countries, this reform process
has been closely intertwined with increasing the extent of competition in product markets.
State intervention and control over economic activity has been significantly reduced and
the role of private-sector entrepreneurship increased.
Although India has clearly made significant progress in liberalising product markets,
the extent to which regulations are conducive to competition is still an important concern
and a number of national and international surveys have highlighted weaknesses in India’s
business environment.1 As well as being an issue at the national level, the degree to which
the regulatory environment is supportive of competition is also an important concern at
the state level. India’s constitution mandates direct responsibility for a number of areas of
economic policy to the state governments as well as shared responsibility with central
government in a number of other areas.2 Accordingly, state governments may implement
their own laws in certain areas, or amend central legislation prior to implementation.
Moreover, the state governments usually formulate and administer the rules and
procedures through which all laws are enforced. As a result, differing views across state
governments on the role of the public sector and the efficiency with which laws and
regulations are administered can lead to considerable differences in the business
environment across states.
This paper assesses the extent to which India’s regulatory environment promotes or
inhibits competition in markets where technology and market conditions make
competition viable. The analysis is based on the OECD’s indicators of Product Market
Regulation (PMR) which have been used extensively over the last decade to benchmark
regulatory frameworks in OECD countries and have proven useful in encouraging countries
to implement structural reforms that enhance economic performance.3 The PMR system
summarises information on a large number of economy-wide and industry-specific
regulatory provisions that have a bearing on competition. The system is based on 16 low-
level indicators that collectively span most of the important aspects of general regulatory
practice. These low-level indicators fall into three broad regulatory areas: i) state control;
ii) barriers to entrepreneurship; and iii) barriers to international trade and investment. At the top
of the PMR structure, the overall indicator serves as a summary statistic of the overall
stance of product market regulation.
The PMR indicators have a number of characteristics that differentiate them from
other indicators of the business environment. First, in principle, the low-level indicators
only record “objective” information about rules and regulations, as opposed to “subjective”
assessments of market participants as in indicators based on opinion surveys. This isolates
OECD JOURNAL: ECONOMIC STUDIES – ISSN 1995-2848 – © OECD 20092

HOW COMPETITIVE IS PRODUCT MARKET REGULATION IN INDIA? AN INTERNATIONAL AND CROSS-STATE COMPARISON
the indicators from context-specific assessments and makes them comparable across time
and countries. Second, the PMR indicators follow a bottom-up approach, in which indicator
values can be related to specific underlying policies. One of the advantages of this system
is that the values of higher-level indicators can be traced with an increasing degree of
detail to the values of the more disaggregated indicators and, eventually, to specific data
points in the regulation database. This is not possible with indicator systems based on
opinion surveys, which can identify perceived areas of policy weakness, but are less able to
relate these to specific policy settings.
As well as benchmarking India’s regulatory environment relative to OECD and a
number of other countries, a modified version of the PMR indicators is also estimated for
21 states, which collectively encompass around 98% of both India’s GDP and population.4
The results of this analysis indicate that there is still considerable scope for improving the
extent to which product market regulations allow competitive market forces to operate in
India. Although reforms over the past 20 years have aligned regulations in a few areas with
international best practice, the overall stance of product market regulation remains much
more restrictive than in a typical OECD country. At the state level the PMR indicators
confirm that cross-state differences in product market regulation are significant. In broad
terms, changing the governance structure for public-sector enterprises, reducing
administrative burdens on enterprises, and ongoing consolidation of tariff rates and
ceilings on foreign investment would go a long way towards increasing the extent of
competition in India’s product markets.
The paper also draws on recent work on regulation and economic performance and
finds that the Indian experience is generally consistent with previous findings on the
impact of product market regulation on productivity in both OECD and developing
countries. In particular, states in which the regulatory environment is relatively supportive
of competition are found to have higher productivity than relatively restrictive states. This
result adds to the growing consensus in the literature of a positive relationship between
liberal regulatory regimes and improvements in productivity performance.
The paper goes on to consider a number of channels through which the regulatory
environment might influence productivity at the state level. States with relatively liberal
regulatory settings are found to attract more foreign direct investment, have better
infrastructure, and a larger share of employment in the organised sector relative to more
restrictive states. This implies that liberalising markets and increasing competition in less
productive states would improve resource allocation and stimulate innovation and
technological diffusion from more to less productive states. This would help ensure that
the benefits of India’s economic transformation spread throughout the national economy,
which is an important key to reducing poverty (OECD, 2007). In the relatively more liberal
states and at the centre, the challenge is to further improve business framework conditions
towards those in the OECD area so as to hasten the international diffusion of more
productive production techniques. These are potentially crucial sources of productivity
growth in India and, as in the OECD and other countries; the extent to which regulations
are conducive to competition will be a central determinant of India’s future growth rate.
The remainder of the paper is structured as follows. A second section briefly outlines
the indicator results at the national and state level. It also compares the PMR indicator
results at the state level with entrepreneurs’ perception of the investment climate and
finds that they are generally consistent. The third section contrasts the impact of
OECD JOURNAL: ECONOMIC STUDIES – ISSN 1995-2848 – © OECD 2009 3
HOW COMPETITIVE IS PRODUCT MARKET REGULATION IN INDIA? AN INTERNATIONAL AND CROSS-STATE COMPARISON
States
3
9
0
3
regulation on productivity performance across Indian states with similar work on OECD
and other countries. A number of channels through which product market regulation
might influence state economic performance are also considered. In the final section, the
detailed indicator results are used to outline a number of regulatory areas where policy
changes would help increase competition and improve economic performance.
The overall stance of product market regulation in India5
At the national level
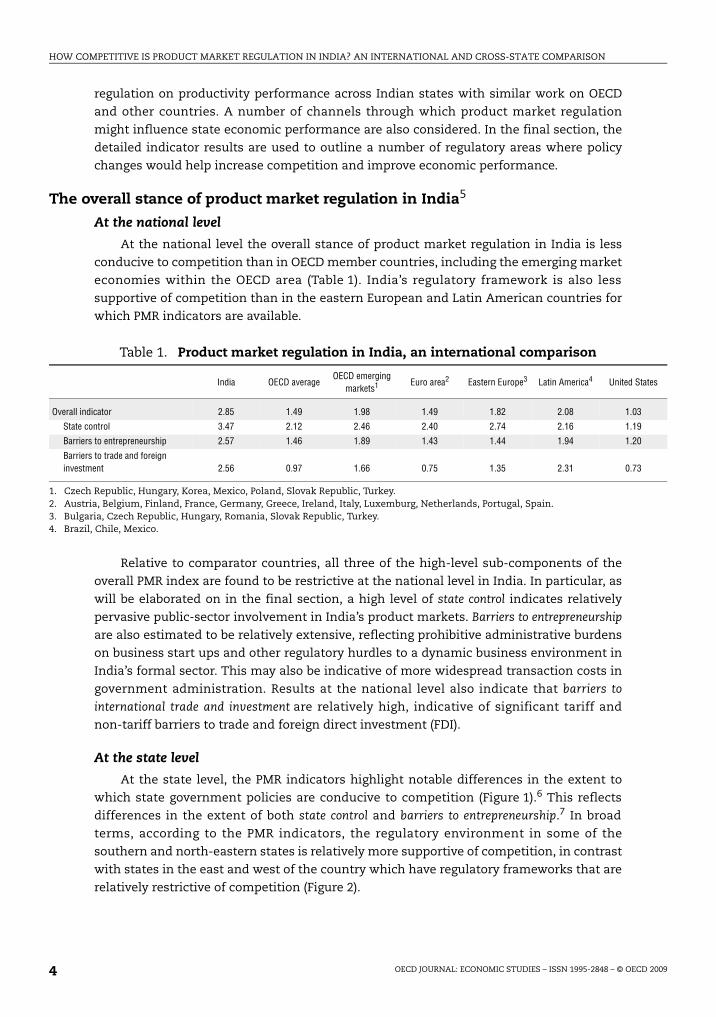
At the national level the overall stance of product market regulation in India is less
conducive to competition than in OECD member countries, including the emerging market
economies within the OECD area (Table 1). India’s regulatory framework is also less
supportive of competition than in the eastern European and Latin American countries for
which PMR indicators are available.
Relative to comparator countries, all three of the high-level sub-components of the
overall PMR index are found to be restrictive at the national level in India. In particular, as
will be elaborated on in the final section, a high level of state control indicates relatively
pervasive public-sector involvement in India’s product markets. Barriers to entrepreneurship
are also estimated to be relatively extensive, reflecting prohibitive administrative burdens
on business start ups and other regulatory hurdles to a dynamic business environment in
India’s formal sector. This may also be indicative of more widespread transaction costs in
government administration. Results at the national level also indicate that barriers to
international trade and investment are relatively high, indicative of significant tariff and
non-tariff barriers to trade and foreign direct investment (FDI).
At the state level
At the state level, the PMR indicators highlight notable differences in the extent to
which state government policies are conducive to competition (Figure 1).6 This reflects
differences in the extent of both state control and barriers to entrepreneurship.7 In broad
terms, according to the PMR indicators, the regulatory environment in some of the
southern and north-eastern states is relatively more supportive of competition, in contrast
with states in the east and west of the country which have regulatory frameworks that are
relatively restrictive of competition (Figure 2).
Table 1. Product market regulation in India, an international comparison
India OECD averageOECD emerging
markets1 Euro area2 Eastern Europe3 Latin America4 United
Overall indicator 2.85 1.49 1.98 1.49 1.82 2.08 1.0
State control 3.47 2.12 2.46 2.40 2.74 2.16 1.1
Barriers to entrepreneurship 2.57 1.46 1.89 1.43 1.44 1.94 1.2
Barriers to trade and foreign investment 2.56 0.97 1.66 0.75 1.35 2.31 0.7
1. Czech Republic, Hungary, Korea, Mexico, Poland, Slovak Republic, Turkey.2. Austria, Belgium, Finland, France, Germany, Greece, Ireland, Italy, Luxemburg, Netherlands, Portugal, Spain.3. Bulgaria, Czech Republic, Hungary, Romania, Slovak Republic, Turkey.4. Brazil, Chile, Mexico.
OECD JOURNAL: ECONOMIC STUDIES – ISSN 1995-2848 – © OECD 20094

HOW COMPETITIVE IS PRODUCT MARKET REGULATION IN INDIA? AN INTERNATIONAL AND CROSS-STATE COMPARISON
Figure 1. Product market regulation at the state level
Figure 2. Overall PMR indicator by state
0
0.5
1.0
1.5
2.0
2.5
3.0
State control Barriers to entrepreneurship
Goa
Haryan
a
Mahara
shtra
Delhi
Tamil N
adu
Punjab
Uttaran
chal
Karnata
ka
Jhark
hand
Uttar P
rades
h
Madhy
a Prad
esh
Andhr
a Prad
esh
Himac
hal P
rades
hKera
laBiha
r
Assam
Rajasth
anOris
sa
Chhatt
isgarh
Gujarat
West B
enga
l
1st quartile: relatively liberal
2nd quartile: middle of the road-relatively liberal
3rd quartile: middle of the road-relatively restrictive
4th quartile: relatively restrictive
OECD JOURNAL: ECONOMIC STUDIES – ISSN 1995-2848 – © OECD 2009 5

HOW COMPETITIVE IS PRODUCT MARKET REGULATION IN INDIA? AN INTERNATIONAL AND CROSS-STATE COMPARISON
This pattern of product market regulation across states is generally consistent with more
subjective perception-based assessments of the investment climate. For example, when the
World Bank’s ranking of entrepreneurs’ perception of investment climate across Indian states
are regressed on the PMR indicators, the latter are highly significant, even though the number
of observations is very small (Table 2).8 The way in which regulations are enforced may also be
an important determinant of perception-based assessments of the investment climate.
However, measuring enforcement effects in isolation is conceptually difficult. Indicators of the
extent of corruption at the state level may provide a proxy for state governments’ approach to
policy enforcement. When an indicator of the extent of corruption at the state level is added to
the regression, it is significant at the 10% level and the R2 indicates a good fit that is much
higher than in an equation with only the PMR indicators on the right-hand side. This suggests
that enforcement, as proxied by the corruption measure, may help explain differences
between regulations per se and investor perceptions of the business environment.9
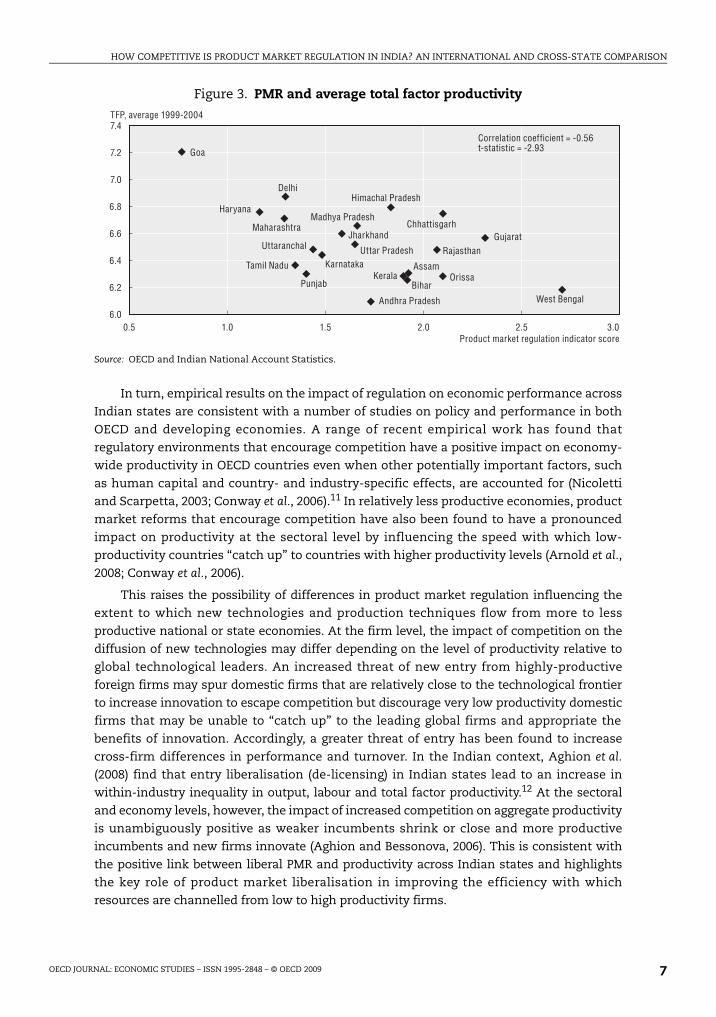
Regulation and economic performance across Indian statesAs well as explaining entrepreneurs’ perception of the investment climate, empirical work
using the PMR indicators implies that the extent to which the regulatory environment
supports competition has a significant impact on economic performance at the state level in
India. For example, there is a clear negative relationship between the stringency of product
market regulation and total factor productivity across states (Figure 3). Confirming this result,
Conway et al. (2008) estimate a model of productivity catch-up and find that cross-state
differences in the regulatory environment, as measured by the PMR indicators, have a
significant impact on both labour and total factor productivity in the state economies. States
where the regulatory environment is less conducive to competition exhibit lower productivity
growth in comparison to states in which regulation is more supportive of competition. This
implies that inappropriate regulatory settings impinge on the ability of the state economies to
reap the full benefits of economic reforms undertaken at the national level.
These results are in line with the emerging consensus in the existing literature that cross-
state differences in the business environment significantly affect various aspects of economic
performance at the state level in India. For example, World Bank-CII (2002) finds that states
with a better investment climate attract more investment and are more productive. Purfield
(2006) finds that the characteristics of the state business environment – such as the GDP share
of government expenditure and transmission and distribution losses of electricity – have a
significant negative effect on state per capita income. Veeramani and Goldar (2004) find that
poor governance is associated with low productivity growth across states.10 Aghion et al. (2008)
find that dismantling the license raj lead to increased industrial growth in states with relatively
liberal labour market institutions.
Table 2. Impact of regulation and enforcement on entrepreneurs’ perception of the business environment
Dependent variable: entrepreneurs’ perception of the business environment
Product market regulation 1.038*** 0.667*
Enforcement 0.435*
Observations 10 10
R-squared 0.55 0.71
* significant at 10%; *** significant at 1%.
OECD JOURNAL: ECONOMIC STUDIES – ISSN 1995-2848 – © OECD 20096
HOW COMPETITIVE IS PRODUCT MARKET REGULATION IN INDIA? AN INTERNATIONAL AND CROSS-STATE COMPARISON
In turn, empirical results on the impact of regulation on economic performance across
Indian states are consistent with a number of studies on policy and performance in both
OECD and developing economies. A range of recent empirical work has found that
regulatory environments that encourage competition have a positive impact on economy-
wide productivity in OECD countries even when other potentially important factors, such
as human capital and country- and industry-specific effects, are accounted for (Nicoletti
and Scarpetta, 2003; Conway et al., 2006).11 In relatively less productive economies, product
market reforms that encourage competition have also been found to have a pronounced
impact on productivity at the sectoral level by influencing the speed with which low-
productivity countries “catch up” to countries with higher productivity levels (Arnold et al.,
2008; Conway et al., 2006).
This raises the possibility of differences in product market regulation influencing the
extent to which new technologies and production techniques flow from more to less
productive national or state economies. At the firm level, the impact of competition on the
diffusion of new technologies may differ depending on the level of productivity relative to
global technological leaders. An increased threat of new entry from highly-productive
foreign firms may spur domestic firms that are relatively close to the technological frontier
to increase innovation to escape competition but discourage very low productivity domestic
firms that may be unable to “catch up” to the leading global firms and appropriate the
benefits of innovation. Accordingly, a greater threat of entry has been found to increase
cross-firm differences in performance and turnover. In the Indian context, Aghion et al.
(2008) find that entry liberalisation (de-licensing) in Indian states lead to an increase in
within-industry inequality in output, labour and total factor productivity.12 At the sectoral
and economy levels, however, the impact of increased competition on aggregate productivity
is unambiguously positive as weaker incumbents shrink or close and more productive
incumbents and new firms innovate (Aghion and Bessonova, 2006). This is consistent with
the positive link between liberal PMR and productivity across Indian states and highlights
the key role of product market liberalisation in improving the efficiency with which
resources are channelled from low to high productivity firms.
Figure 3. PMR and average total factor productivity
Source: OECD and Indian National Account Statistics.
6.0
6.2
6.4
6.6
6.8
7.0
7.2
7.4
Product market regulation indicator score0.5 1.0 1.5 2.0 2.5 3.0
Andhra Pradesh
Assam
Bihar
Chhattisgarh
Delhi
Goa
Gujarat
HaryanaHimachal Pradesh
Jharkhand
KarnatakaKerala
Madhya PradeshMaharashtra
OrissaPunjab
Rajasthan
Tamil Nadu
Uttar PradeshUttaranchal
West Bengal
TFP, average 1999-2004
Correlation coefficient = -0.56t-statistic = -2.93
OECD JOURNAL: ECONOMIC STUDIES – ISSN 1995-2848 – © OECD 2009 7

HOW COMPETITIVE IS PRODUCT MARKET REGULATION IN INDIA? AN INTERNATIONAL AND CROSS-STATE COMPARISON
Although much of the work on the impact of regulation on productivity catch-up has
developed outside the context of transition economies, a number of studies find that
regulation is also an important determinant of economic performance in these countries.
For example, Aghion et al. (2002) argue that transition economies are likely to have a
relatively large number of state-owned or newly privatised firms run by “satisficing”
managers who are more interested in minimising effort than maximising efficiency and
profits. As regulation becomes more conducive to competition, these firms are confronted
with the need to restructure and innovate in order to survive. Accordingly, the impact of
reform on economic performance via improved corporate governance is likely to be
relatively large in transition economies.
Potential transmission channels
It would seem that poor product market regulation in Indian states reduces firms’
incentives to invest and enhance efficiency. Casual empiricism suggests a number of
reasons why states with a relatively more liberal regulatory environment have higher
productivity growth. First, the location of FDI is negatively related to product market
restrictions, with the relatively more liberal states receiving virtually all of India’s FDI
inflows (Figure 4, Panel A). This is consistent with a growing body of recent research
that finds the regulatory environment to be a key determinant of FDI. As shown in
Nicoletti et al. (2003), regulatory policies that restrict market access in one way or another
negatively influence the share of FDI in OECD countries. Conway et al. (2006) find that the
employment share of foreign affiliates in manufacturing sectors is higher in OECD
countries with relatively more liberal product market environments. Given that foreign
affiliates in a host country have been found to be more capital and skill intensive and
invest more in research and development than domestic firms in the same industry, they
generally have a beneficial effect on productivity growth (Keller, 2004; Keller and Yeaple,
2003). In the case of India, because these firms are attracted to the relatively more liberal
states, the beneficial impact on productivity performance is concentrated in these states.
States in which product market regulation is more conducive to competition have also
been more successful at infrastructure provision (Figure 4, Panel B). Because infrastructure has,
to a large extent, been provided by the public sector in India, this points to complementarities
in state government competences: well-functioning state governments that have enacted
policies that are supportive of product market competition have also been more successful at
infrastructure provision. In a number of studies, infrastructure has been found to be an
important determinant of economic performance across states (e.g. Purfield, 2006).
Finally, higher administrative burdens, as measured by the PMR indicator of barriers to
entrepreneurship, are associated with a lower share of private sector employment in the
formal sector of the state economies (Figure 4, Panel C). This suggests that firms
in relatively restrictive states prefer to remain small and informal so as to stay under
the radar of having to interact with government and thereby avoid overly onerous
administrative requirements. However, firms in the informal sector of the Indian economy
have lower capital intensity and are generally much less productive than formal-sector
enterprises (OECD, 2007). As a result, states with excessive administrative burdens suffer
from relatively low fixed capital formation and small average firm size, which weighs on
productivity performance.
OECD JOURNAL: ECONOMIC STUDIES – ISSN 1995-2848 – © OECD 20098

HOW COMPETITIVE IS PRODUCT MARKET REGULATION IN INDIA? AN INTERNATIONAL AND CROSS-STATE COMPARISON
Figure 4. Channels through which product market regulation affects economic performance
1. FDI is measured as cumulative inflows over the period 2000 to 2006 as a share of annual average state GDP.
0.5 1.0 1.5 2.0 2.5 3.0−5
0
5
10
15
20
25
30
35
40
45
0.5 1.0 1.5 2.0 2.5 3.0
0.5 1.0 1.5 2.0 2.5 3.53.0
50
70
90
110
130
150
170
190
210
50
55
60
65
70
75
80
85
90
95
100
Foreign direct investment (% of GDP)
Correlation coefficient = -0.44t - statistic = -1.87without Delhi: correlation coefficient = -0.67t - statistic = -3.30
Correlation coefficient = -0.52
Andhra PradeshAssam
Bihar, Jharkhand
Delhi
Goa
Gujarat
Punjab, Haryana, H.P.
KarnatakaKerala
M.P., Chhattisgarh
Maharashtra
OrissaRajasthan
Tamil Nadu
U.P., Uttaranchal
West Bengal
PMR indicator
Panel A: PMR and foreign direct investment1
Infrastructure index
PMR indicator
Panel B: Provision of infrastructure
Unorganised employment share
Correlation coefficient = 0.53t - statistic = 2.49
Administrative regulation indicator
Panel C: Administrative barriers and unorganised employment share
Andhra Pradesh
Assam
Bihar
Goa
Gujarat
Haryana
Himachal PradeshKarnataka
Kerala
Madhya Pradesh
Maharashtra
Orissa
Punjab
Rajasthan
Tamil Nadu
Uttar Pradesh West Bengal
Andhra Pradesh
Assam
BiharDelhi
Goa
Gujarat
Haryana
Himachal PradeshKarnataka
Kerala Madhya Pradesh
Maharashtra
Orissa
Punjab
Rajasthan
Tamil Nadu
Uttar PradeshWest Bengal
OECD JOURNAL: ECONOMIC STUDIES – ISSN 1995-2848 – © OECD 2009 9

HOW COMPETITIVE IS PRODUCT MARKET REGULATION IN INDIA? AN INTERNATIONAL AND CROSS-STATE COMPARISON
States
9
0
0
9
5
8
0
0
The low-level indicators and areas in need of reformThe results discussed in the preceding section imply that ongoing reform of anti-
competitive regulations in the less productive states would improve their economic
performance, which is an important key to reducing poverty (OECD, 2007). In the relatively
more liberal states and at the centre, the challenge is to further improve business
framework conditions towards those in the OECD area so as to hasten the international
diffusion of more productive production techniques. In this section, the detailed results of
the PMR benchmarking exercise are used to outline specific areas in which the regulatory
environment hinders product market competition and could be improved. It uses the
indicator results at the national and state levels and is divided into the three broad
categories of the PMR indicators: i) state control, ii) barriers to entrepreneurship and iii) barriers
to international trade and investment.
State control
Compared with other countries, the extent of state control in product markets is
relatively high in India at the national level (Table 3). On the positive side, the PMR sub-
indicators show that direct government interference in the conduct of private sector firms
is minimal. Price setting, for example, is free of government interference in most segments
of the Indian retail market and the degree of direct government control over private firms
is broadly similar to that in emerging OECD economies. This reflects the absence of
government-owned special voting rights, notwithstanding restrictions on the voting rights
of private shareholders in government-owned banks. On the other hand, the public
enterprise sector is relatively large in India and public-sector enterprises (PSEs) operate
across a broad range of sectors. In addition, there is also a relatively high level of
command-and-control regulation for private firms reflecting, for example, the imposition
of universal service obligations.
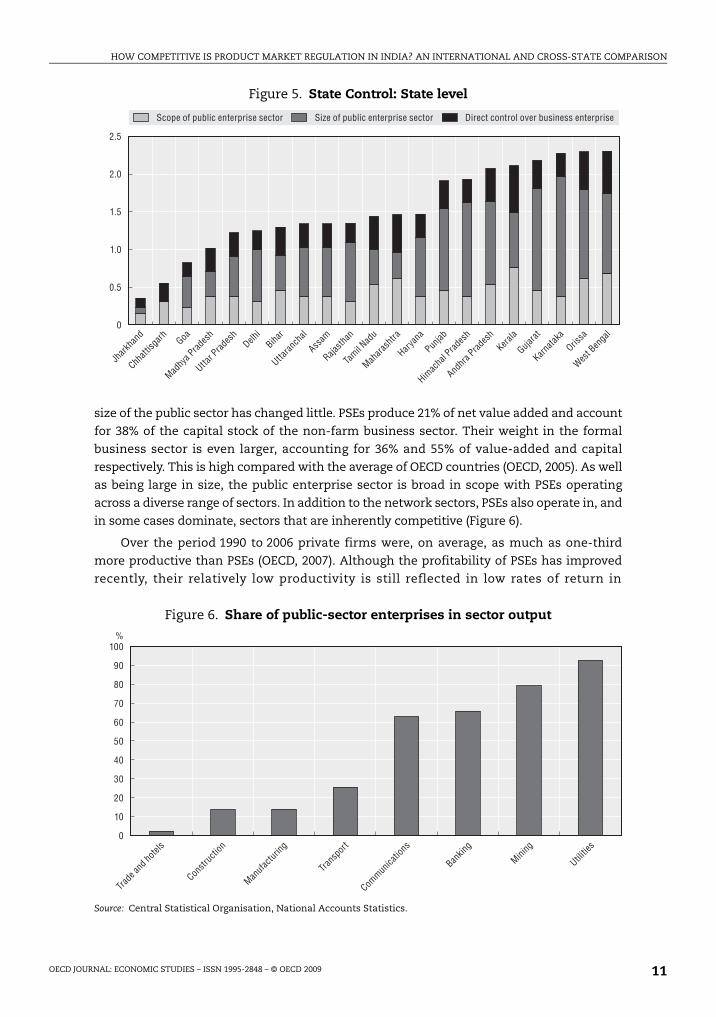
At the state level the PMR indicators suggest that there is wide variation in the degree of
state control (Figure 5). This arises predominantly as a result of differences in the size and
scope of the public enterprise sector, reflecting different starting points and commitments to
privatisation by state governments.
Public ownership
Until the 1990s the public sector was widely seen as the mechanism to bring about
India’s industrialisation and modernisation through control of the “commanding heights of
the economy”. Since then, despite some initiatives to sell stakes in public companies, the
Table 3. State control: National level
India OECD averageOECD emerging
marketsEuro area Eastern Europe Latin America United
State control 3.47 2.12 2.46 2.40 2.74 2.16 1.1
Public ownership 3.82 2.42 2.88 2.72 3.22 2.16 1.2
Scope of public enterprise sector 4.91 3.14 3.48 3.34 3.36 3.06 2.5
Size of public enterprise sector 4.58 2.53 3.09 3.03 3.15 2.13 0.5
Direct Control over business enterprises 2.45 1.86 2.33 2.06 3.20 1.95 0.7
Involvement in business operations 3.03 1.73 1.92 2.00 2.12 1.79 1.1
Use of command-and-control regulation 5.00 2.16 2.17 2.78 2.48 3.13 1.5
Price controls 0.75 1.01 1.27 0.92 1.12 1.08 0.8
OECD JOURNAL: ECONOMIC STUDIES – ISSN 1995-2848 – © OECD 200910
HOW COMPETITIVE IS PRODUCT MARKET REGULATION IN INDIA? AN INTERNATIONAL AND CROSS-STATE COMPARISON
size of the public sector has changed little. PSEs produce 21% of net value added and account
for 38% of the capital stock of the non-farm business sector. Their weight in the formal
business sector is even larger, accounting for 36% and 55% of value-added and capital
respectively. This is high compared with the average of OECD countries (OECD, 2005). As well
as being large in size, the public enterprise sector is broad in scope with PSEs operating
across a diverse range of sectors. In addition to the network sectors, PSEs also operate in, and
in some cases dominate, sectors that are inherently competitive (Figure 6).
Over the period 1990 to 2006 private firms were, on average, as much as one-third
more productive than PSEs (OECD, 2007). Although the profitability of PSEs has improved
recently, their relatively low productivity is still reflected in low rates of return in
Figure 5. State Control: State level
Figure 6. Share of public-sector enterprises in sector output
Source: Central Statistical Organisation, National Accounts Statistics.
0
0.5
1.0
1.5
2.0
2.5
Scope of public enterprise sector Direct control over business enterpriseSize of public enterprise sector
Jhark
hand
Chhatt
isgarh Goa
Madhy
a Prad
esh
Uttar P
rades
hDelh
iBiha
r
Uttaran
chal
Assam
Rajasth
an
Tamil N
adu
Mahara
shtra
Haryan
a
Punjab
Himac
hal P
rades
h
Andhr
a Prad
esh
Kerala
Gujarat
Karnata
kaOris
sa
West B
enga
l
0
10
20
30
40
50
60
70
80
90
100%
Constr
uctio
n
Manufa
cturin
g
Trans
port
Commun
icatio
ns
Bankin
g
Mining
Utilitie
s
Trade
and h
otels
OECD JOURNAL: ECONOMIC STUDIES – ISSN 1995-2848 – © OECD 2009 11

HOW COMPETITIVE IS PRODUCT MARKET REGULATION IN INDIA? AN INTERNATIONAL AND CROSS-STATE COMPARISON
comparison to the private sector. In 2005, the rate of return earned by the median PSE
controlled by the centre was 3% (after subsidies) in contrast to almost 10% for the median
private sector company (Figure 7).
At the state level the amount of capital and loans invested in PSEs as a share of state
GDP ranges from just 0.2% in Jharkhand to 26.2% in Karnataka (Table 4).13 In comparison to
central government, the state governments collectively control a much larger number of
PSEs – just over 1 000 in 2003 in comparison to 245 at the centre. However, the average size
of state-level PSEs is much smaller than at the centre, with state governments collectively
controlling slightly more than 50% of the total capital stock of the public enterprise sector.
At the state level, investment in PSEs is often concentrated in the electricity sector,
underlying the importance of ongoing regulatory reform in this sector.14
Although there is significant variation across states, the financial health of the state-
owned PSEs is, on average, worse than that of the central enterprises, with a large tail of
highly unprofitable public-sector firms (Figure 7 above). The proportion of loss-making
PSEs ranges from 15% in Andhra Pradesh to 77% in Assam (Table 4). Some of the worst-
performing PSEs at the state level are in the power sector, indicative of enormous (implicit)
electricity subsidies and high transmission and distribution losses. In addition to
“working” PSEs most state governments also have a number of “non-working” PSEs on
their books. These firms no longer produce output but, given the difficulties of retrenching
staff and closing down in India, continue to exist as corporate entities, with potentially
severe fiscal implications. Restructuring may be a partial solution for some of them, but
many are non-viable and need to go through an insolvency process. In 2005, the total losses
of the loss-making PSEs controlled by the central and state governments amounted to 0.3%
and 0.6% of GDP, respectively.
Since the late 1980s, worldwide privatisation experience has shown that private
ownership typically leads to improvements in firm profitability, output and efficiency
(e.g. Megginson and Netter, 2001 and Kikeri and Nellis, 2004). In network sectors with
monopoly elements, the regulatory environment needs to be consistent with private
ownership for the gains from privatisation to arise. In the case of India, the proceeds from
Figure 7. Distribution of rates of return of central enterprises
Source: Authors’ calculations based on data from the Comptroller and Auditor General and Prowess database.
−50
−40
−30
−20
−10
0
10
20
30
40
50
0 10 20 30 40 50 60 70 80 90 100
PSEs (state) Private-sector listed firmsPSEs (centre)
Rate of return (%)
Percentile
OECD JOURNAL: ECONOMIC STUDIES – ISSN 1995-2848 – © OECD 200912

HOW COMPETITIVE IS PRODUCT MARKET REGULATION IN INDIA? AN INTERNATIONAL AND CROSS-STATE COMPARISON
privatisations by the central government have been 50% below target since 1991/92 and
relatively low in comparison with some other developing countries. Indeed, in contrast to
India, privatisation programmes in a number of developing countries have gone as far as
selling state-owned enterprises in the network/infrastructure sectors (Figure 8). As well as
a relatively low level of privatisation, the divesture method typically used in India, which
involves selling small tranches of shares to the private sector, may also be sub-optimal.
Although partial privatisation can lead to improvements in firm performance, cross-
country studies of privatisation in OECD countries indicate that the gains in profitability
and productivity are typically larger in firms that are fully privatised (OECD, 2003). The
disadvantage of partial privatisation is that it does not usually result in management
control being passed to private owners or an infusion of new technology necessary to
improve firm performance.15
Government involvement in business operations
India’s large public enterprise sector negatively impacts on the extent of product
market competition in various ways. First and foremost, because government can be a
major market player as well as policymaker (and regulator in some of the infrastructure
sectors) there is often no clear separation between the ownership function and other
functions that influence market conditions. For example, PSEs are often required to fulfil
social and public policy obligations and are subject to political interference and civil
servants as board members. In many of the states, strategic commercial choices of PSEs
Table 4. State-level public sector enterprises2004
Number of PSEs
Assetsof PSEs
Proportion of loss making
PSEs
Losses of loss making PSEs
Proportion of capital in
“non-working” PSEs
Proportion of PSEs
with negative net worth
Rate of return on capital
% SGDP % % SGDP % % Medium Average
Andhra Pradesh 54 18.3 15 –0.06 2.3 14.8 5.6 10.0
Assam 43 10.8 77 –3.47 1.6 20.9 –3.3 –16.4
Bihar 54 7.9 70 –1.38 13.0 11.1 –2.5 –7.7
Chhattisgarh 11 0.2 36 –0.02 0.0 9.1 5.1 4.6
Delhi 11 11.5 45 –4.21 0.0 9.1 3.6 –27.8
Goa 16 6.9 63 –0.57 0.0 0.0 –0.1 –11.0
Gujarat 51 22.4 39 –0.38 50.5 17.6 2.2 –8.9
Haryana 29 12.9 59 –0.05 1.4 13.8 5.5 5.0
Himachal Pradesh 21 20.5 62 –0.50 27.8 23.8 3.3 5.7
Jharkhand 6 1.5 17 –0.15 0.0 0.0 33.6 43.1
Karnataka 82 26.2 41 –0.28 1.5 7.3 3.6 31.2
Kerala 114 12.1 61 –0.39 1.1 14.0 1.7 –15.3
Madhya Pradesh 42 5.6 33 –0.13 3.8 14.3 1.3 2.2
Maharashtra 82 6.1 68 –0.38 3.2 20.7 –0.3 –4.6
Orissa 69 19.7 70 –0.28 1.1 21.7 –1.3 –35.0
Punjab 57 17.9 44 –0.23 0.3 15.8 –1.2 –12.0
Rajasthan 24 13.2 38 –0.06 0.1 20.8 7.4 20.6
Tamil Nadu 68 8.0 53 –0.14 0.6 29.4 2.4 –1.6
Uttar Pradesh 94 8.9 62 –0.94 51.1 17.0 –1.0 –29.9
Uttaranchal 25 10.8 60 –0.32 47.7 12.0 –2.3 –16.4
West Bengal 86 17.5 72 –0.50 0.8 44.2 1.4 –45.2
Source: Authors’ analysis of data from the Comptroller and Auditor General.
OECD JOURNAL: ECONOMIC STUDIES – ISSN 1995-2848 – © OECD 2009 13

HOW COMPETITIVE IS PRODUCT MARKET REGULATION IN INDIA? AN INTERNATIONAL AND CROSS-STATE COMPARISON
often have to be cleared by the state assembly. The procurement policies of the central and
state governments, which typically include a price or quantity preference for PSEs, are also
biased against the private sector. Because they dominate some markets, political
interference in the operation of PSEs not only threatens their profitability but also
adversely influences competition.
Although some steps have been taken to commercialise the activities of the PSEs – such as
granting more operational freedom to relatively successful PSEs and increasing limits for
investments that do not need to be cleared by parliament – more could be done to ensure a
level playing field and government neutrality in its dealings with the private sector. Moving
towards a more centralised model of PSE management where PSEs are put under the
responsibility of an investment agency would be an important step in this direction. Currently,
at the centre, responsibility for the PSEs rests primarily with the line ministry while the
Department of Public Enterprises plays a coordinating role. A more centralised approach would
distance PSEs from political control and achieve a clearer separation between policy and
commercial functions. It would also facilitate a more unified and consistent ownership policy,
simplify the often elaborate committee structures that currently supervise and control PSEs,
and ensure equitable treatment of non-state shareholders by preventing government from
pursuing objectives outside the commercial interests of the PSE. By improving governance,
centralising the ownership function within government would ensure a more level playing
field between public and private sector companies and increase competition.
Barriers to entrepreneurship
At the national level India performs well in some of the regulatory areas covered by the
PMR indicators of barriers to entrepreneurship (Table 5). In particular, reforms over the past
two decades have been successful in removing most of the legal barriers to market entry,
such as licenses to enter a particular sector, which had previously reduced competition
and protected incumbents. In addition, the indicator of regulatory and administrative opacity
is broadly comparable with those in emerging OECD countries, reflecting the recent
introduction of one-stop shops for issuing licences and permits in some states and other
Figure 8. Privatisation proceeds by country and sector% of GDP, 1998-2003 annual average
Source: World Bank.
%1.8
1.6
1.4
1.2
1.0
0.8
0.6
0.4
0.2
0
Energy Infrastructure Manufacturing and services Total
East Europe OECD China Other Asia IndiaOther OECD (Turkey, Mexico)
OECD JOURNAL: ECONOMIC STUDIES – ISSN 1995-2848 – © OECD 200914
HOW COMPETITIVE IS PRODUCT MARKET REGULATION IN INDIA? AN INTERNATIONAL AND CROSS-STATE COMPARISON
States
.20
.28
.00
.39
.02
.75
.25
.03
.50
.36
.63
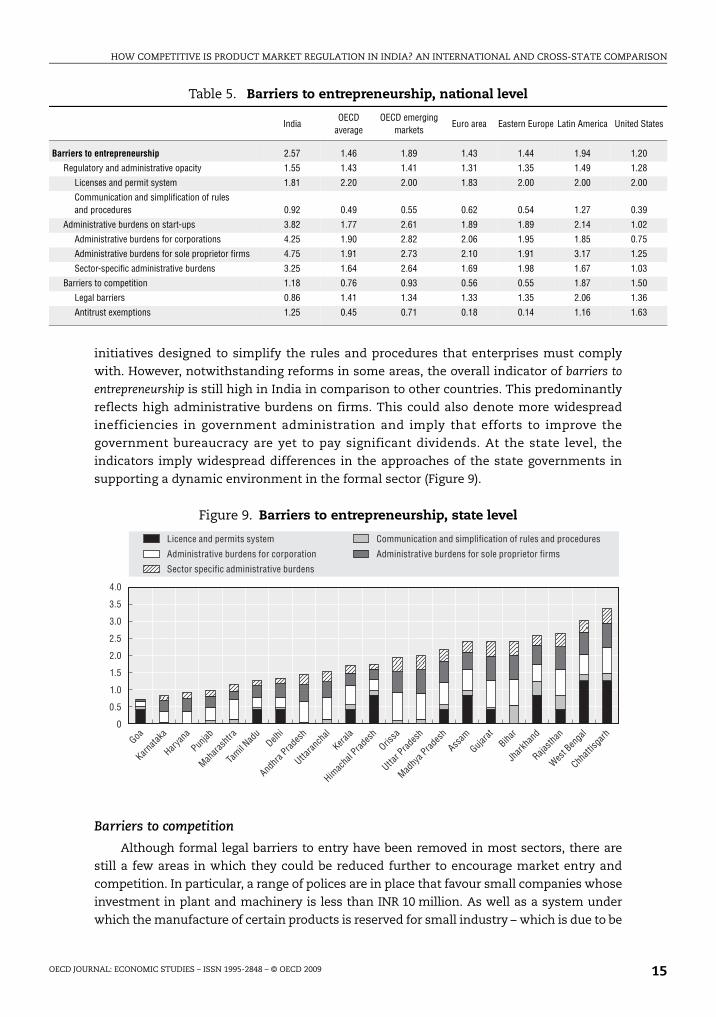
initiatives designed to simplify the rules and procedures that enterprises must comply
with. However, notwithstanding reforms in some areas, the overall indicator of barriers to
entrepreneurship is still high in India in comparison to other countries. This predominantly
reflects high administrative burdens on firms. This could also denote more widespread
inefficiencies in government administration and imply that efforts to improve the
government bureaucracy are yet to pay significant dividends. At the state level, the
indicators imply widespread differences in the approaches of the state governments in
supporting a dynamic environment in the formal sector (Figure 9).
Barriers to competition
Although formal legal barriers to entry have been removed in most sectors, there are
still a few areas in which they could be reduced further to encourage market entry and
competition. In particular, a range of polices are in place that favour small companies whose
investment in plant and machinery is less than INR 10 million. As well as a system under
which the manufacture of certain products is reserved for small industry – which is due to be
Table 5. Barriers to entrepreneurship, national level
IndiaOECD
averageOECD emerging
marketsEuro area Eastern Europe Latin America United
Barriers to entrepreneurship 2.57 1.46 1.89 1.43 1.44 1.94 1
Regulatory and administrative opacity 1.55 1.43 1.41 1.31 1.35 1.49 1
Licenses and permit system 1.81 2.20 2.00 1.83 2.00 2.00 2
Communication and simplification of rules and procedures 0.92 0.49 0.55 0.62 0.54 1.27 0
Administrative burdens on start-ups 3.82 1.77 2.61 1.89 1.89 2.14 1
Administrative burdens for corporations 4.25 1.90 2.82 2.06 1.95 1.85 0
Administrative burdens for sole proprietor firms 4.75 1.91 2.73 2.10 1.91 3.17 1
Sector-specific administrative burdens 3.25 1.64 2.64 1.69 1.98 1.67 1
Barriers to competition 1.18 0.76 0.93 0.56 0.55 1.87 1
Legal barriers 0.86 1.41 1.34 1.33 1.35 2.06 1
Antitrust exemptions 1.25 0.45 0.71 0.18 0.14 1.16 1
Figure 9. Barriers to entrepreneurship, state level
4.0
3.5
3.0
2.5
2.0
1.5
1.0
0.5
0
Administrative burdens for corporation
Licence and permits system
Administrative burdens for sole proprietor firms
Sector specific administrative burdens
Communication and simplification of rules and procedures
Goa
Karnata
ka
Haryan
a
Punjab
Mahara
shtra
Tamil N
adu
Delhi
Andhr
a Prad
esh
Uttaran
chal
Kerala
Himac
hal P
rades
hOris
sa
Uttar P
rades
h
Madhy
a Prad
esh
Assam
Gujarat
Bihar
Jhark
hand
Rajasth
an
West B
enga
l
Chhatt
isgarh
OECD JOURNAL: ECONOMIC STUDIES – ISSN 1995-2848 – © OECD 2009 15
HOW COMPETITIVE IS PRODUCT MARKET REGULATION IN INDIA? AN INTERNATIONAL AND CROSS-STATE COMPARISON
phased out by 2009 – small firms also get fiscal benefits, as they pay a lower rate of excise tax
on the goods they produce. Government procurement also favours small firms, with
338 products reserved for small suppliers who also win tenders for other products if their
price is less than 15% above the lowest quote. Finally, banks are obliged to make 10% of their
advances to small firms. These policies skew the production structure towards small firms,
thereby lowering the scope for productivity gains from producing on an efficient scale.
Regulatory and administrative opacity
The indicators of regulatory and administrative opacity in India compare favourably
internationally, reflecting ongoing effort at the national and state levels to improve the
efficiency of the public bureaucracy. One common initiative for reducing red tape, which
has been introduced in some form in 19 of the 21 states for which the PMR indicators have
been calculated, is the “one-stop shop” (OSS) for providing information and, in some cases,
applying for the necessary licenses and notifications.16 The essential idea of the OSS is that
potential investors only need to be in contact with a single entity to complete all the
necessary paperwork and applications in a streamlined and coordinated process, rather
than having to go through a labyrinth of different government bodies. In practice, given the
impracticalities of assuming full control of the approval process, OSSs tend to act as a
coordination mechanism between relevant government authorities. To be effective in
reducing administrative burdens, OSSs need to be implemented along with other reforms
geared towards cutting red tape (Sader, 2000). In the absence of such measures, OSSs run
the risk of simply adding another layer of bureaucracy to the approval process. Indeed,
because OSSs provide a focal point for investment clearance, they can act as important
catalysts for improving administrative processes and cooperation across government
departments.
Closely related to the OSS concept is the idea of “deemed clearance” under which
licenses are issued automatically if the licensing office does not act by the end of the
statutory response period. Deemed clearance regimes have been implemented in 10 of the
21 states for which the PMR indicators have been calculated. They can be an effective
method of giving teeth to the single window concept if they are set and implemented
judiciously. However, the administrative system must be reformed to the point where it is
capable of meeting these statutory response periods. The objective is not to circumvent
regulation but to implement and enforce it as efficiently as possible.
A number of state governments have also tried to improve the interface with the
private sector by simplifying and consolidating various application forms and registers.
However, simply combining all existing application forms into a single document, as has
been done in a few states, is not enough. Instead, a composite application form should be
the final outcome of a process to coordinate and improve the administrative function of
government departments. There is also potential for reducing administrative burdens by
better integrating the administrative functions of the central and state governments,
which both process applications and collect information for areas in which they have
concurrent responsibility.
Information and communications technology (ICT) offers enormous potential for
reducing administrative burdens in India and has been successfully integrated into the
administrative procedures of some of the state governments. At the central level,
government is using Indian ICT firms to introduce electronic data interchange systems for
customs clearance and checking the progress of documents. The tax administrations are
OECD JOURNAL: ECONOMIC STUDIES – ISSN 1995-2848 – © OECD 200916

HOW COMPETITIVE IS PRODUCT MARKET REGULATION IN INDIA? AN INTERNATIONAL AND CROSS-STATE COMPARISON
also implementing ICT in a similar vein. The introduction of ICT should reduce
opportunities for corruption by reducing subjectivity and discretion in government
administrative processes. It must, however, be linked to improving administrative
processes. Automating existing inefficient processes or using ICT to simply disseminate
information will only produce a limited payoff.
Administrative burdens on start-ups
Despite recent efforts to improve the functioning of the public bureaucracy,
administrative burdens, as measured by the PMR indicators, remain high compared with
other countries. Although these indicators are primarily a reflection of the complexities
involved in starting up a business, they may also reflect more widespread inefficiencies in
government. This increases compliance costs, especially for small firms, and discourages
firm expansion into the formal sector, thus restraining competition and productivity.17
With an interventionist tradition and administrative structures that have in many cases
not kept pace with economic liberalisation, a significant reengineering of administrative
processes is needed to improve service delivery and simplify the interaction between
government and firms.
A high-quality administrative system is transparent, accountable, and efficient.
Establishing a coordinated programme of administrative reform to improve these aspects
of public bureaucracies requires institutional change and is complex and time consuming.
Recognising the scope of this challenge, most OECD governments have established
regulatory oversight bodies with “whole-of-government” responsibility for regulatory
policy (OECD, 2002). One advantage of this approach is that it promotes a consistent and
systematic method of reform across the entire administration. In addition, OECD
experience has been that regulatory reform will often fail if left entirely to ministries,
implying that a degree of centralisation can improve the chances of successful reform.
The Indian government is well aware of the importance of improving the quality of
public administration and has moved a long way towards becoming a more service-oriented
facilitator of private-sector entrepreneurship. From the centre, the Department of
Administrative Reforms and Public Grievances works with central ministries and state
administrations on a number of projects aimed at improving government functioning. One
of the most far-reaching recent initiatives enacted at the central level is the Right to
Information Act (2005), which gives citizens access to information under the control of public
authorities and should greatly improve the transparency of the public administration. Ten of
the 21 state governments surveyed have also established centralised institutions for
managing and coordinating regulation and its reform.
At present, however, there is no centralised oversight body charged with reviewing
regulatory proposals to ensure they do not impose unnecessary or unreasonable
administrative burdens on firms and citizens. This important task would involve the use of
regulatory impact analysis (RIA) to assess the benefits and costs of significant proposed
new regulation. A regulatory oversight body could also develop guidelines on the standards
of good regulation and the use of alternatives to traditional command-and-control
regulation. New ways of measuring the impact of administrative regulation would also
need to be developed to identify areas of high administrative burden (OECD, 2006).18
OECD JOURNAL: ECONOMIC STUDIES – ISSN 1995-2848 – © OECD 2009 17

HOW COMPETITIVE IS PRODUCT MARKET REGULATION IN INDIA? AN INTERNATIONAL AND CROSS-STATE COMPARISON
States
3
4
3
0
0
1
0
Barriers to international trade and investment
Although the Indian economy has opened up considerably since the early 1990s,
barriers to trade and investment remain relatively high in international comparison (Table 6).
As discussed in the previous section, given that India is some distance behind the world
technological frontier, the adoption of production techniques and know-how developed in
more productive countries is potentially an important catalyst for economic development
and productivity improvements. Both international trade and FDI encourage domestic
firms to incorporate foreign technologies into the production process, thereby facilitating
technological diffusion. As a result, more outward-oriented countries consistently grow
more quickly than relatively closed ones (Srinivasan and Bhagwati, 1999).
Explicit barriers to trade and investment
Tariff revenue as a proportion of import values – a broad measure of tariff barriers –
has fallen by a factor of six since the late 1980s. More recently, the government has
progressively reduced the highest standard tariff rate for non-agricultural products from
35% in 2001 to 10% in 2007.19 However, despite these significant improvements, tariff
revenues and the average most favoured nation (MFN) tariff rate, as well as the associated
PMR indicator, are still much higher than in OECD and a number of emerging countries
(Figures 10 and 11).
As a result of substantial derogations from the standard tariff rates, the yield from tariffs,
at around 5%, is considerably lower than the simple average of the MFN tariff (13% in 2007). In
other countries, such as Mexico and Turkey, these derogations arise as the result of regional
trade agreements. In India, however, these derogations are domestic in nature with 134 duty
exemption Acts in place. In sectors reserved for small firms, instruments are in place to
channel duty-free imports through trade associations. Other schemes mandate a 5% import
duty on capital goods subject to an export obligation equivalent to eight times the duty saved
over a period of eight years. Agri-export zones also grant duty-free imports of capital goods.
These exemptions are partially offset by the use of anti-dumping levies, of which India is one
of the largest users. In addition, India has one of the highest dispersions of actual tariff rates in
WTO member countries (Dihel et al., 2007). Widespread exemptions and the variability of the
tariff structure result in an inefficient allocation of resources. In addition to the gains from
lower average tariffs, substantial efficiency gains would result from moving to just one
tariff rate.
As with its tariff policy, India adopted a highly restrictive FDI policy after independence,
which was then liberalised somewhat during the reforms in the early 1990s. Over more
recent years, the policy framework has improved further with the creation of a system of
Table 6. Barriers to foreign trade and investment
India OECD averageOECD emerging
marketsEuro area Eastern Europe Latin America United
Barriers to trade and investment 2.56 0.97 1.66 0.75 1.35 2.31 0.7
Explicit barriers to trade and investment 3.02 1.36 2.26 1.04 1.90 1.92 1.1
Foreign ownership barriers 2.89 1.80 2.55 1.36 2.17 1.57 1.8
Discriminatory procedures 2.00 0.49 0.75 0.49 0.60 1.45 0.0
Tariffs 4.00 1.40 3.00 1.00 2.50 3.67 1.0
Other barriers 1.98 0.47 0.88 0.37 0.66 2.17 0.2
Regulatory barriers 1.60 0.22 0.46 0.17 0.27 2.21 0.0
OECD JOURNAL: ECONOMIC STUDIES – ISSN 1995-2848 – © OECD 200918

HOW COMPETITIVE IS PRODUCT MARKET REGULATION IN INDIA? AN INTERNATIONAL AND CROSS-STATE COMPARISON
automatic clearances for FDI inflows and increases in caps on foreign ownership across a
range of sectors. Currently, foreign ownership of up to 100% is permitted in many sectors
(Table 7), with only the need to notify the authorities. In areas reserved for small-scale
industries, foreign ownership is limited to 24%. In a number of sectors – alcoholic drinks,
cigarettes and tobacco products; electronic, aerospace and defence equipment – government
permission for FDI is required on a case-by-case basis.
Figure 10. Tariff revenue relative to import value in selected countries1
2005, tariff revenue (excluding domestic taxes) as percentage of import value
1. This figure excludes the so-called countervailing duty (CVD). This tax is levied on imported goods that areproduced domestically at the same rate as the central value-added (excise) tax on domestic goods. The CVD canbe offset against payment of the value-added tax. Given that the CVD can be offset, it should not be regarded aspart of the tariff in much the same way that the levy of a normal value-added tax on an imported product is notregarded as a tariff. The CVD accounted for almost half of total receipts of taxes on imported goods in FY 2005.
Source: OECD Revenue Statistics, European Court of Auditors, Public Finance Statistics of India, various nationalpublications.
Figure 11. A cross-country comparison of simple-average tariffs
Source: UNCTAD, Trains database.
0.81.0 1.1 1.1
1.4 1.51.9 2.1
2.4 2.4
3.6
5.3
%
0
1
2
3
4
5
6
Malays
ia
Turke
y EU
Mexico
Japa
n
United
States
Phillip
ines
Indon
esia
Thaila
ndKor
ea
Viet N
amInd
ia
%
0
5
10
15
20
25
30
35
2005 2000
India
Mexico
Brazil
Thaila
ndChin
a
Argen
tina
Russia
n Fed
eratio
n
Indon
esia
Phillip
ines
South
Africa
Austra
lia
Canad
a
United
States
OECD
Japa
nEU
15
OECD JOURNAL: ECONOMIC STUDIES – ISSN 1995-2848 – © OECD 2009 19

HOW COMPETITIVE IS PRODUCT MARKET REGULATION IN INDIA? AN INTERNATIONAL AND CROSS-STATE COMPARISON
Despite substantial recent improvements in policy and actual FDI flows, the policy
framework for FDI in India is still restrictive in comparison with OECD countries (Koyama
and Golub, 2006). In addition, many of the FDI restrictions in place apply to potentially fast-
growing sectors with low productivity, which would benefit from increased investment.
Specifically, relaxing FDI restrictions in banking, insurance and retail distribution would
improve real incomes, given the poor productivity levels in these industries. In addition,
allowing FDI into the retail sector would result in the modernisation of supply chains and
substantially reduce the amount of food produce that rots before getting to market. In turn,
this would improve incomes in the agricultural sector.
Notes
1. See, for example, World Bank (2007) and World Bank-CII (2002).
2. The Union List stipulates areas of regulatory responsibility that are the exclusive preview of theGovernment of India (for example, exit policy and bankruptcy procedures) whereas items on theState List come under the jurisdiction of the state governments (for example, inspections andcompliance with regulation). A third list – the Concurrent List – covers areas where the centre andstate governments have joint responsibility (for example, entry and labour regulation).
3. For a detailed description of the PMR indicators and the results for OECD countries see Nicolettiet al. (1999), Conway et al. (2005) and Wölfl et al. (2009).
4. The regulatory data used to calculate the PMR indicators are primarily collected using a detailedquestionnaire – the OECD Regulatory Indicators Questionnaire – that is answered by civil servants withknowledge and/or responsibility related to the relevant policy area. In the case of India, thequestionnaire was split into two parts covering product market regulations under the jurisdictionof the central and state governments. For details, see Conway and Herd (2008).
Table 7. Foreign direct investment: Ceiling on investment in a given company by sector
2006
Percentage of equity permitted to be held by a foreign company
Agriculture 0
Coal mining (own use) 100
Coal mining (other) 0
Manufacturing 100
Newspaper publication 26
Electricity generation 100
Airports1 100
Distribution of petroleum products 100
Pipelines 100
Roads, highways, ports 100
Civil aviation2 49
Internet service providers (without gateways)3 100
Internet service providers (with gateways) 74
Telecommunication services 74
Banking 74
Insurance 26
Retail distribution 0
Retail distribution (single brand) 51
Wholesale cash and carry distribution 100
1. FDI of more than 74% in existing airports requires government approval.2. Provided there is no direct or indirect participation by foreign airlines.3. Subject to divestment of 26% of equity after five years if the investing company is listed in another part of the world.Source: Department of Economic Affairs, GoI.
OECD JOURNAL: ECONOMIC STUDIES – ISSN 1995-2848 – © OECD 200920

HOW COMPETITIVE IS PRODUCT MARKET REGULATION IN INDIA? AN INTERNATIONAL AND CROSS-STATE COMPARISON
5. Note that in all cases, the scale of the PMR indicators at the state and central levels runs from 0 to 6,representing the least to the most restrictive regulatory regime.
6. Indicator values for the states are given in the annex.
7. Because all of the regulatory provisions summarised by the indicator of barriers to international tradeand investment are determined by the central government, this branch of the PMR indicator systemis not estimated at the state level. Some of the regulatory provisions in the indicators of state controland barriers to entrepreneurship are also determined at the central level and not included in thestate-level indicators. Full details are given in Conway and Herd (2008).
8. This result mirrors that of Nicoletti and Pryor (2006) who find that the PMR indicators for OECDcountries are generally significantly correlated with subjective perceptions-based measures of theregulatory environment. The small number of observations in the regression reported in Table 2reflects the relatively small number of states included in the World Bank-CII study.
9. The indicator of corruption is from Transparency International (2005) and reflects people’sperception of the extent of corruption and experience of actually paying bribes in 11 public services.
10. Veeramani and Goldar (2004) also provide a review of other work in this area.
11. Enhanced product market competition can also contribute to GDP per capita growth by increasingemployment (Blanchard and Giavazzi, 2003; Haefke and Edell, 2004; Nicoletti and Scarpetta, 2004).As restrictions are eased and competition increases, firms earn lower product market rents,activity is expanded and employment rates tend to rise. However, employment in some of the largefirms, particularly in the network sectors, where previous regulations were conducive to overmanning, may be adversely affected by deregulation.
12. A number of other empirical studies also find evidence that more competition increases theheterogeneity of firm performance. For example, Sabirianova, Svejnar and Terrell (2005) findsupport for heterogeneous effects of firm entry on firm performance in Russian and Czechindustrial firms. In OECD countries, Arnold et al. (2008) find that that the result of liberalisationincreasing heterogeneity in firm performance also holds in OECD countries.
13. In 2000 three new states were created. Jharkhand was created out of the southern districts of Bihar,Chhattisgarh was created out of eastern Madhya Pradesh and Uttaranchal was created out ofnorth-western Uttar Pradesh.
14. The share of state government investment in the electricity industry is over 80% of totalinvestment in the following states: Jharkhand, Chhattisgarh, Haryana, Rajasthan, Punjab andOrissa. It is between 60 and 80% in Assam, Andhra Pradesh, Madhya Pradesh, Tamil Nadu, Delhiand Maharashtra.
15. For more on India’s privatisation experience, see, for example, Gupta (2005) and Kaur (2003).
16. The OSSs in Indian states typically involve three levels depending on the size of the proposedinvestment. For example, in Haryana, new investment proposals of a value up to IRP 5 million(USD 1 million) are dealt with by a district-level committee, those between IRP 5 million andIRP 30 million (USD 6.5 million) by a state-level committee and those above IRP 30 million by ahigh-level committee.
17. A growing body of research finds that poor quality government administration creates particularproblems for small and medium-sized firms, which are often less able to bear the costs of bureaucraticburdens than larger, more established – and in some cases more influential – businesses.
18. Given the existing expertise within the Department of Administrative Reforms and PublicGrievances and some of the state-level departments, these institutions are best placed to performthis important role.
19. The objective of the current programme of tariff reductions, which began in 2002, is to lower thepeak tariff rate to the average peak rate in ASEAN countries, which is currently around 7%.
Bibliography
Aghion, P. and E. Bessonova (2006), “On Entry and Growth: Theory and Evidence”, Revue OFCE,June 2006.
Aghion, P., R. Burgess, S. Redding and F. Zilibotti (2008), “The Unequal Effects of Liberalization:Evidence from Dismantling the License Raj in India”, American Economic Review, 98:4.
OECD JOURNAL: ECONOMIC STUDIES – ISSN 1995-2848 – © OECD 2009 21

HOW COMPETITIVE IS PRODUCT MARKET REGULATION IN INDIA? AN INTERNATIONAL AND CROSS-STATE COMPARISON
Aghion, P., W. Carlin and M. Schaffer (2002), “Competition, Innovation and Growth in Transition:Exploring the Interaction between Policies”, William Davidson Working Paper, No. 501.
Arnold, J., G. Nicoletti and S. Scarpetta (2008), “Regulation, Allocative Efficiency and Productivity inOECD Countries: Industry and Firm-level Evidence”, OECD Economics Department Working Paper,No. 616.
Blanchard, O. and F. Giavazzi (2003), “Macroeconomic Effects of Regulations and Deregulation in Goodsand Labour Markets”, Quarterly Journal of Economics, 118, No. 3:879-907.
Conway, P., V. Janod and G. Nicoletti (2005) “Product Market Regulation in OECD Countries:1998 to 2003”, OECD Economics Department Working Papers, No. 419.
Conway, P., D. de Rosa, G. Nicoletti and F. Steiner (2006), “Product Market Regulation and ProductivityConvergence”, OECD Economic Studies, No. 43.
Conway, P., R. Herd and T. Chalaux (2008), “Product Market Regulation and Economic Performanceacross Indian States”, OECD Economics Department Working Paper, No. 600.
Gupta, N. (2005), “Partial Privatisation and Firm Performance”, Journal of Finance, Vol. 60, No. 2.
Haefke, C. and M. Ebell (2004), “The Missing Link: Product Market Regulation, Collective Bargaining andThe European Unemployment Puzzle”, mimeo, Universitat Pompeu Fabra.
Kaur, S. (2003), Privatisation and Public Regulation: The Indian Experience, Macmillan India Ltd., New Delhi.
Keller, W. (2004), “International Technology Diffusion”, Journal of Economic Literature, Vol. XLII, pp. 752-82.
Keller, W. and S. Yeaple (2003), “Multinational Enterprises, International Trade, and ProductivityGrowth: Firm Level Evidence from the United States”, IMF Working Papers, No. 248.
Kikeri, S. and J. Nellis (2004), “An Assessment of Privatization”The World Bank Research Observer, Vol. 19,No. 1.
Koyama, T. and S. Golub (2006), “OECD’s FDI Regulatory Restrictiveness Index: Revision and Extensionto More Countries”, OECD Economics Department Working Papers, No. 525.
Megginson, W. and J. Netter (2001), “From State to Market: A Survey of Empirical Studies onPrivatization”, Journal of Economic Literature, Vol. 39, No. 2.
Nicoletti, G., S. Golub, D. Hajkova, D. Mirza and K.Y. Yoo (2003), “The Influence of Policies on Trade andForeign Direct Investment”, OECD Economic Studies, No. 36.
Nicoletti, G. and F. Pryor (2006), “Subjective and Objective Measures of the Extent of GovernmentalRegulations”, Journal of Economic Behaviour and Organization, Vol. 59, 3, pp. 433-449.
Nicoletti, G. and S. Scarpetta (2003), “Regulation, Productivity and Growth”, Economic Policy, Vol. 36,pp. 11-72.
Nicoletti, G., S. Scarpetta and O. Boylaud (1999), “Summary Indicators of Product Market Regulationwith an Extension to Employment Protection Legislation”, OECD Economics Department WorkingPapers, No. 226.
OECD (2002), Regulatory Policies in OECD Countries: From Interventionism to Regulatory Governance, OECD,Paris.
OECD (2003), Privatising State-Owned Enterprises: An Overview of Policies and Practices in OECD Countries,OECD, Paris.
OECD (2005), Corporate Governance of State-Owned Enterprises: A Survey of OECD Countries, OECD, Paris.
OECD (2006), Cutting Red Tape: National Strategies for Administrative Simplification, OECD, Paris.
OECD (2007), OECD Economic Survey: India, OECD, Paris.
Purfield, C. (2006), “Is Economic Growth Leaving Some States Behind?”, in India Goes Global: ItsExpanding Role in the World Economy, IMF, Washington DC.
Sabirianova, K., J. Svejnar and K. Terrell (2005a) “Foreign Investment, Corporate Ownership andDevelopment: Are Firms in Emerging Markets Catching up to the World Standard?”, IZA and CEPRDiscussion Papers.
Sader, F. (2000), “Do ’One-Stop Shops’ Work?”, Foreign Investment Advisory Service, World Bank,Washington DC.
Srinivasan, T.N. and J. Bhagwati (1999), “Outward-Orientation and Development: Are RevisionistsRight?”, Economic Growth Centre, Yale University, Discussion Papers, No. 806.
OECD JOURNAL: ECONOMIC STUDIES – ISSN 1995-2848 – © OECD 200922

HOW COMPETITIVE IS PRODUCT MARKET REGULATION IN INDIA? AN INTERNATIONAL AND CROSS-STATE COMPARISON
Transparency International (2005), “India Corruption Study: 2005”, Transparency International India,New Delhi, June.
Veeramani, C. and B. Goldar (2004), “Investment Climate and Total Factor Productivity in Manufacturing;Analysis of Indian States”, ICRIER Working Papers, No. 127.
Wölfl, A., I. Wanner, T. Kozluk and G. Nicoletti (2009), “Ten Years of Product Market Reform in OECDCountries – Insights from a Revised PMR Indicator”, OECD Economics Department Working Papers, No. 695.
World Bank (2007), Doing Business 2008: India, World Bank, Washington DC, www.doingbusiness.org/Documents/CountryProfiles/IND.pdf.
World Bank-CII (2002), “Improving the Investment Climate in India”, World Bank, Washington DC.
OECD JOURNAL: ECONOMIC STUDIES – ISSN 1995-2848 – © OECD 2009 23

HOW COMPETITIVE IS PRODUCT MARKET REGULATION IN INDIA? AN INTERNATIONAL AND CROSS-STATE COMPARISON
pecific trative ens
7
1
8
9
3
0
6
7
1
3
1
7
7
8
2
5
2
4
5
4
3
ANNEX A1
Data Annex
This annex presents the PMR indicator values for India at the national level and for the
21 states surveyed.
Table A1.1. Low-level indicators, state level, 2006
State control Barriers to entrepreneurship
Scope of public enterprise sector
Size of public enterprise sector
Direct control over business
enterprise
Licence and permits
system
Communication and simplification
of rules and procedures
Administrative burdens
for corporation
Administrative burdens for sole proprietor firms
Sector-sadminis
burd
Andhra Pradesh 1.91 4.19 0.95 0.00 0.25 2.83 2.61 1.4
Assam 1.36 2.45 0.68 4.00 0.75 2.94 2.60 1.5
Bihar 1.64 1.77 0.82 0.00 3.00 3.60 3.64 2.0
Chhattisgarh 1.09 0.00 0.55 6.00 1.25 3.55 3.72 2.0
Delhi 1.09 2.62 0.55 2.00 0.25 1.37 2.15 0.8
Goa 0.82 1.56 0.41 2.00 0.50 0.60 0.43 0.0
Gujarat 1.64 5.12 0.82 2.00 0.25 3.78 3.72 2.1
Haryana 1.36 2.94 0.68 0.00 0.00 1.72 1.93 0.8
Himachal Pradesh 1.36 4.70 0.68 4.00 0.75 1.48 1.66 0.7
Jharkhand 0.55 0.30 0.27 4.00 2.25 2.30 3.00 1.4
Karnataka 1.36 6.00 0.68 0.00 0.25 1.40 1.75 0.7
Kerala 2.73 2.75 1.36 2.00 0.75 2.66 1.89 1.1
Madhya Pradesh 1.36 1.24 0.68 2.00 0.75 3.08 3.24 1.7
Maharashtra 2.18 1.35 1.09 0.00 0.75 2.66 1.29 0.9
Orissa 2.18 4.50 1.09 0.00 0.50 3.82 3.24 2.0
Punjab 1.64 4.09 0.82 0.00 0.50 1.74 1.82 0.8
Rajasthan 1.09 3.00 0.55 2.00 2.25 3.60 3.46 2.0
Tamil Nadu 1.91 1.79 0.95 2.00 0.25 1.42 1.82 0.7
Uttar Pradesh 1.36 2.01 0.68 0.00 0.75 3.58 3.59 2.0
Uttaranchal 1.36 2.45 0.68 0.00 0.75 2.99 2.36 1.4
West Bengal 2.45 4.00 1.23 6.00 1.00 2.87 3.33 1.7
OECD JOURNAL: ECONOMIC STUDIES – ISSN 1995-2848 – © OECD 200924

HOW COMPETITIVE IS PRODUCT MARKET REGULATION IN INDIA? AN INTERNATIONAL AND CROSS-STATE COMPARISON
ry rative
ent
Tariffs
4.00
therrriers
.98
Table A1.2. Higher-level indicators, state level
Product market regulation
State control Public ownershipBarriers
to entrepreneurshipAdministrative burdens
on start ups
Regulatoand administ
opacity
Andhra Pradesh 1.73 2.08 2.18 1.45 2.24 0.24
Assam 1.93 1.34 1.39 2.41 2.34 2.55
Bihar 1.92 1.30 1.32 2.43 3.06 1.46
Chhattisgarh 2.10 0.55 0.53 3.38 3.10 3.86
Delhi 1.30 1.25 1.31 1.34 1.41 1.25
Goa 0.77 0.83 0.86 0.72 0.36 1.28
Gujarat 2.32 2.18 2.33 2.42 3.15 1.35
Haryana 1.17 1.47 1.54 0.91 1.45 0.10
Himachal Pradesh 1.84 1.93 2.07 1.75 1.29 2.50
Jharkhand 1.59 0.36 0.35 2.60 2.23 3.19
Karnataka 1.48 2.28 2.46 0.83 1.24 0.19
Kerala 1.90 2.11 2.14 1.72 1.90 1.47
Madhya Pradesh 1.66 1.02 1.03 2.20 2.65 1.53
Maharashtra 1.29 1.46 1.46 1.15 1.64 0.41
Orissa 2.10 2.30 2.40 1.94 2.96 0.39
Punjab 1.40 1.91 2.02 0.98 1.43 0.31
Rajasthan 2.07 1.35 1.43 2.67 2.99 2.18
Tamil Nadu 1.35 1.44 1.46 1.27 1.30 1.24
Uttar Pradesh 1.65 1.22 1.26 2.01 2.99 0.50
Uttaranchal 1.44 1.34 1.39 1.52 2.22 0.45
West Bengal 2.71 2.30 2.39 3.04 2.63 3.73
Table A1.3. PMR indicators, national levelIndia, 2006
Low-level indicators
State control Barriers to entrepreneurship Barriers to trade and investm
Scope of public
enterprise sector
Size of public
enterprise sector
Direct control
over business enterprise
Use of command
and control
regulation
Price controls
Licence and
permits system
Commu-nication
and simpli-fication of rules and
procedures
Adminis-trative
burdens for corpo-
ration
Adminis-trative
burdens for sole
proprietor firms
Sector-specific adminis-
trative burdens
Legal barriers
Antitrust exemptions
Ownership barriers
Discrimi-natory proce-dures
Regula-tory
barriers
4.91 4.58 2.45 5.00 0.75 1.81 0.92 4.25 4.75 3.25 0.86 1.25 2.89 2.00 1.60
High-level indicators
Product market regulation
Statecontrol
Public ownership
Involvement in business operation
Barriers to entrepre-
neurship
Administrative burdens
on start ups
Regulatory and administrative
opacity
Barriers to competition
Barriers to trade and investment
Explicit barriers
Oba
2.85 3.47 3.82 3.03 2.57 3.82 1.55 1.18 2.56 3.02 1
OECD JOURNAL: ECONOMIC STUDIES – ISSN 1995-2848 – © OECD 2009 25


![[Economics] Perfectly Competitive Market](https://img.pdfslide.net/doc/110x75/55847362d8b42a6b4d8b4d5a/economics-perfectly-competitive-market.jpg)