Embed Size (px)
Citation preview

4 fund houses were eligible out of a universe of 26. Period: 4 quarterly CPRs in 2007.3 fund houses were eligible out of a universe of 27. Period: 4 quarterly CPRs in 2008.
Past performance is no guarantee of future results.
Birla Sun Life Frontline Equity FundAn Open ended Growth Scheme
Birla Sun Life Frontline Equity FundAn Open ended Growth Scheme
For award methodology and further details refer page 49. For further details of Birla Sun Life Frontline Equity Fund refer page 51
Mutual Fund investments are subject to market risks. Please read the Statement of
Additional Information / Scheme Information Document carefully before investing.
Call 1-800-270-7000 (toll-free) | Visit www.birlasunlife.com sms GAIN to 56161
How do you always keep your investments at the top?
A u g u s t 2 0 0 9
03
A u g u s t 2 0 0 9Asset Allocation Guide
Asset Allocation guide:
How it works?
“Aggressive”
This Asset Allocation guide helps you decide your broad
allocation to equities at different market levels. The
adjustment as per the recommended asset allocation may be
done on a six monthly basis or whenever you review your
portfolio.
Lets see how it will help you in your wealth creation goals with
the help of an illustration below.
Assuming you are an investor lets see how the
allocation guide will work
Recommended Equity Asset Allocation at different market conditions for different types of investors
Aggressive Moderate Conservative
Expensive 50%-60% 30%-40% 0-10%
Fair 60%-70% 40%-50% 10%-20%
Discounted 70%-80% 50%-60% 20%-30%
Asset Allocation Guide
The graph plots month end values of BSE Sensex since March 1991. The Fair price boundaries have been decided by taking P/E of 10.5 & 18.5 as the lower & upper boundaries times the 1 year forward earnings of the Sensex. The values above the fair band has been assumed to be expensive & below the fair band has been assumed to be discounted. This is just a suggested band as per forward earnings estimate and should not be construed as a recommendation to buy or sell securities.
Start 6 months 12 months 18 months
% Value in Rs Actual Allocation % Actual Allocation %Value in Rs Value in Rs
Equity 60% 60,000 65% 77400 75% 150444
Debt 40% 40,000 35% 42000 25% 50148
Total Wealth 100,000 119,400 200,592
Fair MarketAfter 6 Months market goes
up but still in Fair range
Action
Value in RsRecommended a llocation%
60% 71640
40% 47760
119,400
Bring back allocation as perthe suggested grid
After 12 Months market up to Expensive zone
goes
Actual Allocation % Value in Rs
35% 57169
65% 105311
162,480
After 18 Months marketlands in Discounted zone
Action
Value in RsRecommended a llocation%
70% 113736
30% 48744
162,480
Increase allocation to per thesuggested grid
Equity as
Action
Value in RsRecommended a llocation%
50% 100296
50% 100296
200,592
Reduce allocation to Equityas per the suggested grid
Thus, we see that the asset allocation guide helps you
• Observe discipline in your asset allocation by periodic readjustment as per the suggested grid
• Buy low and book profits at high levels by increasing /decreasing exposure at different market conditions.
The above example is to only demonstrate the working of the mentioned investment strategy. The above strategy actions are not based on any judgments of the future return of the debt and equity markets / sectors or of any
individual security. These views alone are not sufficient and should not be used for the development or implementation of an investment strategy.
Any information contained above does not constitute and shall be deemed not to constitute an advice, an offer to sell/purchase or as an invitation to do so for any securities of any entity, and further Birla Sun Life Asset
Management Company Ltd.(BSLAMC) / its subsidiaries/affiliates/sponsors/trustee or their officers, employees, personnel, directors shall not be liable for any loss, damage, liability whatsoever for any direct or indirect loss
arising from the use or access of any information that may be displayed herein. Recipients of the information contained herein should exercise due care and caution and read the offer documents (including if necessary,
obtaining the advice of tax / legal / accounting / financial / other professionals) prior to taking of any decision, acting or omitting to act, on the basis of the information contained herein. Opinions expressed are not necessarily
those of BSLAMC or any of their officers, employees, personnel, directors and BSLAMC . and its officers, employees, personnel, directors do not accept responsibility for the same. BSLAMC or any of its officers, employees,
personnel, directors make no representation as to the accuracy, completeness or reliability of the content and hereby disclaim any liability with regard to the same.
02
0.00
5,000.00
10,000.00
15,000.00
20,000.00
25,000.00
Mar-
91
Sep-9
1
Mar-
92
Sep-9
2
Mar-
93
Sep-9
3
Mar-
94
Sep-9
4
Mar-
95
Sep-9
5
Mar-
96
Sep-9
6
Mar-
97
Sep-9
7
Mar-
98
Sep-9
8
Mar-
99
Sep-9
9
Mar-
00
Sep-0
0
Mar-
01
Sep-0
1
Mar-
02
Sep-0
2
Mar-
03
Sep-0
3
Mar-
04
Sep-0
4
Mar-
05
Sep-0
5
Mar-
06
Sep-0
6
Mar-
07
Sep-0
7
Mar-
08
Sep-0
8
Mar-
09
Expensive
Discounted
Fair
Ju
l-0
9
03
Market OutlookA u g u s t 2 0 0 9
Equity Market
Debt Market
Bond yields rise on supply worries... Pressure on the bonds market increased under the sheer weight of supplies lined up for the fiscal and no positive clues, domestically or globally. Markets remained cautious about adding further duration. The yield curve remained extremely steep- spread between 1-year and 10-year government bond yields widened to a record 325 bps. The yield curve steepness also indicates that markets are pricing in tightening of the monetary policy next year. The 10-year benchmark paper breachced the 7% psychological level, emphasising the bearishness in the market. Corporate bond yields also hardened on back of G-sec blowing out.
Markets have been increasingly worried about the ending of the easy monetary policy regime combined with the inflation worries, which are popping up now more frequently in various comments. Markets also reacted negatively to the choice of securities for the OMO auctions. The weak response during the OMO auctions or lack of any action on RBI's part to stem the hardening yields have hit the bonds markets sentiment adversely. The daily trading volumes in G-secs have been steadily falling indicating vaning interest of various participants. Additionally, the markets expect the WPI inflation number to rise in the 3Q due to the low base effect. Global factors have contributed their bit to the sentiment. Crude after falling through the month have bounced back and are back to the higher levels as they were at the start of the month. The US treasuries also hardened again and are slowing inching towards the 4% mark on the 10 year. The equity markets have been trending upwards, indicating a rising demand for riskier assets. Thus, the risk aversion trades which caused the entire bond market rally are getting unwound. The economic news worldwide indicate bottoming out of the economic cycle and thus are bond-negative.
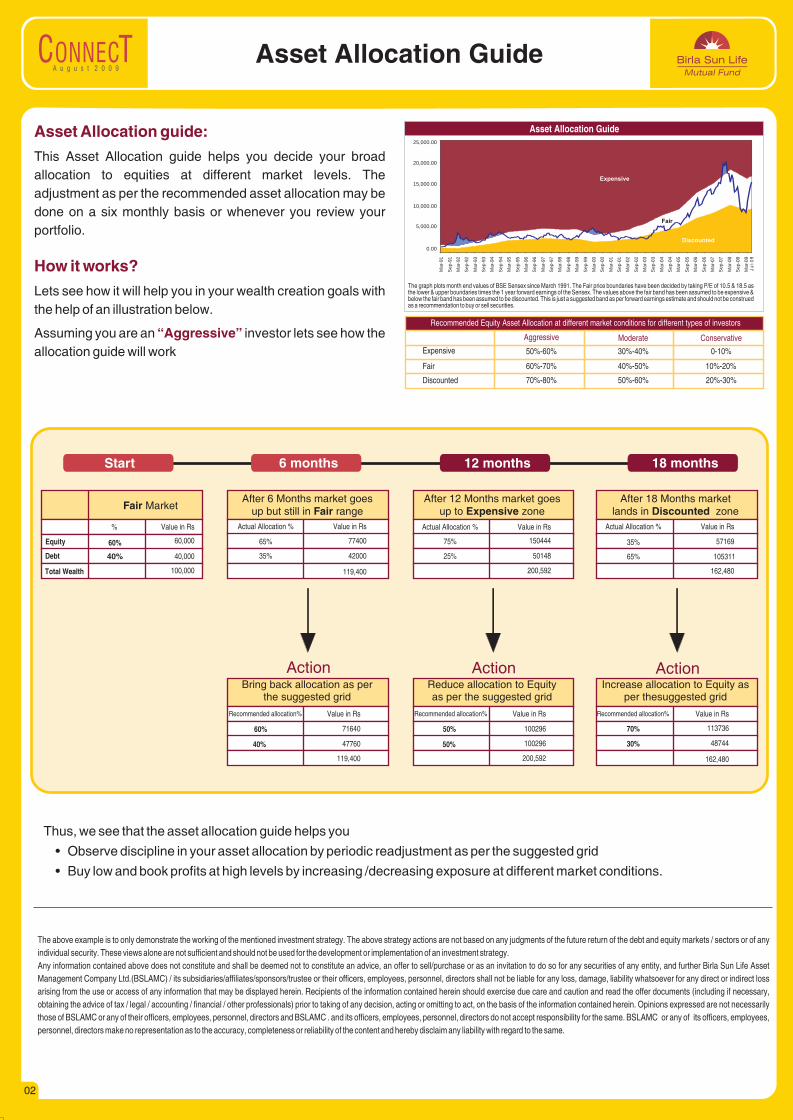
Risk appetite returns…Stock markets have come a long way from the lows made in 2008-2009. Most Asian markets have clearly stood out, outperforming the developed world peers by significant margin. This reflects the relatively better health of their economies.
Our Investment Team (In alphabetical order)
consumption through a combination of reduced personal tax rates and the maintenance of status quo on other direct and indirect taxes. Abolition of FBT was a relief to the corporate sector as it would reduce the tax burden. However, increase in MAT from 10% to 15% was disappointing. The budget was silent on widely anticipated reforms like disinvestments, oil price deregulation and FDI, to which the market reacted negatively. However, the government has subsequently put forward plans of disinvestments in the later weeks, revealing the reforms-oriented side of the government and gained back confidence of the market. Lately, hopes of sector-specific stimulus also boosted sentiment.
Earnings surprise…The earnings releases across the globe came as a pleasant surprise, driven by the impact of cost cutting and inventory reduction by industries while economies entered recession almost across the globe. In India also, earnings season surprised positively with Auto, Cement, IT, PSU Oil & Gas, and FMCG companies delivering better-than-expected numbers. This has resulted in a reassessment and consequently upgrades of earnings forecasts by most market participants.
Way forward…Pockets of positive leads exist from the fundamental side led by revival of industrial output. However, in just 4-5 months, domestic indices have nearly doubled, with global economy yet to find a robust footing. Even though Indian markets are majorly backed by anticipation of growing domestic demand, market is not really available at bargain prices.
Domestic demand itself faces the risk of consumer price inflation (above 9% y-o-y) and both these factors in turn depend a lot on the monsoon. Monsoon has been 19% below average (latest data) and threatens to ruin the rural-backed growth story attempted to be boosted by the government. Meanwhile, as the earnings season has come to a close, all positive factors could end up being factored in – leaving the market vulnerable over the medium term. It is likely that markets would consolidate in the near term and focused stock selection would provide outperformance.
The RBI kept interest steady in its Quarterly review, as per expectations, and on its part made clear that monetary accommodation will stay till economic activity found a firm footing.
OutlookSupply concerns continue to hurt market sentiments despite policy makers assurance that the borrowing would be carried out in a non-disruptive way. Further consumer price inflation continues to remain high and is a cause of concern for the markets. Overall the markets continue to price monetary tightening, though the timing of it would keep markets on its toes, resulting in huge volatility.
Our core view is that liquidity will remain high for considerable amount of time, either due to slow recovery or high capital flows but secular Bull Run in the bond market may be over and we should see rates hardening over the next few quarters. Nevertheless we do not expect rates to rise dramatically given that the government bond yields are already at very elevated levels and substantial amount of Government borrowing remains to be completed.
We feel that the10-year bond may remain in a 6%-7.50 % range for the rest of the year, with a cyclical rally in Oct-Dec and rates moving up in the last quarter of the year. Investors should be with a 'high liquidity' trade with moderate risk. We believe 2-3 year points on the credit curve are cheap and deserve higher allocation in ones portfolio. Overall high systemic liquidity will ensure that ultra short-term rates remain very low and investors will earn 'historic low returns' in liquidity funds.
03
A. Balasubramanian Chief Investment Officer
Achala Kanitkar Research Analyst : Equity
Ajay Argal Co-Head : Equity
Ajay Garg Fund Manager : Equity
Ankit Sancheti Fund Manager/ Research Analyst : Equity
Atul Penkar Fund Manager/ Research Analyst : Equity
Chanchal Khandelwal Research Analyst : Equity
Dipika Chheda Research Analyst : Equity
Hemang Dagli Sr. Dealer / Fund Manager
Lokesh Mallya Research Analyst : Fixed Income
Mahesh Patil Co-Head : Equity
Maneesh Dangi Head : Fixed Income
Merlyn Joseph Research Analyst : Equity
Nishit Dholakia Fund Manager / Analyst : Fixed Income
Paresh Khandelwal Research Analyst : Equity
Prasad Dhonde Fund Manager / Dealer : Fixed Income
Equity
The absence of leverage and focus on stimulating domestic demand has to an extent ruled out the deflationary scenario. In India also the growth momentum is based on consumption and infrastructure growth.The market overcame the disappointment of the Union Budget, driven by risk appetite of global investors that saw FIIs pour in massive amounts of money into Indian securities ($2.3 bn in July itself out of total $7.3 bn in Jan-Jul 2009 vs outflow of $6.6bn in Jan-Jul 2008). Risk appetite was built up across the globe by corporate earnings and economic data – both of which collectively beat expectations.
Budget – The fine print…In the context of a global downturn, the budget focused on increased public spending to sustain the economic revival and took steps to boost domestic investment and consumption. Infrastructure creation and rural development remained the themes in focus. It announced measures that would help sustain
Local Currency Return from Lows in 2008/2009 till July 31, 2009
0%
20%
40%
60%
80%
100%
120%
Ne
w Z
ea
lan
d
UK
Au
stra
lia
So
uth
Afr
ica
Fra
nce
Sw
ize
rla
nd
Ca
na
da
Ma
lays
ia
Jap
an
US
S&
P5
00
Ge
rma
ny
US
NA
SD
AQ
Ch
ile
Pa
kist
an
Me
xico
Th
aila
nd
Ph
ilip
pin
e
Sri L
an
ka
S K
ore
a
Taiw
an
Sin
ga
po
re
Bra
zil
Ho
ng
Ko
ng
Vie
tna
m
Ind
ia S
en
sex
Ch
ina
Ind
ia N
ifty
Ru
ssia
Ind
on
esi
a
Source: Bloomberg
Sanjay Chawla Fund Manager : Equity
Satyabrata Mohanty Head : Mixed Assets
Shaktie Prakash Fund Manager / Dealer : Fixed Income
Sujit Patki Dealer
Sunaina Da cunha Fund Manager / Research Analyst : Fixed Income
Vineet Maloo Fund Manager/ Research Analyst : Equity
A u g u s t 2 0 0 9
Fund Details
Fund Manager :Managing Fund Since : October 01, 2006Total Experience : 20 yearsDate of inception : August 27, 1998Nature of the scheme : An Open-ended Growth Scheme
Default option : Dividend ReinvestmentFresh Purchase : Rs. 5000/-Additional Purchase : Rs. 1000/-Redemption Cheques : Within 10 working days issuedSystematic Investment : Available Plan (SIP)Systematic Withdrawal : Available Plan (SWP)Systematic Transfer : AvailablePlan (STP)
Dividend : 67.75( )Growth : 210.22
Benchmark : BSE 200Average AUM : Rs. 1,112.67 Crores
Entry Load : Nil
Exit Load** : < Rs. 5 crores – 1% if redeemed / (w.e.f August 03, 2009) switched out within 3 years
> Rs. 5 Crores – Nil.**Exit / Entry Load is NIL for units issued in Bonus & Dividend Reinvestment.
Standard Deviation : 37.61%##Sharpe Ratio : 0.36
Beta : 0.94
Mr. Mahesh Patil
Payout, Reinvestment & Sweep
Key Features
Plans / Options & NAV
Load Structure (Incl for SIP)
Other Parameter
(as on July 31, 2009)
Note: Standard Deviation, Sharpe Ratio & Beta are calculated on Annualised basis using 3 years history of monthly returns, source: MFI Explorer##Risk-free rate assumed to be 3.22%(91 day T-bill yield as on July 31, 2009)
Value Blend Growth Size
Large
Mid
Small
Investment Style
Investment Style Box
As on July 31, 2009
An open-ended growth scheme with the objective of long term growth of capital, through a portfolio with a target allocation of 90% equity and 10% debt and money market securities.
Investment Objective
Banks 13.13ICICI Bank Ltd. 3.05State Bank of India 2.67HDFC Bank Ltd. 2.30Axis Bank Ltd. 2.18Bank of Baroda 1.49Yes Bank Ltd. 1.44
Power 9.38Reliance Infrastructure Ltd. 1.89Tata Power Company Ltd. 1.88KEC International Ltd. 1.76GVK Power & Infrastructure Ltd. 1.56CESC Ltd. 1.33PTC India Ltd 0.95
Software 9.37Infosys Technologies Ltd. 6.34Tata Consultancy Services Ltd. 2.69Megasoft Ltd. 0.34
Industrial Capital Goods 7.41Thermax Ltd. 2.26Crompton Greaves Ltd. 2.12Bharat Heavy Electricals Ltd. 1.28BEML Ltd. 1.11Bharat Bijlee Ltd. 0.63
Telecom-Services 7.35Bharti Airtel Ltd. 6.70Reliance Communications Ltd. 0.64
Petroleum Products 5.49Reliance Industries Ltd. 5.49
Finance 5.23Rural Electrification Corporation Ltd. 2.08HDFC Ltd. 1.86India Infoline Ltd. 1.29
Consumer Non Durables 5.18ITC Ltd. 3.07United Breweries Holdings Ltd. 1.54Shree Renuka Sugar 0.57
Oil 4.32Oil & Natural Gas Corporation Ltd. 4.32
Construction Project 4.20Nagarjuna Construction Company Ltd. 1.53Punj Lloyd Ltd. 1.41Larsen & Toubro Ltd. 1.26
Construction 4.02Housing Development & Infrastructure Ltd 2.27Unitech Ltd. 1.75
Cement 3.58Century Textiles and Industries Ltd 1.58Ultratech Cement Ltd. 1.29Grasim Industries Ltd. 0.70
Media & Entertainment 3.31Zee Entertainment Enterprises Ltd. 1.63Jagran Prakashan Ltd. 1.23Balaji Telefilms Ltd. 0.44Magnasound India Ltd. ** #
Pharmaceuticals 2.28Dr.Reddys Laboratories Ltd. 2.26
Maestro Mediline Systems Ltd. 0.02
Foreign Equity 2.11Sterlite Industries (India) Ltd - Ads 1.15Tata Steel Ltd GDR 0.96
Retailing 1.56Pantaloon Retail (India) Ltd. 1.36Pantaloon Retail (India) Ltd. -Class B 0.20
Ferrous Metals 1.36Tata Steel Limited 1.36
Industrial Products 1.07Max India Ltd. 1.07
Auto 1.03Tata Motors Ltd. 1.03
Non - Ferrous Metals 0.88Sterlite Industries (India) Ltd. 0.88
Diversified 0.60Hindustan Unilever Ltd. 0.60
Future and Options 0.16Reliance Communications FUT Aug09 0.16
Cash & Cash Equivalents 7.83
Net receivables / payables -0.84
Total Net Assets 100.00
Issuer % to NetAssets
Issuer % to NetAssets
Issuer % to NetAssets
Portfolio & Asset Allocation
** Represents thinly traded/ non traded securities and illiquid securities. Total Percentage of thinly/non traded securities is Nil # Indicates less than 0.01
Systematic Investment Plan (SIP)
SIP is a powerful tool that can help you create wealth over time. If you had invested in Birla Sun Life Equity Fund...
Date of First Installment : October 01, 1998
The data assumes the investment of Rs.1,000/- on 1st day of every month or the subsequent working day. Load and Taxes are not considered for computation of returns. Past performance may or may not be sustained in future.
*CAGR Returns are computed after accounting for the cash flow by using the XIRR method (investment internal rate of return)
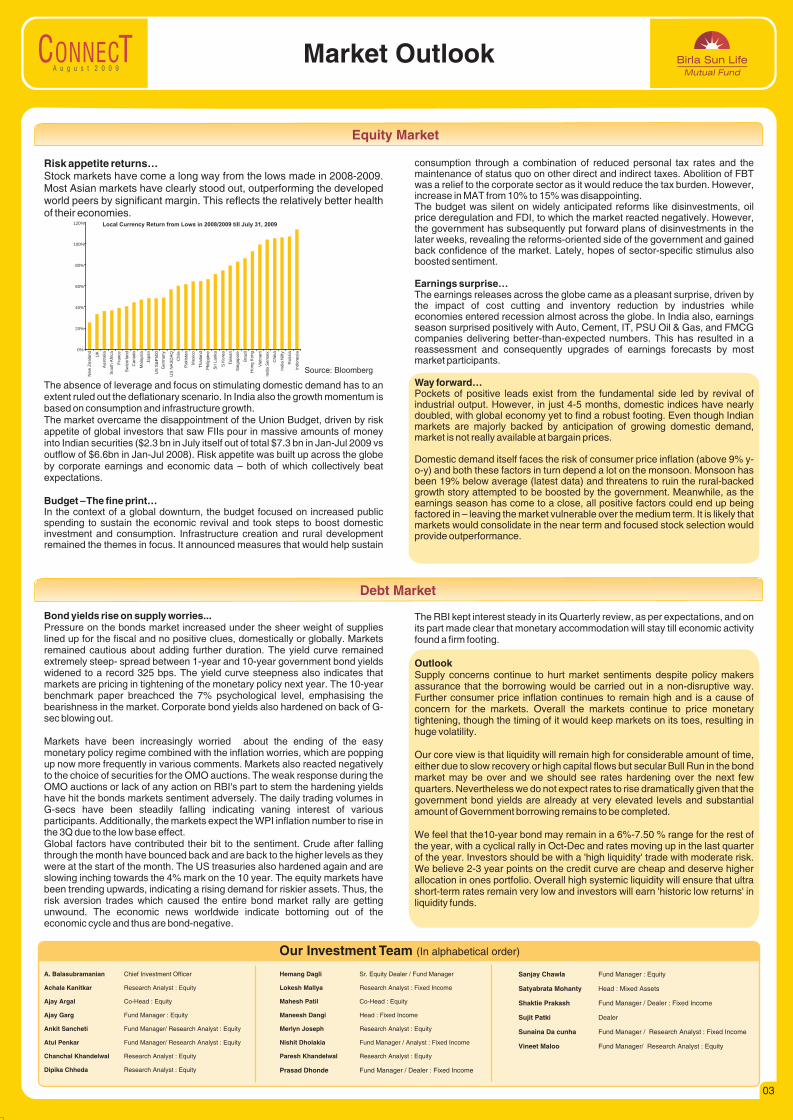
Since Inception 130000 405255 679950 19.73 28.42
Last 5 years 60000 90098 96621 16.28 19.14
Last 3 years 36000 42636 42440 11.31 11.00
Last 1 year 12000 17106 16951 87.76 84.89
Investment Period Total Investment (Rs.) Birla Sun Life
Equity FundBirla Sun Life Equity Fund
BSE 200 BSE 200
Value (Rs.) of SIP in Returns (%)*
Birla Sun Life Equity Fund - Growth BSE 200
% R
etur
ns
Past performance may or may not be sustained in future. Returns are in % and absolute returns for period less than 1 year & CAGR for period 1 year or more.
Investment Performance
(Past performance is no guarantee of future results.) for ranking methodology please refer page 49
«««« #Value Research RatingBirla Sun Life Equity Fund
Equity Diversified (147 Schemes), for 3 & 5 Years periods ending 31-Jul-09
04
Birla Sun Life Equity Fund
13.11
16.52
29.8932.12
8.45
13.98
22.72
18.26
0
10
20
30
40
1 Year 3 Years 5 Years Since Inception
A u g u s t 2 0 0 9
Fund Details
As on July 31, 2009
Investment Objective
Birla Sun Life Midcap Fund
Value Blend Growth Size
Large
Mid
Small
Investment Style
Investment Style Box
Fund Manager :Mr. Sanjay Chawla
Managing Fund Since : September 12,2007Total Experience : 19 years / 20 YearsDate of inception : October 03, 2002Nature of the scheme : An Open-ended Growth Scheme
Default option : Dividend ReinvestmentFresh Purchase : Rs. 5000/-Additional Purchase : Rs. 1000/-Redemption Cheques : Within 10 working days issuedSystematic Investment : Available Plan (SIP)Systematic Withdrawal : Available Plan (SWP)Systematic Transfer : AvailablePlan (STP)
Dividend : 22.66( )Growth : 81.75
Benchmark : CNX MidcapAverage AUM : Rs. 625.08 Crores
Entry Load : Nil
Exit Load** : < Rs. 5 crores – 1% if redeemed / (w.e.f August 03, 2009) switched out within 3 years
> Rs. 5 Crores – Nil.**Exit / Entry Load is NIL for units issued in Bonus & Dividend Reinvestment.
Standard Deviation : 42.15%##Sharpe Ratio : 0.36
Beta : 0.94
Mr. A. Balasubramanian &
Payout, Reinvestment & Sweep
Key Features
Plans / Options & NAV
Load Structure (Incl for SIP)
Other Parameter
(as on July 31, 2009)
Note: Standard Deviation, Sharpe Ratio & Beta are calculated on Annualised basis using 3 years history of monthly returns, source: MFI Explorer##Risk-free rate assumed to be 3.22%(91 day T-bill yield as on July 31, 2009)
(Past performance is no guarantee of future results.) for ranking methodology please refer page 49
CRISIL~CPR 2^^Birla Sun Life Midcap Fund
Small & Mid Equity Schemes ( Schemes), 5 21 Yrs ended 30-Jun-09
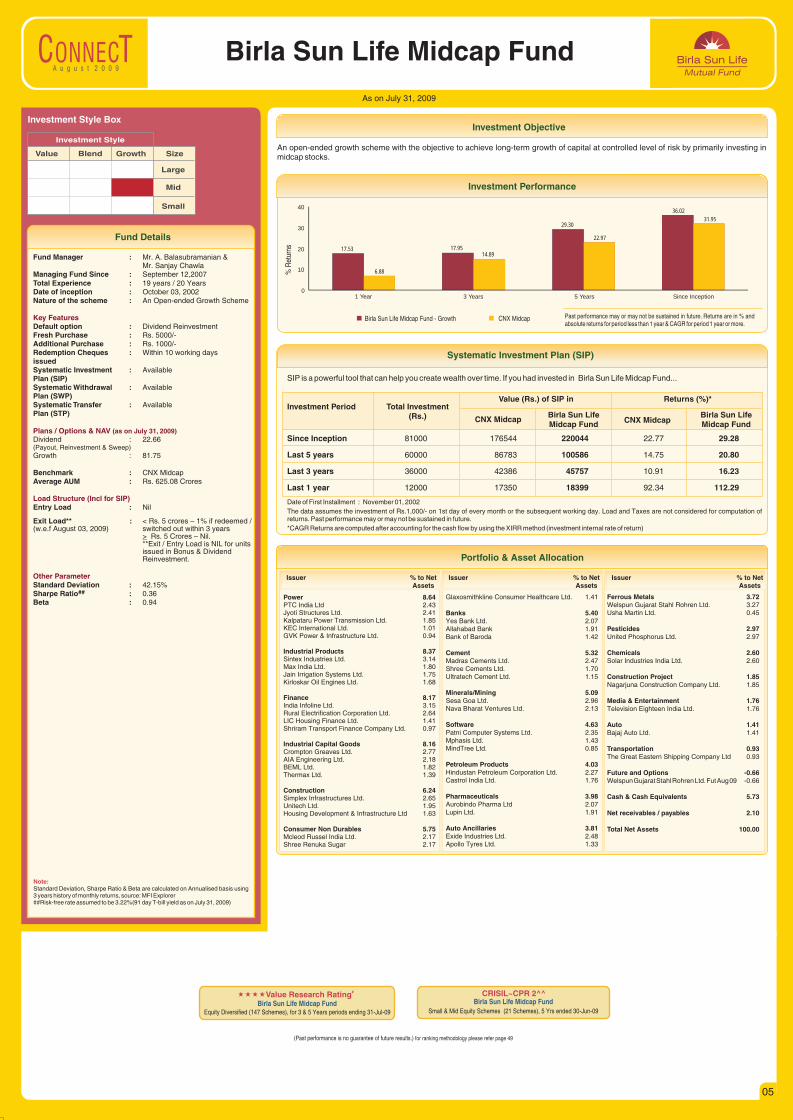
Investment Performance
Birla Sun Life Midcap Fund - Growth CNX Midcap
% R
etur
ns
Past performance may or may not be sustained in future. Returns are in % and absolute returns for period less than 1 year & CAGR for period 1 year or more.
SIP is a powerful tool that can help you create wealth over time. If you had invested in Birla Sun Life Midcap Fund...
Systematic Investment Plan (SIP)
Date of First Installment : November 01, 2002
The data assumes the investment of Rs.1,000/- on 1st day of every month or the subsequent working day. Load and Taxes are not considered for computation of returns. Past performance may or may not be sustained in future.
*CAGR Returns are computed after accounting for the cash flow by using the XIRR method (investment internal rate of return)
Investment Period Total Investment (Rs.) Birla Sun Life
Midcap FundBirla Sun Life Midcap Fund
CNX Midcap CNX Midcap
Value (Rs.) of SIP in Returns (%)*
Since Inception 81000 176544 220044 22.77 29.28
Last 5 years 60000 86783 100586 14.75 20.80
Last 3 years 36000 42386 45757 10.91 16.23
Last 1 year 12000 17350 18399 92.34 112.29
Issuer % to NetAssets
Issuer % to NetAssets
Issuer % to NetAssets
Power 8.64PTC India Ltd 2.43Jyoti Structures Ltd. 2.41Kalpataru Power Transmission Ltd. 1.85KEC International Ltd. 1.01GVK Power & Infrastructure Ltd. 0.94
Industrial Products 8.37Sintex Industries Ltd. 3.14Max India Ltd. 1.80Jain Irrigation Systems Ltd. 1.75Kirloskar Oil Engines Ltd. 1.68
Finance 8.17India Infoline Ltd. 3.15Rural Electrification Corporation Ltd. 2.64LIC Housing Finance Ltd. 1.41Shriram Transport Finance Company Ltd. 0.97
Industrial Capital Goods 8.16Crompton Greaves Ltd. 2.77AIA Engineering Ltd. 2.18BEML Ltd. 1.82Thermax Ltd. 1.39
Construction 6.24Simplex Infrastructures Ltd. 2.65Unitech Ltd. 1.95Housing Development & Infrastructure Ltd 1.63
Consumer Non Durables 5.75Mcleod Russel India Ltd. 2.17Shree Renuka Sugar 2.17
Glaxosmithkline Consumer Healthcare Ltd. 1.41
Banks 5.40Yes Bank Ltd. 2.07Allahabad Bank 1.91Bank of Baroda 1.42
Cement 5.32Madras Cements Ltd. 2.47Shree Cements Ltd. 1.70Ultratech Cement Ltd. 1.15
Minerals/Mining 5.09Sesa Goa Ltd. 2.96Nava Bharat Ventures Ltd. 2.13
Software 4.63Patni Computer Systems Ltd. 2.35Mphasis Ltd. 1.43MindTree Ltd. 0.85
Petroleum Products 4.03Hindustan Petroleum Corporation Ltd. 2.27Castrol India Ltd. 1.76
Pharmaceuticals 3.98Aurobindo Pharma Ltd 2.07Lupin Ltd. 1.91
Auto Ancillaries 3.81Exide Industries Ltd. 2.48Apollo Tyres Ltd. 1.33
Ferrous Metals 3.72Welspun Gujarat Stahl Rohren Ltd. 3.27Usha Martin Ltd. 0.45
Pesticides 2.97United Phosphorus Ltd. 2.97
Chemicals 2.60Solar Industries India Ltd. 2.60
Construction Project 1.85Nagarjuna Construction Company Ltd. 1.85
Media & Entertainment 1.76Television Eighteen India Ltd. 1.76
Auto 1.41Bajaj Auto Ltd. 1.41
Transportation 0.93The Great Eastern Shipping Company Ltd 0.93
Future and Options -0.66Welspun Gujarat Stahl Rohren Ltd. Fut Aug 09 -0.66
Cash & Cash Equivalents 5.73
Net receivables / payables 2.10
Total Net Assets 100.00
Portfolio & Asset Allocation
05
An open-ended growth scheme with the objective to achieve long-term growth of capital at controlled level of risk by primarily investing in midcap stocks.
«««« #Value Research RatingBirla Sun Life Midcap Fund
Equity Diversified (147 Schemes), for 3 & 5 Years periods ending 31-Jul-09
17.53 17.95
29.30
36.02
6.88
14.89
22.97
31.95
0
10
20
30
40
1 Year 3 Years 5 Years Since Inception
A u g u s t 2 0 0 9
Fund Details
Investment Objective
06
Birla Sun Life Frontline Equity Fund
As on July 31, 2009
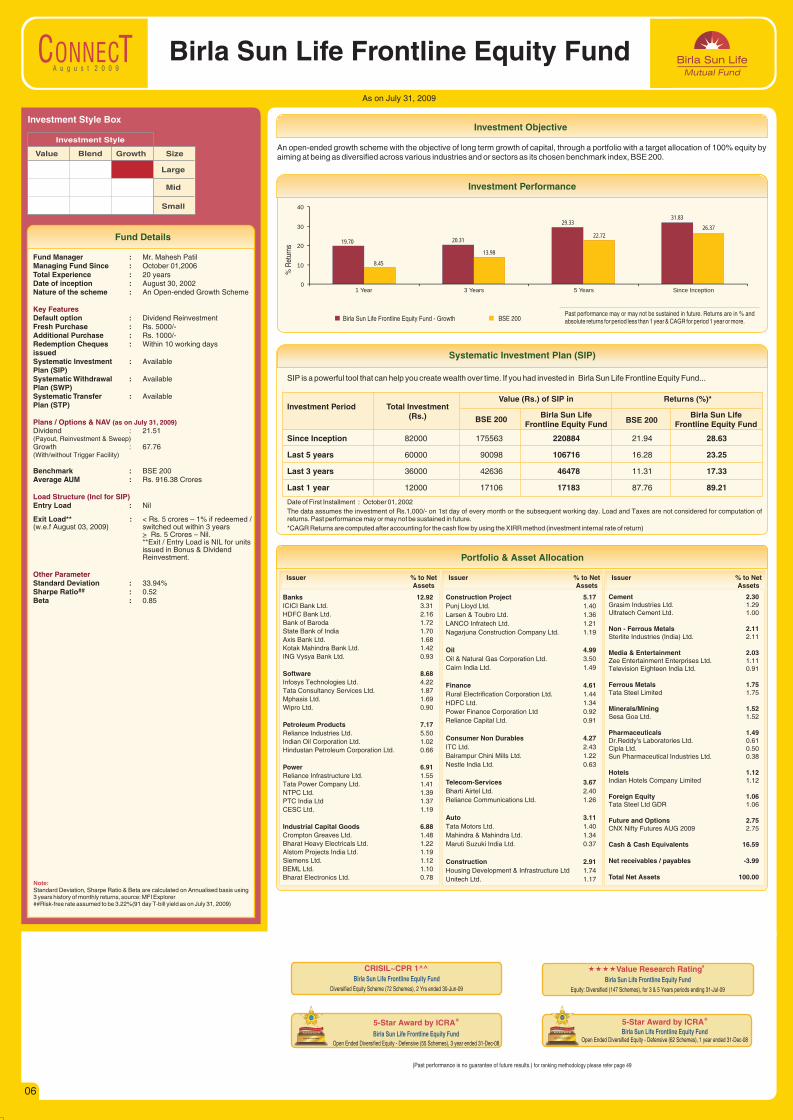
An open-ended growth scheme with the objective of long term growth of capital, through a portfolio with a target allocation of 100% equity by aiming at being as diversified across various industries and or sectors as its chosen benchmark index, BSE 200.
Investment Performance
Birla Sun Life Frontline Equity Fund - Growth BSE 200
% R
etur
ns
Past performance may or may not be sustained in future. Returns are in % and absolute returns for period less than 1 year & CAGR for period 1 year or more.
SIP is a powerful tool that can help you create wealth over time. If you had invested in Birla Sun Life Frontline Equity Fund...
Systematic Investment Plan (SIP)
Date of First Installment : October 01, 2002
The data assumes the investment of Rs.1,000/- on 1st day of every month or the subsequent working day. Load and Taxes are not considered for computation of returns. Past performance may or may not be sustained in future.
*CAGR Returns are computed after accounting for the cash flow by using the XIRR method (investment internal rate of return)
Investment Period Total Investment (Rs.) Birla Sun Life
Frontline Equity FundBirla Sun Life
Frontline Equity FundBSE 200 BSE 200
Value (Rs.) of SIP in Returns (%)*
Since Inception 82000 175563 220884 21.94 28.63
Last 5 years 60000 90098 106716 16.28 23.25
Last 3 years 36000 42636 46478 11.31 17.33
Last 1 year 12000 17106 17183 87.76 89.21
Issuer % to NetAssets
Issuer % to NetAssets
Issuer % to NetAssets
Banks 12.92ICICI Bank Ltd. 3.31
HDFC Bank Ltd. 2.16
Bank of Baroda 1.72
State Bank of India 1.70
Axis Bank Ltd. 1.68
Kotak Mahindra Bank Ltd. 1.42
ING Vysya Bank Ltd. 0.93
Software 8.68Infosys Technologies Ltd. 4.22
Tata Consultancy Services Ltd. 1.87
Mphasis Ltd. 1.69
Wipro Ltd. 0.90
Petroleum Products 7.17Reliance Industries Ltd. 5.50
Indian Oil Corporation Ltd. 1.02
Hindustan Petroleum Corporation Ltd. 0.66
Power 6.91Reliance Infrastructure Ltd. 1.55
Tata Power Company Ltd. 1.41
NTPC Ltd. 1.39
PTC India Ltd 1.37
CESC Ltd. 1.19
Industrial Capital Goods 6.88Crompton Greaves Ltd. 1.48
Bharat Heavy Electricals Ltd. 1.22
Alstom Projects India Ltd. 1.19
Siemens Ltd. 1.12
BEML Ltd. 1.10
Bharat Electronics Ltd. 0.78
Construction Project 5.17Punj Lloyd Ltd. 1.40
Larsen & Toubro Ltd. 1.36
LANCO Infratech Ltd. 1.21
Nagarjuna Construction Company Ltd. 1.19
Oil 4.99Oil & Natural Gas Corporation Ltd. 3.50
Cairn India Ltd. 1.49
Finance 4.61Rural Electrification Corporation Ltd. 1.44
HDFC Ltd. 1.34
Power Finance Corporation Ltd 0.92
Reliance Capital Ltd. 0.91
Consumer Non Durables 4.27ITC Ltd. 2.43
Balrampur Chini Mills Ltd. 1.22
Nestle India Ltd. 0.63
Telecom-Services 3.67Bharti Airtel Ltd. 2.40
Reliance Communications Ltd. 1.26
Auto 3.11Tata Motors Ltd. 1.40
Mahindra & Mahindra Ltd. 1.34
Maruti Suzuki India Ltd. 0.37
Construction 2.91Housing Development & Infrastructure Ltd 1.74
Unitech Ltd. 1.17
Cement 2.30Grasim Industries Ltd. 1.29Ultratech Cement Ltd. 1.00
Non - Ferrous Metals 2.11Sterlite Industries (India) Ltd. 2.11
Media & Entertainment 2.03Zee Entertainment Enterprises Ltd. 1.11Television Eighteen India Ltd. 0.91
Ferrous Metals 1.75Tata Steel Limited 1.75
Minerals/Mining 1.52Sesa Goa Ltd. 1.52
Pharmaceuticals 1.49Dr.Reddy's Laboratories Ltd. 0.61Cipla Ltd. 0.50Sun Pharmaceutical Industries Ltd. 0.38
Hotels 1.12Indian Hotels Company Limited 1.12
Foreign Equity 1.06Tata Steel Ltd GDR 1.06
Future and Options 2.75CNX Nifty Futures AUG 2009 2.75
Cash & Cash Equivalents 16.59
Net receivables / payables -3.99
Total Net Assets 100.00
Portfolio & Asset Allocation
(Past performance is no guarantee of future results.) for ranking methodology please refer page 49
CRISIL~CPR 1^^Birla Sun Life Frontline Equity Fund
Diversified Equity Scheme (72 Schemes), 2 Yrs ended 30-Jun-09
5-Star Award by @ICRABirla Sun Life Frontline Equity Fund
Open Ended Diversified Equity - Defensive (55 Schemes), 3 year ended 31-Dec-08
««««V #alue Research RatingBirla Sun Life Frontline Equity Fund
Equity: Diversified (147 Schemes), for 3 & 5 Years periods ending 31-Jul-09
5-Star Award by @ICRABirla Sun Life Frontline Equity Fund
Open Ended Diversified Equity - Defensive (62 Schemes), 1 year ended 31-Dec-08
Value Blend Growth Size
Large
Mid
Small
Investment Style
Investment Style Box
Fund Manager :Managing Fund Since : October 01,2006Total Experience : 20 yearsDate of inception : August 30, 2002Nature of the scheme : An Open-ended Growth Scheme
Default option : Dividend ReinvestmentFresh Purchase : Rs. 5000/-Additional Purchase : Rs. 1000/-Redemption Cheques : Within 10 working days issuedSystematic Investment : Available Plan (SIP)Systematic Withdrawal : Available Plan (SWP)Systematic Transfer : AvailablePlan (STP)
Dividend : 21.51( )Growth : 67.76(With/without Trigger Facility)
Benchmark : BSE 200Average AUM : Rs. 916.38 Crores
Entry Load : Nil
Exit Load** : < Rs. 5 crores – 1% if redeemed / (w.e.f August 03, 2009) switched out within 3 years
> Rs. 5 Crores – Nil.**Exit / Entry Load is NIL for units issued in Bonus & Dividend Reinvestment.
Standard Deviation : 33.94%##Sharpe Ratio : 0.52
Beta : 0.85
Mr. Mahesh Patil
Payout, Reinvestment & Sweep
Key Features
Plans / Options & NAV
Load Structure (Incl for SIP)
Other Parameter
(as on July 31, 2009)
Note: Standard Deviation, Sharpe Ratio & Beta are calculated on Annualised basis using 3 years history of monthly returns, source: MFI Explorer##Risk-free rate assumed to be 3.22%(91 day T-bill yield as on July 31, 2009)
19.70 20.31
29.3331.83
8.45
13.98
22.72
26.37
0
10
20
30
40
1 Year 3 Years 5 Years Since Inception

A u g u s t 2 0 0 9
Fund Details
Investment Objective
As on July 31, 2009
Birla Sun Life Tax Relief ‘96An open - ended Equity Linked Savings Scheme (ELSS) with a lock-in of 3 years
Value Blend Growth Size
Large
Mid
Small
Investment Style
Investment Style Box
Fund Manager :Managing Fund Since : October 01,2006Total Experience : 15 yearsDate of inception : March 29, 1996Nature of the scheme : An Open-ended ELSS Scheme
Default option : Dividend PayoutFresh Purchase : Rs. 500/-Additional Purchase : Rs. 500/-Redemption Cheques : Within 10 working days issuedSystematic Investment : Available Plan (SIP)Systematic Withdrawal : Not Available Plan (SWP)Systematic Transfer : Not AvailablePlan (STP)
Dividend : 77.16(Payout, Reinvestment & Sweep)Growth (w.e.f. 06/03/08) : 9.07
Benchmark : BSE 200Average AUM : Rs. 896.39 Crores
Entry Load : Nil
Exit Load : Nil
Standard Deviation : 41.97%##Sharpe Ratio : 0.27
Beta : 1.04
Mr. Ajay Garg
Key Features
Plans / Options & NAV
Load Structure (Incl for SIP)
Other Parameter
(as on July 31, 2009)
Note: Standard Deviation, Sharpe Ratio & Beta are calculated on Annualised basis using 3 years history of monthly returns, source: MFI Explorer##Risk-free rate assumed to be 3.22%(91 day T-bill yield as on July 31, 2009)
07
An open-ended equity linked savings scheme (ELSS) with the objective of long term growth of capital through a portfolio with a target allocation of 80% equity, 20% debt and money market securities
Investment Performance
Birla Sun Life Tax Relief ‘96 - Dividend BSE 200
% R
etur
ns
Past performance may or may not be sustained in future. Returns are in % and absolute returns for period less than 1 year & CAGR for period 1 year or more. Returns assume reinvestment of the tax free dividend declared.
SIP is a powerful tool that can help you create wealth over time. If you had invested in Birla Sun Life Tax Relief ‘96...
Systematic Investment Plan (SIP)
Date of First Installment : April 01, 1996
The data assumes the investment of Rs.1,000/- on 1st day of every month or the subsequent working day. Load and Taxes are not considered for computation of returns. Past performance may or may not be sustained in future.
*CAGR Returns are computed after accounting for the cash flow by using the XIRR method (investment internal rate of return)
Investment Period Total Investment (Rs.) Birla Sun Life
Tax Relief ‘96Birla Sun Life Tax
Relief ‘96BSE 200 BSE 200
Value (Rs.) of SIP in Returns (%)*
Since Inception 160000 567805 1586726 17.48 30.88
Last 5 years 60000 90098 88868 16.28 15.72
Last 3 years 36000 42636 41882 11.31 10.09
Last 1 year 12000 17106 17605 87.76 97.13
Issuer % to NetAssets
Issuer % to NetAssets
Issuer % to NetAssets
Banks 15.12State Bank of India 3.34ICICI Bank Ltd. 3.00HDFC Bank Ltd. 2.76ING Vysya Bank Ltd. 2.58Axis Bank Ltd. 2.53Kotak Mahindra Bank Ltd. 0.90
Industrial Capital Goods 8.47Bharat Heavy Electricals Ltd. 3.28Honeywell Automation India Ltd. 2.80Crompton Greaves Ltd. 1.51Bharat Bijlee Ltd. 0.56Siemens Ltd. 0.32
Software 8.39Infosys Technologies Ltd. 5.32Tata Consultancy Services Ltd. 1.94Wipro Ltd. 1.13
Power 8.18Reliance Infrastructure Ltd. 4.44Torrent Power Ltd. 2.54GVK Power & Infrastructure Ltd. 1.20
Petroleum Products 7.96Reliance Industries Ltd. 5.95Reliance Petroleum Ltd. 2.01
Finance 7.90HDFC Ltd. 3.26
ICRA Ltd. 3.19India Infoline Ltd. 1.45
Ferrous Metals 7.16Jindal Steel & Power Ltd. 4.60Tata Steel Limited 2.56
Construction Project 5.55Larsen & Toubro Ltd. 5.55
Telecom-Services 4.55Bharti Airtel Ltd. 3.02Reliance Communications Ltd. 1.52
Hotels 4.30Indian Hotels Company Limited 2.51Taj GVK Hotels & Resorts Ltd. 1.02Asian Hotels Ltd. 0.77
Auto 3.79Maruti Suzuki India Ltd. 2.21Mahindra & Mahindra Ltd. 1.58
Non - Ferrous Metals 3.63Hindalco Industries Ltd. 1.84Sterlite Industries (India) Ltd. 1.78
Consumer Non Durables 3.18United Breweries Holdings Ltd. 1.51United Spirits Ltd. 1.04Radico Khaitan Ltd. 0.63
Auto Ancillaries 3.14Bosch Ltd. 1.86MRF Ltd. 1.28
Pesticides 2.21United Phosphorus Ltd. 1.89Rallis India Ltd. 0.32
Industrial Products 1.77Cummins India Ltd. 1.77
Transportation 1.29Jet Airways India Ltd. 0.78Container Corporation of India Ltd. 0.51
Media & Entertainment 1.12Television Eighteen India Ltd. 1.12Magnasound India Ltd. ** #
Foreign Equity 0.88Sterlite Industries (India) Ltd - ADR 0.88
Trading 0.26Uniphos Enterprises Ltd. 0.26
Cash & Cash Equivalents 1.34
Net receivables / payables -0.18
Total Net Assets 100.00
Portfolio & Asset Allocation
** Represents thinly traded/ non traded securities and illiquid securities. Total Percentage of thinly/non traded securities is Nil # Indicates less than 0.01
11.6814.10
21.47
32.66
8.45
13.98
22.72
13.67
0
10
20
30
40
1 Year 3 Years 5 Years Since Inception
A u g u s t 2 0 0 9
Fund Details
Investment Objective
08
As on July 31, 2009
Birla Sun Life Infrastructure Fund
Value Blend Growth Size
Large
Mid
Small
Investment Style
Investment Style Box
Fund Manager :Managing Fund Since : Since inceptionTotal Experience : 20 yearsDate of inception : March 17, 2006Nature of the scheme : An Open-ended Growth Scheme
Default option : Dividend ReinvestmentPlan AFresh Purchase : Rs. 5000/-Additional Purchase : Rs. 1000/-Plan BFresh Purchase : Rs. 5,00,000/-Additional Purchase : Rs. 1000/-Redemption Cheques : Within 10 working days issuedSystematic Investment : Available Plan (SIP)Systematic Withdrawal : Available Plan (SWP)Systematic Transfer : AvailablePlan (STP)
Plan ADividend : 12.14( )Growth : 14.24Plan BDividend : 10.21(Payout, Reinvestment & Sweep)Growth : 10.64
Benchmark : S&P CNX NIFTYAverage AUM : Rs. 499.31 Crores
Entry Load : For Plan A: Nil
For Plan B: Nil
Exit Load** : For Plan A: < Rs. 5 crores – 1% (w.e.f August 06, 2009) if redeemed / switched out within
3 years > Rs. 5 Crores – Nil.For Plan B: If redeemed / switched out within 15 days from the date of allotment - 1%.After 15 days – Nil.**Exit / Entry Load is NIL for units issued in Bonus & Dividend Reinvestment.
Standard Deviation : 41.66%##Sharpe Ratio : 0.32
Beta : 1.11
Mr. Mahesh Patil
Payout, Reinvestment & Sweep
Key Features
Plans / Options & NAV
Load Structure (Incl for SIP)
Other Parameter
(as on July 31, 2009)
Note: Standard Deviation, Sharpe Ratio & Beta are calculated on Annualised basis using 3 years history of monthly returns, source: MFI Explorer##Risk-free rate assumed to be 3.22%(91 day T-bill yield as on July 31, 2009)
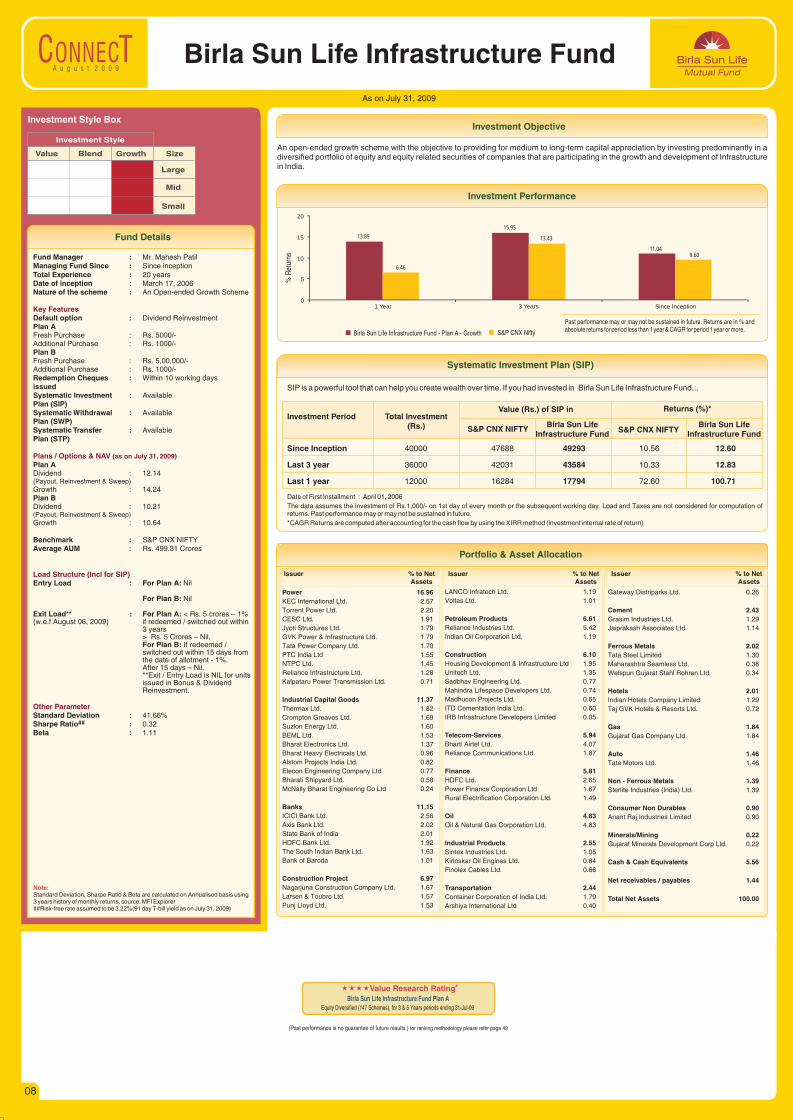
An open-ended growth scheme with the objective to providing for medium to long-term capital appreciation by investing predominantly in a diversified portfolio of equity and equity related securities of companies that are participating in the growth and development of Infrastructure in India.
Investment Performance
Birla Sun Life Infrastructure Fund - Plan A - Growth S&P CNX Nifty
% R
etur
ns
Past performance may or may not be sustained in future. Returns are in % and absolute returns for period less than 1 year & CAGR for period 1 year or more.
SIP is a powerful tool that can help you create wealth over time. If you had invested in Birla Sun Life Infrastructure Fund...
Systematic Investment Plan (SIP)
Date of First Installment : April 01, 2006
The data assumes the investment of Rs.1,000/- on 1st day of every month or the subsequent working day. Load and Taxes are not considered for computation of returns. Past performance may or may not be sustained in future.
*CAGR Returns are computed after accounting for the cash flow by using the XIRR method (investment internal rate of return)
Investment Period Total Investment (Rs.) Birla Sun Life
Infrastructure FundBirla Sun Life
Infrastructure FundS&P CNX NIFTY S&P CNX NIFTY
Value (Rs.) of SIP in Returns (%)*
Since Inception 40000 47688 49293 10.56 12.60
Last 3 year 36000 42031 43584 10.33 12.83
Last 1 year 12000 16284 17794 72.60 100.71
Issuer % to NetAssets
Issuer % to NetAssets
Issuer % to NetAssets
Power 16.96KEC International Ltd. 2.57
Torrent Power Ltd. 2.20
CESC Ltd. 1.91
Jyoti Structures Ltd. 1.79
GVK Power & Infrastructure Ltd. 1.79
Tata Power Company Ltd. 1.70
PTC India Ltd 1.55
NTPC Ltd. 1.45
Reliance Infrastructure Ltd. 1.28
Kalpataru Power Transmission Ltd. 0.71
Industrial Capital Goods 11.37Thermax Ltd. 1.82
Crompton Greaves Ltd. 1.69
Suzlon Energy Ltd. 1.60
BEML Ltd. 1.53
Bharat Electronics Ltd. 1.37
Bharat Heavy Electricals Ltd. 0.96
Alstom Projects India Ltd. 0.82
Elecon Engineering Company Ltd. 0.77
Bharati Shipyard Ltd. 0.58
McNally Bharat Engineering Co Ltd 0.24
Banks 11.15ICICI Bank Ltd. 2.56
Axis Bank Ltd. 2.02
State Bank of India 2.01
HDFC Bank Ltd. 1.92
The South Indian Bank Ltd. 1.63
Bank of Baroda 1.01
Construction Project 6.97Nagarjuna Construction Company Ltd. 1.67
Larsen & Toubro Ltd. 1.57
Punj Lloyd Ltd. 1.53
LANCO Infratech Ltd. 1.19
Voltas Ltd. 1.01
Petroleum Products 6.61Reliance Industries Ltd. 5.42
Indian Oil Corporation Ltd. 1.19
Construction 6.10Housing Development & Infrastructure Ltd 1.95
Unitech Ltd. 1.35
Sadbhav Engineering Ltd. 0.77
Mahindra Lifespace Developers Ltd. 0.74
Madhucon Projects Ltd. 0.65
ITD Cementation India Ltd. 0.60
IRB Infrastructure Developers Limited 0.05
Telecom-Services 5.94Bharti Airtel Ltd. 4.07
Reliance Communications Ltd. 1.87
Finance 5.81HDFC Ltd. 2.65
Power Finance Corporation Ltd 1.67
Rural Electrification Corporation Ltd. 1.49
Oil 4.83Oil & Natural Gas Corporation Ltd. 4.83
Industrial Products 2.55Sintex Industries Ltd. 1.05
Kirloskar Oil Engines Ltd. 0.84
Finolex Cables Ltd. 0.66
Transportation 2.44Container Corporation of India Ltd. 1.79
Arshiya International Ltd 0.40
Gateway Distriparks Ltd. 0.26
Cement 2.43Grasim Industries Ltd. 1.29
Jaiprakash Associates Ltd. 1.14
Ferrous Metals 2.02Tata Steel Limited 1.30
Maharashtra Seamless Ltd. 0.38
Welspun Gujarat Stahl Rohren Ltd. 0.34
Hotels 2.01Indian Hotels Company Limited 1.29
Taj GVK Hotels & Resorts Ltd. 0.72
Gas 1.84Gujarat Gas Company Ltd. 1.84
Auto 1.46Tata Motors Ltd. 1.46
Non - Ferrous Metals 1.39Sterlite Industries (India) Ltd. 1.39
Consumer Non Durables 0.90Anant Raj Industries Limited 0.90
Minerals/Mining 0.22Gujarat Minerals Development Corp Ltd. 0.22
Cash & Cash Equivalents 5.56
Net receivables / payables 1.44
Total Net Assets 100.00
Portfolio & Asset Allocation
(Past performance is no guarantee of future results.) for ranking methodology please refer page 49
««««V #alue Research RatingBirla Sun Life Infrastructure Fund Plan A
Equity Diversified (147 Schemes), for 3 & 5 Years periods ending 31-Jul-09
13.89
15.95
11.04
6.46
13.43
9.60
0
5
10
15
20
1 Year 3 Years Since Inception
A u g u s t 2 0 0 9
Fund Details
Investment Objective
As on July 31, 2009
09
Birla Sun Life Basic Industries Fund
Value Blend Growth Size
Large
Mid
Small
Investment Style
Investment Style Box
Fund Manager :Managing Fund Since : November 30,2007Total Experience : 11 yearsDate of inception : January 15, 2000Nature of the scheme : An Open-ended Growth Scheme
Default option : Dividend ReinvestmentFresh Purchase : Rs. 5000/-Additional Purchase : Rs. 1000/-Redemption Cheques : Within 10 working days issued Systematic Investment : Available Plan (SIP)Systematic Withdrawal : Available Plan (SWP)Systematic Transfer : AvailablePlan (STP)
Dividend : 25.57(Payout, Reinvestment & Sweep)Growth : 79.72
Benchmark : BSE 200Average AUM : Rs. 119.85 Crores
Entry Load : Nil
Exit Load** : < Rs. 5 crores – 1% if redeemed/ (w.e.f August 03, 2009) switched out within 3 years
> Rs. 5 Crores – Nil.**Exit / Entry Load is NIL for units issued in Bonus & Dividend Reinvestment.
Standard Deviation : 40.23%##Sharpe Ratio : 0.26
Beta : 1.00
Mr. Ankit Sancheti
Key Features
Plans / Options & NAV
Load Structure (Incl for SIP)
Other Parameter
(as on July 31, 2009)
Note: Standard Deviation, Sharpe Ratio & Beta are calculated on Annualised basis using 3 years history of monthly returns, source: MFI Explorer##Risk-free rate assumed to be 3.22%(91 day T-bill yield as on July 31, 2009)
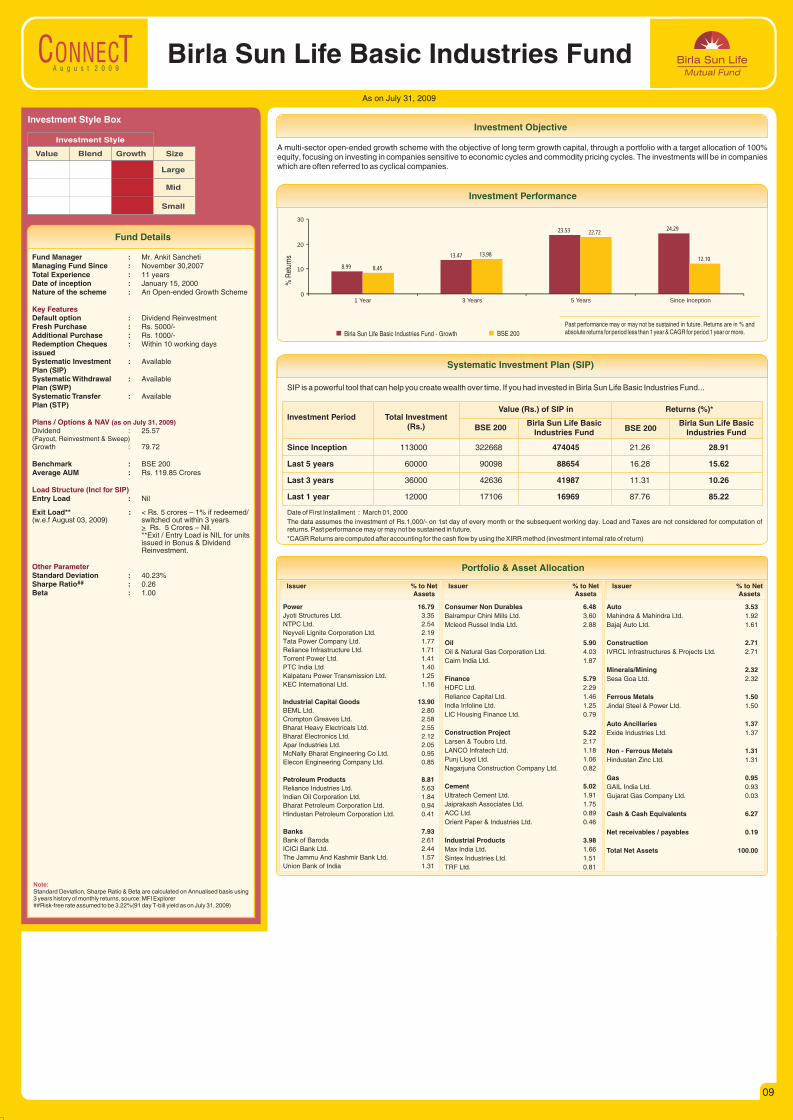
A multi-sector open-ended growth scheme with the objective of long term growth capital, through a portfolio with a target allocation of 100% equity, focusing on investing in companies sensitive to economic cycles and commodity pricing cycles. The investments will be in companies which are often referred to as cyclical companies.
Investment Performance
Birla Sun Life Basic Industries Fund - Growth BSE 200
% R
etur
ns
Past performance may or may not be sustained in future. Returns are in % and absolute returns for period less than 1 year & CAGR for period 1 year or more.
SIP is a powerful tool that can help you create wealth over time. If you had invested in Birla Sun Life Basic Industries Fund...
Systematic Investment Plan (SIP)
Date of First Installment : March 01, 2000
The data assumes the investment of Rs.1,000/- on 1st day of every month or the subsequent working day. Load and Taxes are not considered for computation of returns. Past performance may or may not be sustained in future.
*CAGR Returns are computed after accounting for the cash flow by using the XIRR method (investment internal rate of return)
Investment Period Total Investment (Rs.) Birla Sun Life Basic
Industries FundBirla Sun Life Basic
Industries FundBSE 200 BSE 200
Value (Rs.) of SIP in Returns (%)*
Since Inception 113000 322668 474045 21.26 28.91
Last 5 years 60000 90098 88654 16.28 15.62
Last 3 years 36000 42636 41987 11.31 10.26
Last 1 year 12000 17106 16969 87.76 85.22
Issuer % to NetAssets
Issuer % to NetAssets
Issuer % to NetAssets
Power 16.79Jyoti Structures Ltd. 3.35
NTPC Ltd. 2.54
Neyveli Lignite Corporation Ltd. 2.19
Tata Power Company Ltd. 1.77
Reliance Infrastructure Ltd. 1.71
Torrent Power Ltd. 1.41
PTC India Ltd 1.40
Kalpataru Power Transmission Ltd. 1.25
KEC International Ltd. 1.16
Industrial Capital Goods 13.90BEML Ltd. 2.80
Crompton Greaves Ltd. 2.58
Bharat Heavy Electricals Ltd. 2.55
Bharat Electronics Ltd. 2.12
Apar Industries Ltd. 2.05
McNally Bharat Engineering Co Ltd. 0.95
Elecon Engineering Company Ltd. 0.85
Petroleum Products 8.81Reliance Industries Ltd. 5.63
Indian Oil Corporation Ltd. 1.84
Bharat Petroleum Corporation Ltd. 0.94
Hindustan Petroleum Corporation Ltd. 0.41
Banks 7.93Bank of Baroda 2.61
ICICI Bank Ltd. 2.44
The Jammu And Kashmir Bank Ltd. 1.57
Union Bank of India 1.31
Consumer Non Durables 6.48Balrampur Chini Mills Ltd. 3.60
Mcleod Russel India Ltd. 2.88
Oil 5.90Oil & Natural Gas Corporation Ltd. 4.03
Cairn India Ltd. 1.87
Finance 5.79HDFC Ltd. 2.29
Reliance Capital Ltd. 1.46
India Infoline Ltd. 1.25
LIC Housing Finance Ltd. 0.79
Construction Project 5.22Larsen & Toubro Ltd. 2.17
LANCO Infratech Ltd. 1.18
Punj Lloyd Ltd. 1.06
Nagarjuna Construction Company Ltd. 0.82
Cement 5.02Ultratech Cement Ltd. 1.91
Jaiprakash Associates Ltd. 1.75
ACC Ltd. 0.89
Orient Paper & Industries Ltd. 0.46
Industrial Products 3.98Max India Ltd. 1.66
Sintex Industries Ltd. 1.51
TRF Ltd. 0.81
Auto 3.53Mahindra & Mahindra Ltd. 1.92
Bajaj Auto Ltd. 1.61
Construction 2.71IVRCL Infrastructures & Projects Ltd. 2.71
Minerals/Mining 2.32Sesa Goa Ltd. 2.32
Ferrous Metals 1.50Jindal Steel & Power Ltd. 1.50
Auto Ancillaries 1.37Exide Industries Ltd. 1.37
Non - Ferrous Metals 1.31Hindustan Zinc Ltd. 1.31
Gas 0.95GAIL India Ltd. 0.93
Gujarat Gas Company Ltd. 0.03
Cash & Cash Equivalents 6.27
Net receivables / payables 0.19
Total Net Assets 100.00
Portfolio & Asset Allocation
8.99
13.47
23.53 24.29
8.45
13.98
22.72
12.10
0
10
20
30
1 Year 3 Years 5 Years Since Inception
A u g u s t 2 0 0 9
Fund Details
Investment Objective
10
Birla Sun Life India GenNext FundAs on July 31, 2009
Value Blend Growth Size
Large
Mid
Small
Investment Style
Investment Style Box
Fund Manager :Mr. Sanjay Chawla
Managing Fund Since : September 12,2007Total Experience : 19 years / 20 yearsDate of inception : August 05, 2005Nature of the scheme : An Open-ended Growth Scheme
Default option : Dividend ReinvestmentFresh Purchase : Rs. 5000/-Additional Purchase : Rs. 1000/-Redemption Cheques : Within 10 working days issuedSystematic Investment : Available Plan (SIP)Systematic Withdrawal : Available Plan (SWP)Systematic Transfer : AvailablePlan (STP)
Dividend : 12.27(Payout, Reinvestment & Sweep)Growth : 17.54
Benchmark : S&P CNX NIFTYAverage AUM : Rs. 89.87 Crores
Entry Load : Nil
Exit Load** : < Rs. 5 crores – 1% if redeemed/ (w.e.f August 03, 2009) switched out within 3 years
> Rs. 5 Crores – Nil.**Exit / Entry Load is NIL for units issued in Bonus & Dividend Reinvestment.
Standard Deviation : 29.49%##Sharpe Ratio : 0.39
Beta : 0.76
Mr. A.Balasubramanian &
Key Features
Plans / Options & NAV
Load Structure (Incl for SIP)
Other Parameter
(as on July 31, 2009)
Note: Standard Deviation, Sharpe Ratio & Beta are calculated on Annualised basis using 3 years history of monthly returns, source: MFI Explorer##Risk-free rate assumed to be 3.22%(91 day T-bill yield as on July 31, 2009)
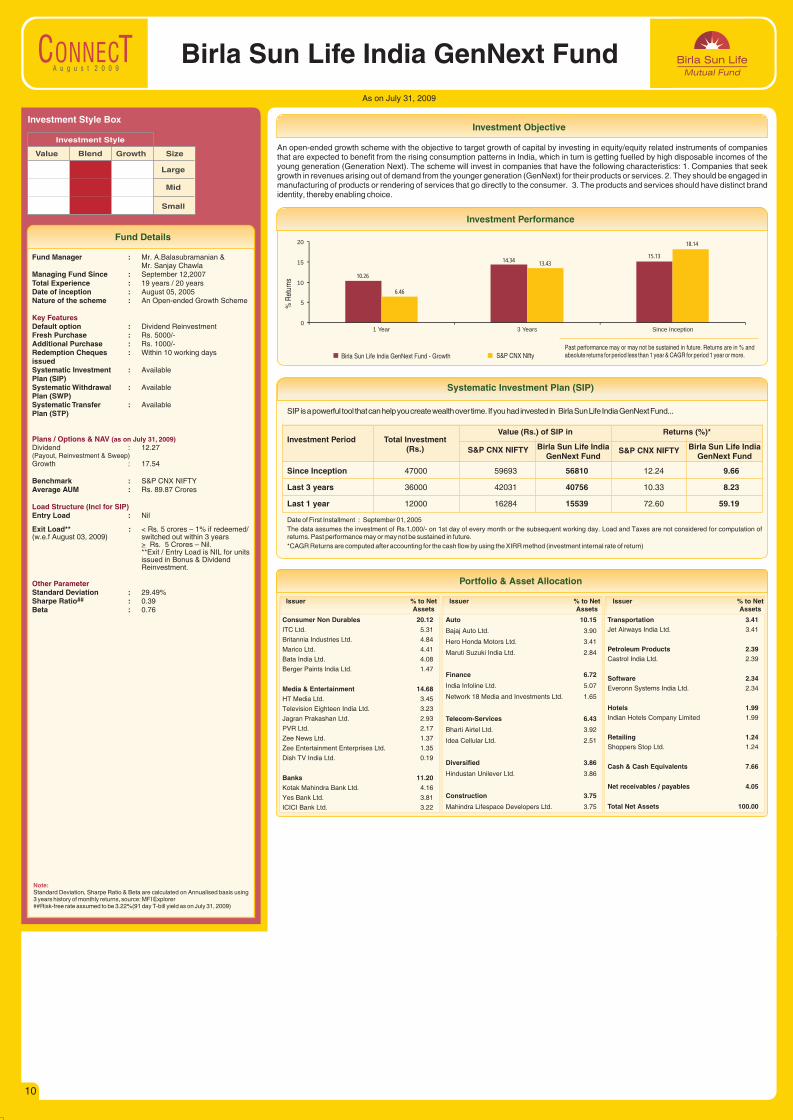
An open-ended growth scheme with the objective to target growth of capital by investing in equity/equity related instruments of companies that are expected to benefit from the rising consumption patterns in India, which in turn is getting fuelled by high disposable incomes of the young generation (Generation Next). The scheme will invest in companies that have the following characteristics: 1. Companies that seek growth in revenues arising out of demand from the younger generation (GenNext) for their products or services. 2. They should be engaged in manufacturing of products or rendering of services that go directly to the consumer. 3. The products and services should have distinct brand identity, thereby enabling choice.
Investment Performance
Birla Sun Life India GenNext Fund - Growth S&P CNX Nifty
% R
etur
ns
Past performance may or may not be sustained in future. Returns are in % and absolute returns for period less than 1 year & CAGR for period 1 year or more.
SIP is a powerful tool that can help you create wealth over time. If you had invested in Birla Sun Life India GenNext Fund...
Systematic Investment Plan (SIP)
Date of First Installment : September 01, 2005
The data assumes the investment of Rs.1,000/- on 1st day of every month or the subsequent working day. Load and Taxes are not considered for computation of returns. Past performance may or may not be sustained in future.
*CAGR Returns are computed after accounting for the cash flow by using the XIRR method (investment internal rate of return)
Investment Period Total Investment (Rs.) Birla Sun Life India
GenNext FundBirla Sun Life India
GenNext FundS&P CNX NIFTY S&P CNX NIFTY
Value (Rs.) of SIP in Returns (%)*
Since Inception 47000 59693 56810 12.24 9.66
Last 3 years 36000 42031 40756 10.33 8.23
Last 1 year 12000 16284 15539 72.60 59.19
Issuer % to NetAssets
Issuer % to NetAssets
Issuer % to NetAssets
Consumer Non Durables 20.12ITC Ltd. 5.31
Britannia Industries Ltd. 4.84
Marico Ltd. 4.41
Bata India Ltd. 4.08
Berger Paints India Ltd. 1.47
Media & Entertainment 14.68HT Media Ltd. 3.45
Television Eighteen India Ltd. 3.23
Jagran Prakashan Ltd. 2.93
PVR Ltd. 2.17
Zee News Ltd. 1.37
Zee Entertainment Enterprises Ltd. 1.35
Dish TV India Ltd. 0.19
Banks 11.20Kotak Mahindra Bank Ltd. 4.16
Yes Bank Ltd. 3.81
ICICI Bank Ltd. 3.22
Auto 10.15
Bajaj Auto Ltd. 3.90
Hero Honda Motors Ltd. 3.41
Maruti Suzuki India Ltd. 2.84
Finance 6.72
India Infoline Ltd. 5.07
Network 18 Media and Investments Ltd. 1.65
Telecom-Services 6.43
Bharti Airtel Ltd. 3.92
Idea Cellular Ltd. 2.51
Diversified 3.86
Hindustan Unilever Ltd. 3.86
Construction 3.75
Mahindra Lifespace Developers Ltd. 3.75
Transportation 3.41Jet Airways India Ltd. 3.41
Petroleum Products 2.39Castrol India Ltd. 2.39
Software 2.34Everonn Systems India Ltd. 2.34
Hotels 1.99Indian Hotels Company Limited 1.99
Retailing 1.24Shoppers Stop Ltd. 1.24
Cash & Cash Equivalents 7.66
Net receivables / payables 4.05
Total Net Assets 100.00
Portfolio & Asset Allocation
10.26
14.3415.13
6.46
13.43
18.14
0
5
10
15
20
1 Year 3 Years Since Inception

A u g u s t 2 0 0 9
Fund Details
Investment Objective
11
As on July 31, 2009
Birla Sun Life Advantage Fund
Value Blend Growth Size
Large
Mid
Small
Investment Style
Investment Style Box
Fund Manager :Managing Fund Since : September 12,2007Total Experience : 19 yearsDate of inception : February 24, 1995Nature of the scheme : An Open-ended Growth Scheme
Default option : Dividend ReinvestmentFresh Purchase : Rs. 5000/-Additional Purchase : Rs. 1000/-Redemption Cheques : Within 10 working days issuedSystematic Investment : Available Plan (SIP)Systematic Withdrawal : Available Plan (SWP)Systematic Transfer : AvailablePlan (STP)
Dividend : 88.53(Payout, Reinvestment & Sweep)Growth : 129.80
Benchmark : BSE SENSEXAverage AUM : Rs. 367.03 Crores
Entry Load : Nil
Exit Load** : < Rs. 5 crores – 1% if redeemed / (w.e.f August 03, 2009) switched out within 3 years
> Rs. 5 Crores – Nil.**Exit / Entry Load is NIL for units issued in Bonus & Dividend Reinvestment.
Standard Deviation : 38.54%##Sharpe Ratio : 0.19
Beta : 1.05
Mr. A.Balasubramanian
Key Features
Plans / Options & NAV
Load Structure (Incl for SIP)
Other Parameter
(as on July 31, 2009)
Note: Standard Deviation, Sharpe Ratio & Beta are calculated on Annualised basis using 3 years history of monthly returns, source: MFI Explorer##Risk-free rate assumed to be 3.22%(91 day T-bill yield as on July 31, 2009)
An open-ended growth scheme with the objective to achieve long-term growth of capital at relatively moderate levels of risk through a diversified research based investment approach.
Investment Performance
Birla Sun Life Advantage Fund - Growth BSE Sensex
% R
etur
ns
Past performance may or may not be sustained in future. Returns are in % and absolute returns for period less than 1 year & CAGR for period 1 year or more.
SIP is a powerful tool that can help you create wealth over time. If you had invested in Birla Sun Life Advantage Fund...
Systematic Investment Plan (SIP)
Date of First Installment : March 01, 1995
The data assumes the investment of Rs.1,000/- on 1st day of every month or the subsequent working day. Load and Taxes are not considered for computation of returns. Past performance may or may not be sustained in future.
*CAGR Returns are computed after accounting for the cash flow by using the XIRR method (investment internal rate of return)
Investment Period Total Investment (Rs.) Birla Sun Life
Advantage FundBirla Sun Life
Advantage FundBSE SENSEX BSE SENSEX
Value (Rs.) of SIP in Returns (%)*
Since Inception 173000 576247 1047363 15.31 22.44
Last 5 years 60000 92699 84381 17.44 13.61
Last 3 years 36000 42231 40792 10.66 8.29
Last 1 year 12000 16702 17001 80.26 85.82
Issuer % to NetAssets
Issuer % to NetAssets
Issuer % to NetAssets
Industrial Capital Goods 12.06Bharat Heavy Electricals Ltd. 3.83
Bharat Electronics Ltd. 1.84
Thermax Ltd. 1.42
Areva T&D India Ltd. 1.38
ABB Ltd. 1.26
Siemens Ltd. 1.24
Emco Ltd. 1.10
Banks 11.09ICICI Bank Ltd. 3.56
State Bank of India 2.85
HDFC Bank Ltd. 2.71
Bank of Baroda 0.99
Kotak Mahindra Bank Ltd. 0.98
Petroleum Products 10.80Reliance Industries Ltd. 4.91
Hindustan Petroleum Corporation Ltd. 3.15
Indian Oil Corporation Ltd. 2.75
Software 10.74Infosys Technologies Ltd. 4.55
Tata Consultancy Services Ltd. 2.23
Mphasis Ltd. 1.61
Core Projects & Technologies Ltd. 1.31
Wipro Ltd. 1.05
Telecom-Services 8.25Bharti Airtel Ltd. 3.60
Idea Cellular Ltd. 2.62
Tata Communications Limited. 1.05
Reliance Communications Ltd. 0.98
Ferrous Metals 8.02Jindal Steel & Power Ltd. 4.43
Welspun Gujarat Stahl Rohren Ltd. 3.59
Consumer Non Durables 7.22United Spirits Ltd. 2.48
Balrampur Chini Mills Ltd. 1.85
ITC Ltd. 1.78
Tata Tea Ltd. 1.11
Construction Project 5.69Larsen & Toubro Ltd. 3.21
Punj Lloyd Ltd. 2.48
Power 4.06KEC International Ltd. 2.09
Reliance Infrastructure Ltd. 1.97
Finance 3.43LIC Housing Finance Ltd. 1.79
HDFC Ltd. 1.63
Cement 2.34The India Cements Ltd. 1.34
Century Textiles and Industries Ltd 1.00
Construction 2.12Unitech Ltd. 2.03
Dharti Dredging and Infrastructure Ltd** 0.09
Portfolio & Asset Allocation
** Represents thinly traded/ non traded securities and illiquid securities. Total Percentage of thinly/non traded securities is 0.09% # Indicates less than 0.01
Auto 1.84Maruti Suzuki India Ltd. 1.84
Diversified 1.67Aditya Birla Nuvo Ltd. 1.67
Auto Ancillaries 1.58Exide Industries Ltd. 1.58
Media & Entertainment 1.42Television Eighteen India Ltd. 1.03Sun TV Network Limited 0.39
Foreign Equity 1.29Sterlite Industries (India) Ltd - Ads 1.29
Pharmaceuticals 1.16Pfizer Ltd. 1.16
Transportation 1.01Shipping Corporation of India Ltd. 1.01
Non - Ferrous Metals 0.86Sterlite Industries (India) Ltd. 0.86
IT Consulting & Services #Karrox Technologies Ltd ** #
Cash & Cash Equivalents 3.01
Net receivables / payables 0.35
Total Net Assets 100.00
10.44 10.05
22.2520.98
8.43
13.01
24.37
11.11
0
10
20
30
1 Year 3 Years 5 Years Since Inception
A u g u s t 2 0 0 9
Fund Details
12
As on July 31, 2009
Birla Sun Life Tax PlanAn open - ended Equity Linked Savings Scheme (ELSS) with a lock-in of 3 years
Value Blend Growth Size
Large
Mid
Small
Investment Style
Investment Style Box
Fund Manager :Managing Fund Since : September 12,2007Total Experience : 20 yearsDate of inception : February 16, 1999Nature of the scheme : An Open-ended ELSS Scheme
Default option : Dividend PayoutFresh Purchase : Rs. 500/-Additional Purchase : Rs. 500/-Redemption Cheques : Within 10 working days issuedSystematic Investment : Available Plan (SIP)Systematic Withdrawal : Not Available Plan (SWP)Systematic Transfer : Not AvailablePlan (STP)
Dividend : 45.38(Payout, Reinvestment & Sweep)Growth : 11.05
Benchmark : BSE SENSEXAverage AUM : Rs. 135.73 Crores
Entry Load : Nil
Exit Load : Nil
Standard Deviation : 35.06%##Sharpe Ratio : 0.19
Beta : 0.94
Mr. Sanjay Chawla
Key Features
Plans / Options & NAV
Load Structure (Incl for SIP)
Other Parameter
(as on July 31, 2009)
Note: Standard Deviation, Sharpe Ratio & Beta are calculated on Annualised basis using 3 years history of monthly returns, source: MFI Explorer##Risk-free rate assumed to be 3.22%(91 day T-bill yield as on July 31, 2009)
An open-ended Equity Linked Savings Scheme (ELSS) with the objective to achieve long-term growth of capital along with income tax relief for investment.
Investment Objective
Investment Performance
Birla Sun Life Tax Plan - Dividend BSE Sensex
% R
etur
ns
Past performance may or may not be sustained in future. Returns are in % and absolute returns for period less than 1 year & CAGR for period 1 year or more. Returns assume reinvestment of the tax free dividend declared.
SIP is a powerful tool that can help you create wealth over time. If you had invested in Birla Sun Life Tax Plan...
Systematic Investment Plan (SIP)
Date of First Installment : March 01, 1999
The data assumes the investment of Rs.1,000/- on 1st day of every month or the subsequent working day. Load and Taxes are not considered for computation of returns. Past performance may or may not be sustained in future.
*CAGR Returns are computed after accounting for the cash flow by using the XIRR method (investment internal rate of return)
Investment Period Total Investment (Rs.) Birla Sun Life
Tax PlanBirla Sun Life
Tax PlanBSE SENSEX BSE SENSEX
Value (Rs.) of SIP in Returns (%)*
Since Inception 125000 355565 487560 18.98 24.54
Last 5 years 60000 92699 81811 17.44 12.36
Last 3 years 36000 42231 38582 10.66 4.55
Last 1 year 12000 16702 15980 80.26 67.10
Issuer % to NetAssets
Issuer % to NetAssets
Issuer % to NetAssets
Industrial Capital Goods 10.04Bharat Electronics Ltd. 3.46
Alstom Projects India Ltd. 2.91
Apar Industries Ltd. 1.48
Bharat Bijlee Ltd. 1.10
Areva T&D India Ltd. 1.08
Petroleum Products 10.02Indian Oil Corporation Ltd. 3.77
Reliance Petroleum Ltd. 3.56
Reliance Industries Ltd. 2.70
Transportation 8.33Mundra Port and Special Eco Zone Ltd. 4.55
Container Corporation of India Ltd. 3.78
Cement 6.67Jaiprakash Associates Ltd. 4.08
Ultratech Cement Ltd. 1.37
Madras Cements Ltd. 1.21
Non - Ferrous Metals 5.41Hindalco Industries Ltd. 2.76
Sterlite Industries (India) Ltd. 1.33
Hindustan Zinc Ltd. 1.31
Banks 4.67HDFC Bank Ltd. 3.10
ICICI Bank Ltd. 1.57
Auto 4.58Maruti Suzuki India Ltd. 2.92
Hero Honda Motors Ltd. 1.66
Pharmaceuticals 4.45Dishman Pharmaceuticals & Chemicals Ltd. 2.94
Biocon Ltd. 1.50
Media & Entertainment 4.17Television Eighteen India Ltd. 2.79
Jagran Prakashan Ltd. 1.37
Magnasound India Ltd. ** #
Auto Ancillaries 3.74Goodyear India Ltd. 2.47
Everest Kanto Cylinder Ltd. 1.27
Software 3.55Infosys Technologies Ltd. 3.55
Ferrous Metals 3.46Monnet Ispat and Energy Limited 2.55
Steel Authority of India Ltd. 0.91
Telecom-Services 2.83Bharti Airtel Ltd. 2.83
Power 2.69Tata Power Company Ltd. 2.69
Construction 2.09Simplex Infrastructures Ltd. 2.09
Oil 2.01Oil & Natural Gas Corporation Ltd. 2.01
Consumer Non Durables 1.74ITC Ltd. 1.74
Industrial Products 1.55TRF Ltd. 1.55
Gas 1.06Indraprastha Gas Ltd. 1.06
Retailing 0.29Pantaloon Retail (India) Ltd. -Class B 0.29
Cash & Cash Equivalents 12.11
Net receivables / payables 0.05
Total Net Assets 100.00
Portfolio & Asset Allocation
** Represents thinly traded/ non traded securities and illiquid securities. Total Percentage of thinly/non traded securities is Nil# Indicates less than 0.01
3.49
9.56
23.1124.74
8.43
13.01
24.37
15.73
0
10
20
30
1 Year 3 Years 5 Years Since Inception
A u g u s t 2 0 0 9
Fund Details
13
As on July 31, 2009
Investment Objective
Birla Sun Life Index Fund
Value Blend Growth Size
Large
Mid
Small
Investment Style
Investment Style Box
Fund Manager :Managing Fund Since : October 01,2007Total Experience : 15 yearsDate of inception : September 18, 2002Nature of the scheme : An Open-ended Index Linked
Growth Scheme
Default option : Dividend ReinvestmentFresh Purchase : Rs. 5000/-Additional Purchase : Rs. 1000/-Redemption Cheques : Within 10 Working days issuedSystematic Investment : Available Plan (SIP)Systematic Withdrawal : Not Available Plan (SWP)Systematic Transfer : Not AvailablePlan (STP)
Dividend : 17.94(Payout, Reinvestment & Sweep)Growth : 46.37
Benchmark : S&P CNX NIFTYAverage AUM : Rs. 41.71 Crores
Entry Load : Nil
Exit Load** : < Rs. 5 crores - 1% if redeemed / switched out within 15 days ³ Rs. 5 crores - Nil**Exit / Entry Load is NIL for units issued in Bonus & Dividend Reinvestment.
Standard Deviation : 35.73%##Sharpe Ratio : 0.26
Beta : 0.98
Mr. Ajay Garg
Key Features
Plans / Options & NAV
Load Structure (Incl for SIP)
Other Parameter
(as on July 31, 2009)
Note: Standard Deviation, Sharpe Ratio & Beta are calculated on Annualised basis using 3 years history of monthly returns, source: MFI Explorer##Risk-free rate assumed to be 3.22%(91 day T-bill yield as on July 31, 2009)
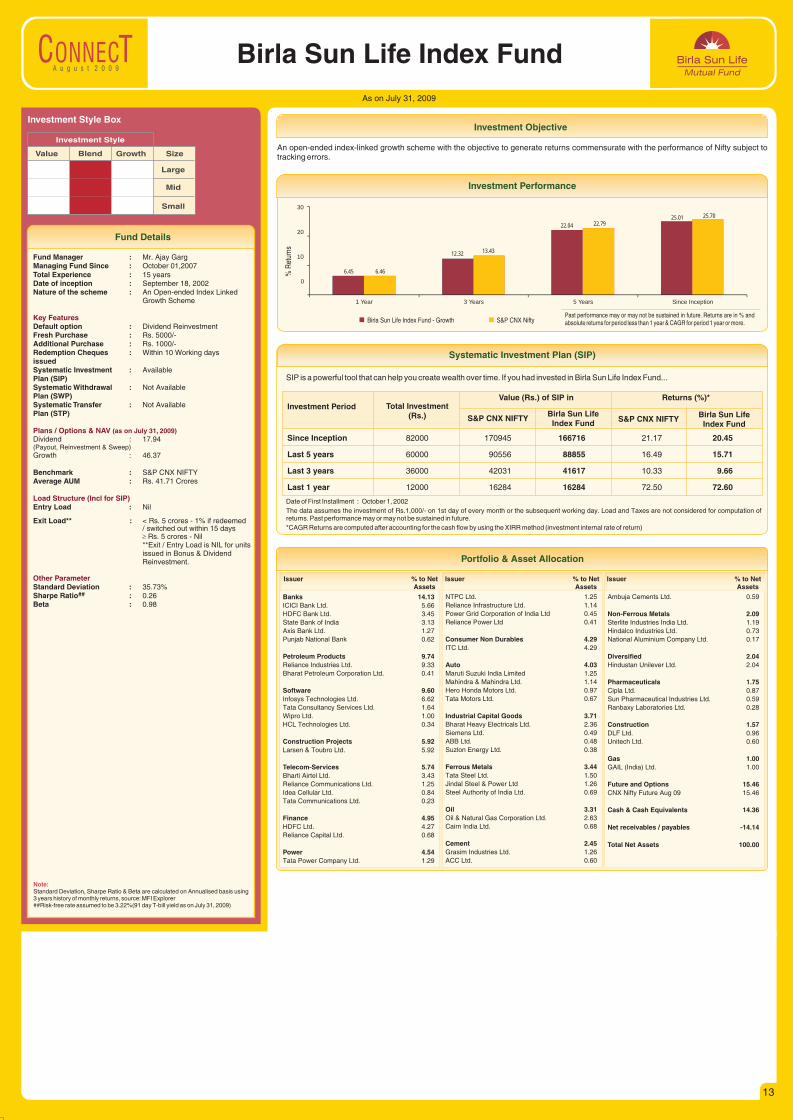
An open-ended index-linked growth scheme with the objective to generate returns commensurate with the performance of Nifty subject to tracking errors.
Investment Performance
% R
etur
ns
Birla Sun Life Index Fund - Growth S&P CNX NiftyPast performance may or may not be sustained in future. Returns are in % and absolute returns for period less than 1 year & CAGR for period 1 year or more.
SIP is a powerful tool that can help you create wealth over time. If you had invested in Birla Sun Life Index Fund...
Systematic Investment Plan (SIP)
Date of First Installment : October 1, 2002
The data assumes the investment of Rs.1,000/- on 1st day of every month or the subsequent working day. Load and Taxes are not considered for computation of returns. Past performance may or may not be sustained in future.
*CAGR Returns are computed after accounting for the cash flow by using the XIRR method (investment internal rate of return)
Investment Period Total Investment (Rs.) Birla Sun Life
Index FundBirla Sun Life
Index FundS&P CNX NIFTY S&P CNX NIFTY
Value (Rs.) of SIP in Returns (%)*
Since Inception 82000 170945 166716 21.17 20.45
Last 5 years 60000 90556 88855 16.49 15.71
Last 3 years 36000 42031 41617 10.33 9.66
Last 1 year 12000 16284 16284 72.50 72.60
Issuer % to NetAssets
Issuer % to NetAssets
Issuer % to NetAssets
Banks 14.13ICICI Bank Ltd. 5.66
HDFC Bank Ltd. 3.45
State Bank of India 3.13
Axis Bank Ltd. 1.27
Punjab National Bank 0.62
Petroleum Products 9.74Reliance Industries Ltd. 9.33
Bharat Petroleum Corporation Ltd. 0.41
Software 9.60Infosys Technologies Ltd. 6.62
Tata Consultancy Services Ltd. 1.64
Wipro Ltd. 1.00
HCL Technologies Ltd. 0.34
Construction Projects 5.92Larsen & Toubro Ltd. 5.92
Telecom-Services 5.74Bharti Airtel Ltd. 3.43
Reliance Communications Ltd. 1.25
Idea Cellular Ltd. 0.84
Tata Communications Ltd. 0.23
Finance 4.95HDFC Ltd. 4.27
Reliance Capital Ltd. 0.68
Power 4.54Tata Power Company Ltd. 1.29
NTPC Ltd. 1.25
Reliance Infrastructure Ltd. 1.14
Power Grid Corporation of India Ltd 0.45
Reliance Power Ltd 0.41
Consumer Non Durables 4.29ITC Ltd. 4.29
Auto 4.03Maruti Suzuki India Limited 1.25
Mahindra & Mahindra Ltd. 1.14
Hero Honda Motors Ltd. 0.97
Tata Motors Ltd. 0.67
Industrial Capital Goods 3.71Bharat Heavy Electricals Ltd. 2.36
Siemens Ltd. 0.49
ABB Ltd. 0.48
Suzlon Energy Ltd. 0.38
Ferrous Metals 3.44Tata Steel Ltd. 1.50
Jindal Steel & Power Ltd 1.26
Steel Authority of India Ltd. 0.69
Oil 3.31Oil & Natural Gas Corporation Ltd. 2.63
Cairn India Ltd. 0.68
Cement 2.45Grasim Industries Ltd. 1.26
ACC Ltd. 0.60
Ambuja Cements Ltd. 0.59
Non-Ferrous Metals 2.09Sterlite Industries India Ltd. 1.19
Hindalco Industries Ltd. 0.73
National Aluminium Company Ltd. 0.17
Diversified 2.04Hindustan Unilever Ltd. 2.04
Pharmaceuticals 1.75Cipla Ltd. 0.87
Sun Pharmaceutical Industries Ltd. 0.59
Ranbaxy Laboratories Ltd. 0.28
Construction 1.57DLF Ltd. 0.96
Unitech Ltd. 0.60
Gas 1.00GAIL (India) Ltd. 1.00
Future and Options 15.46CNX Nifty Future Aug 09 15.46
Cash & Cash Equivalents 14.36
Net receivables / payables -14.14
Total Net Assets 100.00
Portfolio & Asset Allocation
6.45
12.32
22.04
25.01
6.46
13.43
22.79
25.70
0
10
20
30
1 Year 3 Years 5 Years Since Inception
A u g u s t 2 0 0 9
Fund Details
14
As on July 31, 2009
Investment Objective
Birla Sun Life New Millennium Fund
Value Blend Growth Size
Large
Mid
Small
Investment Style
Investment Style Box
Fund Manager :Managing Fund Since : September 12,2007Total Experience : 10 yearsDate of inception : January 15, 2000Nature of the scheme : An Open-ended Growth Scheme
Default option : Dividend ReinvestmentFresh Purchase : Rs. 5000/-Additional Purchase : Rs. 1000/-Redemption Cheques : Within 10 working days issuedSystematic Investment : Available Plan (SIP)Systematic Withdrawal : Available Plan (SWP)Systematic Transfer : AvailablePlan (STP)
Dividend : 12.35(Payout, Reinvestment & Sweep)Growth : 15.59
Benchmark : BSE TeckAverage AUM : Rs. 57.89 Crores
Entry Load : Nil
Exit Load** : < Rs. 5 crores – 1% if redeemed / (w.e.f August 03, 2009) switched out within 3 years
> Rs. 5 Crores – Nil.**Exit / Entry Load is NIL for units issued in Bonus & Dividend Reinvestment.
Standard Deviation : 34.22%##Sharpe Ratio : 0.00
Beta : 1.00
Mr. Atul Penkar
Key Features
Plans / Options & NAV
Load Structure (Incl for SIP)
Other Parameter
(as on July 31, 2009)
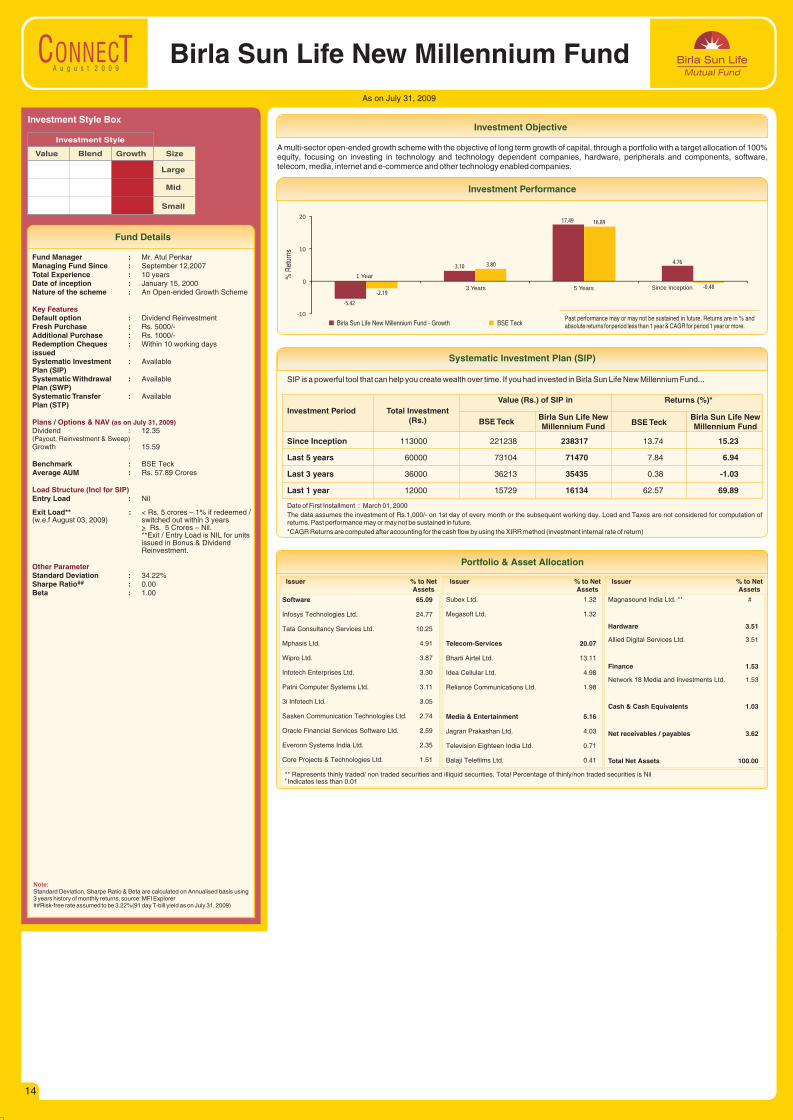
A multi-sector open-ended growth scheme with the objective of long term growth of capital, through a portfolio with a target allocation of 100% equity, focusing on investing in technology and technology dependent companies, hardware, peripherals and components, software, telecom, media, internet and e-commerce and other technology enabled companies.
Investment Performance
% R
etur
ns
Birla Sun Life New Millennium Fund - Growth BSE TeckPast performance may or may not be sustained in future. Returns are in % and absolute returns for period less than 1 year & CAGR for period 1 year or more.
SIP is a powerful tool that can help you create wealth over time. If you had invested in Birla Sun Life New Millennium Fund...
Systematic Investment Plan (SIP)
Date of First Installment : March 01, 2000
The data assumes the investment of Rs.1,000/- on 1st day of every month or the subsequent working day. Load and Taxes are not considered for computation of returns. Past performance may or may not be sustained in future.
*CAGR Returns are computed after accounting for the cash flow by using the XIRR method (investment internal rate of return)
Investment Period Total Investment (Rs.) Birla Sun Life New
Millennium FundBirla Sun Life New Millennium Fund
BSE Teck BSE Teck
Value (Rs.) of SIP in Returns (%)*
Since Inception 113000 221238 238317 13.74 15.23
Last 5 years 60000 73104 71470 7.84 6.94
Last 3 years 36000 36213 35435 0.38 -1.03
Last 1 year 12000 15729 16134 62.57 69.89
Issuer % to NetAssets
Issuer % to NetAssets
Issuer % to NetAssets
Software 65.09
Infosys Technologies Ltd. 24.77
Tata Consultancy Services Ltd. 10.25
Mphasis Ltd. 4.91
Wipro Ltd. 3.87
Infotech Enterprises Ltd. 3.30
Patni Computer Systems Ltd. 3.11
3i Infotech Ltd. 3.05
Sasken Communication Technologies Ltd. 2.74
Oracle Financial Services Software Ltd. 2.59
Everonn Systems India Ltd. 2.35
Core Projects & Technologies Ltd. 1.51
Subex Ltd. 1.32
Megasoft Ltd. 1.32
Telecom-Services 20.07
Bharti Airtel Ltd. 13.11
Idea Cellular Ltd. 4.98
Reliance Communications Ltd. 1.98
Media & Entertainment 5.16
Jagran Prakashan Ltd. 4.03
Television Eighteen India Ltd. 0.71
Balaji Telefilms Ltd. 0.41
Portfolio & Asset Allocation
** Represents thinly traded/ non traded securities and illiquid securities. Total Percentage of thinly/non traded securities is Nil# Indicates less than 0.01
Magnasound India Ltd. ** #
Hardware 3.51
Allied Digital Services Ltd. 3.51
Finance 1.53
Network 18 Media and Investments Ltd. 1.53
Cash & Cash Equivalents 1.03
Net receivables / payables 3.62
Total Net Assets 100.00
Note: Standard Deviation, Sharpe Ratio & Beta are calculated on Annualised basis using 3 years history of monthly returns, source: MFI Explorer##Risk-free rate assumed to be 3.22%(91 day T-bill yield as on July 31, 2009)
-5.42
3.10
17.49
4.76
-2.19
3.80
16.89
-0.48
-10
0
10
20
1 Year
3 Years 5 Years Since Inception
A u g u s t 2 0 0 9
Fund Details
15
As on July 31, 2009
Investment Objective
Birla Sun Life Top 100 Fund
Value Blend Growth Size
Large
Mid
Small
Investment Style
Investment Style Box
Fund Manager :Managing Fund Since : October 01,2007Total Experience : 16 yearsDate of inception : October 24, 2005Nature of the scheme : An Open-ended Growth Scheme
Default option : Dividend ReinvestmentFresh Purchase : Rs. 5000/-Additional Purchase : Rs. 1000/-Redemption Cheques : Within 10 working days issuedSystematic Investment : Available Plan (SIP)Systematic Withdrawal : Available Plan (SWP)Systematic Transfer : AvailablePlan (STP)
Dividend : 14.46(Payout, Reinvestment & Sweep)Growth : 17.64
Benchmark : S&P CNX NIFTYAverage AUM : Rs. 343.68 Crores
Entry Load : Nil
Exit Load** : < Rs. 5 crores – 1% if redeemed / (w.e.f August 03, 2009) switched out within 3 years
> Rs. 5 Crores – Nil.**Exit / Entry Load is NIL for units issued in Bonus & Dividend Reinvestment.
Standard Deviation : 30.59%##Sharpe Ratio : 0.28
Beta : 0.83
Mr. Ajay Argal
Key Features
Plans / Options & NAV
Load Structure (Incl for SIP)
Other Parameter
(as on July 31, 2009)
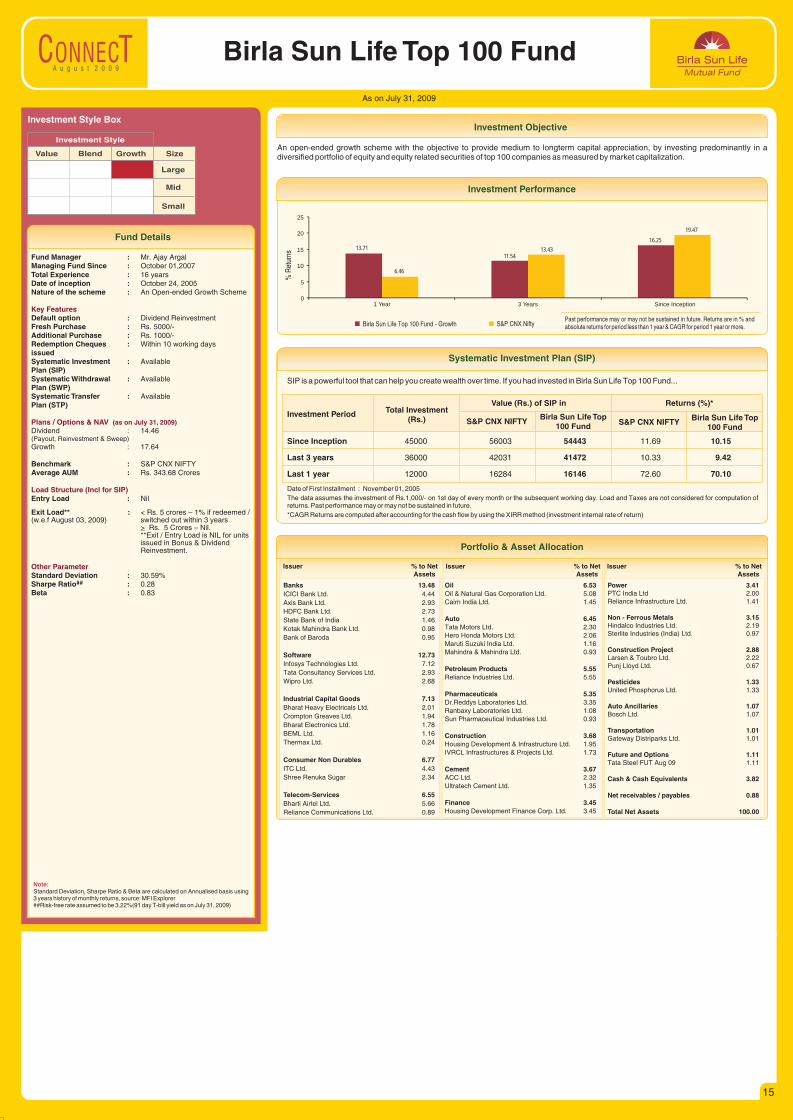
An open-ended growth scheme with the objective to provide medium to longterm capital appreciation, by investing predominantly in a diversified portfolio of equity and equity related securities of top 100 companies as measured by market capitalization.
Investment Performance
Birla Sun Life Top 100 Fund - Growth S&P CNX Nifty
% R
etur
ns
Past performance may or may not be sustained in future. Returns are in % and absolute returns for period less than 1 year & CAGR for period 1 year or more.
SIP is a powerful tool that can help you create wealth over time. If you had invested in Birla Sun Life Top 100 Fund...
Systematic Investment Plan (SIP)
Date of First Installment : November 01, 2005
The data assumes the investment of Rs.1,000/- on 1st day of every month or the subsequent working day. Load and Taxes are not considered for computation of returns. Past performance may or may not be sustained in future.
*CAGR Returns are computed after accounting for the cash flow by using the XIRR method (investment internal rate of return)
Investment Period Total Investment (Rs.) Birla Sun Life Top
100 FundBirla Sun Life Top
100 FundS&P CNX NIFTY S&P CNX NIFTY
Value (Rs.) of SIP in Returns (%)*
Since Inception 45000 56003 54443 11.69 10.15
Last 3 years 36000 42031 41472 10.33 9.42
Last 1 year 12000 16284 16146 72.60 70.10
Issuer % to NetAssets
Issuer % to NetAssets
Issuer % to NetAssets
Banks 13.48ICICI Bank Ltd. 4.44
Axis Bank Ltd. 2.93
HDFC Bank Ltd. 2.73
State Bank of India 1.46
Kotak Mahindra Bank Ltd. 0.98
Bank of Baroda 0.95
Software 12.73Infosys Technologies Ltd. 7.12
Tata Consultancy Services Ltd. 2.93
Wipro Ltd. 2.68
Industrial Capital Goods 7.13Bharat Heavy Electricals Ltd. 2.01
Crompton Greaves Ltd. 1.94
Bharat Electronics Ltd. 1.78
BEML Ltd. 1.16
Thermax Ltd. 0.24
Consumer Non Durables 6.77ITC Ltd. 4.43
Shree Renuka Sugar 2.34
Telecom-Services 6.55Bharti Airtel Ltd. 5.66
Reliance Communications Ltd. 0.89
Oil 6.53Oil & Natural Gas Corporation Ltd. 5.08Cairn India Ltd. 1.45
Auto 6.45Tata Motors Ltd. 2.30Hero Honda Motors Ltd. 2.06Maruti Suzuki India Ltd. 1.16Mahindra & Mahindra Ltd. 0.93
Petroleum Products 5.55Reliance Industries Ltd. 5.55
Pharmaceuticals 5.35Dr.Reddys Laboratories Ltd. 3.35Ranbaxy Laboratories Ltd. 1.08Sun Pharmaceutical Industries Ltd. 0.93
Construction 3.68Housing Development & Infrastructure Ltd. 1.95IVRCL Infrastructures & Projects Ltd. 1.73
Cement 3.67ACC Ltd. 2.32Ultratech Cement Ltd. 1.35
Finance 3.45Housing Development Finance Corp. Ltd. 3.45
Power 3.41PTC India Ltd 2.00Reliance Infrastructure Ltd. 1.41
Non - Ferrous Metals 3.15Hindalco Industries Ltd. 2.19Sterlite Industries (India) Ltd. 0.97
Construction Project 2.88Larsen & Toubro Ltd. 2.22Punj Lloyd Ltd. 0.67
Pesticides 1.33United Phosphorus Ltd. 1.33
Auto Ancillaries 1.07Bosch Ltd. 1.07
Transportation 1.01Gateway Distriparks Ltd. 1.01
Future and Options 1.11Tata Steel FUT Aug 09 1.11
Cash & Cash Equivalents 3.82
Net receivables / payables 0.88
Total Net Assets 100.00
Portfolio & Asset Allocation
Note: Standard Deviation, Sharpe Ratio & Beta are calculated on Annualised basis using 3 years history of monthly returns, source: MFI Explorer##Risk-free rate assumed to be 3.22%(91 day T-bill yield as on July 31, 2009)
13.71
11.54
16.25
6.46
13.43
19.47
0
5
10
15
20
25
1 Year 3 Years Since Inception
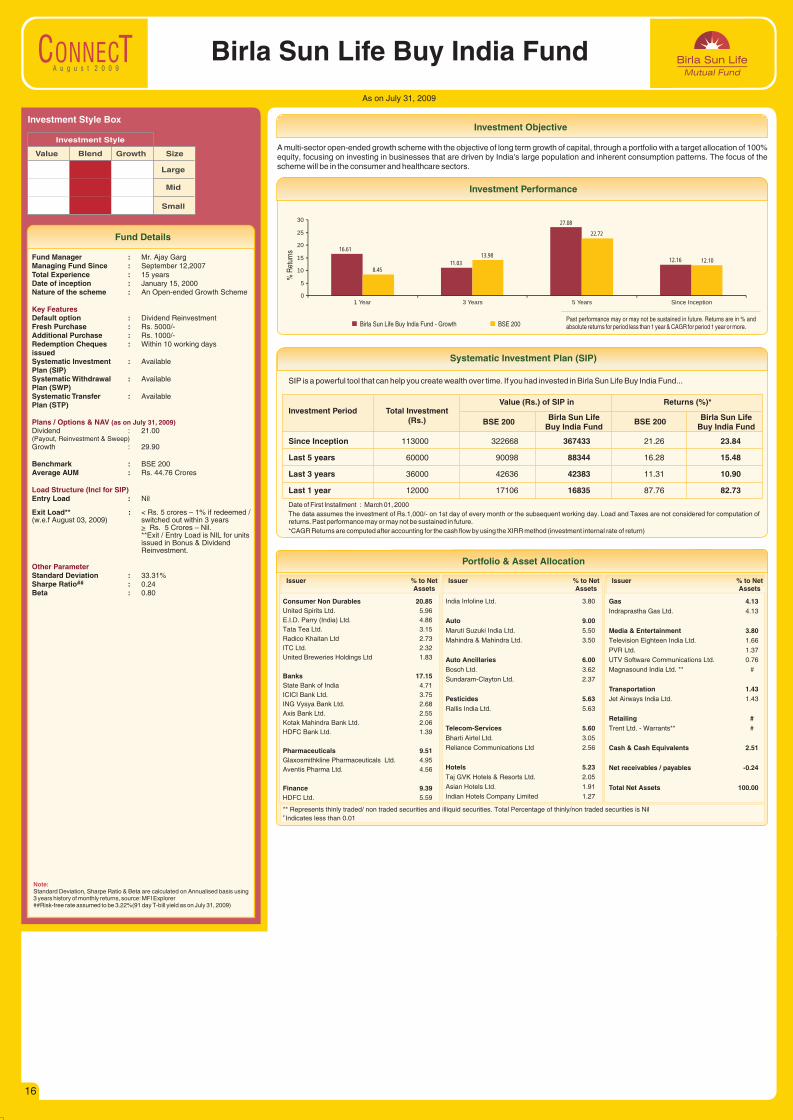
A u g u s t 2 0 0 9
Fund Details
16
As on July 31, 2009
Birla Sun Life Buy India Fund
Value Blend Growth Size
Large
Mid
Small
Investment Style
Investment Style Box
Fund Manager :Managing Fund Since : September 12,2007Total Experience : 15 yearsDate of inception : January 15, 2000Nature of the scheme : An Open-ended Growth Scheme
Default option : Dividend ReinvestmentFresh Purchase : Rs. 5000/-Additional Purchase : Rs. 1000/-Redemption Cheques : Within 10 working days issuedSystematic Investment : Available Plan (SIP)Systematic Withdrawal : Available Plan (SWP)Systematic Transfer : AvailablePlan (STP)
Dividend : 21.00(Payout, Reinvestment & Sweep)Growth : 29.90
Benchmark : BSE 200Average AUM : Rs. 44.76 Crores
Entry Load : Nil
Exit Load** : < Rs. 5 crores – 1% if redeemed / (w.e.f August 03, 2009) switched out within 3 years
> Rs. 5 Crores – Nil.**Exit / Entry Load is NIL for units issued in Bonus & Dividend Reinvestment.
Standard Deviation : 33.31%##Sharpe Ratio : 0.24
Beta : 0.80
Mr. Ajay Garg
Key Features
Plans / Options & NAV
Load Structure (Incl for SIP)
Other Parameter
(as on July 31, 2009)
Note: Standard Deviation, Sharpe Ratio & Beta are calculated on Annualised basis using 3 years history of monthly returns, source: MFI Explorer##Risk-free rate assumed to be 3.22%(91 day T-bill yield as on July 31, 2009)
A multi-sector open-ended growth scheme with the objective of long term growth of capital, through a portfolio with a target allocation of 100% equity, focusing on investing in businesses that are driven by India's large population and inherent consumption patterns. The focus of the scheme will be in the consumer and healthcare sectors.
Investment Objective
Investment Performance
Birla Sun Life Buy India Fund - Growth BSE 200
% R
etur
ns
Past performance may or may not be sustained in future. Returns are in % and absolute returns for period less than 1 year & CAGR for period 1 year or more.
SIP is a powerful tool that can help you create wealth over time. If you had invested in Birla Sun Life Buy India Fund...
Systematic Investment Plan (SIP)
Date of First Installment : March 01, 2000
The data assumes the investment of Rs.1,000/- on 1st day of every month or the subsequent working day. Load and Taxes are not considered for computation of returns. Past performance may or may not be sustained in future.
*CAGR Returns are computed after accounting for the cash flow by using the XIRR method (investment internal rate of return)
Investment Period Total Investment (Rs.) Birla Sun Life
Buy India FundBirla Sun Life
Buy India FundBSE 200 BSE 200
Value (Rs.) of SIP in Returns (%)*
Since Inception 113000 322668 367433 21.26 23.84
Last 5 years 60000 90098 88344 16.28 15.48
Last 3 years 36000 42636 42383 11.31 10.90
Last 1 year 12000 17106 16835 87.76 82.73
Issuer % to NetAssets
Issuer % to NetAssets
Issuer % to NetAssets
Consumer Non Durables 20.85United Spirits Ltd. 5.96
E.I.D. Parry (India) Ltd. 4.86
Tata Tea Ltd. 3.15
Radico Khaitan Ltd 2.73
ITC Ltd. 2.32
United Breweries Holdings Ltd 1.83
Banks 17.15State Bank of India 4.71
ICICI Bank Ltd. 3.75
ING Vysya Bank Ltd. 2.68
Axis Bank Ltd. 2.55
Kotak Mahindra Bank Ltd. 2.06
HDFC Bank Ltd. 1.39
Pharmaceuticals 9.51Glaxosmithkline Pharmaceuticals Ltd. 4.95
Aventis Pharma Ltd. 4.56
Finance 9.39HDFC Ltd. 5.59
India Infoline Ltd. 3.80
Auto 9.00Maruti Suzuki India Ltd. 5.50
Mahindra & Mahindra Ltd. 3.50
Auto Ancillaries 6.00Bosch Ltd. 3.62
Sundaram-Clayton Ltd. 2.37
Pesticides 5.63Rallis India Ltd. 5.63
Telecom-Services 5.60Bharti Airtel Ltd. 3.05
Reliance Communications Ltd 2.56
Hotels 5.23Taj GVK Hotels & Resorts Ltd. 2.05
Asian Hotels Ltd. 1.91
Indian Hotels Company Limited 1.27
Gas 4.13Indraprastha Gas Ltd. 4.13
Media & Entertainment 3.80Television Eighteen India Ltd. 1.66
PVR Ltd. 1.37
UTV Software Communications Ltd. 0.76
Magnasound India Ltd. ** #
Transportation 1.43Jet Airways India Ltd. 1.43
Retailing #Trent Ltd. - Warrants** #
Cash & Cash Equivalents 2.51
Net receivables / payables -0.24
Total Net Assets 100.00
Portfolio & Asset Allocation
** Represents thinly traded/ non traded securities and illiquid securities. Total Percentage of thinly/non traded securities is Nil# Indicates less than 0.01
16.61
11.03
27.08
12.16
8.45
13.98
22.72
12.10
0
5
10
15
20
25
30
1 Year 3 Years 5 Years Since Inception

A u g u s t 2 0 0 9
Fund Details
17
As on July 31, 2009
Investment Objective
Birla Sun Life MNC Fund
Value Blend Growth Size
Large
Mid
Small
Investment Style
Investment Style Box
Fund Manager :Managing Fund Since : June 18, 2009Total Experience : 15 yearsDate of inception : December 27, 1999Nature of the scheme : An Open-ended Growth Scheme
Default option : Dividend ReinvestmentFresh Purchase : Rs. 5000/-Additional Purchase : Rs. 1000/-Redemption Cheques : Within 10 working days issuedSystematic Investment : Available Plan (SIP)Systematic Withdrawal : Available Plan (SWP)Systematic Transfer : AvailablePlan (STP)
Dividend : 66.76(Payout, Reinvestment & Sweep)Growth : 133.18
Benchmark : S & P CNX MNCAverage AUM : Rs. 148.02 Crores
Entry Load : Nil
Exit Load** : < Rs. 5 crores – 1% if redeemed / (w.e.f August 03, 2009) switched out within 3 years
> Rs. 5 Crores – Nil.**Exit / Entry Load is NIL for units issued in Bonus & Dividend Reinvestment.
Standard Deviation : 27.39%##Sharpe Ratio : 0.28
Beta : 0.85
Mr. Ajay Garg
Key Features
Plans / Options & NAV
Load Structure (Incl for SIP)
Other Parameter
(as on July 31, 2009)
Note: Standard Deviation, Sharpe Ratio & Beta are calculated on Annualised basis using 3 years history of monthly returns, source: MFI Explorer##Risk-free rate assumed to be 3.22%(91 day T-bill yield as on July 31, 2009)
An open-ended growth scheme with the objective to achieve long-term growth of capital at relatively moderate levels of risk by making investments in securities of multi-national companies through a research based investment approach.
Investment Performance
Birla Sun Life MNC Fund - Growth S&P CNX MNC
% R
etur
ns
Past performance may or may not be sustained in future. Returns are in % and absolute returns for period less than 1 year & CAGR for period 1 year or more.
SIP is a powerful tool that can help you create wealth over time. If you had invested in Birla Sun Life MNC Fund...
Systematic Investment Plan (SIP)
Date of First Installment : January 01, 2000
The data assumes the investment of Rs.1,000/- on 1st day of every month or the subsequent working day. Load and Taxes are not considered for computation of returns. Past performance may or may not be sustained in future.
*CAGR Returns are computed after accounting for the cash flow by using the XIRR method (investment internal rate of return)
Investment Period Total Investment (Rs.) Birla Sun Life
MNC FundBirla Sun Life
MNC FundS & P CNX MNC S & P CNX MNC
Value (Rs.) of SIP in Returns (%)*
Since Inception 115000 249299 318182 15.48 20.24
Last 5 years 60000 90216 84849 16.33 13.84
Last 3 years 36000 43899 43124 13.33 12.10
Last 1 year 12000 17102 17046 87.69 86.65
Issuer % to NetAssets
Issuer % to NetAssets
Issuer % to NetAssets
Consumer Non Durables 16.42
Colgate-Palmolive (India) Ltd. 5.77
Glaxosmithkline Consumer Healthcare Ltd. 5.52
ITC Ltd. 2.78
Kansai Nerolac Paints Ltd. 2.36
Visakha Aqua Farms Ltd** #
Pharmaceuticals 16.11
Pfizer Ltd. 5.79
Glaxosmithkline Pharmaceuticals Ltd. 3.78
Wyeth Ltd. 3.61
Fulford (India) Ltd. 2.93
Industrial Capital Goods 13.70
Areva T&D India Ltd. 3.39
Honeywell Automation India Ltd. 3.29
Alstom Projects India Ltd. 3.26
ABB Ltd. 1.94
Siemens Ltd. 1.81
Finance 11.50
CRISIL Ltd. 6.55
ICRA Ltd. 4.95
Banks 8.26
ING Vysya Bank Ltd. 4.71
Yes Bank Ltd. 3.55
Auto Ancillaries 6.59
Bosch Ltd. 4.34
Wabco TVS India Ltd 1.38
Federal-Mogul Goetze (India) Ltd. 0.86
Gas 5.25
Gujarat Gas Company Ltd. 5.25
Auto 5.23
Maruti Suzuki India Ltd. 5.23
Industrial Products 5.03
Cummins India Ltd. 3.99
FAG Bearings India Ltd. 1.04
Software 3.72
Mphasis Ltd. 1.86
Oracle Financial Services Software Ltd. 1.86
Telecom-Services 3.65
Bharti Airtel Ltd. 3.65
Oil 2.26
Cairn India Ltd. 2.26
Construction 1.15
ITD Cementation India Ltd. 1.15
Paper #
Jainpur Straw Board & Papers Ltd. ** #
Textiles #
Sri Venkatesha Mills Ltd** #
Textiles-Synthetic #
Maruti Cottex Ltd** #
Sree Jayalakshmi Autospin Ltd.** #
Cash & Cash Equivalents 1.68
Net receivables / payables -0.54
Total Net Assets 100.00
Portfolio & Asset Allocation
5-Star Award by @ICRABirla Sun Life MNC Fund
Open Ended Diversified Equity - Aggressive (51 Schemes), 1 year ended 31-Dec-08
(Past performance is no guarantee of future results.) for ranking methodology please refer page 49
** Represents thinly traded/ non traded securities and illiquid securities. Total Percentage of thinly/non traded securities is Nil # Indicates less than 0.01
21.48
10.51
21.04
13.97
23.96
10.58
23.69
8.25
0
5
10
15
20
25
30
1 Year 3 Years 5 Years Since Inception
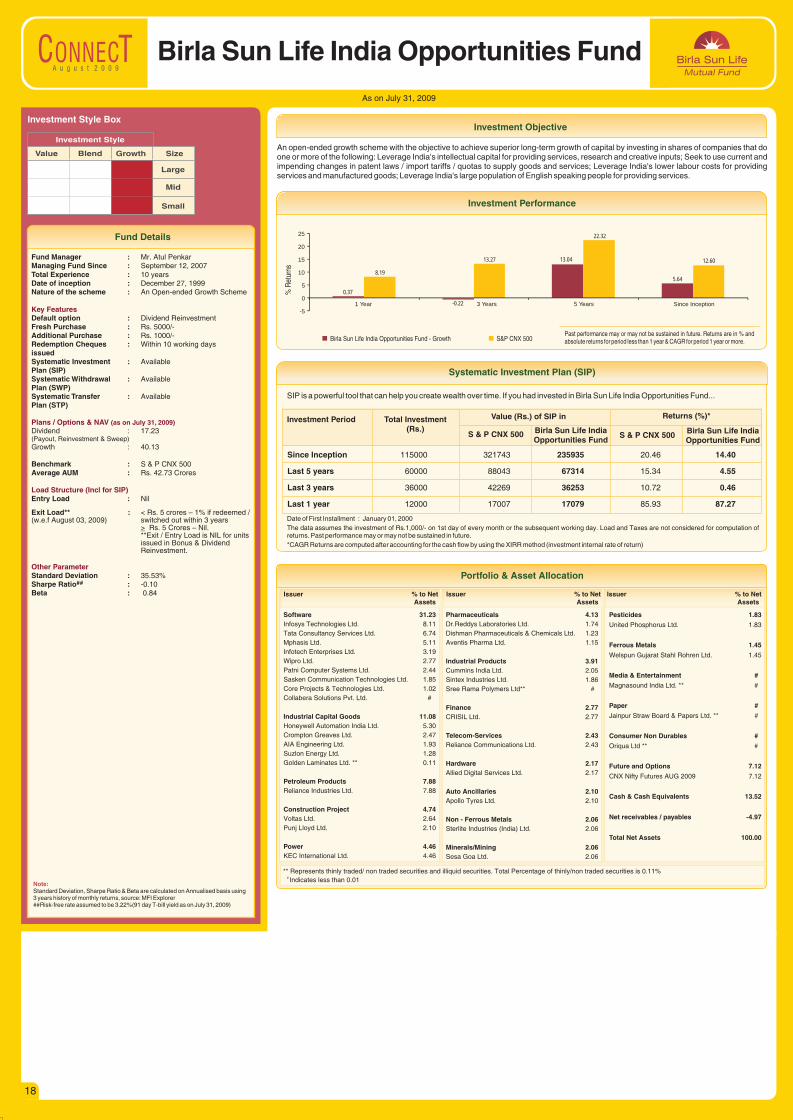
A u g u s t 2 0 0 9
Fund Details
18
As on July 31, 2009
Investment Objective
Birla Sun Life India Opportunities Fund
Value Blend Growth Size
Large
Mid
Small
Investment Style
Investment Style Box
Fund Manager :Managing Fund Since : September 12, 2007Total Experience : 10 yearsDate of inception : December 27, 1999Nature of the scheme : An Open-ended Growth Scheme
Default option : Dividend ReinvestmentFresh Purchase : Rs. 5000/-Additional Purchase : Rs. 1000/-Redemption Cheques : Within 10 working days issuedSystematic Investment : Available Plan (SIP)Systematic Withdrawal : Available Plan (SWP)Systematic Transfer : AvailablePlan (STP)
Dividend : 17.23(Payout, Reinvestment & Sweep)Growth : 40.13
Benchmark : S & P CNX 500Average AUM : Rs. 42.73 Crores
Entry Load : Nil
Exit Load** : < Rs. 5 crores – 1% if redeemed / (w.e.f August 03, 2009) switched out within 3 years
> Rs. 5 Crores – Nil.**Exit / Entry Load is NIL for units issued in Bonus & Dividend Reinvestment.
Standard Deviation : 35.53%##Sharpe Ratio : -0.10
Beta : 0.84
Mr. Atul Penkar
Key Features
Plans / Options & NAV
Load Structure (Incl for SIP)
Other Parameter
(as on July 31, 2009)
Note: Standard Deviation, Sharpe Ratio & Beta are calculated on Annualised basis using 3 years history of monthly returns, source: MFI Explorer##Risk-free rate assumed to be 3.22%(91 day T-bill yield as on July 31, 2009)
An open-ended growth scheme with the objective to achieve superior long-term growth of capital by investing in shares of companies that do one or more of the following: Leverage India's intellectual capital for providing services, research and creative inputs; Seek to use current and impending changes in patent laws / import tariffs / quotas to supply goods and services; Leverage India's lower labour costs for providing services and manufactured goods; Leverage India's large population of English speaking people for providing services.
Investment Performance
Birla Sun Life India Opportunities Fund - Growth S&P CNX 500
% R
etur
ns
Past performance may or may not be sustained in future. Returns are in % and absolute returns for period less than 1 year & CAGR for period 1 year or more.
SIP is a powerful tool that can help you create wealth over time. If you had invested in Birla Sun Life India Opportunities Fund...
Systematic Investment Plan (SIP)
Date of First Installment : January 01, 2000
The data assumes the investment of Rs.1,000/- on 1st day of every month or the subsequent working day. Load and Taxes are not considered for computation of returns. Past performance may or may not be sustained in future.
*CAGR Returns are computed after accounting for the cash flow by using the XIRR method (investment internal rate of return)
Investment Period Total Investment (Rs.) Birla Sun Life India
Opportunities FundBirla Sun Life India Opportunities Fund
S & P CNX 500 S & P CNX 500
Value (Rs.) of SIP in Returns (%)*
Since Inception 115000 321743 235935 20.46 14.40
Last 5 years 60000 88043 67314 15.34 4.55
Last 3 years 36000 42269 36253 10.72 0.46
Last 1 year 12000 17007 17079 85.93 87.27
Issuer % to NetAssets
Issuer % to NetAssets
Issuer % to NetAssets
Software 31.23Infosys Technologies Ltd. 8.11
Tata Consultancy Services Ltd. 6.74
Mphasis Ltd. 5.11
Infotech Enterprises Ltd. 3.19
Wipro Ltd. 2.77
Patni Computer Systems Ltd. 2.44
Sasken Communication Technologies Ltd. 1.85
Core Projects & Technologies Ltd. 1.02
Collabera Solutions Pvt. Ltd. #
Industrial Capital Goods 11.08Honeywell Automation India Ltd. 5.30
Crompton Greaves Ltd. 2.47
AIA Engineering Ltd. 1.93
Suzlon Energy Ltd. 1.28
Golden Laminates Ltd. ** 0.11
Petroleum Products 7.88Reliance Industries Ltd. 7.88
Construction Project 4.74Voltas Ltd. 2.64
Punj Lloyd Ltd. 2.10
Power 4.46KEC International Ltd. 4.46
Pharmaceuticals 4.13Dr.Reddys Laboratories Ltd. 1.74
Dishman Pharmaceuticals & Chemicals Ltd. 1.23
Aventis Pharma Ltd. 1.15
Industrial Products 3.91Cummins India Ltd. 2.05
Sintex Industries Ltd. 1.86
Sree Rama Polymers Ltd** #
Finance 2.77CRISIL Ltd. 2.77
Telecom-Services 2.43Reliance Communications Ltd. 2.43
Hardware 2.17Allied Digital Services Ltd. 2.17
Auto Ancillaries 2.10Apollo Tyres Ltd. 2.10
Non - Ferrous Metals 2.06Sterlite Industries (India) Ltd. 2.06
Minerals/Mining 2.06Sesa Goa Ltd. 2.06
Pesticides 1.83
United Phosphorus Ltd. 1.83
Ferrous Metals 1.45
Welspun Gujarat Stahl Rohren Ltd. 1.45
Media & Entertainment #
Magnasound India Ltd. ** #
Paper #
Jainpur Straw Board & Papers Ltd. ** #
Consumer Non Durables #
Oriqua Ltd ** #
Future and Options 7.12
CNX Nifty Futures AUG 2009 7.12
Cash & Cash Equivalents 13.52
Net receivables / payables -4.97
Total Net Assets 100.00
Portfolio & Asset Allocation
** Represents thinly traded/ non traded securities and illiquid securities. Total Percentage of thinly/non traded securities is 0.11% # Indicates less than 0.01
0.37
-0.22
13.04
5.648.19
13.27
22.32
12.60
-5
0
5
10
15
20
25
1 Year 3 Years 5 Years Since Inception
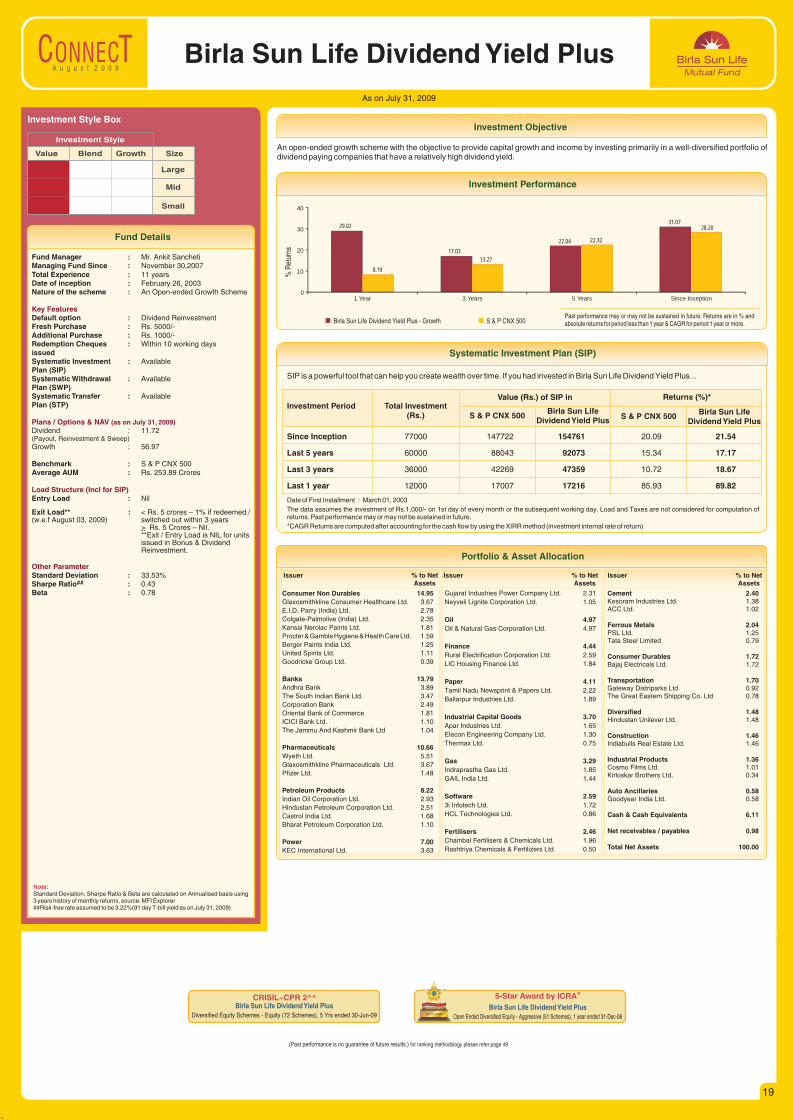
A u g u s t 2 0 0 9
Fund Details
19
As on July 31, 2009
Investment Objective
Birla Sun Life Dividend Yield Plus
Value Blend Growth Size
Large
Mid
Small
Investment Style
Investment Style Box
Fund Manager :Managing Fund Since : November 30,2007Total Experience : 11 yearsDate of inception : February 26, 2003Nature of the scheme : An Open-ended Growth Scheme
Default option : Dividend ReinvestmentFresh Purchase : Rs. 5000/-Additional Purchase : Rs. 1000/-Redemption Cheques : Within 10 working days issuedSystematic Investment : Available Plan (SIP)Systematic Withdrawal : Available Plan (SWP)Systematic Transfer : AvailablePlan (STP)
Dividend : 11.72(Payout, Reinvestment & Sweep)Growth : 56.97
Benchmark : S & P CNX 500Average AUM : Rs. 253.89 Crores
Entry Load : Nil
Exit Load** : < Rs. 5 crores – 1% if redeemed / (w.e.f August 03, 2009) switched out within 3 years
> Rs. 5 Crores – Nil.**Exit / Entry Load is NIL for units issued in Bonus & Dividend Reinvestment.
Standard Deviation : 33.53%##Sharpe Ratio : 0.43
Beta : 0.78
Mr. Ankit Sancheti
Key Features
Plans / Options & NAV
Load Structure (Incl for SIP)
Other Parameter
(as on July 31, 2009)
Note: Standard Deviation, Sharpe Ratio & Beta are calculated on Annualised basis using 3 years history of monthly returns, source: MFI Explorer##Risk-free rate assumed to be 3.22%(91 day T-bill yield as on July 31, 2009)
An open-ended growth scheme with the objective to provide capital growth and income by investing primarily in a well-diversified portfolio of dividend paying companies that have a relatively high dividend yield.
Investment Performance
Birla Sun Life Dividend Yield Plus - Growth S & P CNX 500
% R
etur
ns
Past performance may or may not be sustained in future. Returns are in % and absolute returns for period less than 1 year & CAGR for period 1 year or more.
SIP is a powerful tool that can help you create wealth over time. If you had invested in Birla Sun Life Dividend Yield Plus...
Systematic Investment Plan (SIP)
Date of First Installment : March 01, 2003
The data assumes the investment of Rs.1,000/- on 1st day of every month or the subsequent working day. Load and Taxes are not considered for computation of returns. Past performance may or may not be sustained in future.
*CAGR Returns are computed after accounting for the cash flow by using the XIRR method (investment internal rate of return)
Investment Period Total Investment (Rs.) Birla Sun Life
Dividend Yield PlusBirla Sun Life
Dividend Yield PlusS & P CNX 500 S & P CNX 500
Value (Rs.) of SIP in Returns (%)*
Since Inception 77000 147722 154761 20.09 21.54
Last 5 years 60000 88043 92073 15.34 17.17
Last 3 years 36000 42269 47359 10.72 18.67
Last 1 year 12000 17007 17216 85.93 89.82
Issuer % to NetAssets
Issuer % to NetAssets
Issuer % to NetAssets
Consumer Non Durables 14.95Glaxosmithkline Consumer Healthcare Ltd. 3.67
E.I.D. Parry (India) Ltd. 2.78
Colgate-Palmolive (India) Ltd. 2.35
Kansai Nerolac Paints Ltd. 1.81
Procter & Gamble Hygiene & Health Care Ltd. 1.59
Berger Paints India Ltd. 1.25
United Spirits Ltd. 1.11
Goodricke Group Ltd. 0.39
Banks 13.79Andhra Bank 3.89
The South Indian Bank Ltd. 3.47
Corporation Bank 2.49
Oriental Bank of Commerce 1.81
ICICI Bank Ltd. 1.10
The Jammu And Kashmir Bank Ltd 1.04
Pharmaceuticals 10.66Wyeth Ltd. 5.51
Glaxosmithkline Pharmaceuticals Ltd. 3.67
Pfizer Ltd. 1.48
Petroleum Products 8.22Indian Oil Corporation Ltd. 2.93
Hindustan Petroleum Corporation Ltd. 2.51
Castrol India Ltd. 1.68
Bharat Petroleum Corporation Ltd. 1.10
Power 7.00KEC International Ltd. 3.63
Gujarat Industries Power Company Ltd. 2.31
Neyveli Lignite Corporation Ltd. 1.05
Oil 4.97Oil & Natural Gas Corporation Ltd. 4.97
Finance 4.44Rural Electrification Corporation Ltd. 2.59
LIC Housing Finance Ltd. 1.84
Paper 4.11Tamil Nadu Newsprint & Papers Ltd. 2.22
Ballarpur Industries Ltd. 1.89
Industrial Capital Goods 3.70Apar Industries Ltd. 1.65
Elecon Engineering Company Ltd. 1.30
Thermax Ltd. 0.75
Gas 3.29Indraprastha Gas Ltd. 1.85
GAIL India Ltd. 1.44
Software 2.593i Infotech Ltd. 1.72
HCL Technologies Ltd. 0.86
Fertilisers 2.46Chambal Fertilisers & Chemicals Ltd. 1.96
Rashtriya Chemicals & Fertilizers Ltd. 0.50
Cement 2.40Kesoram Industries Ltd. 1.38ACC Ltd. 1.02
Ferrous Metals 2.04PSL Ltd. 1.25Tata Steel Limited 0.79
Consumer Durables 1.72Bajaj Electricals Ltd. 1.72
Transportation 1.70Gateway Distriparks Ltd. 0.92The Great Eastern Shipping Co. Ltd 0.78
Diversified 1.48Hindustan Unilever Ltd. 1.48
Construction 1.46Indiabulls Real Estate Ltd. 1.46
Industrial Products 1.36Cosmo Films Ltd. 1.01Kirloskar Brothers Ltd. 0.34
Auto Ancillaries 0.58Goodyear India Ltd. 0.58
Cash & Cash Equivalents 6.11
Net receivables / payables 0.98
Total Net Assets 100.00
Portfolio & Asset Allocation
5-Star Award by @ICRABirla Sun Life Dividend Yield Plus
Open Ended Diversified Equity - Aggressive (51 Schemes), 1 year ended 31-Dec-08
(Past performance is no guarantee of future results.) for ranking methodology please refer page 49
CRISIL~CPR 2^^Birla Sun Life Dividend Yield Plus
Diversified Equity Schemes - Equity ( Schemes), 5 72 Yrs ended 30-Jun-09
29.02
17.03
22.04
31.07
8.19
13.27
22.32
28.20
0
10
20
30
40
1 Year 3 Years 5 Years Since Inception
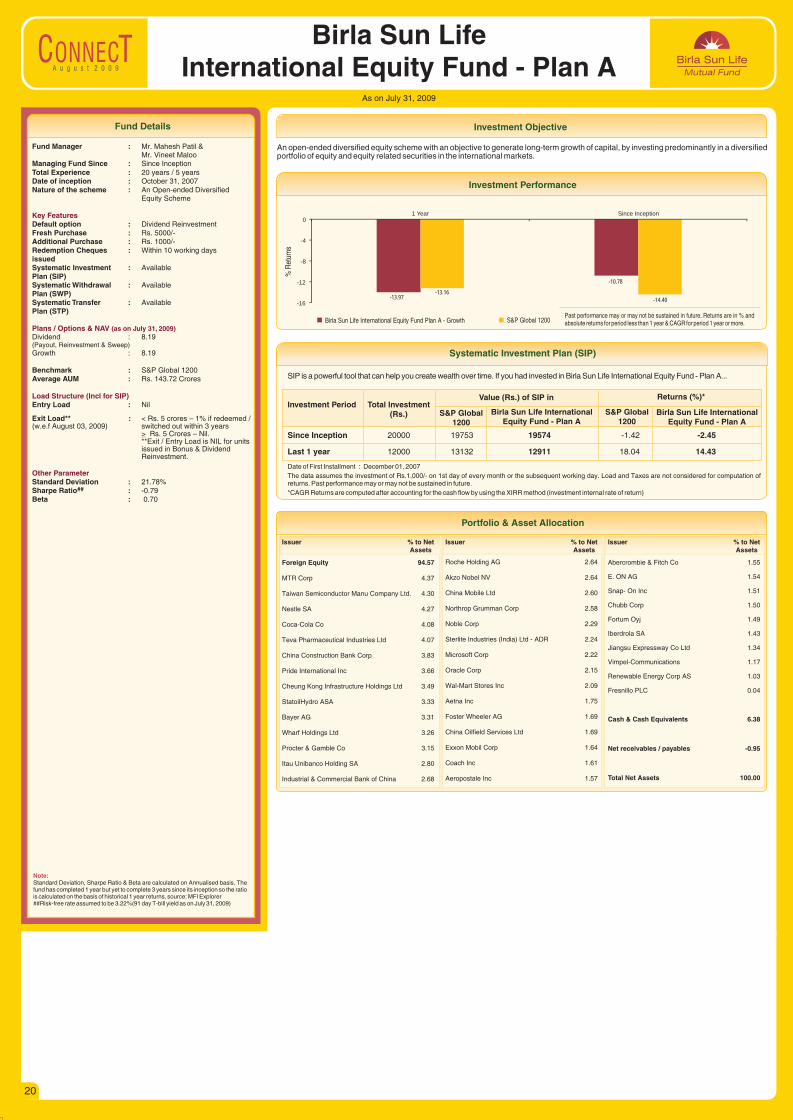
A u g u s t 2 0 0 9
20
As on July 31, 2009
Investment ObjectiveFund Details
Birla Sun Life International Equity Fund - Plan A
Fund Manager :Mr. Vineet Maloo
Managing Fund Since : Since InceptionTotal Experience : 20 years / 5 yearsDate of inception : October 31, 2007Nature of the scheme : An Open-ended Diversified
Equity Scheme
Default option : Dividend ReinvestmentFresh Purchase : Rs. 5000/-Additional Purchase : Rs. 1000/-Redemption Cheques : Within 10 working days issuedSystematic Investment : Available Plan (SIP)Systematic Withdrawal : Available Plan (SWP)Systematic Transfer : AvailablePlan (STP)
Dividend : 8.19(Payout, Reinvestment & Sweep)Growth : 8.19
Benchmark : S&P Global 1200Average AUM : Rs. 143.72 Crores
Entry Load : Nil
Exit Load** : < Rs. 5 crores – 1% if redeemed / (w.e.f August 03, 2009) switched out within 3 years
> Rs. 5 Crores – Nil.**Exit / Entry Load is NIL for units issued in Bonus & Dividend Reinvestment.
Standard Deviation : 21.78%##Sharpe Ratio : -0.79
Beta : 0.70
Mr. Mahesh Patil &
Key Features
Plans / Options & NAV
Load Structure (Incl for SIP)
Other Parameter
(as on July 31, 2009)
Note: Standard Deviation, Sharpe Ratio & Beta are calculated on Annualised basis. fund has completed 1 year but yet to complete 3 years since its inception so the ratio is calculated on the basis of historical 1 year returns, source: MFI Explorer##Risk-free rate assumed to be 3.22%(91 day T-bill yield as on July 31, 2009)
The
An open-ended diversified equity scheme with an objective to generate long-term growth of capital, by investing predominantly in a diversified portfolio of equity and equity related securities in the international markets.
Investment Performance
Birla Sun Life International Equity Fund Plan A - Growth S&P Global 1200
% R
etur
ns
Past performance may or may not be sustained in future. Returns are in % and absolute returns for period less than 1 year & CAGR for period 1 year or more.
SIP is a powerful tool that can help you create wealth over time. If you had invested in Birla Sun Life International Equity Fund - Plan A...
Systematic Investment Plan (SIP)
Date of First Installment : December 01, 2007
The data assumes the investment of Rs.1,000/- on 1st day of every month or the subsequent working day. Load and Taxes are not considered for computation of returns. Past performance may or may not be sustained in future.
*CAGR Returns are computed after accounting for the cash flow by using the XIRR method (investment internal rate of return)
Investment Period Total Investment (Rs.) Birla Sun Life International
Equity Fund - Plan ABirla Sun Life International
Equity Fund - Plan AS&P Global
1200S&P Global
1200
Value (Rs.) of SIP in Returns (%)*
Since Inception 20000 19753 19574 -1.42 -2.45
Last 1 year 12000 13132 12911 18.04 14.43
Issuer % to NetAssets
Issuer % to NetAssets
Issuer % to NetAssets
Foreign Equity 94.57
MTR Corp 4.37
Taiwan Semiconductor Manu Company Ltd. 4.30
Nestle SA 4.27
Coca-Cola Co 4.08
Teva Pharmaceutical Industries Ltd 4.07
China Construction Bank Corp 3.83
Pride International Inc 3.66
Cheung Kong Infrastructure Holdings Ltd 3.49
StatoilHydro ASA 3.33
Bayer AG 3.31
Wharf Holdings Ltd 3.26
Procter & Gamble Co 3.15
Itau Unibanco Holding SA 2.80
Industrial & Commercial Bank of China 2.68
Roche Holding AG 2.64
Akzo Nobel NV 2.64
China Mobile Ltd 2.60
Northrop Grumman Corp 2.58
Noble Corp 2.29
Sterlite Industries (India) Ltd - ADR 2.24
Microsoft Corp 2.22
Oracle Corp 2.15
Wal-Mart Stores Inc 2.09
Aetna Inc 1.75
Foster Wheeler AG 1.69
China Oilfield Services Ltd 1.69
Exxon Mobil Corp 1.64
Coach Inc 1.61
Aeropostale Inc 1.57
Abercrombie & Fitch Co 1.55
E. ON AG 1.54
Snap- On Inc 1.51
Chubb Corp 1.50
Fortum Oyj 1.49
Iberdrola SA 1.43
Jiangsu Expressway Co Ltd 1.34
Vimpel-Communications 1.17
Renewable Energy Corp AS 1.03
Fresnillo PLC 0.04
Cash & Cash Equivalents 6.38
Net receivables / payables -0.95
Total Net Assets 100.00
Portfolio & Asset Allocation
-13.97
-10.78
-13.16
-14.40-16
-12
-8
-4
01 Year Since Inception
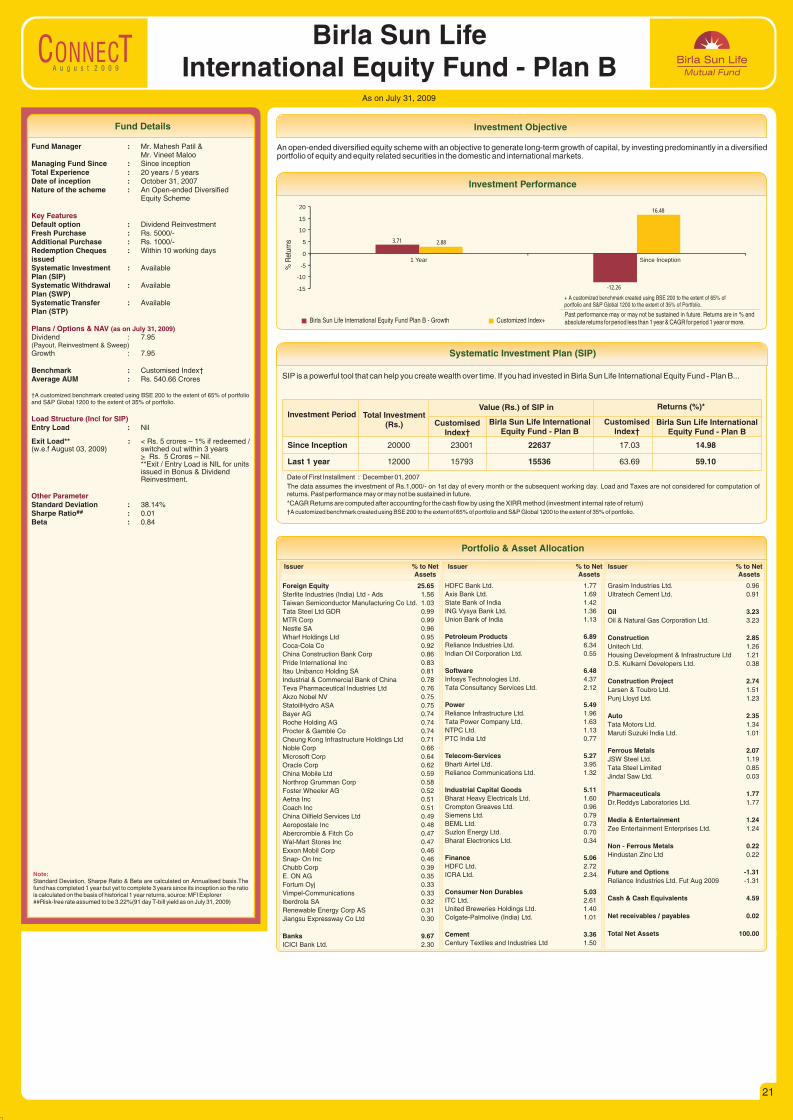
A u g u s t 2 0 0 9
21
As on July 31, 2009
Investment ObjectiveFund Details
Birla Sun Life International Equity Fund - Plan B
Fund Manager :Mr. Vineet Maloo
Managing Fund Since : Since inceptionTotal Experience : 20 years / 5 yearsDate of inception : October 31, 2007Nature of the scheme : An Open-ended Diversified
Equity Scheme
Default option : Dividend ReinvestmentFresh Purchase : Rs. 5000/-Additional Purchase : Rs. 1000/-Redemption Cheques : Within 10 working days issued Systematic Investment : Available Plan (SIP)Systematic Withdrawal : Available Plan (SWP)Systematic Transfer : AvailablePlan (STP)
Dividend : 7.95(Payout, Reinvestment & Sweep)Growth : 7.95
Benchmark : Customised Index†Average AUM : Rs. 540.66 Crores
†A customized benchmark created using BSE 200 to the extent of 65% of portfolio and S&P Global 1200 to the extent of 35% of portfolio.
Entry Load : Nil
Exit Load** : < Rs. 5 crores – 1% if redeemed / (w.e.f August 03, 2009) switched out within 3 years
> Rs. 5 Crores – Nil.**Exit / Entry Load is NIL for units issued in Bonus & Dividend Reinvestment.
Standard Deviation : 38.14%##Sharpe Ratio : 0.01
Beta : 0.84
Mr. Mahesh Patil &
Key Features
Plans / Options & NAV
Load Structure (Incl for SIP)
Other Parameter
(as on July 31, 2009)
Note: Standard Deviation, Sharpe Ratio & Beta are calculated on Annualised basis.fund has completed 1 year but yet to complete 3 years since its inception so the ratio is calculated on the basis of historical 1 year returns, source: MFI Explorer##Risk-free rate assumed to be 3.22%(91 day T-bill yield as on July 31, 2009)
The
An open-ended diversified equity scheme with an objective to generate long-term growth of capital, by investing predominantly in a diversified portfolio of equity and equity related securities in the domestic and international markets.
Investment Performance
Birla Sun Life International Equity Fund Plan B - Growth Customized Index+
% R
etur
ns
Past performance may or may not be sustained in future. Returns are in % and absolute returns for period less than 1 year & CAGR for period 1 year or more.
+ A customized benchmark created using BSE 200 to the extent of 65% of portfolio and S&P Global 1200 to the extent of 35% of Portfolio.
SIP is a powerful tool that can help you create wealth over time. If you had invested in Birla Sun Life International Equity Fund - Plan B...
Systematic Investment Plan (SIP)
Date of First Installment : December 01, 2007
The data assumes the investment of Rs.1,000/- on 1st day of every month or the subsequent working day. Load and Taxes are not considered for computation of returns. Past performance may or may not be sustained in future.
*CAGR Returns are computed after accounting for the cash flow by using the XIRR method (investment internal rate of return)
†A customized benchmark created using BSE 200 to the extent of 65% of portfolio and S&P Global 1200 to the extent of 35% of portfolio.
Investment Period Total Investment (Rs.) Birla Sun Life International
Equity Fund - Plan BBirla Sun Life International
Equity Fund - Plan BCustomised
Index†Customised
Index†
Value (Rs.) of SIP in Returns (%)*
Since Inception 20000 23001 22637 17.03 14.98
Last 1 year 12000 15793 15536 63.69 59.10
Issuer % to NetAssets
Issuer % to NetAssets
Issuer % to NetAssets
Foreign Equity 25.65Sterlite Industries (India) Ltd - Ads 1.56
Taiwan Semiconductor Manufacturing Co Ltd. 1.03
Tata Steel Ltd GDR 0.99
MTR Corp 0.99
Nestle SA 0.96
Wharf Holdings Ltd 0.95
Coca-Cola Co 0.92
China Construction Bank Corp 0.86
Pride International Inc 0.83
Itau Unibanco Holding SA 0.81
Industrial & Commercial Bank of China 0.78
Teva Pharmaceutical Industries Ltd 0.76
Akzo Nobel NV 0.75
StatoilHydro ASA 0.75
Bayer AG 0.74
Roche Holding AG 0.74
Procter & Gamble Co 0.74
Cheung Kong Infrastructure Holdings Ltd 0.71
Noble Corp 0.66
Microsoft Corp 0.64
Oracle Corp 0.62
China Mobile Ltd 0.59
Northrop Grumman Corp 0.58
Foster Wheeler AG 0.52
Aetna Inc 0.51
Coach Inc 0.51
China Oilfield Services Ltd 0.49
Aeropostale Inc 0.48
Abercrombie & Fitch Co 0.47
Wal-Mart Stores Inc 0.47
Exxon Mobil Corp 0.46
Snap- On Inc 0.46
Chubb Corp 0.39
E. ON AG 0.35
Fortum Oyj 0.33
Vimpel-Communications 0.33
Iberdrola SA 0.32
Renewable Energy Corp AS 0.31
Jiangsu Expressway Co Ltd 0.30
Banks 9.67ICICI Bank Ltd. 2.30
HDFC Bank Ltd. 1.77
Axis Bank Ltd. 1.69
State Bank of India 1.42
ING Vysya Bank Ltd. 1.36
Union Bank of India 1.13
Petroleum Products 6.89Reliance Industries Ltd. 6.34
Indian Oil Corporation Ltd. 0.55
Software 6.48Infosys Technologies Ltd. 4.37
Tata Consultancy Services Ltd. 2.12
Power 5.49Reliance Infrastructure Ltd. 1.96
Tata Power Company Ltd. 1.63
NTPC Ltd. 1.13
PTC India Ltd 0.77
Telecom-Services 5.27Bharti Airtel Ltd. 3.95
Reliance Communications Ltd. 1.32
Industrial Capital Goods 5.11Bharat Heavy Electricals Ltd. 1.60
Crompton Greaves Ltd. 0.96
Siemens Ltd. 0.79
BEML Ltd. 0.73
Suzlon Energy Ltd. 0.70
Bharat Electronics Ltd. 0.34
Finance 5.06HDFC Ltd. 2.72
ICRA Ltd. 2.34
Consumer Non Durables 5.03ITC Ltd. 2.61
United Breweries Holdings Ltd. 1.40
Colgate-Palmolive (India) Ltd. 1.01
Cement 3.36Century Textiles and Industries Ltd 1.50
Grasim Industries Ltd. 0.96
Ultratech Cement Ltd. 0.91
Oil 3.23Oil & Natural Gas Corporation Ltd. 3.23
Construction 2.85Unitech Ltd. 1.26
Housing Development & Infrastructure Ltd 1.21
D.S. Kulkarni Developers Ltd. 0.38
Construction Project 2.74Larsen & Toubro Ltd. 1.51
Punj Lloyd Ltd. 1.23
Auto 2.35Tata Motors Ltd. 1.34
Maruti Suzuki India Ltd. 1.01
Ferrous Metals 2.07JSW Steel Ltd. 1.19
Tata Steel Limited 0.85
Jindal Saw Ltd. 0.03
Pharmaceuticals 1.77Dr.Reddys Laboratories Ltd. 1.77
Media & Entertainment 1.24Zee Entertainment Enterprises Ltd. 1.24
Non - Ferrous Metals 0.22Hindustan Zinc Ltd 0.22
Future and Options -1.31Reliance Industries Ltd. Fut Aug 2009 -1.31
Cash & Cash Equivalents 4.59
Net receivables / payables 0.02
Total Net Assets 100.00
Portfolio & Asset Allocation
3.71
-12.26
2.88
16.48
-15
-10
-5
0
5
10
15
20
1 Year Since Inception
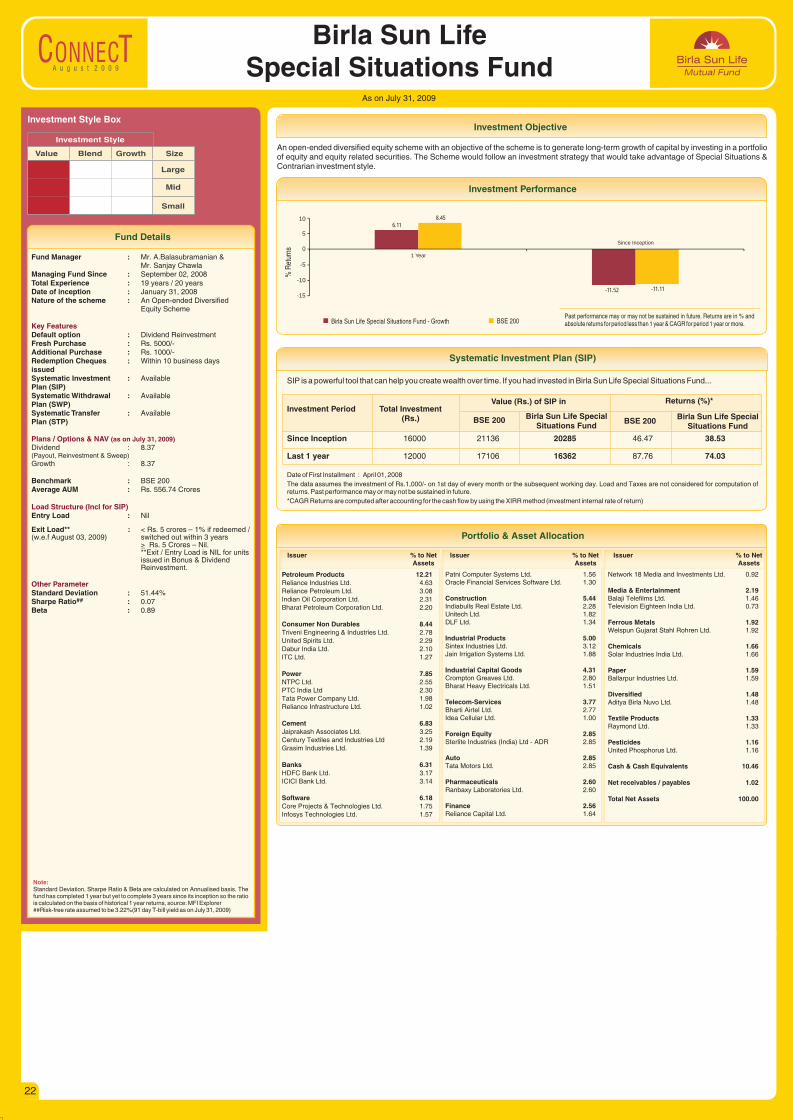
A u g u s t 2 0 0 9
Fund Details
22
As on July 31, 2009
Investment Objective
Birla Sun Life Special Situations Fund
Value Blend Growth Size
Large
Mid
Small
Investment Style
Investment Style Box
Fund Manager :Mr. Sanjay Chawla
Managing Fund Since : September 02, 2008Total Experience : 19 years / 20 yearsDate of inception : January 31, 2008Nature of the scheme : An Open-ended Diversified
Equity Scheme
Default option : Dividend ReinvestmentFresh Purchase : Rs. 5000/-Additional Purchase : Rs. 1000/-Redemption Cheques : Within 10 business days issuedSystematic Investment : Available Plan (SIP)Systematic Withdrawal : Available Plan (SWP)Systematic Transfer : AvailablePlan (STP)
Dividend : 8.37(Payout, Reinvestment & Sweep)Growth : 8.37
Benchmark : BSE 200Average AUM : Rs. 556.74 Crores
Entry Load : Nil
Exit Load** : < Rs. 5 crores – 1% if redeemed / (w.e.f August 03, 2009) switched out within 3 years
> Rs. 5 Crores – Nil.**Exit / Entry Load is NIL for units issued in Bonus & Dividend Reinvestment.
Standard Deviation : 51.44%##Sharpe Ratio : 0.07
Beta : 0.89
Mr. A.Balasubramanian &
Key Features
Plans / Options & NAV
Load Structure (Incl for SIP)
Other Parameter
(as on July 31, 2009)
Note: Standard Deviation, Sharpe Ratio & Beta are calculated on Annualised basis. fund has completed 1 year but yet to complete 3 years since its inception so the ratio is calculated on the basis of historical 1 year returns, source: MFI Explorer##Risk-free rate assumed to be 3.22%(91 day T-bill yield as on July 31, 2009)
The
An open-ended diversified equity scheme with an objective of the scheme is to generate long-term growth of capital by investing in a portfolio of equity and equity related securities. The Scheme would follow an investment strategy that would take advantage of Special Situations & Contrarian investment style.
Investment Performance
Birla Sun Life Special Situations Fund - Growth BSE 200
% R
etur
ns
Past performance may or may not be sustained in future. Returns are in % and absolute returns for period less than 1 year & CAGR for period 1 year or more.
SIP is a powerful tool that can help you create wealth over time. If you had invested in Birla Sun Life Special Situations Fund...
Systematic Investment Plan (SIP)
Date of First Installment : April 01, 2008
The data assumes the investment of Rs.1,000/- on 1st day of every month or the subsequent working day. Load and Taxes are not considered for computation of returns. Past performance may or may not be sustained in future.
*CAGR Returns are computed after accounting for the cash flow by using the XIRR method (investment internal rate of return)
Investment Period Total Investment (Rs.) Birla Sun Life Special
Situations FundBirla Sun Life Special
Situations FundBSE 200 BSE 200
Value (Rs.) of SIP in Returns (%)*
Since Inception 16000 21136 20285 46.47 38.53
Last 1 year 12000 17106 16362 87.76 74.03
Issuer % to NetAssets
Issuer % to NetAssets
Issuer % to NetAssets
Petroleum Products 12.21Reliance Industries Ltd. 4.63Reliance Petroleum Ltd. 3.08Indian Oil Corporation Ltd. 2.31Bharat Petroleum Corporation Ltd. 2.20
Consumer Non Durables 8.44Triveni Engineering & Industries Ltd. 2.78United Spirits Ltd. 2.29Dabur India Ltd. 2.10ITC Ltd. 1.27
Power 7.85NTPC Ltd. 2.55PTC India Ltd 2.30Tata Power Company Ltd. 1.98Reliance Infrastructure Ltd. 1.02
Cement 6.83Jaiprakash Associates Ltd. 3.25Century Textiles and Industries Ltd 2.19Grasim Industries Ltd. 1.39
Banks 6.31HDFC Bank Ltd. 3.17ICICI Bank Ltd. 3.14
Software 6.18Core Projects & Technologies Ltd. 1.75Infosys Technologies Ltd. 1.57
Patni Computer Systems Ltd. 1.56Oracle Financial Services Software Ltd. 1.30
Construction 5.44Indiabulls Real Estate Ltd. 2.28Unitech Ltd. 1.82DLF Ltd. 1.34
Industrial Products 5.00Sintex Industries Ltd. 3.12Jain Irrigation Systems Ltd. 1.88
Industrial Capital Goods 4.31Crompton Greaves Ltd. 2.80Bharat Heavy Electricals Ltd. 1.51
Telecom-Services 3.77Bharti Airtel Ltd. 2.77Idea Cellular Ltd. 1.00
Foreign Equity 2.85Sterlite Industries (India) Ltd - ADR 2.85
Auto 2.85Tata Motors Ltd. 2.85
Pharmaceuticals 2.60Ranbaxy Laboratories Ltd. 2.60
Finance 2.56Reliance Capital Ltd. 1.64
Network 18 Media and Investments Ltd. 0.92
Media & Entertainment 2.19Balaji Telefilms Ltd. 1.46Television Eighteen India Ltd. 0.73
Ferrous Metals 1.92Welspun Gujarat Stahl Rohren Ltd. 1.92
Chemicals 1.66Solar Industries India Ltd. 1.66
Paper 1.59Ballarpur Industries Ltd. 1.59
Diversified 1.48Aditya Birla Nuvo Ltd. 1.48
Textile Products 1.33Raymond Ltd. 1.33
Pesticides 1.16United Phosphorus Ltd. 1.16
Cash & Cash Equivalents 10.46
Net receivables / payables 1.02
Total Net Assets 100.00
Portfolio & Asset Allocation
6.11
-11.52
8.45
-11.11-15
-10
-5
0
5
10
1 Year
Since Inception
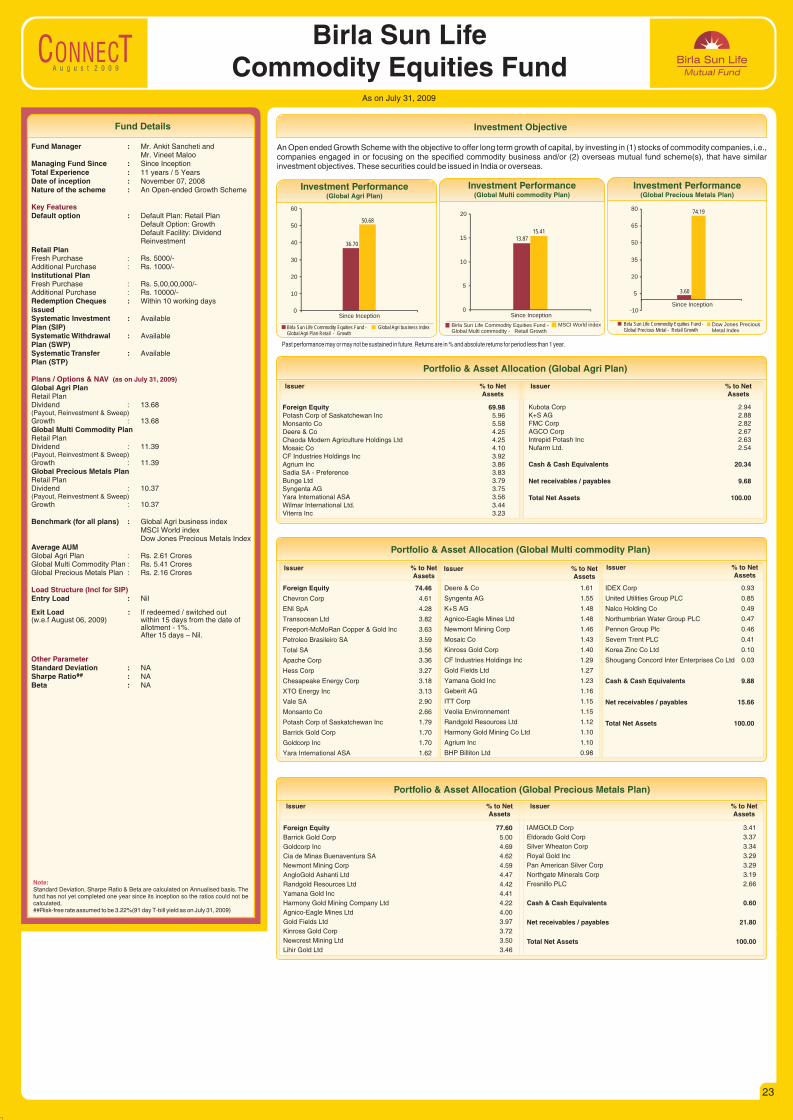
A u g u s t 2 0 0 9
23
As on July 31, 2009
Investment ObjectiveFund Details
Birla Sun Life Commodity Equities Fund
Fund Manager :Mr. Vineet Maloo
Managing Fund Since : Since InceptionTotal Experience : 11 years / 5 YearsDate of inception : November 07, 2008Nature of the scheme : An Open-ended Growth Scheme
Default option : Default Plan: Retail PlanDefault Option: GrowthDefault Facility: Dividend Reinvestment
Retail PlanFresh Purchase : Rs. 5000/-Additional Purchase : Rs. 1000/-Institutional PlanFresh Purchase : Rs. 5,00,00,000/-Additional Purchase : Rs. 10000/-Redemption Cheques : Within 10 working days issuedSystematic Investment : Available Plan (SIP)Systematic Withdrawal : Available Plan (SWP)Systematic Transfer : AvailablePlan (STP)
Global Agri PlanRetail PlanDividend : 13.68(Payout, Reinvestment & Sweep)Growth : 13.68Global Multi Commodity PlanRetail PlanDividend : 11.39(Payout, Reinvestment & Sweep)Growth : 11.39Global Precious Metals PlanRetail PlanDividend : 10.37(Payout, Reinvestment & Sweep)Growth : 10.37
Benchmark (for all plans) : Global Agri business indexMSCI World indexDow Jones Precious Metals Index
Average AUMGlobal Agri Plan : Rs. 2.61 CroresGlobal Multi Commodity Plan : Rs. 5.41 CroresGlobal Precious Metals Plan : Rs. 2.16 Crores
Entry Load : Nil
Exit Load : If redeemed / switched out (w.e.f August 06, 2009) within 15 days from the date of
allotment - 1%.After 15 days – Nil.
Standard Deviation : NA##Sharpe Ratio : NA
Beta : NA
Mr. Ankit Sancheti and
Key Features
Plans / Options & NAV
Load Structure (Incl for SIP)
Other Parameter
(as on July 31, 2009)
An Open ended Growth Scheme with the objective to offer long term growth of capital, by investing in (1) stocks of commodity companies, i.e., companies engaged in or focusing on the specified commodity business and/or (2) overseas mutual fund scheme(s), that have similar investment objectives. These securities could be issued in India or overseas.
Note: Standard Deviation, Sharpe Ratio & Beta are calculated on Annualised basis. fund has not yet completed one year since its inception so the ratios could not be calculated, ##Risk-free rate assumed to be 3.22%(91 day T-bill yield as on July 31, 2009)
The
Investment Performance(Global Multi commodity Plan)
Investment Performance(Global Agri Plan)
Investment Performance(Global Precious Metals Plan)
Birla Sun Life Commodity Equities Fund - Global Agri Plan Retail - Growth
Global Agri business index Birla Sun Life Commodity Equities Fund - Global Multi commodity - Retail Growth
MSCI World index Birla Sun Life Commodity Equities Fund - Global Precious Metal - Retail Growth
Dow Jones Precious Metal Index
Past performance may or may not be sustained in future. Returns are in % and absolute returns for period less than 1 year.
Issuer % to NetAssets
Issuer % to NetAssets
Portfolio & Asset Allocation (Global Agri Plan)
Foreign Equity 69.98Potash Corp of Saskatchewan Inc 5.96Monsanto Co 5.58Deere & Co 4.25Chaoda Modern Agriculture Holdings Ltd 4.25Mosaic Co 4.10CF Industries Holdings Inc 3.92Agrium Inc 3.86Sadia SA - Preference 3.83Bunge Ltd 3.79Syngenta AG 3.75Yara International ASA 3.56Wilmar International Ltd. 3.44Viterra Inc 3.23
Kubota Corp 2.94K+S AG 2.88FMC Corp 2.82AGCO Corp 2.67Intrepid Potash Inc 2.63Nufarm Ltd. 2.54
Cash & Cash Equivalents 20.34
Net receivables / payables 9.68
Total Net Assets 100.00
Portfolio & Asset Allocation (Global Multi commodity Plan)
Issuer % to NetAssets
Issuer % to NetAssets
Issuer % to NetAssets
Foreign Equity 74.46
Chevron Corp 4.61
ENI SpA 4.28
Transocean Ltd 3.82
Freeport-McMoRan Copper & Gold Inc 3.63
Petroleo Brasileiro SA 3.59
Total SA 3.56
Apache Corp 3.36
Hess Corp 3.27
Chesapeake Energy Corp 3.18
XTO Energy Inc 3.13
Vale SA 2.90
Monsanto Co 2.66
Potash Corp of Saskatchewan Inc 1.79
Barrick Gold Corp 1.70
Goldcorp Inc 1.70
Yara International ASA 1.62
Deere & Co 1.61
Syngenta AG 1.55
K+S AG 1.48
Agnico-Eagle Mines Ltd 1.48
Newmont Mining Corp 1.46
Mosaic Co 1.43
Kinross Gold Corp 1.40
CF Industries Holdings Inc 1.29
Gold Fields Ltd 1.27
Yamana Gold Inc 1.23
Geberit AG 1.16
ITT Corp 1.15
Veolia Environnement 1.15
Randgold Resources Ltd 1.12
Harmony Gold Mining Co Ltd 1.10
Agrium Inc 1.10
BHP Billiton Ltd 0.98
Portfolio & Asset Allocation (Global Precious Metals Plan)
Issuer % to NetAssets
Issuer % to NetAssets
Foreign Equity 77.60Barrick Gold Corp 5.00
Goldcorp Inc 4.69
Cia de Minas Buenaventura SA 4.62
Newmont Mining Corp 4.59
AngloGold Ashanti Ltd 4.47
Randgold Resources Ltd 4.42
Yamana Gold Inc 4.41
Harmony Gold Mining Company Ltd 4.22
Agnico-Eagle Mines Ltd 4.00
Gold Fields Ltd 3.97
Kinross Gold Corp 3.72
Newcrest Mining Ltd 3.50
Lihir Gold Ltd 3.46
IAMGOLD Corp 3.41
Eldorado Gold Corp 3.37
Silver Wheaton Corp 3.34
Royal Gold Inc 3.29
Pan American Silver Corp 3.29
Northgate Minerals Corp 3.19
Fresnillo PLC 2.66
Cash & Cash Equivalents 0.60
Net receivables / payables 21.80
Total Net Assets 100.00
IDEX Corp 0.93
United Utilities Group PLC 0.85
Nalco Holding Co 0.49
Northumbrian Water Group PLC 0.47
Pennon Group Plc 0.46
Severn Trent PLC 0.41
Korea Zinc Co Ltd 0.10
Shougang Concord Inter Enterprises Co Ltd 0.03
Cash & Cash Equivalents 9.88
Net receivables / payables 15.66
Total Net Assets 100.00
36.70
50.68
0
10
20
30
40
50
60
Since Inception
13.8715.41
0
5
10
15
20
Since Inception
3.60
74.19
-10
5
20
35
50
65
80
Since Inception
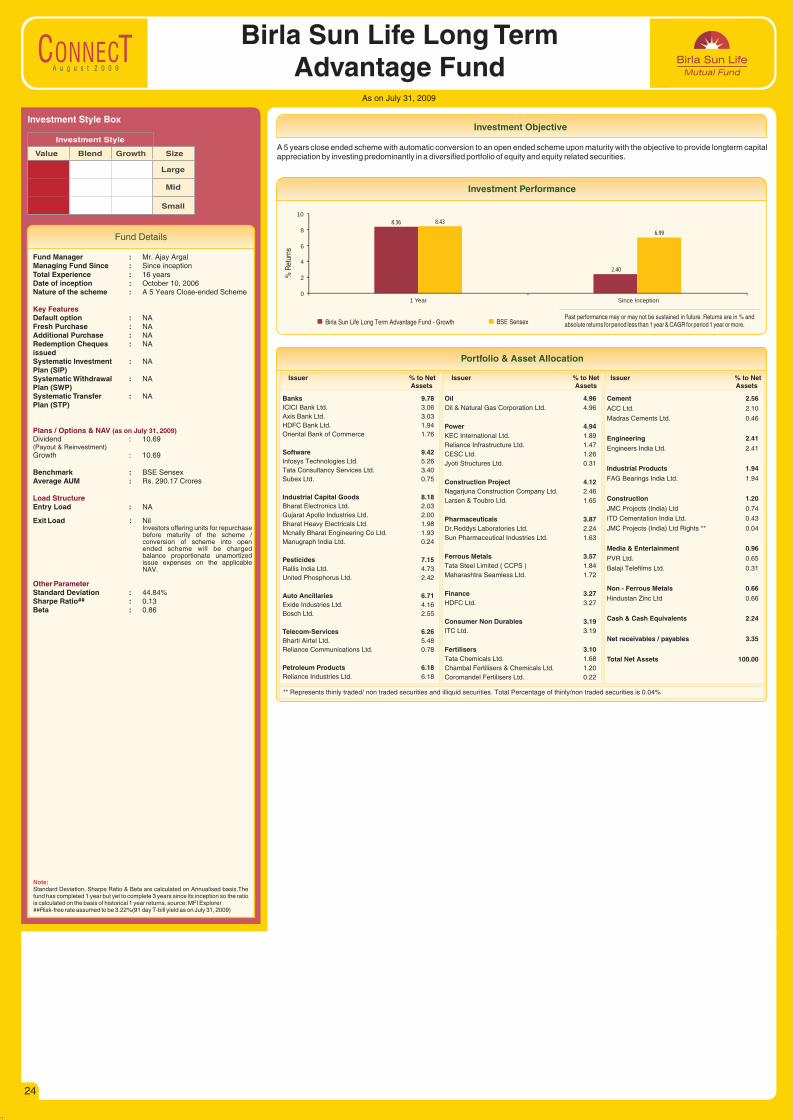
A u g u s t 2 0 0 9
Fund Details
24
Investment Objective
Birla Sun Life Long Term Advantage Fund
As on July 31, 2009
Value Blend Growth Size
Large
Mid
Small
Investment Style
Investment Style Box
Fund Manager :Managing Fund Since : Since inceptionTotal Experience : 16 yearsDate of inception : October 10, 2006Nature of the scheme : A 5 Years Close-ended Scheme
Default option : NAFresh Purchase : NAAdditional Purchase : NARedemption Cheques : NAissuedSystematic Investment : NAPlan (SIP)Systematic Withdrawal : NAPlan (SWP)Systematic Transfer : NAPlan (STP)
Dividend : 10.69(Payout & Reinvestment)Growth : 10.69
Benchmark : BSE SensexAverage AUM : Rs. 290.17 Crores
Entry Load : NA
Exit Load : NilInvestors offering units for repurchase before maturity of the scheme / conversion of scheme into open ended scheme will be charged balance proportionate unamortized issue expenses on the applicable NAV.
Standard Deviation : 44.84%##Sharpe Ratio : 0.13
Beta : 0.86
Mr. Ajay Argal
Key Features
Plans / Options & NAV
Load Structure
Other Parameter
(as on July 31, 2009)
Note: Standard Deviation, Sharpe Ratio & Beta are calculated on Annualised basis.fund has completed 1 year but yet to complete 3 years since its inception so the ratio is calculated on the basis of historical 1 year returns, source: MFI Explorer##Risk-free rate assumed to be 3.22%(91 day T-bill yield as on July 31, 2009)
The
A 5 years close ended scheme with automatic conversion to an open ended scheme upon maturity with the objective to provide longterm capital appreciation by investing predominantly in a diversified portfolio of equity and equity related securities.
Investment Performance
Birla Sun Life Long Term Advantage Fund - Growth BSE Sensex
% R
etur
ns
Past performance may or may not be sustained in future. Returns are in % and absolute returns for period less than 1 year & CAGR for period 1 year or more.
Issuer % to NetAssets
Issuer % to NetAssets
Issuer % to NetAssets
Banks 9.78ICICI Bank Ltd. 3.06
Axis Bank Ltd. 3.03
HDFC Bank Ltd. 1.94
Oriental Bank of Commerce 1.76
Software 9.42Infosys Technologies Ltd. 5.26
Tata Consultancy Services Ltd. 3.40
Subex Ltd. 0.75
Industrial Capital Goods 8.18Bharat Electronics Ltd. 2.03
Gujarat Apollo Industries Ltd. 2.00
Bharat Heavy Electricals Ltd. 1.98
Mcnally Bharat Engineering Co Ltd. 1.93
Manugraph India Ltd. 0.24
Pesticides 7.15Rallis India Ltd. 4.73
United Phosphorus Ltd. 2.42
Auto Ancillaries 6.71Exide Industries Ltd. 4.16
Bosch Ltd. 2.55
Telecom-Services 6.26Bharti Airtel Ltd. 5.48
Reliance Communications Ltd. 0.78
Petroleum Products 6.18Reliance Industries Ltd. 6.18
Oil 4.96Oil & Natural Gas Corporation Ltd. 4.96
Power 4.94KEC International Ltd. 1.89
Reliance Infrastructure Ltd. 1.47
CESC Ltd. 1.26
Jyoti Structures Ltd. 0.31
Construction Project 4.12Nagarjuna Construction Company Ltd. 2.46
Larsen & Toubro Ltd. 1.65
Pharmaceuticals 3.87Dr.Reddys Laboratories Ltd. 2.24
Sun Pharmaceutical Industries Ltd. 1.63
Ferrous Metals 3.57Tata Steel Limited ( CCPS ) 1.84
Maharashtra Seamless Ltd. 1.72
Finance 3.27HDFC Ltd. 3.27
Consumer Non Durables 3.19ITC Ltd. 3.19
Fertilisers 3.10Tata Chemicals Ltd. 1.68
Chambal Fertilisers & Chemicals Ltd. 1.20
Coromandel Fertilisers Ltd. 0.22
Cement 2.56
ACC Ltd. 2.10
Madras Cements Ltd. 0.46
Engineering 2.41
Engineers India Ltd. 2.41
Industrial Products 1.94
FAG Bearings India Ltd. 1.94
Construction 1.20
JMC Projects (India) Ltd 0.74
ITD Cementation India Ltd. 0.43
JMC Projects (India) Ltd Rights ** 0.04
Media & Entertainment 0.96
PVR Ltd. 0.65
Balaji Telefilms Ltd. 0.31
Non - Ferrous Metals 0.66
Hindustan Zinc Ltd 0.66
Cash & Cash Equivalents 2.24
Net receivables / payables 3.35
Total Net Assets 100.00
Portfolio & Asset Allocation
** Represents thinly traded/ non traded securities and illiquid securities. Total Percentage of thinly/non traded securities is 0.04%
8.36
2.40
8.43
6.99
0
2
4
6
8
10
1 Year Since Inception
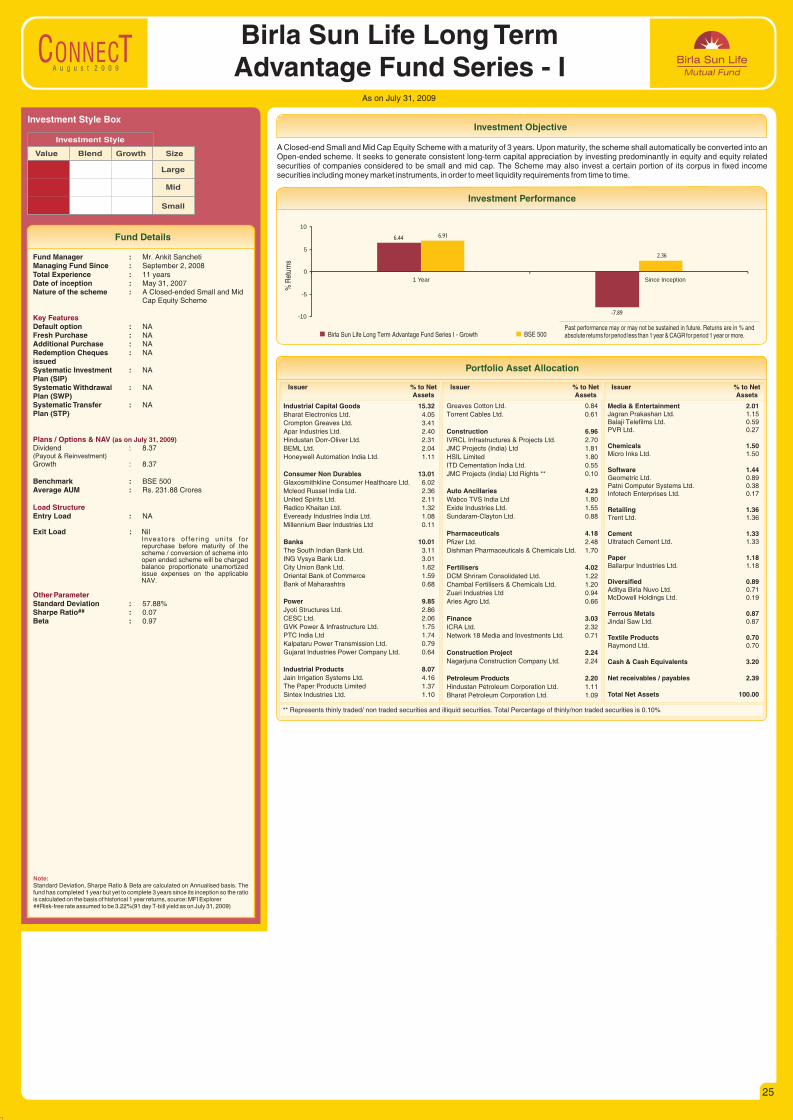
A u g u s t 2 0 0 9
Fund Details
25
Investment Objective
As on July 31, 2009
Birla Sun Life Long Term Advantage Fund Series - I
Value Blend Growth Size
Large
Mid
Small
Investment Style
Investment Style Box
Fund Manager :Managing Fund Since : September 2, 2008Total Experience : 11 yearsDate of inception : May 31, 2007Nature of the scheme : A Closed-ended Small and Mid
Cap Equity Scheme
Default option : NAFresh Purchase : NAAdditional Purchase : NARedemption Cheques : NA issuedSystematic Investment : NAPlan (SIP)Systematic Withdrawal : NAPlan (SWP)Systematic Transfer : NAPlan (STP)
Dividend : 8.37(Payout & Reinvestment)Growth : 8.37
Benchmark : BSE 500Average AUM : Rs. 231.88 Crores
Entry Load : NA
Exit Load : NilInves tors o f fe r ing un i ts fo r repurchase before maturity of the scheme / conversion of scheme into open ended scheme will be charged balance proportionate unamortized issue expenses on the applicable NAV.
Standard Deviation : 57.88%##Sharpe Ratio : 0.07
Beta : 0.97
Mr. Ankit Sancheti
Key Features
Plans / Options & NAV
Load Structure
Other Parameter
(as on July 31, 2009)
Note: Standard Deviation, Sharpe Ratio & Beta are calculated on Annualised basis. fund has completed 1 year but yet to complete 3 years since its inception so the ratio is calculated on the basis of historical 1 year returns, source: MFI Explorer##Risk-free rate assumed to be 3.22%(91 day T-bill yield as on July 31, 2009)
The
A Closed-end Small and Mid Cap Equity Scheme with a maturity of 3 years. Upon maturity, the scheme shall automatically be converted into an Open-ended scheme. It seeks to generate consistent long-term capital appreciation by investing predominantly in equity and equity related securities of companies considered to be small and mid cap. The Scheme may also invest a certain portion of its corpus in fixed income securities including money market instruments, in order to meet liquidity requirements from time to time.
Investment Performance
Past performance may or may not be sustained in future. Returns are in % and absolute returns for period less than 1 year & CAGR for period 1 year or more. Birla Sun Life Long Term Advantage Fund Series I - Growth BSE 500
% R
etur
ns
Issuer % to NetAssets
Issuer % to NetAssets
Issuer % to NetAssets
Industrial Capital Goods 15.32Bharat Electronics Ltd. 4.05
Crompton Greaves Ltd. 3.41
Apar Industries Ltd. 2.40
Hindustan Dorr-Oliver Ltd. 2.31
BEML Ltd. 2.04
Honeywell Automation India Ltd. 1.11
Consumer Non Durables 13.01Glaxosmithkline Consumer Healthcare Ltd. 6.02
Mcleod Russel India Ltd. 2.36
United Spirits Ltd. 2.11
Radico Khaitan Ltd. 1.32
Eveready Industries India Ltd. 1.08
Millennium Beer Industries Ltd 0.11
Banks 10.01The South Indian Bank Ltd. 3.11
ING Vysya Bank Ltd. 3.01
City Union Bank Ltd. 1.62
Oriental Bank of Commerce 1.59
Bank of Maharashtra 0.68
Power 9.85Jyoti Structures Ltd. 2.86
CESC Ltd. 2.06
GVK Power & Infrastructure Ltd. 1.75
PTC India Ltd 1.74
Kalpataru Power Transmission Ltd. 0.79
Gujarat Industries Power Company Ltd. 0.64
Industrial Products 8.07Jain Irrigation Systems Ltd. 4.16
The Paper Products Limited 1.37
Sintex Industries Ltd. 1.10
Greaves Cotton Ltd. 0.84
Torrent Cables Ltd. 0.61
Construction 6.96IVRCL Infrastructures & Projects Ltd. 2.70
JMC Projects (India) Ltd 1.81
HSIL Limited 1.80
ITD Cementation India Ltd. 0.55
JMC Projects (India) Ltd Rights ** 0.10
Auto Ancillaries 4.23Wabco TVS India Ltd 1.80
Exide Industries Ltd. 1.55
Sundaram-Clayton Ltd. 0.88
Pharmaceuticals 4.18Pfizer Ltd. 2.48
Dishman Pharmaceuticals & Chemicals Ltd. 1.70
Fertilisers 4.02DCM Shriram Consolidated Ltd. 1.22
Chambal Fertilisers & Chemicals Ltd. 1.20
Zuari Industries Ltd 0.94
Aries Agro Ltd. 0.66
Finance 3.03ICRA Ltd. 2.32
Network 18 Media and Investments Ltd. 0.71
Construction Project 2.24Nagarjuna Construction Company Ltd. 2.24
Petroleum Products 2.20Hindustan Petroleum Corporation Ltd. 1.11
Bharat Petroleum Corporation Ltd. 1.09
Media & Entertainment 2.01Jagran Prakashan Ltd. 1.15Balaji Telefilms Ltd. 0.59PVR Ltd. 0.27
Chemicals 1.50Micro Inks Ltd. 1.50
Software 1.44Geometric Ltd. 0.89Patni Computer Systems Ltd. 0.38Infotech Enterprises Ltd. 0.17
Retailing 1.36Trent Ltd. 1.36
Cement 1.33Ultratech Cement Ltd. 1.33
Paper 1.18Ballarpur Industries Ltd. 1.18
Diversified 0.89Aditya Birla Nuvo Ltd. 0.71McDowell Holdings Ltd. 0.19
Ferrous Metals 0.87Jindal Saw Ltd. 0.87
Textile Products 0.70Raymond Ltd. 0.70
Cash & Cash Equivalents 3.20
Net receivables / payables 2.39
Total Net Assets 100.00
Portfolio Asset Allocation
** Represents thinly traded/ non traded securities and illiquid securities. Total Percentage of thinly/non traded securities is 0.10%
6.44
-7.89
6.91
2.36
-10
-5
0
5
10
1 Year Since Inception
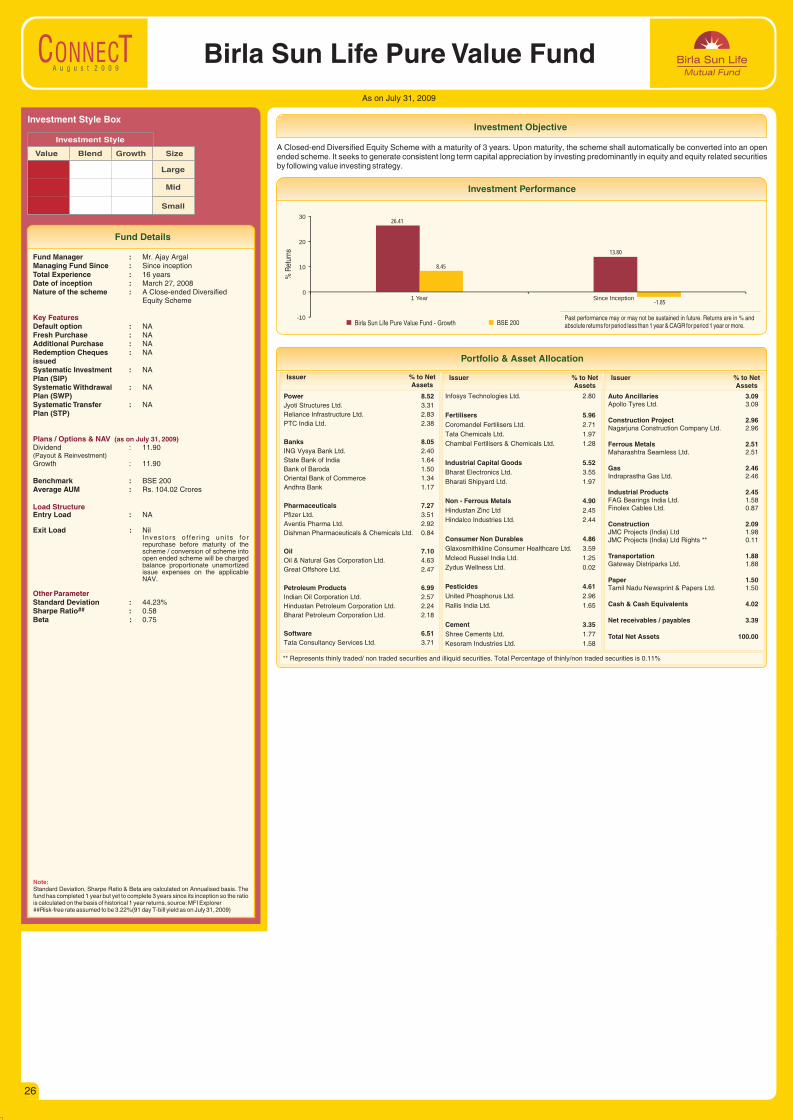
A u g u s t 2 0 0 9
26
As on July 31, 2009
Birla Sun Life Pure Value Fund
Value Blend Growth Size
Large
Mid
Small
Investment Style
Investment Style Box
Fund Details
Fund Manager :Managing Fund Since : Since inceptionTotal Experience : 16 yearsDate of inception : March 27, 2008Nature of the scheme : A Close-ended Diversified
Equity Scheme
Default option : NAFresh Purchase : NAAdditional Purchase : NARedemption Cheques : NA issuedSystematic Investment : NAPlan (SIP)Systematic Withdrawal : NAPlan (SWP)Systematic Transfer : NAPlan (STP)
Dividend : 11.90(Payout & Reinvestment)Growth : 11.90
Benchmark : BSE 200Average AUM : Rs. 104.02 Crores
Entry Load : NA
Exit Load : NilInvestors o f fe r ing un i ts fo r repurchase before maturity of the scheme / conversion of scheme into open ended scheme will be charged balance proportionate unamortized issue expenses on the applicable NAV.
Standard Deviation : 44.23%##Sharpe Ratio : 0.58
Beta : 0.75
Mr. Ajay Argal
Key Features
Plans / Options & NAV
Load Structure
Other Parameter
(as on July 31, 2009)
Note: Standard Deviation, Sharpe Ratio & Beta are calculated on Annualised basis. fund has completed 1 year but yet to complete 3 years since its inception so the ratio is calculated on the basis of historical 1 year returns, source: MFI Explorer##Risk-free rate assumed to be 3.22%(91 day T-bill yield as on July 31, 2009)
The
A Closed-end Diversified Equity Scheme with a maturity of 3 years. Upon maturity, the scheme shall automatically be converted into an open ended scheme. It seeks to generate consistent long term capital appreciation by investing predominantly in equity and equity related securities by following value investing strategy.
Investment Objective
Investment Performance
Birla Sun Life Pure Value Fund - Growth BSE 200
% R
etur
ns
Past performance may or may not be sustained in future. Returns are in % and absolute returns for period less than 1 year & CAGR for period 1 year or more.
Issuer % to NetAssets
Issuer % to NetAssets
Issuer % to NetAssets
Power 8.52Jyoti Structures Ltd. 3.31
Reliance Infrastructure Ltd. 2.83
PTC India Ltd. 2.38
Banks 8.05ING Vysya Bank Ltd. 2.40
State Bank of India 1.64
Bank of Baroda 1.50
Oriental Bank of Commerce 1.34
Andhra Bank 1.17
Pharmaceuticals 7.27Pfizer Ltd. 3.51
Aventis Pharma Ltd. 2.92
Dishman Pharmaceuticals & Chemicals Ltd. 0.84
Oil 7.10Oil & Natural Gas Corporation Ltd. 4.63
Great Offshore Ltd. 2.47
Petroleum Products 6.99Indian Oil Corporation Ltd. 2.57
Hindustan Petroleum Corporation Ltd. 2.24
Bharat Petroleum Corporation Ltd. 2.18
Software 6.51Tata Consultancy Services Ltd. 3.71
Infosys Technologies Ltd. 2.80
Fertilisers 5.96Coromandel Fertilisers Ltd. 2.71
Tata Chemicals Ltd. 1.97
Chambal Fertilisers & Chemicals Ltd. 1.28
Industrial Capital Goods 5.52Bharat Electronics Ltd. 3.55
Bharati Shipyard Ltd. 1.97
Non - Ferrous Metals 4.90Hindustan Zinc Ltd 2.45
Hindalco Industries Ltd. 2.44
Consumer Non Durables 4.86Glaxosmithkline Consumer Healthcare Ltd. 3.59
Mcleod Russel India Ltd. 1.25
Zydus Wellness Ltd. 0.02
Pesticides 4.61United Phosphorus Ltd. 2.96
Rallis India Ltd. 1.65
Cement 3.35Shree Cements Ltd. 1.77
Kesoram Industries Ltd. 1.58
Auto Ancillaries 3.09Apollo Tyres Ltd. 3.09
Construction Project 2.96Nagarjuna Construction Company Ltd. 2.96
Ferrous Metals 2.51Maharashtra Seamless Ltd. 2.51
Gas 2.46Indraprastha Gas Ltd. 2.46
Industrial Products 2.45FAG Bearings India Ltd. 1.58Finolex Cables Ltd. 0.87
Construction 2.09JMC Projects (India) Ltd 1.98JMC Projects (India) Ltd Rights ** 0.11
Transportation 1.88Gateway Distriparks Ltd. 1.88
Paper 1.50Tamil Nadu Newsprint & Papers Ltd. 1.50
Cash & Cash Equivalents 4.02
Net receivables / payables 3.39
Total Net Assets 100.00
Portfolio & Asset Allocation
** Represents thinly traded/ non traded securities and illiquid securities. Total Percentage of thinly/non traded securities is 0.11%
26.41
13.80
8.45
-1.85
-10
0
10
20
30
1 Year Since Inception
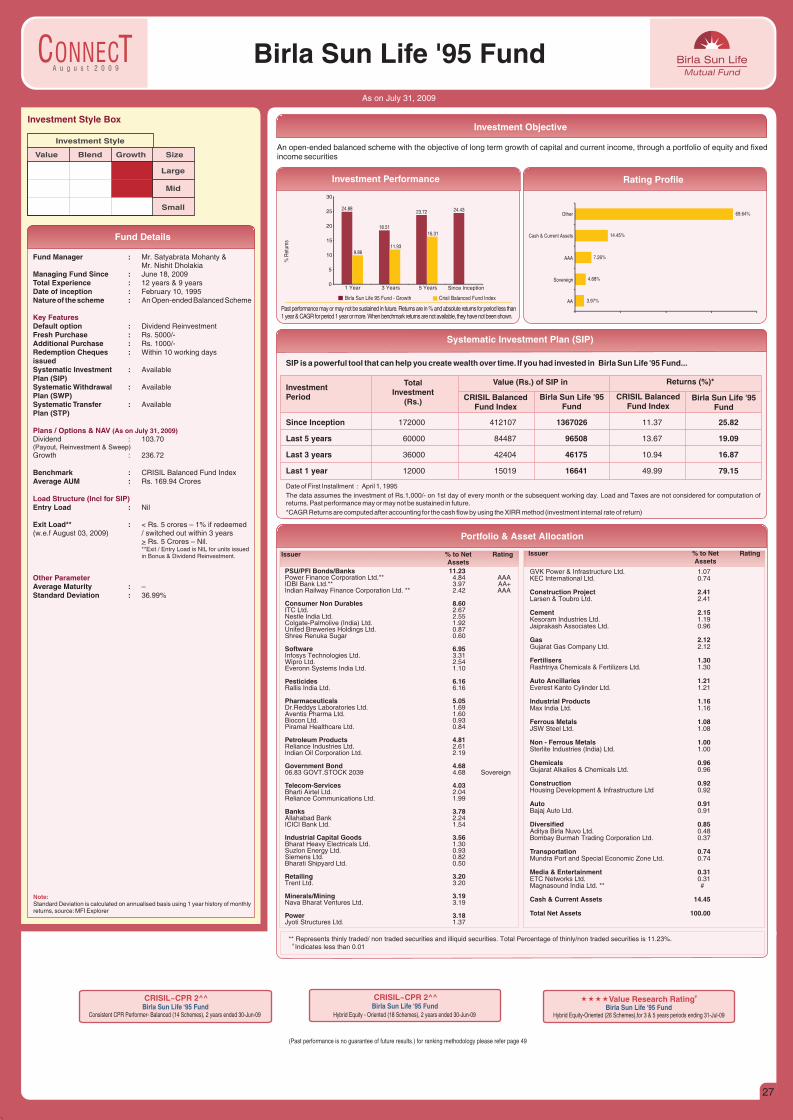
A u g u s t 2 0 0 9
Fund Details
27
Investment Objective
As on July 31, 2009
Birla Sun Life '95 Fund
Fund Manager :Mr. Nishit Dholakia
Managing Fund Since : June 18, 2009Total Experience : 12 years & 9 yearsDate of inception : February 10, 1995Nature of the scheme : An Open-ended Balanced Scheme
Default option : Dividend ReinvestmentFresh Purchase : Rs. 5000/-Additional Purchase : Rs. 1000/-Redemption Cheques : Within 10 working days issued Systematic Investment : Available Plan (SIP)Systematic Withdrawal : Available Plan (SWP)Systematic Transfer : AvailablePlan (STP)
Dividend : 103.70(Payout, Reinvestment & Sweep)Growth : 236.72
Benchmark : CRISIL Balanced Fund IndexAverage AUM : Rs. 169.94 Crores
Entry Load : Nil
Exit Load** : < Rs. 5 crores – 1% if redeemed (w.e.f August 03, 2009) / switched out within 3 years
> Rs. 5 Crores – Nil.**Exit / Entry Load is NIL for units issued in Bonus & Dividend Reinvestment.
Average Maturity : –Standard Deviation : 36.99%
Mr. Satyabrata Mohanty &
Key Features
Plans / Options & NAV
Load Structure (Incl for SIP)
Other Parameter
(As on July 31, 2009)
Investment Style Box
Value Blend Growth Size
Large
Mid
Small
Investment StyleAn open-ended balanced scheme with the objective of long term growth of capital and current income, through a portfolio of equity and fixed income securities
Portfolio & Asset Allocation
PSU/PFI Bonds/Banks 11.23Power Finance Corporation Ltd.** 4.84 AAAIDBI Bank Ltd.** 3.97 AA+Indian Railway Finance Corporation Ltd. ** 2.42 AAA
Consumer Non Durables 8.60ITC Ltd. 2.67 Nestle India Ltd. 2.55 Colgate-Palmolive (India) Ltd. 1.92 United Breweries Holdings Ltd. 0.87 Shree Renuka Sugar 0.60
Software 6.95Infosys Technologies Ltd. 3.31 Wipro Ltd. 2.54 Everonn Systems India Ltd. 1.10
Pesticides 6.16Rallis India Ltd. 6.16
Pharmaceuticals 5.05Dr.Reddys Laboratories Ltd. 1.69 Aventis Pharma Ltd. 1.60 Biocon Ltd. 0.93 Piramal Healthcare Ltd. 0.84
Petroleum Products 4.81Reliance Industries Ltd. 2.61 Indian Oil Corporation Ltd. 2.19
Government Bond 4.6806.83 GOVT.STOCK 2039 4.68 Sovereign
Telecom-Services 4.03Bharti Airtel Ltd. 2.04 Reliance Communications Ltd. 1.99
Banks 3.78Allahabad Bank 2.24 ICICI Bank Ltd. 1.54
Industrial Capital Goods 3.56Bharat Heavy Electricals Ltd. 1.30 Suzlon Energy Ltd. 0.93 Siemens Ltd. 0.82 Bharati Shipyard Ltd. 0.50
Retailing 3.20Trent Ltd. 3.20
Minerals/Mining 3.19Nava Bharat Ventures Ltd. 3.19
Power 3.18Jyoti Structures Ltd. 1.37
GVK Power & Infrastructure Ltd. 1.07 KEC International Ltd. 0.74
Construction Project 2.41Larsen & Toubro Ltd. 2.41
Cement 2.15Kesoram Industries Ltd. 1.19 Jaiprakash Associates Ltd. 0.96
Gas 2.12Gujarat Gas Company Ltd. 2.12
Fertilisers 1.30Rashtriya Chemicals & Fertilizers Ltd. 1.30
Auto Ancillaries 1.21Everest Kanto Cylinder Ltd. 1.21
Industrial Products 1.16Max India Ltd. 1.16
Ferrous Metals 1.08JSW Steel Ltd. 1.08
Non - Ferrous Metals 1.00Sterlite Industries (India) Ltd. 1.00
Chemicals 0.96Gujarat Alkalies & Chemicals Ltd. 0.96
Construction 0.92Housing Development & Infrastructure Ltd 0.92
Auto 0.91Bajaj Auto Ltd. 0.91
Diversified 0.85Aditya Birla Nuvo Ltd. 0.48 Bombay Burmah Trading Corporation Ltd. 0.37
Transportation 0.74Mundra Port and Special Economic Zone Ltd. 0.74
Media & Entertainment 0.31ETC Networks Ltd. 0.31 Magnasound India Ltd. ** #
Cash & Current Assets 14.45
Total Net Assets 100.00
Issuer % to Net RatingAssets
Issuer % to Net RatingAssets
** Represents thinly traded/ non traded securities and illiquid securities. Total Percentage of thinly/non traded securities is 11.23%. #
Indicates less than 0.01
Note:Standard Deviation is calculated on annualised basis using 1 year history of monthly returns, source: MFI Explorer
Past performance may or may not be sustained in future. Returns are in % and absolute returns for period less than 1 year & CAGR for period 1 year or more. When benchmark returns are not available, they have not been shown.
% R
etur
ns
Investment Performance Rating Profile
Birla Sun Life 95 Fund - Growth Crisil Balanced Fund Index
(Past performance is no guarantee of future results.) for ranking methodology please refer page 49
#««««Value Research Rating
Hybrid Equity-Oriented (26 Schemes),for 3 & 5 years periods ending 31-Jul-09Birla Sun Life ‘95 Fund
Hybrid Equity - Oriented (18 Schemes), 2 years ended 30-Jun-09
Birla Sun Life ‘95 FundCRISIL~CPR 2^^
SIP is a powerful tool that can help you create wealth over time. If you had invested in Birla Sun Life '95 Fund...
Systematic Investment Plan (SIP)
Date of First Installment : April 1, 1995
The data assumes the investment of Rs.1,000/- on 1st day of every month or the subsequent working day. Load and Taxes are not considered for computation of returns. Past performance may or may not be sustained in future.
*CAGR Returns are computed after accounting for the cash flow by using the XIRR method (investment internal rate of return)
Investment Period
Total Investment
(Rs.) Birla Sun Life '95 Fund
Birla Sun Life '95 Fund
CRISIL Balanced Fund Index
CRISIL Balanced Fund Index
Since Inception 172000 412107 1367026 11.37 25.82
Last 5 years 60000 84487 96508 13.67 19.09
Last 3 years 36000 42404 46175 10.94 16.87
Last 1 year 12000 15019 16641 49.99 79.15
Value (Rs.) of SIP in Returns (%)*
3.97%
4.68%
7.26%
14.45%
69.64%
AA
Sovereign
AAA
Cash & Current Assets
Other
Consistent CPR Performer- Balanced (14 Schemes), 2 years ended 30-Jun-09Birla Sun Life ‘95 FundCRISIL~CPR 2^^
24.88
18.51
23.72 24.43
9.8611.93
16.31
0
5
10
15
20
25
30
1 Year 3 Years 5 Years Since Inception
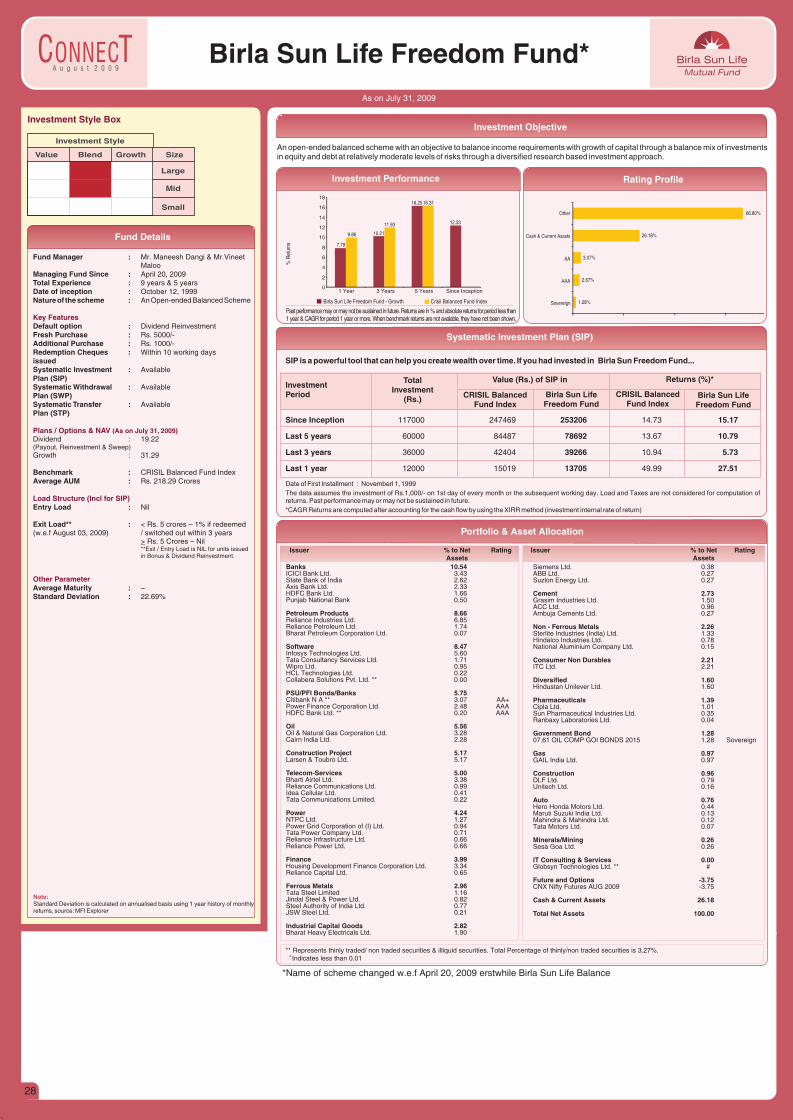
A u g u s t 2 0 0 9
Fund Details
28
Investment Objective
Birla Sun Life Freedom Fund*As on July 31, 2009
Investment Style Box
Value Blend Growth Size
Large
Mid
Small
Investment Style
Fund Manager :Maloo
Managing Fund Since : April 20, 2009Total Experience : 9 years & 5 yearsDate of inception : October 12, 1999Nature of the scheme : An Open-ended Balanced Scheme
Default option : Dividend ReinvestmentFresh Purchase : Rs. 5000/-Additional Purchase : Rs. 1000/-Redemption Cheques : Within 10 working days issuedSystematic Investment : Available Plan (SIP)Systematic Withdrawal : Available Plan (SWP)Systematic Transfer : AvailablePlan (STP)
Dividend : 19.22(Payout, Reinvestment & Sweep)Growth : 31.29
Benchmark : CRISIL Balanced Fund IndexAverage AUM : Rs. 218.29 Crores
Entry Load : Nil
Exit Load** : < Rs. 5 crores – 1% if redeemed (w.e.f August 03, 2009) / switched out within 3 years
> Rs. 5 Crores – Nil **Exit / Entry Load is NIL for units issued in Bonus & Dividend Reinvestment.
Average Maturity : –Standard Deviation : 22.69%
Mr. Maneesh Dangi & Mr.Vineet
Key Features
Plans / Options & NAV
Load Structure (Incl for SIP)
Other Parameter
(As on July 31, 2009)
Note:Standard Deviation is calculated on annualised basis using 1 year history of monthly returns, source: MFI Explorer
An open-ended balanced scheme with an objective to balance income requirements with growth of capital through a balance mix of investments in equity and debt at relatively moderate levels of risks through a diversified research based investment approach.
Past performance may or may not be sustained in future. Returns are in % and absolute returns for period less than 1 year & CAGR for period 1 year or more. When benchmark returns are not available, they have not been shown.
% R
etur
ns
Investment Performance Rating Profile
Birla Sun Life Freedom Fund - Growth Crisil Balanced Fund Index
Banks 10.54ICICI Bank Ltd. 3.43 State Bank of India 2.62 Axis Bank Ltd. 2.33 HDFC Bank Ltd. 1.66 Punjab National Bank 0.50
Petroleum Products 8.66Reliance Industries Ltd. 6.85 Reliance Petroleum Ltd. 1.74 Bharat Petroleum Corporation Ltd. 0.07
Software 8.47Infosys Technologies Ltd. 5.60 Tata Consultancy Services Ltd. 1.71 Wipro Ltd. 0.95 HCL Technologies Ltd. 0.22 Collabera Solutions Pvt. Ltd. ** 0.00
PSU/PFI Bonds/Banks 5.75Citibank N A ** 3.07 AA+Power Finance Corporation Ltd. 2.48 AAAHDFC Bank Ltd. ** 0.20 AAA
Oil 5.56Oil & Natural Gas Corporation Ltd. 3.28 Cairn India Ltd. 2.28
Construction Project 5.17Larsen & Toubro Ltd. 5.17
Telecom-Services 5.00Bharti Airtel Ltd. 3.38 Reliance Communications Ltd. 0.99 Idea Cellular Ltd. 0.41 Tata Communications Limited. 0.22
Power 4.24NTPC Ltd. 1.27 Power Grid Corporation of (I) Ltd. 0.94 Tata Power Company Ltd. 0.71 Reliance Infrastructure Ltd. 0.66 Reliance Power Ltd. 0.66
Finance 3.99Housing Development Finance Corporation Ltd. 3.34 Reliance Capital Ltd. 0.65
Ferrous Metals 2.96Tata Steel Limited 1.16 Jindal Steel & Power Ltd. 0.82 Steel Authority of India Ltd. 0.77 JSW Steel Ltd. 0.21
Industrial Capital Goods 2.82Bharat Heavy Electricals Ltd. 1.90
Issuer % to Net RatingAssets
** Represents thinly traded/ non traded securities & illiquid securities. Total Percentage of thinly/non traded securities is 3.27%. # Indicates less than 0.01
Portfolio & Asset Allocation
Siemens Ltd. 0.38 ABB Ltd. 0.27 Suzlon Energy Ltd. 0.27
Cement 2.73Grasim Industries Ltd. 1.50 ACC Ltd. 0.96 Ambuja Cements Ltd. 0.27
Non - Ferrous Metals 2.26Sterlite Industries (India) Ltd. 1.33 Hindalco Industries Ltd. 0.78 National Aluminium Company Ltd. 0.15
Consumer Non Durables 2.21ITC Ltd. 2.21
Diversified 1.60Hindustan Unilever Ltd. 1.60
Pharmaceuticals 1.39Cipla Ltd. 1.01 Sun Pharmaceutical Industries Ltd. 0.35 Ranbaxy Laboratories Ltd. 0.04
Government Bond 1.2807.61 OIL COMP GOI BONDS 2015 1.28 Sovereign
Gas 0.97GAIL India Ltd. 0.97
Construction 0.96DLF Ltd. 0.79 Unitech Ltd. 0.16
Auto 0.76Hero Honda Motors Ltd. 0.44 Maruti Suzuki India Ltd. 0.13 Mahindra & Mahindra Ltd. 0.12 Tata Motors Ltd. 0.07
Minerals/Mining 0.26Sesa Goa Ltd. 0.26
IT Consulting & Services 0.00Globsyn Technologies Ltd. ** #
Future and Options -3.75CNX Nifty Futures AUG 2009 -3.75
Cash & Current Assets 26.18
Total Net Assets 100.00
Issuer % to Net RatingAssets
*Name of scheme changed w.e.f April 20, 2009 erstwhile Birla Sun Life Balance
SIP is a powerful tool that can help you create wealth over time. If you had invested in Birla Sun Freedom Fund...
Systematic Investment Plan (SIP)
Date of First Installment : Novemberl 1, 1999
The data assumes the investment of Rs.1,000/- on 1st day of every month or the subsequent working day. Load and Taxes are not considered for computation of returns. Past performance may or may not be sustained in future.
*CAGR Returns are computed after accounting for the cash flow by using the XIRR method (investment internal rate of return)
Investment Period
Total Investment
(Rs.) Birla Sun Life Freedom Fund
Birla Sun Life Freedom Fund
CRISIL Balanced Fund Index
CRISIL Balanced Fund Index
Since Inception 117000 247469 253206 14.73 15.17
Last 5 years 60000 84487 78692 13.67 10.79
Last 3 years 36000 42404 39266 10.94 5.73
Last 1 year 12000 15019 13705 49.99 27.51
Value (Rs.) of SIP in Returns (%)*
1.28%
2.67%
3.07%
26.18%
66.80%
Sovereign
AAA
AA
Cash & Current Assets
Other
7.79
10.21
16.25
12.33
9.86
11.93
16.31
0
2
4
6
8
10
12
14
16
18
1 Year 3 Years 5 Years Since Inception
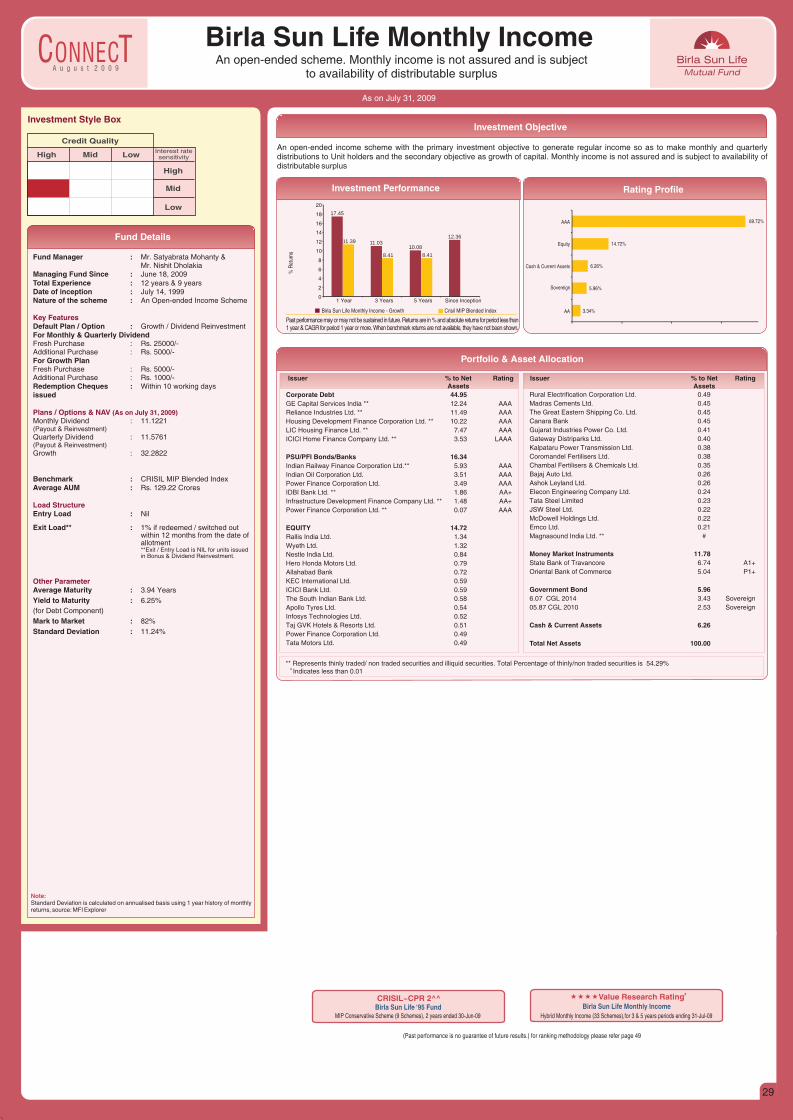
A u g u s t 2 0 0 9
Fund Details
29
Birla Sun Life Monthly IncomeAn open-ended scheme. Monthly income is not assured and is subject
to availability of distributable surplus
As on July 31, 2009
Investment Style Box
High Mid Low Interest rate sensitivity
High
Mid
Low
Credit Quality
Fund Manager :Mr. Nishit Dholakia
Managing Fund Since : June 18, 2009Total Experience : 12 years & 9 yearsDate of inception : July 14, 1999Nature of the scheme : An Open-ended Income Scheme
Default Plan / Option : Growth / Dividend ReinvestmentFor Monthly & Quarterly Dividend Fresh Purchase : Rs. 25000/-Additional Purchase : Rs. 5000/-For Growth PlanFresh Purchase : Rs. 5000/-Additional Purchase : Rs. 1000/-Redemption Cheques : Within 10 working days issued
Monthly Dividend : 11.1221(Payout & Reinvestment)Quarterly Dividend : 11.5761(Payout & Reinvestment)Growth : 32.2822
Benchmark : CRISIL MIP Blended IndexAverage AUM : Rs. 129.22 Crores
Entry Load : Nil
Exit Load** : 1% if redeemed / switched out within 12 months from the date of allotment **Exit / Entry Load is NIL for units issued in Bonus & Dividend Reinvestment.
Average Maturity : 3.94 Years
Yield to Maturity : 6.25%
(for Debt Component)
Mark to Market : 82%
Standard Deviation : 11.24%
Mr. Satyabrata Mohanty &
Key Features
Plans / Options & NAV
Load Structure
Other Parameter
(As on July 31, 2009)
An open-ended income scheme with the primary investment objective to generate regular income so as to make monthly and quarterly distributions to Unit holders and the secondary objective as growth of capital. Monthly income is not assured and is subject to availability of distributable surplus
Investment Objective
Past performance may or may not be sustained in future. Returns are in % and absolute returns for period less than 1 year & CAGR for period 1 year or more. When benchmark returns are not available, they have not been shown.
% R
etur
ns
Investment Performance Rating Profile
Birla Sun Life Monthly Income - Growth Crisil MIP Blended Index
Corporate Debt 44.95GE Capital Services India ** 12.24 AAA
Reliance Industries Ltd. ** 11.49 AAA
Housing Development Finance Corporation Ltd. ** 10.22 AAA
LIC Housing Finance Ltd. ** 7.47 AAA
ICICI Home Finance Company Ltd. ** 3.53 LAAA
PSU/PFI Bonds/Banks 16.34Indian Railway Finance Corporation Ltd.** 5.93 AAA
Indian Oil Corporation Ltd. 3.51 AAA
Power Finance Corporation Ltd. 3.49 AAA
IDBI Bank Ltd. ** 1.86 AA+
Infrastructure Development Finance Company Ltd. ** 1.48 AA+
Power Finance Corporation Ltd. ** 0.07 AAA
EQUITY 14.72Rallis India Ltd. 1.34
Wyeth Ltd. 1.32
Nestle India Ltd. 0.84
Hero Honda Motors Ltd. 0.79
Allahabad Bank 0.72
KEC International Ltd. 0.59
ICICI Bank Ltd. 0.59
The South Indian Bank Ltd. 0.58
Apollo Tyres Ltd. 0.54
Infosys Technologies Ltd. 0.52
Taj GVK Hotels & Resorts Ltd. 0.51
Power Finance Corporation Ltd. 0.49
Tata Motors Ltd. 0.49
Rural Electrification Corporation Ltd. 0.49
Madras Cements Ltd. 0.45
The Great Eastern Shipping Co. Ltd. 0.45
Canara Bank 0.45
Gujarat Industries Power Co. Ltd. 0.41
Gateway Distriparks Ltd. 0.40
Kalpataru Power Transmission Ltd. 0.38
Coromandel Fertilisers Ltd. 0.38
Chambal Fertilisers & Chemicals Ltd. 0.35
Bajaj Auto Ltd. 0.26
Ashok Leyland Ltd. 0.26
Elecon Engineering Company Ltd. 0.24
Tata Steel Limited 0.23
JSW Steel Ltd. 0.22
McDowell Holdings Ltd. 0.22
Emco Ltd. 0.21
Magnasound India Ltd. ** #
Money Market Instruments 11.78State Bank of Travancore 6.74 A1+
Oriental Bank of Commerce 5.04 P1+
Government Bond 5.966.07 CGL 2014 3.43 Sovereign
05.87 CGL 2010 2.53 Sovereign
Cash & Current Assets 6.26
Total Net Assets 100.00
Issuer % to Net RatingAssets
Issuer % to Net RatingAssets
** Represents thinly traded/ non traded securities and illiquid securities. Total Percentage of thinly/non traded securities is 54.29% # Indicates less than 0.01
Portfolio & Asset Allocation
(Past performance is no guarantee of future results.) for ranking methodology please refer page 49
«««« #Value Research Rating
Hybrid Monthly Income (33 Schemes),for 3 & 5 years periods ending 31-Jul-09
Birla Sun Life Monthly Income
Note:Standard Deviation is calculated on annualised basis using 1 year history of monthly returns, source: MFI Explorer
3.34%
5.96%
6.26%
14.72%
69.72%
AA
Sovereign
Cash & Current Assets
Equity
AAA
MIP Conservative Scheme (9 Schemes), 2 years ended 30-Jun-09
Birla Sun Life ‘95 FundCRISIL~CPR 2^^
17.45
11.0310.08
12.3611.39
8.41 8.41
0
2
4
6
8
10
12
14
16
18
20
1 Year 3 Years 5 Years Since Inception
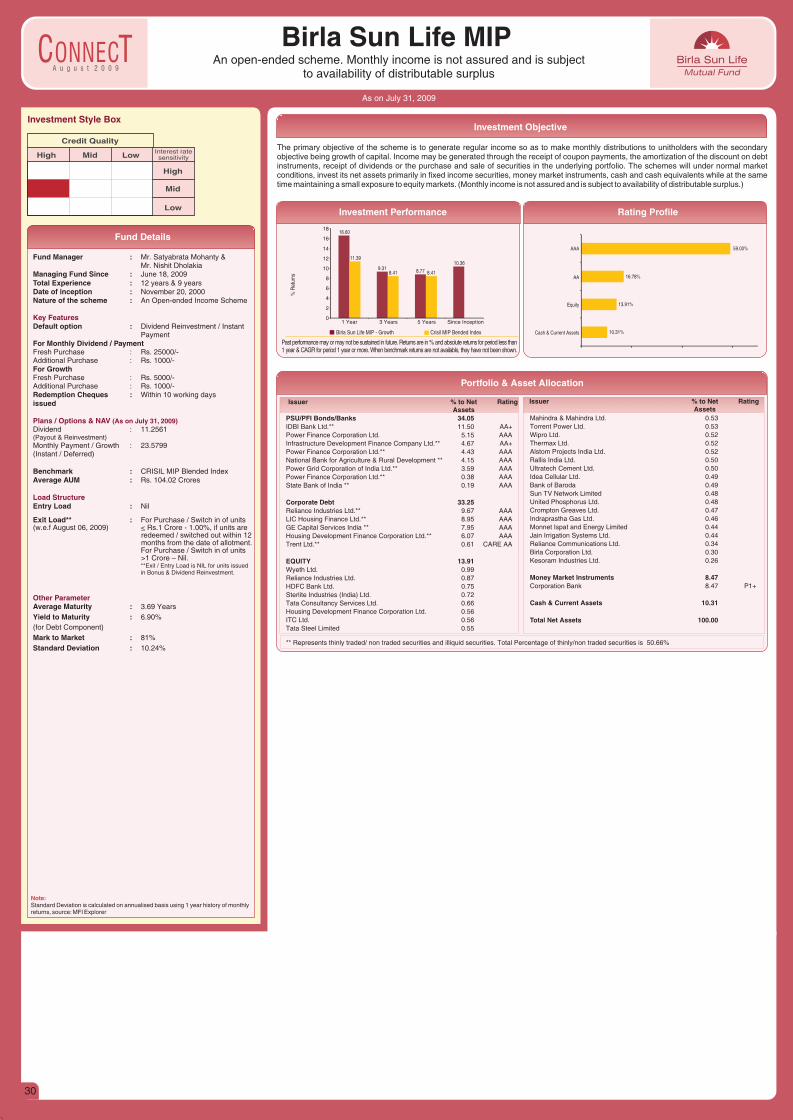
A u g u s t 2 0 0 9
Fund Details
30
Birla Sun Life MIPAn open-ended scheme. Monthly income is not assured and is subject
to availability of distributable surplus
As on July 31, 2009
Investment Style Box
Credit Quality
High Mid Low Interest rate sensitivity
High
Mid
Low
Fund Manager :Mr. Nishit Dholakia
Managing Fund Since : June 18, 2009Total Experience : 12 years & 9 yearsDate of inception : November 20, 2000Nature of the scheme : An Open-ended Income Scheme
Default option : Dividend Reinvestment / Instant Payment
For Monthly Dividend / PaymentFresh Purchase : Rs. 25000/-Additional Purchase : Rs. 1000/-For GrowthFresh Purchase : Rs. 5000/-Additional Purchase : Rs. 1000/-Redemption Cheques : Within 10 working days issued
Dividend : 11.2561(Payout & Reinvestment)Monthly Payment / Growth : 23.5799(Instant / Deferred)
Benchmark : CRISIL MIP Blended IndexAverage AUM : Rs. 104.02 Crores
Entry Load : Nil
Exit Load** : For Purchase / Switch in of units(w.e.f August 06, 2009) < Rs.1 Crore - 1.00%, if units are
redeemed / switched out within 12 months from the date of allotment. For Purchase / Switch in of units >1 Crore – Nil.**Exit / Entry Load is NIL for units issued in Bonus & Dividend Reinvestment.
Average Maturity : 3.69 Years
Yield to Maturity : 6.90%
(for Debt Component)
Mark to Market : 81%
Standard Deviation : 10.24%
Mr. Satyabrata Mohanty &
Key Features
Plans / Options & NAV
Load Structure
Other Parameter
(As on July 31, 2009)
Note:Standard Deviation is calculated on annualised basis using 1 year history of monthly returns, source: MFI Explorer
The primary objective of the scheme is to generate regular income so as to make monthly distributions to unitholders with the secondary objective being growth of capital. Income may be generated through the receipt of coupon payments, the amortization of the discount on debt instruments, receipt of dividends or the purchase and sale of securities in the underlying portfolio. The schemes will under normal market conditions, invest its net assets primarily in fixed income securities, money market instruments, cash and cash equivalents while at the same time maintaining a small exposure to equity markets. (Monthly income is not assured and is subject to availability of distributable surplus.)
Investment Objective
Past performance may or may not be sustained in future. Returns are in % and absolute returns for period less than 1 year & CAGR for period 1 year or more. When benchmark returns are not available, they have not been shown.
% R
etur
ns
Investment Performance Rating Profile
Birla Sun Life MIP - Growth Crisil MIP Bended Index
PSU/PFI Bonds/Banks 34.05IDBI Bank Ltd.** 11.50 AA+
Power Finance Corporation Ltd. 5.15 AAA
Infrastructure Development Finance Company Ltd.** 4.67 AA+
Power Finance Corporation Ltd.** 4.43 AAA
National Bank for Agriculture & Rural Development ** 4.15 AAA
Power Grid Corporation of India Ltd.** 3.59 AAA
Power Finance Corporation Ltd.** 0.38 AAA
State Bank of India ** 0.19 AAA
Corporate Debt 33.25Reliance Industries Ltd.** 9.67 AAA
LIC Housing Finance Ltd.** 8.95 AAA
GE Capital Services India ** 7.95 AAA
Housing Development Finance Corporation Ltd.** 6.07 AAA
Trent Ltd.** 0.61 CARE AA
EQUITY 13.91Wyeth Ltd. 0.99
Reliance Industries Ltd. 0.87
HDFC Bank Ltd. 0.75
Sterlite Industries (India) Ltd. 0.72
Tata Consultancy Services Ltd. 0.66
Housing Development Finance Corporation Ltd. 0.56
ITC Ltd. 0.56
Tata Steel Limited 0.55
Mahindra & Mahindra Ltd. 0.53
Torrent Power Ltd. 0.53
Wipro Ltd. 0.52
Thermax Ltd. 0.52
Alstom Projects India Ltd. 0.52
Rallis India Ltd. 0.50
Ultratech Cement Ltd. 0.50
Idea Cellular Ltd. 0.49
Bank of Baroda 0.49
Sun TV Network Limited 0.48
United Phosphorus Ltd. 0.48
Crompton Greaves Ltd. 0.47
Indraprastha Gas Ltd. 0.46
Monnet Ispat and Energy Limited 0.44
Jain Irrigation Systems Ltd. 0.44
Reliance Communications Ltd. 0.34
Birla Corporation Ltd. 0.30
Kesoram Industries Ltd. 0.26
Money Market Instruments 8.47Corporation Bank 8.47 P1+
Cash & Current Assets 10.31
Total Net Assets 100.00
Issuer % to Net RatingAssets
Issuer % to Net RatingAssets
Portfolio & Asset Allocation
** Represents thinly traded/ non traded securities and illiquid securities. Total Percentage of thinly/non traded securities is 50.66%
10.31%
13.91%
16.78%
59.00%
Cash & Current Assets
Equity
AA
AAA
16.60
9.318.77
10.3611.39
8.41 8.41
0
2
4
6
8
10
12
14
16
18
1 Year 3 Years 5 Years Since Inception
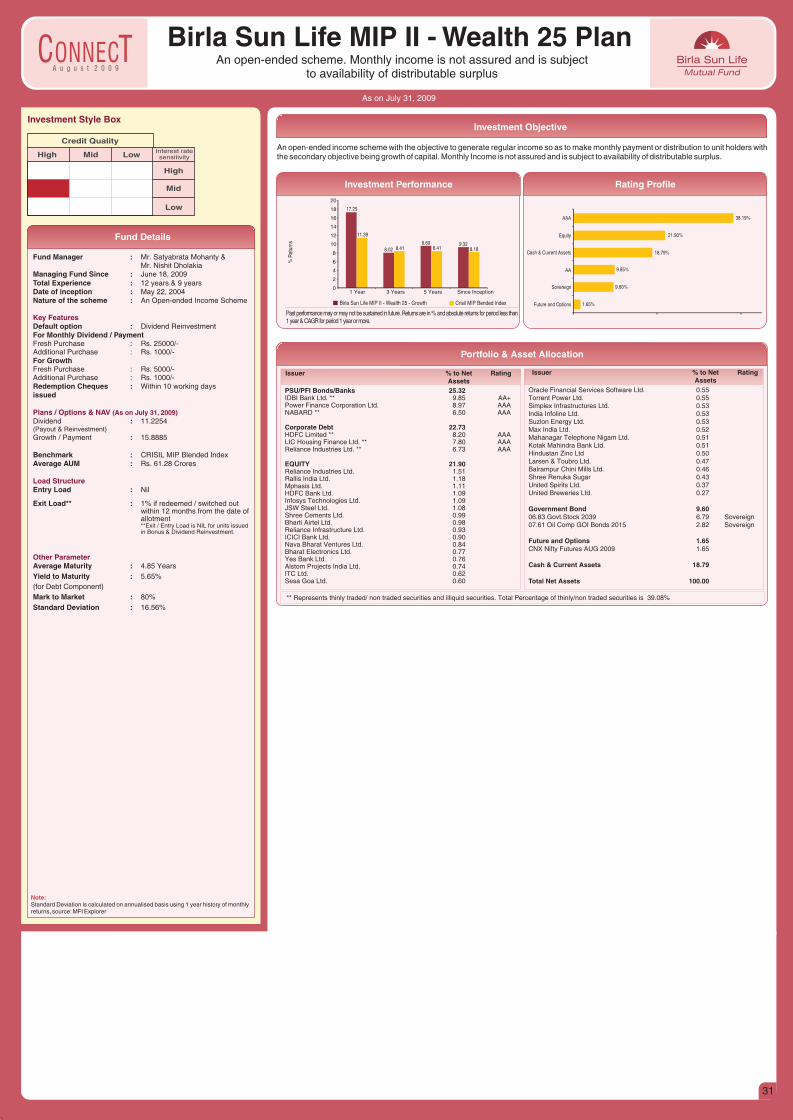
A u g u s t 2 0 0 9
Fund Details
31
Investment Objective
Birla Sun Life MIP II - Wealth 25 PlanAn open-ended scheme. Monthly income is not assured and is subject
to availability of distributable surplus
As on July 31, 2009
Investment Style Box
Credit Quality
High Mid Low Interest rate sensitivity
High
Mid
Low
Fund Manager :Mr. Nishit Dholakia
Managing Fund Since : June 18, 2009Total Experience : 12 years & 9 yearsDate of inception : May 22, 2004Nature of the scheme : An Open-ended Income Scheme
Default option : Dividend ReinvestmentFor Monthly Dividend / PaymentFresh Purchase : Rs. 25000/-Additional Purchase : Rs. 1000/-For GrowthFresh Purchase : Rs. 5000/-Additional Purchase : Rs. 1000/-Redemption Cheques : Within 10 working days issued
Dividend : 11.2254(Payout & Reinvestment)
Growth / Payment : 15.8885
Benchmark : CRISIL MIP Blended IndexAverage AUM : Rs. 61.28 Crores
Entry Load : Nil
Exit Load** : 1% if redeemed / switched out within 12 months from the date of allotment **Exit / Entry Load is NIL for units issued in Bonus & Dividend Reinvestment.
Average Maturity : 4.85 Years
Yield to Maturity : 5.65%
(for Debt Component)
Mark to Market : 80%
Standard Deviation : 16.56%
Mr. Satyabrata Mohanty &
Key Features
Plans / Options & NAV
Load Structure
Other Parameter
(As on July 31, 2009)
An open-ended income scheme with the objective to generate regular income so as to make monthly payment or distribution to unit holders with the secondary objective being growth of capital. Monthly Income is not assured and is subject to availability of distributable surplus.
Past performance may or may not be sustained in future. Returns are in % and absolute returns for period less than 1 year & CAGR for period 1 year or more.
% R
etur
ns
Investment Performance Rating Profile
Birla Sun Life MIP II - Wealth 25 - Growth Crisil MIP Bended Index
PSU/PFI Bonds/Banks 25.32IDBI Bank Ltd. ** 9.85 AA+Power Finance Corporation Ltd. 8.97 AAANABARD ** 6.50 AAA
Corporate Debt 22.73HDFC Limited ** 8.20 AAALIC Housing Finance Ltd. ** 7.80 AAAReliance Industries Ltd. ** 6.73 AAA
EQUITY 21.90Reliance Industries Ltd. 1.51 Rallis India Ltd. 1.18 Mphasis Ltd. 1.11 HDFC Bank Ltd. 1.09 Infosys Technologies Ltd. 1.09 JSW Steel Ltd. 1.08 Shree Cements Ltd. 0.99 Bharti Airtel Ltd. 0.98 Reliance Infrastructure Ltd. 0.93 ICICI Bank Ltd. 0.90 Nava Bharat Ventures Ltd. 0.84 Bharat Electronics Ltd. 0.77 Yes Bank Ltd. 0.76 Alstom Projects India Ltd. 0.74 ITC Ltd. 0.62 Sesa Goa Ltd. 0.60
Oracle Financial Services Software Ltd. 0.55 Torrent Power Ltd. 0.55 Simplex Infrastructures Ltd. 0.53 India Infoline Ltd. 0.53 Suzlon Energy Ltd. 0.53 Max India Ltd. 0.52 Mahanagar Telephone Nigam Ltd. 0.51 Kotak Mahindra Bank Ltd. 0.51 Hindustan Zinc Ltd 0.50 Larsen & Toubro Ltd. 0.47 Balrampur Chini Mills Ltd. 0.46 Shree Renuka Sugar 0.43 United Spirits Ltd. 0.37 United Breweries Ltd. 0.27
Government Bond 9.6006.83 Govt.Stock 2039 6.79 Sovereign07.61 Oil Comp GOI Bonds 2015 2.82 Sovereign
Future and Options 1.65CNX Nifty Futures AUG 2009 1.65
Cash & Current Assets 18.79
Total Net Assets 100.00
Issuer % to Net RatingAssets
Issuer % to Net RatingAssets
Portfolio & Asset Allocation
Note:Standard Deviation is calculated on annualised basis using 1 year history of monthly returns, source: MFI Explorer
** Represents thinly traded/ non traded securities and illiquid securities. Total Percentage of thinly/non traded securities is 39.08%
1.65%
9.60%
9.85%
18.79%
21.90%
38.19%
Future and Options
Sovereign
AA
Cash & Current Assets
Equity
AAA
17.25
8.029.60 9.32
11.39
8.41 8.41 8.18
0
2
4
6
8
10
12
14
16
18
20
1 Year 3 Years 5 Years Since Inception
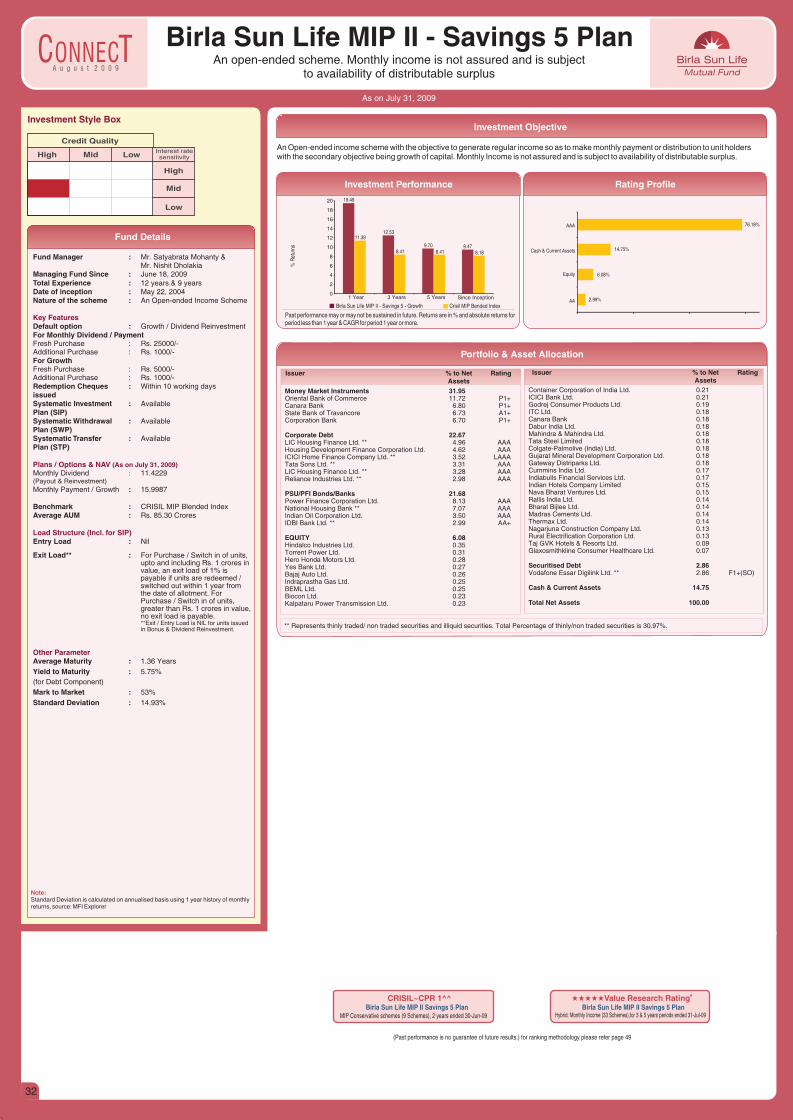
A u g u s t 2 0 0 9
Fund Details
Investment Objective
As on July 31, 2009
Birla Sun Life MIP II - Savings 5 PlanAn open-ended scheme. Monthly income is not assured and is subject
to availability of distributable surplus
Investment Style Box
Credit Quality
High Mid Low Interest rate sensitivity
High
Mid
Low
Fund Manager :Mr. Nishit Dholakia
Managing Fund Since : June 18, 2009Total Experience : 12 years & 9 yearsDate of inception : May 22, 2004Nature of the scheme : An Open-ended Income Scheme
Default option : Growth / Dividend ReinvestmentFor Monthly Dividend / PaymentFresh Purchase : Rs. 25000/-Additional Purchase : Rs. 1000/-For GrowthFresh Purchase : Rs. 5000/-Additional Purchase : Rs. 1000/-Redemption Cheques : Within 10 working days issuedSystematic Investment : Available Plan (SIP)Systematic Withdrawal : Available Plan (SWP)Systematic Transfer : AvailablePlan (STP)
Monthly Dividend : 11.4229(Payout & Reinvestment)
Monthly Payment / Growth : 15.9987 Benchmark : CRISIL MIP Blended IndexAverage AUM : Rs. 85.30 Crores
Entry Load : Nil
Exit Load** : For Purchase / Switch in of units, upto and including Rs. 1 crores in value, an exit load of 1% is payable if units are redeemed / switched out within 1 year from the date of allotment. For Purchase / Switch in of units, greater than Rs. 1 crores in value, no exit load is payable.**Exit / Entry Load is NIL for units issued in Bonus & Dividend Reinvestment.
Average Maturity : 1.36 Years
Yield to Maturity : 5.75%
(for Debt Component)
Mark to Market : 53%
Standard Deviation : 14.93%
Mr. Satyabrata Mohanty &
Key Features
Plans / Options & NAV
Load Structure (Incl. for SIP)
Other Parameter
(As on July 31, 2009)
Note:Standard Deviation is calculated on annualised basis using 1 year history of monthly returns, source: MFI Explorer
An Open-ended income scheme with the objective to generate regular income so as to make monthly payment or distribution to unit holderswith the secondary objective being growth of capital. Monthly Income is not assured and is subject to availability of distributable surplus.
Past performance may or may not be sustained in future. Returns are in % and absolute returns for period less than 1 year & CAGR for period 1 year or more.
% R
etur
ns
Investment Performance Rating Profile
Birla Sun Life MIP II - Savings 5 - Growth Crisil MIP Bended Index
Money Market Instruments 31.95Oriental Bank of Commerce 11.72 P1+Canara Bank 6.80 P1+State Bank of Travancore 6.73 A1+Corporation Bank 6.70 P1+
Corporate Debt 22.67LIC Housing Finance Ltd. ** 4.96 AAAHousing Development Finance Corporation Ltd. 4.62 AAAICICI Home Finance Company Ltd. ** 3.52 LAAATata Sons Ltd. ** 3.31 AAALIC Housing Finance Ltd. ** 3.28 AAAReliance Industries Ltd. ** 2.98 AAA
PSU/PFI Bonds/Banks 21.68Power Finance Corporation Ltd. 8.13 AAANational Housing Bank ** 7.07 AAAIndian Oil Corporation Ltd. 3.50 AAAIDBI Bank Ltd. ** 2.99 AA+
EQUITY 6.08Hindalco Industries Ltd. 0.35 Torrent Power Ltd. 0.31 Hero Honda Motors Ltd. 0.28 Yes Bank Ltd. 0.27 Bajaj Auto Ltd. 0.26 Indraprastha Gas Ltd. 0.25 BEML Ltd. 0.25 Biocon Ltd. 0.23 Kalpataru Power Transmission Ltd. 0.23
Container Corporation of India Ltd. 0.21 ICICI Bank Ltd. 0.21 Godrej Consumer Products Ltd. 0.19 ITC Ltd. 0.18 Canara Bank 0.18 Dabur India Ltd. 0.18 Mahindra & Mahindra Ltd. 0.18 Tata Steel Limited 0.18 Colgate-Palmolive (India) Ltd. 0.18 Gujarat Mineral Development Corporation Ltd. 0.18 Gateway Distriparks Ltd. 0.18 Cummins India Ltd. 0.17 Indiabulls Financial Services Ltd. 0.17 Indian Hotels Company Limited 0.15 Nava Bharat Ventures Ltd. 0.15 Rallis India Ltd. 0.14 Bharat Bijlee Ltd. 0.14 Madras Cements Ltd. 0.14 Thermax Ltd. 0.14 Nagarjuna Construction Company Ltd. 0.13 Rural Electrification Corporation Ltd. 0.13 Taj GVK Hotels & Resorts Ltd. 0.09 Glaxosmithkline Consumer Healthcare Ltd. 0.07
Securitised Debt 2.86Vodafone Essar Digilink Ltd. ** 2.86 F1+(SO)
Cash & Current Assets 14.75
Total Net Assets 100.00
Issuer % to Net RatingAssets
Issuer % to Net RatingAssets
Portfolio & Asset Allocation
** Represents thinly traded/ non traded securities and illiquid securities. Total Percentage of thinly/non traded securities is 30.97%.
ii#
iiiValue Research RatingBirla Sun Life MIP II Savings 5 Plan
Hybrid: Monthly Income (33 Schemes),for 3 & 5 years periods ended 31-Jul-09
(Past performance is no guarantee of future results.) for ranking methodology please refer page 49
MIP Conservative schemes (9 Schemes), 2 years ended 30-Jun-09Birla Sun Life MIP II Savings 5 Plan
CRISIL~CPR 1^^
32
2.99%
6.08%
14.75%
76.18%
AA
Equity
Cash & Current Assets
AAA
19.49
12.53
9.70 9.47
11.39
8.41 8.41 8.18
0
2
4
6
8
10
12
14
16
18
20
1 Year 3 Years 5 Years Since Inception
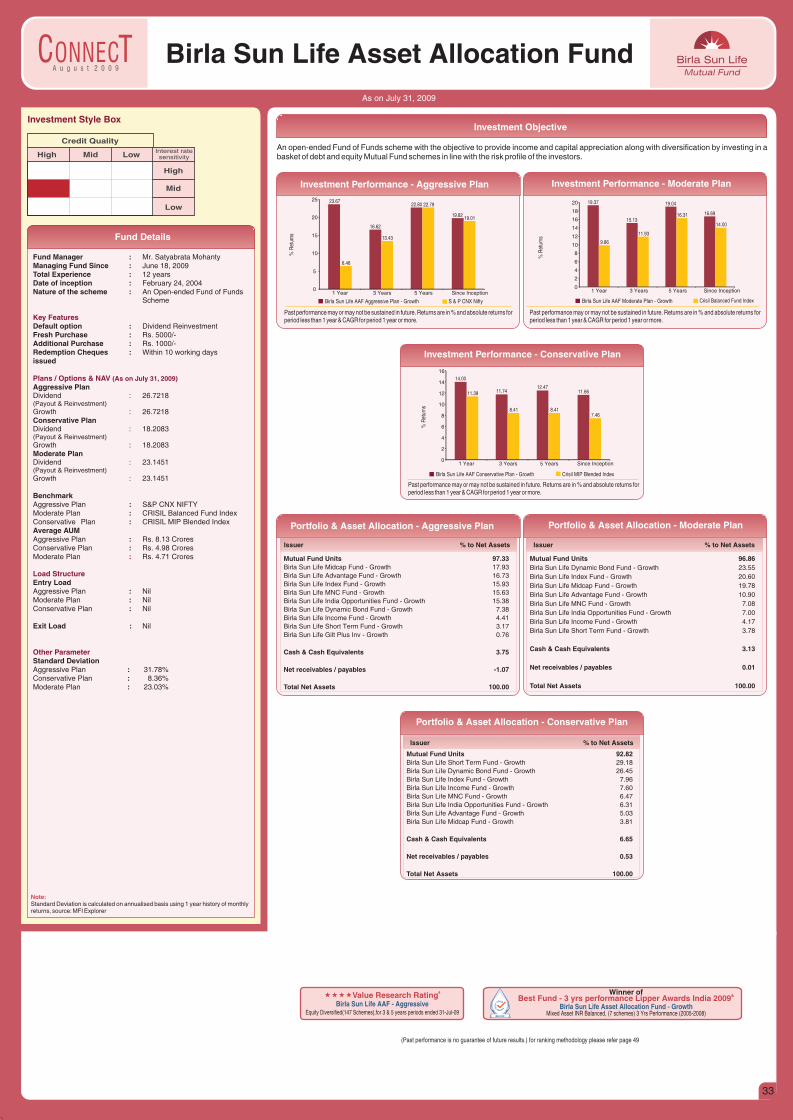
A u g u s t 2 0 0 9
Fund Details
33
Investment Objective
As on July 31, 2009
Birla Sun Life Asset Allocation Fund
Investment Style Box
Credit Quality
High Mid Low Interest rate sensitivity
High
Mid
Low
Fund Manager :Managing Fund Since : June 18, 2009Total Experience : 12 yearsDate of inception : February 24, 2004Nature of the scheme : An Open-ended Fund of Funds
Scheme
Default option : Dividend ReinvestmentFresh Purchase : Rs. 5000/-Additional Purchase : Rs. 1000/-Redemption Cheques : Within 10 working days issued
Aggressive PlanDividend : 26.7218(Payout & Reinvestment)Growth : 26.7218Conservative PlanDividend : 18.2083(Payout & Reinvestment)Growth : 18.2083Moderate PlanDividend : 23.1451(Payout & Reinvestment)Growth : 23.1451
BenchmarkAggressive Plan : S&P CNX NIFTYModerate Plan : CRISIL Balanced Fund IndexConservative Plan : CRISIL MIP Blended IndexAverage AUMAggressive Plan : Rs. 8.13 CroresConservative Plan : Rs. 4.98 CroresModerate Plan Rs. 4.71 Crores
Entry Load Aggressive Plan : NilModerate Plan : NilConservative Plan : Nil
Exit Load : Nil
Standard Deviation Aggressive Plan : 31.78%Conservative Plan : 8.36%Moderate Plan : 23.03%
Mr. Satyabrata Mohanty
Key Features
Plans / Options & NAV
:
Load Structure
Other Parameter
(As on July 31, 2009)
Note:Standard Deviation is calculated on annualised basis using 1 year history of monthly returns, source: MFI Explorer
An open-ended Fund of Funds scheme with the objective to provide income and capital appreciation along with diversification by investing in a basket of debt and equity Mutual Fund schemes in line with the risk profile of the investors.
Past performance may or may not be sustained in future. Returns are in % and absolute returns for period less than 1 year & CAGR for period 1 year or more.
Birla Sun Life AAF Aggressive Plan - Growth S & P CNX Nifty
Investment Performance - Aggressive Plan
Past performance may or may not be sustained in future. Returns are in % and absolute returns for period less than 1 year & CAGR for period 1 year or more.
Birla Sun Life AAF Conservative Plan - Growth Crisil MIP Blended Index
Investment Performance - Conservative Plan
Past performance may or may not be sustained in future. Returns are in % and absolute returns for period less than 1 year & CAGR for period 1 year or more.
Birla Sun Life AAF Moderate Plan - Growth Crisil Balanced Fund Index
Investment Performance - Moderate Plan
% R
etur
ns
% R
etur
ns
% R
etur
ns
Mutual Fund Units 96.86Birla Sun Life Dynamic Bond Fund - Growth 23.55
Birla Sun Life Index Fund - Growth 20.60
Birla Sun Life Midcap Fund - Growth 19.78
Birla Sun Life Advantage Fund - Growth 10.90
Birla Sun Life MNC Fund - Growth 7.08
Birla Sun Life India Opportunities Fund - Growth 7.00
Birla Sun Life Income Fund - Growth 4.17
Birla Sun Life Short Term Fund - Growth 3.78
Cash & Cash Equivalents 3.13
Net receivables / payables 0.01
Total Net Assets 100.00
Portfolio & Asset Allocation - Moderate PlanPortfolio & Asset Allocation - Aggressive Plan
Issuer % to Net Assets Issuer % to Net Assets
Mutual Fund Units 97.33Birla Sun Life Midcap Fund - Growth 17.93
Birla Sun Life Advantage Fund - Growth 16.73
Birla Sun Life Index Fund - Growth 15.93
Birla Sun Life MNC Fund - Growth 15.63
Birla Sun Life India Opportunities Fund - Growth 15.38
Birla Sun Life Dynamic Bond Fund - Growth 7.38
Birla Sun Life Income Fund - Growth 4.41
Birla Sun Life Short Term Fund - Growth 3.17
Birla Sun Life Gilt Plus Inv - Growth 0.76
Cash & Cash Equivalents 3.75
Net receivables / payables -1.07
Total Net Assets 100.00
Portfolio & Asset Allocation - Conservative Plan
Issuer % to Net Assets
Mutual Fund Units 92.82Birla Sun Life Short Term Fund - Growth 29.18
Birla Sun Life Dynamic Bond Fund - Growth 26.45
Birla Sun Life Index Fund - Growth 7.96
Birla Sun Life Income Fund - Growth 7.60
Birla Sun Life MNC Fund - Growth 6.47
Birla Sun Life India Opportunities Fund - Growth 6.31
Birla Sun Life Advantage Fund - Growth 5.03
Birla Sun Life Midcap Fund - Growth 3.81
Cash & Cash Equivalents 6.65
Net receivables / payables 0.53
Total Net Assets 100.00
(Past performance is no guarantee of future results.) for ranking methodology please refer page 49
««««#Value Research Rating
Equity Diversified(147 Schemes),for 3 & 5 years periods ended 31-Jul-09
Birla Sun Life AAF - Aggressive
Winner of&Best Fund - 3 yrs performance Lipper Awards India 2009
Mixed Asset INR Balanced, (7 schemes) 3 Yrs Performance (2005-2008)Birla Sun Life Asset Allocation Fund - Growth
9
23.67
16.62
22.80
19.82
6.46
13.43
22.79
19.01
0
5
10
15
20
25
1 Year 3 Years 5 Years Since Inception
19.37
15.13
19.04
16.69
9.86
11.93
16.31
14.00
0
2
4
6
8
10
12
14
16
18
20
1 Year 3 Years 5 Years Since Inception
14.00
11.7412.47
11.6611.39
8.41 8.417.46
0
2
4
6
8
10
12
14
16
1 Year 3 Years 5 Years Since Inception
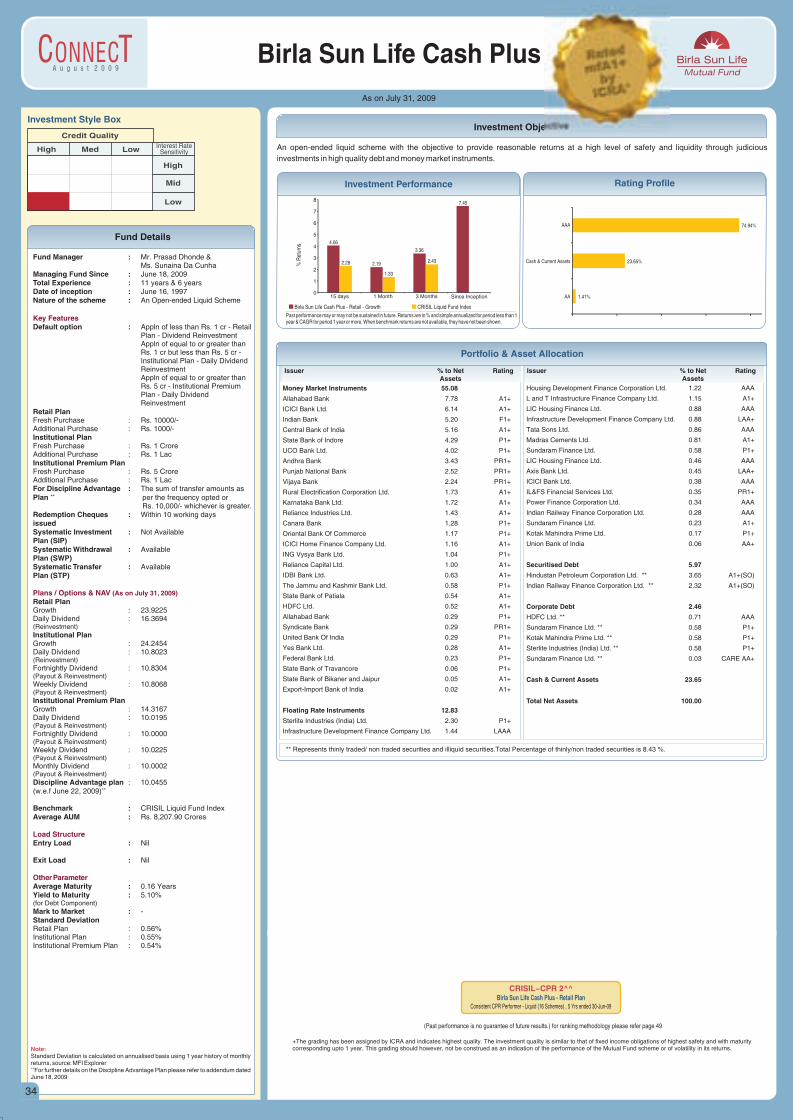
A u g u s t 2 0 0 9
Fund Details
Investment Objective
As on July 31, 2009
34
Birla Sun Life Cash Plus
Investment Style Box
Low Interest RateSensitivity
High
Mid
Low
Credit Quality
High Med
Fund Manager :Ms. Sunaina Da Cunha
Managing Fund Since : June 18, 2009Total Experience : 11 years & 6 yearsDate of inception : June 16, 1997Nature of the scheme : An Open-ended Liquid Scheme
Default option : Appln of less than Rs. 1 cr - Retail Plan - Dividend ReinvestmentAppln of equal to or greater than Rs. 1 cr but less than Rs. 5 cr - Institutional Plan - Daily Dividend ReinvestmentAppln of equal to or greater than Rs. 5 cr - Institutional Premium Plan - Daily Dividend Reinvestment
Retail PlanFresh Purchase : Rs. 10000/-Additional Purchase : Rs. 1000/-Institutional PlanFresh Purchase : Rs. 1 CroreAdditional Purchase : Rs. 1 LacInstitutional Premium PlanFresh Purchase : Rs. 5 CroreAdditional Purchase : Rs. 1 LacFor Discipline Advantage : The sum of transfer amounts as
++Plan per the frequency opted or Rs. 10,000/- whichever is greater.
Redemption Cheques : Within 10 working days issuedSystematic Investment : Not Available Plan (SIP)Systematic Withdrawal : Available Plan (SWP)Systematic Transfer : AvailablePlan (STP)
Retail PlanGrowth : 23.9225Daily Dividend : 16.3694(Reinvestment)
Institutional PlanGrowth : 24.2454Daily Dividend : 10.8023(Reinvestment)Fortnightly Dividend : 10.8304(Payout & Reinvestment)Weekly Dividend : 10.8068(Payout & Reinvestment)
Institutional Premium PlanGrowth : 14.3167Daily Dividend : 10.0195(Payout & Reinvestment)Fortnightly Dividend : 10.0000(Payout & Reinvestment)Weekly Dividend : 10.0225(Payout & Reinvestment)Monthly Dividend : 10.0002(Payout & Reinvestment)
Discipline Advantage plan : 10.0455++
(w.e.f June 22, 2009)
Benchmark : CRISIL Liquid Fund IndexAverage AUM : Rs. 8,207.90 Crores
Entry Load : Nil
Exit Load : Nil
Average Maturity : 0.16 YearsYield to Maturity : 5.10%(for Debt Component)
Mark to Market : -Standard DeviationRetail Plan : 0.56%Institutional Plan : 0.55%Institutional Premium Plan : 0.54%
Mr. Prasad Dhonde &
Key Features
Plans / Options & NAV
Load Structure
Other Parameter
(As on July 31, 2009)
Note:Standard Deviation is calculated on annualised basis using 1 year history of monthly returns, source: MFI Explorer++
For further details on the Discipline Advantage Plan please refer to addendum dated June 18, 2009
An open-ended liquid scheme with the objective to provide reasonable returns at a high level of safety and liquidity through judicious
investments in high quality debt and money market instruments.
Portfolio & Asset Allocation
Issuer % to Net RatingAssets
Issuer % to Net RatingAssets
Money Market Instruments 55.08
Allahabad Bank 7.78 A1+
ICICI Bank Ltd. 6.14 A1+
Indian Bank 5.20 F1+
Central Bank of India 5.16 A1+
State Bank of Indore 4.29 P1+
UCO Bank Ltd. 4.02 P1+
Andhra Bank 3.43 PR1+
Punjab National Bank 2.52 PR1+
Vijaya Bank 2.24 PR1+
Rural Electrification Corporation Ltd. 1.73 A1+
Karnataka Bank Ltd. 1.72 A1+
Reliance Industries Ltd. 1.43 A1+
Canara Bank 1.28 P1+
Oriental Bank Of Commerce 1.17 P1+
ICICI Home Finance Company Ltd. 1.16 A1+
ING Vysya Bank Ltd. 1.04 P1+
Reliance Capital Ltd. 1.00 A1+
IDBI Bank Ltd. 0.63 A1+
The Jammu and Kashmir Bank Ltd. 0.58 P1+
State Bank of Patiala 0.54 A1+
HDFC Ltd. 0.52 A1+
Allahabad Bank 0.29 P1+
Syndicate Bank 0.29 PR1+
United Bank Of India 0.29 P1+
Yes Bank Ltd. 0.28 A1+
Federal Bank Ltd. 0.23 P1+
State Bank of Travancore 0.06 P1+
State Bank of Bikaner and Jaipur 0.05 A1+
Export-Import Bank of India 0.02 A1+
Floating Rate Instruments 12.83
Sterlite Industries (India) Ltd. 2.30 P1+
Infrastructure Development Finance Company Ltd. 1.44 LAAA
Housing Development Finance Corporation Ltd. 1.22 AAA
L and T Infrastructure Finance Company Ltd. 1.15 A1+
LIC Housing Finance Ltd. 0.88 AAA
Infrastructure Development Finance Company Ltd. 0.88 LAA+
Tata Sons Ltd. 0.86 AAA
Madras Cements Ltd. 0.81 A1+
Sundaram Finance Ltd. 0.58 P1+
LIC Housing Finance Ltd. 0.46 AAA
Axis Bank Ltd. 0.45 LAA+
ICICI Bank Ltd. 0.38 AAA
IL&FS Financial Services Ltd. 0.35 PR1+
Power Finance Corporation Ltd. 0.34 AAA
Indian Railway Finance Corporation Ltd. 0.28 AAA
Sundaram Finance Ltd. 0.23 A1+
Kotak Mahindra Prime Ltd. 0.17 P1+
Union Bank of India 0.06 AA+
Securitised Debt 5.97
Hindustan Petroleum Corporation Ltd. ** 3.65 A1+(SO)
Indian Railway Finance Corporation Ltd. ** 2.32 A1+(SO)
Corporate Debt 2.46
HDFC Ltd. ** 0.71 AAA
Sundaram Finance Ltd. ** 0.58 P1+
Kotak Mahindra Prime Ltd. ** 0.58 P1+
Sterlite Industries (India) Ltd. ** 0.58 P1+
Sundaram Finance Ltd. ** 0.03 CARE AA+
Cash & Current Assets 23.65
Total Net Assets 100.00
** Represents thinly traded/ non traded securities and illiquid securities.Total Percentage of thinly/non traded securities is 8.43 %.
(Past performance is no guarantee of future results.) for ranking methodology please refer page 49
CRISIL~CPR 2^^Birla Sun Life Cash Plus - Retail Plan
Consistent CPR Performer - Liquid (16 Schemes) , 5 Yrs ended 30-Jun-09
+The grading has been assigned by ICRA and indicates highest quality. The investment quality is similar to that of fixed income obligations of highest safety and with maturity corresponding upto 1 year. This grading should however, not be construed as an indication of the performance of the Mutual Fund scheme or of volatility in its returns.
Rating ProfileInvestment Performance
Past performance may or may not be sustained in future. Returns are in % and simple annualized for period less than 1 year & CAGR for period 1 year or more. When benchmark returns are not available, they have not been shown.
% R
etur
ns
Birla Sun Life Cash Plus - Retail - Growth CRISIL Liquid Fund Index
1.41%
23.65%
74.94%
AA
Cash & Current Assets
AAA
4.06
2.19
3.36
7.45
2.28
1.33
2.43
0
1
2
3
4
5
6
7
8
15 days 1 Month 3 Months Since Inception
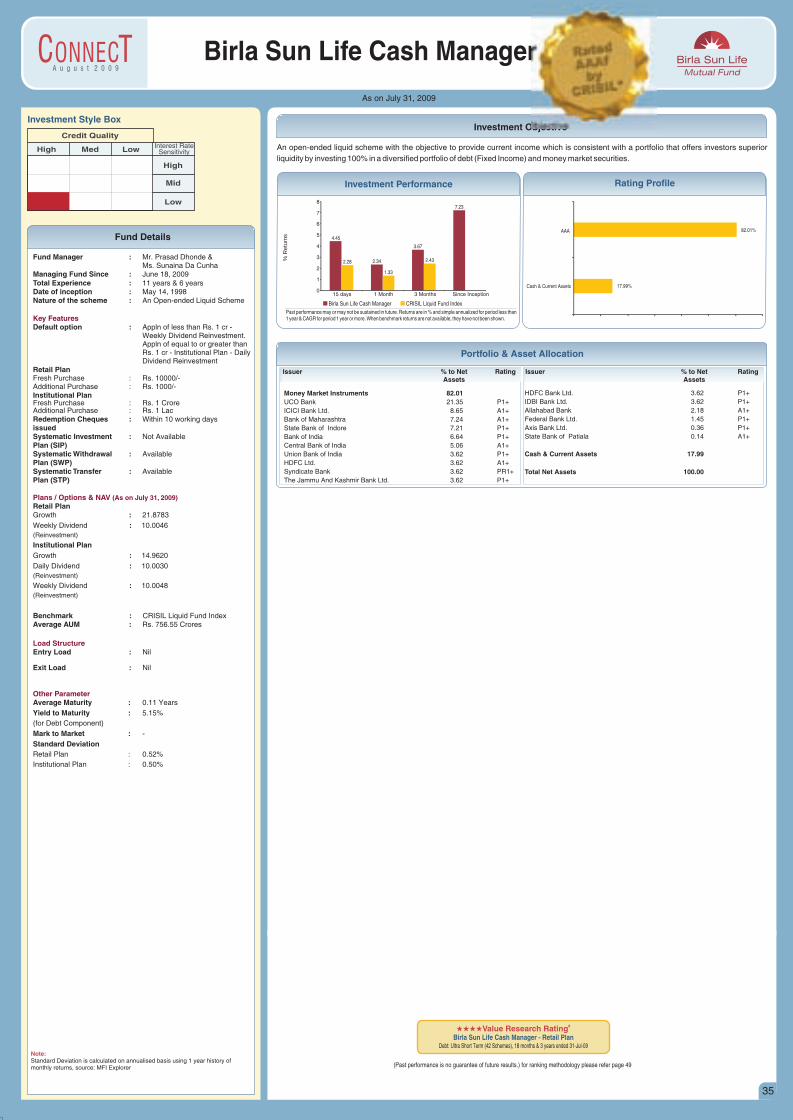
A u g u s t 2 0 0 9
Fund Details
35
Investment Objective
As on July 31, 2009
Birla Sun Life Cash Manager
Investment Style Box
Low Interest RateSensitivity
High
Mid
Low
Credit Quality
High Med
Fund Manager :Ms. Sunaina Da Cunha
Managing Fund Since : June 18, 2009Total Experience : 11 years & 6 yearsDate of inception : May 14, 1998Nature of the scheme : An Open-ended Liquid Scheme
Default option : Appln of less than Rs. 1 cr - Weekly Dividend Reinvestment.Appln of equal to or greater than Rs. 1 cr - Institutional Plan - Daily Dividend Reinvestment
Retail PlanFresh Purchase : Rs. 10000/-Additional Purchase : Rs. 1000/-Institutional PlanFresh Purchase : Rs. 1 CroreAdditional Purchase : Rs. 1 LacRedemption Cheques : Within 10 working days issuedSystematic Investment : Not Available Plan (SIP)Systematic Withdrawal : Available Plan (SWP)Systematic Transfer : AvailablePlan (STP)
Retail PlanGrowth : 21.8783
Weekly Dividend : 10.0046
(Reinvestment)
Institutional PlanGrowth : 14.9620
Daily Dividend : 10.0030
(Reinvestment)
Weekly Dividend : 10.0048
(Reinvestment)
Benchmark : CRISIL Liquid Fund IndexAverage AUM : Rs. 756.55 Crores
Entry Load : Nil
Exit Load : Nil
Average Maturity : 0.11 Years
Yield to Maturity : 5.15%
(for Debt Component)
Mark to Market : -
Standard Deviation Retail Plan : 0.52%
Institutional Plan : 0.50%
Mr. Prasad Dhonde &
Key Features
Plans / Options & NAV
Load Structure
Other Parameter
(As on July 31, 2009)
Note:Standard Deviation is calculated on annualised basis using 1 year history of monthly returns, source: MFI Explorer
An open-ended liquid scheme with the objective to provide current income which is consistent with a portfolio that offers investors superior
liquidity by investing 100% in a diversified portfolio of debt (Fixed Income) and money market securities.
Rating Profile
17.99%
82.01%
Cash & Current Assets
AAA
Past performance may or may not be sustained in future. Returns are in % and simple annualized for period less than 1 year & CAGR for period 1 year or more. When benchmark returns are not available, they have not been shown.
Birla Sun Life Cash Manager CRISIL Liquid Fund Index
Investment Performance
% R
etu
rns
Portfolio & Asset Allocation
Issuer % to Net RatingAssets
Issuer % to Net RatingAssets
Money Market Instruments 82.01UCO Bank 21.35 P1+
ICICI Bank Ltd. 8.65 A1+
Bank of Maharashtra 7.24 A1+
State Bank of Indore 7.21 P1+
Bank of India 6.64 P1+
Central Bank of India 5.06 A1+
Union Bank of India 3.62 P1+
HDFC Ltd. 3.62 A1+
Syndicate Bank 3.62 PR1+
The Jammu And Kashmir Bank Ltd. 3.62 P1+
HDFC Bank Ltd. 3.62 P1+
IDBI Bank Ltd. 3.62 P1+
Allahabad Bank 2.18 A1+
Federal Bank Ltd. 1.45 P1+
Axis Bank Ltd. 0.36 P1+
State Bank of Patiala 0.14 A1+
Cash & Current Assets 17.99
Total Net Assets 100.00
#iiiValue Research Ratingi
Birla Sun Life Cash Manager - Retail PlanDebt: Ultra Short Term (42 Schemes), 18 months & 3 years ended 31-Jul-09
(Past performance is no guarantee of future results.) for ranking methodology please refer page 49
4.45
2.34
3.67
7.23
2.28
1.33
2.43
0
1
2
3
4
5
6
7
8
15 days 1 Month 3 Months Since Inception
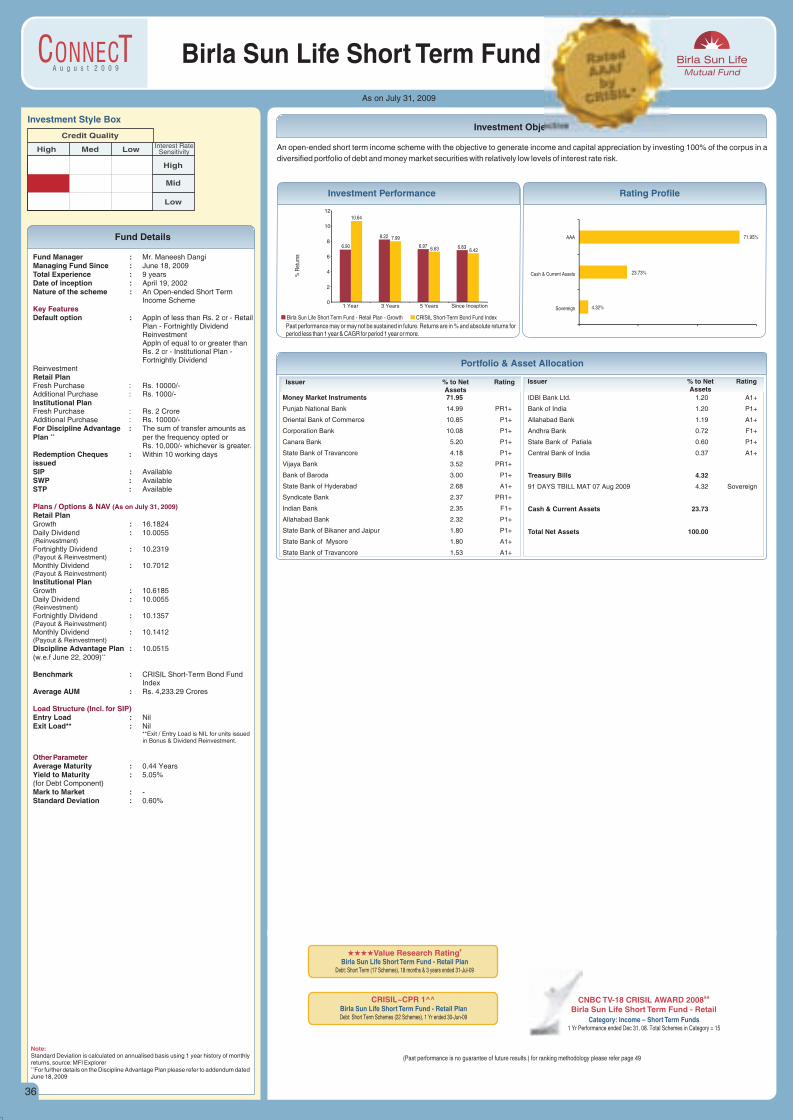
A u g u s t 2 0 0 9
Fund Details
Investment Objective
As on July 31, 2009
Birla Sun Life Short Term Fund
Investment Style Box
Low Interest RateSensitivity
High
Mid
Low
Credit Quality
High Med
Fund Manager :Managing Fund Since : June 18, 2009Total Experience : 9 yearsDate of inception : April 19, 2002Nature of the scheme : An Open-ended Short Term
Income Scheme
Default option : Appln of less than Rs. 2 cr - Retail Plan - Fortnightly Dividend ReinvestmentAppln of equal to or greater than Rs. 2 cr - Institutional Plan - Fortnightly Dividend
ReinvestmentRetail PlanFresh Purchase : Rs. 10000/-Additional Purchase : Rs. 1000/-Institutional PlanFresh Purchase : Rs. 2 CroreAdditional Purchase : Rs. 10000/-For Discipline Advantage : The sum of transfer amounts as
++Plan per the frequency opted or Rs. 10,000/- whichever is greater.
Redemption Cheques : Within 10 working days issuedSIP : AvailableSWP : Available STP : Available
Retail PlanGrowth : 16.1824Daily Dividend : 10.0055(Reinvestment)
Fortnightly Dividend : 10.2319(Payout & Reinvestment)
Monthly Dividend : 10.7012(Payout & Reinvestment)
Institutional PlanGrowth : 10.6185Daily Dividend : 10.0055(Reinvestment)
Fortnightly Dividend : 10.1357(Payout & Reinvestment)
Monthly Dividend : 10.1412(Payout & Reinvestment)
Discipline Advantage Plan : 10.0515++
(w.e.f June 22, 2009)
Benchmark : CRISIL Short-Term Bond Fund Index
Average AUM : Rs. 4,233.29 Crores
Entry Load : NilExit Load** : Nil
**Exit / Entry Load is NIL for units issued in Bonus & Dividend Reinvestment.
Average Maturity : 0.44 YearsYield to Maturity : 5.05%(for Debt Component)Mark to Market : -Standard Deviation : 0.60%
Mr. Maneesh Dangi
Key Features
Plans / Options & NAV
Load Structure (Incl. for SIP)
Other Parameter
(As on July 31, 2009)
Past performance may or may not be sustained in future. Returns are in % and absolute returns for period less than 1 year & CAGR for period 1 year or more.
% R
etur
ns
Birla Sun Life Short Term Fund - Retail Plan - Growth CRISIL Short-Term Bond Fund Index
Investment Performance Rating Profile
An open-ended short term income scheme with the objective to generate income and capital appreciation by investing 100% of the corpus in a
diversified portfolio of debt and money market securities with relatively low levels of interest rate risk.
Note:Standard Deviation is calculated on annualised basis using 1 year history of monthly returns, source: MFI Explorer++
For further details on the Discipline Advantage Plan please refer to addendum dated June 18, 2009
(Past performance is no guarantee of future results.) for ranking methodology please refer page 49
Birla Sun Life Short Term Fund - Retail PlanDebt: Short Term Schemes (22 Schemes), 1 Yr ended 30-Jun-09
CRISIL~CPR 1^^ &&CNBC TV-18 CRISIL AWARD 2008Birla Sun Life Short Term Fund - Retail
1 Yr Performance ended Dec 31, 08. Total Schemes in Category = 15Category: Income – Short Term Funds
Portfolio & Asset Allocation
Issuer % to Net RatingAssets
Issuer % to Net RatingAssets
Money Market Instruments 71.95
Punjab National Bank 14.99 PR1+
Oriental Bank of Commerce 10.85 P1+
Corporation Bank 10.08 P1+
Canara Bank 5.20 P1+
State Bank of Travancore 4.18 P1+
Vijaya Bank 3.52 PR1+
Bank of Baroda 3.00 P1+
State Bank of Hyderabad 2.68 A1+
Syndicate Bank 2.37 PR1+
Indian Bank 2.35 F1+
Allahabad Bank 2.32 P1+
State Bank of Bikaner and Jaipur 1.80 P1+
State Bank of Mysore 1.80 A1+
State Bank of Travancore 1.53 A1+
IDBI Bank Ltd. 1.20 A1+
Bank of India 1.20 P1+
Allahabad Bank 1.19 A1+
Andhra Bank 0.72 F1+
State Bank of Patiala 0.60 P1+
Central Bank of India 0.37 A1+
Treasury Bills 4.32
91 DAYS TBILL MAT 07 Aug 2009 4.32 Sovereign
Cash & Current Assets 23.73
Total Net Assets 100.00
4.32%
23.73%
71.95%
Sovereign
Cash & Current Assets
AAA
36
#iiValue Research Ratingii
Birla Sun Life Short Term Fund - Retail PlanDebt: Short Term (17 Schemes), 18 months & 3 years ended 31-Jul-09
6.90
8.22
6.97 6.83
10.64
7.99
6.63 6.42
0
2
4
6
8
10
12
1 Year 3 Years 5 Years Since Inception
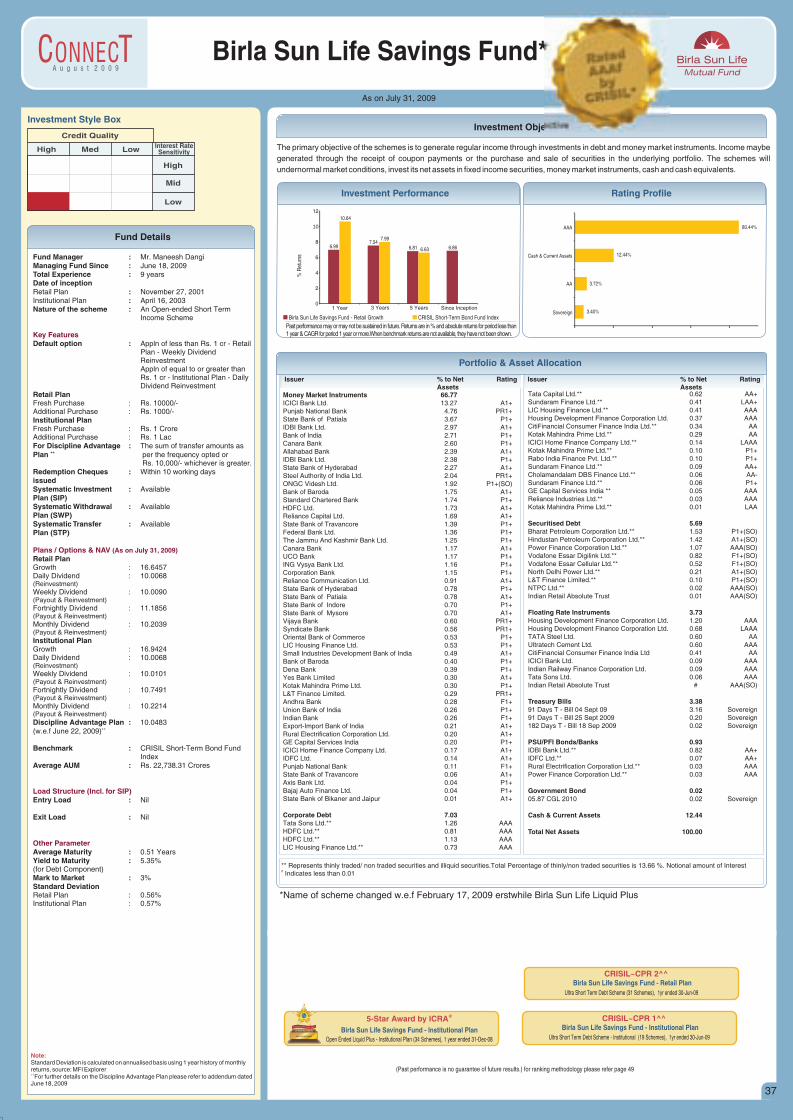
A u g u s t 2 0 0 9
Fund Details
Investment Objective
Birla Sun Life Savings Fund*
As on July 31, 2009
Investment Style Box
Low Interest RateSensitivity
High
Mid
Low
Credit Quality
High Med
Fund Manager :Managing Fund Since : June 18, 2009Total Experience : 9 yearsDate of inceptionRetail Plan : November 27, 2001Institutional Plan : April 16, 2003Nature of the scheme : An Open-ended Short Term
Income Scheme
Default option : Appln of less than Rs. 1 cr - Retail Plan - Weekly Dividend ReinvestmentAppln of equal to or greater than Rs. 1 cr - Institutional Plan - Daily Dividend Reinvestment
Retail PlanFresh Purchase : Rs. 10000/-Additional Purchase : Rs. 1000/-Institutional PlanFresh Purchase : Rs. 1 CroreAdditional Purchase : Rs. 1 LacFor Discipline Advantage : The sum of transfer amounts as
++Plan per the frequency opted or Rs. 10,000/- whichever is greater.
Redemption Cheques : Within 10 working days issuedSystematic Investment : Available Plan (SIP)Systematic Withdrawal : Available Plan (SWP)Systematic Transfer : AvailablePlan (STP)
Retail PlanGrowth : 16.6457Daily Dividend : 10.0068(Reinvestment)Weekly Dividend : 10.0090(Payout & Reinvestment)Fortnightly Dividend : 11.1856(Payout & Reinvestment)Monthly Dividend : 10.2039(Payout & Reinvestment)
Institutional PlanGrowth : 16.9424Daily Dividend : 10.0068(Reinvestment)Weekly Dividend : 10.0101(Payout & Reinvestment)Fortnightly Dividend : 10.7491(Payout & Reinvestment)Monthly Dividend : 10.2214(Payout & Reinvestment)
Discipline Advantage Plan : 10.0483++
(w.e.f June 22, 2009)
Benchmark : CRISIL Short-Term Bond Fund Index
Average AUM : Rs. 22,738.31 Crores
Entry Load : Nil
Exit Load : Nil
Average Maturity : 0.51 YearsYield to Maturity : 5.35%(for Debt Component)Mark to Market : 3%Standard DeviationRetail Plan : 0.56%Institutional Plan : 0.57%
Mr. Maneesh Dangi
Key Features
Plans / Options & NAV
Load Structure (Incl. for SIP)
Other Parameter
(As on July 31, 2009)
Note:Standard Deviation is calculated on annualised basis using 1 year history of monthly returns, source: MFI Explorer++
For further details on the Discipline Advantage Plan please refer to addendum dated June 18, 2009
Birla Sun Life Savings Fund - Institutional Plan Ultra Short Term Debt Scheme - Institutional (19 Schemes), 1yr ended 30-Jun-09
CRISIL~CPR 1^^
(Past performance is no guarantee of future results.) for ranking methodology please refer page 49
5-Star Award by @ICRABirla Sun Life Savings Fund - Institutional Plan
Open Ended Liquid Plus - Institutional Plan (34 Schemes), 1 year ended 31-Dec-08
Past performance may or may not be sustained in future. Returns are in % and absolute returns for period less than 1 year & CAGR for period 1 year or more.When benchmark returns are not available, they have not been shown.
% R
etur
ns
Birla Sun Life Savings Fund - Retail Growth CRISIL Short-Term Bond Fund Index
Investment Performance Rating Profile
The primary objective of the schemes is to generate regular income through investments in debt and money market instruments. Income maybe
generated through the receipt of coupon payments or the purchase and sale of securities in the underlying portfolio. The schemes will
undernormal market conditions, invest its net assets in fixed income securities, money market instruments, cash and cash equivalents.
Portfolio & Asset Allocation
Issuer % to Net RatingAssets
Issuer % to Net RatingAssets
Money Market Instruments 66.77ICICI Bank Ltd. 13.27 A1+Punjab National Bank 4.76 PR1+State Bank of Patiala 3.67 P1+IDBI Bank Ltd. 2.97 A1+Bank of India 2.71 P1+Canara Bank 2.60 P1+Allahabad Bank 2.39 A1+IDBI Bank Ltd. 2.38 P1+State Bank of Hyderabad 2.27 A1+Steel Authority of India Ltd. 2.04 PR1+ONGC Videsh Ltd. 1.92 P1+(SO)Bank of Baroda 1.75 A1+Standard Chartered Bank 1.74 P1+HDFC Ltd. 1.73 A1+Reliance Capital Ltd. 1.69 A1+State Bank of Travancore 1.39 P1+Federal Bank Ltd. 1.36 P1+The Jammu And Kashmir Bank Ltd. 1.25 P1+Canara Bank 1.17 A1+UCO Bank 1.17 P1+ING Vysya Bank Ltd. 1.16 P1+Corporation Bank 1.15 P1+Reliance Communication Ltd. 0.91 A1+State Bank of Hyderabad 0.78 P1+State Bank of Patiala 0.78 A1+State Bank of Indore 0.70 P1+State Bank of Mysore 0.70 A1+Vijaya Bank 0.60 PR1+Syndicate Bank 0.56 PR1+Oriental Bank of Commerce 0.53 P1+LIC Housing Finance Ltd. 0.53 P1+Small Industries Development Bank of India 0.49 A1+Bank of Baroda 0.40 P1+Dena Bank 0.39 P1+Yes Bank Limited 0.30 A1+Kotak Mahindra Prime Ltd. 0.30 P1+L&T Finance Limited. 0.29 PR1+Andhra Bank 0.28 F1+Union Bank of India 0.26 P1+Indian Bank 0.26 F1+Export-Import Bank of India 0.21 A1+Rural Electrification Corporation Ltd. 0.20 A1+GE Capital Services India 0.20 P1+ICICI Home Finance Company Ltd. 0.17 A1+IDFC Ltd. 0.14 A1+Punjab National Bank 0.11 F1+State Bank of Travancore 0.06 A1+Axis Bank Ltd. 0.04 P1+Bajaj Auto Finance Ltd. 0.04 P1+State Bank of Bikaner and Jaipur 0.01 A1+
Corporate Debt 7.03Tata Sons Ltd.** 1.26 AAAHDFC Ltd.** 0.81 AAAHDFC Ltd.** 1.13 AAALIC Housing Finance Ltd.** 0.73 AAA
Tata Capital Ltd.** 0.62 AA+Sundaram Finance Ltd.** 0.41 LAA+LIC Housing Finance Ltd.** 0.41 AAAHousing Development Finance Corporation Ltd. 0.37 AAACitiFinancial Consumer Finance India Ltd.** 0.34 AAKotak Mahindra Prime Ltd.** 0.29 AAICICI Home Finance Company Ltd.** 0.14 LAAAKotak Mahindra Prime Ltd.** 0.10 P1+Rabo India Finance Pvt. Ltd.** 0.10 P1+Sundaram Finance Ltd.** 0.09 AA+Cholamandalam DBS Finance Ltd.** 0.06 AA-Sundaram Finance Ltd.** 0.06 P1+GE Capital Services India ** 0.05 AAAReliance Industries Ltd.** 0.03 AAAKotak Mahindra Prime Ltd.** 0.01 LAA
Securitised Debt 5.69Bharat Petroleum Corporation Ltd.** 1.53 P1+(SO)Hindustan Petroleum Corporation Ltd.** 1.42 A1+(SO)Power Finance Corporation Ltd.** 1.07 AAA(SO)Vodafone Essar Digilink Ltd.** 0.82 F1+(SO)Vodafone Essar Cellular Ltd.** 0.52 F1+(SO)North Delhi Power Ltd.** 0.21 A1+(SO)L&T Finance Limited.** 0.10 P1+(SO)NTPC Ltd.** 0.02 AAA(SO)Indian Retail Absolute Trust 0.01 AAA(SO)
Floating Rate Instruments 3.73Housing Development Finance Corporation Ltd. 1.20 AAAHousing Development Finance Corporation Ltd. 0.68 LAAATATA Steel Ltd. 0.60 AAUltratech Cement Ltd. 0.60 AAACitiFinancial Consumer Finance India Ltd 0.41 AAICICI Bank Ltd. 0.09 AAAIndian Railway Finance Corporation Ltd. 0.09 AAATata Sons Ltd. 0.06 AAAIndian Retail Absolute Trust # AAA(SO)
Treasury Bills 3.3891 Days T - Bill 04 Sept 09 3.16 Sovereign91 Days T - Bill 25 Sept 2009 0.20 Sovereign182 Days T - Bill 18 Sep 2009 0.02 Sovereign
PSU/PFI Bonds/Banks 0.93IDBI Bank Ltd.** 0.82 AA+IDFC Ltd.** 0.07 AA+Rural Electrification Corporation Ltd.** 0.03 AAAPower Finance Corporation Ltd.** 0.03 AAA
Government Bond 0.0205.87 CGL 2010 0.02 Sovereign
Cash & Current Assets 12.44
Total Net Assets 100.00
** Represents thinly traded/ non traded securities and illiquid securities.Total Percentage of thinly/non traded securities is 13.66 %. Notional amount of Interest # Indicates less than 0.01
*Name of scheme changed w.e.f February 17, 2009 erstwhile Birla Sun Life Liquid Plus
37
3.40%
3.72%
12.44%
80.44%
Sovereign
AA
Cash & Current Assets
AAA
Birla Sun Life Savings Fund - Retail Plan Ultra Short Term Debt Scheme (31 Schemes), 1yr ended 30-Jun-09
CRISIL~CPR 2^^
6.997.54
6.81 6.86
10.64
7.99
6.63
0
2
4
6
8
10
12
1 Year 3 Years 5 Years Since Inception
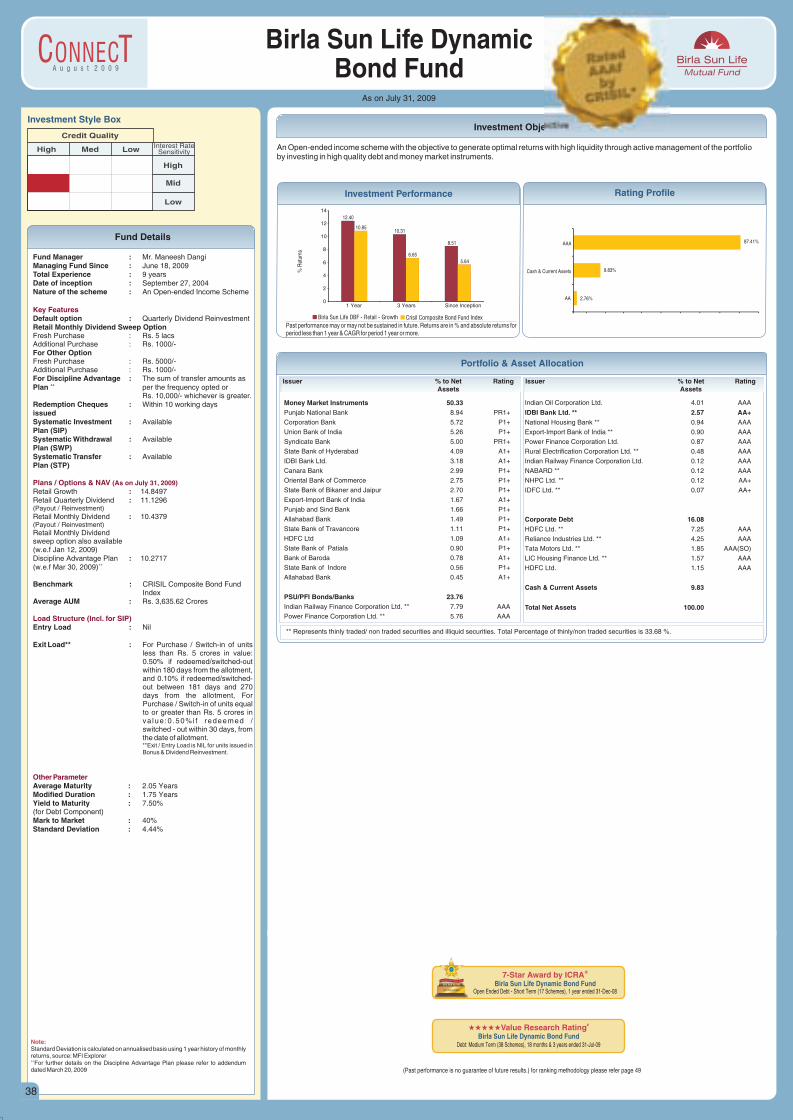
A u g u s t 2 0 0 9
Fund Details
Investment Objective
38
Birla Sun Life Dynamic Bond Fund
As on July 31, 2009
Investment Style Box
Low Interest RateSensitivity
High
Mid
Low
Credit Quality
High Med
Fund Manager :Managing Fund Since : June 18, 2009Total Experience : 9 yearsDate of inception : September 27, 2004Nature of the scheme : An Open-ended Income Scheme
Default option : Quarterly Dividend ReinvestmentRetail Monthly Dividend Sweep OptionFresh Purchase : Rs. 5 lacsAdditional Purchase : Rs. 1000/-For Other OptionFresh Purchase : Rs. 5000/- Additional Purchase : Rs. 1000/-For Discipline Advantage : The sum of transfer amounts as
++Plan per the frequency opted or Rs. 10,000/- whichever is greater.
Redemption Cheques : Within 10 working days issuedSystematic Investment : Available Plan (SIP)Systematic Withdrawal : Available Plan (SWP)Systematic Transfer : AvailablePlan (STP)
Retail Growth : 14.8497 Retail Quarterly Dividend : 11.1296 (Payout / Reinvestment)
Retail Monthly Dividend : 10.4379(Payout / Reinvestment)Retail Monthly Dividendsweep option also available (w.e.f Jan 12, 2009) Discipline Advantage Plan : 10.2717
++(w.e.f Mar 30, 2009)
Benchmark : CRISIL Composite Bond Fund Index
Average AUM : Rs. 3,635.62 Crores
Entry Load : Nil
Exit Load** : For Purchase / Switch-in of units less than Rs. 5 crores in value: 0.50% if redeemed/switched-out within 180 days from the allotment, and 0.10% if redeemed/switched-out between 181 days and 270 days from the allotment, For Purchase / Switch-in of units equal to or greater than Rs. 5 crores in va lue :0 .50%i f redeemed / switched - out within 30 days, from the date of allotment.**Exit / Entry Load is NIL for units issued in Bonus & Dividend Reinvestment.
Average Maturity : 2.05 YearsModified Duration : 1.75 YearsYield to Maturity : 7.50%(for Debt Component)Mark to Market : 40%Standard Deviation : 4.44%
Mr. Maneesh Dangi
Key Features
Plans / Options & NAV
Load Structure (Incl. for SIP)
Other Parameter
(As on July 31, 2009)
Note:Standard Deviation is calculated on annualised basis using 1 year history of monthly returns, source: MFI Explorer++For further details on the Discipline Advantage Plan please refer to addendum dated March 20, 2009 (Past performance is no guarantee of future results.) for ranking methodology please refer page 49
#iiiValue Research Ratingii
Birla Sun Life Dynamic Bond FundDebt: Medium Term (38 Schemes), 18 months & 3 years ended 31-Jul-09
7-Star Award by @ICRABirla Sun Life Dynamic Bond Fund
Open Ended Debt - Short Term (17 Schemes), 1 year ended 31-Dec-08
Portfolio & Asset Allocation
Issuer % to Net RatingAssets
Issuer % to Net RatingAssets
Money Market Instruments 50.33Punjab National Bank 8.94 PR1+
Corporation Bank 5.72 P1+
Union Bank of India 5.26 P1+
Syndicate Bank 5.00 PR1+
State Bank of Hyderabad 4.09 A1+
IDBI Bank Ltd. 3.18 A1+
Canara Bank 2.99 P1+
Oriental Bank of Commerce 2.75 P1+
State Bank of Bikaner and Jaipur 2.70 P1+
Export-Import Bank of India 1.67 A1+
Punjab and Sind Bank 1.66 P1+
Allahabad Bank 1.49 P1+
State Bank of Travancore 1.11 P1+
HDFC Ltd 1.09 A1+
State Bank of Patiala 0.90 P1+
Bank of Baroda 0.78 A1+
State Bank of Indore 0.56 P1+
Allahabad Bank 0.45 A1+
PSU/PFI Bonds/Banks 23.76Indian Railway Finance Corporation Ltd. ** 7.79 AAA
Power Finance Corporation Ltd. ** 5.76 AAA
Indian Oil Corporation Ltd. 4.01 AAA
IDBI Bank Ltd. ** 2.57 AA+National Housing Bank ** 0.94 AAA
Export-Import Bank of India ** 0.90 AAA
Power Finance Corporation Ltd. 0.87 AAA
Rural Electrification Corporation Ltd. ** 0.48 AAA
Indian Railway Finance Corporation Ltd. 0.12 AAA
NABARD ** 0.12 AAA
NHPC Ltd. ** 0.12 AA+
IDFC Ltd. ** 0.07 AA+
Corporate Debt 16.08HDFC Ltd. ** 7.25 AAA
Reliance Industries Ltd. ** 4.25 AAA
Tata Motors Ltd. ** 1.85 AAA(SO)
LIC Housing Finance Ltd. ** 1.57 AAA
HDFC Ltd. 1.15 AAA
Cash & Current Assets 9.83
Total Net Assets 100.00
** Represents thinly traded/ non traded securities and illiquid securities. Total Percentage of thinly/non traded securities is 33.68 %.
Past performance may or may not be sustained in future. Returns are in % and absolute returns for period less than 1 year & CAGR for period 1 year or more.
% R
etur
ns
Birla Sun Life DBF - Retail - Growth Crisil Composite Bond Fund Index
Investment Performance Rating Profile
2.76%
9.83%
87.41%
AA
Cash & Current Assets
AAA
An Open-ended income scheme with the objective to generate optimal returns with high liquidity through active management of the portfolioby investing in high quality debt and money market instruments.
12.40
10.31
8.51
10.85
6.65
5.64
0
2
4
6
8
10
12
14
1 Year 3 Years Since Inception
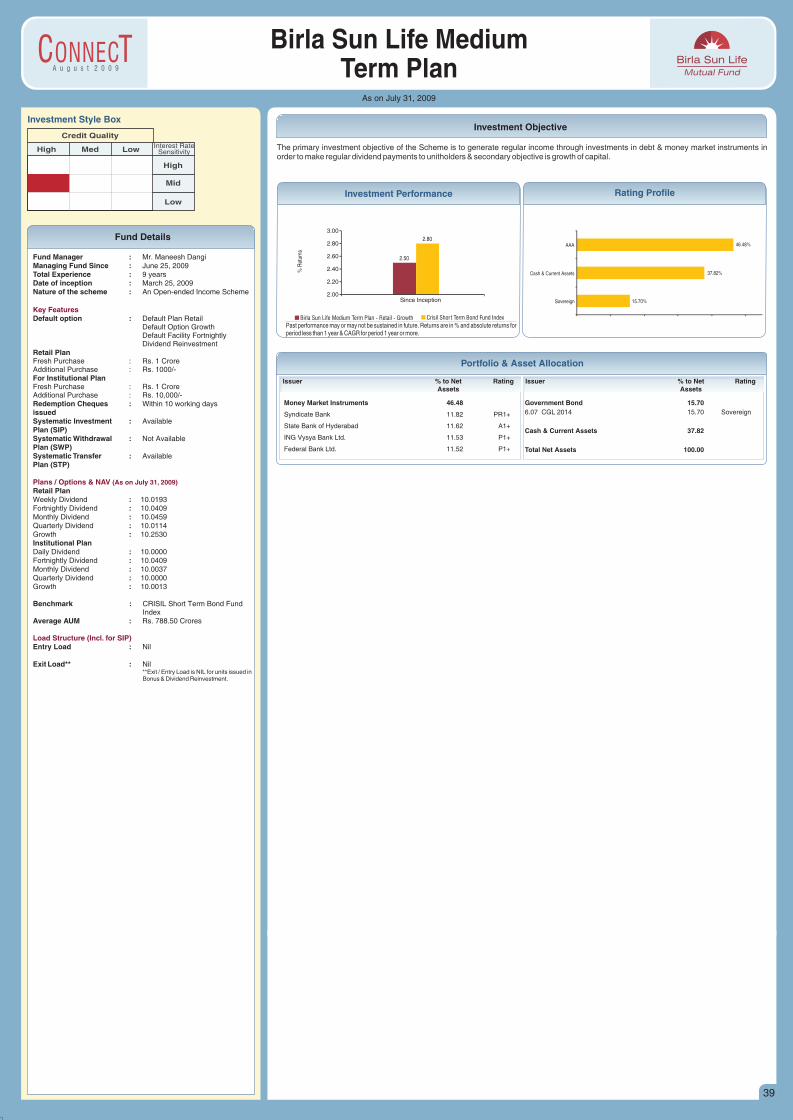
A u g u s t 2 0 0 9
Fund Details
Investment Objective
39
Birla Sun Life Medium Term Plan
As on July 31, 2009
Investment Style Box
Low Interest RateSensitivity
High
Mid
Low
Credit Quality
High Med
Fund Manager :Managing Fund Since : June 25, 2009Total Experience : 9 yearsDate of inception : March 25, 2009Nature of the scheme : An Open-ended Income Scheme
Default option : Default Plan RetailDefault Option GrowthDefault Facility FortnightlyDividend Reinvestment
Retail PlanFresh Purchase : Rs. 1 Crore Additional Purchase : Rs. 1000/-For Institutional PlanFresh Purchase : Rs. 1 Crore Additional Purchase : Rs. 10,000/-Redemption Cheques : Within 10 working days issuedSystematic Investment : Available Plan (SIP)Systematic Withdrawal : Not Available Plan (SWP)Systematic Transfer : AvailablePlan (STP)
Retail Plan Weekly Dividend : 10.0193Fortnightly Dividend : 10.0409Monthly Dividend : 10.0459Quarterly Dividend : 10.0114Growth : 10.2530Institutional PlanDaily Dividend : 10.0000Fortnightly Dividend : 10.0409Monthly Dividend : 10.0037Quarterly Dividend : 10.0000Growth : 10.0013
Benchmark : CRISIL Short Term Bond Fund Index
Average AUM : Rs. 788.50 Crores
Entry Load : Nil
Exit Load** : Nil**Exit / Entry Load is NIL for units issued in Bonus & Dividend Reinvestment.
Mr. Maneesh Dangi
Key Features
Plans / Options & NAV
Load Structure (Incl. for SIP)
(As on July 31, 2009)
Portfolio & Asset Allocation
Issuer % to Net RatingAssets
Issuer % to Net RatingAssets
Money Market Instruments 46.48
Syndicate Bank 11.82 PR1+
State Bank of Hyderabad 11.62 A1+
ING Vysya Bank Ltd. 11.53 P1+
Federal Bank Ltd. 11.52 P1+
Government Bond 15.706.07 CGL 2014 15.70 Sovereign
Cash & Current Assets 37.82
Total Net Assets 100.00
Past performance may or may not be sustained in future. Returns are in % and absolute returns for period less than 1 year & CAGR for period 1 year or more.
% R
etur
ns
Birla Sun Life Medium Term Plan - Retail - Growth Crisil Short Term Bond Fund Index
Investment Performance Rating Profile
The primary investment objective of the Scheme is to generate regular income through investments in debt & money market instruments in order to make regular dividend payments to unitholders & secondary objective is growth of capital.
15.70%
37.82%
46.48%
Sovereign
Cash & Current Assets
AAA
2.50
2.80
2.00
2.20
2.40
2.60
2.80
3.00
Since Inception
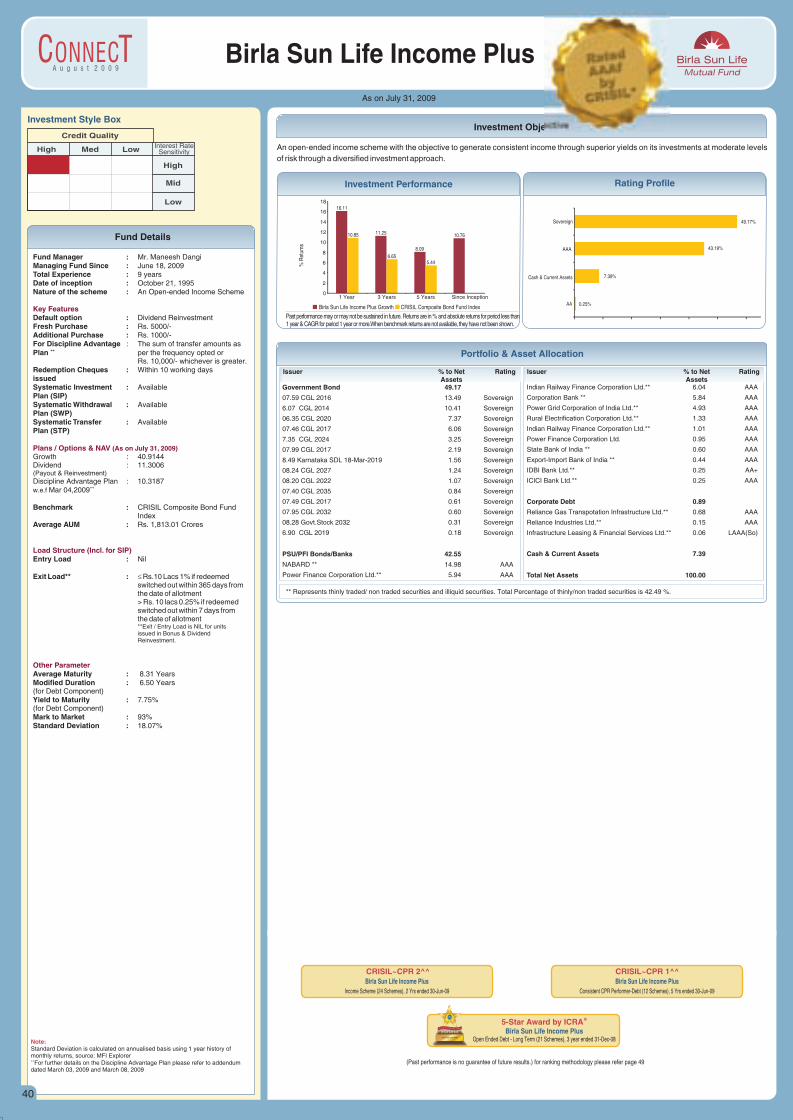
A u g u s t 2 0 0 9
Fund Details
40
Investment Objective
Birla Sun Life Income PlusAs on July 31, 2009
Investment Style Box
Low Interest RateSensitivity
High
Mid
Low
Credit Quality
High Med
Fund Manager : Mr. Managing Fund Since : June 18, 2009Total Experience : 9 yearsDate of inception : October 21, 1995Nature of the scheme : An Open-ended Income Scheme
Default option : Dividend ReinvestmentFresh Purchase : Rs. 5000/-Additional Purchase : Rs. 1000/-For Discipline Advantage : The sum of transfer amounts as
++Plan per the frequency opted or Rs. 10,000/- whichever is greater.
Redemption Cheques : Within 10 working days issuedSystematic Investment : Available Plan (SIP)Systematic Withdrawal : Available Plan (SWP)Systematic Transfer : Available Plan (STP)
Growth : 40.9144Dividend : 11.3006(Payout & Reinvestment)Discipline Advantage Plan : 10.3187
++w.e.f Mar 04,2009
Benchmark : CRISIL Composite Bond Fund Index
Average AUM : Rs. 1,813.01 Crores
Entry Load : Nil
Exit Load** : £ Rs.10 Lacs 1% if redeemedswitched out within 365 days fromthe date of allotment> Rs. 10 lacs 0.25% if redeemedswitched out within 7 days fromthe date of allotment**Exit / Entry Load is NIL for units issued in Bonus & DividendReinvestment.
Average Maturity : 8.31 YearsModified Duration : 6.50 Years(for Debt Component)Yield to Maturity : 7.75%(for Debt Component)Mark to Market : 93%Standard Deviation : 18.07%
Maneesh Dangi
Key Features
Plans / Options & NAV
Load Structure (Incl. for SIP)
Other Parameter
(As on July 31, 2009)
Note:Standard Deviation is calculated on annualised basis using 1 year history of monthly returns, source: MFI Explorer++
For further details on the Discipline Advantage Plan please refer to addendum dated March 03, 2009 and March 08, 2009
5-Star Award by @ICRABirla Sun Life Income Plus
Open Ended Debt - Long Term (21 Schemes), 3 year ended 31-Dec-08
CRISIL~CPR 2^^Birla Sun Life Income Plus
Income Scheme (24 Schemes), 2 Yrs ended 30-Jun-09
CRISIL~CPR 1^^Birla Sun Life Income Plus
Consistent CPR Performer-Debt (12 Schemes), 5 Yrs ended 30-Jun-09
(Past performance is no guarantee of future results.) for ranking methodology please refer page 49
An open-ended income scheme with the objective to generate consistent income through superior yields on its investments at moderate levels
of risk through a diversified investment approach.
Past performance may or may not be sustained in future. Returns are in % and absolute returns for period less than 1 year & CAGR for period 1 year or more.When benchmark returns are not available, they have not been shown.
% R
etur
ns
Birla Sun Life Income Plus Growth CRISIL Composite Bond Fund Index
Investment Performance Rating Profile
Portfolio & Asset Allocation
Issuer % to Net RatingAssets
Issuer % to Net RatingAssets
Government Bond 49.17
07.59 CGL 2016 13.49 Sovereign
6.07 CGL 2014 10.41 Sovereign
06.35 CGL 2020 7.37 Sovereign
07.46 CGL 2017 6.06 Sovereign
7.35 CGL 2024 3.25 Sovereign
07.99 CGL 2017 2.19 Sovereign
8.49 Karnataka SDL 18-Mar-2019 1.56 Sovereign
08.24 CGL 2027 1.24 Sovereign
08.20 CGL 2022 1.07 Sovereign
07.40 CGL 2035 0.84 Sovereign
07.49 CGL 2017 0.61 Sovereign
07.95 CGL 2032 0.60 Sovereign
08.28 Govt.Stock 2032 0.31 Sovereign
6.90 CGL 2019 0.18 Sovereign
PSU/PFI Bonds/Banks 42.55
NABARD ** 14.98 AAA
Power Finance Corporation Ltd.** 5.94 AAA
Indian Railway Finance Corporation Ltd.** 6.04 AAA
Corporation Bank ** 5.84 AAA
Power Grid Corporation of India Ltd.** 4.93 AAA
Rural Electrification Corporation Ltd.** 1.33 AAA
Indian Railway Finance Corporation Ltd.** 1.01 AAA
Power Finance Corporation Ltd. 0.95 AAA
State Bank of India ** 0.60 AAA
Export-Import Bank of India ** 0.44 AAA
IDBI Bank Ltd.** 0.25 AA+
ICICI Bank Ltd.** 0.25 AAA
Corporate Debt 0.89
Reliance Gas Transpotation Infrastructure Ltd.** 0.68 AAA
Reliance Industries Ltd.** 0.15 AAA
Infrastructure Leasing & Financial Services Ltd.** 0.06 LAAA(So)
Cash & Current Assets 7.39
Total Net Assets 100.00
** Represents thinly traded/ non traded securities and illiquid securities. Total Percentage of thinly/non traded securities is 42.49 %.
0.25%
7.39%
43.19%
49.17%
AA
Cash & Current Assets
Sovereign
AAA
16.11
11.25
8.09
10.7610.85
6.655.44
0
2
4
6
8
10
12
14
16
18
1 Year 3 Years 5 Years Since Inception
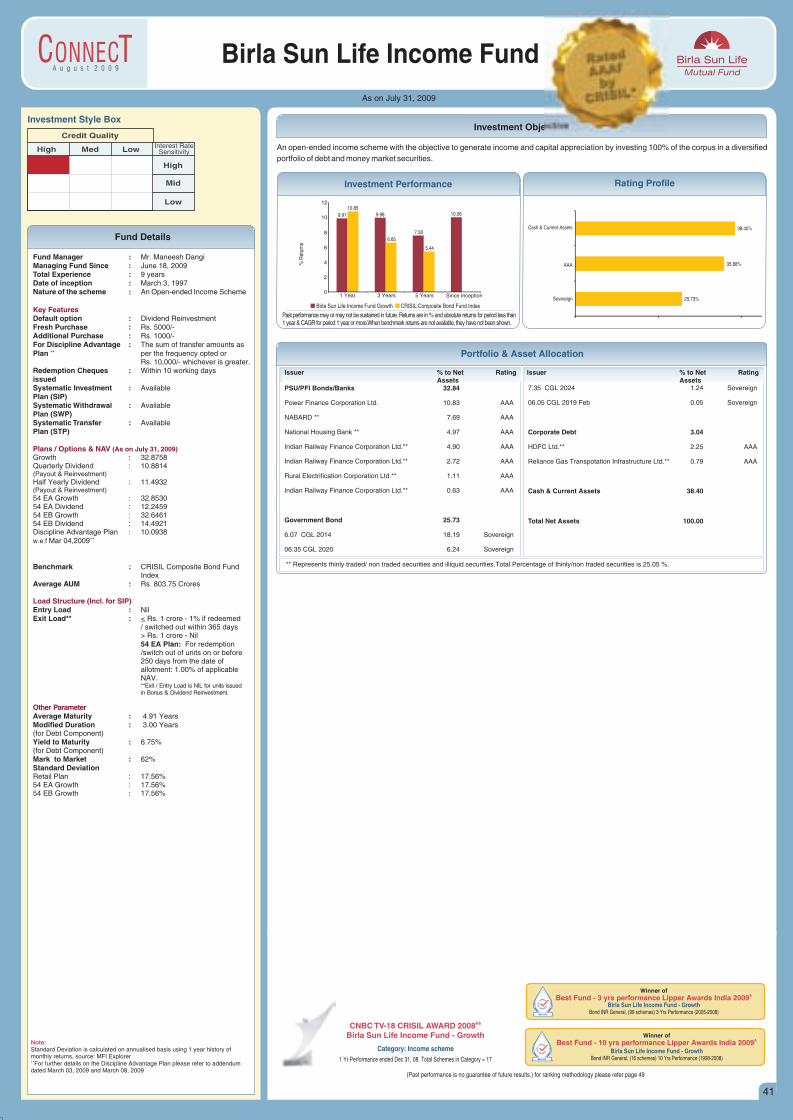
A u g u s t 2 0 0 9
Fund Details
Investment Objective
41
As on July 31, 2009
Birla Sun Life Income Fund
Investment Style Box
Low Interest RateSensitivity
High
Mid
Low
Credit Quality
High Med
Fund Manager :Managing Fund Since : June 18, 2009Total Experience : 9 years Date of inception : March 3, 1997Nature of the scheme : An Open-ended Income Scheme
Default option : Dividend ReinvestmentFresh Purchase : Rs. 5000/-Additional Purchase : Rs. 1000/-For Discipline Advantage : The sum of transfer amounts as
++Plan per the frequency opted or Rs. 10,000/- whichever is greater.
Redemption Cheques : Within 10 working days issuedSystematic Investment : Available Plan (SIP)Systematic Withdrawal : Available Plan (SWP)Systematic Transfer : AvailablePlan (STP)
Growth : 32.8758Quarterly Dividend : 10.8814(Payout & Reinvestment)Half Yearly Dividend : 11.4932(Payout & Reinvestment)54 EA Growth : 32.853054 EA Dividend : 12.245954 EB Growth : 32.646154 EB Dividend : 14.4921Discipline Advantage Plan : 10.0938
++w.e.f Mar 04,2009
Benchmark : CRISIL Composite Bond Fund Index
Average AUM : Rs. 803.75 Crores
Entry Load : NilExit Load** : < Rs. 1 crore - 1% if redeemed
/ switched out within 365 days > Rs. 1 crore - Nil54 EA Plan: For redemption /switch out of units on or before 250 days from the date ofallotment: 1.00% of applicable NAV.**Exit / Entry Load is NIL for units issued in Bonus & Dividend Reinvestment.
Average Maturity : 4.91 YearsModified Duration : 3.00 Years(for Debt Component)Yield to Maturity : 6.75%(for Debt Component)Mark to Market : 62%Standard DeviationRetail Plan : 17.56%54 EA Growth : 17.56%54 EB Growth : 17.56%
Mr. Maneesh Dangi
Key Features
Plans / Options & NAV
Load Structure (Incl. for SIP)
Other Parameter
(As on July 31, 2009)
Note:Standard Deviation is calculated on annualised basis using 1 year history of monthly returns, source: MFI Explorer++
For further details on the Discipline Advantage Plan please refer to addendum dated March 03, 2009 and March 08, 2009
(Past performance is no guarantee of future results.) for ranking methodology please refer page 49
Winner of&Best Fund - 3 yrs performance Lipper Awards India 2009
Bond INR General, (99 schemes) 3 Yrs Performance (2005-2008)Birla Sun Life Income Fund - Growth
9
Winner of&Best Fund - 10 yrs performance Lipper Awards India 2009
Bond INR General, (16 schemes) 10 Yrs Performance (1998-2008)Birla Sun Life Income Fund - Growth
9
&&CNBC TV-18 CRISIL AWARD 2008Birla Sun Life Income Fund - Growth
1 Yr Performance ended Dec 31, 08. Total Schemes in Category = 17
Category: Income scheme
Portfolio & Asset Allocation
Issuer % to Net RatingAssets
Issuer % to Net RatingAssets
PSU/PFI Bonds/Banks 32.84
Power Finance Corporation Ltd. 10.83 AAA
NABARD ** 7.69 AAA
National Housing Bank ** 4.97 AAA
Indian Railway Finance Corporation Ltd.** 4.90 AAA
Indian Railway Finance Corporation Ltd.** 2.72 AAA
Rural Electrification Corporation Ltd.** 1.11 AAA
Indian Railway Finance Corporation Ltd.** 0.63 AAA
Government Bond 25.73
6.07 CGL 2014 18.19 Sovereign
06.35 CGL 2020 6.24 Sovereign
7.35 CGL 2024 1.24 Sovereign
06.05 CGL 2019 Feb 0.05 Sovereign
Corporate Debt 3.04
HDFC Ltd.** 2.25 AAA
Reliance Gas Transpotation Infrastructure Ltd.** 0.79 AAA
Cash & Current Assets 38.40
Total Net Assets 100.00
** Represents thinly traded/ non traded securities and illiquid securities.Total Percentage of thinly/non traded securities is 25.05 %.
Past performance may or may not be sustained in future. Returns are in % and absolute returns for period less than 1 year & CAGR for period 1 year or more.When benchmark returns are not available, they have not been shown.
% R
etur
ns
Birla Sun Life Income Fund Growth CRISIL Composite Bond Fund Index
Investment Performance Rating Profile
An open-ended income scheme with the objective to generate income and capital appreciation by investing 100% of the corpus in a diversified
portfolio of debt and money market securities.
25.73%
35.88%
38.40%
Sovereign
AAA
Cash & Current Assets
9.91 9.98
7.58
10.0610.85
6.65
5.44
0
2
4
6
8
10
12
1 Year 3 Years 5 Years Since Inception
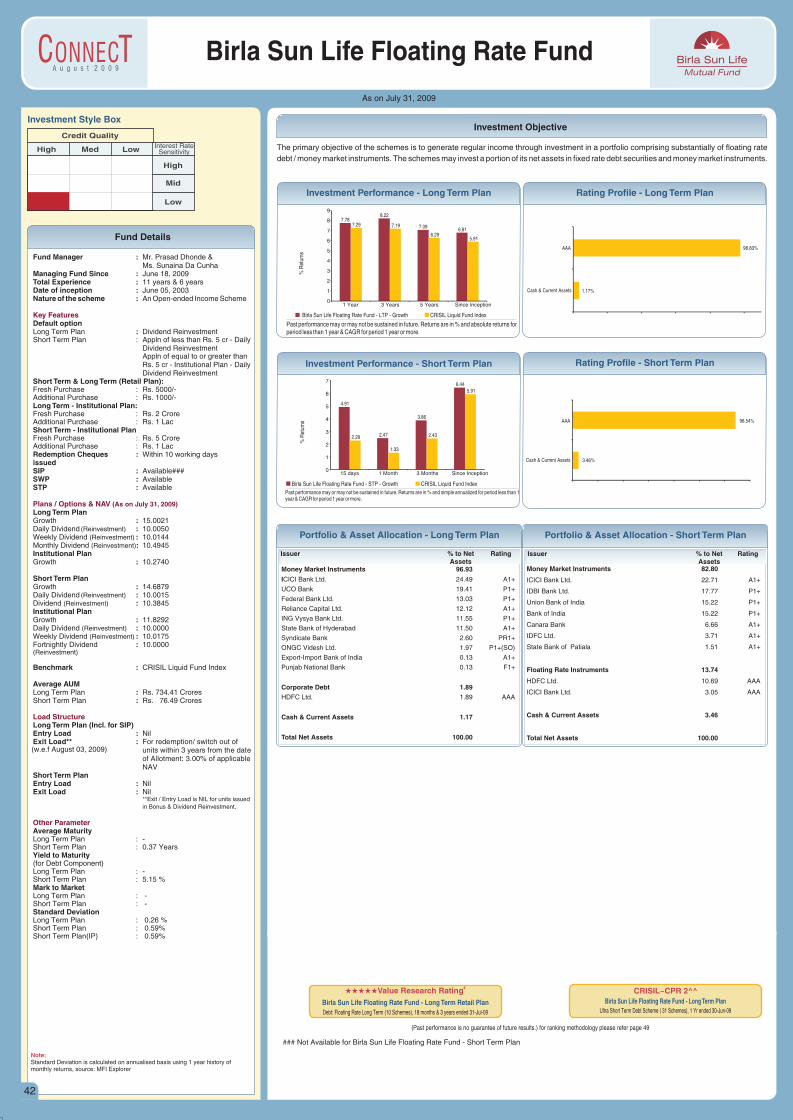
A u g u s t 2 0 0 9
Fund Details
42
Investment Objective
As on July 31, 2009
Birla Sun Life Floating Rate Fund
Investment Style Box
Low Interest RateSensitivity
High
Mid
Low
Credit Quality
High Med
Fund Manager :Ms. Sunaina Da Cunha
Managing Fund Since : June 18, 2009Total Experience : 11 years & 6 years Date of inception : June 05, 2003Nature of the scheme : An Open-ended Income Scheme
Default optionLong Term Plan : Dividend ReinvestmentShort Term Plan : Appln of less than Rs. 5 cr - Daily
Dividend ReinvestmentAppln of equal to or greater than Rs. 5 cr - Institutional Plan - Daily Dividend Reinvestment
Short Term & Long Term (Retail Plan): Fresh Purchase : Rs. 5000/-Additional Purchase : Rs. 1000/-Long Term - Institutional Plan:Fresh Purchase : Rs. 2 CroreAdditional Purchase : Rs. 1 LacShort Term - Institutional PlanFresh Purchase : Rs. 5 CroreAdditional Purchase : Rs. 1 LacRedemption Cheques : Within 10 working days issuedSIP : Available### SWP : Available STP : Available
Long Term PlanGrowth : 15.0021Daily Dividend (Reinvestment) : 10.0050Weekly Dividend (Reinvestment) : 10.0144Monthly Dividend (Reinvestment): 10.4945Institutional Plan Growth : 10.2740
Short Term PlanGrowth : 14.6879Daily Dividend (Reinvestment) : 10.0015Dividend (Reinvestment) : 10.3845Institutional Plan Growth : 11.8292Daily Dividend (Reinvestment) : 10.0000Weekly Dividend (Reinvestment) : 10.0175
Benchmark : CRISIL Liquid Fund Index
Average AUMLong Term Plan : Rs. 734.41 CroresShort Term Plan : Rs. 76.49 Crores
Long Term Plan (Incl. for SIP) Entry Load : Nil Exit Load** : For redemption/ switch out of
units within 3 years from the date of Allotment: 3.00% of applicable NAV
Short Term PlanEntry Load : NilExit Load : Nil
**Exit / Entry Load is NIL for units issued
in Bonus & Dividend Reinvestment.
Average Maturity Long Term Plan : -Short Term Plan : 0.37 YearsYield to Maturity (for Debt Component)Long Term Plan : -Short Term Plan : 5.15 %Mark to MarketLong Term Plan : -Short Term Plan : -Standard Deviation Long Term Plan : 0.26 %Short Term Plan : 0.59%Short Term Plan(IP) : 0.59%
Mr. Prasad Dhonde &
Key Features
Plans / Options & NAV
Load Structure
Other Parameter
(As on July 31, 2009)
Fortnightly Dividend : 10.0000(Reinvestment)
The primary objective of the schemes is to generate regular income through investment in a portfolio comprising substantially of floating rate
debt / money market instruments. The schemes may invest a portion of its net assets in fixed rate debt securities and money market instruments.
Past performance may or may not be sustained in future. Returns are in % and absolute returns for period less than 1 year & CAGR for period 1 year or more.
% R
etur
ns
Birla Sun Life Floating Rate Fund - LTP - Growth CRISIL Liquid Fund Index
Investment Performance - Long Term Plan Rating Profile - Long Term Plan
1.17%
98.83%
Cash & Current Assets
AAA
Past performance may or may not be sustained in future. Returns are in % and simple annualized for period less than 1 year & CAGR for period 1 year or more.
% R
etur
ns
Birla Sun Life Floating Rate Fund - STP - Growth CRISIL Liquid Fund Index
Investment Performance - Short Term Plan Rating Profile - Short Term Plan
Issuer % to Net RatingAssets
Issuer % to Net RatingAssets
Money Market Instruments 96.93
ICICI Bank Ltd. 24.49 A1+
UCO Bank 19.41 P1+
Federal Bank Ltd. 13.03 P1+
Reliance Capital Ltd. 12.12 A1+
ING Vysya Bank Ltd. 11.55 P1+
State Bank of Hyderabad 11.50 A1+
Syndicate Bank 2.60 PR1+
ONGC Videsh Ltd. 1.97 P1+(SO)
Export-Import Bank of India 0.13 A1+
Punjab National Bank 0.13 F1+
Corporate Debt 1.89HDFC Ltd. 1.89 AAA
Cash & Current Assets 1.17
Total Net Assets 100.00
Portfolio & Asset Allocation - Long Term Plan Portfolio & Asset Allocation - Short Term Plan
### Not Available for Birla Sun Life Floating Rate Fund - Short Term Plan
#iiiValue Research Ratingii
Birla Sun Life Floating Rate Fund - Long Term Plan Retail Debt: Floating Rate Long Term (10 Schemes), 18 months & 3 years ended 31-Jul-09
(Past performance is no guarantee of future results.) for ranking methodology please refer page 49
CRISIL~CPR 2^^Birla Sun Life Floating Rate Fund - Long Term Plan
Ultra Short Term Debt Scheme ( 31 Schemes), 1 Yr ended 30-Jun-09
Note:Standard Deviation is calculated on annualised basis using 1 year history of monthly returns, source: MFI Explorer
Money Market Instruments 82.80
ICICI Bank Ltd. 22.71 A1+
IDBI Bank Ltd. 17.77 P1+
Union Bank of India 15.22 P1+
Bank of India 15.22 P1+
Canara Bank 6.66 A1+
IDFC Ltd. 3.71 A1+
State Bank of Patiala 1.51 A1+
Floating Rate Instruments 13.74
HDFC Ltd. 10.69 AAA
ICICI Bank Ltd. 3.05 AAA
Cash & Current Assets 3.46
Total Net Assets 100.00
3.46%
96.54%
Cash & Current Assets
AAA
7.788.22
7.096.81
7.29 7.19
6.295.91
0
1
2
3
4
5
6
7
8
9
1 Year 3 Years 5 Years Since Inception
4.91
2.47
3.86
6.44
2.28
1.33
2.43
5.91
0
1
2
3
4
5
6
7
15 days 1 Month 3 Months Since Inception
(w.e.f August 03, 2009)
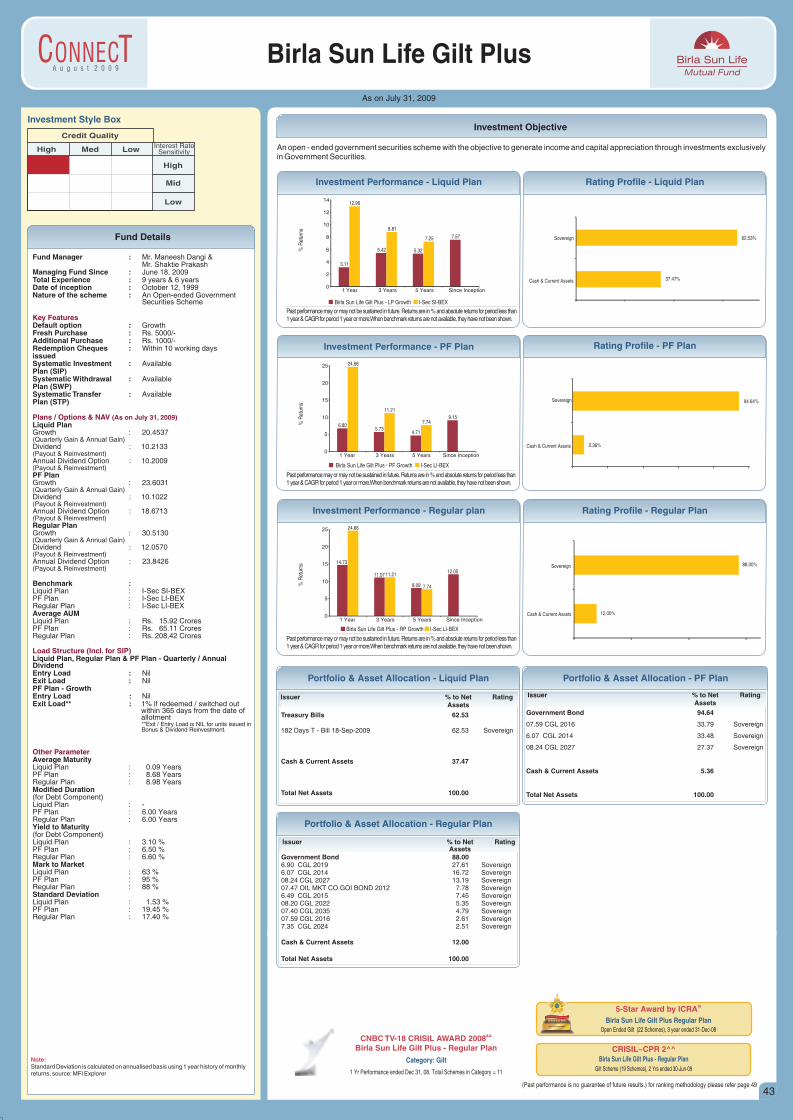
A u g u s t 2 0 0 9
Investment Objective
43
As on July 31, 2009
An open - ended government securities scheme with the objective to generate income and capital appreciation through investments exclusivelyin Government Securities.
Birla Sun Life Gilt Plus
Investment Style Box
Low Interest RateSensitivity
High
Mid
Low
Credit Quality
High Med
Fund Manager :Mr. Shaktie Prakash
Managing Fund Since : June 18, 2009Total Experience : 9 years & 6 yearsDate of inception : October 12, 1999Nature of the scheme : An Open-ended Government
Securities Scheme
Default option : GrowthFresh Purchase : Rs. 5000/-Additional Purchase : Rs. 1000/-Redemption Cheques : Within 10 working days issuedSystematic Investment : Available Plan (SIP)Systematic Withdrawal : Available Plan (SWP)Systematic Transfer : AvailablePlan (STP)
Liquid PlanGrowth : 20.4537(Quarterly Gain & Annual Gain)Dividend : 10.2133(Payout & Reinvestment)Annual Dividend Option : 10.2009(Payout & Reinvestment)PF PlanGrowth : 23.6031(Quarterly Gain & Annual Gain)Dividend : 10.1022(Payout & Reinvestment)Annual Dividend Option : 18.6713(Payout & Reinvestment)Regular PlanGrowth : 30.5130(Quarterly Gain & Annual Gain)Dividend : 12.0570(Payout & Reinvestment)Annual Dividend Option : 23.8426(Payout & Reinvestment)
Benchmark :Liquid Plan : I-Sec SI-BEXPF Plan : I-Sec LI-BEXRegular Plan : I-Sec LI-BEXAverage AUMLiquid Plan : Rs. 15.92 CroresPF Plan : Rs. 65.11 CroresRegular Plan : Rs. 208.42 Crores
Liquid Plan, Regular Plan & PF Plan - Quarterly / Annual DividendEntry Load : NilExit Load : NilPF Plan - GrowthEntry Load : NilExit Load** : 1% if redeemed / switched out
within 365 days from the date of allotment**Exit / Entry Load is NIL for units issued in Bonus & Dividend Reinvestment.
Average Maturity Liquid Plan : 0.09 YearsPF Plan : 8.68 YearsRegular Plan : 8.98 YearsModified Duration (for Debt Component)Liquid Plan : -PF Plan : 6.00 YearsRegular Plan : 6.00 YearsYield to Maturity (for Debt Component)Liquid Plan : 3.10 %PF Plan : 6.50 %Regular Plan : 6.60 %Mark to MarketLiquid Plan : 63 %PF Plan : 95 % Regular Plan : 88 %Standard Deviation Liquid Plan : 1.53 %PF Plan : 19.45 % Regular Plan : 17.40 %
Mr. Maneesh Dangi &
Key Features
Plans / Options & NAV
Load Structure (Incl. for SIP)
Other Parameter
(As on July 31, 2009)
Note:Standard Deviation is calculated on annualised basis using 1 year history of monthly returns, source: MFI Explorer
Past performance may or may not be sustained in future. Returns are in % and absolute returns for period less than 1 year & CAGR for period 1 year or more.When benchmark returns are not available, they have not been shown.
Investment Performance - Liquid Plan Rating Profile - Liquid Plan
Past performance may or may not be sustained in future. Returns are in % and absolute returns for period less than 1 year & CAGR for period 1 year or more.When benchmark returns are not available, they have not been shown.
Investment Performance - PF Plan Rating Profile - PF Plan
Past performance may or may not be sustained in future. Returns are in % and absolute returns for period less than 1 year & CAGR for period 1 year or more.When benchmark returns are not available, they have not been shown.
Investment Performance - Regular plan Rating Profile - Regular Plan
Birla Sun Life Gilt Plus - LP Growth I-Sec SI-BEX
Birla Sun Life Gilt Plus - PF Growth I-Sec LI-BEX
Birla Sun Life Gilt Plus - RP Growth I-Sec LI-BEX
% R
etur
ns%
Ret
urns
% R
etur
ns
5.36%
94.64%
Cash & Current Assets
Sovereign
Fund Details
Issuer % to Net RatingAssets
Government Bond 94.64
07.59 CGL 2016 33.79 Sovereign
6.07 CGL 2014 33.48 Sovereign
08.24 CGL 2027 27.37 Sovereign
Cash & Current Assets 5.36
Total Net Assets 100.00
Issuer % to Net RatingAssets
Treasury Bills 62.53
182 Days T - Bill 18-Sep-2009 62.53 Sovereign
Cash & Current Assets 37.47
Total Net Assets 100.00
Portfolio & Asset Allocation - Liquid Plan Portfolio & Asset Allocation - PF Plan
Issuer % to Net RatingAssets
Government Bond 88.006.90 CGL 2019 27.61 Sovereign6.07 CGL 2014 16.72 Sovereign08.24 CGL 2027 13.19 Sovereign07.47 OIL MKT CO GOI BOND 2012 7.78 Sovereign6.49 CGL 2015 7.45 Sovereign08.20 CGL 2022 5.35 Sovereign07.40 CGL 2035 4.79 Sovereign07.59 CGL 2016 2.61 Sovereign7.35 CGL 2024 2.51 Sovereign
Cash & Current Assets 12.00
Total Net Assets 100.00
Portfolio & Asset Allocation - Regular Plan
5-Star Award by @ICRABirla Sun Life Gilt Plus Regular Plan
Open Ended Gilt (22 Schemes), 3 year ended 31-Dec-08
CRISIL~CPR 2^^Birla Sun Life Gilt Plus - Regular Plan
Gilt Scheme (19 Schemes), 2 Yrs ended 30-Jun-09
(Past performance is no guarantee of future results.) for ranking methodology please refer page 49
&&CNBC TV-18 CRISIL AWARD 2008Birla Sun Life Gilt Plus - Regular Plan
1 Yr Performance ended Dec 31, 08. Total Schemes in Category = 11
Category: Gilt
37.47%
62.53%
Cash & Current Assets
Sovereign
12.00%
88.00%
Cash & Current Assets
Sovereign
3.11
5.42 5.32
7.57
12.96
8.81
7.25
0
2
4
6
8
10
12
14
1 Year 3 Years 5 Years Since Inception
6.805.73
4.71
9.15
24.66
11.21
7.74
0
5
10
15
20
25
1 Year 3 Years 5 Years Since Inception
14.73
11.07
8.09
12.05
24.66
11.21
7.74
0
5
10
15
20
25
1 Year 3 Years 5 Years Since Inception
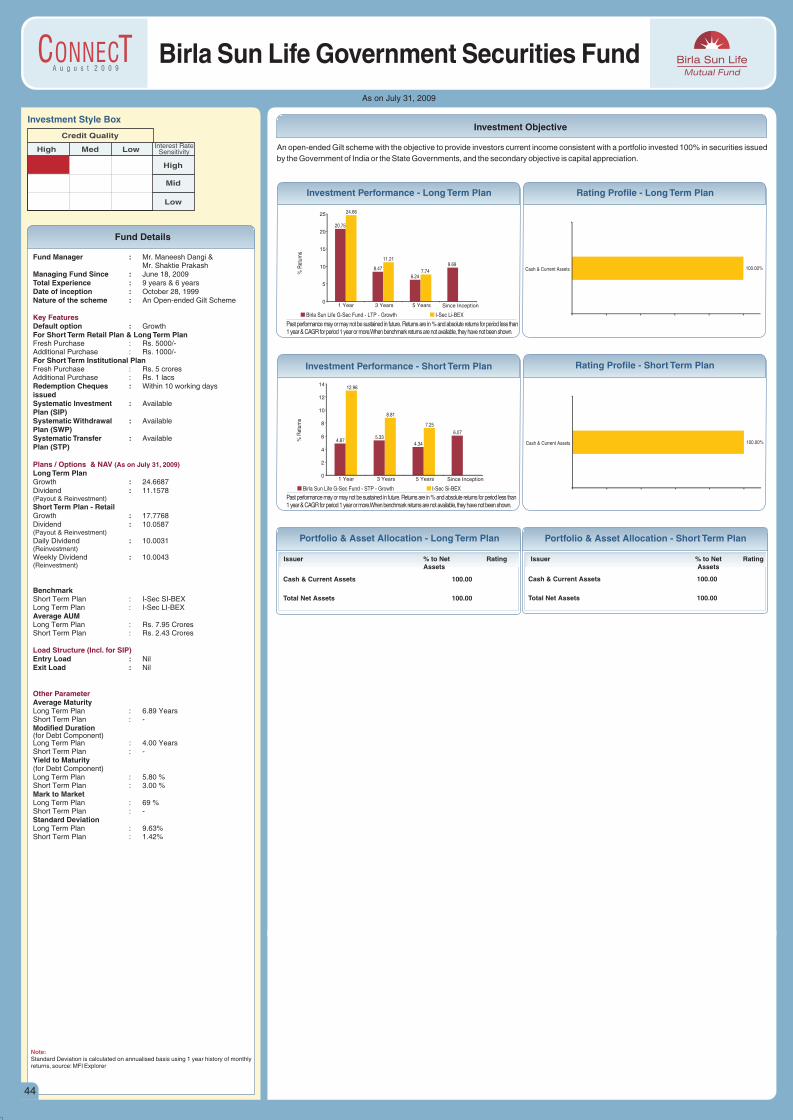
A u g u s t 2 0 0 9
44
As on July 31, 2009
Fund Details
Investment Style Box
Low Interest RateSensitivity
High
Mid
Low
Credit Quality
High Med
Fund Manager :Mr. Shaktie Prakash
Managing Fund Since : June 18, 2009Total Experience : 9 years & 6 yearsDate of inception : October 28, 1999Nature of the scheme : An Open-ended Gilt Scheme
Default option : GrowthFor Short Term Retail Plan & Long Term PlanFresh Purchase : Rs. 5000/-Additional Purchase : Rs. 1000/-For Short Term Institutional PlanFresh Purchase : Rs. 5 croresAdditional Purchase : Rs. 1 lacsRedemption Cheques : Within 10 working days issuedSystematic Investment : Available Plan (SIP)Systematic Withdrawal : Available Plan (SWP)Systematic Transfer : AvailablePlan (STP)
Long Term PlanGrowth : 24.6687Dividend : 11.1578(Payout & Reinvestment)
Short Term Plan - Retail Growth : 17.7768Dividend : 10.0587(Payout & Reinvestment)
Daily Dividend : 10.0031(Reinvestment)
Weekly Dividend : 10.0043(Reinvestment)
BenchmarkShort Term Plan : I-Sec SI-BEXLong Term Plan : I-Sec LI-BEXAverage AUMLong Term Plan : Rs. 7.95 CroresShort Term Plan : Rs. 2.43 Crores
Entry Load : NilExit Load : Nil
Average Maturity Long Term Plan : 6.89 YearsShort Term Plan : -Modified Duration (for Debt Component)Long Term Plan : 4.00 YearsShort Term Plan : -Yield to Maturity (for Debt Component)Long Term Plan : 5.80 %Short Term Plan : 3.00 %Mark to MarketLong Term Plan : 69 %Short Term Plan : -Standard Deviation Long Term Plan : 9.63%Short Term Plan : 1.42%
Mr. Maneesh Dangi &
Key Features
Plans / Options & NAV
Load Structure (Incl. for SIP)
Other Parameter
(As on July 31, 2009)
Note:Standard Deviation is calculated on annualised basis using 1 year history of monthly returns, source: MFI Explorer
An open-ended Gilt scheme with the objective to provide investors current income consistent with a portfolio invested 100% in securities issued
by the Government of India or the State Governments, and the secondary objective is capital appreciation.
Investment Objective
Birla Sun Life Government Securities Fund
Past performance may or may not be sustained in future. Returns are in % and absolute returns for period less than 1 year & CAGR for period 1 year or more.When benchmark returns are not available, they have not been shown.
% R
etur
ns
Birla Sun Life G-Sec Fund - LTP - Growth I-Sec Li-BEX
Investment Performance - Long Term Plan Rating Profile - Long Term Plan
Past performance may or may not be sustained in future. Returns are in % and absolute returns for period less than 1 year & CAGR for period 1 year or more.When benchmark returns are not available, they have not been shown.
Investment Performance - Short Term Plan Rating Profile - Short Term Plan
% R
etur
ns
Birla Sun Life G-Sec Fund - STP - Growth I-Sec Si-BEX
Issuer % to Net RatingAssets
Issuer % to Net RatingAssets
Cash & Current Assets 100.00
Total Net Assets 100.00
Cash & Current Assets 100.00
Total Net Assets 100.00
Portfolio & Asset Allocation - Long Term Plan Portfolio & Asset Allocation - Short Term Plan
100.00%Cash & Current Assets
100.00%Cash & Current Assets
20.75
8.47
6.24
9.69
24.66
11.21
7.74
0
5
10
15
20
25
1 Year 3 Years 5 Years Since Inception
4.875.33
4.34
6.07
12.96
8.81
7.25
0
2
4
6
8
10
12
14
1 Year 3 Years 5 Years Since Inception
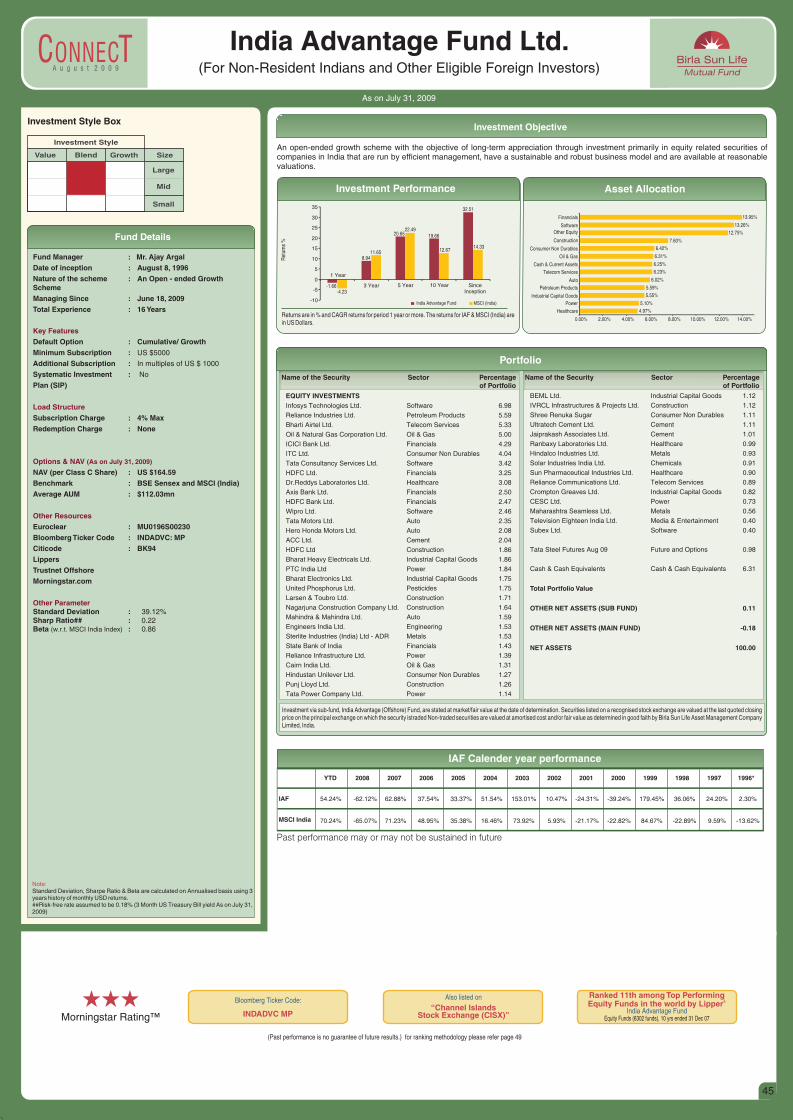
A u g u s t 2 0 0 9
Fund Details
45
Investment Objective
Note: Standard Deviation, Sharpe Ratio & Beta are calculated on Annualised basis using 3 years history of monthly USD returns.##Risk-free rate assumed to be 0.18% (3 Month US Treasury Bill yield As on July 31, 2009)
As on July 31, 2009
India Advantage Fund Ltd.(For Non-Resident Indians and Other Eligible Foreign Investors)
Investment Style Box
Value Blend Growth Size
Large
Mid
Small
Investment StyleAn open-ended growth scheme with the objective of long-term appreciation through investment primarily in equity related securities of companies in India that are run by efficient management, have a sustainable and robust business model and are available at reasonable valuations.
Fund Manager : Mr. Ajay Argal
Date of inception : August 8, 1996
Nature of the scheme : An Open - ended Growth Scheme
Managing Since : June 18, 2009
Total Experience : 16 Years
Default Option : Cumulative/ Growth
Minimum Subscription : US $5000
Additional Subscription : In multiples of US $ 1000
Systematic Investment : No
Plan (SIP)
Subscription Charge : 4% Max
Redemption Charge : None
NAV (per Class C Share) : US $164.59
Benchmark : BSE Sensex and MSCI (India)
Average AUM : $112.03mn
Euroclear : MU0196S00230
Bloomberg Ticker Code : INDADVC: MP
Citicode : BK94
Lippers
Trustnet Offshore
Morningstar.com
Standard Deviation : 39.12%Sharp Ratio## : 0.22Beta (w.r.t. MSCI India Index) : 0.86
Key Features
Load Structure
Options & NAV (As on July 31, 2009)
Other Resources
Other Parameter
Morningstar Rating™
iii Ranked 11th among Top Performing &Equity Funds in the world by Lipper
India Advantage FundEquity Funds (6302 funds), 10 yrs ended 31 Dec 07
“Channel Islands Stock Exchange (CISX)”
Also listed on
INDADVC MP
Bloomberg Ticker Code:
(Past performance is no guarantee of future results.) for ranking methodology please refer page 49
Returns are in % and CAGR returns for period 1 year or more. The returns for IAF & MSCI (India) are in US Dollars.
Investment Performance Asset Allocation
India Advantage Fund MSCI (India)
Ret
urns
%
Portfolio
EQUITY INVESTMENTSInfosys Technologies Ltd. Software 6.98
Reliance Industries Ltd. Petroleum Products 5.59
Bharti Airtel Ltd. Telecom Services 5.33
Oil & Natural Gas Corporation Ltd. Oil & Gas 5.00
ICICI Bank Ltd. Financials 4.29
ITC Ltd. Consumer Non Durables 4.04
Tata Consultancy Services Ltd. Software 3.42
HDFC Ltd. Financials 3.25
Dr.Reddys Laboratories Ltd. Healthcare 3.08
Axis Bank Ltd. Financials 2.50
HDFC Bank Ltd. Financials 2.47
Wipro Ltd. Software 2.46
Tata Motors Ltd. Auto 2.35
Hero Honda Motors Ltd. Auto 2.08
ACC Ltd. Cement 2.04
HDFC Ltd Construction 1.86
Bharat Heavy Electricals Ltd. Industrial Capital Goods 1.86
PTC India Ltd Power 1.84
Bharat Electronics Ltd. Industrial Capital Goods 1.75
United Phosphorus Ltd. Pesticides 1.75
Larsen & Toubro Ltd. Construction 1.71
Nagarjuna Construction Company Ltd. Construction 1.64
Mahindra & Mahindra Ltd. Auto 1.59
Engineers India Ltd. Engineering 1.53
Sterlite Industries (India) Ltd - ADR Metals 1.53
State Bank of India Financials 1.43
Reliance Infrastructure Ltd. Power 1.39
Cairn India Ltd. Oil & Gas 1.31
Hindustan Unilever Ltd. Consumer Non Durables 1.27
Punj Lloyd Ltd. Construction 1.26
Tata Power Company Ltd. Power 1.14
BEML Ltd. Industrial Capital Goods 1.12
IVRCL Infrastructures & Projects Ltd. Construction 1.12
Shree Renuka Sugar Consumer Non Durables 1.11
Ultratech Cement Ltd. Cement 1.11
Jaiprakash Associates Ltd. Cement 1.01
Ranbaxy Laboratories Ltd. Healthcare 0.99
Hindalco Industries Ltd. Metals 0.93
Solar Industries India Ltd. Chemicals 0.91
Sun Pharmaceutical Industries Ltd. Healthcare 0.90
Reliance Communications Ltd. Telecom Services 0.89
Crompton Greaves Ltd. Industrial Capital Goods 0.82
CESC Ltd. Power 0.73
Maharashtra Seamless Ltd. Metals 0.56
Television Eighteen India Ltd. Media & Entertainment 0.40
Subex Ltd. Software 0.40
Tata Steel Futures Aug 09 Future and Options 0.98
Cash & Cash Equivalents Cash & Cash Equivalents 6.31
Total Portfolio Value
OTHER NET ASSETS (SUB FUND) 0.11
OTHER NET ASSETS (MAIN FUND) -0.18
NET ASSETS 100.00
Investment via sub-fund, India Advantage (Offshore) Fund, are stated at market/fair value at the date of determination. Securities listed on a recognised stock exchange are valued at the last quoted closing price on the principal exchange on which the security istraded Non-traded securities are valued at amortised cost and/or fair value as determined in good faith by Birla Sun Life Asset Management Company Limited, India.
Name of the Security Sector Percentageof Portfolio
Name of the Security Sector Percentageof Portfolio
YTD 2008 2007 2006 2005 2004 2003 2002 2001 2000 1999 1998 1997 1996*
IAF
MSCI India
IAF Calender year performance
54.24% -62.12% 62.88% 37.54% 33.37% 51.54% 153.01% 10.47% -24.31% -39.24% 179.45% 36.06% 24.20% 2.30%
70.24% -65.07% 71.23% 48.95% 35.38% 16.46% 73.92% 5.93% -21.17% -22.82% 84.67% -22.89% 9.59% -13.62%
Past performance may or may not be sustained in future
4.97%
5.10%
5.55%
5.59%
6.02%
6.23%
6.25%
6.31%
6.42%
7.60%
12.75%
13.26%
13.95%
0.00% 2.00% 4.00% 6.00% 8.00% 10.00% 12.00% 14.00%
Healthcare
Power
Industrial Capital Goods
Petroleum Products
Auto
Telecom Services
Cash & Current Assets
Oil & Gas
Consumer Non Durables
Construction
Other Equity
Software
Financials
-1.66
8.94
20.65 19.66
32.51
-4.23
11.65
22.49
12.6714.33
-10
-5
0
5
10
15
20
25
30
35
1 Year
3 Year 5 Year 10 Year SinceInception
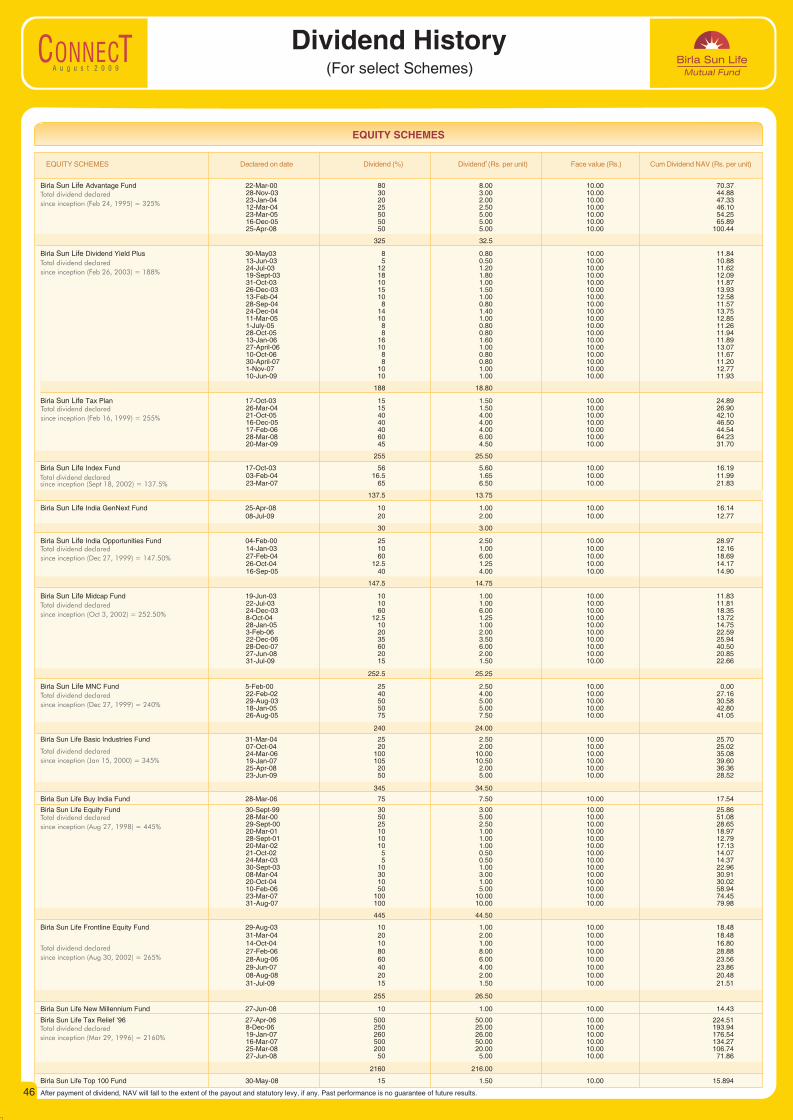
A u g u s t 2 0 0 9
Dividend History(For select Schemes)
EQUITY SCHEMES
After payment of dividend, NAV will fall to the extent of the payout and statutory levy, if any. Past performance is no guarantee of future results.
Total dividend declared
since inception (Feb 24, 1995) = 325%
Total dividend declared
since inception (Feb 16, 1999) = 255%
Total dividend declared
since inception (Aug 27, 1998) = 445%
Total dividend declared
since inception (Dec 27, 1999) = 147.50%
Total dividend declared
since inception (Dec 27, 1999) = 240%
Total dividend declared
since inception (Oct 3, 2002) = 252.50%
Total dividend declared
since inception (Feb 26, 2003) = 188%
Total dividend declared since inception (Sept 18, 2002) = 137.5%
Total dividend declared
since inception (Aug 30, 2002) = 265%
Total dividend declared
since inception (Jan 15, 2000) = 345%
Total dividend declared
since inception (Mar 29, 1996) = 2160%
# EQUITY SCHEMES Declared Dividend Dividend Face value Cum Dividend NAV on date (%) (Rs. per unit) (Rs.) (Rs. per unit)
46
Birla Advantage Fund 22-Mar-00 80 8.00 10.00 70.3728-Nov-03 30 3.00 10.00 44.8823-Jan-04 20 2.00 10.00 47.3312-Mar-04 25 2.50 10.00 46.1023-Mar-05 50 5.00 10.00 54.2516-Dec-05 50 5.00 10.00 65.8925-Apr-08 50 5.00 10.00 100.44
325 32.5
Birla Sun Life Dividend Yield Plus 30-May03 8 0.80 10.00 11.8413-Jun-03 5 0.50 10.00 10.88 24-Jul-03 12 1.20 10.00 11.6219-Sept-03 18 1.80 10.00 12.0931-Oct-03 10 1.00 10.00 11.8726-Dec-03 15 1.50 10.00 13.9313-Feb-04 10 1.00 10.00 12.5828-Sep-04 8 0.80 10.00 11.5724-Dec-04 14 1.40 10.00 13.7511-Mar-05 10 1.00 10.00 12.851-July-05 8 0.80 10.00 11.2628-Oct-05 8 0.80 10.00 11.9413-Jan-06 16 1.60 10.00 11.8927-April-06 10 1.00 10.00 13.0710-Oct-06 8 0.80 10.00 11.6730-April-07 8 0.80 10.00 11.201-Nov-07 10 1.00 10.00 12.7710-Jun-09 10 1.00 10.00 11.93
188 18.80
Birla Sun Life Tax Plan 17-Oct-03 15 1.50 10.00 24.8926-Mar-04 15 1.50 10.00 26.9021-Oct-05 40 4.00 10.00 42.1016-Dec-05 40 4.00 10.00 46.5017-Feb-06 40 4.00 10.00 44.5428-Mar-08 60 6.00 10.00 64.2320-Mar-09 45 4.50 10.00 31.70
255 25.50
Birla Sun Life Index Fund 17-Oct-03 56 5.60 10.00 16.1903-Feb-04 16.5 1.65 10.00 11.9923-Mar-07 65 6.50 10.00 21.83
137.5 13.75
Birla Sun Life India GenNext Fund 25-Apr-08 10 1.00 10.00 16.14 08-Jul-09 20 2.00 10.00 12.77
30 3.00
Birla Sun Life India Opportunities Fund 04-Feb-00 25 2.50 10.00 28.9714-Jan-03 10 1.00 10.00 12.1627-Feb-04 60 6.00 10.00 18.6926-Oct-04 12.5 1.25 10.00 14.1716-Sep-05 40 4.00 10.00 14.90
147.5 14.75
Birla Sun Life Midcap Fund 19-Jun-03 10 1.00 10.00 11.8322-Jul-03 10 1.00 10.00 11.8124-Dec-03 60 6.00 10.00 18.358-Oct-04 12.5 1.25 10.00 13.7228-Jan-05 10 1.00 10.00 14.753-Feb-06 20 2.00 10.00 22.5922-Dec-06 35 3.50 10.00 25.9428-Dec-07 60 6.00 10.00 40.50 27-Jun-08 20 2.00 10.00 20.8531-Jul-09 15 1.50 10.00 22.66
252.5 25.25
Birla Sun Life MNC Fund 5-Feb-00 25 2.50 10.00 0.0022-Feb-02 40 4.00 10.00 27.1629-Aug-03 50 5.00 10.00 30.5818-Jan-05 50 5.00 10.00 42.8026-Aug-05 75 7.50 10.00 41.05
240 24.00
Birla Sun Life Basic Industries Fund 31-Mar-04 25 2.50 10.00 25.70 07-Oct-04 20 2.00 10.00 25.0224-Mar-06 100 10.00 10.00 35.0819-Jan-07 105 10.50 10.00 39.60 25-Apr-08 20 2.00 10.00 36.36 23-Jun-09 50 5.00 10.00 28.52
345 34.50
Birla Sun Life Buy India Fund 28-Mar-06 75 7.50 10.00 17.54
Birla Sun Life Equity Fund 30-Sept-99 30 3.00 10.00 25.8628-Mar-00 50 5.00 10.00 51.0829-Sept-00 25 2.50 10.00 28.6520-Mar-01 10 1.00 10.00 18.9728-Sept-01 10 1.00 10.00 12.7920-Mar-02 10 1.00 10.00 17.1321-Oct-02 5 0.50 10.00 14.0724-Mar-03 5 0.50 10.00 14.3730-Sept-03 10 1.00 10.00 22.9608-Mar-04 30 3.00 10.00 30.9120-Oct-04 10 1.00 10.00 30.0210-Feb-06 50 5.00 10.00 58.9423-Mar-07 100 10.00 10.00 74.4531-Aug-07 100 10.00 10.00 79.98
445 44.50
Birla Sun Life Frontline Equity Fund 29-Aug-03 10 1.00 10.00 18.4831-Mar-04 20 2.00 10.00 18.4814-Oct-04 10 1.00 10.00 16.8027-Feb-06 80 8.00 10.00 28.8828-Aug-06 60 6.00 10.00 23.5629-Jun-07 40 4.00 10.00 23.8608-Aug-08 20 2.00 10.00 20.4831-Jul-09 15 1.50 10.00 21.51
255 26.50
Birla Sun Life New Millennium Fund 27-Jun-08 10 1.00 10.00 14.43
Birla Sun Life Tax Relief ‘96 27-Apr-06 500 50.00 10.00 224.518-Dec-06 250 25.00 10.00 193.9419-Jan-07 260 26.00 10.00 176.5416-Mar-07 500 50.00 10.00 134.27 25-Mar-08 200 20.00 10.00 106.74 27-Jun-08 50 5.00 10.00 71.86
2160 216.00
Birla Sun Life Top 100 Fund 30-May-08 15 1.50 10.00 15.894
Sun Life

A u g u s t 2 0 0 9
Dividend History(For select Schemes)
HYBRID & MONTHLY INCOME SCHEMES
# DEBT SCHEMES Date Face Value Dividend Dividend Cum Dividend NAV
(%) (Rs. per unit) (%) (Rs. per unit) (Rs. per unit)
#Dividend Dividend
Non Corporate Corporate
Birla Sun Life Freedom Fund 17-Oct-03 10.00 15 1.50 - - 13.32
20-Jan-06 10.00 50 5.00 - - 15.13
08-Jul-09 10.00 15 1.50 - - 19.69
80 8.00
Birla Sun Life MIP (Monthly Dividend Plan) 30-Nov-07 10.00 1.455 0.1455 1.354 0.1354 11.5526
28-Dec-07 10.00 1.147 0.1147 1.068 0.1068 11.6693
25-Jan-08 10.00 1.204 0.1204 1.120 0.1120 11.3399
29-Feb-08 10.00 0.847 0.0847 0.788 0.0788 10.9853
28-Mar-08 10.00 0.682 0.0682 0.635 0.0635 10.6837
25-Apr-08 10.00 0.641 0.0641 0.597 0.0597 10.6054
30-May-08 10.00 0.796 0.0796 0.741 0.0741 10.4906
27-Jun-08 10.00 0.123 0.0123 0.114 0.0114 10.0146
29-Aug-08 10.00 0.228 0.0228 0.212 0.0212 10.0638
30-Jan-09 10.00 0.876 0.0876 0.815 0.0815 10.5239
24-Apr-09 10.00 0.613 0.0613 0.571 0.057 11.1021
29-May-09 10.00 0.788 0.0788 0.734 0.0734 11.1220
26-Jun-09 10.00 0.788 0.0788 0.734 0.0734 11.1155
31-Jul-09 10.00 0.834 0.0834 0.776 0.0776 11.2561
13-Aug-08 10.00 0.402 0.0402 0.374 0.0374 10.1890
28-Aug-08 10.00 0.140 0.0140 0.130 0.0130 10.6778
29-Sep-08 10.00 0.802 0.0802 0.747 0.0747 10.7534
17-Oct-08 10.00 0.140 0.0140 0.130 0.0130 10.6947
27-Oct-08 10.00 0.526 0.0526 0.489 0.0489 10.7336
12-Nov-08 10.00 0.657 0.0657 0.611 0.0611 10.7369
26-Dec-08 10.00 1.051 0.1051 0.978 0.0978 11.6828
30-Jan-09 10.00 0.613 0.0613 0.571 0.0571 11.1310
27-Feb-09 10.00 0.526 0.0526 0.489 0.0489 10.9174
30-Mar-09 10.00 0.438 0.0438 0.408 0.0408 10.8148
24-Apr-09 10.00 0.350 0.0350 0.326 0.0326 11.1480
29-May-09 10.00 0.794 0.0794 0.739 0.0739 11.3596
26-Jun-09 10.00 0.794 0.0794 0.739 0.0739 11.3100
31-Jul-09 10.00 0.850 0.0850 0.791 0.0791 11.4229
27-July-07 10.00 1.126 0.1126 1.048 0.1048 11.5658
31-Aug-07 10.00 0.962 0.0962 0.895 0.0895 11.3493
28-Sep-07 10.00 1.133 0.1133 1.054 0.1054 11.5543
26-Oct-07 10.00 1.193 0.1193 1.110 0.1110 11.6241
30-Nov-07 10.00 1.446 0.1446 1.346 0.1346 11.5255
28-Dec-07 10.00 1.145 0.1145 1.066 0.1066 11.7620
25-Jan-08 10.00 1.214 0.1214 1.130 0.1130 11.2126
29-Feb-08 10.00 0.837 0.0837 0.779 0.0779 10.7279
28-Mar-08 10.00 0.666 0.0666 0.620 0.0620 10.3049
25-Apr-08 10.00 0.620 0.0620 0.577 0.0577 10.3476
30-May-08 10.00 0.777 0.0777 0.723 0.0723 10.2064
29-May-09 10.00 0.656 0.0656 0.611 0.0611 10.9059
26-Jun-09 10.00 0.656 0.0656 0.611 0.0611 11.0223
31-Jul-09 10.00 0.828 0.0828 0.770 0.0770 11.2254
30-Jun-99 10.00 20 2.00 - - 26.78
28-Mar-00 10.00 50 5.00 - - 64.44
13-Oct-00 10.00 30 3.00 - - 39.85
09-Mar-01 10.00 20 2.00 - - 33.50
15-Oct-01 10.00 20 2.00 - - 25.70
26-Mar-02 10.00 20 2.00 - - 29.99
30-Oct-02 10.00 10 1.00 - - 26.01
28-Mar-03 10.00 10 1.00 - - 27.00
10-Oct-03 10.00 10 1.00 - - 38.59
22-Mar-04 10.00 30 3.00 - - 42.31
25-Oct-04 10.00 20 2.00 - - 43.02
10-Mar-06 10.00 25 2.50 - - 68.53
30-May-08 10.00 50 5.00 - - 97.61
325 32.50
Birla Sun Life Monthly Income - 30-Nov-07 10.00 1.401 0.1401 1.304 0.1304 11.0995
31-Dec-07 10.00 1.221 0.1221 1.136 0.1136 11.3372
31-Jan-08 10.00 0.750 0.0750 0.698 0.0698 10.8881
29-Feb-08 10.00 0.677 0.0677 0.630 0.0630 10.7070
31-Mar-08 10.00 0.712 0.0712 0.663 0.0663 10.3796
30-Apr-08 10.00 0.668 0.0668 0.622 0.0622 10.4731
30-May-08 10.00 0.786 0.0786 0.731 0.0731 10.3396
30-Jan-09 10.00 2.628 0.2628 2.446 0.2446 10.3982
27-Feb-09 10.00 0.491 0.0491 0.457 0.0457 10.4460
30-Mar-09 10.00 0.438 0.0438 0.408 0.0408 10.4684
29-Apr-09 10.00 1.664 0.1664 1.549 0.1549 10.7674
29-May-09 10.00 0.648 0.0648 0.603 0.0603 10.9353
30-Jun-09 10.00 0.710 0.0710 0.661 0.0661 10.9986
31-Jul-09 10.00 0.731 0.0731 0.681 0.0681 11.1221
Birla Sun Life Monthly Income - 31-Dec-07 10.00 2.856 0.2856 2.658 0.2658 12.2011
31-Mar-08 10.00 2.593 0.2593 2.413 0.2413 11.1765
30-Jun-08 10.00 1.901 0.1901 1.769 0.1769 10.6399
30-Sep-08 10.00 1.380 0.1380 1.284 0.1284 10.4584
31-Dec-08 10.00 2.256 0.2256 2.100 0.2100 10.8938
30-Mar-09 10.00 1.577 0.1577 1.467 0.1467 10.5699
30-Jun-09 10.00 1.577 0.1577 1.467 0.1467 11.5430
Total dividend declared
since inception (Feb 10, 1995) = 325%
Total dividend declared since inception (Oct 12, 1999) = 65%
Monthly Dividend
(Monthly Dividend Plan)
Quarterly Dividend
After payment of dividend, NAV will fall to the extent of the payout and statutory levy, if any. Past performance is no guarantee of future results. 47
Birla Sun Life MIP II - Savings 5 Plan
Birla Sun Life MIP II - Wealth 25 Plan
Birla Sun Life '95 Fund
(Monthly Dividend Plan)
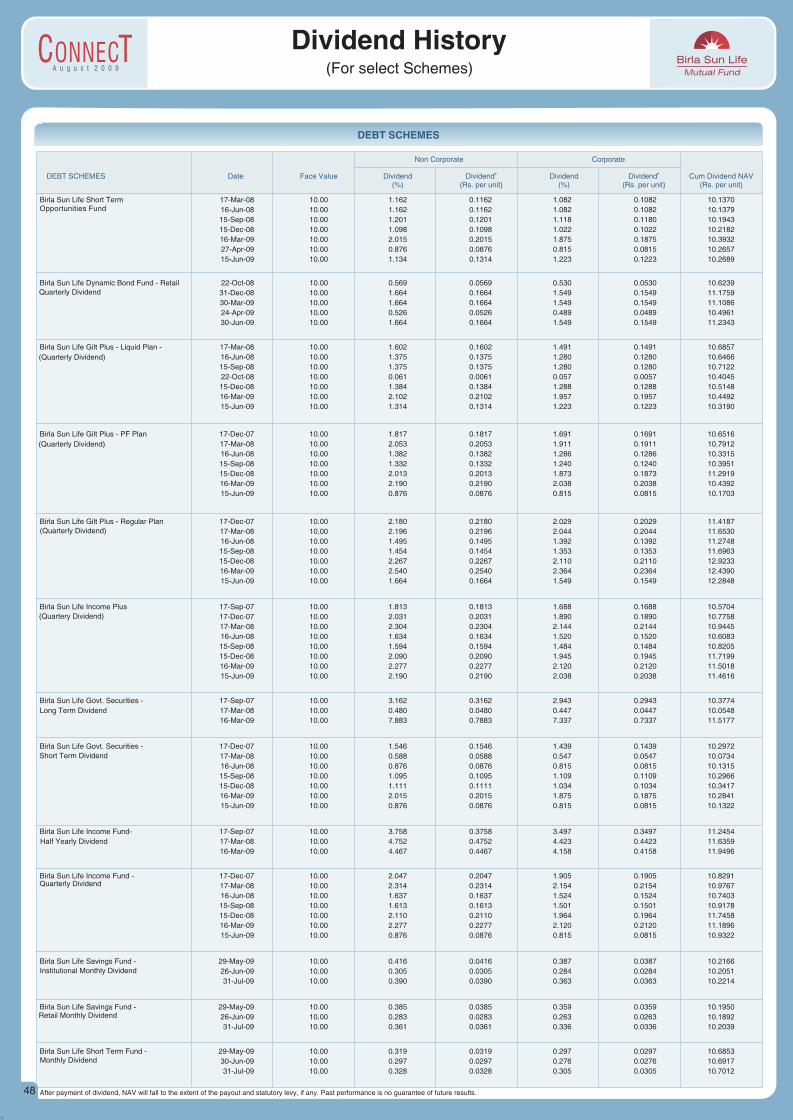
03
A u g u s t 2 0 0 9
Dividend History(For select Schemes)
DEBT SCHEMES
Birla Sun Life Short Term 17-Mar-08 10.00 1.162 0.1162 1.082 0.1082 10.1370
16-Jun-08 10.00 1.162 0.1162 1.082 0.1082 10.1379
15-Sep-08 10.00 1.201 0.1201 1.118 0.1180 10.1943
15-Dec-08 10.00 1.098 0.1098 1.022 0.1022 10.2182
16-Mar-09 10.00 2.015 0.2015 1.875 0.1875 10.3932
27-Apr-09 10.00 0.876 0.0876 0.815 0.0815 10.2657
15-Jun-09 10.00 1.134 0.1314 1.223 0.1223 10.2689
Birla Sun Life Dynamic Bond Fund - Retail 22-Oct-08 10.00 0.569 0.0569 0.530 0.0530 10.6239
31-Dec-08 10.00 1.664 0.1664 1.549 0.1549 11.1759
30-Mar-09 10.00 1.664 0.1664 1.549 0.1549 11.1086
24-Apr-09 10.00 0.526 0.0526 0.489 0.0489 10.4961
30-Jun-09 10.00 1.664 0.1664 1.549 0.1549 11.2343
Birla Sun Life Gilt Plus - Liquid Plan - 17-Mar-08 10.00 1.602 0.1602 1.491 0.1491 10.6857
16-Jun-08 10.00 1.375 0.1375 1.280 0.1280 10.6466
15-Sep-08 10.00 1.375 0.1375 1.280 0.1280 10.7122
22-Oct-08 10.00 0.061 0.0061 0.057 0.0057 10.4045
15-Dec-08 10.00 1.384 0.1384 1.288 0.1288 10.5148
16-Mar-09 10.00 2.102 0.2102 1.957 0.1957 10.4492
15-Jun-09 10.00 1.314 0.1314 1.223 0.1223 10.3190
Birla Sun Life Gilt Plus - PF Plan 17-Dec-07 10.00 1.817 0.1817 1.691 0.1691 10.6516
17-Mar-08 10.00 2.053 0.2053 1.911 0.1911 10.7912
16-Jun-08 10.00 1.382 0.1382 1.286 0.1286 10.3315
15-Sep-08 10.00 1.332 0.1332 1.240 0.1240 10.3951
15-Dec-08 10.00 2.013 0.2013 1.873 0.1873 11.2919
16-Mar-09 10.00 2.190 0.2190 2.038 0.2038 10.4392
15-Jun-09 10.00 0.876 0.0876 0.815 0.0815 10.1703
Birla Sun Life Gilt Plus - Regular Plan 17-Dec-07 10.00 2.180 0.2180 2.029 0.2029 11.4187
17-Mar-08 10.00 2.196 0.2196 2.044 0.2044 11.6530
16-Jun-08 10.00 1.495 0.1495 1.392 0.1392 11.2748
15-Sep-08 10.00 1.454 0.1454 1.353 0.1353 11.6963
15-Dec-08 10.00 2.267 0.2267 2.110 0.2110 12.9233
16-Mar-09 10.00 2.540 0.2540 2.364 0.2364 12.4390
15-Jun-09 10.00 1.664 0.1664 1.549 0.1549 12.2848
Birla Sun Life Income Plus 17-Sep-07 10.00 1.813 0.1813 1.688 0.1688 10.5704
17-Dec-07 10.00 2.031 0.2031 1.890 0.1890 10.7758
17-Mar-08 10.00 2.304 0.2304 2.144 0.2144 10.9445
16-Jun-08 10.00 1.634 0.1634 1.520 0.1520 10.6083
15-Sep-08 10.00 1.594 0.1594 1.484 0.1484 10.8205
15-Dec-08 10.00 2.090 0.2090 1.945 0.1945 11.7199
16-Mar-09 10.00 2.277 0.2277 2.120 0.2120 11.5018
15-Jun-09 10.00 2.190 0.2190 2.038 0.2038 11.4616
Birla Sun Life Govt. Securities - 17-Sep-07 10.00 3.162 0.3162 2.943 0.2943 10.3774
17-Mar-08 10.00 0.480 0.0480 0.447 0.0447 10.0548
16-Mar-09 10.00 7.883 0.7883 7.337 0.7337 11.5177
Birla Sun Life Govt. Securities - 17-Dec-07 10.00 1.546 0.1546 1.439 0.1439 10.2972
17-Mar-08 10.00 0.588 0.0588 0.547 0.0547 10.0734
16-Jun-08 10.00 0.876 0.0876 0.815 0.0815 10.1315
15-Sep-08 10.00 1.095 0.1095 1.109 0.1109 10.2966
15-Dec-08 10.00 1.111 0.1111 1.034 0.1034 10.3417
16-Mar-09 10.00 2.015 0.2015 1.875 0.1875 10.2841
15-Jun-09 10.00 0.876 0.0876 0.815 0.0815 10.1322
Birla Sun Life Income Fund- 17-Sep-07 10.00 3.758 0.3758 3.497 0.3497 11.2454
17-Mar-08 10.00 4.752 0.4752 4.423 0.4423 11.6359
16-Mar-09 10.00 4.467 0.4467 4.158 0.4158 11.9496
Birla Sun Life Income Fund - 17-Dec-07 10.00 2.047 0.2047 1.905 0.1905 10.8291
17-Mar-08 10.00 2.314 0.2314 2.154 0.2154 10.9767
16-Jun-08 10.00 1.637 0.1637 1.524 0.1524 10.7403
15-Sep-08 10.00 1.613 0.1613 1.501 0.1501 10.9178
15-Dec-08 10.00 2.110 0.2110 1.964 0.1964 11.7458
16-Mar-09 10.00 2.277 0.2277 2.120 0.2120 11.1896
15-Jun-09 10.00 0.876 0.0876 0.815 0.0815 10.9322
Birla Sun Life Savings Fund - 29-May-09 10.00 0.416 0.0416 0.387 0.0387 10.2166
26-Jun-09 10.00 0.305 0.0305 0.284 0.0284 10.2051
31-Jul-09 10.00 0.390 0.0390 0.363 0.0363 10.2214
Birla Sun Life Savings Fund - 29-May-09 10.00 0.385 0.0385 0.359 0.0359 10.1950
26-Jun-09 10.00 0.283 0.0283 0.263 0.0263 10.1892
31-Jul-09 10.00 0.361 0.0361 0.336 0.0336 10.2039
Birla Sun Life Short Term Fund - 29-May-09 10.00 0.319 0.0319 0.297 0.0297 10.6853
30-Jun-09 10.00 0.297 0.0297 0.276 0.0276 10.6917
31-Jul-09 10.00 0.328 0.0328 0.305 0.0305 10.7012
Non Corporate Corporate
# DEBT SCHEMES Date Face Value Dividend Dividend Cum Dividend NAV (%) (Rs. per unit) (%) (Rs. per unit) (Rs. per unit)
#Dividend Dividend
Institutional Monthly Dividend
Monthly Dividend
Retail Monthly Dividend
Quarterly Dividend
Quarterly Dividend
(Quarterly Dividend)
(Quarterly Dividend)
Short Term Dividend
Half Yearly Dividend
Opportunities Fund
Long Term Dividend
(Quarterly Dividend)
After payment of dividend, NAV will fall to the extent of the payout and statutory levy, if any. Past performance is no guarantee of future results.48
(Quartery Dividend)
03
A u g u s t 2 0 0 9
Methodology of Ranking
#Value Research Ratings
@ ICRA Mutual Fund Awards 2009 – Ranking Methodology and Disclaimer
+ ICRA mfAAA and mfA1+ Rating Methodology for Birla Sun Life Floating Rate (Short Term & Long Term) and Birla Sun Life Cash Plus Respectively
* AAAf: CRISIL AAAf Rating Methodology for Birla Sun Life Savings Fund, Birla Sun Life Income Plus, Birla Sun Life Cash Manager, Birla Sun Life Income Fund, Birla Sun Life Short Term Fund and Birla Sun Life Dynamic Bond Fund
^^Crisil CPR – Ranking Methodology & Disclaimer
Value Research Fund Ratings are a composite measure of historical risk-adjusted returns. In the case of equity and hybrid funds this rating is based on the weighted average monthly returns for the last 3 and 5-year periods. In the case of debt funds this rating is based on the weighted average weekly returns for the last 18 months and 3-year periods and in case of short-term debt funds - weekly returns for the last 18 months. These ratings do not take into consideration any entry or exit load. Each category must have a minimum of 10 funds for it to be rated. Effective, July 2008, we have put an additional qualifying criteria, whereby a fund with less than Rs 5 crore of average AUM in the past six months will not be eligible for rating.Five-stars indicate that a fund is in the top 10% of its category in terms of historical risk-adjusted returns. Four stars indicate that a fund is in the next 22.5%, middle 35% receive three stars, the next 22.5% are assigned two stars while the bottom 10% receive one star. The number of schemes in each category is mentioned along side the categories name. Equity Diversified (147), Equity : Index (19), Equity Tax Planning (24), Hybrid Equity Oriented (26), Hybrid: Monthly Income (33), Debt: Medium-term (38), Gilt: Medium and Long-term (29), Gilt: Short-term (13), Debt: Ultra Short-term (42), Debt: Ultra Short-term Institutional (45), Debt: Short-term (17), Debt: Floating Rate Short-term (14),Debt: Floating Rate Long-term (10), Hybrid: Debt-oriented (16), Debt: Liquid Plus: (26), Debt: Liquid Plus Institutional:(24). These Fund Ratings are as on July 31, 2009. The Value Research Ratings are published in Monthly Mutual Fund Performance Report and Mutual Fund Insight. The Ratings are subject to change every month. The Rating is based on primary data provided by respective funds, Value Research does not guarantee the accuracy. Source : www.valueresearchonline.com
Birla Sun Life Dynamic Bond Fund – 7-Star Fund in ‘Open Ended Debt - Short Term’ schemes category – 17 Schemes – 1 year performance ended 31 Dec 2008. Birla Sun Life Dividend Yield Plus – 5-Star Fund in ‘Open Ended Diversified Equity - Aggressive’ schemes Category – 51 Schemes – 1 year performance ended 31 Dec 2008. Birla Sun Life MNC Fund – 5-Star Fund in ‘Open Ended Diversified Equity - Aggressive’ schemes Category – 51 Schemes – 1 year performance ended 31 Dec 2008. Birla Sun Life Frontline Equity Fund - 5-Star Fund in the category of ‘Open Ended Diversified Equity - Defensive’ schemes Category – 51 Schemes – 1 year performance ended 31 Dec 2008. Birla Sun Life Frontline Equity Fund – Two 5-Star Fund Rankings both in ‘Open Ended Diversified Equity - Defensive’ schemes Category – 51 and 55 Schemes – 1 and 3 year performance ended 31 Dec 2008 respectively. Birla Sun Life Liquid Plus - Institutional Plan - 5-Star Fund in the category of ‘Open Ended Liquid Plus - Institutional Plan’ schemes Category – 34 Schemes – 1 year performance ended 31 Dec 2008. Birla Sun Life Income Plus - 5-Star Fund in the category of ‘Open Ended Debt – Long Term schemes Category – 21 Schemes – 3 year performance ended 31 Dec 2008. Birla Sun Life Gilt Plus-Regular Plan - 5-Star Fund in the category of ‘Open Ended Gilt’ schemes Category – 21 Schemes – 3 year performance ended 31 Dec 2008. The rank for the schemes is an outcome of an objective and comparative analysis against various parameters, including: risk adjusted return, fund size, company concentration, portfolio turnover and liquidity. 7-Star Fund Rank indicates - Best Performance amongst the 5-Star Funds. 5-Star Fund Rank indicates - Best performance (Top 10% of the category). Entry/Exit Loads not considered. Past Performance is no guarantee of future results. Ranking Source & Publisher: ICRA Online Limited
Birla Sun Life Floating Rate Fund – Short Term Plan & Birla Sun Life Floating Rate Fund – Long Term Plan: The credit risk rating assigned to the schemes is mfAAA. The rating is the highest-credit-quality rating assigned by ICRA to debt funds. Birla Sun Life Cash Plus: The credit risk rating assigned to the scheme is mfA1+. The highest-credit-quality short-term rating assigned by ICRA to debt funds.Rating methodology used by ICRA is based on evaluating the inherent credit quality of the funds portfolio. As a measure of the credit quality of a debt fund’s assets, ICRA uses the concept of ”credit scores”, based on ICRA’s assessment of credit risk associated with each exposure of the portfolio taking into account its maturity, investment objectives and policies, its management characteristics and the creditworthiness of its investment portfolio. ICRA reviews relevant fund information on an ongoing basis to support its published rating opinions. Source: ICRA Ltd.
AAAf The fund’s portfolio holdings provide very strong protection against losses from credit defaults.The credit quality ratings are based on an analysis of the fund’s investment philosophy, its management, investment strategies, operational policies and internal controls. Credit quality incorporates the credit risk of securities and the counter-party risk involved in transactions CRISIL has developed a Credit Quality Matrix to evaluate a bond fund’s overall level of protection against losses associated with credit default. The matrix is a set of credit factors & credit scores derived scientifically from CRISIL’s rating default and transition rates over past ten years. Ranking source: CRISIL FundServices, CRISIL Ltd.
Birla Sun Life Frontline Equity Fund: CRISIL~CPR 1 -In Diversified Equity Scheme Category (72 Schemes). Birla Sun Life Dividend Yield Plus: CRISIL~CPR 2 -In Diversified Equity Scheme Category (72 Schemes). Birla Sun Life Midcap Fund: CRISIL~CPR 2 -In Small & Mid Equity Scheme Category (21 Schemes). Birla Sun Life 95 Fund: CRISIL~CPR 2 -Consistent CPR Performer - Balanced (14 Schemes). Birla Sun Life 95 Fund: CRISIL~CPR 2 -In Hybrid Equity-Oriented Category (18 Schemes). Birla Sun Life Income Plus: CRISIL~CPR 1 - Consistent CPR Performer - Debt (12 Schemes)Birla Sun Life Income Plus: CRISIL~CPR 2 - Income Scheme Category (24 Schemes)Birla Sun Life Short Term Fund - Retail Plan: CRISIL~CPR 1 - Debt Short Term Scheme Category (22 Schemes).Birla Sun Life Cash Plus - Retail Plan: CRISIL~CPR 2 Consistent CPR Performer - Liquid (16 Schemes)Birla Sun Life Gilt Plus - Regular Plan: CRISIL~CPR 2 - Gilt Scheme Category (19 Schemes)Birla Sun Life Savings Fund -Retail Plan: CRISIL~CPR 2 - Ultra Short Term Debt (31 Schemes)Birla Sun Life Savings Fund - Instituitional Plan: CRISIL~CPR 1 - Ultra Short Term Debt - Institutional Scheme Category (19 Schemes)Birla Sun Life Monthly Income: CRISIL~CPR 2 - MIP Conservative Scheme Category (9 Schemes)Birla Sun Life MIP II Fund - Savings 5 Plan: CRISIL~CPR 1 - MIP Conservative Scheme Category (9 Schemes)Birla Sun Life Floating Rate Fund - Long Term Plan: CRISIL~CPR 2 - Ultra Short Term Debt Scheme Category (31 Schemes)
CRISIL~Composite Performance Ranking - (CRISIL~CPR) is the relative performance ranking of mutual fund schemes within the peer group. The criteria used for computing the ranking are AUM in excess of category cut-off limits & portfolio disclosure and performance in case of Liquid Plans, Liquid Institutional and Debt-Short Term – Last 1 years; All other Schemes – Last 2 years and 5 yrs CPR track record for consistent CPR Performers. Fund
Ratings are as on 30 Jun ‘09. Ranking is done on the following parameters depending on scheme category.CRISIL~CPR 1 - indicates “Very Good" performance & ranks within top 10 percentile of the respective category.CRISIL~CPR 2 - indicates “Good" performance & ranks within top 11th - 30th percentile of the respective category.
Ranking Source: Crisil FundServices, CRISIL Limited
Birla Sun Life Mutual Fund: Best Group over 3 years (2005-2008). Group Name - Mixed Asset, Size: 12 fund houses were eligible for the group award. Fund groups with at least five equity, five bond, or three mixed-asset portfolios in the respective asset classes were eligible for a group award. The lowest average decile(1) rank of the three years’ Consistent Return measure of the eligible funds per asset class and group determined the asset class group award winner. Birla Sun Life Asset Allocation Fund-Moderate Plan-Growth (BSLAAF-MP-GR): Best Fund – 3 year performance (2005-2008) No. of Schemes: 7; Classification-Mixed Asset INR Balanced, Birla Sun Life Income Fund-Growth (BSLIF-Gr): Best Fund - 3 year performance (2005-2008) & 10 year performance (1998 – 2008), No. of Schemes: 99 & 16 respectively ; Classification-Bond Indian Rupee-General. BSLAAF-MP-Gr & BSLIF-Gr are awarded Lipper Awards India 2009 on the basis of Consistent Return (Effective Return) value over the relevant performance period. Entry/Exit load not considered. Ranking source: Lipper - A Reuter Co. www.lipperweb.com
Standard & Poor’s A: The fund demonstrates high standards of quality based on its investment process, risk awareness and consistency of performance relative to its own objectives. Ranking Methodology: The Fund has provided consistent, above average, risk-adjusted returns relative to its peers over a three-year period ending December 31, 2006. The Fund is assessed by S&P on basis of quantitative factors viz. historical performance for consistency, discrete period performance comparisons and measurement over 3 discrete twelve-month periods, including 6 month moving average size, turnover, dealing, liquidity of portfolio, gearing, client base, cost, fees and on evaluation of qualitative factors viz. fund management group, portfolio manager and investment team that contributes to long term performance.
& Lipper Awards India 2009 - Award Methodology & Disclaimers:
@@ S & P Fund Management Rating
&&CNBC TV18 - CRISIL Mutual Fund of the Year Award for 2007 & 2008 - Award Methodology & Disclaimer
&&CNBC TV18 - CRISIL Mutual Fund of the Year Award for 2008 - Award Methodology & Disclaimer
Past performance is no guarantee of future results.
Birla Sun Life Mutual Fund, Category - Mutual Fund House of the Year, out of 27 fund houses for 2008 awards and out of 26 fund houses for 2007 awards. Fund Houses winning at least two awards for their schemes in the category level awards for 2008 and 2007 respectively were considered for the award based on consistency of fund house's performance across various scheme categories in the four quarterly CRISIL CPR rankings released during the calendar year 2008 and 2007 respectively. The individual CRISIL CPR ranks for their schemes were aggregated on a weighted average basis to arrive at the final ranks for fund houses in both the years. A detailed methodology of the CRISIL CPR is available at www.crisil.com. Ranking & Award Source: CRISIL Fund Services, CRISIL Ltd. Past performance is no guarantee of future results A detailed methodology of the CRISIL CPR is available at www.crisil.com. Ranking & Award Source: CRISIL Fund Services, CRISIL Ltd.
Birla Sun Life Mutual Fund, Category – Debt Fund House of the Year, out of 27 Fund houses. The award is based on consistency of fund house’s performance across the Gilt, Income, Income – Short, Liquid – Retail, Liquid – Institutional, Liquid – Super Institutional, MIP (Aggressive & Conservative) and Liquid Plus categories in the four quarterly CRISIL CPR rankings released during the calendar year 2008. The individual CRISIL CPR ranks for their schemes were aggregated on a weighted average basis to arrive at the final ranks for fund houses.Birla Sun Life Income Fund (Income Category) 17 schemes: Only Winner.Birla Sun Life Short Term Fund - Retail (Income – Short Term Funds) 15 schemes: Only Winner.Birla Sun Life Gilt Plus – Regular Plan (Gilt Category) 11 schemes: Only Winner.Schemes present in all four quarterly CRISIL CPRs were considered for the award. The award is based on consistency of the scheme’s performance in the four quarterly CRISIL CPR rankings released during the calendar year 2008. The individual CRISIL CPR parameter scores averaged for the four quarters were further multiplied by the parameter weights as per the CRISIL CPR methodology to arrive at the final scores. A detailed methodology of the CRISIL CPR is available at www.crisil.com. A detailed methodology of the CRISIL CPR is available at www.crisil.com. Ranking & Award Source: CRISIL Fund Services, CRISIL Ltd.Past performance is no guarantee of future results
Parameters Scheme CategorySuperior Return Score Large Cap Oriented Equity, Diversified Equity, Small and Midcap, ELSS, Balanced, Debt, MIP
(Aggressive & Conservative), Gilt-Long and Consistent CPR Performers – Equity, Balanced and DebtMean Return and Volatility Debt-Short, Ultra Short Term Debt, Liquid, Liquid Institutional & Liquid Super Institutional and Consistent
CPR Performers - Liquid
Portfolio Concentration Analysis All Schemes
Liquidity Analysis All Schemes
Asset Quality Debt Schemes
Average Maturity Debt Schemes
Downside Risk Probability Debt- Short Term, Liquid, Ultra Short Term Debt, Liquid- Institutional & Super Institutional
Asset Size Debt- Short Term, Liquid, Ultra Short Term Debt, Liquid- Institutional & Super Institutional
Historic performance on CRISIL~CPR Consistent CPR Performer – Equity, Balanced, Debt and Liquid categories
For further details on our Funds, please contact our Customers Service Centres at details given below.
BIRLA SUN LIFE ASSET MANAGEMENT COMPANY LTD. BRANCHES
Disclaimer: Any information contained in this publication does not constitute and shall be deemed not to constitute an advice, an ofaffiliates / sponsors / trustee or their officers, employees, personnel, directors shall not be liable for any loss, damage, liability whatsoever for any direct or indirect loss arising from the use or access of any information that may be displayed in this publication from time to time. Recipients of the information contained herein should exercise due care and caution and read the offer documents (including if necessary, obtaining the advice of tax / legal / accounting / financial / other professionals) prior to taking of any decision, acting or omitting to act, on the basis of the information contained herein.Editorial opinions expressed in the 'Connect' are not necessarily those of BSLAMC. or any of their officers, employees, personnel, directors and BSLAMC. and its officers, employees, personnel, directors do not accept responsibility for the editorial content. BSLAMC. or any of its officers, employees, personnel, directors make no representation as to the accuracy, completeness or reliability of the editorial content and hereby disclaim any liability with regard to the same.
fer to sell/ purchase or as an invitation or solicitation to do so for any securities of any entity, and further, Birla Sun Life Asset Management Company Ltd.(BSLAMC)/ its subsidiaries /
Statutory Details: Constitution: Birla Sun Life Mutual Fund (BSLMF) has been set up as a Trust under the Indian Trust Act, 1882. Sponsors: Aditya Birla Nuvo Limited and Sun Life (India) AMC Investments Inc. (liability restricted to seed corpus of Rs. 1 Lac). Trustee: Birla Sun Life Trustee Company Pvt. Ltd. Investment Manager: Birla Sun Life Asset Management Company Ltd.Risk Factors: Mutual Funds and securities investments are subject to market risks and there can be no assurance or guarantee that the objectives of the Scheme will be achieved. As with any investment in securities, the NAV of the Units issued under the Scheme may go up or down depending on the various factors and forces affecting capital markets and money markets. Past performance of the Sponsor / Investment Manager / Mutual Fund does not indicate the future performance of the Schemes and may not necessarily provide a basis of comparison with other investments. The names of the Schemes do not, in any manner, indicate either the quality of the Schemes or their future prospects or returns. Unitholders in the schemes are not being offered any guaranteed/assured returns. Investors should read the Statement of Additional Information / Scheme Information Document/ Key Information Memorandum available at Investor Service Centers and with distributors carefully before investing. The Material provided in the Connect cannot be reproduced or quoted anywhere without express permission from Birla Sun Life Asset Management Company Ltd.
AHMEDABAD : 079 - 26403553 / 48
ALLAHABAD : 0532 - 2427015 / 3201661
ALWAR : 0145 - 2700126
AMBALA : 0171 - 2601345
AMRAVATI : 0721 - 6451692
ANAND : 02692 - 247260
BANGALURU (Jayanagar) : 080 - 41555000
BANGALURU (Malleswaram) : 080 - 42199223
BANGALURU(Cunningham House Rd) : 080 - 22389991 / 2 / 3
BHAVNAGAR : 0278 - 6452524
BHUBANESHWAR : 0674 - 2535521 / 3413
CALICUT : 0495 - 4021366 / 99
CHANDIGARH : 0172 - 2783556
CHENNAI (Anna Nagar) : 044 - 43016950 / 1 / 2 / 4 / 6
CHENNAI (Egmore) : 044 - 28191681 / 708 / 715 / 699
COCHIN : 0484 - 2366817 / 2383969 / 4021722
COIMBATORE : 0422 - 4350262 / 4
DELHI : 011- 40744514
DHANBAD : 0326 - 2302747 / 8051
DURGAPUR : 0343 - 6454621 / 19 / 3201241
ERODE : 0424 - 4558197 / 8
GUWAHATI : 0361 - 2595020 / 2599273
GWALIOR : 0751 - 6499442 / 378
HUBLI : 0836 - 4259989 / 4266283
JAMMU : 0191 - 2432601
AGRA AJMER AMRITSAR
AURANGABAD BARODA BELGAUM
BHILLAI BHOPAL DEHRADUN
GURGAON HYDERABAD (Abids) INDORE
JABALPUR JAIPUR JALANDHAR
JAMSHEDPUR JODHPUR KANPUR
KOLHAPUR LUCKNOW LUDHIANA
MANGALORE MEERUT MORADABAD
MUMBAI (Borivali) MUMBAI (Ghatkopar) NAGPUR
NASIK PATIALA PUNE
RAIPUR RAJKOT RANCHI
SURAT UDAIPUR VALSAD
VARANASI VASHI VIJAYWADA
VISAG
JAMNAGAR : 0288 - 3200064
KOLKATA : 033 - 22882592 / 4 / 5
KOTA : 0744 - 2366237
MADURAI : 0452 - 4231493 / 83
MANDI GOBINDGARH : 01765 - 250051
MARGAO : 0832 - 6480109
MATHURA 0565 - 3207007 / 6959
MEHASANA : 02762 - 658323 / 16
MUMBAI (Fort) : 022 - 66379839 / 41 / 44 / 12
MUMBAI (Head Office) : 022 - 66928000
MUMBAI (Prabhadevi) : 022 - 6661035 / 36
MYSORE : 0821 - 4244400 / 1 / 2
NOIDA : 0120 - 4203629
PANIPAT : 0180 - 4005660
PANJIM : 0832 - 2437628
PATNA : 0612 - 2323265 / 66
PONDICHERRY : 0413 - 4207997
SALEM : 0427 - 4554431
SILIGURI : 0353 - 2545165
THANE : 022 - 67930660 / 1
TRICHY : 0431 - 2773391 / 2 / 3
TRIVANDRUM : 0471 - 4017007
VAPI : 0260 - 6454735 / 6
VISHAKAPATNAM : 0891 - 6631337 / 8
IDEA Toll Free No. 1800-270-7000 & the centralised TOLL no. 022-66917777
0349

assistance,round the clock.
www.birlasunlife.com/mobile
Online Portfolio Access
www.birlasunlife.com
Mobile Investment Manager
All India Telephone
• View portfolio summary
• View transaction history
• Track your portfolio
• Purchase, Switch & Redeem
• Change TPIN (Telephone Personal Identification Number)
• Get Account Statement instantly
Toll Free : 1-800-22-7000 1-800-270-7000
Non Toll Free : +91 22 6691 7777
(MTNL/BSNL)
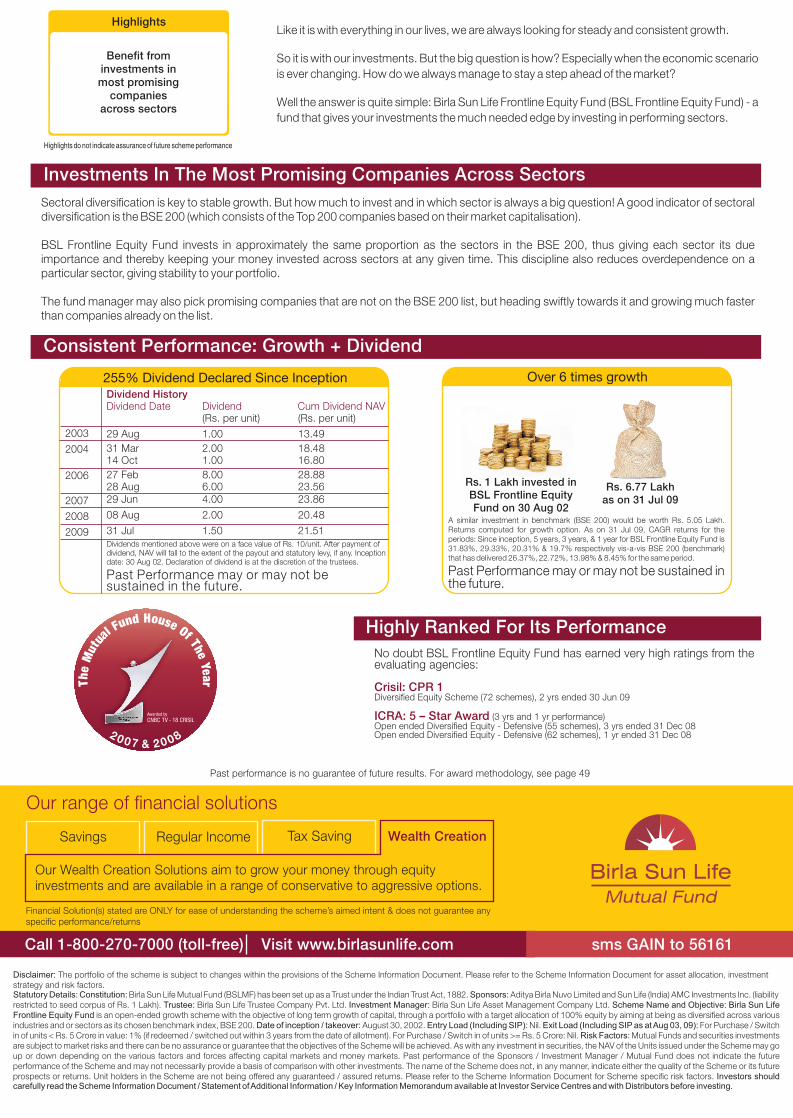
Sectoral diversification is key to stable growth. But how much to invest and in which sector is always a big question! A good indicator of sectoral diversification is the BSE 200 (which consists of the Top 200 companies based on their market capitalisation).
BSL Frontline Equity Fund invests in approximately the same proportion as the sectors in the BSE 200, thus giving each sector its due importance and thereby keeping your money invested across sectors at any given time. This discipline also reduces overdependence on a particular sector, giving stability to your portfolio.
The fund manager may also pick promising companies that are not on the BSE 200 list, but heading swiftly towards it and growing much faster than companies already on the list.
No doubt BSL Frontline Equity Fund has earned very high ratings from theevaluating agencies:
Diversified Equity Scheme (72 schemes), 2 yrs ended 30 Jun 09
(3 yrs and 1 yr performance)Open ended Diversified Equity - Defensive (55 schemes), 3 yrs ended 31 Dec 08Open ended Diversified Equity - Defensive (62 schemes), 1 yr ended 31 Dec 08
Crisil: CPR 1
ICRA: 5 – Star Award
Past performance is no guarantee of future results. For award methodology, see page 49
Consistent Performance: Growth + Dividend
Investments In The Most Promising Companies Across Sectors
Highly Ranked For Its Performance
Disclaimer: The portfolio of the scheme is subject to changes within the provisions of the Scheme Information Document. Please refer to the Scheme Information Document for asset allocation, investment strategy and risk factors.Statutory Details: Constitution: Birla Sun Life Mutual Fund (BSLMF) has been set up as a Trust under the Indian Trust Act, 1882. Sponsors: Aditya Birla Nuvo Limited and Sun Life (India) AMC Investments Inc. (liabilityrestricted to seed corpus of Rs. 1 Lakh). Trustee: Birla Sun Life Trustee Company Pvt. Ltd. Investment Manager: Birla Sun Life Asset Management Company Ltd. Scheme Name and Objective: Birla Sun Life Frontline Equity Fund is an open-ended growth scheme with the objective of long term growth of capital, through a portfolio with a target allocation of 100% equity by aiming at being as diversified across various industries and or sectors as its chosen benchmark index, BSE 200. Date of inception / takeover: August 30, 2002. Entry Load (Including SIP): Nil. Exit Load (Including SIP as at Aug 03, 09): For Purchase / Switch in of units < Rs. 5 Crore in value: 1% (if redeemed / switched out within 3 years from the date of allotment). For Purchase / Switch in of units >= Rs. 5 Crore: Nil. Risk Factors: Mutual Funds and securities investments are subject to market risks and there can be no assurance or guarantee that the objectives of the Scheme will be achieved. As with any investment in securities, the NAV of the Units issued under the Scheme may go up or down depending on the various factors and forces affecting capital markets and money markets. Past performance of the Sponsors / Investment Manager / Mutual Fund does not indicate the future performance of the Scheme and may not necessarily provide a basis of comparison with other investments. The name of the Scheme does not, in any manner, indicate either the quality of the Scheme or its future prospects or returns. Unit holders in the Scheme are not being offered any guaranteed / assured returns. Please refer to the Scheme Information Document for Scheme specific risk factors. Investors should carefully read the Scheme Information Document / Statement of Additional Information / Key Information Memorandum available at Investor Service Centres and with Distributors before investing.
Benefit frominvestments inmost promising
companiesacross sectors
HighlightsLike it is with everything in our lives, we are always looking for steady and consistent growth.
So it is with our investments. But the big question is how? Especially when the economic scenario
is ever changing. How do we always manage to stay a step ahead of the market?
Well the answer is quite simple: Birla Sun Life Frontline Equity Fund (BSL Frontline Equity Fund) - a
fund that gives your investments the much needed edge by investing in performing sectors.
Highlights do not indicate assurance of future scheme performance
255% Dividend Declared Since InceptionDividend History Dividend Date Dividend Cum Dividend NAV
(Rs. per unit) (Rs. per unit)
29 Aug 1.00 13.49
31 Mar 2.00 18.4814 Oct 1.00 16.80
27 Feb 8.00 28.8828 Aug 6.00 23.5629 Jun 4.00 23.86
08 Aug 2.00 20.48
31 Jul 1.50 21.51Dividends mentioned above were on a face value of Rs. 10/unit. After payment of dividend, NAV will fall to the extent of the payout and statutory levy, if any. Inception date: 30 Aug 02. Declaration of dividend is at the discretion of the trustees.
Past Performance may or may not be sustained in the future.
2003
2004
2006
2007
2008
2009
Over 6 times growth
A similar investment in benchmark (BSE 200) would be worth Rs. 5.05 Lakh. Returns computed for growth option. As on 31 Jul 09, CAGR returns for the periods: Since inception, 5 years, 3 years, & 1 year for BSL Frontline Equity Fund is 31.83%, 29.33%, 20.31% & 19.7% respectively vis-a-vis BSE 200 (benchmark) that has delivered 26.37%, 22.72%, 13.98% & 8.45% for the same period.
Past Performance may or may not be sustained in the future.
Hod usnu eF O l fa Tut hu e M Y ee ah rT
2007 &8
020
Awarded by
CNBC TV - 18 CRISIL
Our range of financial solutions
Savings Regular Income Tax Saving Wealth Creation
Our Wealth Creation Solutions aim to grow your money through equity investments and are available in a range of conservative to aggressive options.
Financial Solution(s) stated are ONLY for ease of understanding the scheme’s aimed intent & does not guarantee any specific performance/returns
Rs. 1 Lakh invested inBSL Frontline EquityFund on 30 Aug 02
Rs. 6.77 Lakhas on 31 Jul 09


![Various Investments at the Arabian Cement Company · Various Investments at the Arabian Cement Company WSP | Parsons Brinckerhoff [EBRD] Non-Technical Environmental and Social Summary](https://img.pdfslide.net/doc/110x75/5f0f41187e708231d4433fc2/various-investments-at-the-arabian-cement-company-various-investments-at-the-arabian.jpg)