Embed Size (px)
Citation preview
1
How Does Video Clip Technology Affect Student Motivation and Learning? Valerie Sharritts
St. Francis DeSales High School
Columbus, OH
Keywords Calculus, AP exam, high school students, related rates, video clips, technology, motivation
Abstract In this study, the impact of video clips as an instructional technology to improve student
motivation and learning was examined. Related Rates test scores and AP Calculus AB exam
results from 2009-10 students were used as a control group and similarly 2010-11 students as an
experimental group. Students completed a pre- and post-student survey on attitudes.
Quantitative and qualitative data were collected and analyzed from a variety of sources. Based
on the indicators of change present in the quantitative data and from observations in the
qualitative data, I concluded that video clips improved both student motivation and student
learning.
Table of Contents
Abstract ........................................................................................................................................... 1
Introduction ..................................................................................................................................... 1
What does the Literature Say? ........................................................................................................ 2
How Video Clips were used in My Class ....................................................................................... 6
Results of Data Collected.............................................................................................................. 10
Conclusions ................................................................................................................................... 16
Works Cited .................................................................................................................................. 19
Introduction After more than 25 years of experience as a calculus teacher, I have recently noticed that more
students are eager to earn college credit for calculus or are interested in being exposed to college-
level material prior to their freshman college experience. The state of Ohio‟s Board of Regents
has passed a rule that Ohio students receiving a score of three or better on the Advanced
Placement (AP) exam in any subject must receive college credit for their AP course from any
2
state school. Yet in 2010, 77% of my calculus students taking the AP Calculus AB exam scored
below a three. These results are disappointing for my students and me—my students want to be
able to earn college credit while in high school, and I want more success for my students. I want
them to feel better about the calculus they are learning. I want to provide as many avenues as I
can for them to build their understanding of the material and transition successfully to college.
In July 2010, a former student contacted me about a multimedia program he was using in his
college calculus course. He thought my students would benefit from the program, in particular
the videos that explained in detail specific topics. He reported that the program provided
students with engaging, authentic connections between calculus and their world. Over the years
I have watched my students struggle with problem-solving on particular topics in calculus (for
example, Related Rates). Neither time spent teaching the topic nor the number of problems
reviewed seemed to make much of a difference in how the students tested. Furthermore, my
students have indicated they are motivated when they see real-world connections to calculus.
Since my former student described the problems presented in the multimedia program as great
applications of calculus in the real world and highly motivating to students, I wanted to find out
if using the multimedia program as an instructional intervention would improve my students‟
success in calculus.
The purpose of this study was to determine whether high school junior and senior students
demonstrate a better understanding of and attitude toward calculus as a result of my
implementation of the Multimedia program.
My research questions for this investigation were,
Does the use of videos improve student performance on specific
measures of testing on Related Rates tests and AP exams?
How is student motivation affected by the program?
To answer these questions, I examined differences in AP exam scores between 2009-2010
students (without use of videos) and 2010-2011 students‟ test results after video
use. I also examined qualitative data to determine impact of videos on students‟
attitudes.
What does the Literature Say? According to the 7
th Annual Advanced Placement (AP) Report to the Nation (2010), 12,738
schools administered the Calculus AB exam and 236,502 students took the exam in 2010
(http://apcentral.collegeboard.com/apc/Controller.jpf). Sixty-eight of my seventy students taking
the exam were seniors in my calculus class at St. Francis DeSales High School. My students‟
mean score for the AB exam of 1.714 was below the national mean score of 2.79, which was
slightly less than the global mean score of 2.81. Colleges set their own standard for granting
credit, but often students receiving a score of 3 or higher earn college credit at state institutions.
Sixteen of the 130,264 national students receiving a score of three or higher were my students.
Each college‟s college credit information can be accessed on the AP College Board‟s website at
http://collegesearch.collegeboard.com/apcreditpolicy/index.jsp.
3
Gaps in Student Understanding
Mathematics, a national interest, is an important component in the development of our youths‟
ability to think and provide the necessary leadership for our country (Duncan, 2010), and yet
“[a]lthough national math achievement has improved slightly, too many students still do not have
basic math skill” (Snyder, 2005, p. i). It is important to find out why students struggle in math.
In calculus especially, students tend to struggle with conceptual topics such as related rates
applications (Kay & Kletskin, 2010). In differential calculus, related rates are problem situations
in which the rates at which 2 or more variables change with respect to time. For example, a
related rate problem could involve finding how fast the radius of a balloon changes as the
balloon inflates.
The National Mathematics Advisory Panel (NMAP) acknowledges that “students learn by
building on prior knowledge” and that “learning and development are incremental, processes that
occur gradually and continuously over many years” (NMAP, 2008, pg. 30). One of the reasons
that it is difficult to get students to understand calculus is that their prior knowledge of algebra
seems weak or forgotten, and yet it is well known that students entering into calculus must be
able to “perform algebraic manipulations with ease” (Kay & Kletskin, 2010, p.88).
While identifying specific gaps in student understanding can be challenging, research indicates
that some attributes of students‟ mathematical deficiencies include: 1) missing prior knowledge,
2) negative attitudes regarding math, and 3) inability to cope with varied teaching methods as a
result of different teachers emphasizing different concepts or strategies (Hudson, Kadan, Lavin,
& Vasquez, 2010).
Research shows that learners hold both procedural (know-how) and conceptual (know-why)
knowledge of mathematics. Students who build procedural knowledge without conceptual
knowledge will have resulting errors in their thought process during calculus (Luneta &
Makonye, 2010). These authors found that often “procedural knowledge is taught at the expense
of or before conceptual knowledge” (p. 36). Yet more research is needed to determine the best
way to blend both types of knowledge in classroom instruction.
Student Motivation
While the blending of procedural and conceptual knowledge is critical to mathematical
understanding, the role of student motivation to learn this knowledge cannot be underestimated.
What motivates a student to fix the gaps in his or her knowledge? The NMAP notes that
students‟ “beliefs about learning are also critical” (p. 31), and that these beliefs can be changed.
Two particular reasons why learners develop negative attitudes toward math are a) they do not
see the real world connection with mathematics, and b) they lack confidence in their skills.
Furthermore, students deem cleverness as a necessary quality for understanding math. Students
often equate struggling with mathematics as not being clever which results in lower confidence
according to Hudson, Kadan, Lavin & Vasquez (2010). “Students who have been influenced by
4
To be effective teachers we must be able to utilize “technology and specific
curriculum changes that aim to improve students’ understanding of calculus
concepts, as well as” develop procedural knowledge in ways that are meaningful
to the learner (Bezuidenhout, 1998, p.389)
this mindset feel defeated before they begin” (Hudson et al, p.23). Unfortunately public opinion
in our culture still seems rooted in believing that some people are gifted for mathematics, an
opinion that contributes to students‟ lack of persistence (Hudson et al; NMAP, 2008). A
learner‟s feeling along with this cultural reality seems to be a contributing factor in a student‟s
lack of confidence.
In order to improve students‟ motivation we need to understand today‟s learners. Technology
shows promise as a tool to make real world connections and help students overcome their lack of
confidence. According to Prensky (2001), “today‟s students think and process information
fundamentally differently from their predecessors” (p.1). Students who are in high school today
belong to a generation of Digital Natives (Prensky) for whom computers are a normal part of
their lives. As teachers, we need to be aware of our learners and what best motivates them; for
this generation in particular, technology has the potential to do just that. As Bezuidenhout
(1998) concludes, to be effective teachers we must be able to utilize “technology and specific
curriculum changes that aim to improve students‟ understanding of calculus concepts, as well as”
develop procedural knowledge in ways that are meaningful to the learner (p.389).
Instructional Technology Use in the Classroom
Benefits
Showing video clips as a part of computer instruction can have positive effects on student
achievement and attitude, yet success for students is contingent on the instructional methods used
to implement the technology and emphasis in how the technology is used (Kara & Yesilyurt,
2007).
Students can develop their understanding of mathematical topics if they are challenged to “watch
carefully and engage in mathematical thinking” through the use of video clips (Niess, 2009, p.
36). Homer, Plass, Jan and Blake (2007) looked deeply into what factors have a positive role in
students using video learning effectively. They believe that through using animation and
narration, the students become more socially engaged.
Another argument for the use of multimedia in mathematics instruction is its visual components.
Research shows that “visualization is an important tool in problem solving, and students need
multiple visualization opportunities to fully develop this skill” (Niess & Walker, 2009, p. 36).
These authors emphasize use of video clips as an important part of the students‟ learning
experience and base their findings on the NCTM‟s article on Principles and Standards for
5
School Mathematics. When an instructor actively engages students in the analysis of an event in
a video clip, the instructor provides the opportunity for growth in reasoning skills.
Flexibility and independent learning are also benefits of using video clips within a wireless
network classroom. Flexibility in learning facilitates cooperation between students and teachers,
particularly in an era where flexible, alternative learning settings are encouraged (Bhave, 2002).
In addition to flexibility of scheduling, improvement in students‟ academic achievement occurs
as students learn at their own pace. As students become more active and take ownership of their
learning, they are more conscious of what they know (Kara, & Yesilyurt, 2007). A computer can
“offer a flexible environment that enables students to proceed with their own plans” (Kara, &
Yesilyurt, 2007, p.33).
Problems and Qualifications of Instructional Technology
While technology is clearly shown to offer benefits of engagement, flexibility and improved
learning, its impacts are not always positive. Teachers will need to think about the behavioral
issues they may face when technology is used in the classroom. There may be changes in
classroom etiquette; for example, eye contact with the teacher or media may not be as significant
an indicator that a student is paying attention (Bhave 2002), and it can be more difficult to
determine when a student is on task.
Furthermore, some researchers believe that video lesson presentation is not best suited for
learning because the learner divides visual attention between the slides the speaker is drawing
and the speaker himself. When the videotaped speaker can create a sense of social presence,
then learning by use of videos is more likely to have a positive effect (Homer, Plass, Jan &
Blake, 2007). Despite these challenges, there is still potential for positive academic learning
while using instructional technology (Bhave, 2002).
It is up to instructors to provide the connection between the students‟ questions and the video
being used, because only the live instructor can observe students‟ misconceptions and address
them in order to improve academic achievement (Kara & Yesilyurt, 2007). “Successful delivery
of corrective feedback requires the use of a medium that can analyze a learner‟s response and
provide feedback that directly addresses the nature” of the response of the learner (Reiser, 1994,
p.45).
While I find it easy to agree with Halverson and Smith (2009) that technology can enhance
instructional methods, more research on using video clips within existing practices as well as
developing new methods of instruction needs to take place. The purpose of my classroom
investigation was to examine the use of video clips to determine the impact on the achievement
and motivation of my students.
6
How Video Clips were used in My Class
Starting in the 2009-2010 school year, students at St. Francis De Sales High School were
mandated to take the AP exam if they enrolled in an AP designated course. Prior to 2009, each
student chose whether he or she wanted to take the exam. The new policy meant an increase in
the number of students I must help prepare for the exam and so I was forced to rethink my
strategies for helping students succeed on the AP exam. I needed a better understanding of the
difficulties my students had in learning mathematics, and how I as a single teacher of over 70
students could help them most effectively. My calculus students have excelled in mathematics
thus far, but as research shows, they are not alone in having gaps in their ability to perform
mathematics needed for success in calculus.
After examining the content of the multimedia calculus program and knowing
(through reading the professional literature and observing my students‟ behavior) that technology
affects student engagement and motivation, I decided to use the videos as an added alternative
resource for building students‟ foundational calculus skills. I designated an area in my
classroom for wireless computers, internet access and headphones for students to use throughout
the day. In addition, I used the videos during my classroom instruction as an introduction to or
reinforcement of the concepts I was teaching.
In the interest of student success, the Administrative Staff at St. Francis DeSales
(http://www.stfrancisdesaleshs.org/about-us/mission-core-values) was very supportive of my idea
of using the multimedia program to enhance classroom instruction and developed
the tutorial lab for my calculus students. They provided laptops and headphone sets needed to
pilot the program.
Participants
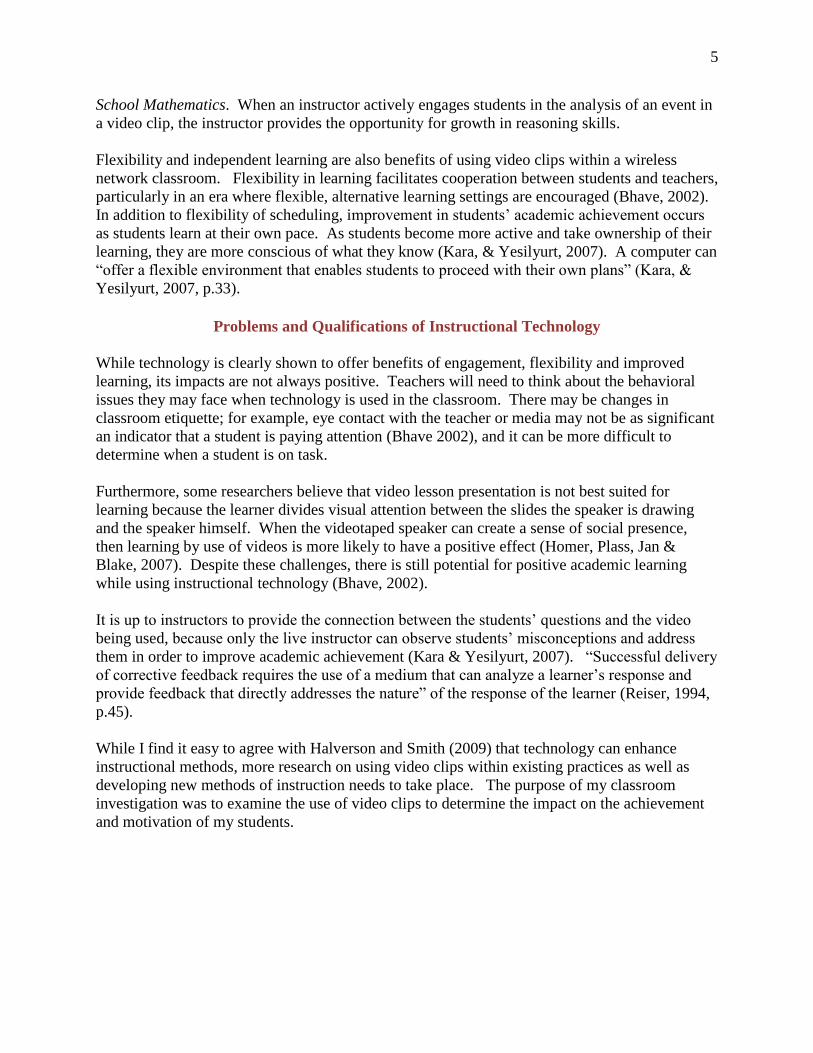
To better understand my students‟ background in this study, it is important to note that the course
content is broken down into three main sections: “A” topics include differential calculus, “B”
topics include integral calculus and “C” topics include material such as sequences and series
(Diagram 1). The students taking the AB course have studied one year of Precalculus and are in
the process of studying differential, “A” topics, and some integral calculus, “B” topics. The
students taking the BC course have studied one year of mathematics that includes Precalculus
and differential calculus, “A” topics. The BC students are continuing to develop their
understanding of differential calculus by delving further into integral calculus, “B” topics, and
going beyond the AB course by studying the “C” topics. These students have the most calculus
experience by the time they take the AP exam.
7
Diagram 1. Shows the integration of topics within courses at DeSales.
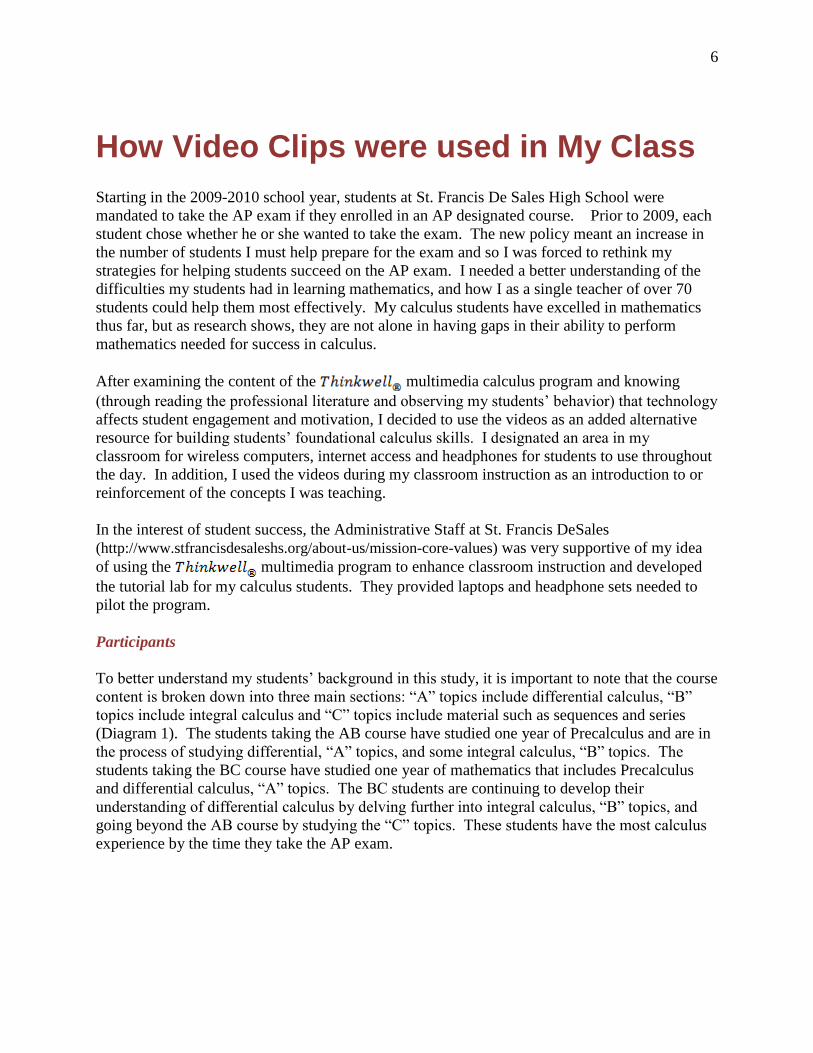
The students who were the focus of this study were those seventy students taking the AP
Calculus AB exam. A majority of those students were from the AB course; the rest with the
exception of one independent study student, are those who were in the BC course but elected to
take the AB exam for various reasons (for example, their desire to focus on the “AB” material,
and the realization they did not need BC credit for their chosen major in college).
Diagram 2. Demonstrates flow of students taking AP Calculus AB exam.
Intervention
I wanted to start using the videos as soon as possible in order to evaluate their effectiveness
within actual classroom lessons. The videos were well done, and I found Edward Burger, the
videos‟ narrator, to be very funny. I found that the supplemental text gave an excellent preview
of the entire lesson, so the instructor could determine whether the specific video is compatible to
their own lesson. I soon felt much more comfortable focusing on when and how to use videos
rather than worrying whether they were reliable.
When I used the videos as an introduction, I followed up with more detailed examples. I
sometimes took what Edward Burger said and incorporated it into my own lesson. For example,
8
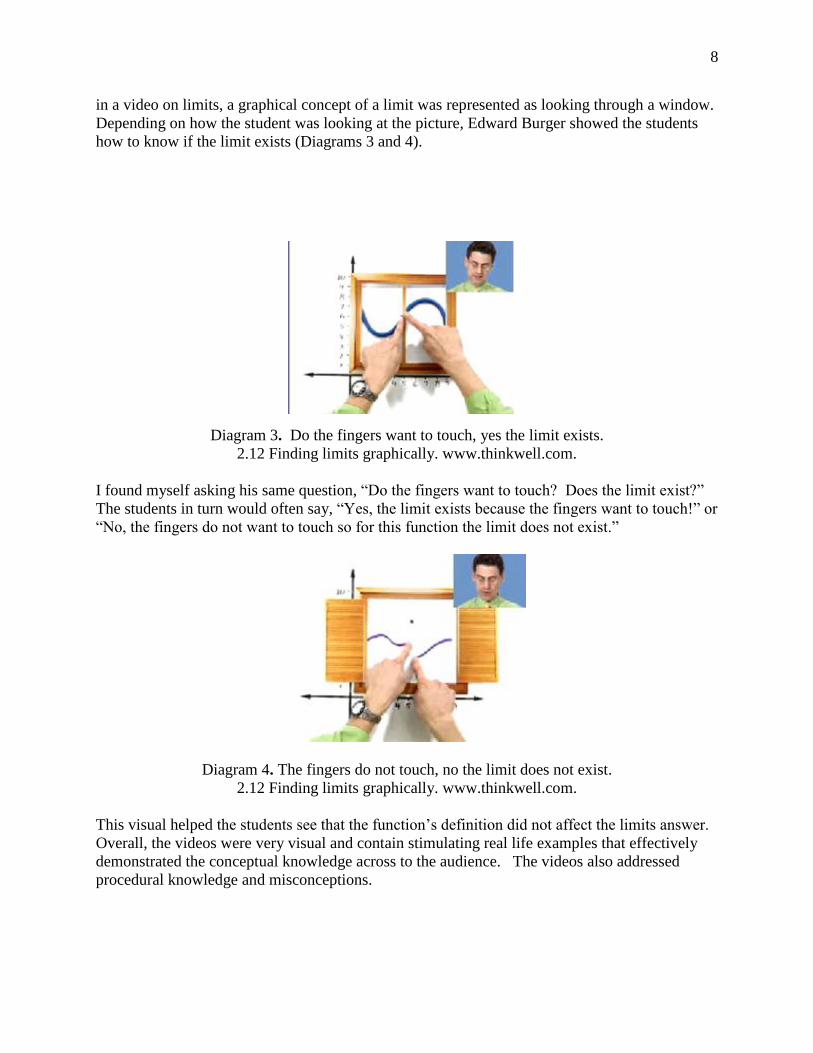
in a video on limits, a graphical concept of a limit was represented as looking through a window.
Depending on how the student was looking at the picture, Edward Burger showed the students
how to know if the limit exists (Diagrams 3 and 4).
Diagram 3. Do the fingers want to touch, yes the limit exists.
2.12 Finding limits graphically. www.thinkwell.com.
I found myself asking his same question, “Do the fingers want to touch? Does the limit exist?”
The students in turn would often say, “Yes, the limit exists because the fingers want to touch!” or
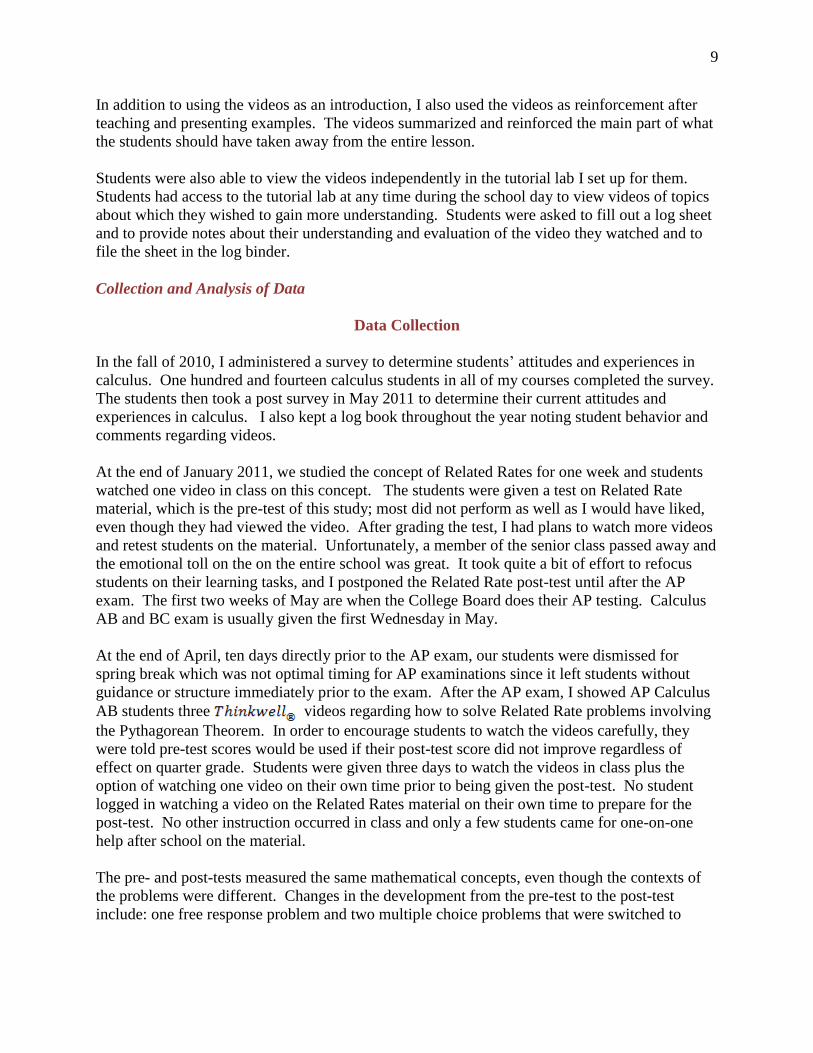
“No, the fingers do not want to touch so for this function the limit does not exist.”
Diagram 4. The fingers do not touch, no the limit does not exist.
2.12 Finding limits graphically. www.thinkwell.com.
This visual helped the students see that the function‟s definition did not affect the limits answer.
Overall, the videos were very visual and contain stimulating real life examples that effectively
demonstrated the conceptual knowledge across to the audience. The videos also addressed
procedural knowledge and misconceptions.
9
In addition to using the videos as an introduction, I also used the videos as reinforcement after
teaching and presenting examples. The videos summarized and reinforced the main part of what
the students should have taken away from the entire lesson.
Students were also able to view the videos independently in the tutorial lab I set up for them.
Students had access to the tutorial lab at any time during the school day to view videos of topics
about which they wished to gain more understanding. Students were asked to fill out a log sheet
and to provide notes about their understanding and evaluation of the video they watched and to
file the sheet in the log binder.
Collection and Analysis of Data
Data Collection
In the fall of 2010, I administered a survey to determine students‟ attitudes and experiences in
calculus. One hundred and fourteen calculus students in all of my courses completed the survey.
The students then took a post survey in May 2011 to determine their current attitudes and
experiences in calculus. I also kept a log book throughout the year noting student behavior and
comments regarding videos.
At the end of January 2011, we studied the concept of Related Rates for one week and students
watched one video in class on this concept. The students were given a test on Related Rate
material, which is the pre-test of this study; most did not perform as well as I would have liked,
even though they had viewed the video. After grading the test, I had plans to watch more videos
and retest students on the material. Unfortunately, a member of the senior class passed away and
the emotional toll on the on the entire school was great. It took quite a bit of effort to refocus
students on their learning tasks, and I postponed the Related Rate post-test until after the AP
exam. The first two weeks of May are when the College Board does their AP testing. Calculus
AB and BC exam is usually given the first Wednesday in May.
At the end of April, ten days directly prior to the AP exam, our students were dismissed for
spring break which was not optimal timing for AP examinations since it left students without
guidance or structure immediately prior to the exam. After the AP exam, I showed AP Calculus
AB students three videos regarding how to solve Related Rate problems involving
the Pythagorean Theorem. In order to encourage students to watch the videos carefully, they
were told pre-test scores would be used if their post-test score did not improve regardless of
effect on quarter grade. Students were given three days to watch the videos in class plus the
option of watching one video on their own time prior to being given the post-test. No student
logged in watching a video on the Related Rates material on their own time to prepare for the
post-test. No other instruction occurred in class and only a few students came for one-on-one
help after school on the material.
The pre- and post-tests measured the same mathematical concepts, even though the contexts of
the problems were different. Changes in the development from the pre-test to the post-test
include: one free response problem and two multiple choice problems that were switched to
10
Related Rate material involving the Pythagorean Theorem. These changes were made because
of the lapse in time and because the review of the videos focused on those applications.
At the end of May during senior exam week, I interviewed six students to try to get a better
understanding of student conceptions and the learning processes they used as a result of watching
the videos. Of the six students I interviewed, I tried to represent a variety: one had done well
with the videos, one had not. Another spoke English as a first language, another was an English
language learner, etc.
Data Analysis
In the data, I was looking for reliable and significant changes in conceptual knowledge and
student attitudes as a result of watching the videos.
First, I wanted to know whether the videos made a difference in student learning of
the concept of Related Rates and also on their AP test scores. A t-test analysis was performed to
determine whether the mean score on the Related Rates test from 2009-2010 AB students was
significantly different from the mean score of the 2010-2011 AB students. Similarly a t-test
analysis was performed to determine if the mean scores of the Related Rates pre and post-test for
the 2010-2011 students changed significantly. A t-test was also conducted in order to determine
if there was significant increase in the AP results for students in the 2010-2011 cohort versus the
2009-2010 year, and whether there was a significant difference in AP scores for those who
watched videos on their own accord versus students who only observed videos as a part of a
class lesson. Additional qualitative evidence for conceptual knowledge came from my
impressions noted in my log book and during interviews with the students.
In looking for changes in student attitudes as a result of watching videos, a t-test
analysis was conducted on the pre- versus post-survey Likert-scale scores to determine if there
were reliable attitude changes for each of the seven questions posed on the survey to all calculus
students. My log book and student interviews served as a source of qualitative data in
describing the change in my students‟ attitudes. The following analysis includes quantitative and
qualitative evidence on conceptual knowledge and student attitudes.
Results of Data Collected
Quantitative Indicators of Students’ Change in Conceptual Understanding
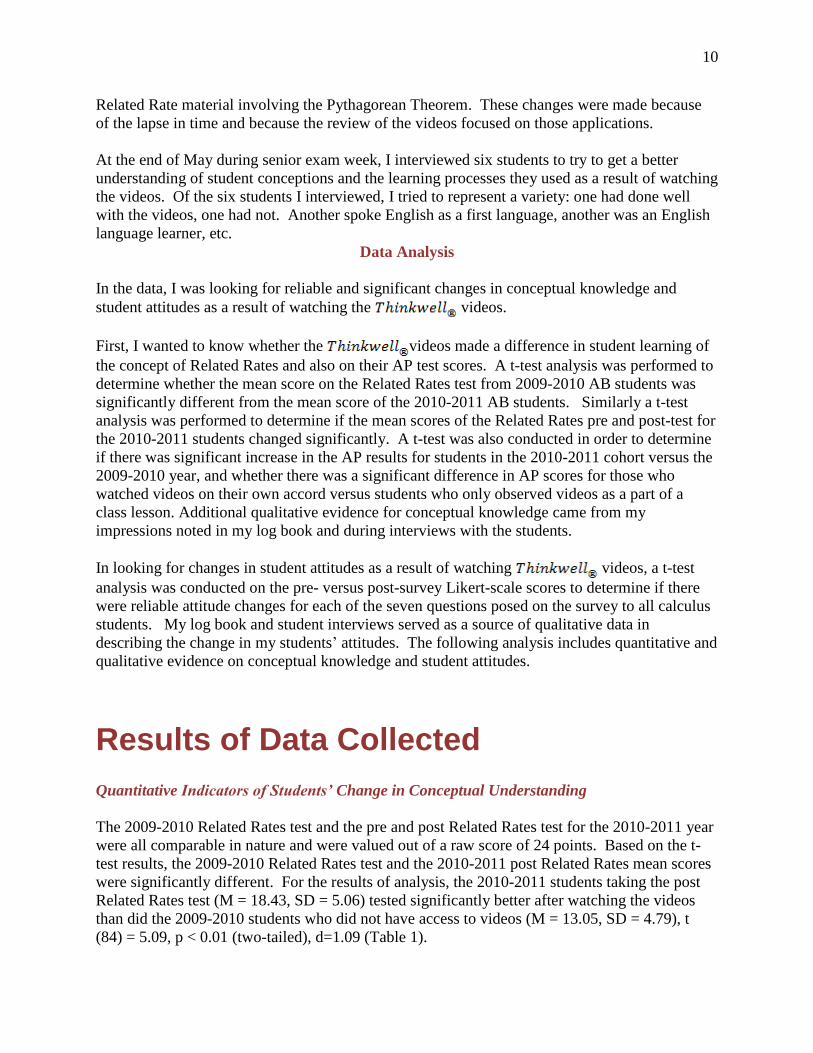
The 2009-2010 Related Rates test and the pre and post Related Rates test for the 2010-2011 year
were all comparable in nature and were valued out of a raw score of 24 points. Based on the t-
test results, the 2009-2010 Related Rates test and the 2010-2011 post Related Rates mean scores
were significantly different. For the results of analysis, the 2010-2011 students taking the post
Related Rates test (M = 18.43, SD = 5.06) tested significantly better after watching the videos
than did the 2009-2010 students who did not have access to videos (M = 13.05, SD = 4.79), t
(84) = 5.09, p < 0.01 (two-tailed), d=1.09 (Table 1).
11
Related Rates t-test 2009-10 (no videos) Post:2010-11 (videos)
Average: 13.05 18.43 % out of 24 54.36 76.77 standard deviation 4.79 5.06 standard error 0.76 0.74
effect size 1.09
Table 1. Related Rates test scores for students in the 2009-2010 and 2010-2011 cohorts.
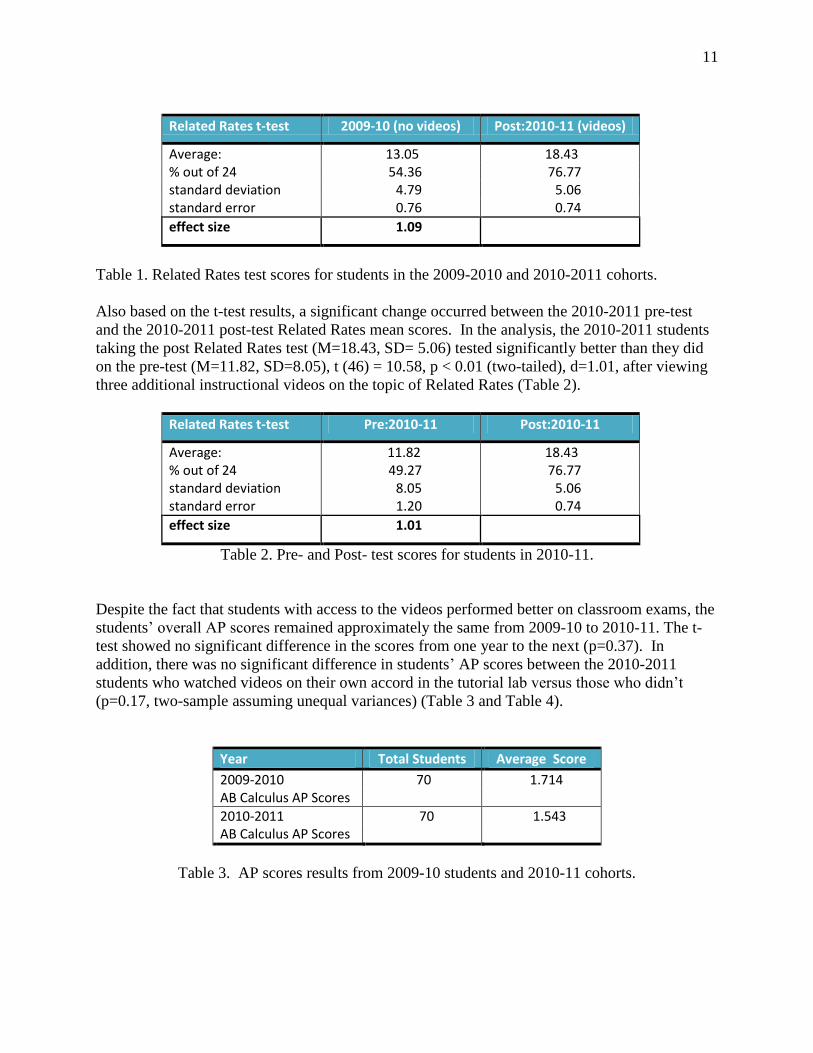
Also based on the t-test results, a significant change occurred between the 2010-2011 pre-test
and the 2010-2011 post-test Related Rates mean scores. In the analysis, the 2010-2011 students
taking the post Related Rates test (M=18.43, SD= 5.06) tested significantly better than they did
on the pre-test (M=11.82, SD=8.05), t (46) = 10.58, p < 0.01 (two-tailed), d=1.01, after viewing
three additional instructional videos on the topic of Related Rates (Table 2).
Related Rates t-test Pre:2010-11 Post:2010-11
Average: 11.82 18.43 % out of 24 49.27 76.77 standard deviation 8.05 5.06 standard error 1.20 0.74
effect size 1.01
Table 2. Pre- and Post- test scores for students in 2010-11.
Despite the fact that students with access to the videos performed better on classroom exams, the
students‟ overall AP scores remained approximately the same from 2009-10 to 2010-11. The t-
test showed no significant difference in the scores from one year to the next (p=0.37). In
addition, there was no significant difference in students‟ AP scores between the 2010-2011
students who watched videos on their own accord in the tutorial lab versus those who didn‟t
(p=0.17, two-sample assuming unequal variances) (Table 3 and Table 4).
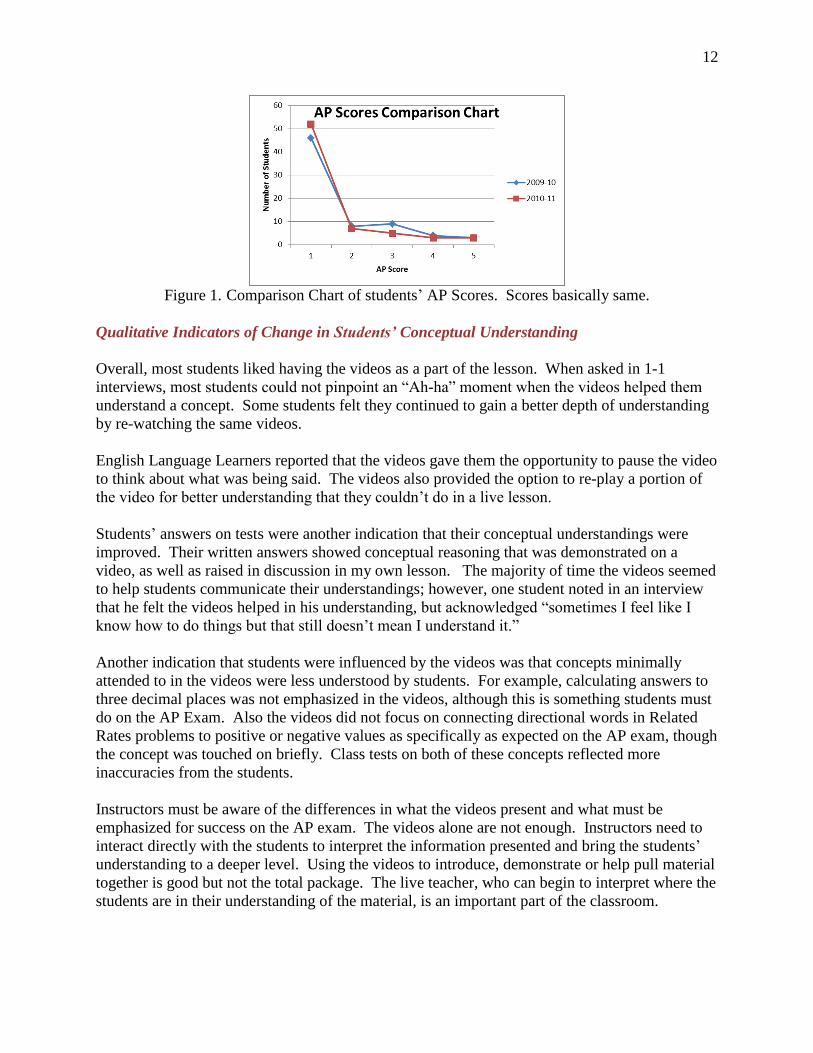
Year Total Students Average Score
2009-2010 70 1.714 AB Calculus AP Scores
2010-2011 70 1.543 AB Calculus AP Scores
Table 3. AP scores results from 2009-10 students and 2010-11 cohorts.
12
Figure 1. Comparison Chart of students‟ AP Scores. Scores basically same.
Qualitative Indicators of Change in Students’ Conceptual Understanding
Overall, most students liked having the videos as a part of the lesson. When asked in 1-1
interviews, most students could not pinpoint an “Ah-ha” moment when the videos helped them
understand a concept. Some students felt they continued to gain a better depth of understanding
by re-watching the same videos.
English Language Learners reported that the videos gave them the opportunity to pause the video
to think about what was being said. The videos also provided the option to re-play a portion of
the video for better understanding that they couldn‟t do in a live lesson.
Students‟ answers on tests were another indication that their conceptual understandings were
improved. Their written answers showed conceptual reasoning that was demonstrated on a
video, as well as raised in discussion in my own lesson. The majority of time the videos seemed
to help students communicate their understandings; however, one student noted in an interview
that he felt the videos helped in his understanding, but acknowledged “sometimes I feel like I
know how to do things but that still doesn‟t mean I understand it.”
Another indication that students were influenced by the videos was that concepts minimally
attended to in the videos were less understood by students. For example, calculating answers to
three decimal places was not emphasized in the videos, although this is something students must
do on the AP Exam. Also the videos did not focus on connecting directional words in Related
Rates problems to positive or negative values as specifically as expected on the AP exam, though
the concept was touched on briefly. Class tests on both of these concepts reflected more
inaccuracies from the students.
Instructors must be aware of the differences in what the videos present and what must be
emphasized for success on the AP exam. The videos alone are not enough. Instructors need to
interact directly with the students to interpret the information presented and bring the students‟
understanding to a deeper level. Using the videos to introduce, demonstrate or help pull material
together is good but not the total package. The live teacher, who can begin to interpret where the
students are in their understanding of the material, is an important part of the classroom.
13
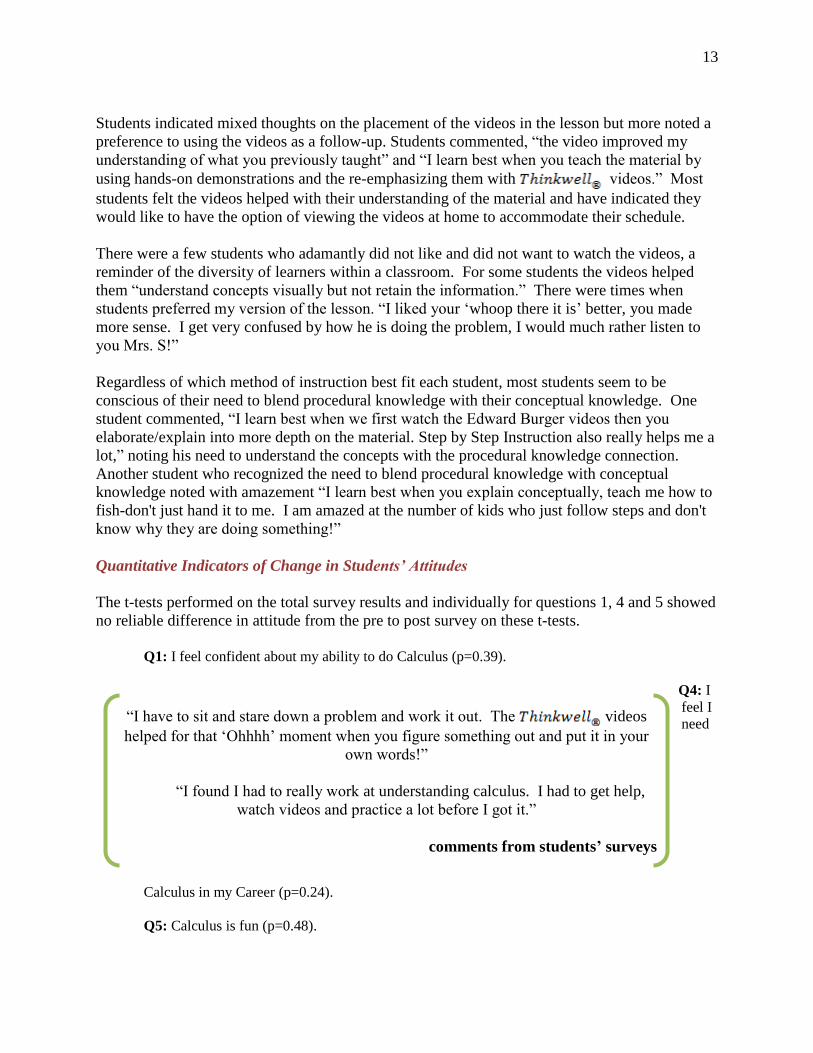
“I have to sit and stare down a problem and work it out. The videos
helped for that „Ohhhh‟ moment when you figure something out and put it in your
own words!”
“I found I had to really work at understanding calculus. I had to get help,
watch videos and practice a lot before I got it.”
comments from students’ surveys
Students indicated mixed thoughts on the placement of the videos in the lesson but more noted a
preference to using the videos as a follow-up. Students commented, “the video improved my
understanding of what you previously taught” and “I learn best when you teach the material by
using hands-on demonstrations and the re-emphasizing them with videos.” Most
students felt the videos helped with their understanding of the material and have indicated they
would like to have the option of viewing the videos at home to accommodate their schedule.
There were a few students who adamantly did not like and did not want to watch the videos, a
reminder of the diversity of learners within a classroom. For some students the videos helped
them “understand concepts visually but not retain the information.” There were times when
students preferred my version of the lesson. “I liked your „whoop there it is‟ better, you made
more sense. I get very confused by how he is doing the problem, I would much rather listen to
you Mrs. S!”
Regardless of which method of instruction best fit each student, most students seem to be
conscious of their need to blend procedural knowledge with their conceptual knowledge. One
student commented, “I learn best when we first watch the Edward Burger videos then you
elaborate/explain into more depth on the material. Step by Step Instruction also really helps me a
lot,” noting his need to understand the concepts with the procedural knowledge connection.
Another student who recognized the need to blend procedural knowledge with conceptual
knowledge noted with amazement “I learn best when you explain conceptually, teach me how to
fish-don't just hand it to me. I am amazed at the number of kids who just follow steps and don't
know why they are doing something!”
Quantitative Indicators of Change in Students’ Attitudes
The t-tests performed on the total survey results and individually for questions 1, 4 and 5 showed
no reliable difference in attitude from the pre to post survey on these t-tests.
Q1: I feel confident about my ability to do Calculus (p=0.39).
Q4: I
feel I
need
Calculus in my Career (p=0.24).
Q5: Calculus is fun (p=0.48).
14
However, the t-tests performed on questions 2, 3 and 7 (below) show at least a reliable yet not
huge difference in the students‟ response from the pre to post survey. The change in attitude on
question 6 was highly reliable and a more evident increase. The student‟s choice of answers was
as follows:
1=Not at all (does not agree)
2=Somewhat (agree a little)
3=Mostly (agree most of the time)
4=Very much (agrees completely)
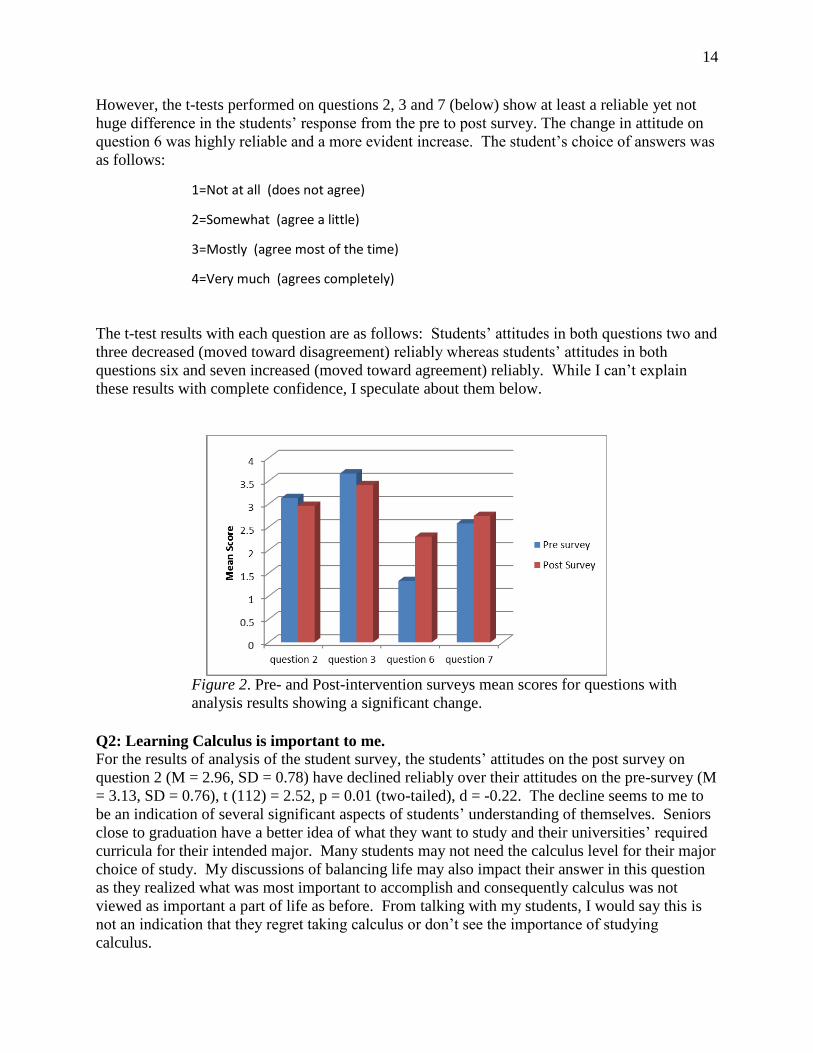
The t-test results with each question are as follows: Students‟ attitudes in both questions two and
three decreased (moved toward disagreement) reliably whereas students‟ attitudes in both
questions six and seven increased (moved toward agreement) reliably. While I can‟t explain
these results with complete confidence, I speculate about them below.
Figure 2. Pre- and Post-intervention surveys mean scores for questions with
analysis results showing a significant change.
Q2: Learning Calculus is important to me.
For the results of analysis of the student survey, the students‟ attitudes on the post survey on
question 2 (M = 2.96, SD = 0.78) have declined reliably over their attitudes on the pre-survey (M
= 3.13, SD = 0.76), t (112) = 2.52, p = 0.01 (two-tailed), d = -0.22. The decline seems to me to
be an indication of several significant aspects of students‟ understanding of themselves. Seniors
close to graduation have a better idea of what they want to study and their universities‟ required
curricula for their intended major. Many students may not need the calculus level for their major
choice of study. My discussions of balancing life may also impact their answer in this question
as they realized what was most important to accomplish and consequently calculus was not
viewed as important a part of life as before. From talking with my students, I would say this is
not an indication that they regret taking calculus or don‟t see the importance of studying
calculus.
15
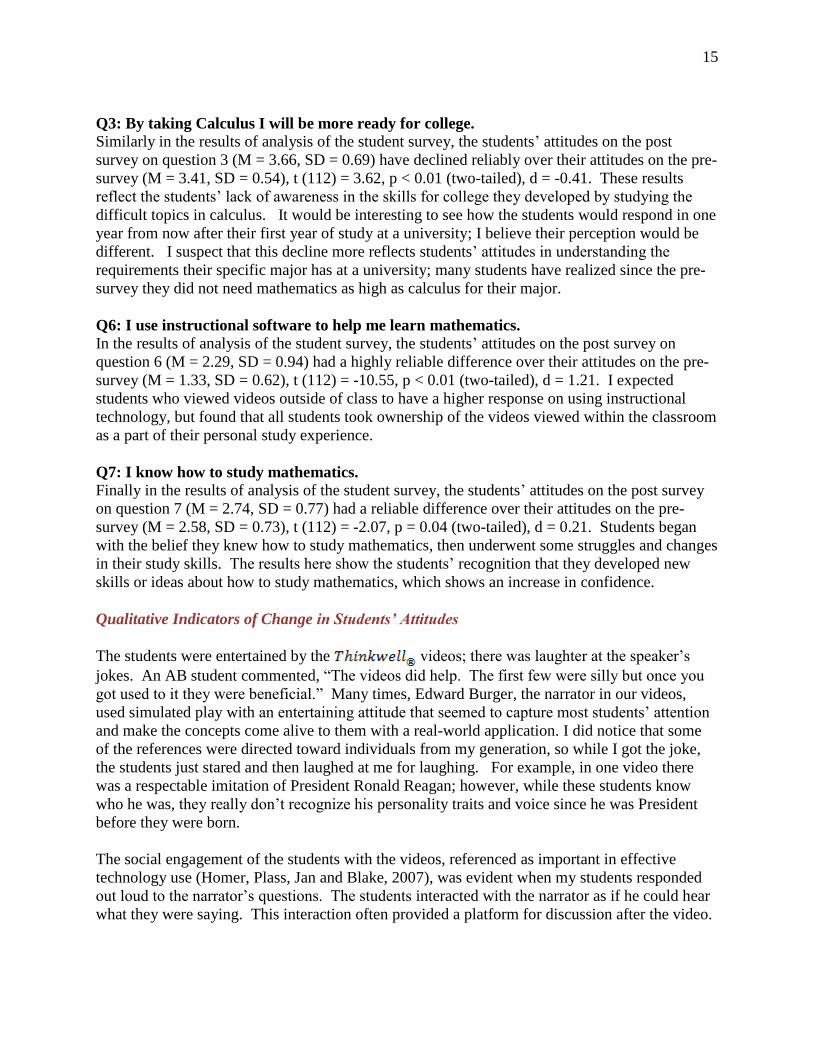
Q3: By taking Calculus I will be more ready for college.
Similarly in the results of analysis of the student survey, the students‟ attitudes on the post
survey on question 3 (M = 3.66, SD = 0.69) have declined reliably over their attitudes on the pre-
survey (M = 3.41, SD = 0.54), t (112) = 3.62, p < 0.01 (two-tailed), d = -0.41. These results
reflect the students‟ lack of awareness in the skills for college they developed by studying the
difficult topics in calculus. It would be interesting to see how the students would respond in one
year from now after their first year of study at a university; I believe their perception would be
different. I suspect that this decline more reflects students‟ attitudes in understanding the
requirements their specific major has at a university; many students have realized since the pre-
survey they did not need mathematics as high as calculus for their major.
Q6: I use instructional software to help me learn mathematics.
In the results of analysis of the student survey, the students‟ attitudes on the post survey on
question 6 (M = 2.29, SD = 0.94) had a highly reliable difference over their attitudes on the pre-
survey (M = 1.33, SD = 0.62), t (112) = -10.55, p < 0.01 (two-tailed), d = 1.21. I expected
students who viewed videos outside of class to have a higher response on using instructional
technology, but found that all students took ownership of the videos viewed within the classroom
as a part of their personal study experience.
Q7: I know how to study mathematics.
Finally in the results of analysis of the student survey, the students‟ attitudes on the post survey
on question 7 (M = 2.74, SD = 0.77) had a reliable difference over their attitudes on the pre-
survey (M = 2.58, SD = 0.73), t (112) = -2.07, p = 0.04 (two-tailed), d = 0.21. Students began
with the belief they knew how to study mathematics, then underwent some struggles and changes
in their study skills. The results here show the students‟ recognition that they developed new
skills or ideas about how to study mathematics, which shows an increase in confidence.
Qualitative Indicators of Change in Students’ Attitudes
The students were entertained by the videos; there was laughter at the speaker‟s
jokes. An AB student commented, “The videos did help. The first few were silly but once you
got used to it they were beneficial.” Many times, Edward Burger, the narrator in our videos,
used simulated play with an entertaining attitude that seemed to capture most students‟ attention
and make the concepts come alive to them with a real-world application. I did notice that some
of the references were directed toward individuals from my generation, so while I got the joke,
the students just stared and then laughed at me for laughing. For example, in one video there
was a respectable imitation of President Ronald Reagan; however, while these students know
who he was, they really don‟t recognize his personality traits and voice since he was President
before they were born.
The social engagement of the students with the videos, referenced as important in effective
technology use (Homer, Plass, Jan and Blake, 2007), was evident when my students responded
out loud to the narrator‟s questions. The students interacted with the narrator as if he could hear
what they were saying. This interaction often provided a platform for discussion after the video.
16
For many students, the videos made examples of real-world problems come alive, and this was
motivational. As one commented, “Real-world topics motivated me to study more because I felt
that‟s how I would apply my math on a daily basis.” More than one student mentioned their
understanding of the Related Rates topic strengthened at some point in watching Edward Burger
demonstrate a problem by throwing a rock into a pond and then performing the math to solve for
the occurring changes. They said the visual representation was very helpful in keeping them
motivated to understand the problem and finally get the concepts.
As the year progressed, the students became more comfortable accessing the tutorial lab. They
quietly slipped into my classroom, put the head phones on and went to work. The tutorial lab
was inviting to students and seemed to provide some students with the motivation to spend more
time studying calculus; four out of five days during the year at lunch, there were approximately
twenty students working on math. Some students who ended up studying weren‟t even from my
classes!
Getting seniors to pay attention and do anything in May, regardless of the methods employed by
the instructor, is difficult. Often throughout the year while watching video clips, students‟
behavior did not appear to demonstrate attention; however, research shows that this behavior
may not necessarily be a lack of attention, but could be a demonstration of how the students in
this technology generation learn. Some students demonstrated boredom or exhaustion by
yawning or falling asleep during a video. Their behavior may also be explained by this student‟s
comment: “I found I used the videos at the beginning of the year and then preferred your
teaching.” While video clips can help learners see the relevance topics have in their own lives,
overuse can, I found, cause them to lose interest.
The survey results showed that frustration in learning impacted the students‟ attitudes in
comments like, “I like calculus, but when something doesn‟t come to me after multiple tries, I
find it hard to push on” and noted in one survey, “Calculus is really hard!” Helping students
persist in solving mathematical situations needs exploration for solutions beyond the use of
technology.
Conclusions
Limitations of the study
A majority of the AB calculus students scored lower than the BC students on the AP Calculus
AB exam, probably because they lacked the experience in calculus that the BC students have
from previous courses. They struggle more with algebraic manipulations and those who score
lower also lack the motivation to engage in calculus at the level they need to in order to derive an
understanding of the material so they can test well. This does not mean they can‟t learn calculus
or learn to be successful. Patience is necessary in order to get students where they need to be and
feel good about what they‟ve learned. There is no one recipe that fits for all classes. Every year
means new students, new difficulties, and new challenges to staying flexible.
17
Two situations that I speculate impacted the students‟ performance on the AP exam include the
loss of a close classmate within a couple of months prior to the AP exam and the occurrence of a
ten day spring break that ended 3 days prior to the exam. With these major challenges, I would
expect these students‟ AP scores to be lower than the previous year, yet the scores remained the
same with the use of video clip being the only additional positive change.
Most calculus students do care about their grades even though they may lack understanding in
how to be persistent. They can be taught to utilize all materials at hand in learning calculus. The
threat of failing rather than the use of instructional videos may have provided some motivation
for improved in-depth study of the material. One senior (female) noted that in the end a group of
the students realized they needed to understand the Related Rate material so they got together
and helped each other out. The Related Rates test results may have also improved due to a
concentrated focus on applications of the Pythagorean Theorem in the types of Related Rates
problems. In addition, students may have processed the material over the months between the
pre and post-test dates which may have also had an effect on the test scores.
It‟s hard to tell exactly how much the videos impacted students‟ understanding of calculus but
the study results clearly show a positive change in students‟ desire to study. At the same time, a
student comment stating “Your personality has made me want to learn calculus!” serves a
reminder to me that motivational improvement involves more than just videos; my
encouragement and providing the opportunity to study was also part of what the students
responded to. The videos were the tool used in making an inviting environment for the students.
In consideration of the students‟ emotional state near the administration of the Related Rates pre-
test, we moved to a different and less intense topic of study and put the post-test for Related
Rates on hold. Also to be noted that with great consideration to the emotional state of the
students the topic of Newton‟s Law of Cooling was later avoided because of the many references
to death; we covered differential equations but not specifically Newton‟s Law of Cooling.
Unfortunately for my students, one of the written problems on 2010-2011 free response was
involving that particular topic; the avoidance of this topic may have directly impeded the
students‟ AP scores from improving from the previous year.
Future directions for the study and teaching
A request to order enough site licenses of the multimedia program so all Calculus
students can access the on-line videos at home along with the other components of the
multimedia program has been made. Over the next few years my students and I will continue to
use the videos and other components of their multimedia program. Also in order to
continue to improve teacher learning and understanding of available technology and thus
enhance student learning, I plan to work with the school administration on expanding use of
videos and online activities for other subjects within mathematics and other departments. In
addition, I would make the following recommendations, which may be applicable to researchers,
and teachers and administrators in many schools.
18
Recommendations
There needs to be continued implementation of various teaching methods that encourage
positive student attitudes and improve student learning. Students appreciate the variety in
instructional methods and resources: As one student stated, “It‟s good to see concepts in
different forms. I needed the videos, you, labs, notes, and the book.” Finding the
instructional methods that blend procedural knowledge with conceptual knowledge while
using technology is important. Be open to students suggestions, they usually have some
idea of what works for them.
More pre-video versus post-video data on calculus topics need to be collected in order to
help determine effective technology use, especially for those students who are English
Language Learners. Are the videos more effective with female learners versus male
learners? What part of increased motivation do video clips play as instructors motivate
learners to create solid algebraic skills?
Instructors need to continue to search for resources that include budget friendly video-
clips and research the effects on student learning. Teachers, along with school libraries,
public libraries and students, could compile resources that students can access to study.
Teachers must find and share successful ways to hold students accountable for what they
watch and what they learn and in an environment that‟s inviting to participate. Kay and
Kletskin found “the impact of mini-clips and written documentation appears to be
complementary” (2010).
Teachers cannot be afraid to try to use technology in the classroom. It may not always
work but in order to use technology effectively one must become comfortable with using
it and know the issues that may arise which only come with experience. And students
can help teachers learn about technology. Students are great leaders when given the
opportunity!
While I didn‟t get the results of the AP scores that I was hoping for, I believe that in the journey
my students‟ learning reaped many rewards. I saw many students take ownership of their
learning, examine their own study skills, question their procedural and conceptual knowledge
and make changes to improve. And from my own teacher‟s standpoint, I believe there is need
for future research on effective use of video clips to impact academic testing. I encourage others
to examine their own practices and find how video clips can be used to improve student learning!
I‟m looking forward to exploring the videos and multimedia program further and
extending their use within my school.
19
Works Cited
Bezuidenhout, J. (1998). First-year university students‟ understanding of rate of change.
International Journal of Mathematics Education in Science and Technology,19(3), 389-399.
Bhave, M. P. (2002). Classrooms with wi-fi, a challenge for teacher control and a revolution in
learning. T.H.E. Journal,17-23.
Duncan, A. (2010). Transforming American education: Learning powered by technology. U.S.
Department of Education, Office of Educational Technology Washington, D.C.
Halverson, R. & Smith, A. (2009). How new technologies have (and have not) changed teaching
and learning in schools. Journal of Computing in Teacher Education, 26(2), 49-54.
Homer, B.D., Plass, Jan L., & Blake, L. (2008). The effects of video on cognitive load and social
presence in multimedia-learning. Computers in Human Behavior, 14, 786-797.
Hudson, S., Kadan, S., Lavin, K. & Vasquez, T. (2010). Improving basic math skills using
technology. An Action Research Project submitted to the Graduate Faculty of the School of
Education at Saint Xavier University Masters of Arts in Teaching and Leadership Program, ii,
29-33.
Kay, R & Kletskin, I. (2010) Evaluating the use of learning objects for improving calculus
readiness. JI. of Computers in Mathematics and Science Teaching,29(1), 87-104
Kara, Y., & Yesilyurt, S. (2007). Comparing the impacts of tutorial and edutainment software
programs on students‟ achievements, misconceptions, and attitudes towards biology. Journal of
Science Education & Technology, 17,32-41. doi:10.1007/s10956-007-9077-z
Luneta, K. & Makonye, P. (2010). Learner errors and misconceptions in elementary analysis: A
case study of a grade 12 class in South Africa. Acta Didactica Napocensia, 3, 35-45.
National Mathematics Advisory Panel. (2008) Foundations for Success: The Final Report of the
National Mathematics Advisory Panel, U.S. Department of Education: Washington, DC.
Niess, M., & Walker, J. (2009). This rock „n‟ roll video teaches math. Learning & Leading with
Technology, June/July, 36-37.
Prensky, M. (2001). Digital natives, digital immigrants. On the Horizon, MCB University Press,
9(5), 1-6.
Reiser, R. A. (1994). Clark‟s invitation to the dance: An instructional designer‟s response.
Educational Technology Research and Development, 42(2), 45-48,
http://www.jstor.org/stable/30218687

20
Snyder, T. (2005) Foundation & evidence of effectiveness for fastt math Tom Snyder
Productions, Inc..Research. Scholastic Research Results, 1-15