Embed Size (px)
Citation preview
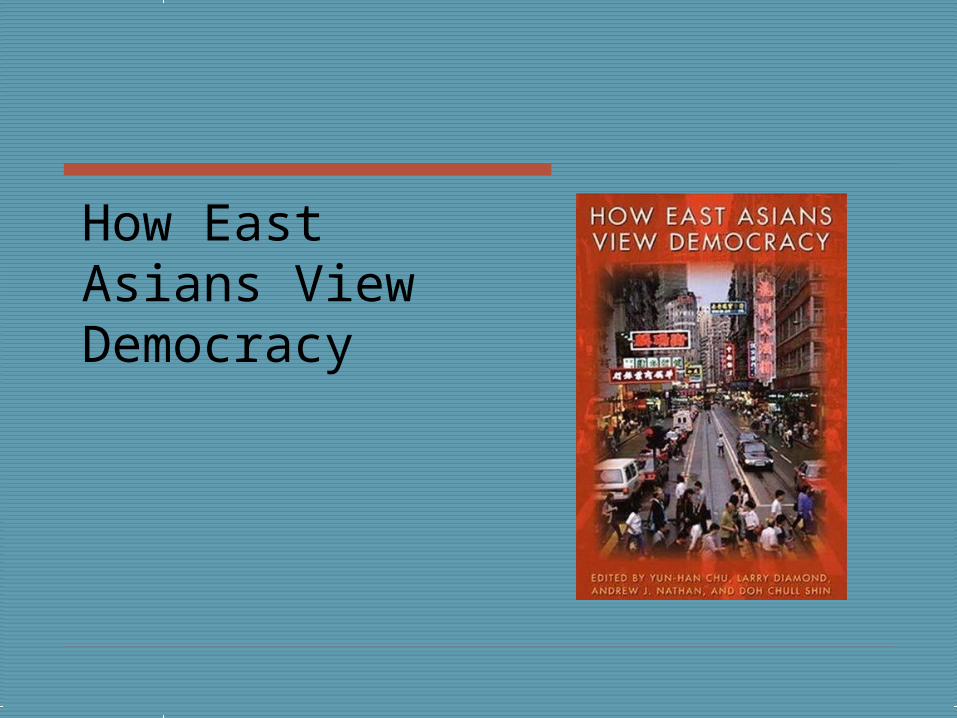
How East Asians View Democracy
First systematic comparative survey of attitudes and values toward politics, governance, democracy and reform, and citizens’ political actions in East Asia
Standardized survey instruments designed around a common research framework
Federated country-team structure, coordinated by Yun-han Chu, National Taiwan University, with international steering committee
Funded by Taiwan Ministry of Education, Henry Luce Foundation, World Bank, foundations in some of the countries, and other sources
Allows for nested comparisons: three Chinese societies, five “Confucian” societies, developed/developing, democratic/non-democratic; within-society educational, gender, occupational, ethnic, religious, and other groups
Later changed its name to Asian Barometer Surveys. Web address: www.asianbarometer.org
East Asia BarometerA Comparative Survey of Democratization and Value Change, 2001-2003
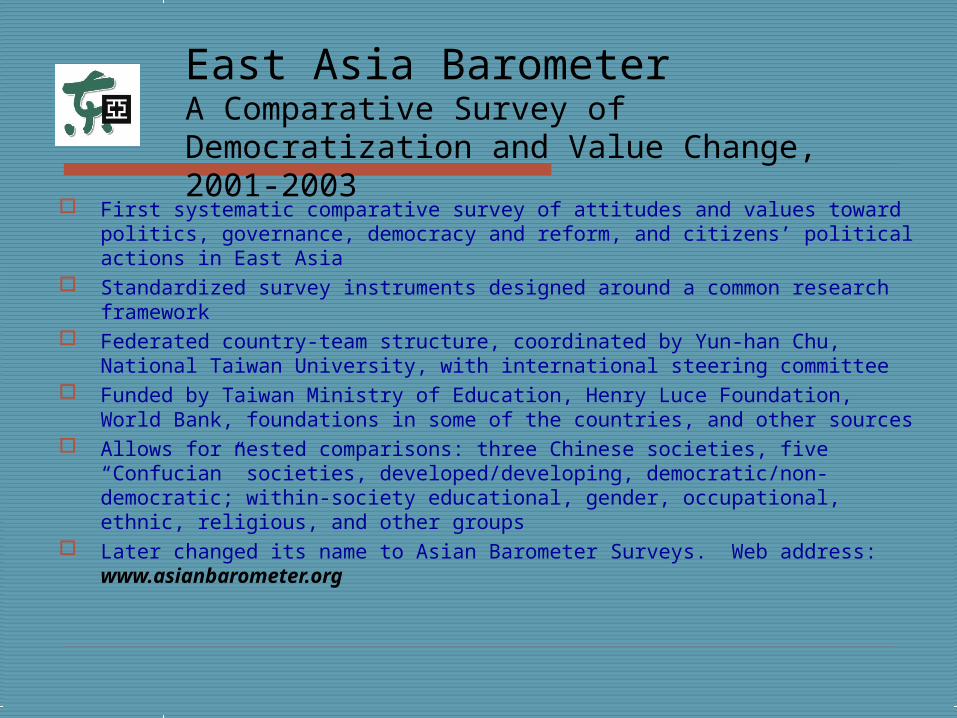
Table 1.2a Survey Schedules and Sample Sizes of First Wave EAB
Data release form
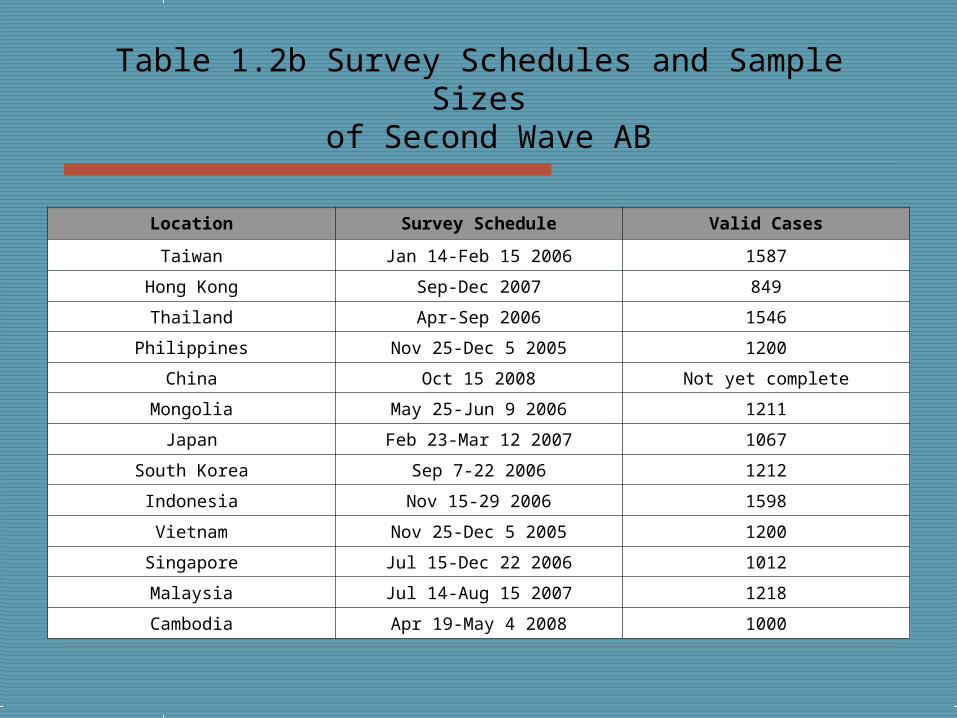
Table 1.2b Survey Schedules and Sample Sizes of Second Wave AB
Location Survey Schedule Valid Cases
Taiwan Jan 14-Feb 15 2006 1587
Hong Kong Sep-Dec 2007 849
Thailand Apr-Sep 2006 1546
Philippines Nov 25-Dec 5 2005 1200
China Oct 15 2008 Not yet complete
Mongolia May 25-Jun 9 2006 1211
Japan Feb 23-Mar 12 2007 1067
South Korea Sep 7-22 2006 1212
Indonesia Nov 15-29 2006 1598
Vietnam Nov 25-Dec 5 2005 1200
Singapore Jul 15-Dec 22 2006 1012
Malaysia Jul 14-Aug 15 2007 1218
Cambodia Apr 19-May 4 2008 1000
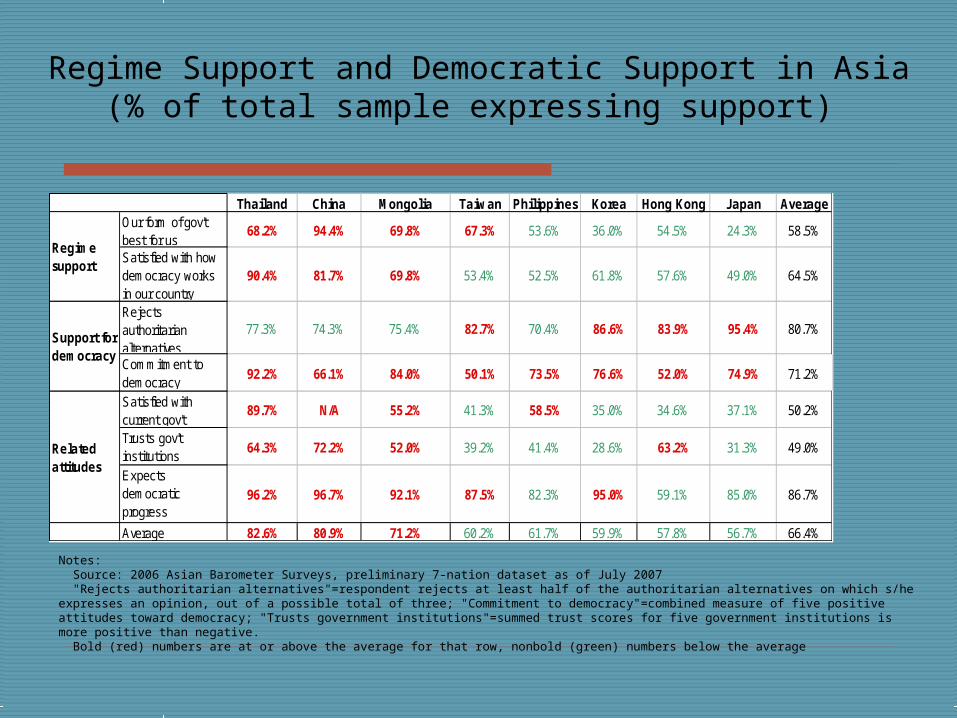
Thailand China Mongolia Taiwan Philippines Korea Hong Kong Japan AverageOur form of gov'tbest for us
68.2% 94.4% 69.8% 67.3% 53.6% 36.0% 54.5% 24.3% 58.5%
Satisfied with howdemocracy worksin our country
90.4% 81.7% 69.8% 53.4% 52.5% 61.8% 57.6% 49.0% 64.5%
Rejectsauthoritarianalternatives
77.3% 74.3% 75.4% 82.7% 70.4% 86.6% 83.9% 95.4% 80.7%
Commitment todemocracy
92.2% 66.1% 84.0% 50.1% 73.5% 76.6% 52.0% 74.9% 71.2%
Satisfied withcurrent gov't
89.7% N/A 55.2% 41.3% 58.5% 35.0% 34.6% 37.1% 50.2%
Trusts gov'tinstitutions
64.3% 72.2% 52.0% 39.2% 41.4% 28.6% 63.2% 31.3% 49.0%
Expectsdemocraticprogress
96.2% 96.7% 92.1% 87.5% 82.3% 95.0% 59.1% 85.0% 86.7%
Average 82.6% 80.9% 71.2% 60.2% 61.7% 59.9% 57.8% 56.7% 66.4%
Regimesupport
Support fordemocracy
Relatedattitudes
Regime Support and Democratic Support in Asia(% of total sample expressing support)
Notes: Source: 2006 Asian Barometer Surveys, preliminary 7-nation dataset as of July 2007 "Rejects authoritarian alternatives"=respondent rejects at least half of the authoritarian alternatives on which s/he expresses an opinion, out of a possible total of three; "Commitment to democracy"=combined measure of five positive attitudes toward democracy; "Trusts government institutions"=summed trust scores for five government institutions is more positive than negative. Bold (red) numbers are at or above the average for that row, nonbold (green) numbers below the average
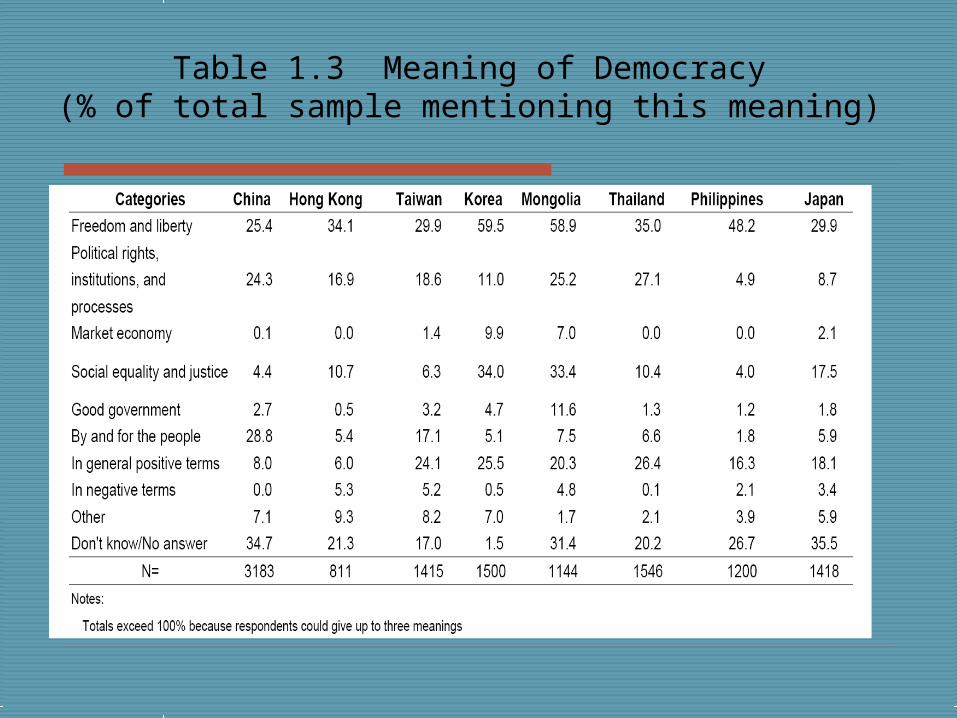
Table 1.3 Meaning of Democracy (% of total sample mentioning this meaning)
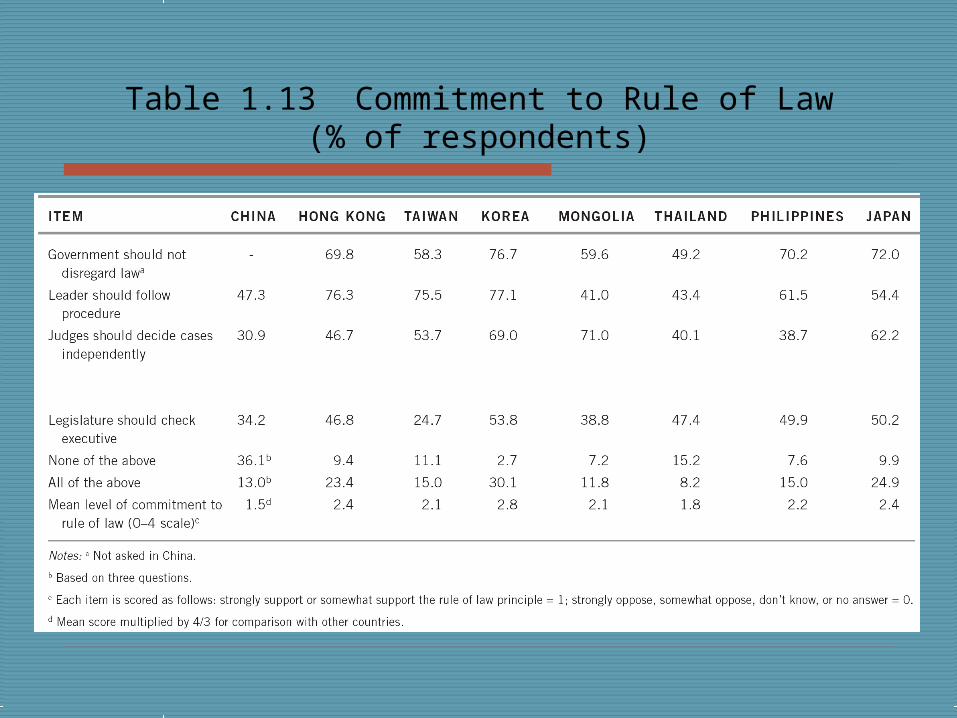
Table 1.13 Commitment to Rule of Law(% of respondents)
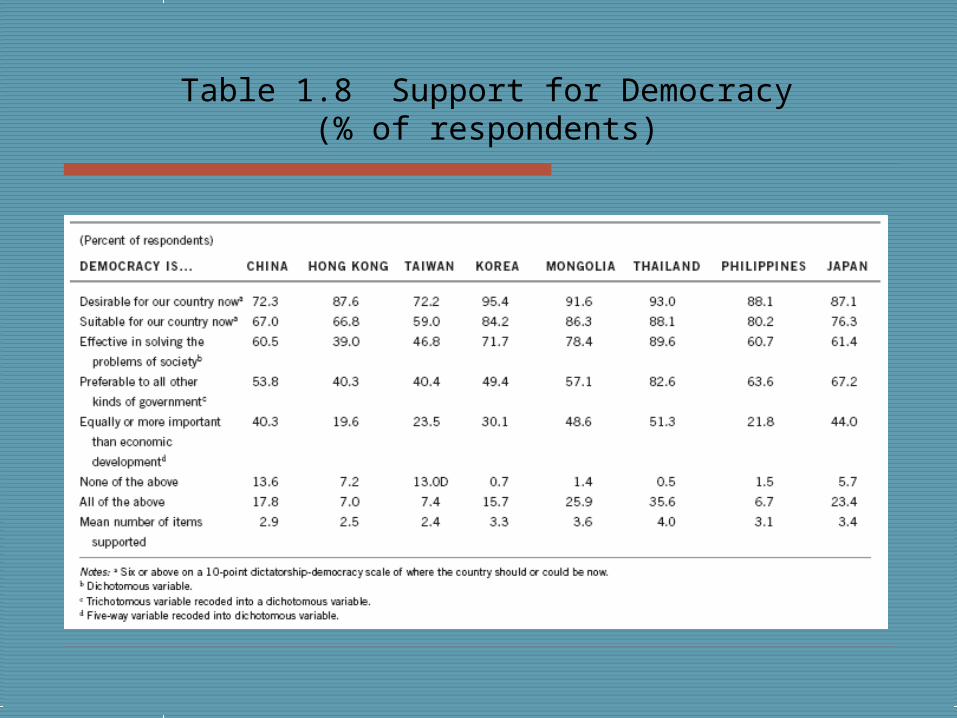
Table 1.8 Support for Democracy(% of respondents)
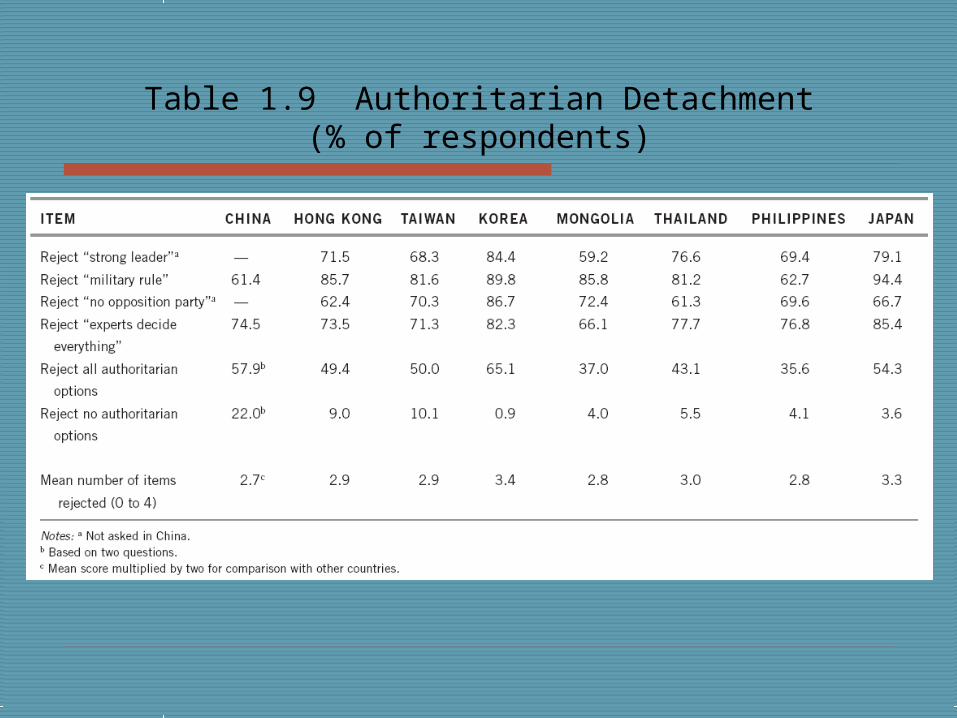
Table 1.9 Authoritarian Detachment(% of respondents)
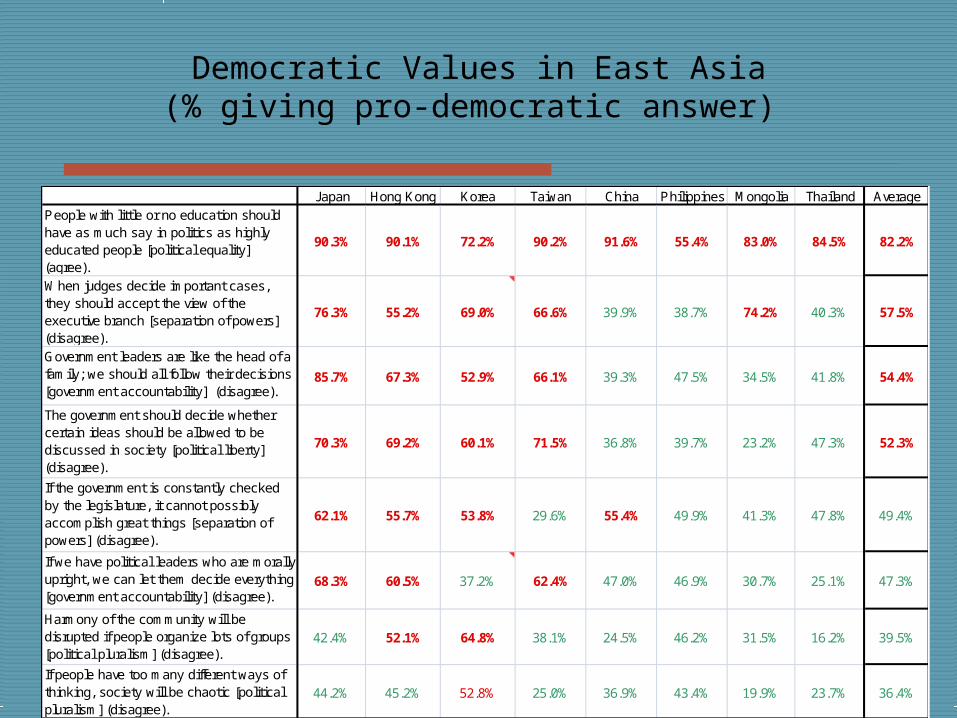
Japan Hong Kong Korea Taiwan China Philippines Mongolia Thailand AveragePeople with little or no education should have as much say in politics as highly educated people [political equality] (agree).
90.3% 90.1% 72.2% 90.2% 91.6% 55.4% 83.0% 84.5% 82.2%
When judges decide important cases, they should accept the view of the executive branch [separation of powers] (disagree).
76.3% 55.2% 69.0% 66.6% 39.9% 38.7% 74.2% 40.3% 57.5%
Government leaders are like the head of a family; we should all follow their decisions [government accountability] (disagree).
85.7% 67.3% 52.9% 66.1% 39.3% 47.5% 34.5% 41.8% 54.4%
The government should decide whether certain ideas should be allowed to be discussed in society [political liberty] (disagree).
70.3% 69.2% 60.1% 71.5% 36.8% 39.7% 23.2% 47.3% 52.3%
If the government is constantly checked by the legislature, it cannot possibly accomplish great things [separation of powers] (disagree).
62.1% 55.7% 53.8% 29.6% 55.4% 49.9% 41.3% 47.8% 49.4%
If we have political leaders who are morally upright, we can let them decide everything [government accountability] (disagree).
68.3% 60.5% 37.2% 62.4% 47.0% 46.9% 30.7% 25.1% 47.3%
Harmony of the community will be disrupted if people organize lots of groups [political pluralism] (disagree).
42.4% 52.1% 64.8% 38.1% 24.5% 46.2% 31.5% 16.2% 39.5%
If people have too many different ways of thinking, society will be chaotic [political pluralism] (disagree).
44.2% 45.2% 52.8% 25.0% 36.9% 43.4% 19.9% 23.7% 36.4%
Average percent democratic 67.4% 61.9% 57.9% 56.2% 46.4% 46.0% 42.3% 40.8% 52.4%
Democratic Values in East Asia(% giving pro-democratic answer)
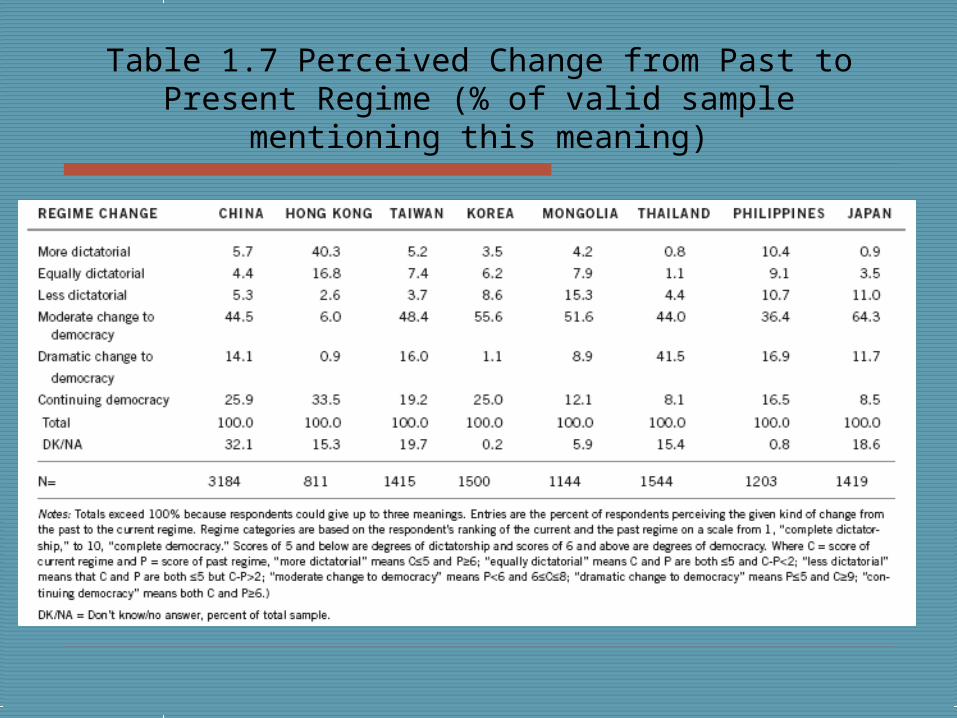
Table 1.7 Perceived Change from Past to Present Regime (% of valid sample mentioning this meaning)
Democraticperformance
Policyperformance
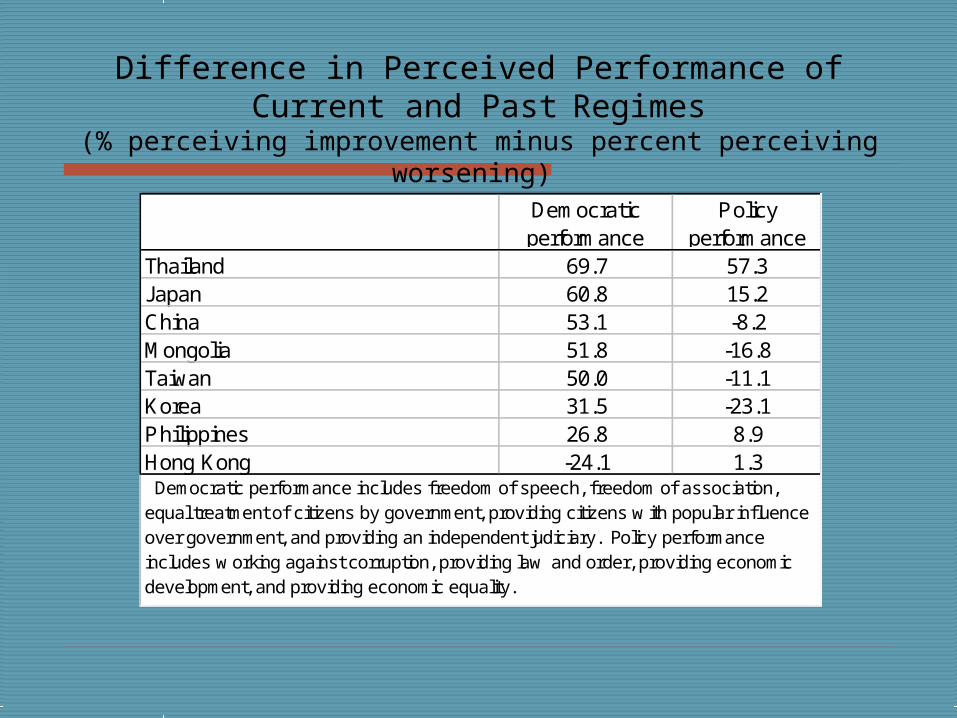
Thailand 69.7 57.3Japan 60.8 15.2China 53.1 -8.2Mongolia 51.8 -16.8Taiwan 50.0 -11.1Korea 31.5 -23.1Philippines 26.8 8.9Hong Kong -24.1 1.3 Democratic performance includes freedom of speech, freedom of association,equal treatment of citizens by government, providing citizens w ith popular inf luenceover government, and providing an independent judiciary. Policy performanceincludes w orking against corruption, providing law and order, providing economicdevelopment, and providing economic equality.
Difference in Perceived Performance of Current and Past Regimes
(% perceiving improvement minus percent perceiving worsening)
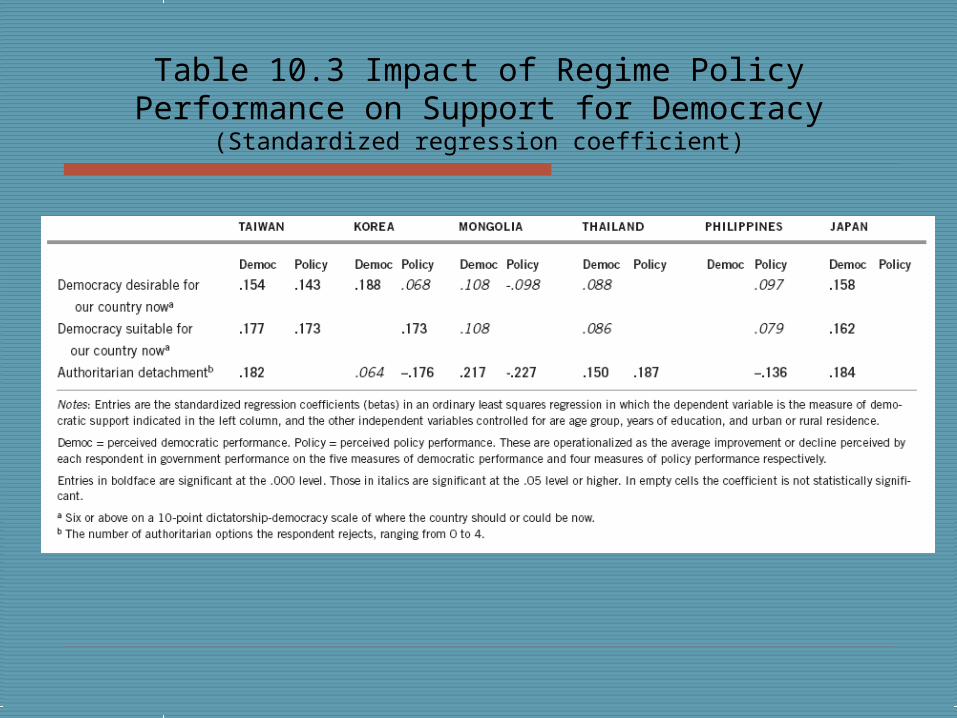
Table 10.3 Impact of Regime Policy Performance on Support for Democracy
(Standardized regression coefficient)
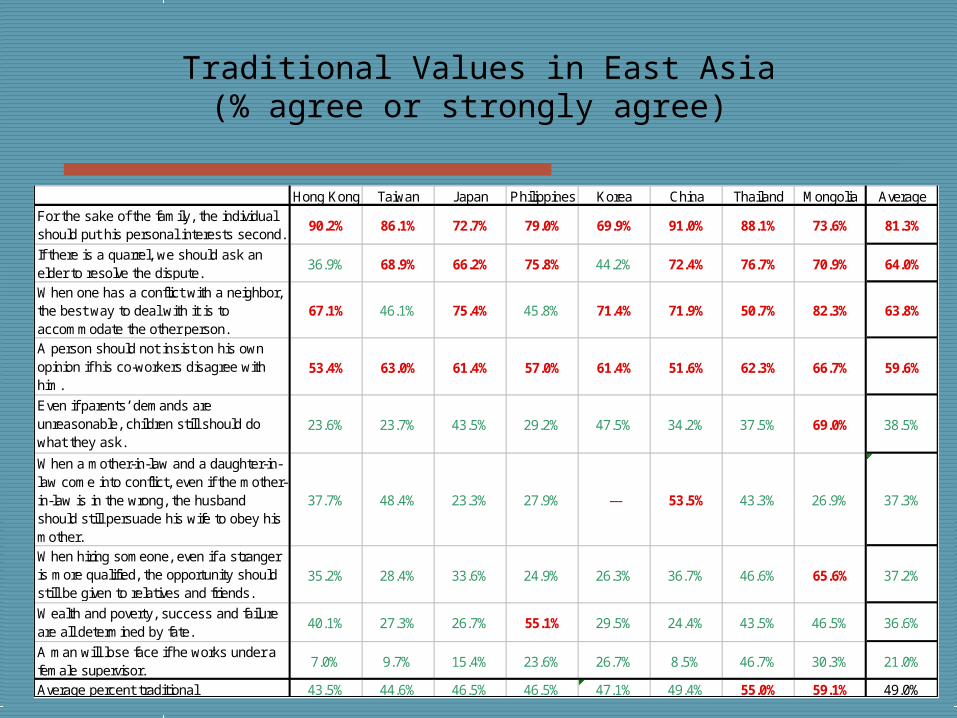
Hong Kong Taiwan Japan Philippines Korea China Thailand Mongolia AverageFor the sake of the family, the individualshould put his personal interests second.
90.2% 86.1% 72.7% 79.0% 69.9% 91.0% 88.1% 73.6% 81.3%
If there is a quarrel, we should ask anelder to resolve the dispute.
36.9% 68.9% 66.2% 75.8% 44.2% 72.4% 76.7% 70.9% 64.0%
When one has a conflict with a neighbor,the best way to deal with it is toaccommodate the other person.
67.1% 46.1% 75.4% 45.8% 71.4% 71.9% 50.7% 82.3% 63.8%
A person should not insist on his ownopinion if his co-workers disagree withhim.
53.4% 63.0% 61.4% 57.0% 61.4% 51.6% 62.3% 66.7% 59.6%
Even if parents’ demands areunreasonable, children still should dowhat they ask.
23.6% 23.7% 43.5% 29.2% 47.5% 34.2% 37.5% 69.0% 38.5%
When a mother-in-law and a daughter-in-law come into conflict, even if the mother-in-law is in the wrong, the husbandshould still persuade his wife to obey hismother.
37.7% 48.4% 23.3% 27.9% --- 53.5% 43.3% 26.9% 37.3%
When hiring someone, even if a strangeris more qualified, the opportunity shouldstill be given to relatives and friends.
35.2% 28.4% 33.6% 24.9% 26.3% 36.7% 46.6% 65.6% 37.2%
Wealth and poverty, success and failureare all determined by fate.
40.1% 27.3% 26.7% 55.1% 29.5% 24.4% 43.5% 46.5% 36.6%
A man will lose face if he works under afemale supervisor.
7.0% 9.7% 15.4% 23.6% 26.7% 8.5% 46.7% 30.3% 21.0%
Average percent traditional 43.5% 44.6% 46.5% 46.5% 47.1% 49.4% 55.0% 59.1% 49.0%
Traditional Values in East Asia(% agree or strongly agree)
Better educated
Higher income
Urban Older MaleInvolved in
politicsInternal efficacy
Inst'l trust
Leaders responsive
Increased pol rights
Democratic progress
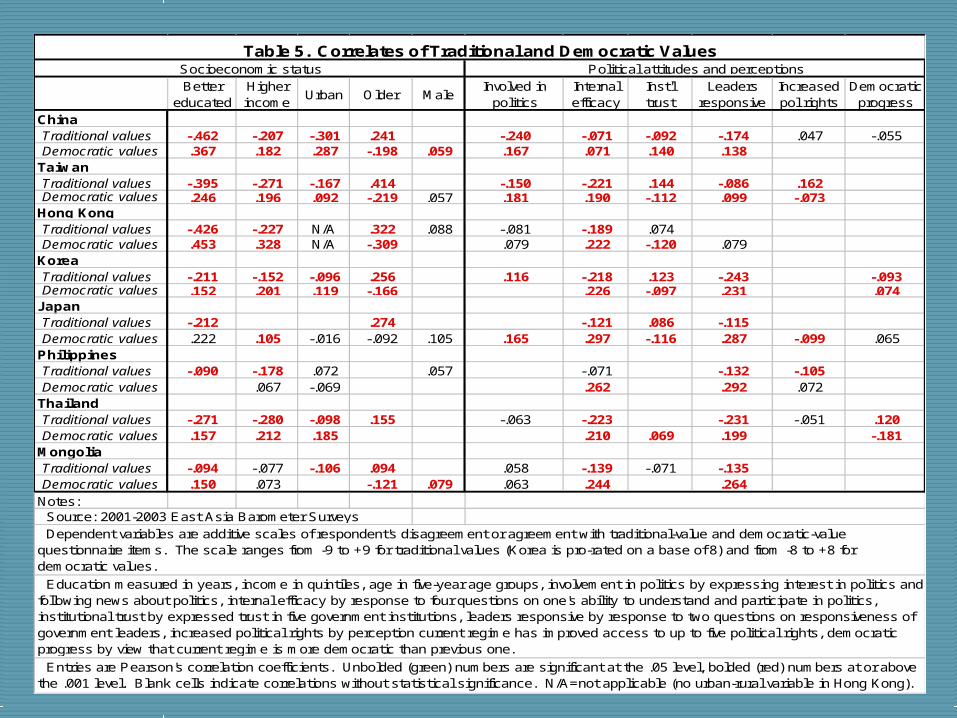
China Traditional values -.462 -.207 -.301 .241 -.240 -.071 -.092 -.174 .047 -.055 Democratic values .367 .182 .287 -.198 .059 .167 .071 .140 .138Taiwan Traditional values -.395 -.271 -.167 .414 -.150 -.221 .144 -.086 .162 Democratic values .246 .196 .092 -.219 .057 .181 .190 -.112 .099 -.073Hong Kong Traditional values -.426 -.227 N/A .322 .088 -.081 -.189 .074 Democratic values .453 .328 N/A -.309 .079 .222 -.120 .079Korea Traditional values -.211 -.152 -.096 .256 .116 -.218 .123 -.243 -.093 Democratic values .152 .201 .119 -.166 .226 -.097 .231 .074Japan Traditional values -.212 .274 -.121 .086 -.115 Democratic values .222 .105 -.016 -.092 .105 .165 .297 -.116 .287 -.099 .065Philippines Traditional values -.090 -.178 .072 .057 -.071 -.132 -.105 Democratic values .067 -.069 .262 .292 .072Thailand Traditional values -.271 -.280 -.098 .155 -.063 -.223 -.231 -.051 .120 Democratic values .157 .212 .185 .210 .069 .199 -.181Mongolia Traditional values -.094 -.077 -.106 .094 .058 -.139 -.071 -.135 Democratic values .150 .073 -.121 .079 .063 .244 .264Notes:
Table 5. Correlates of Traditional and Democratic Values
Dependent variables are additive scales of respondent's disagreement or agreement with traditional-value and democratic-value questionnaire items. The scale ranges from -9 to +9 for traditional values (Korea is pro-rated on a base of 8) and from -8 to +8 for democratic values.
Socioeconomic status
Entries are Pearson's correlation coefficients. Unbolded (green) numbers are significant at the .05 level, bolded (red) numbers at or above the .001 level. Blank cells indicate correlations without statistical significance. N/A=not applicable (no urban-rural variable in Hong Kong).
Education measured in years, income in quintiles, age in five-year age groups, involvement in politics by expressing interest in politics and following news about politics, internal efficacy by response to four questions on one's ability to understand and participate in politics, institutional trust by expressed trust in five government institutions, leaders responsive by response to two questions on responsiveness of government leaders, increased political rights by perception current regime has improved access to up to five political rights, democratic progress by view that current regime is more democratic than previous one.
Political attitudes and perceptions
Source: 2001-2003 East Asia Barometer Surveys
First and Second Wave Comparison
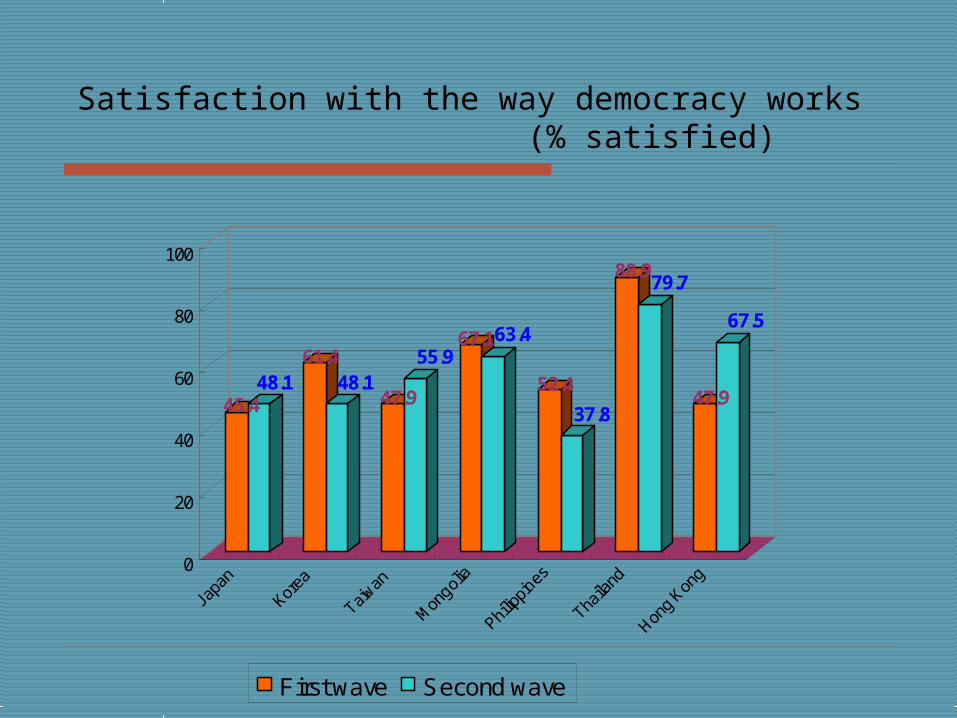
Satisfaction with the way democracy works (% satisfied)
45.448.1
61.448.1
47.9
55.967.163.4
52.4
37.8
88.979.7
47.9
67.5
0
20
40
60
80
100
First wave Second wave
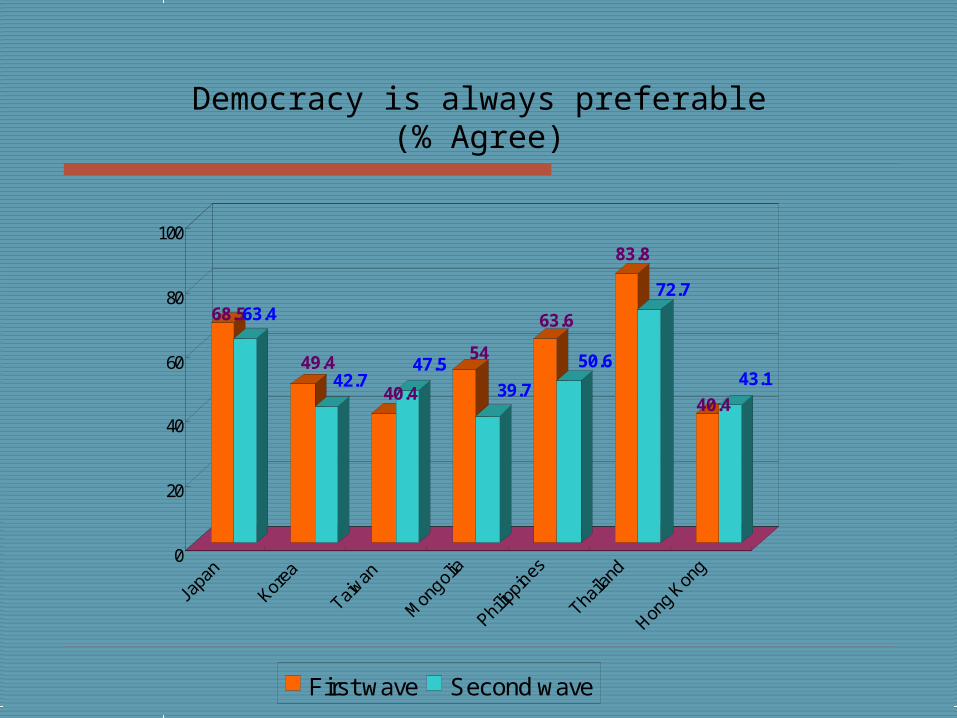
Democracy is always preferable(% Agree)
68.563.4
49.442.7
40.4
47.554
39.7
63.6
50.6
83.8
72.7
40.4
43.1
0
20
40
60
80
100
Japa
n
Korea
Taiwan
Mon
golia
Philip
pines
Thaila
nd
Hong
Kong
First wave Second wave
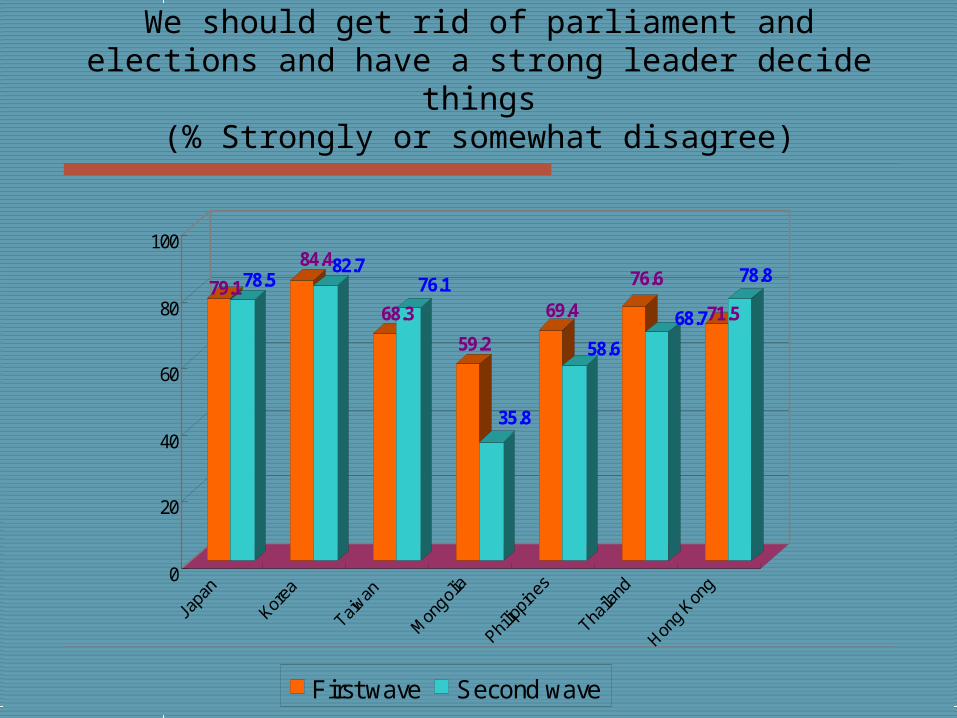
We should get rid of parliament and elections and have a strong leader decide things
(% Strongly or somewhat disagree)
79.178.584.482.7
68.3
76.1
59.2
35.8
69.4
58.6
76.6
68.771.5
78.8
0
20
40
60
80
100
First wave Second wave
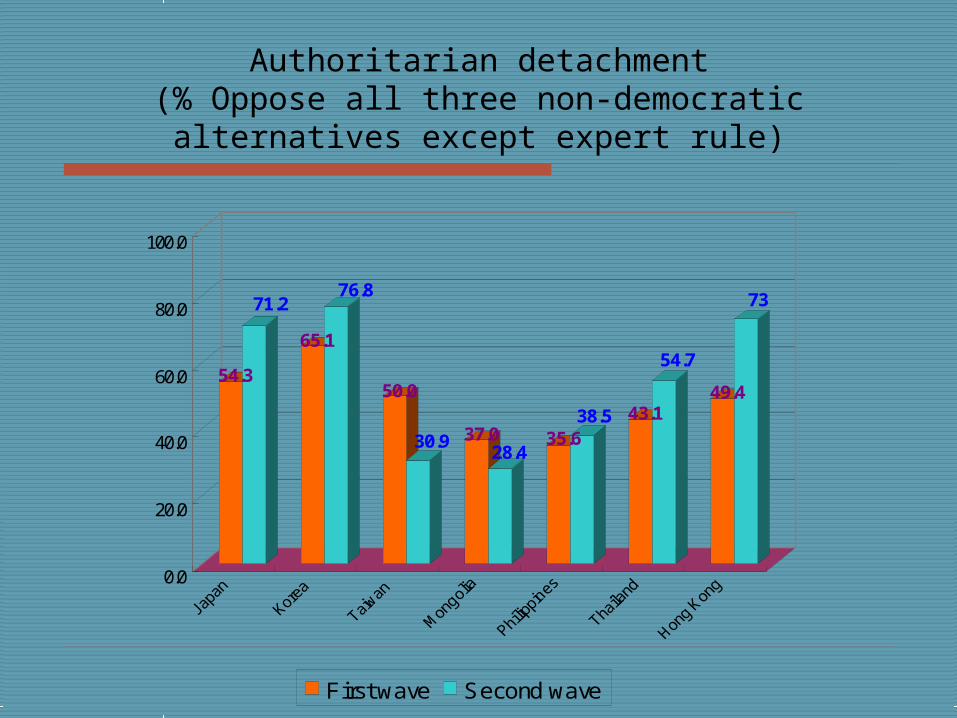
Authoritarian detachment(% Oppose all three non-democratic alternatives except
expert rule)
54.3
71.2
65.1
76.8
50.0
30.9 37.028.4
35.638.5 43.1
54.7
49.4
73
0.0
20.0
40.0
60.0
80.0
100.0
First wave Second wave
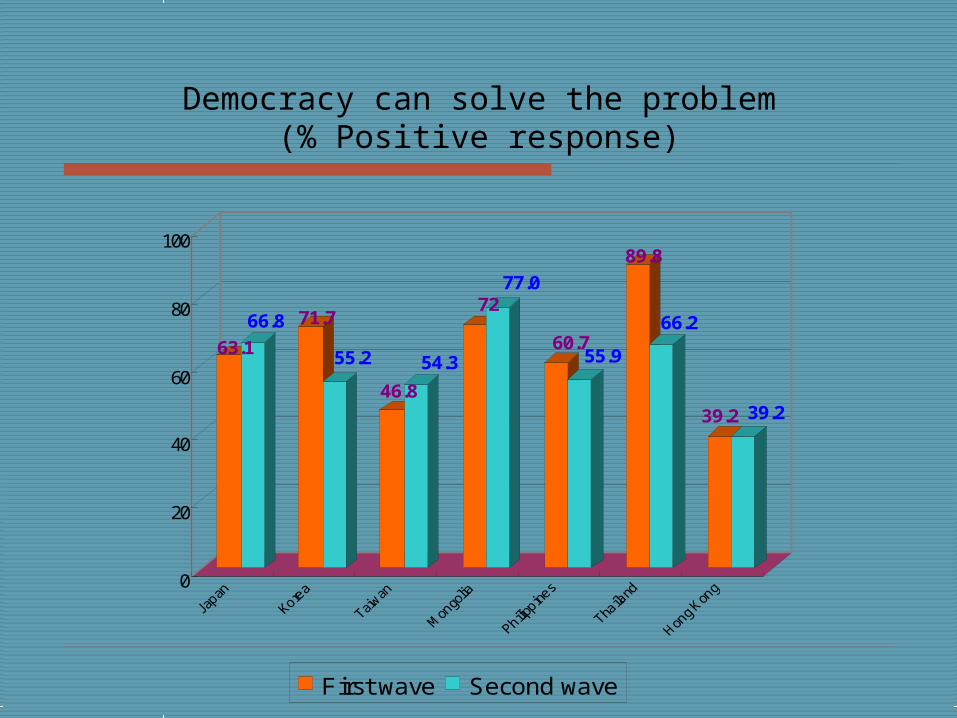
Democracy can solve the problem(% Positive response)
63.1
66.8 71.7
55.2
46.8
54.3
7277.0
60.755.9
89.8
66.2
39.2 39.2
0
20
40
60
80
100
First wave Second wave
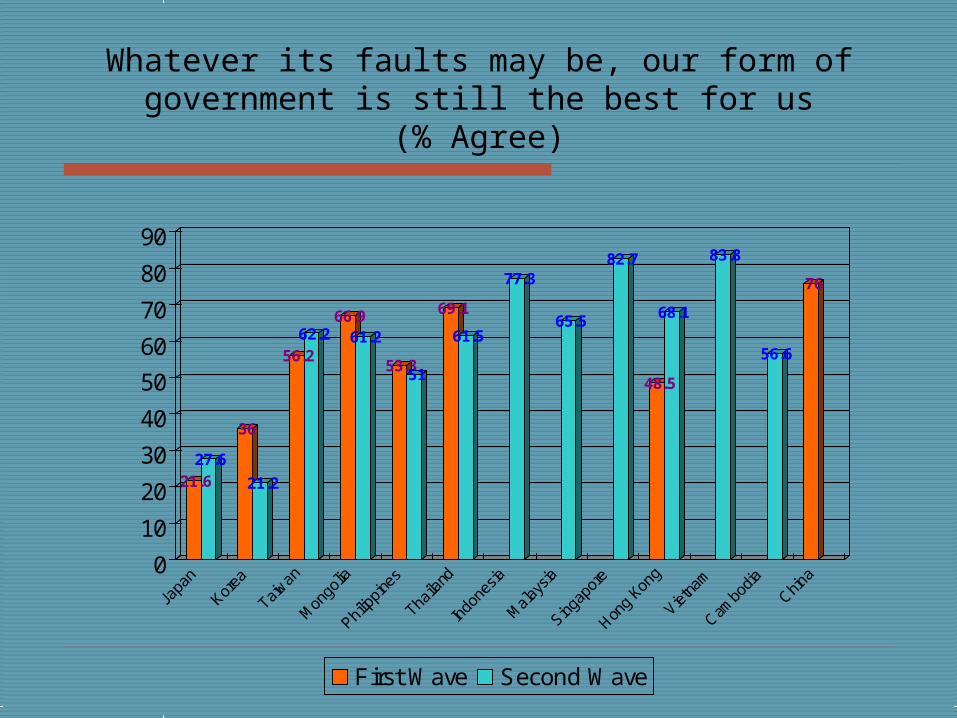
Whatever its faults may be, our form of government is still the best for us
(% Agree)
21.627.6
36
21.2
56.262.2
66.961.2
53.351
69.1
61.5
77.3
65.5
82.7
48.5
68.1
83.8
56.6
76
0
10
20
30
40
50
60
70
80
90
Japa
n
Korea
Taiwan
Mon
golia
Philipp
ines
Thaila
nd
Indo
nesia
Mal
aysia
Singap
ore
Hong
Kong
Vietna
m
Cambo
diaChin
a
First Wave Second Wave
Second Wave
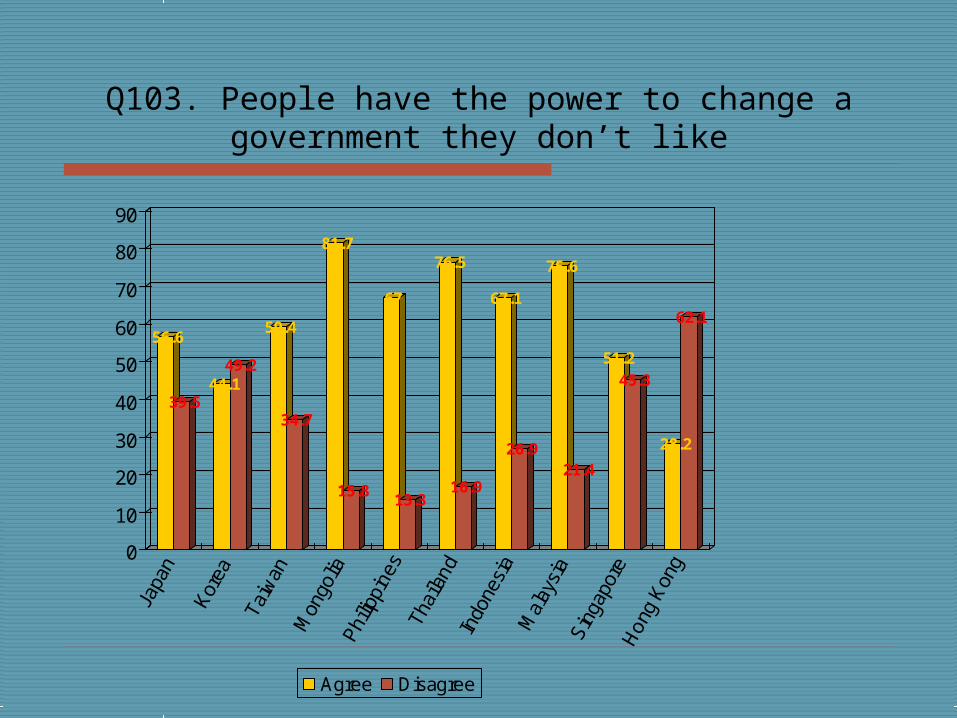
Q103. People have the power to change a government they don’t like
56.6
39.544.1
49.2
59.4
34.7
81.7
15.8
67
13.3
76.5
16.9
67.1
26.9
75.6
21.4
51.245.3
28.2
62.1
0
10
20
30
40
50
60
70
80
90
Japa
n
Kor
ea
Taiw
anM
ongo
liaP
hilip
pine
sTh
aila
ndIn
done
sia
Mal
aysi
aS
inga
pore
Hon
g K
ong
Agree Disagree
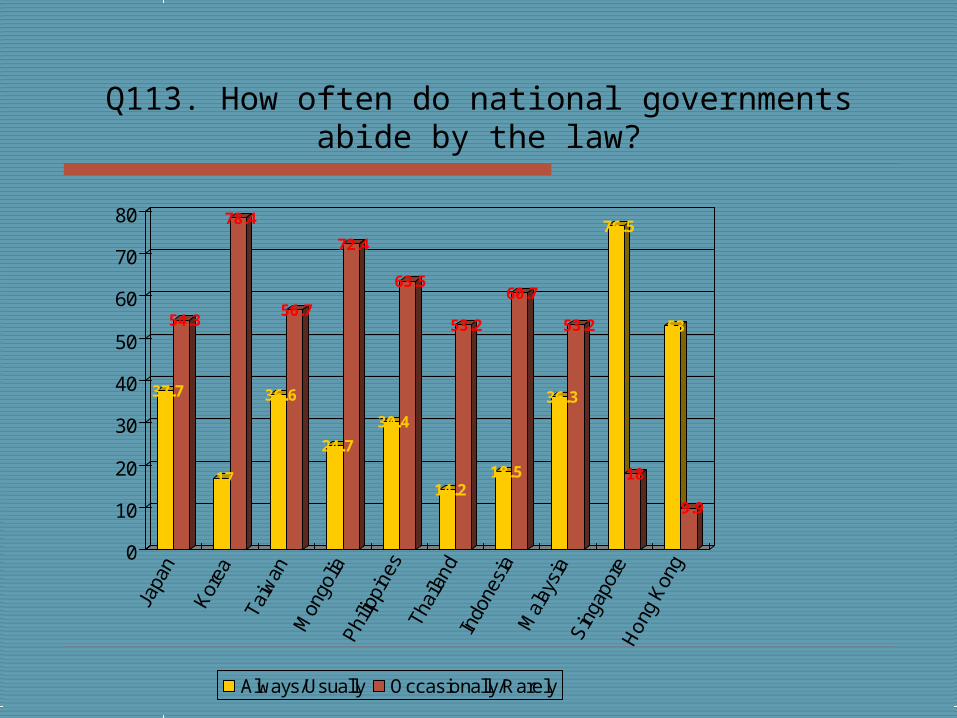
Q113. How often do national governments abide by the law?
37.7
54.3
17
78.4
36.6
56.7
24.7
72.4
30.4
63.5
14.2
53.2
18.5
60.7
36.3
53.2
76.5
18
53
9.9
0
10
20
30
40
50
60
70
80
Japa
n
Kor
ea
Taiw
anM
ongo
liaP
hilip
pine
sTh
aila
ndIn
done
sia
Mal
aysi
aS
inga
pore
Hon
g K
ong
Always/Usually Occasionally/Rarely
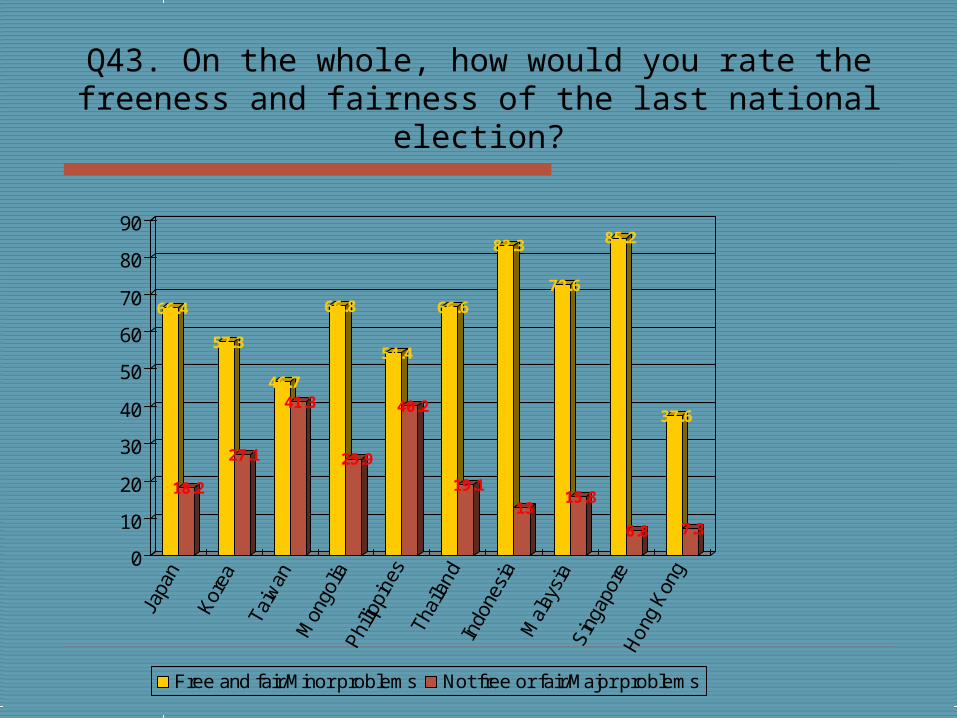
Q43. On the whole, how would you rate the freeness and fairness of the last national election?
66.4
18.2
57.3
27.1
46.741.3
66.8
25.9
54.4
40.2
66.6
19.1
83.3
13
72.6
15.8
85.2
6.8
37.6
7.3
0
10
20
30
40
50
60
70
80
90
Japa
n
Kor
ea
Taiw
anM
ongo
liaP
hilip
pine
sTh
aila
ndIn
done
sia
Mal
aysi
aS
inga
pore
Hon
g K
ong
Free and fair/Minor problems Not free or fair/Major problems
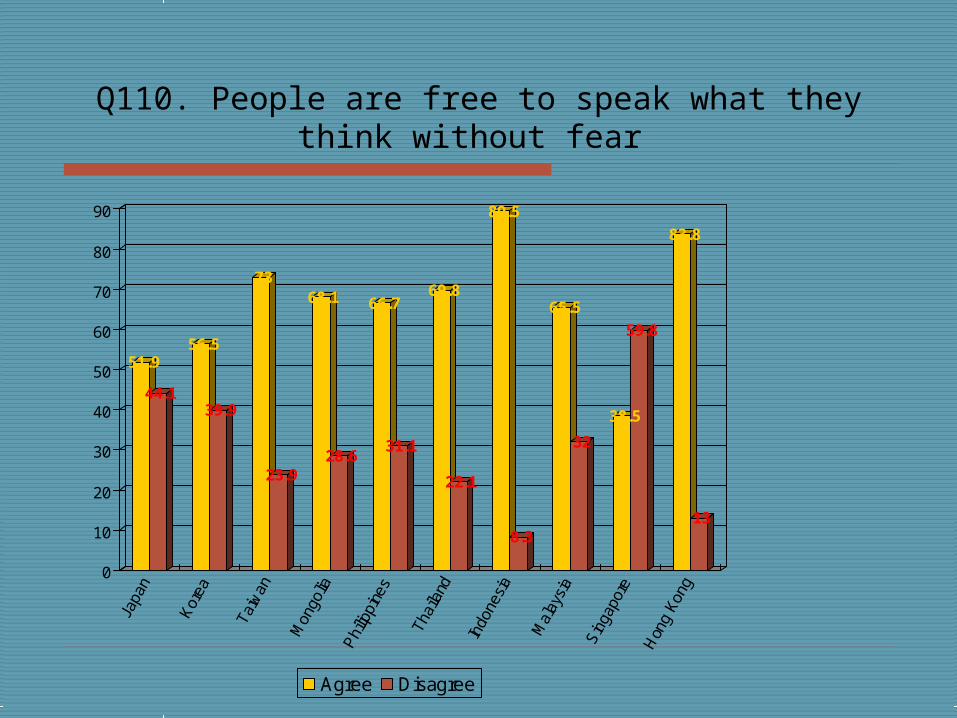
Q110. People are free to speak what they think without fear
51.9
44.1
56.5
39.9
73
23.9
68.1
28.6
66.7
31.1
69.8
22.1
89.5
8.3
65.5
32
38.5
59.8
83.8
13
0
10
20
30
40
50
60
70
80
90
Japa
n
Kor
ea
Taiw
an
Mon
golia
Phi
lippi
nes
Thai
land
Indo
nesi
a
Mal
aysi
a
Sin
gapo
re
Hon
g Ko
ngAgree Disagree
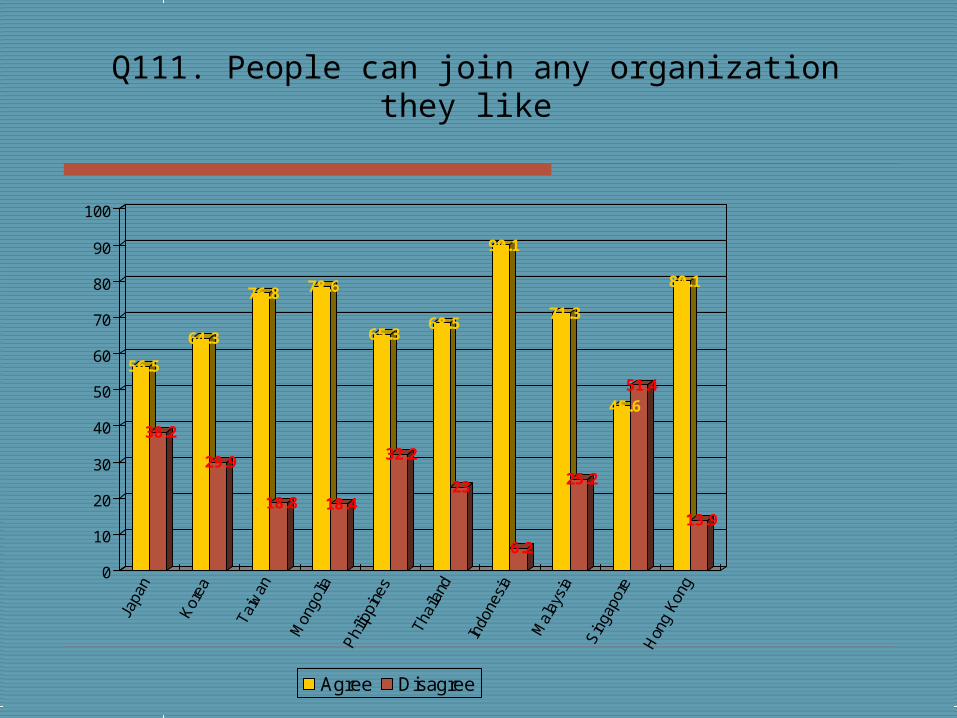
Q111. People can join any organization they like
56.5
38.2
64.3
29.9
76.8
18.8
78.6
18.4
65.3
32.2
68.5
23
90.1
6.2
71.3
25.2
45.651.4
80.1
13.9
0
10
20
30
40
50
60
70
80
90
100
Japa
n
Kor
ea
Taiw
an
Mon
golia
Phi
lippi
nes
Thai
land
Indo
nesi
a
Mal
aysi
a
Sin
gapo
re
Hon
g Ko
ngAgree Disagree
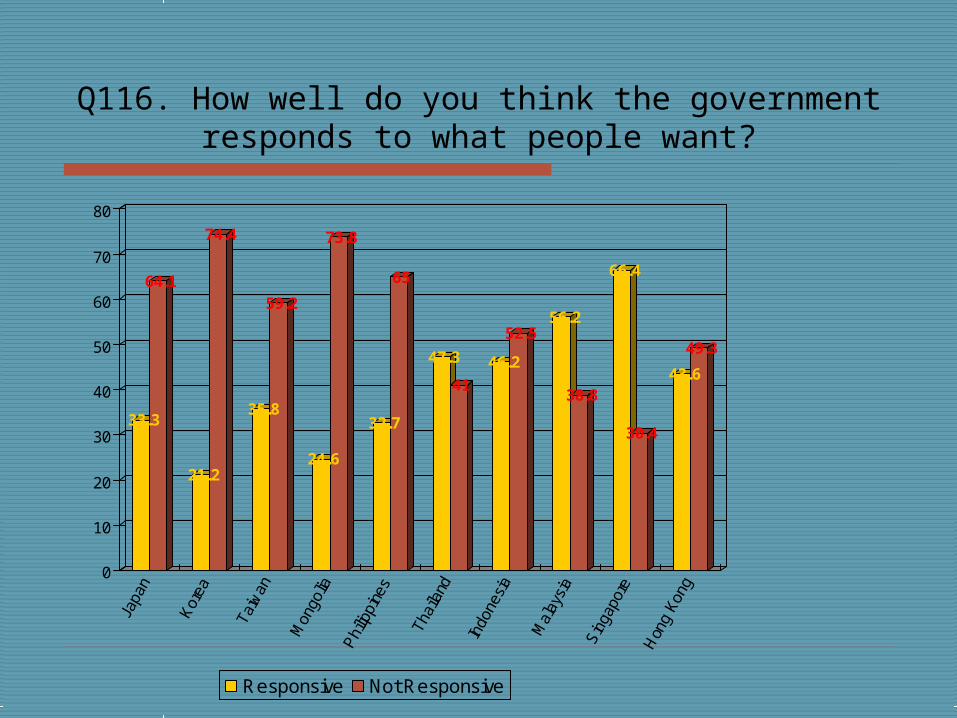
Q116. How well do you think the government responds to what people want?
33.3
64.1
21.2
74.4
35.8
59.2
24.6
73.8
32.7
65
47.3
4146.2
52.556.2
38.8
66.4
30.4
43.6
49.3
0
10
20
30
40
50
60
70
80
Japa
n
Kor
ea
Taiw
an
Mon
golia
Phi
lippi
nes
Thai
land
Indo
nesi
a
Mal
aysi
a
Sin
gapo
re
Hon
g Ko
ngResponsive Not Responsive
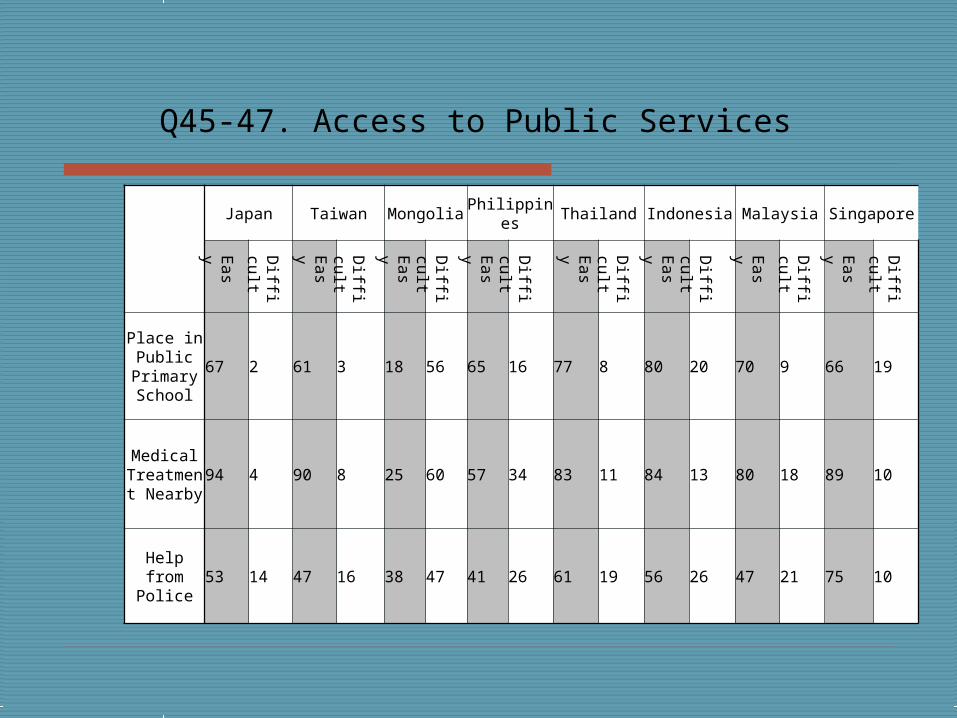
Q45-47. Access to Public Services
Japan Taiwan Mongolia Philippines Thailand Indonesia Malaysia Singapore
Place in Public
Primary School
67 2 61 3 18 56 65 16 77 8 80 20 70 9 66 19
Medical Treatment
Nearby94 4 90 8 25 60 57 34 83 11 84 13 80 18 89 10
Help from Police
53 14 47 16 38 47 41 26 61 19 56 26 47 21 75 10
Ea
sy D
ifficul
t Ea
sy E
as
yEa
sy E
as
yEa
sy E
as
yEa
sy D
ifficul
t Difficu
ltD
ifficul
t Difficu
ltD
ifficul
t Difficu
ltD
ifficul
t
Don’t walk away after democratic transition, but invest in the consolidation of new democracies at risk.
Consolidation is not only about elections and civil society, but even more about rule of law, accountability, and governance – the “quality of democracy.”
Promoting the “d” word is less valuable than promoting deeper democratic values.
Longterm modernization promotes democratic values, but slowly and unevenly.
The modernization process that most changes values is education. Take authoritarian governments at their word in their democratic claims, and
work with the public’s rising expectations for democracy.
Policy implications
Institutionalizing African Democracy:Formal or Informal?
Michael Bratton, Michigan State University
Research Questions
What are the trends over time in popular support for democracy?
Is nostalgia for authoritarian rule growing or shrinking?
Over time, are Africans becoming more or less satisfied with the quality of democracy delivered by their leaders?
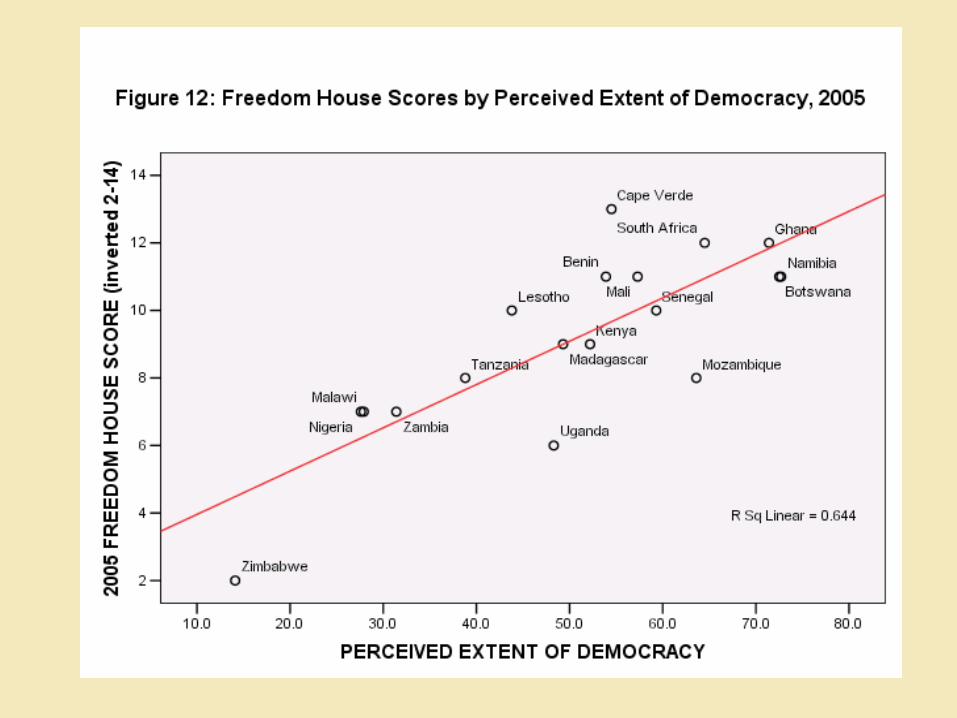
How much democracy do they think they have?
How do they arrive at their attitudes to democracy? With reference to formal or informal institutions? Which is more important?
If informal institutions remain important to African politics, do they help or harm democracy?
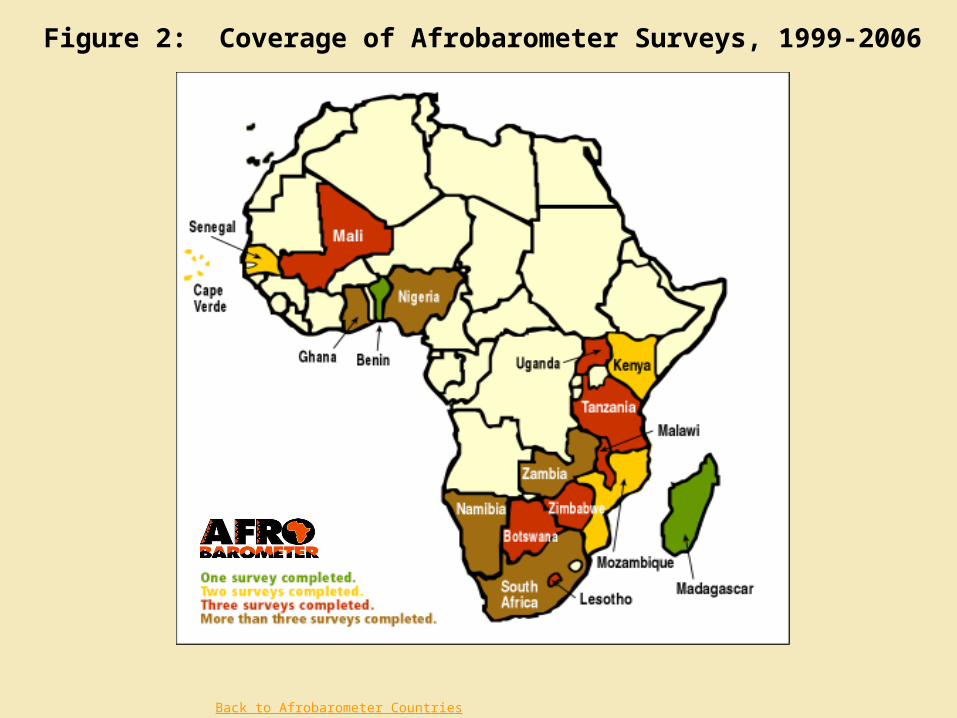
The AfrobarometerA comparative series of public attitude surveys on democracy, markets and civil society.
Run by Idasa (South Africa), CDD (Ghana) and MSU, plus national partners. Based on:
* national probability samples (1200-3600) representing all adult citizens
* margin of sampling error of +/- 3% at 95 % confidence
* face-to-face interviews by trained interviewers in language of choice
* response rates averaging above 80%
* standard questionnaire with identical or functionally equivalent items
DataComparisons of observed values across countries, and over time, between:
* Afrobarometer Round 1 (12 countries), 1999-2001 (21,000+ cases)
* Afrobarometer Round 2 (15 countries), 2002-2003 (23,000+ cases)
* Afrobarometer Round 3 (18 countries), 2005-2006 (25,000+ cases)
Back to Afrobarometer Countries
Figure 2: Coverage of Afrobarometer Surveys, 1999-2006
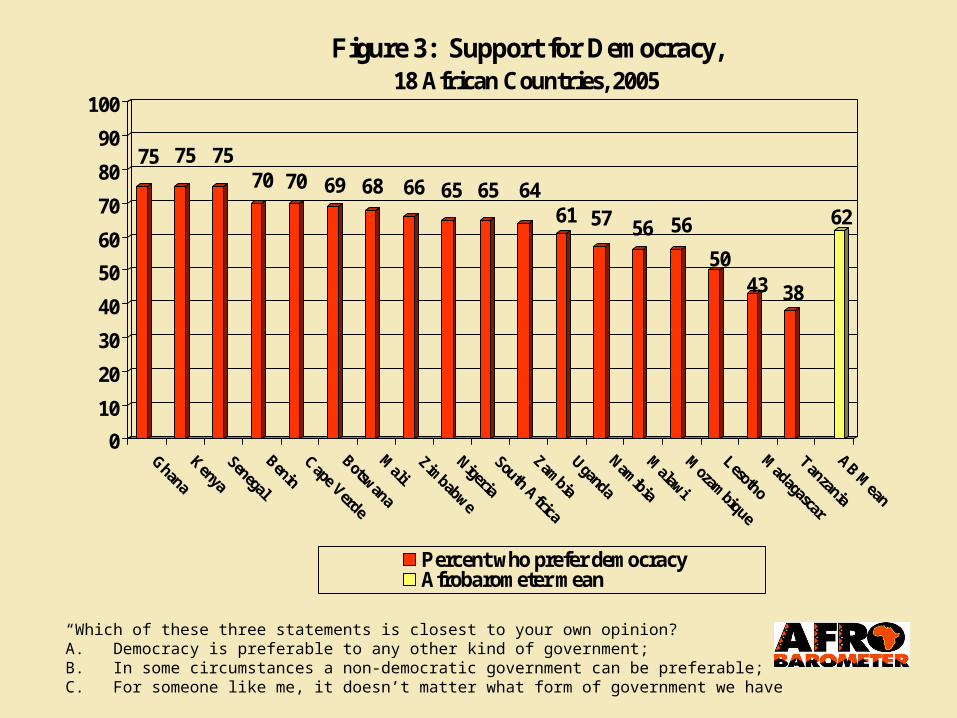
75 75 7570 70 69 68 66 65 65 64
61 57 56 56
5043 38
62
0
10
20
30
40
50
60
70
80
90
100
Figure 3: Support for Democracy, 18 African Countries, 2005
Percent who prefer democracyAfrobarometer mean
“Which of these three statements is closest to your own opinion? A. Democracy is preferable to any other kind of government; B. In some circumstances a non-democratic government can be preferable; C. For someone like me, it doesn’t matter what form of government we have”
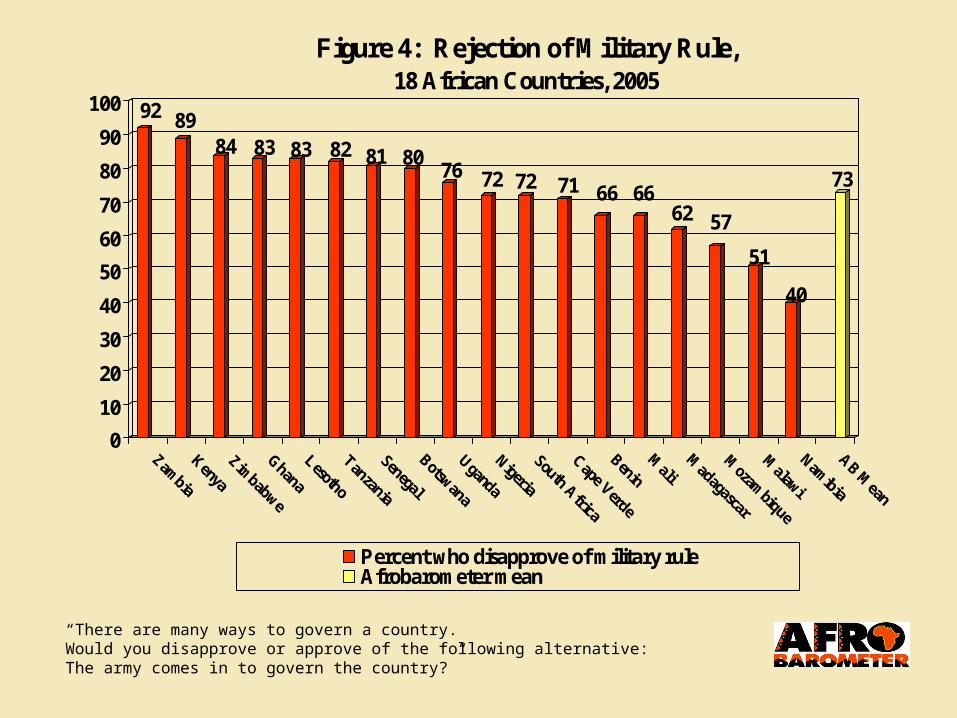
92 8984 83 83 82 81 80
76 72 72 71 66 6662 57
51
40
73
0
10
20
30
40
50
60
70
80
90
100
Figure 4: Rejection of Military Rule,18 African Countries, 2005
Percent who disapprove of military ruleAfrobarometer mean
“There are many ways to govern a country. Would you disapprove or approve of the following alternative:The army comes in to govern the country?”
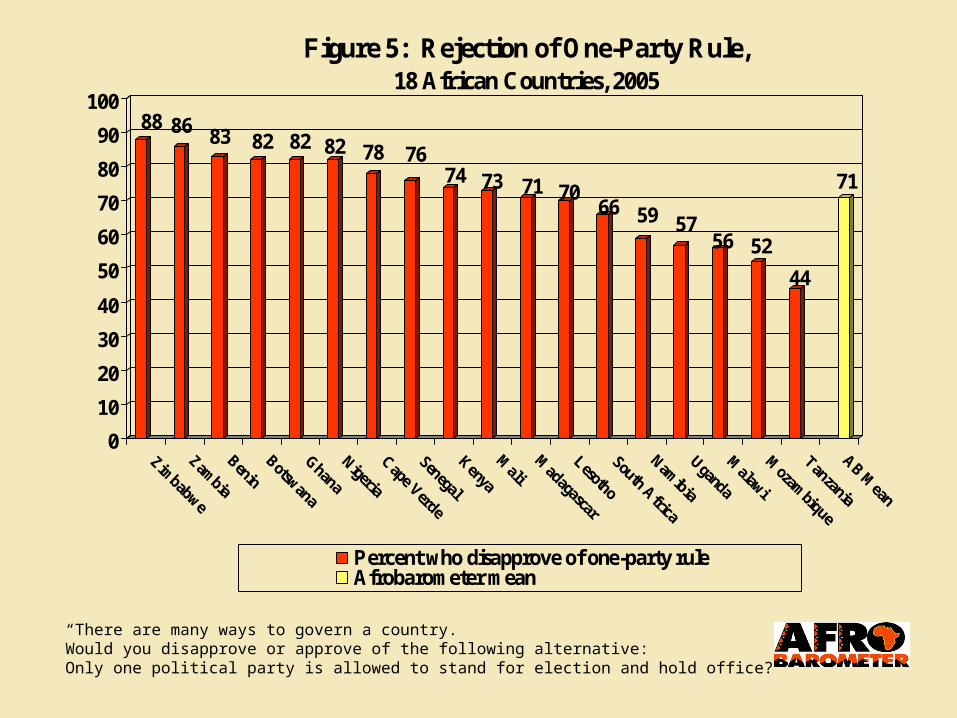
88 86 83 82 82 82 78 7674 73 71 70
66 59 5756 52
44
71
0
10
20
30
40
50
60
70
80
90
100
Figure 5: Rejection of One-Party Rule,18 African Countries, 2005
Percent who disapprove of one-party ruleAfrobarometer mean
“There are many ways to govern a country. Would you disapprove or approve of the following alternative:Only one political party is allowed to stand for election and hold office?”
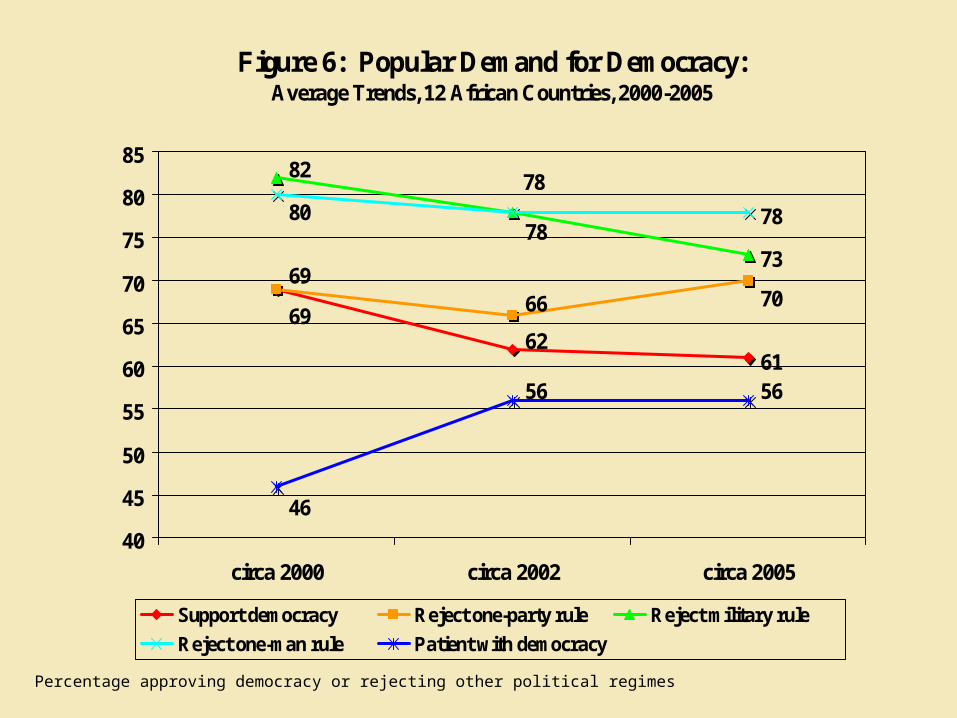
Figure 6: Popular Demand for Democracy:Average Trends, 12 African Countries, 2000-2005
61
73
78
6962
6669
70
7882
7880
46
56 56
40
45
50
55
60
65
70
75
80
85
circa 2000 circa 2002 circa 2005
Support democracy Reject one-party rule Reject military rule
Reject one-man rule Patient with democracy
Percentage approving democracy or rejecting other political regimes
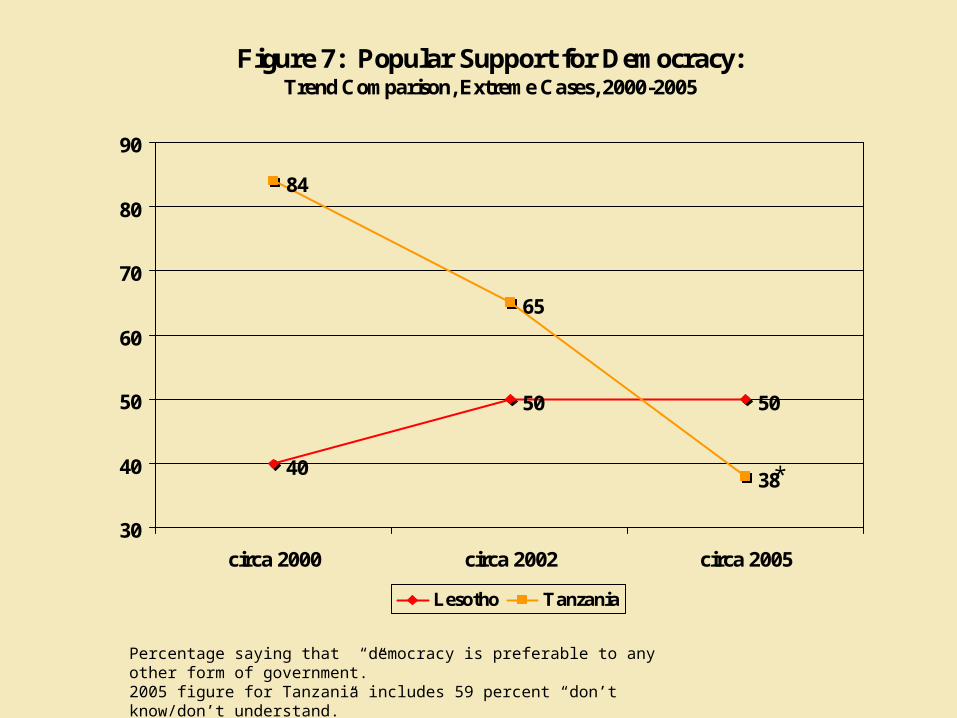
Figure 7: Popular Support for Democracy:Trend Comparison, Extreme Cases, 2000-2005
40
50 50
84
65
38
30
40
50
60
70
80
90
circa 2000 circa 2002 circa 2005
Lesotho Tanzania
Percentage saying that “democracy is preferable to any other form of government.”2005 figure for Tanzania includes 59 percent “don’t know/don’t understand.”
*

Figure 6: Popular Demand for Democracy:Average Trends, 12 African Countries, 2000-2005
61
73
78
6962
6669
70
7882
7880
46
56 56
40
45
50
55
60
65
70
75
80
85
circa 2000 circa 2002 circa 2005
Support democracy Reject one-party rule Reject military rule
Reject one-man rule Patient with democracy
Percentage approving democracy or rejecting other political regimes

Figure 8: Perceived Supply of Democracy:Average Trends, 12 African Countries, 2000-2005
58
52
5049
48
54
45
40
42
44
46
48
50
52
54
56
58
60
circa 2000 circa 2002 circa 2005
Satisfied with democracy Perceive extensive democracy
Think country will remain democratic
Percentages (a) satisfied with “the way democracy works” (b) perceiving that country has “full” or “almost full” democracy and (c) thinking country will remain a democracy in the future
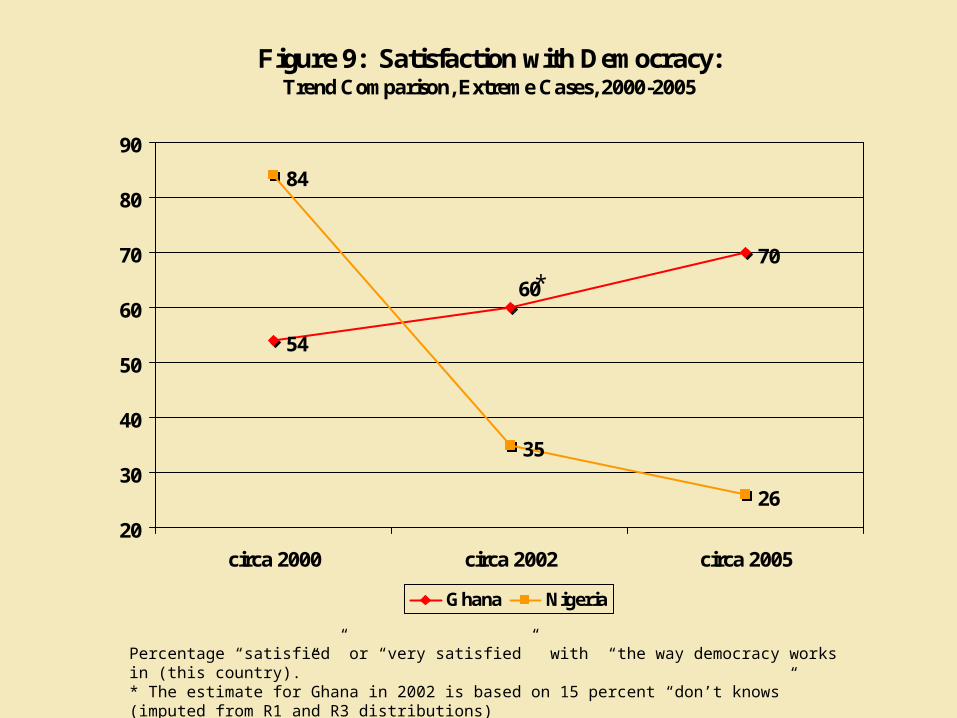
Figure 9: Satisfaction with Democracy:Trend Comparison, Extreme Cases, 2000-2005
54
70
84
35
26
60
20
30
40
50
60
70
80
90
circa 2000 circa 2002 circa 2005
Ghana Nigeria
Percentage “satisfied” or “very satisfied” with “the way democracy works in (this country).”* The estimate for Ghana in 2002 is based on 15 percent “don’t knows” (imputed from R1 and R3 distributions)
*
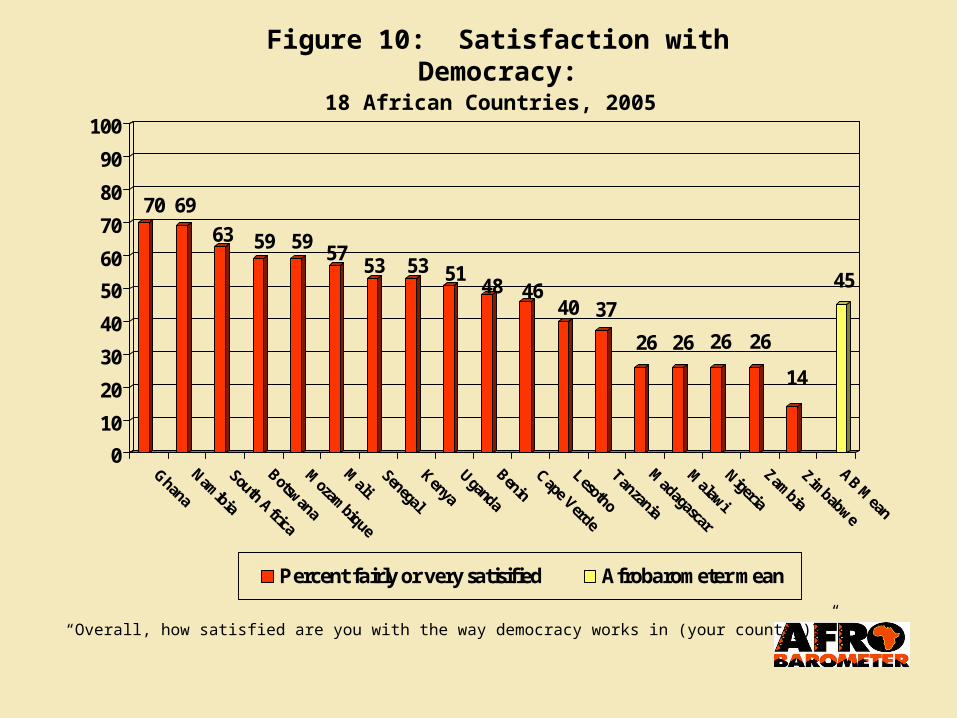
70 69
63 59 5957
53 53 5148 46
40 37
26 26 26 26
14
45
0
10
20
30
40
50
60
70
80
90
100
Percent fairly or very satisified Afrobarometer mean
“Overall, how satisfied are you with the way democracy works in (your country)?”
Figure 10: Satisfaction with Democracy:
18 African Countries, 2005
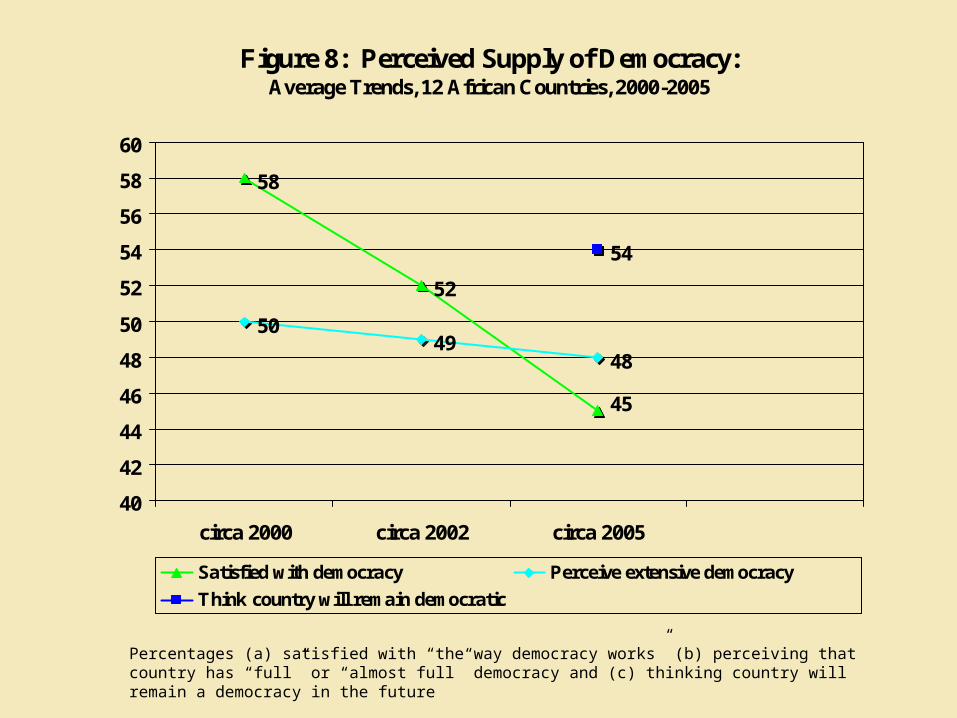
Figure 8: Perceived Supply of Democracy:Average Trends, 12 African Countries, 2000-2005
58
52
5049
48
54
45
40
42
44
46
48
50
52
54
56
58
60
circa 2000 circa 2002 circa 2005
Satisfied with democracy Perceive extensive democracy
Think country will remain democratic
Percentages (a) satisfied with “the way democracy works” (b) perceiving that country has “full” or “almost full” democracy and (c) thinking country will remain a democracy in the future
Multiple Regression (OLS) a
1.319 .027 .000
-.093 .008 -.083 .000
-.057 .009 -.049 .000
.002 .000 .045 .000
.062 .011 .045 .000
.052 .002 .185 .000
(Constant)
Gender (Female)
Habitat (Rural)
Age
Religion (Muslim)
Education
Model1
B Std. Error
UnstandardizedCoefficients
Beta
StandardizedCoefficients
Sig.
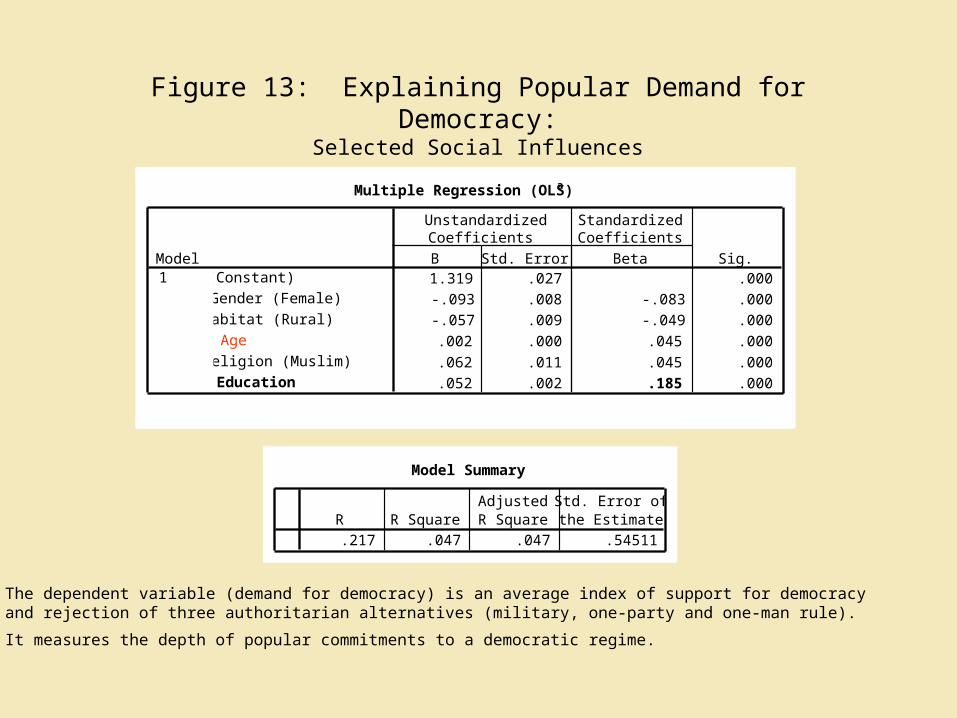
Figure 13: Explaining Popular Demand for Democracy:
Selected Social Influences
Model Summary
.217 .047 .047 .54511
R R SquareAdjustedR Square
Std. Error ofthe Estimate
The dependent variable (demand for democracy) is an average index of support for democracy and rejection of three authoritarian alternatives (military, one-party and one-man rule).
It measures the depth of popular commitments to a democratic regime.
Multiple Regression (OLS)
1.318 .021 63.233 .000
.356 .007 .427 49.247 .000
.200 .007 .242 27.910 .000
(Constant)Free and Fair Elections
Trust in the President
Model1
B Std. Error
UnstandardizedCoefficients
Beta
StandardizedCoefficients
t Sig.
Model Summary
.575 a .330 .330 .767
Model1
R R SquareAdjustedR Square
Std. Error ofthe Estimate
Dependent Variable: EXTENT OF DEMOCRACYa.
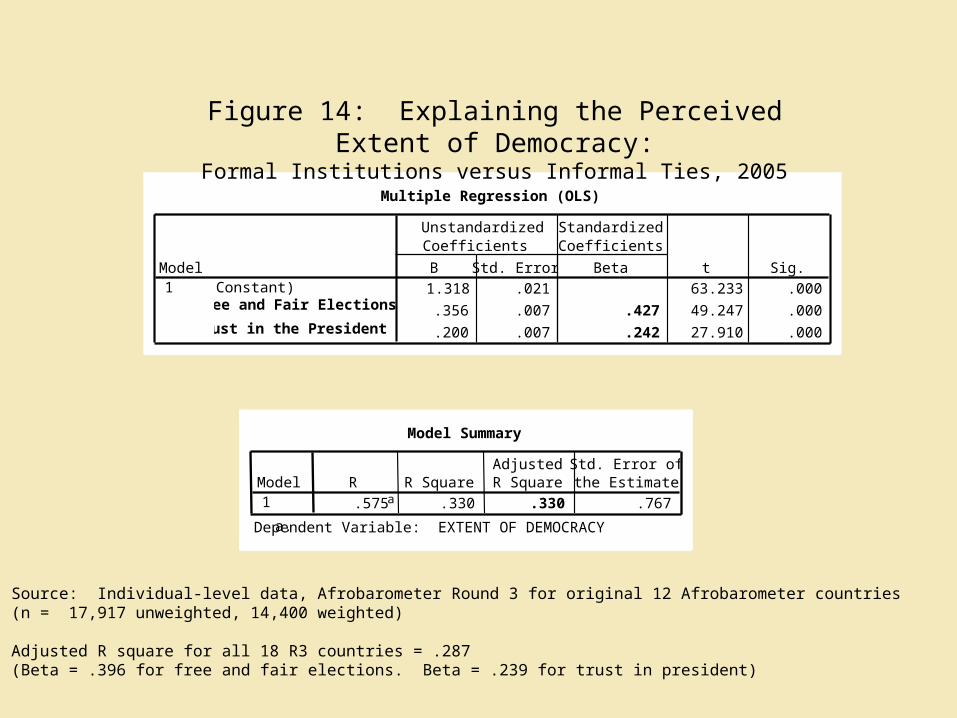
Figure 14: Explaining the Perceived Extent of Democracy:
Formal Institutions versus Informal Ties, 2005
Source: Individual-level data, Afrobarometer Round 3 for original 12 Afrobarometer countries(n = 17,917 unweighted, 14,400 weighted)
Adjusted R square for all 18 R3 countries = .287 (Beta = .396 for free and fair elections. Beta = .239 for trust in president)
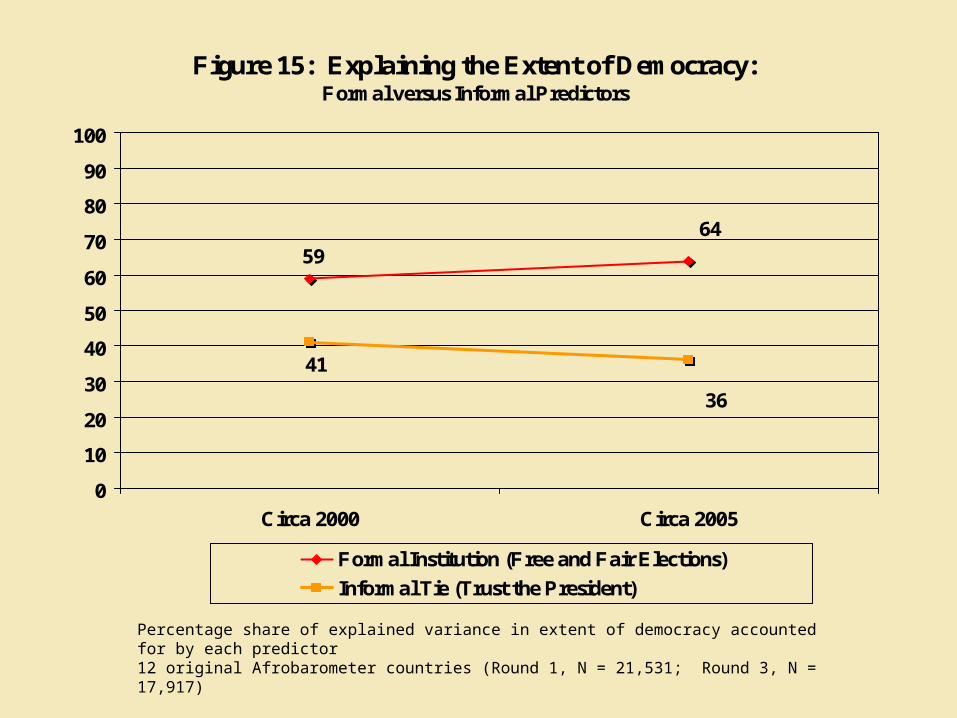
Figure 15: Explaining the Extent of Democracy: Formal versus Informal Predictors
6459
36
41
0
10
20
30
40
50
60
70
80
90
100
Circa 2000 Circa 2005
Formal Institution (Free and Fair Elections)
Informal Tie (Trust the President)
Percentage share of explained variance in extent of democracy accounted for by each predictor 12 original Afrobarometer countries (Round 1, N = 21,531; Round 3, N = 17,917)
“In your opinion, how much of a democracy is (your country) today?”
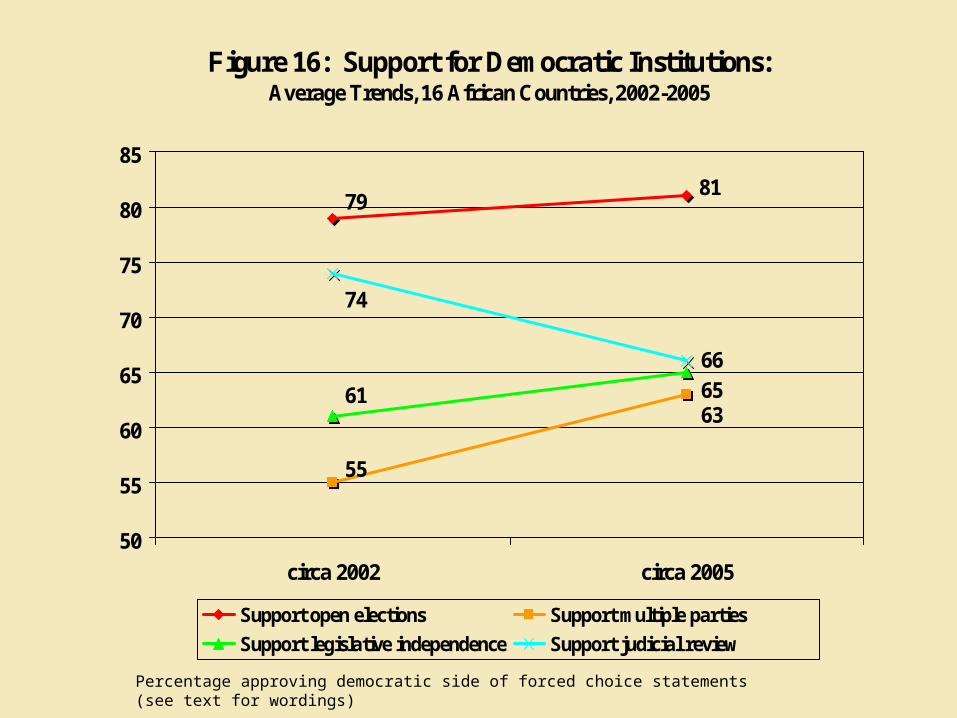
Figure 16: Support for Democratic Institutions:Average Trends, 16 African Countries, 2002-2005
7981
63
55
6561
66
74
50
55
60
65
70
75
80
85
circa 2002 circa 2005
Support open elections Support multiple parties
Support legislative independence Support judicial review
Percentage approving democratic side of forced choice statements (see text for wordings)
81
47
66
36
65
46
63
41
0
10
20
30
40
50
60
70
80
90
100
Elections that removeleaders
President subject torule of law
A representativelegislature
Peaceful multipartycompetition
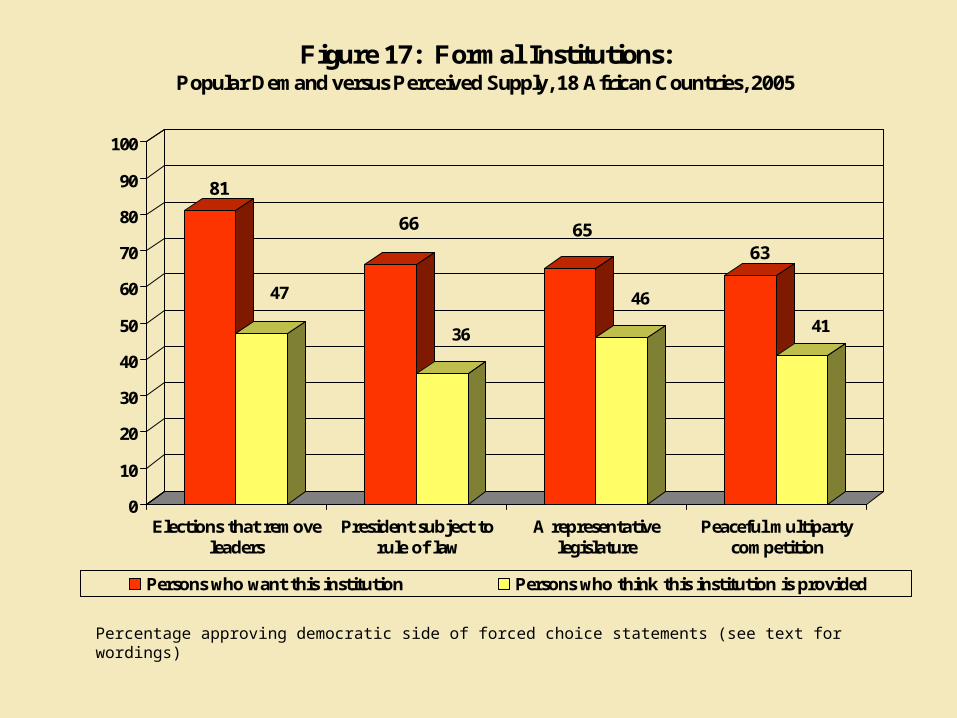
Figure 17: Formal Institutions:Popular Demand versus Perceived Supply, 18 African Countries, 2005
Persons who want this institution Persons who think this institution is provided
Percentage approving democratic side of forced choice statements (see text for wordings)
43
62
64
0
10
20
30
40
50
60
70
80
90
100
Clientelism Corruption Presidentialism
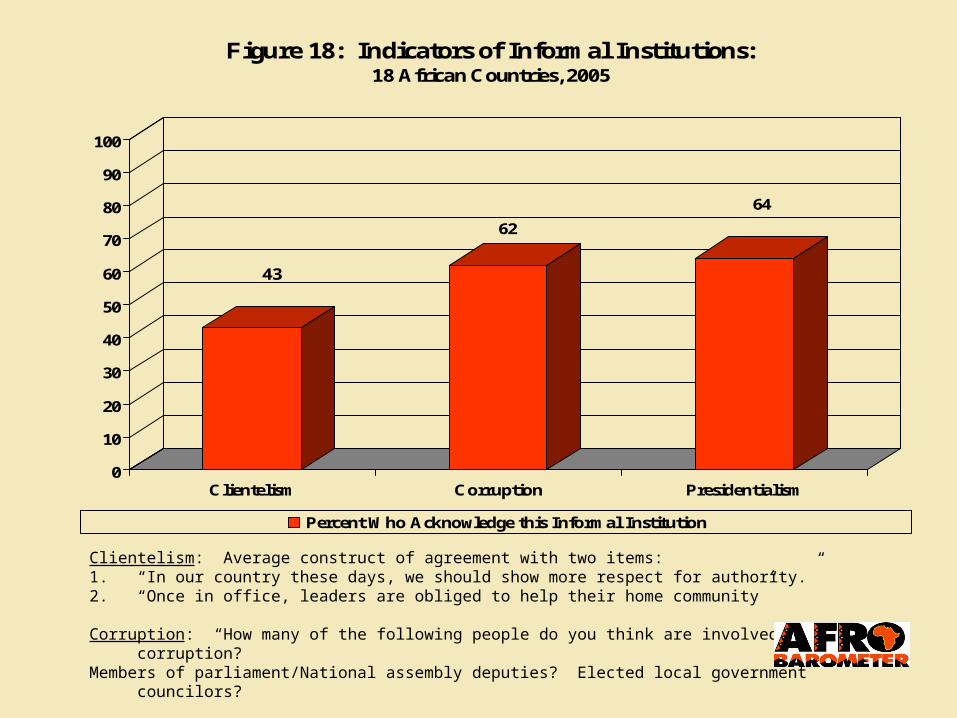
Figure 18: Indicators of Informal Institutions:18 African Countries, 2005
Percent Who Acknowledge this Informal Institution
Clientelism: Average construct of agreement with two items:1. “In our country these days, we should show more respect for authority.” 2. “Once in office, leaders are obliged to help their home community”
Corruption: “How many of the following people do you think are involved in corruption? Members of parliament/National assembly deputies? Elected local government councilors?
Presidentialism: How much do you trust each of the following? The President?
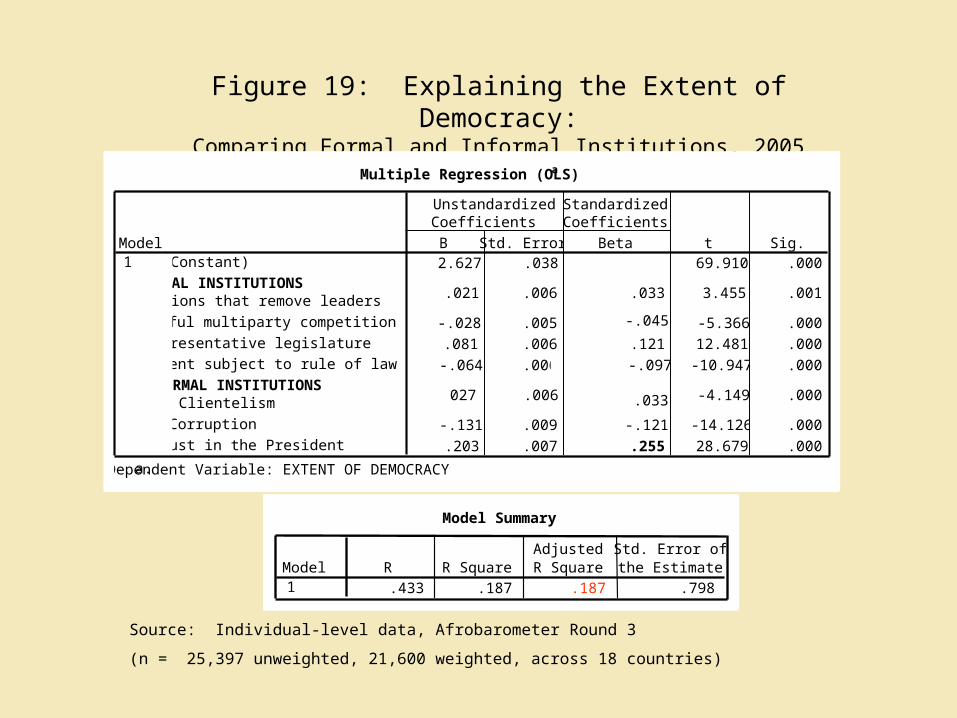
Figure 19: Explaining the Extent of Democracy:Comparing Formal and Informal Institutions, 2005
Multiple Regression (OLS)a
2.627 .038 69.910 .000
.021 .006 .033 3.455 .001
-.028 .005 -.045 -5.366 .000
.081 .006 .121 12.481 .000
-.064 .006 -.097 -10.947 .000
027 .006 .033 -4.149 .000
-.131 .009 -.121 -14.126 .000
.203 .007 .255 28.679 .000
(Constant)
FORMAL INSTITUTIONS Elections that remove leaders
Peaceful multiparty competition
A representative legislature
President subject to rule of law
INFORMAL INSTITUTIONS Clientelism
Corruption
Trust in the President
Model1
B Std. Error
UnstandardizedCoefficients
Beta
StandardizedCoefficients
t Sig.
Dependent Variable: EXTENT OF DEMOCRACYa.
Model Summary
.433 .187 .187 .798
Model1
R R SquareAdjustedR Square
Std. Error ofthe Estimate
Source: Individual-level data, Afrobarometer Round 3
(n = 25,397 unweighted, 21,600 weighted, across 18 countries)
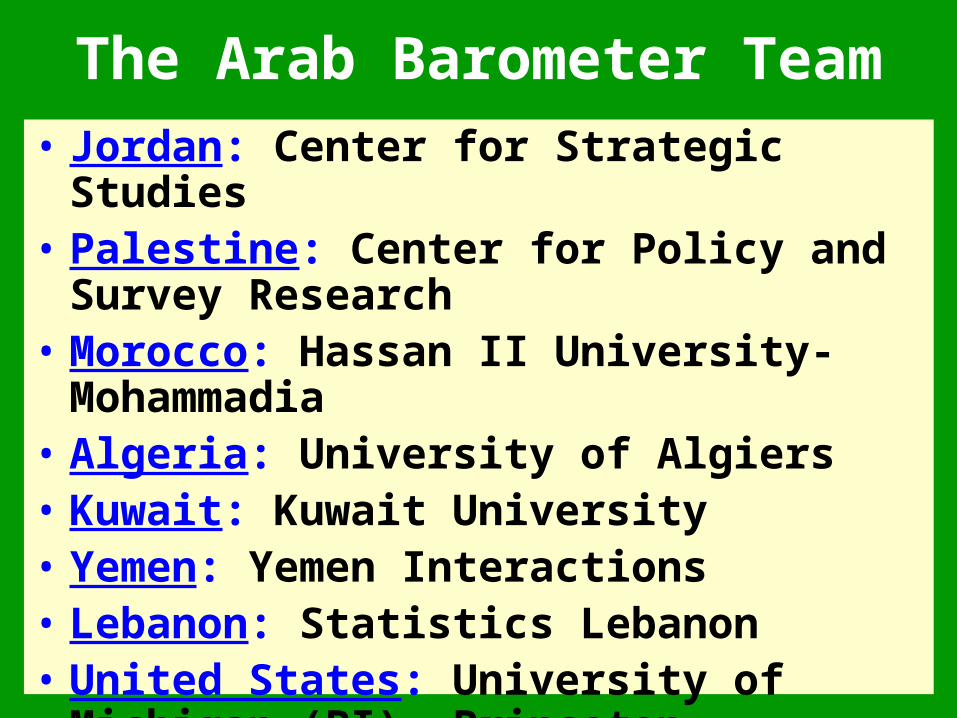
• Jordan: Center for Strategic Studies• Palestine: Center for Policy and Survey
Research• Morocco: Hassan II University-Mohammadia• Algeria: University of Algiers• Kuwait: Kuwait University• Yemen: Yemen Interactions • Lebanon: Statistics Lebanon• United States: University of Michigan (PI),
Princeton University (co-PI)
The Arab Barometer Team
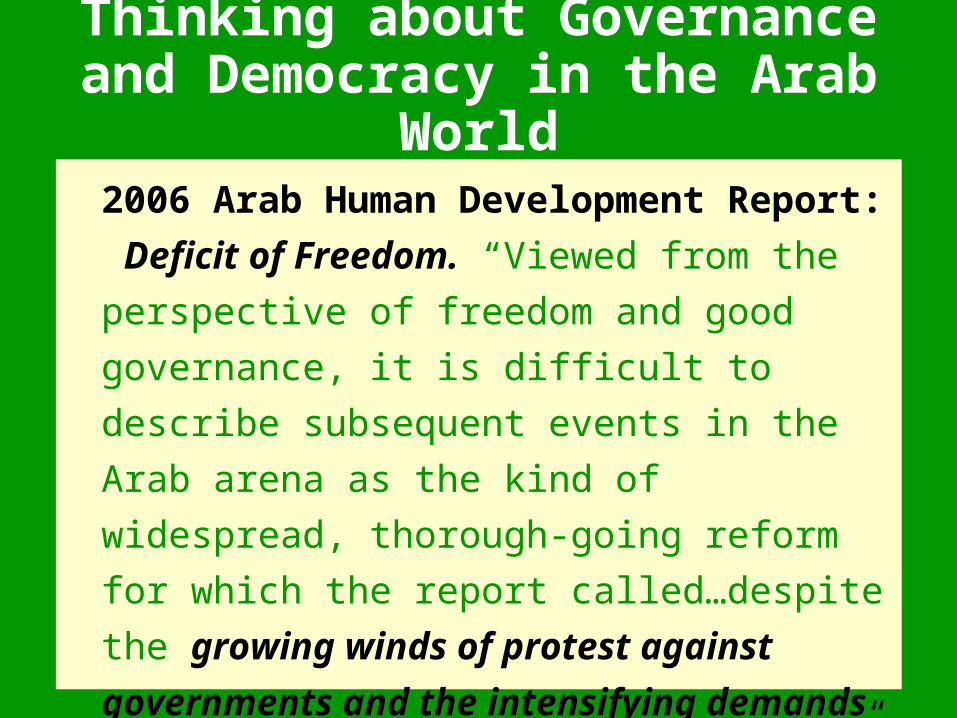
2006 Arab Human Development Report: Deficit
of Freedom. “Viewed from the perspective of
freedom and good governance, it is difficult to
describe subsequent events in the Arab arena as the
kind of widespread, thorough-going reform for
which the report called…despite the growing winds
of protest against governments and the intensifying
demands for radical reform around the Arab
world.”
Thinking about Governance and Democracy in the Arab World
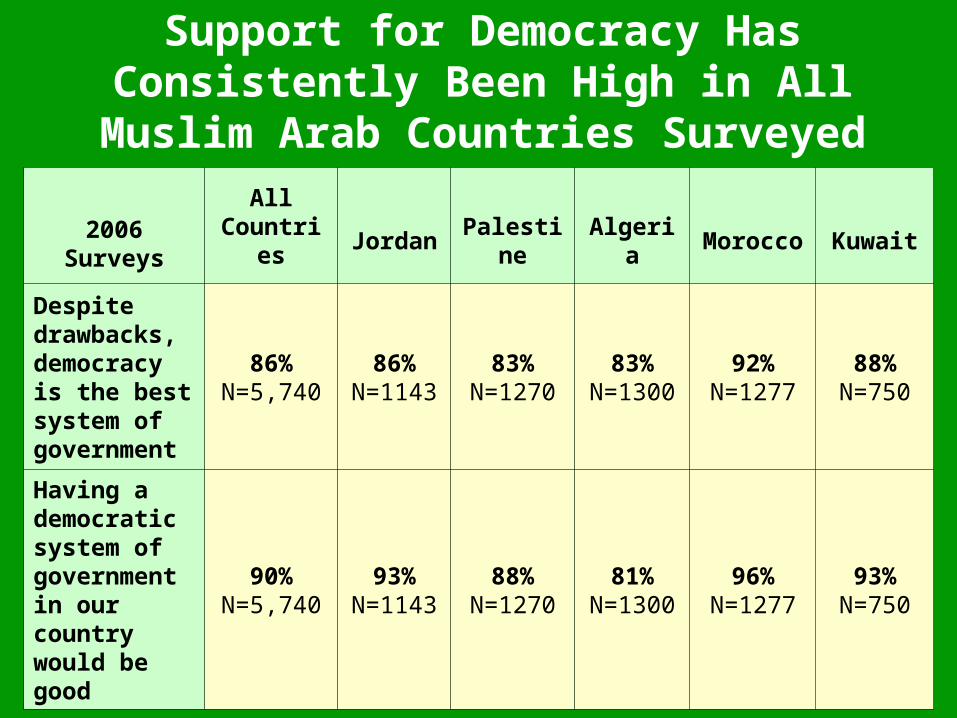
2006 SurveysAll
Countries Jordan Palestine Algeria Morocco Kuwait
Despite drawbacks, democracy is the best system of government
86%N=5,740
86%N=1143
83%N=1270
83%N=1300
92%N=1277
88%N=750
Having a democratic system of government in our country would be good
90%N=5,740
93%N=1143
88%N=1270
81%N=1300
96%N=1277
93%N=750
Support for Democracy Has Consistently Been High in All Muslim Arab Countries Surveyed
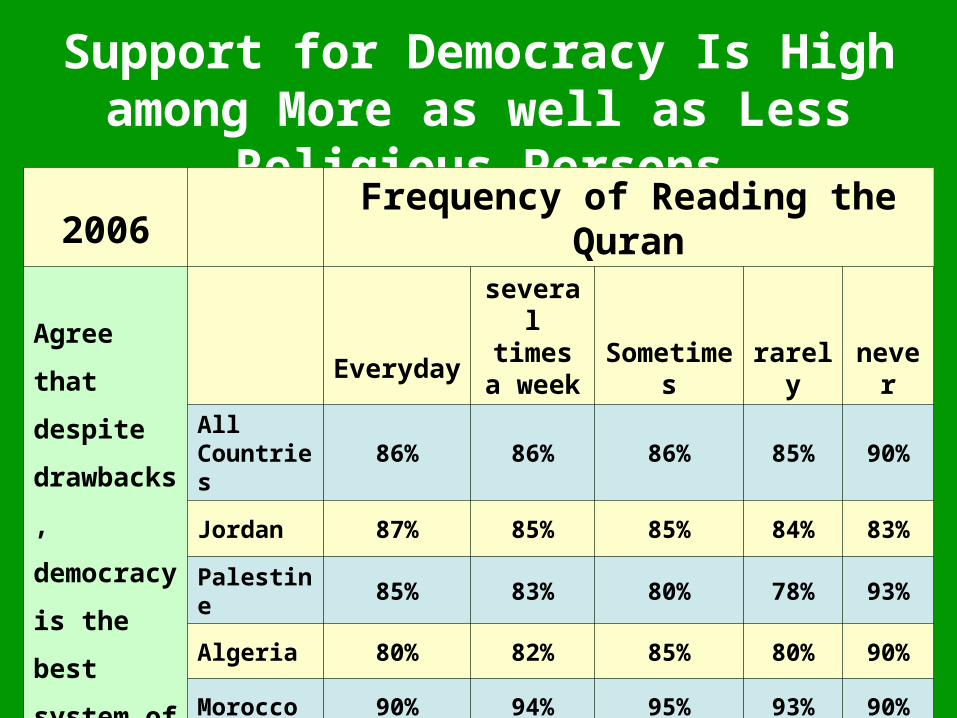
Support for Democracy Is High among More as well as Less Religious Persons
2006 Frequency of Reading the Quran
Agree that
despite
drawbacks,
democracy
is the best
system of
government
Everyday
several times a week Sometimes rarely never
All Countries
86% 86% 86% 85% 90%
Jordan 87% 85% 85% 84% 83%
Palestine 85% 83% 80% 78% 93%
Algeria 80% 82% 85% 80% 90%
Morocco 90% 94% 95% 93% 90%
Kuwait 87% 89% 90% 86% 86%
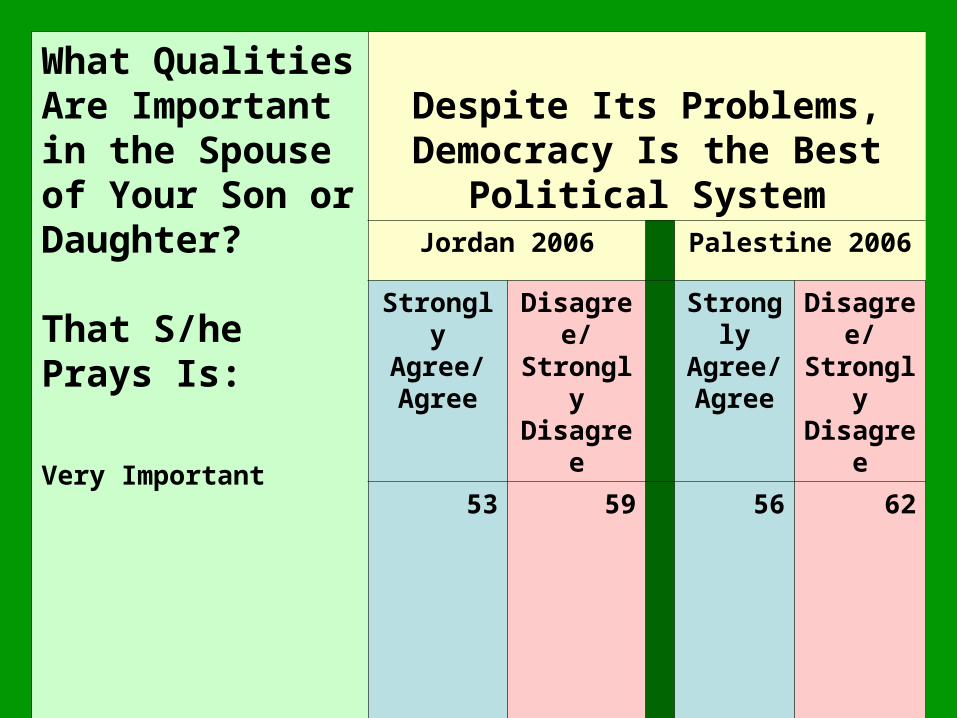
What Qualities Are Important in the Spouse of Your Son or Daughter?
That S/he Prays Is:
Very Important
Despite Its Problems, Democracy Is the Best Political SystemJordan 2006 Palestine 2006
Strongly Agree/Agree
Disagree/Strongly Disagree
StronglyAgree/Agree
Disagree/StronglyDisagree
53 59 56 62
Somewhat Important 26 25 24 20
A little Important 8 6 9 7
Not Important 13 10 11 11
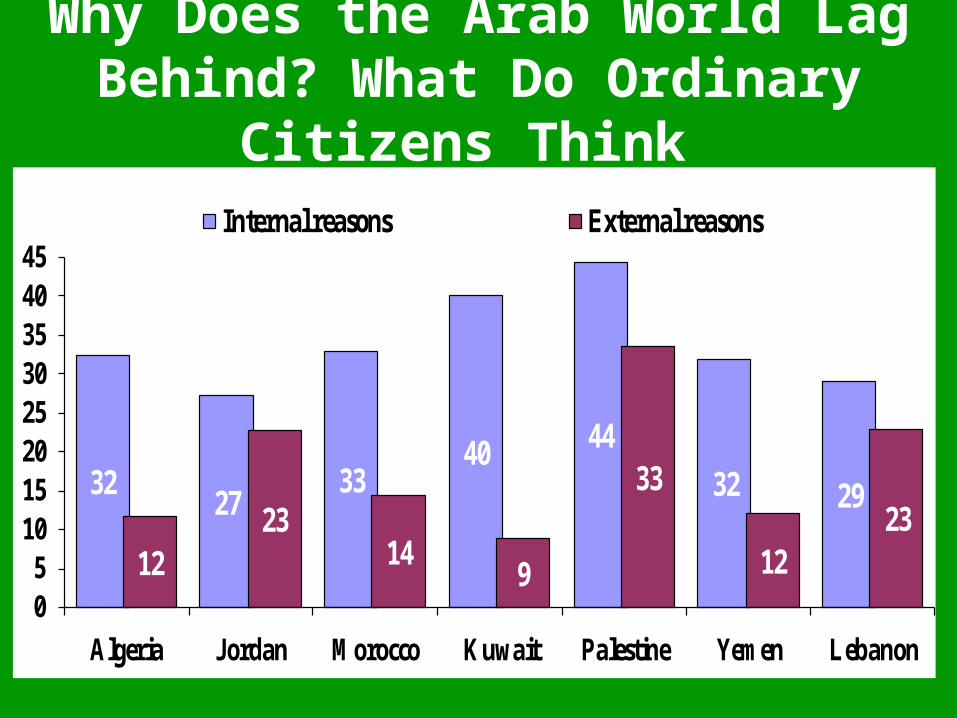
3227
3340 44
32 29
1223
149
33
1223
05
1015202530354045
Algeria Jordan Morocco Kuwait Palestine Yemen Lebanon
Internal reasons External reasons
Why Does the Arab World Lag Behind? What Do Ordinary Citizens Think
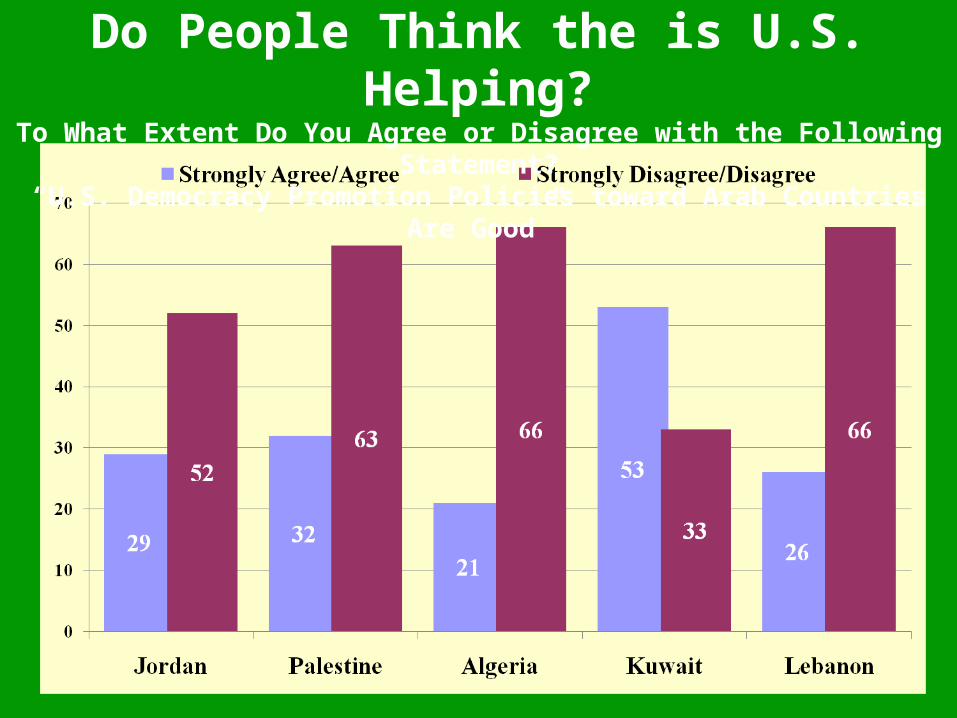
Do People Think the is U.S. Helping?To What Extent Do You Agree or Disagree with the Following Statement?“U.S. Democracy Promotion Policies toward Arab Countries Are Good”
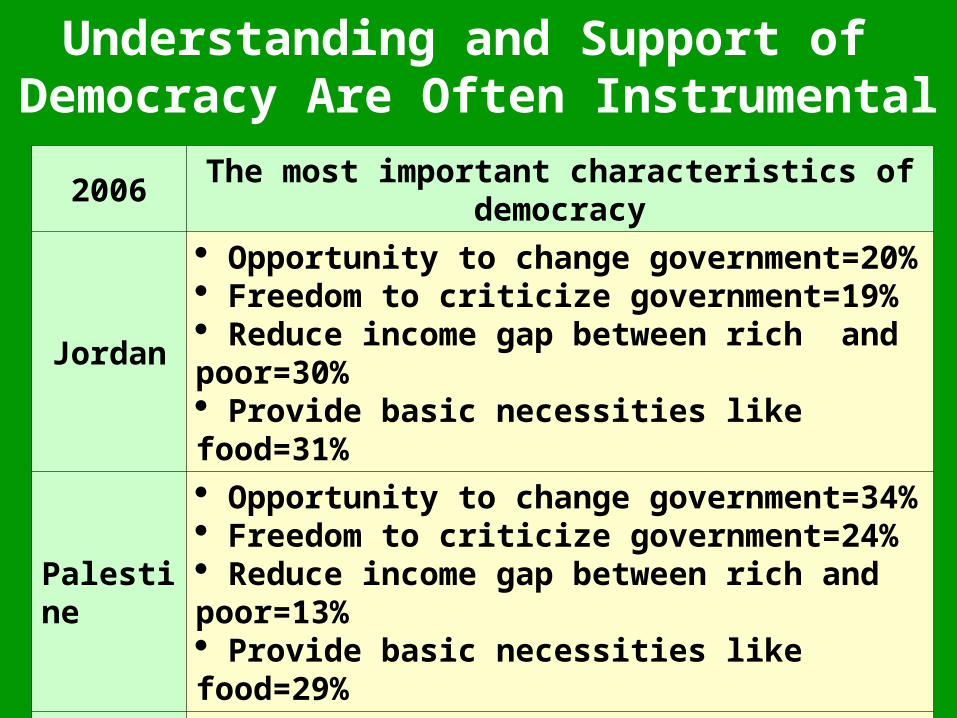
2006 The most important characteristics of democracy
Jordan
Opportunity to change government=20% Freedom to criticize government=19% Reduce income gap between rich and poor=30% Provide basic necessities like food=31%
Palestine
Opportunity to change government=34% Freedom to criticize government=24% Reduce income gap between rich and poor=13% Provide basic necessities like food=29%
Algeria
Opportunity to change government=28% Freedom to criticize government=22% Reduce income gap between rich and poor=30% Provide basic necessities like food=20%
Understanding and Support of Democracy Are Often Instrumental
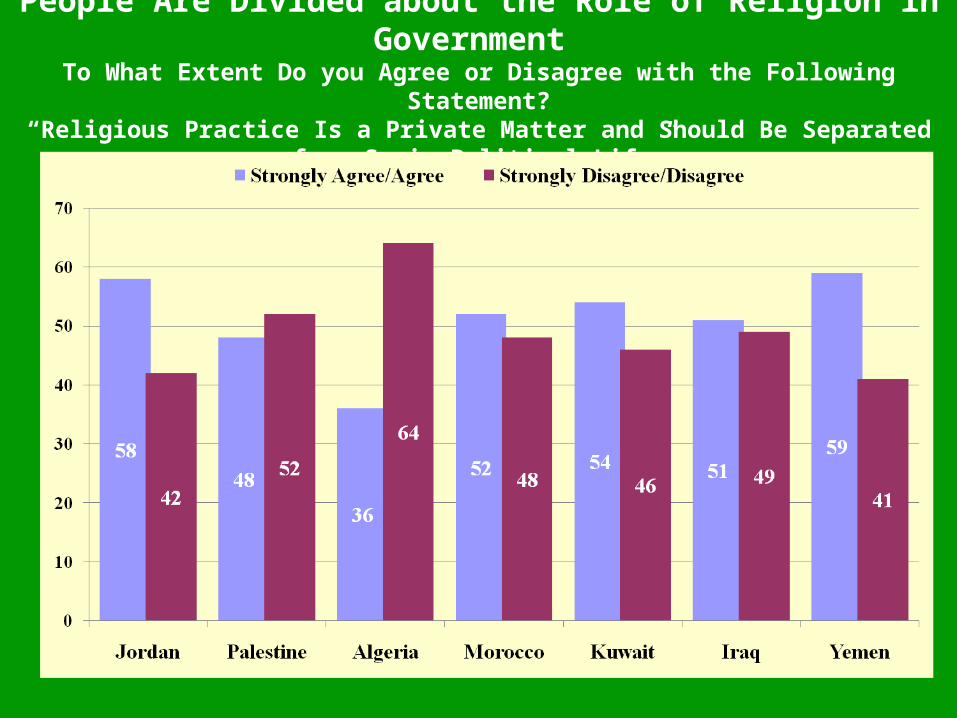
People Are Divided about the Role of Religion in Government To What Extent Do you Agree or Disagree with the Following Statement?
“Religious Practice Is a Private Matter and Should Be Separated from Socio-Political Life”
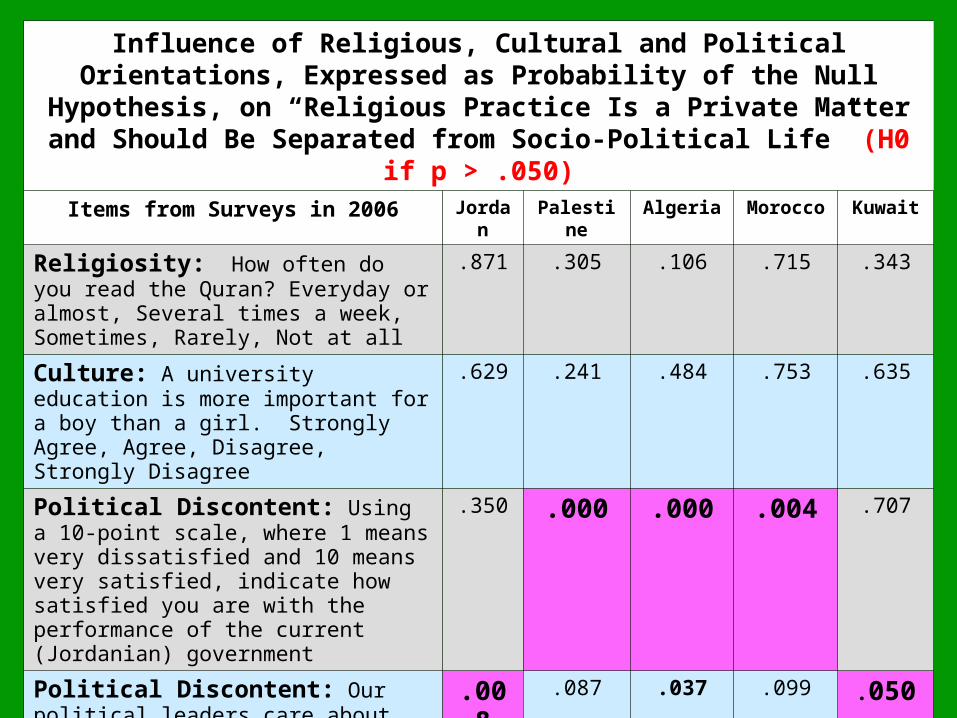
Influence of Religious, Cultural and Political Orientations, Expressed as Probability of the Null Hypothesis, on “Religious Practice Is a Private Matter
and Should Be Separated from Socio-Political Life” (H0 if p > .050)
Items from Surveys in 2006 Jordan Palestine Algeria Morocco Kuwait
Religiosity: How often do you read the Quran? Everyday or almost, Several times a week, Sometimes, Rarely, Not at all
.871 .305 .106 .715 .343
Culture: A university education is more important for a boy than a girl. Strongly Agree, Agree, Disagree, Strongly Disagree
.629 .241 .484 .753 .635
Political Discontent: Using a 10-point scale, where 1 means very dissatisfied and 10 means very satisfied, indicate how satisfied you are with the performance of the current (Jordanian) government
.350 .000 .000 .004 .707
Political Discontent: Our political leaders care about ordinary citizens. Strongly Agree, Agree, Disagree, Strongly Disagree
.008 .087 .037 .099 .050
External Interference: Some people have said that the Arab world lags behind other regions. Which of the following statements do you most agree with? It is because of Domestic factors, Both Domestic and International factors, International factors
.955 .267 .494 .060 .001
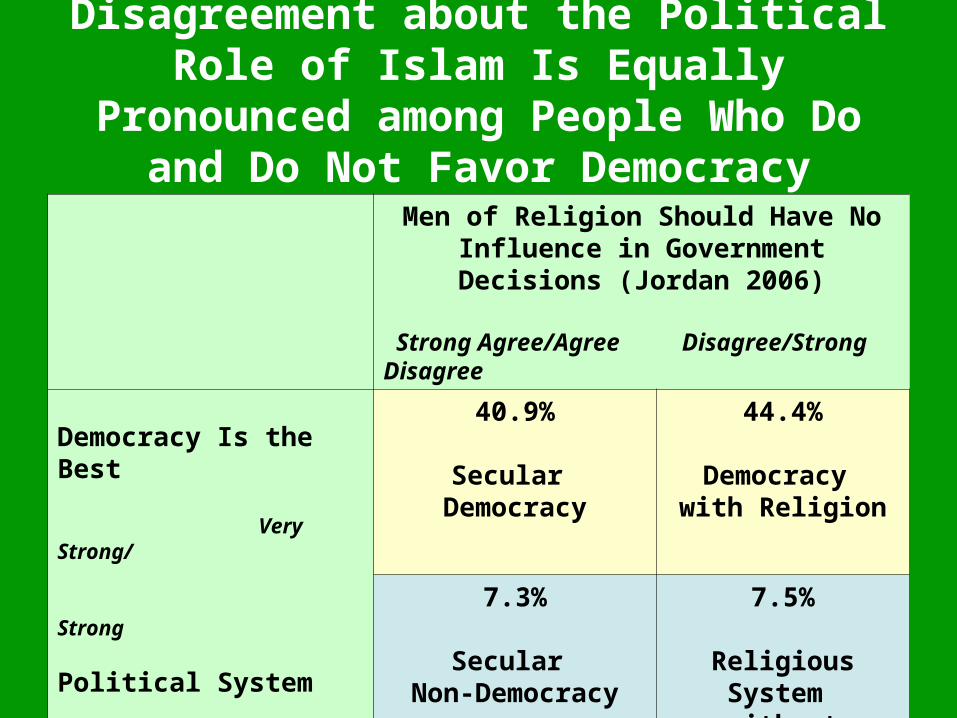
Disagreement about the Political Role of Islam Is Equally Pronounced among People
Who Do and Do Not Favor Democracy
Men of Religion Should Have No Influence in Government Decisions (Jordan 2006)
Strong Agree/Agree Disagree/Strong Disagree
Democracy Is the Best Very Strong/ Strong
Political System
Somewhat Strong/ Not Strong
Despite Its Problems
40.9%
Secular Democracy
44.4%
Democracy with Religion
7.3%
Secular Non-Democracy
7.5%
Religious System without Democracy
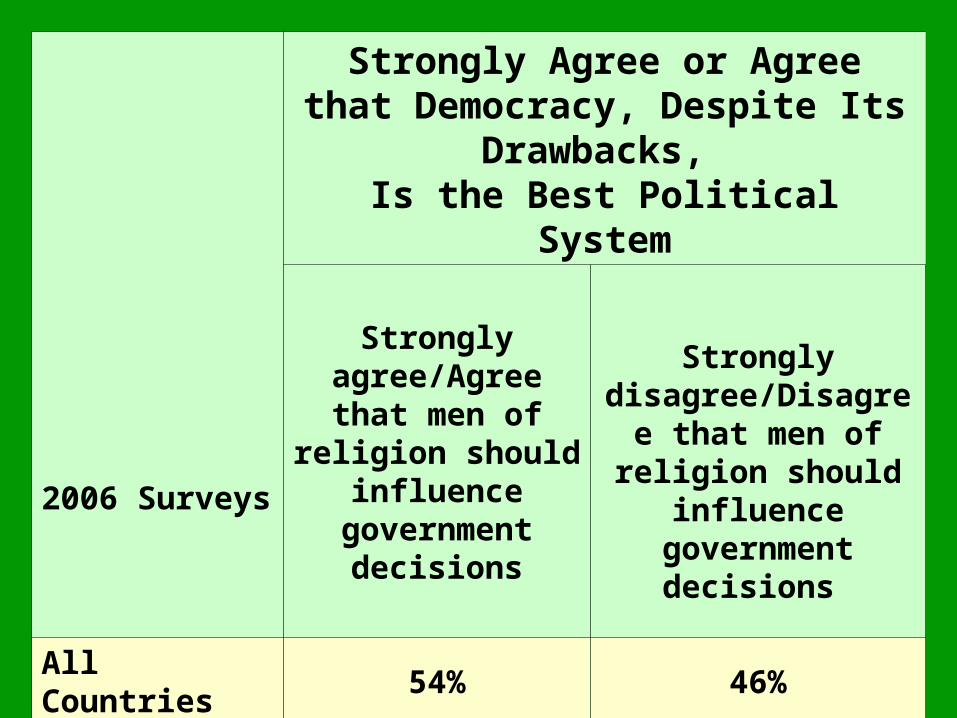
2006 Surveys
Strongly Agree or Agree that Democracy, Despite Its Drawbacks,
Is the Best Political System
Strongly agree/Agree that men of religion
should influence government
decisions
Strongly disagree/Disagree that men of religion should influence government
decisions
All Countries 54% 46%
Jordan 52% 48%
Palestine 55% 45%
Algeria 58% 42%
Morocco 63% 37%
Kuwait 39% 61%
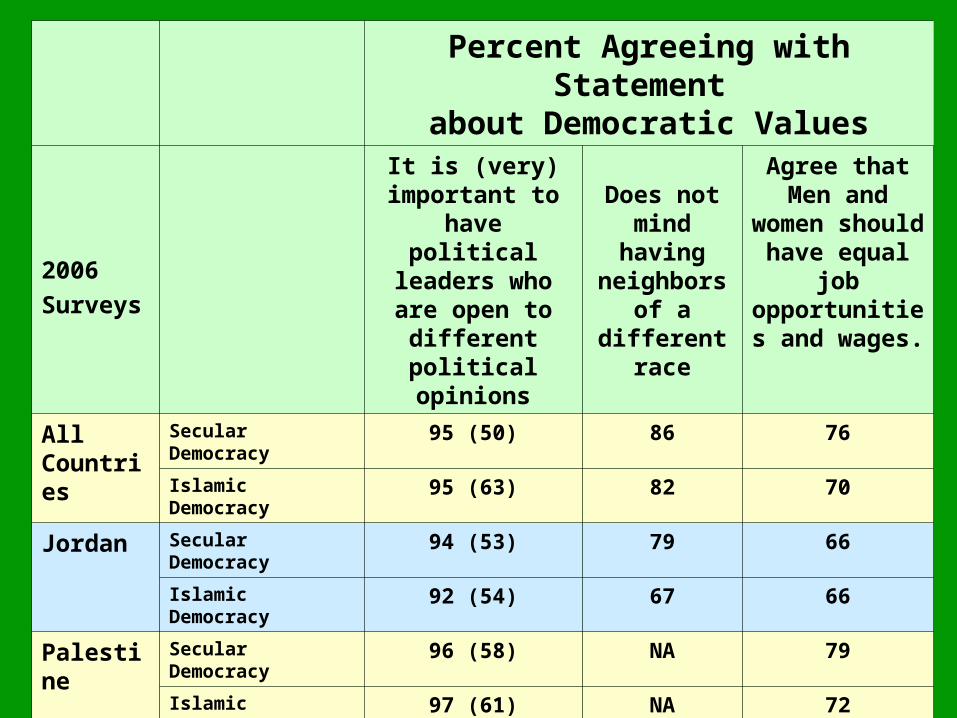
Percent Agreeing with Statement about Democratic Values
2006
Surveys
It is (very) important to have political leaders who are open to
different political opinions
Does not mind having neighbors of a different
race
Agree that Men and women should have
equal job opportunities
and wages.
All Countries
Secular Democracy 95 (50) 86 76
Islamic Democracy 95 (63) 82 70
Jordan Secular Democracy 94 (53) 79 66
Islamic Democracy 92 (54) 67 66
Palestine Secular Democracy 96 (58) NA 79
Islamic Democracy 97 (61) NA 72
Algeria Secular Democracy 95 (60) 83 71
Islamic Democracy 96 (66) 80 57
Morocco Secular Democracy 93 (62) 94 78
Islamic Democracy 95 (64) 89 77
Kuwait Secular Democracy 96 (64) 88 85
Islamic Democracy 98 (71) 92 84
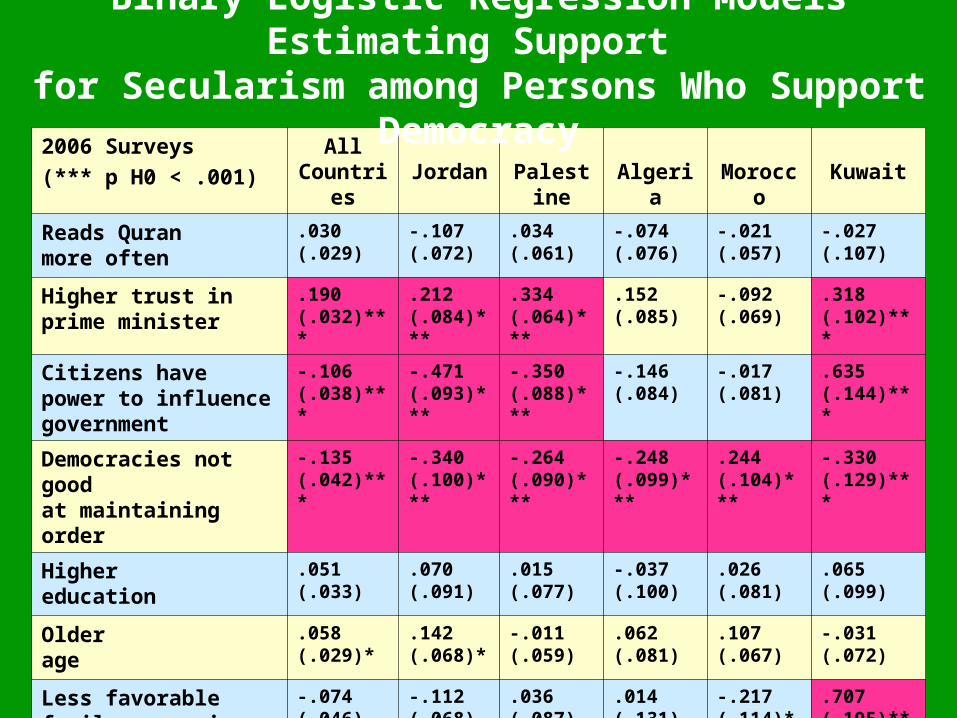
2006 Surveys
(*** p H0 < .001)
All Countries Jordan Palestine Algeria Morocco Kuwait
Reads Quranmore often
.030(.029)
-.107(.072)
.034(.061)
-.074(.076)
-.021(.057)
-.027(.107)
Higher trust in prime minister
.190(.032)***
.212(.084)***
.334(.064)***
.152(.085)
-.092(.069)
.318(.102)***
Citizens have power to influence government
-.106(.038)***
-.471(.093)***
-.350(.088)***
-.146(.084)
-.017(.081)
.635(.144)***
Democracies not good at maintaining order
-.135(.042)***
-.340(.100)***
-.264(.090)***
-.248(.099)***
.244(.104)***
-.330(.129)***
Higher education
.051(.033)
.070(.091)
.015(.077)
-.037(.100)
.026(.081)
.065(.099)
Older age
.058(.029)*
.142(.068)*
-.011(.059)
.062(.081)
.107(.067)
-.031(.072)
Less favorable family economic situation
-.074(.046)
-.112(.068)
.036(.087)
.014(.131)
-.217(.114)*
.707(.195)***
Constant -.328(.240)
-2.267(.568)***
-.853(.525)
-1.100(.672)
.094(.594)
.334(.754)
Binary Logistic Regression Models Estimating Support for Secularism among Persons Who Support Democracy
Presentation to Press and Others in Morocco