Embed Size (px)
Citation preview
How Firms Respond to Business Cycles: The Role of the Firm Age and Firm Size
Teresa Fort Tuck School of Business at Dartmouth
John Haltiwanger
University of Maryland
Ron S. Jarmin U.S. Census Bureau
Javier Miranda
U.S. Census Bureau
Paper presented at the 13th Jacques Polak Annual Research Conference Hosted by the International Monetary Fund Washington, DC─November 8–9, 2012 The views expressed in this paper are those of the author(s) only, and the presence
of them, or of links to them, on the IMF website does not imply that the IMF, its Executive Board, or its management endorses or shares the views expressed in the paper.
1133TTHH JJAACCQQUUEESS PPOOLLAAKK AANNNNUUAALL RREESSEEAARRCCHH CCOONNFFEERREENNCCEE NNOOVVEEMMBBEERR 88––99,, 22001122
How Firms Respond to Business Cycles: The Role of Firm Age and Firm Size
November 2012
by
Teresa Fort, Tuck School of Business John Haltiwanger, University of Maryland
Ron Jarmin, U.S. Census Bureau Javier Miranda, U.S. Census Bureau
We thank the Kauffman Foundation for financial support. Any opinions and conclusions expressed herein are those of the authors and do not necessarily represent the views of the
U.S. Census Bureau. All results have been reviewed to ensure that no confidential information is disclosed.
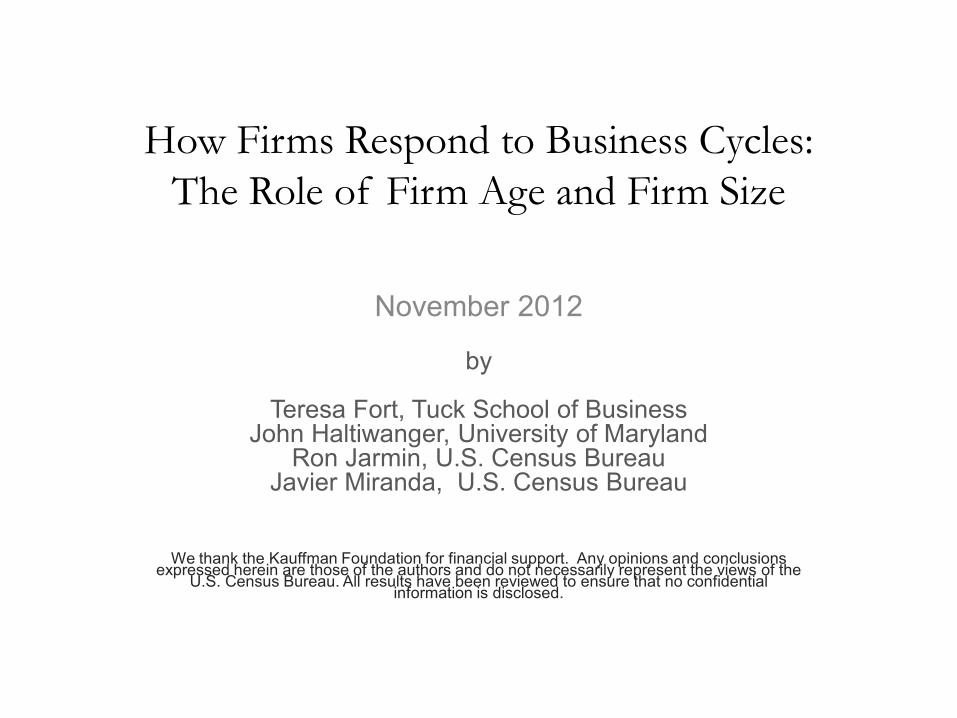
Overview • Main Theme: Important to Distinguish Between Firm Age and Firm
Size for Cyclical Dynamics – Most of focus in literature has been on firm size.
• Debate about sensitivity to different types of shocks – Firm age and firm size related but not the same
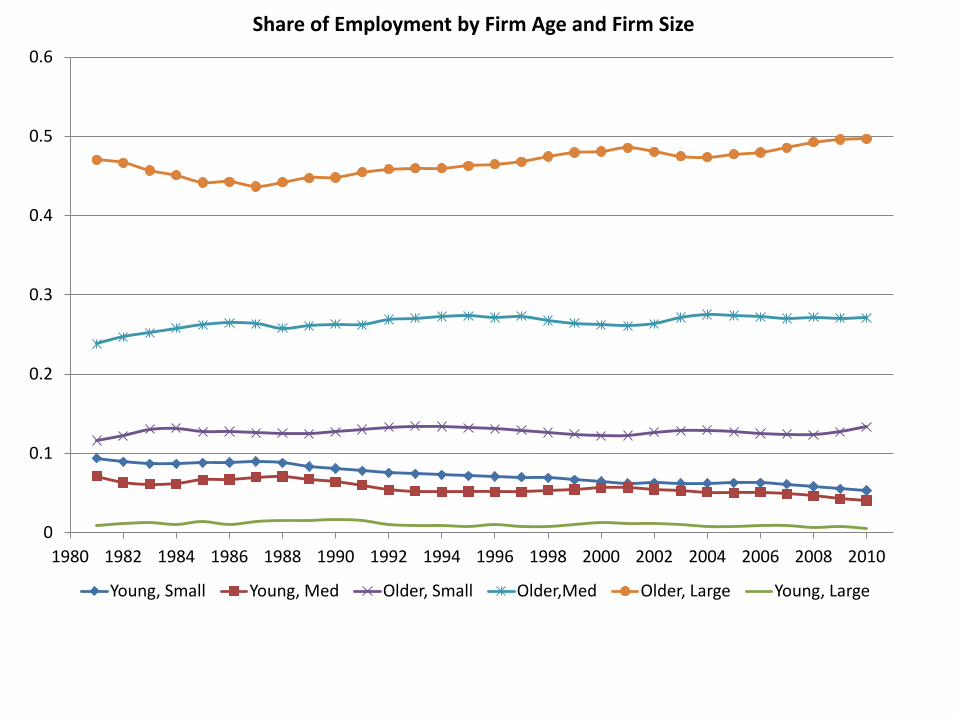
• Young firms are small but many mature, small firms. • They have very different dynamics.
• Young firms (which are small and medium size) hit especially hard in Great Recession. – Why? – Our answer: Collapse of Housing Prices an Important Contributor
• Young firms hit especially hard in states with especially large declines in housing prices.
• Estimate a panel VAR at state*year level to isolate local housing price effects from local cyclical shocks.
• Consistent with home equity/financing channel for young businesses but other mechanisms may be at work as well.
0
0.1
0.2
0.3
0.4
0.5
0.6
1980 1982 1984 1986 1988 1990 1992 1994 1996 1998 2000 2002 2004 2006 2008 2010
Share of Employment by Firm Age and Firm Size
Young, Small Young, Med Older, Small Older,Med Older, Large Young, Large
-0.2
-0.15
-0.1
-0.05
0
0.05
0.1
0.15
0.2
0.25
0.3
0.35
1980 1982 1984 1986 1988 1990 1992 1994 1996 1998 2000 2002 2004 2006 2008 2010
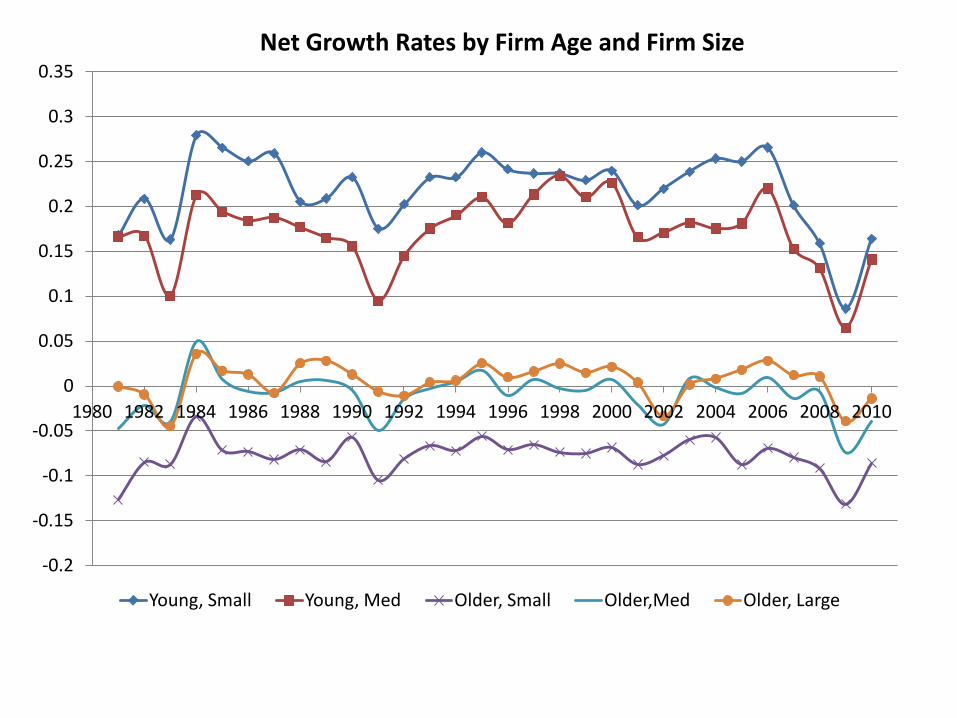
Net Growth Rates by Firm Age and Firm Size
Young, Small Young, Med Older, Small Older,Med Older, Large
0
0.1
0.2
0.3
0.4
0.5
0.6
1980 1982 1984 1986 1988 1990 1992 1994 1996 1998 2000 2002 2004 2006 2008 2010
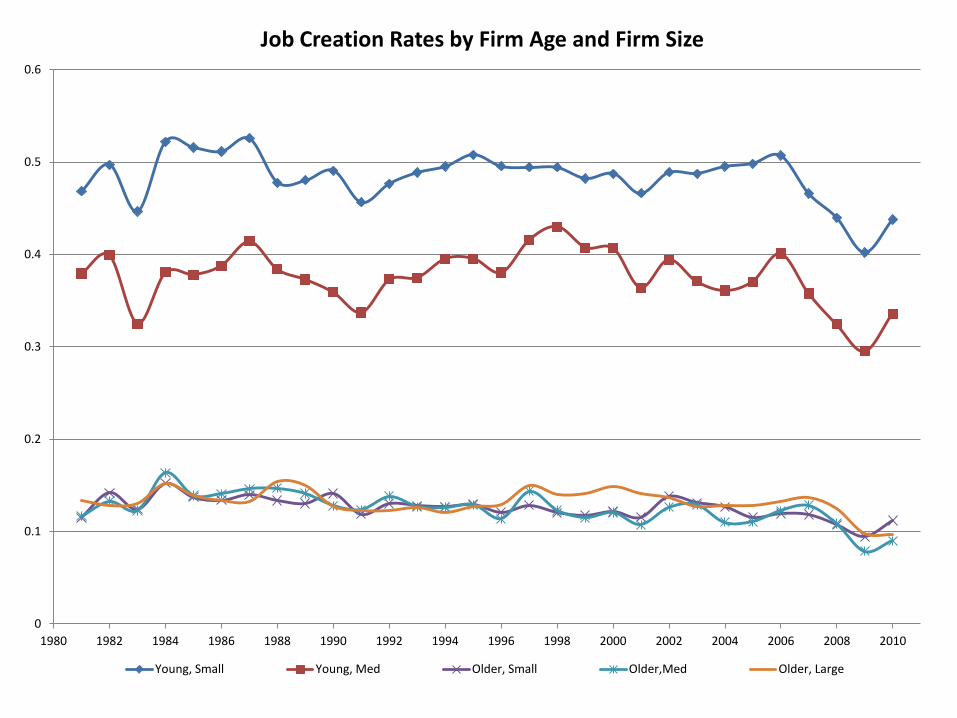
Job Creation Rates by Firm Age and Firm Size
Young, Small Young, Med Older, Small Older,Med Older, Large
0
0.05
0.1
0.15
0.2
0.25
0.3
0.35
1980 1982 1984 1986 1988 1990 1992 1994 1996 1998 2000 2002 2004 2006 2008 2010
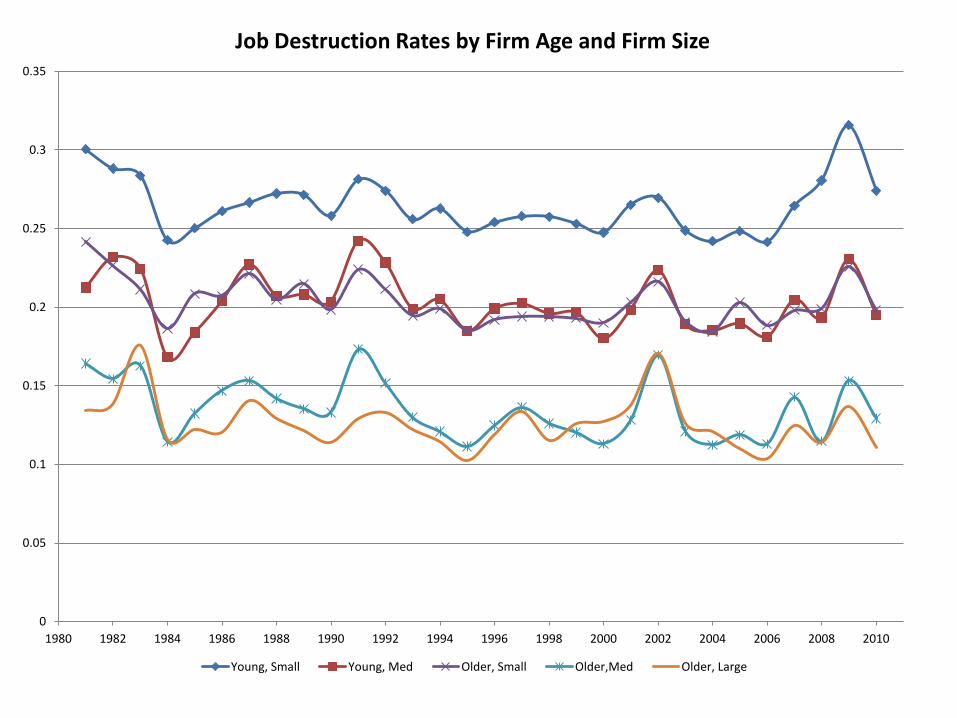
Job Destruction Rates by Firm Age and Firm Size
Young, Small Young, Med Older, Small Older,Med Older, Large
-0.15
-0.1
-0.05
0
0.05
0.1
0.15
0.2
0.25
0.3
1980 1982 1984 1986 1988 1990 1992 1994 1996 1998 2000 2002 2004 2006 2008 2010
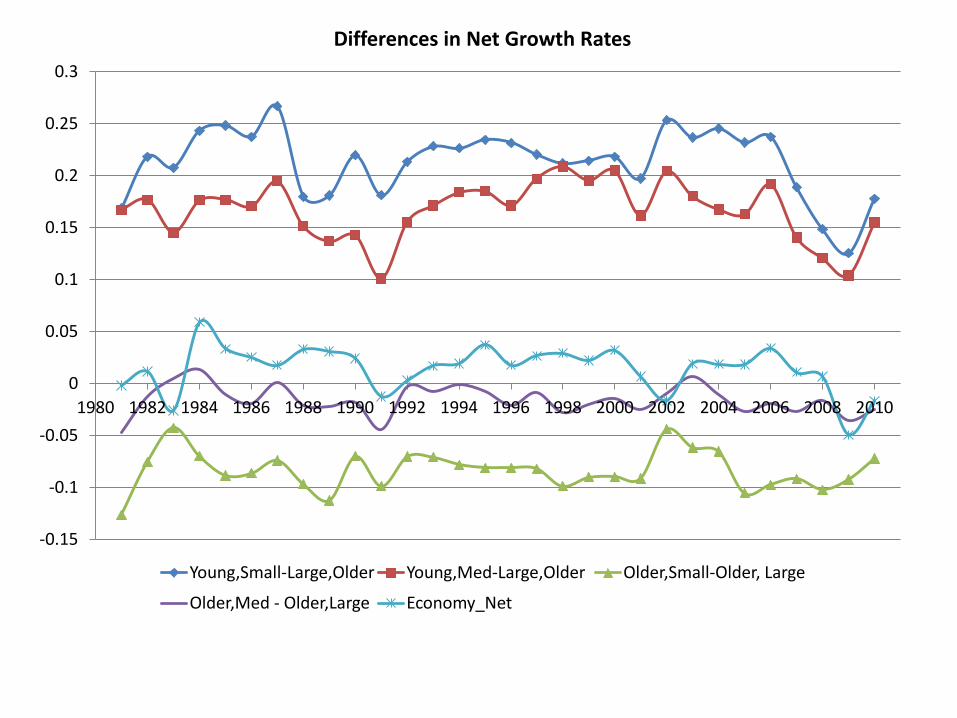
Differences in Net Growth Rates
Young,Small-Large,Older Young,Med-Large,Older Older,Small-Older, Large
Older,Med - Older,Large Economy_Net
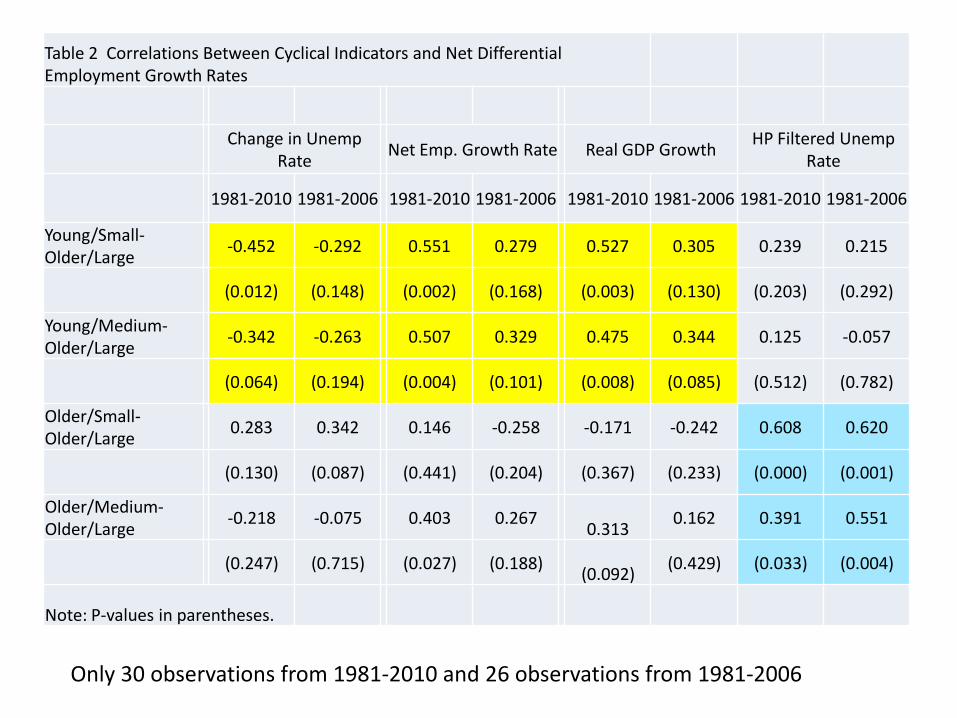
Table 2 Correlations Between Cyclical Indicators and Net Differential Employment Growth Rates
Change in Unemp
Rate Net Emp. Growth Rate Real GDP Growth HP Filtered Unemp Rate
1981-2010 1981-2006 1981-2010 1981-2006 1981-2010 1981-2006 1981-2010 1981-2006
Young/Small-Older/Large -0.452 -0.292 0.551 0.279 0.527 0.305 0.239 0.215
(0.012) (0.148) (0.002) (0.168) (0.003) (0.130) (0.203) (0.292)
Young/Medium-Older/Large -0.342 -0.263 0.507 0.329 0.475 0.344 0.125 -0.057
(0.064) (0.194) (0.004) (0.101) (0.008) (0.085) (0.512) (0.782)
Older/Small-Older/Large 0.283 0.342 0.146 -0.258 -0.171 -0.242 0.608 0.620
(0.130) (0.087) (0.441) (0.204) (0.367) (0.233) (0.000) (0.001)
Older/Medium-Older/Large -0.218 -0.075 0.403 0.267
0.313 0.162 0.391 0.551
(0.247) (0.715) (0.027) (0.188) (0.092)
(0.429) (0.033) (0.004)
Note: P-values in parentheses.
Only 30 observations from 1981-2010 and 26 observations from 1981-2006
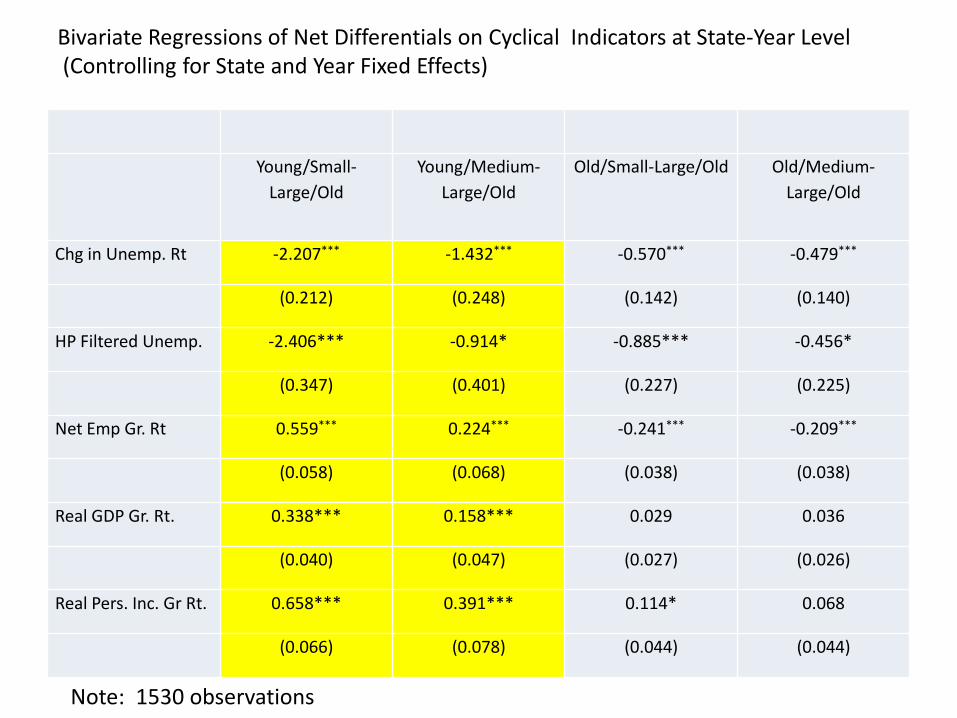
Young/Small-Large/Old
Young/Medium-Large/Old
Old/Small-Large/Old Old/Medium-Large/Old
Chg in Unemp. Rt -2.207*** -1.432*** -0.570*** -0.479***
(0.212) (0.248) (0.142) (0.140)
HP Filtered Unemp. -2.406*** -0.914* -0.885*** -0.456*
(0.347) (0.401) (0.227) (0.225)
Net Emp Gr. Rt 0.559*** 0.224*** -0.241*** -0.209***
(0.058) (0.068) (0.038) (0.038)
Real GDP Gr. Rt. 0.338*** 0.158*** 0.029 0.036
(0.040) (0.047) (0.027) (0.026)
Real Pers. Inc. Gr Rt. 0.658*** 0.391*** 0.114* 0.068
(0.066) (0.078) (0.044) (0.044)
Bivariate Regressions of Net Differentials on Cyclical Indicators at State-Year Level (Controlling for State and Year Fixed Effects)
Note: 1530 observations
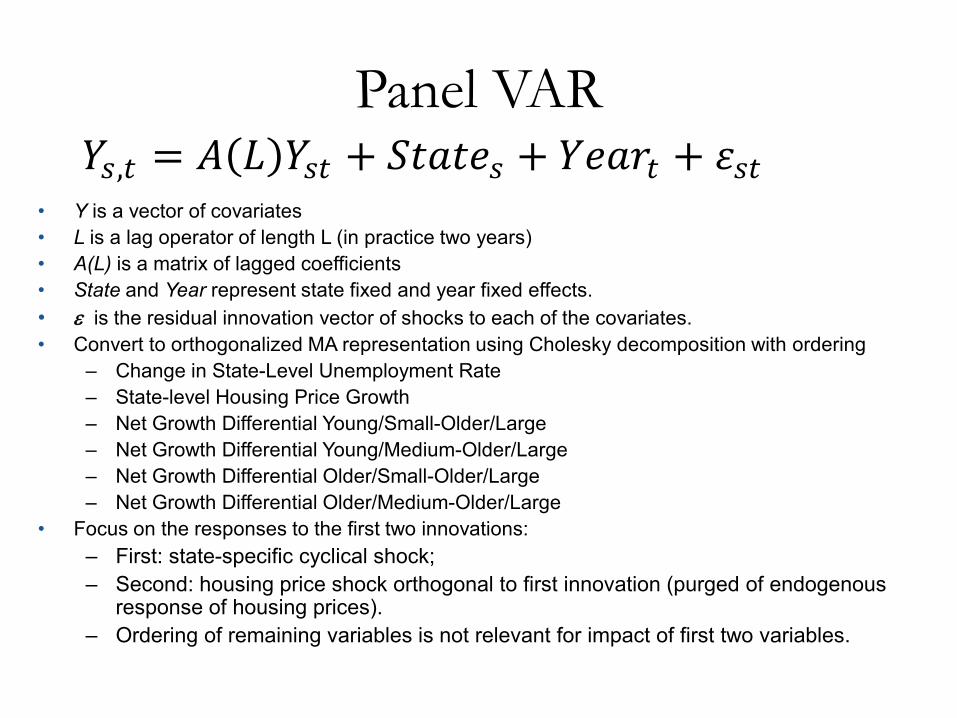
Panel VAR 𝑌𝑌𝑠𝑠,𝑡𝑡 = 𝐴𝐴(𝐿𝐿)𝑌𝑌𝑠𝑠𝑡𝑡 + 𝑆𝑆𝑡𝑡𝑆𝑆𝑡𝑡𝑆𝑆𝑠𝑠 + 𝑌𝑌𝑆𝑆𝑆𝑆𝑌𝑌𝑡𝑡 + 𝜀𝜀𝑠𝑠𝑡𝑡
• Y is a vector of covariates • L is a lag operator of length L (in practice two years) • A(L) is a matrix of lagged coefficients • State and Year represent state fixed and year fixed effects. • ε is the residual innovation vector of shocks to each of the covariates. • Convert to orthogonalized MA representation using Cholesky decomposition with ordering
– Change in State-Level Unemployment Rate – State-level Housing Price Growth – Net Growth Differential Young/Small-Older/Large – Net Growth Differential Young/Medium-Older/Large – Net Growth Differential Older/Small-Older/Large – Net Growth Differential Older/Medium-Older/Large
• Focus on the responses to the first two innovations: – First: state-specific cyclical shock; – Second: housing price shock orthogonal to first innovation (purged of endogenous
response of housing prices). – Ordering of remaining variables is not relevant for impact of first two variables.
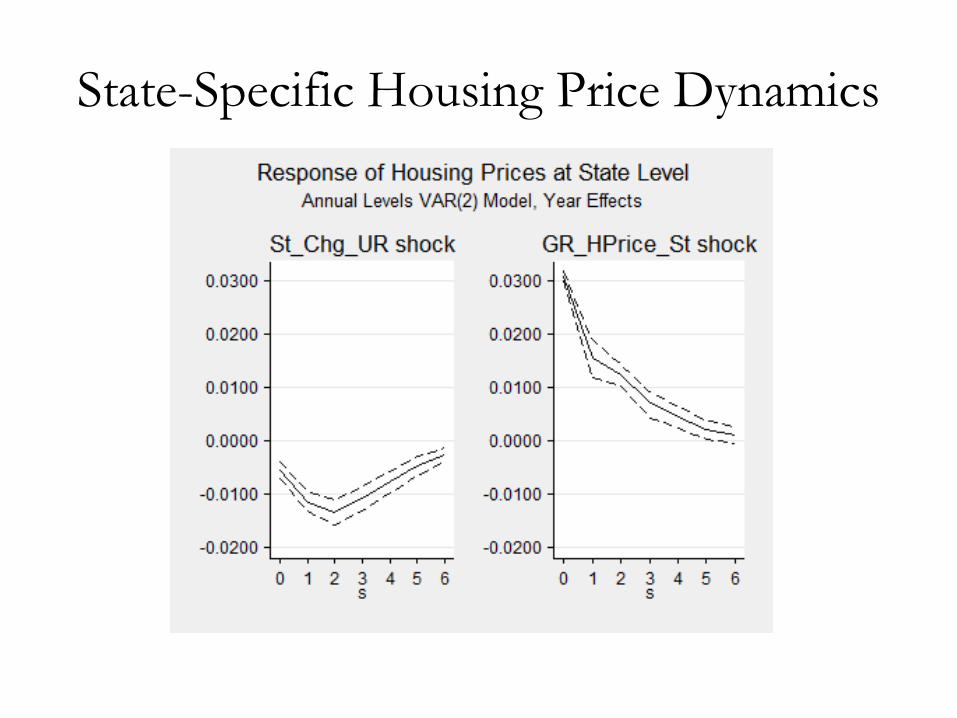
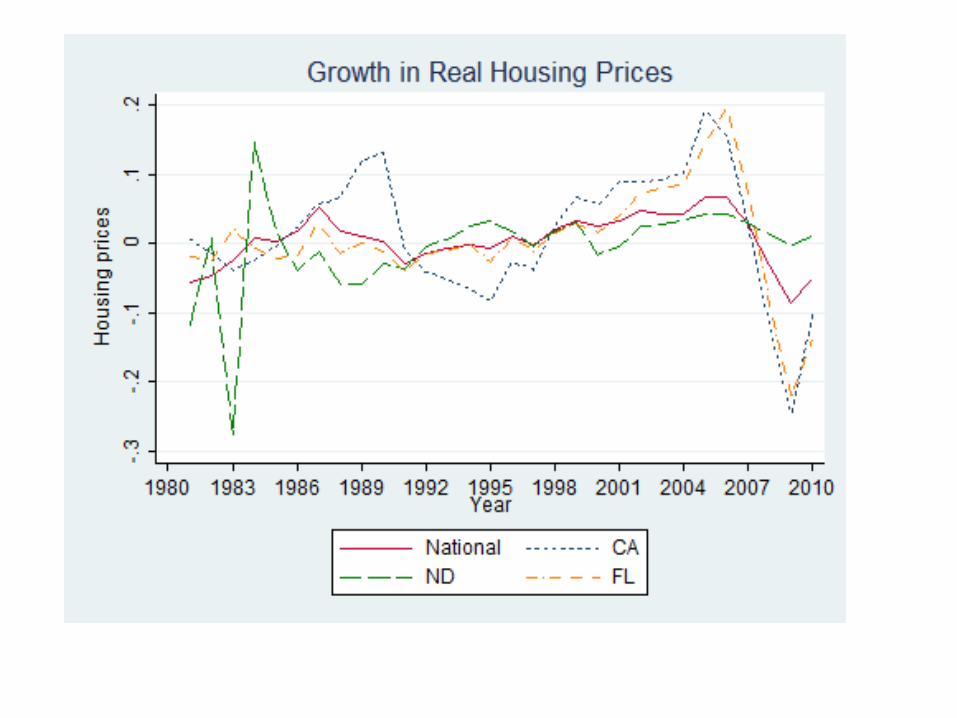
State-Specific Housing Price Dynamics
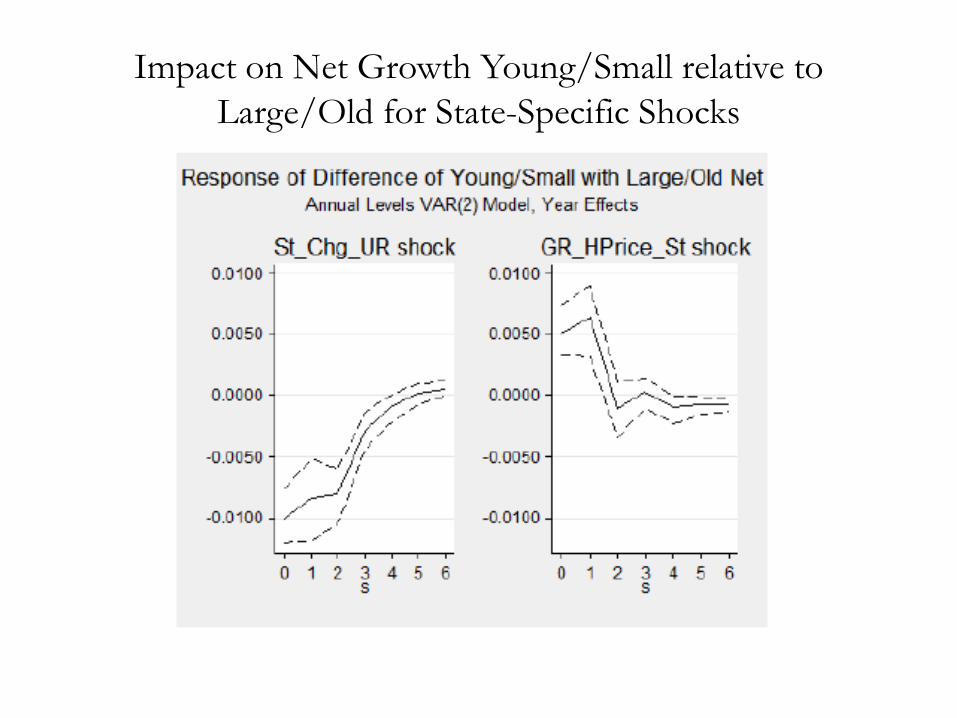
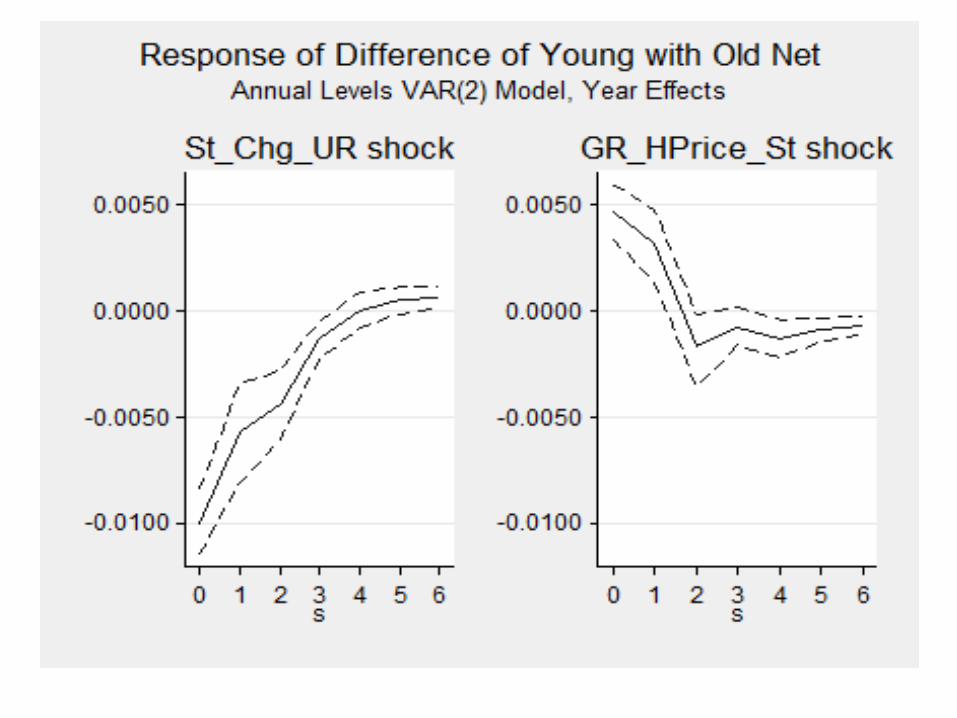
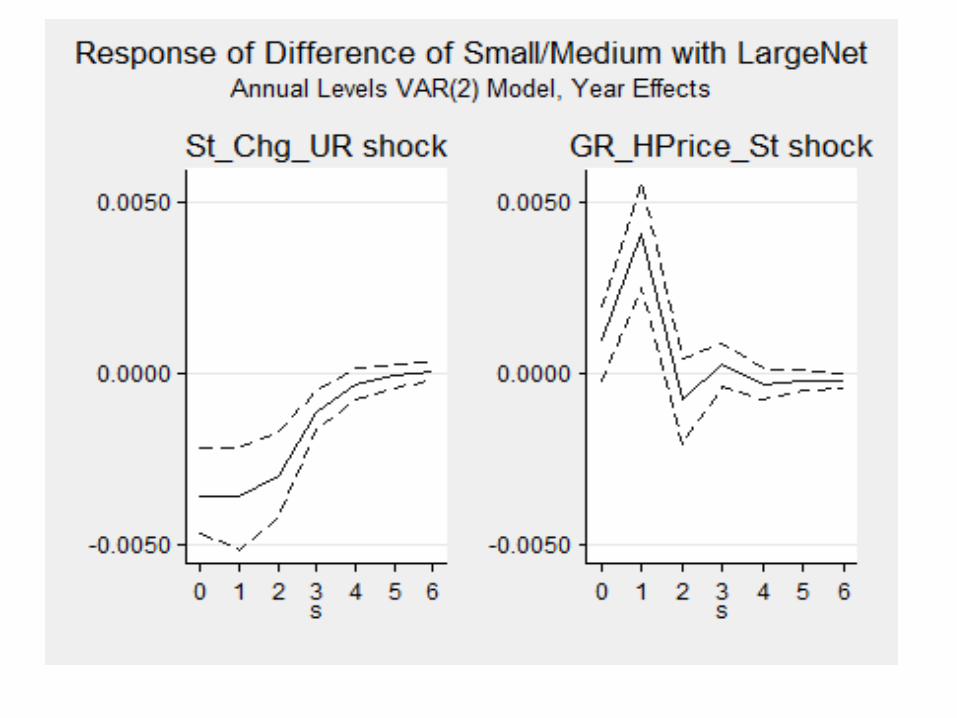
Impact on Net Growth Young/Small relative to Large/Old for State-Specific Shocks
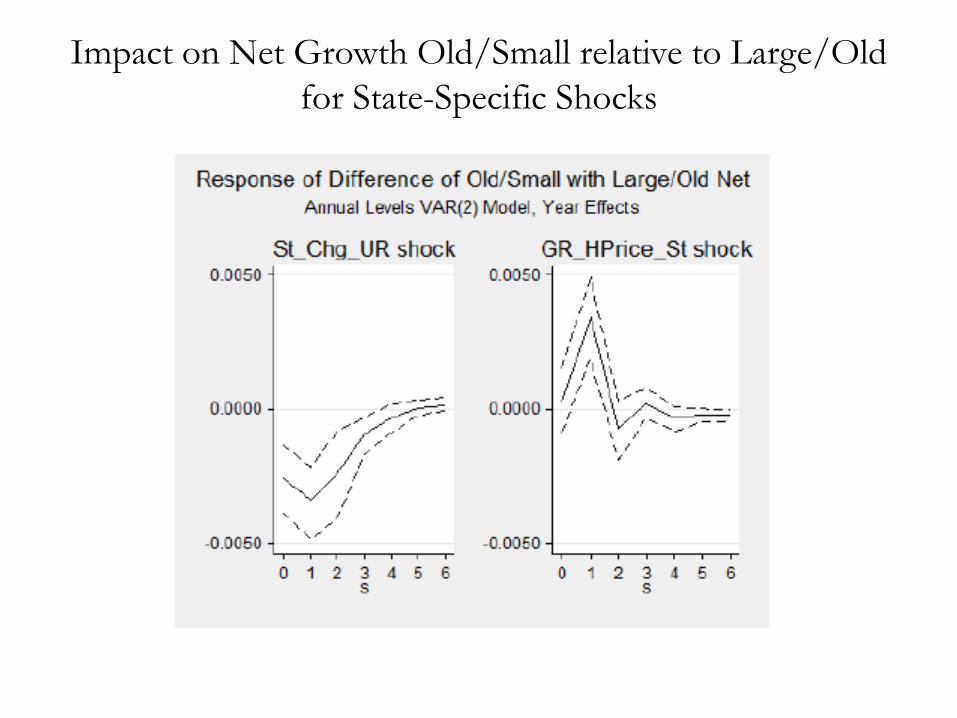
Impact on Net Growth Old/Small relative to Large/Old for State-Specific Shocks
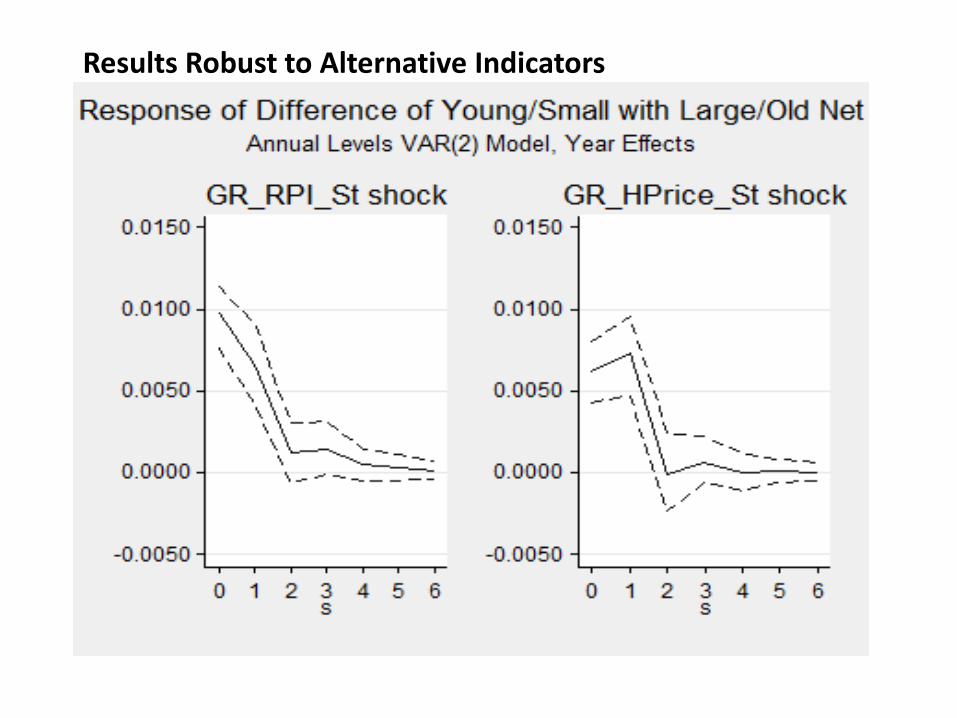
Results Robust to Alternative Indicators
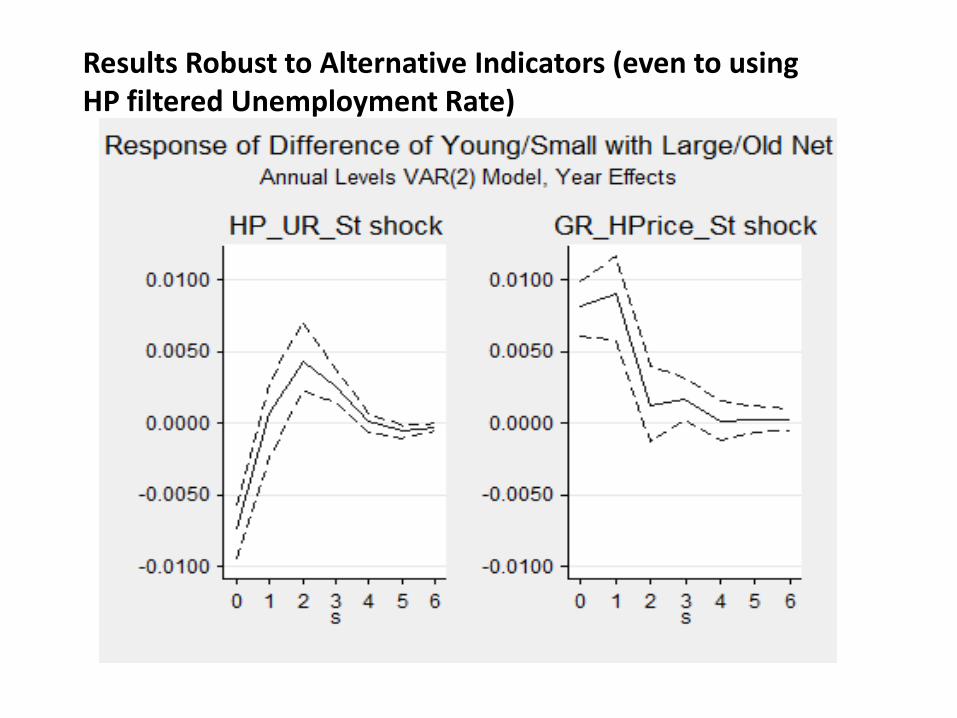
Results Robust to Alternative Indicators (even to using HP filtered Unemployment Rate)
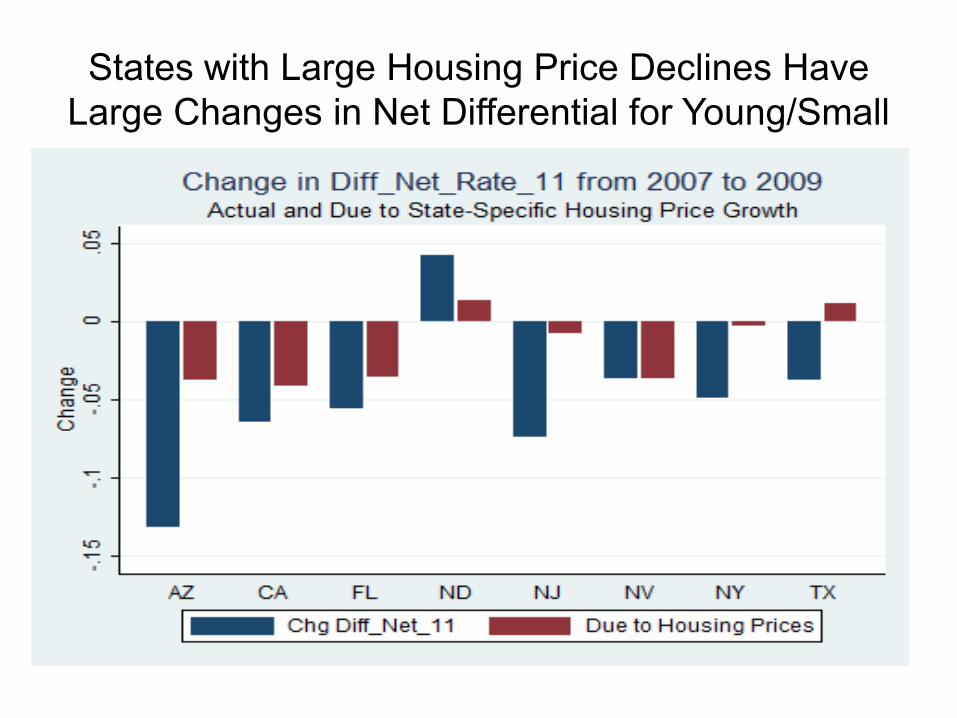
States with Large Housing Price Declines Have Large Changes in Net Differential for Young/Small
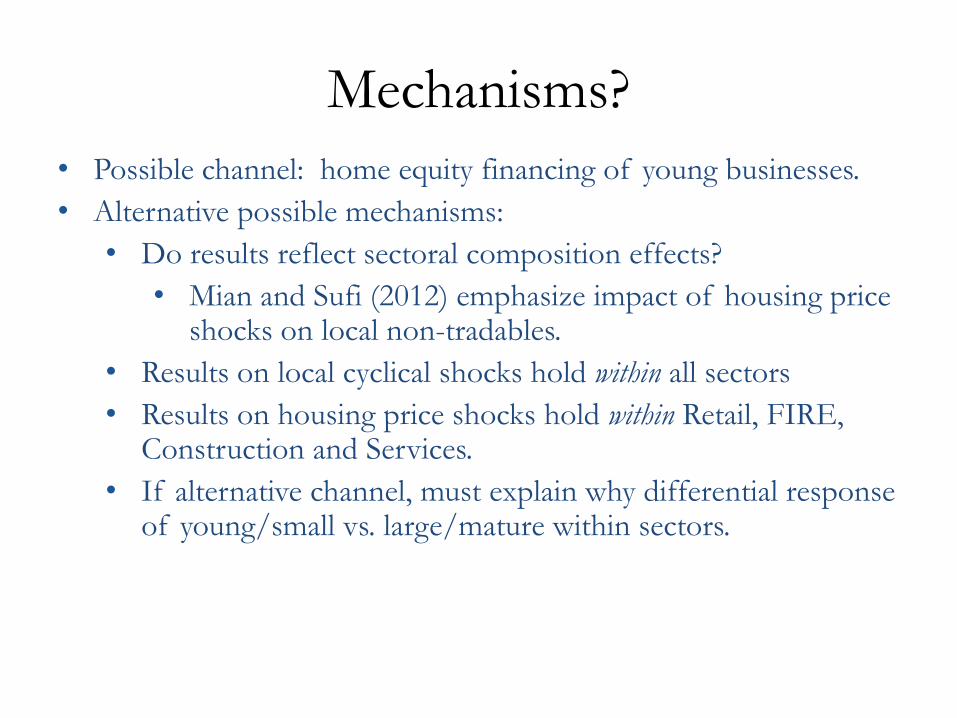
Mechanisms?
• Possible channel: home equity financing of young businesses. • Alternative possible mechanisms:
• Do results reflect sectoral composition effects? • Mian and Sufi (2012) emphasize impact of housing price
shocks on local non-tradables. • Results on local cyclical shocks hold within all sectors • Results on housing price shocks hold within Retail, FIRE,
Construction and Services. • If alternative channel, must explain why differential response
of young/small vs. large/mature within sectors.
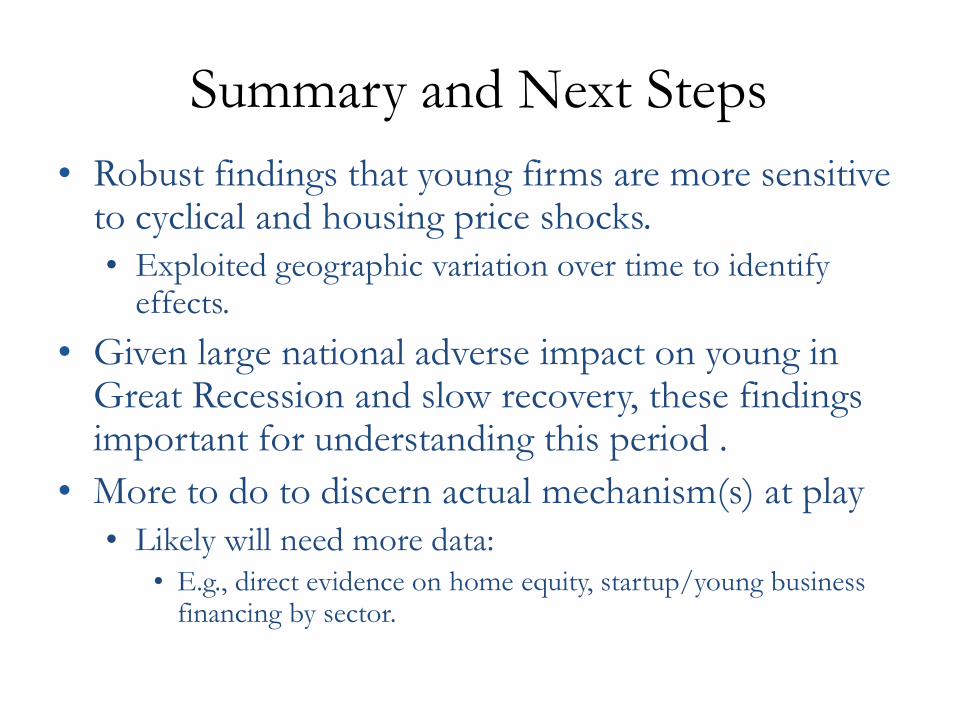
Summary and Next Steps • Robust findings that young firms are more sensitive
to cyclical and housing price shocks. • Exploited geographic variation over time to identify
effects. • Given large national adverse impact on young in
Great Recession and slow recovery, these findings important for understanding this period .
• More to do to discern actual mechanism(s) at play • Likely will need more data:
• E.g., direct evidence on home equity, startup/young business financing by sector.

Extra Slides
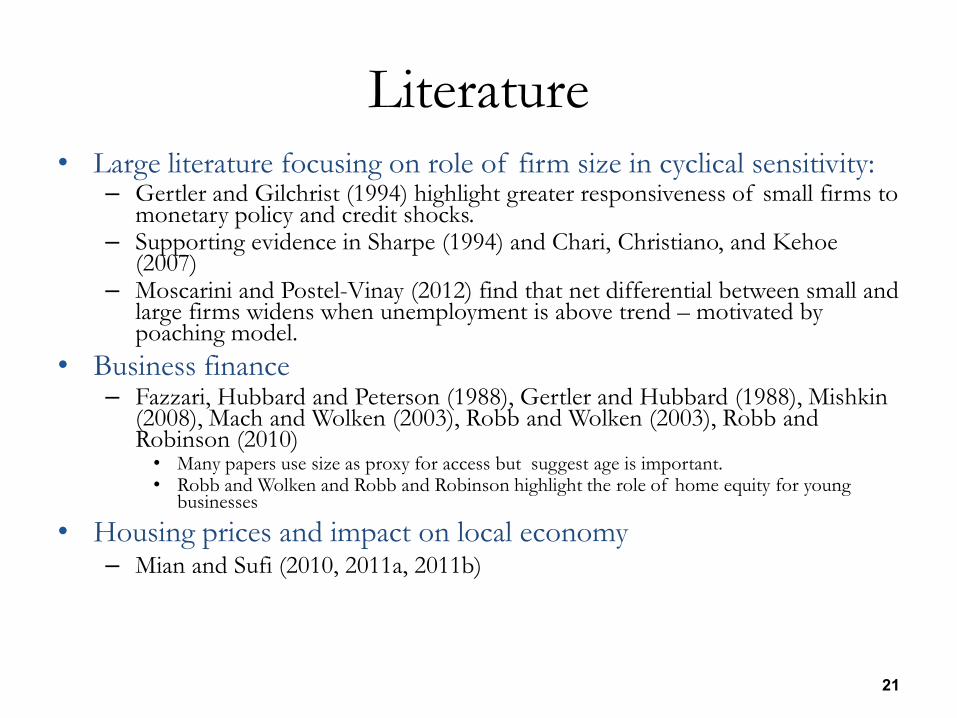
Literature • Large literature focusing on role of firm size in cyclical sensitivity:
– Gertler and Gilchrist (1994) highlight greater responsiveness of small firms to monetary policy and credit shocks.
– Supporting evidence in Sharpe (1994) and Chari, Christiano, and Kehoe (2007)
– Moscarini and Postel-Vinay (2012) find that net differential between small and large firms widens when unemployment is above trend – motivated by poaching model.
• Business finance – Fazzari, Hubbard and Peterson (1988), Gertler and Hubbard (1988), Mishkin
(2008), Mach and Wolken (2003), Robb and Wolken (2003), Robb and Robinson (2010) • Many papers use size as proxy for access but suggest age is important. • Robb and Wolken and Robb and Robinson highlight the role of home equity for young
businesses
• Housing prices and impact on local economy – Mian and Sufi (2010, 2011a, 2011b)
21
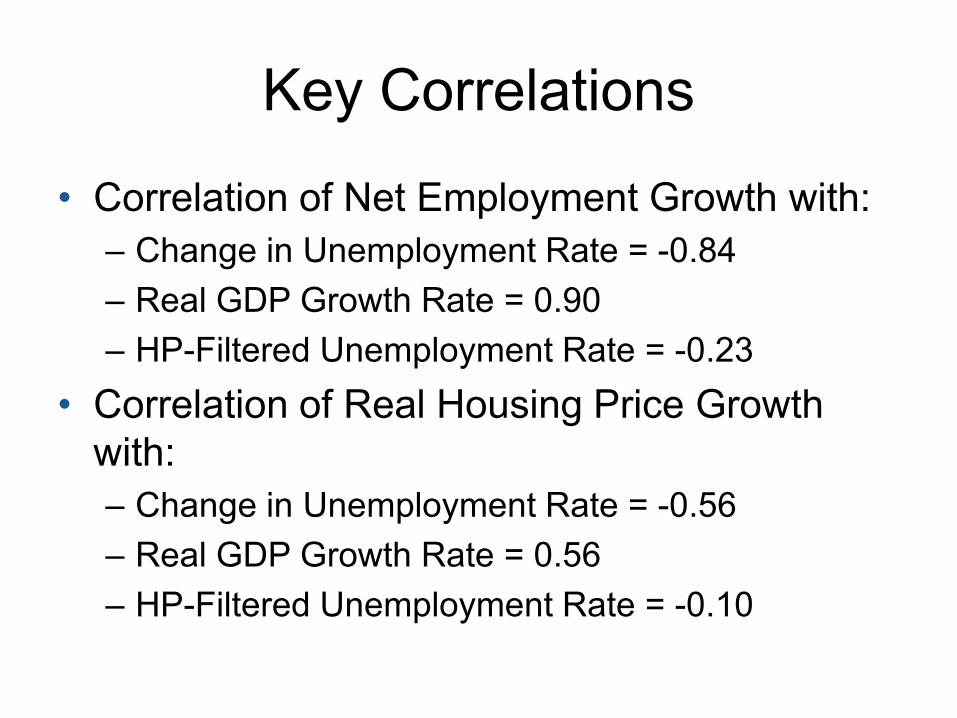
Key Correlations
• Correlation of Net Employment Growth with: – Change in Unemployment Rate = -0.84 – Real GDP Growth Rate = 0.90 – HP-Filtered Unemployment Rate = -0.23
• Correlation of Real Housing Price Growth with: – Change in Unemployment Rate = -0.56 – Real GDP Growth Rate = 0.56 – HP-Filtered Unemployment Rate = -0.10
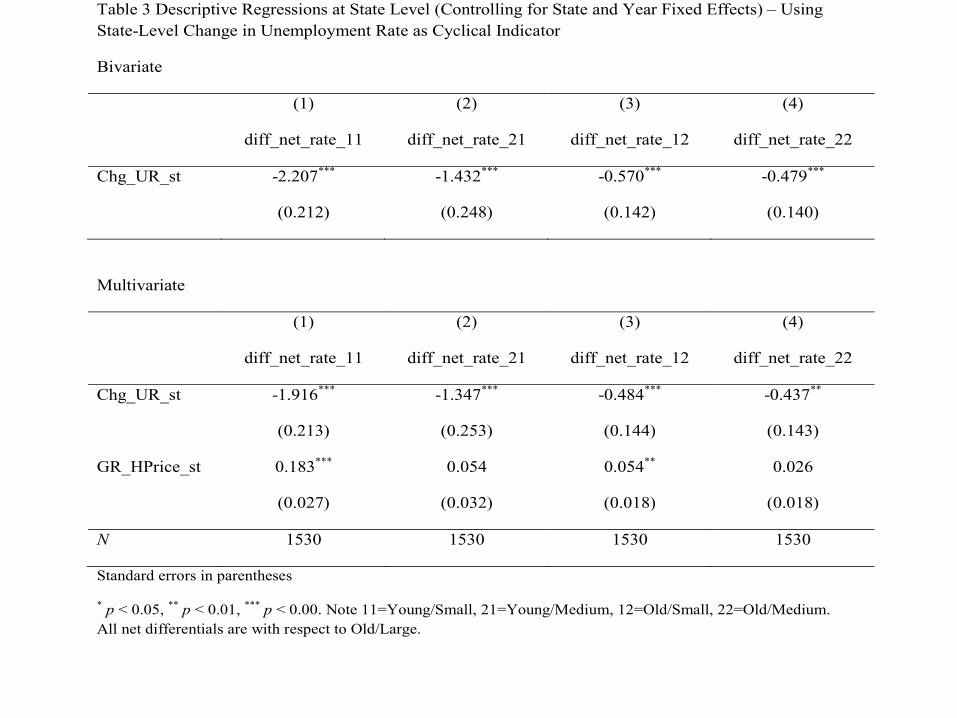
Table 3 Descriptive Regressions at State Level (Controlling for State and Year Fixed Effects) – Using State-Level Change in Unemployment Rate as Cyclical Indicator
Bivariate
(1) (2) (3) (4)
diff_net_rate_11 diff_net_rate_21 diff_net_rate_12 diff_net_rate_22
Chg_UR_st -2.207*** -1.432*** -0.570*** -0.479***
(0.212) (0.248) (0.142) (0.140)
Multivariate
(1) (2) (3) (4)
diff_net_rate_11 diff_net_rate_21 diff_net_rate_12 diff_net_rate_22
Chg_UR_st -1.916*** -1.347*** -0.484*** -0.437**
(0.213) (0.253) (0.144) (0.143)
GR_HPrice_st 0.183*** 0.054 0.054** 0.026
(0.027) (0.032) (0.018) (0.018)
N 1530 1530 1530 1530
Standard errors in parentheses
* p < 0.05, ** p < 0.01, *** p < 0.00. Note 11=Young/Small, 21=Young/Medium, 12=Old/Small, 22=Old/Medium. All net differentials are with respect to Old/Large.
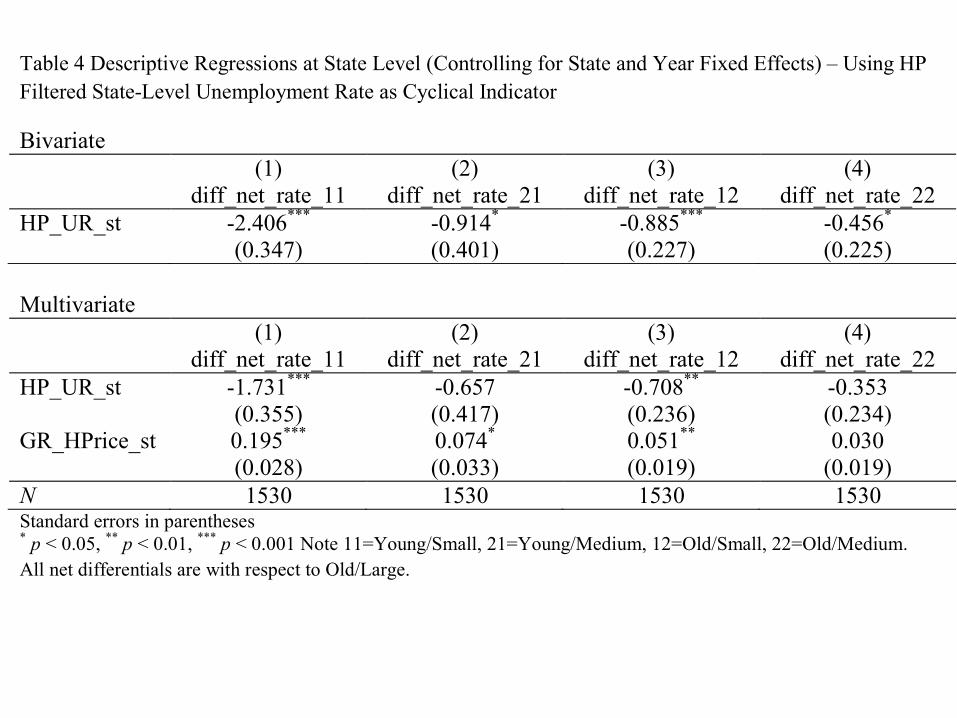
Table 4 Descriptive Regressions at State Level (Controlling for State and Year Fixed Effects) – Using HP Filtered State-Level Unemployment Rate as Cyclical Indicator
Bivariate (1) (2) (3) (4) diff_net_rate_11 diff_net_rate_21 diff_net_rate_12 diff_net_rate_22 HP_UR_st -2.406*** -0.914* -0.885*** -0.456* (0.347) (0.401) (0.227) (0.225) Multivariate (1) (2) (3) (4) diff_net_rate_11 diff_net_rate_21 diff_net_rate_12 diff_net_rate_22 HP_UR_st -1.731*** -0.657 -0.708** -0.353 (0.355) (0.417) (0.236) (0.234) GR_HPrice_st 0.195*** 0.074* 0.051** 0.030 (0.028) (0.033) (0.019) (0.019) N 1530 1530 1530 1530 Standard errors in parentheses * p < 0.05, ** p < 0.01, *** p < 0.001 Note 11=Young/Small, 21=Young/Medium, 12=Old/Small, 22=Old/Medium. All net differentials are with respect to Old/Large.
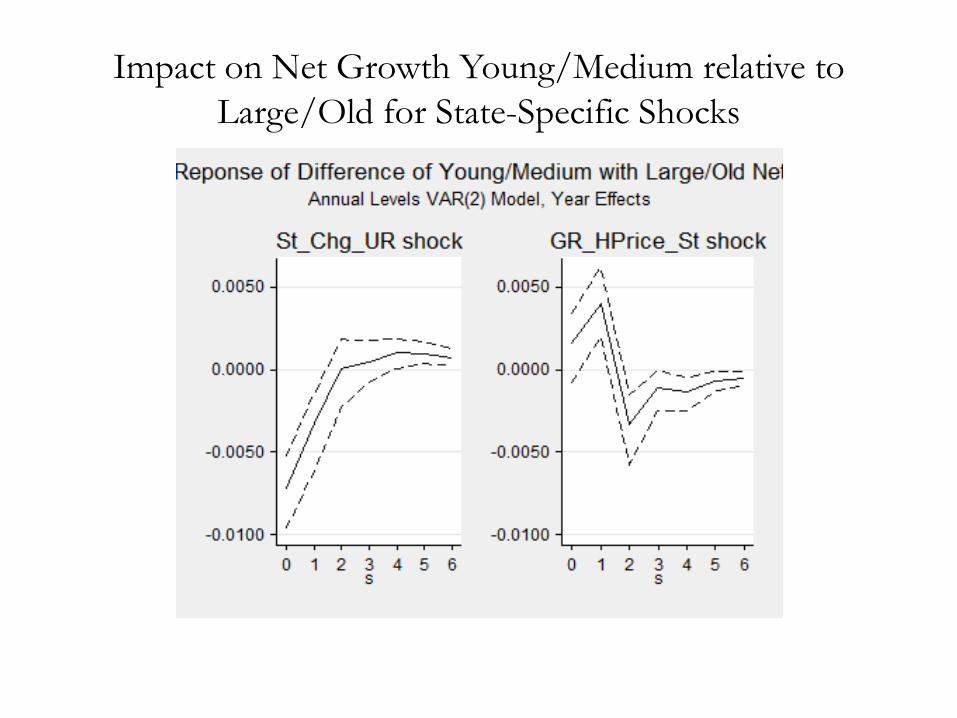
Impact on Net Growth Young/Medium relative to Large/Old for State-Specific Shocks
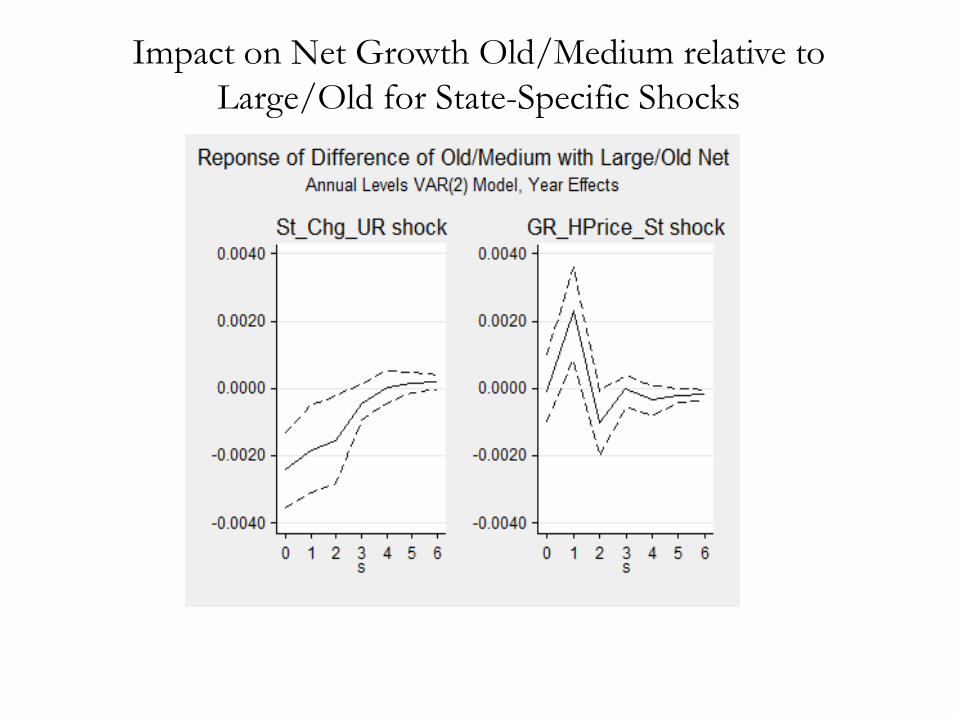
Impact on Net Growth Old/Medium relative to Large/Old for State-Specific Shocks
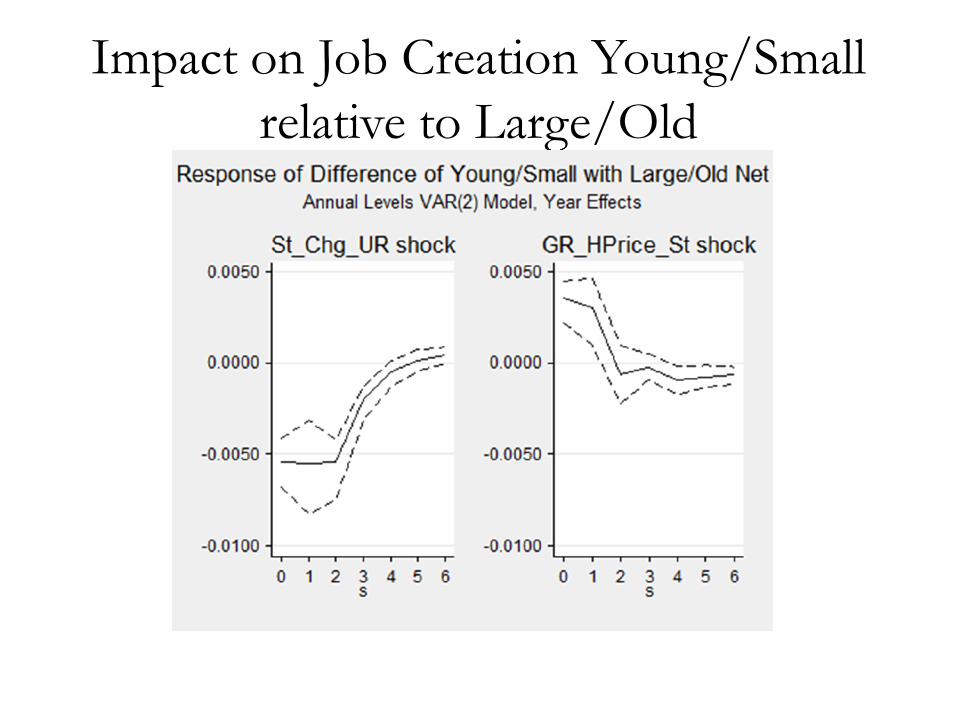
Impact on Job Creation Young/Small relative to Large/Old
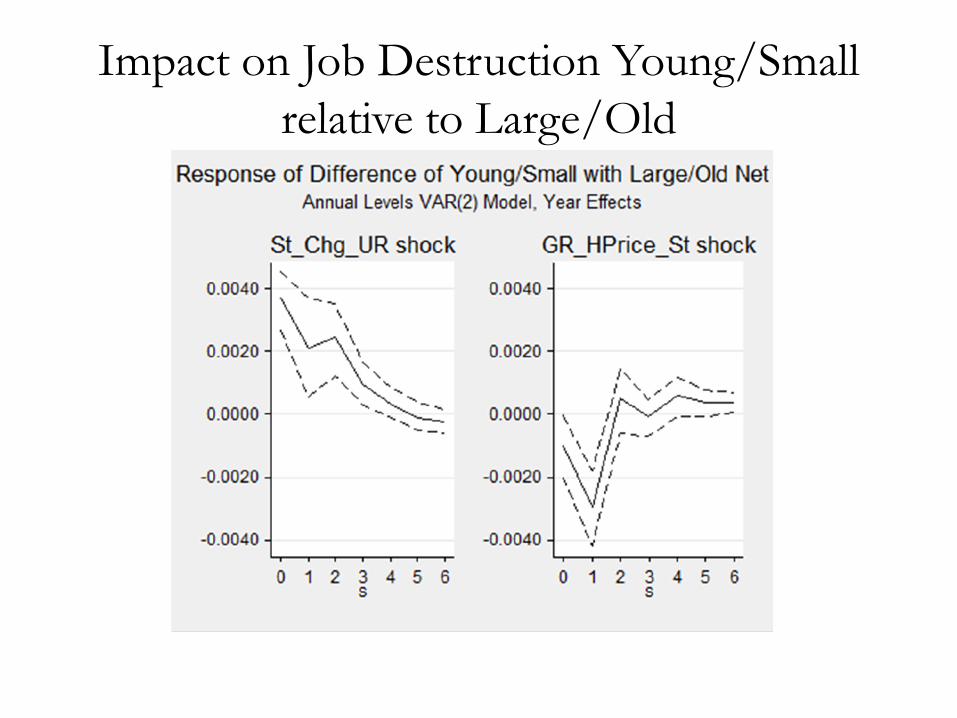
Impact on Job Destruction Young/Small relative to Large/Old
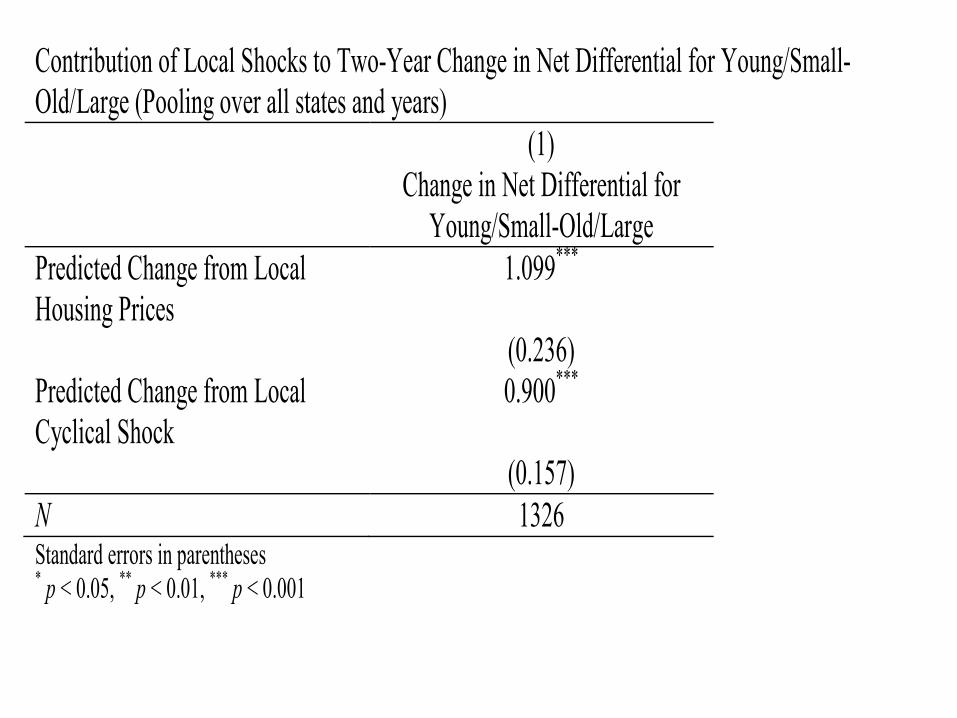
Contribution of Local Shocks to Two-Year Change in Net Differential for Young/Small-Old/Large (Pooling over all states and years) (1) Change in Net Differential for
Young/Small-Old/Large Predicted Change from Local Housing Prices
1.099***
(0.236) Predicted Change from Local Cyclical Shock
0.900***
(0.157) N 1326 Standard errors in parentheses * p < 0.05, ** p < 0.01, *** p < 0.001
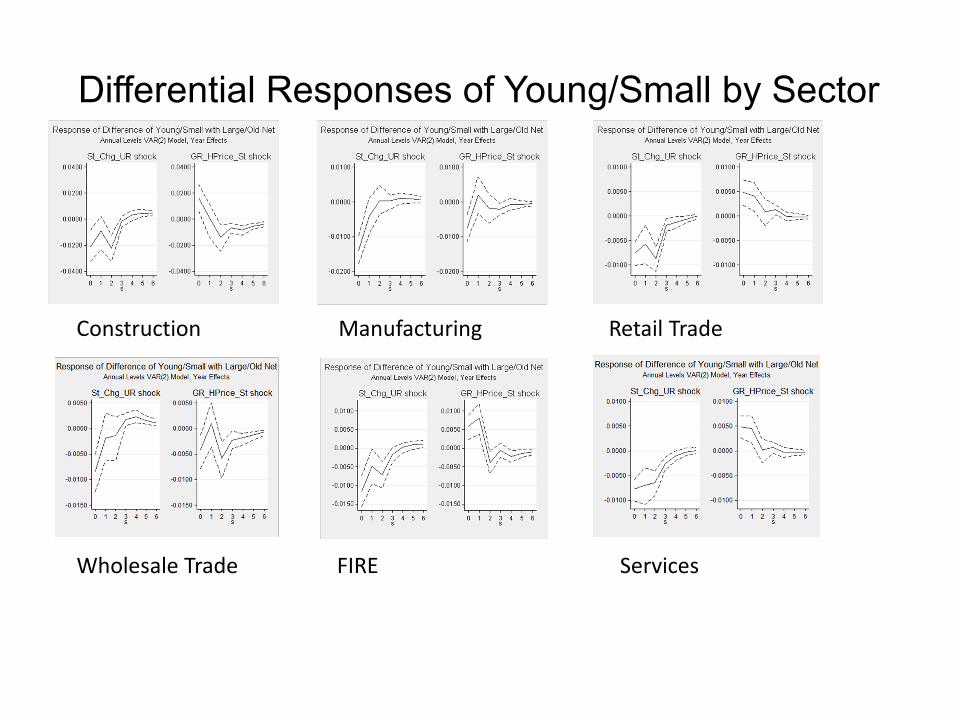
Differential Responses of Young/Small by Sector
Construction Manufacturing Retail Trade
Wholesale Trade FIRE Services


The Role of Housing Prices for Young Firms?
• Mian and Sufi (2010, 2011a, 2011b) relevant here. • They find that the impact of state-specific housing prices
greater for non-tradeables. • Pooled sector results could have been driven by this if
young/small disproportionately in tradeables. • But our results hold within sectors so not just a between
effect. • Not for all sectors. Our greater sensitivity for non-
tradeables but also Construction, Services, and FIRE. • Must be a reason that young are more sensitive even within non-
tradeables. • Is it credit channel? Maybe but need direct evidence that
home equity more relevant in some sectors. • Is sectoral variation in results due to variation in entry costs?