Embed Size (px)
Citation preview
17 April, 2018
Dr. Walter Kemmsies
Chief Strategist
JLL Ports Airports and Global Infrastructure
How Global Trade Is Driving Demand For
Ports

2
Capital MarketsProvides access to equity and debt capital (including municipal bonds)
JLL Ports Airports and Global Infrastructure

3
Demand for port services remains strong
• The drivers of global trade remain intact
Benign global economic environment continues if productivity picks up
Growing global middle class
Waterborne freight costs continue to decline
• Congestion, slightly offset by automation, has impacted logistics and retail
Shopping at retail outlets is a lot less convenient
Logistics and transportation labor productivity declined
Worsening reliability requires more safety stock (inventory)
• The three T’s of policy indicate more growth ahead, particularly exports
Trade agreement renegotiation could open foreign markets
Tax reform incentives manufacturing capacity increases
Transportation infrastructure investment is critical

Source: Oxford, JLL 4
Best global economic environment in 20 years
0
50
100
150
200
250
300
Mar
-94
Feb-
95
Jan-
96
Dec
-96
Nov
-97
Oct
-98
Sep-
99
Aug
-00
Jul-0
1
Jun-
02
May
-03
Apr
-04
Mar
-05
Feb-
06
Jan-
07
Dec
-07
Nov
-08
Oct
-09
Sep-
10
Aug
-11
Jul-1
2
Jun-
13
May
-14
Apr
-15
Mar
-16
Feb-
17
Jan-
18
Dec
-18
Copper
Raw Materials
Agricultural
Oil
Steel
-6%
-4%
-2%
0%
2%
4%
6%
8%
10%
12%
14%
16%
2001
2002
2003
2004
2005
2006
2007
2008
2009
2010
2011
2012
2013
2014
2015
2016
2017
2018
India
China
US
Brazil
Mexico
Eurozone
Japan
ANNUAL REAL GDP GROWTH 2001 – 2018(E) COMMODITY PRICES 1994 – 2018 (2018 =100)

5
Where is the US in the business cycle?
-6%
-4%
-2%
0%
2%
4%
6%
8%
10%
12%
14%
16%
19
48
19
50
19
52
19
54
19
56
19
58
19
60
19
62
19
64
19
66
19
68
19
70
19
72
19
74
19
76
19
78
19
80
19
82
19
84
19
86
19
88
19
90
19
92
19
94
19
96
19
98
20
00
20
02
20
04
20
06
20
08
20
10
20
12
20
14
20
16
20
18
Recession Employment + Productivity RGDP
ANNUAL REAL GDP, PRODUCTIVITY AND EMPLOYMENT GROWTH 1948 – 2017
• Average expansion period between 1948 and 2018 is 19 quarters
• Longest expansion period was September 1990 to December 2000 (39 quarters)
• Current expansion period is 34 quarters
• Current expansion period is the first since 1948 not to experience a bounce-back
• Key question is why has growth slowed so significantly in the last few decades

6
What has happened to the drivers of GDP growth?
ANNUAL PRODUCTIVITY AND EMPLOYMENT GROWTH 2001 – 2017
• Employment growth has slowed due to aging population and low labor demand growth
• Key question is why has productivity growth slowed so significantly in the last 10 to 15 years
-8%
-6%
-4%
-2%
0%
2%
4%
6%
8%
10%
2001 2003 2005 2007 2009 2011 2013 2015 2017
Recession Productivity Employment

-40%
-30%
-20%
-10%
0%
10%
20%
30%
40%
19
50
19
52
19
54
19
56
19
58
19
60
19
62
19
64
19
66
19
68
19
70
19
72
19
74
19
76
19
78
19
80
19
82
19
84
19
86
19
88
19
90
19
92
19
94
19
96
19
98
20
00
20
02
20
04
20
06
20
08
20
10
20
12
20
14
20
16
Recession Nonresidential7
US investment spending trends
US NON-RESIDENTIAL INVESTMENT SPENDING GROWTH 1950 - 2017
• Average investment spending growth from 1950 to 2017 was 4.9% per year
• Excluding recessions, investment spending growth averaged 7% per year from 1950 to 2017
• Since the 2007 – 2009 recession ended, average investment spending was 4.6% per year
• During the period since the recession corporate profits, dividends and share buy backs increased substantially
8
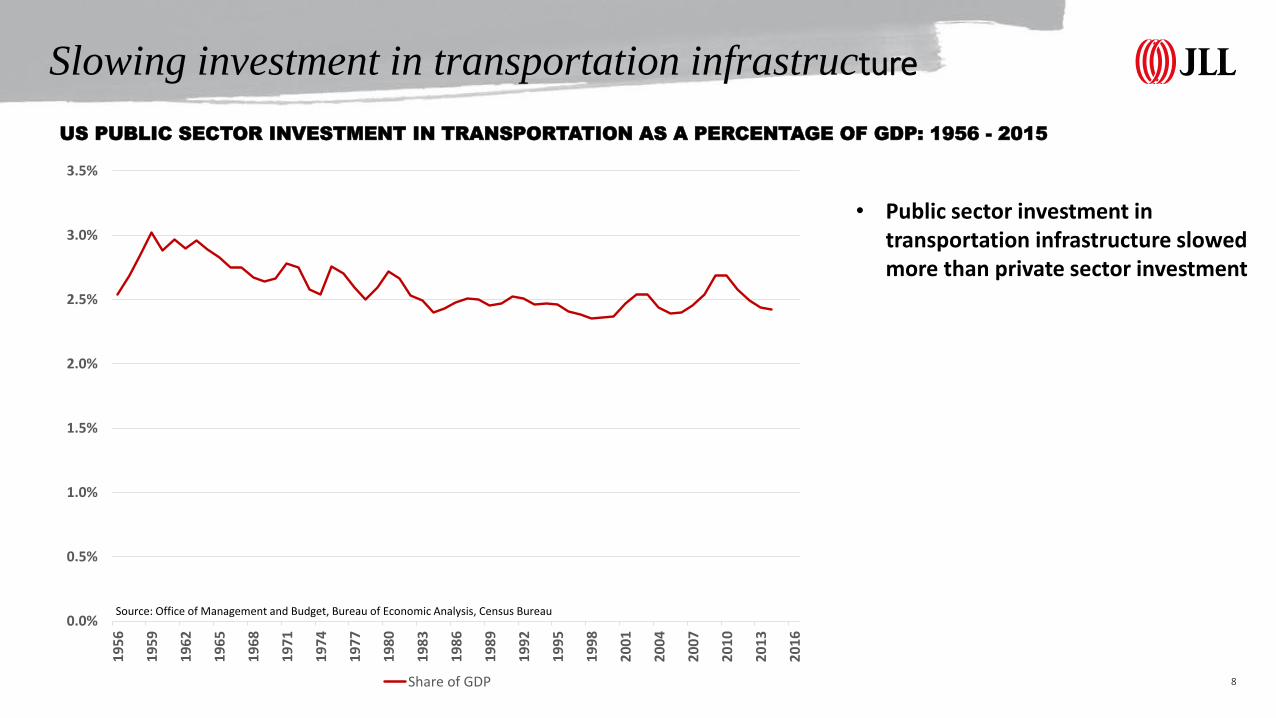
Slowing investment in transportation infrastructure
0.0%
0.5%
1.0%
1.5%
2.0%
2.5%
3.0%
3.5%
19
56
19
59
19
62
19
65
19
68
19
71
19
74
19
77
19
80
19
83
19
86
19
89
19
92
19
95
19
98
20
01
20
04
20
07
20
10
20
13
20
16
Share of GDP
Source: Office of Management and Budget, Bureau of Economic Analysis, Census Bureau
US PUBLIC SECTOR INVESTMENT IN TRANSPORTATION AS A PERCENTAGE OF GDP: 1956 - 2015
• Public sector investment in transportation infrastructure slowed more than private sector investment
0%
2%
4%
6%
8%
10%
12%
14%
19
60
19
62
19
64
19
66
19
68
19
70
19
72
19
74
19
76
19
78
19
80
19
82
19
84
19
86
19
88
19
90
19
92
19
94
19
96
19
98
20
00
20
02
20
04
20
06
20
08
20
10
20
12
20
14
20
16
20
18
Recession Wages CPI (Exc Food and Energy) 9
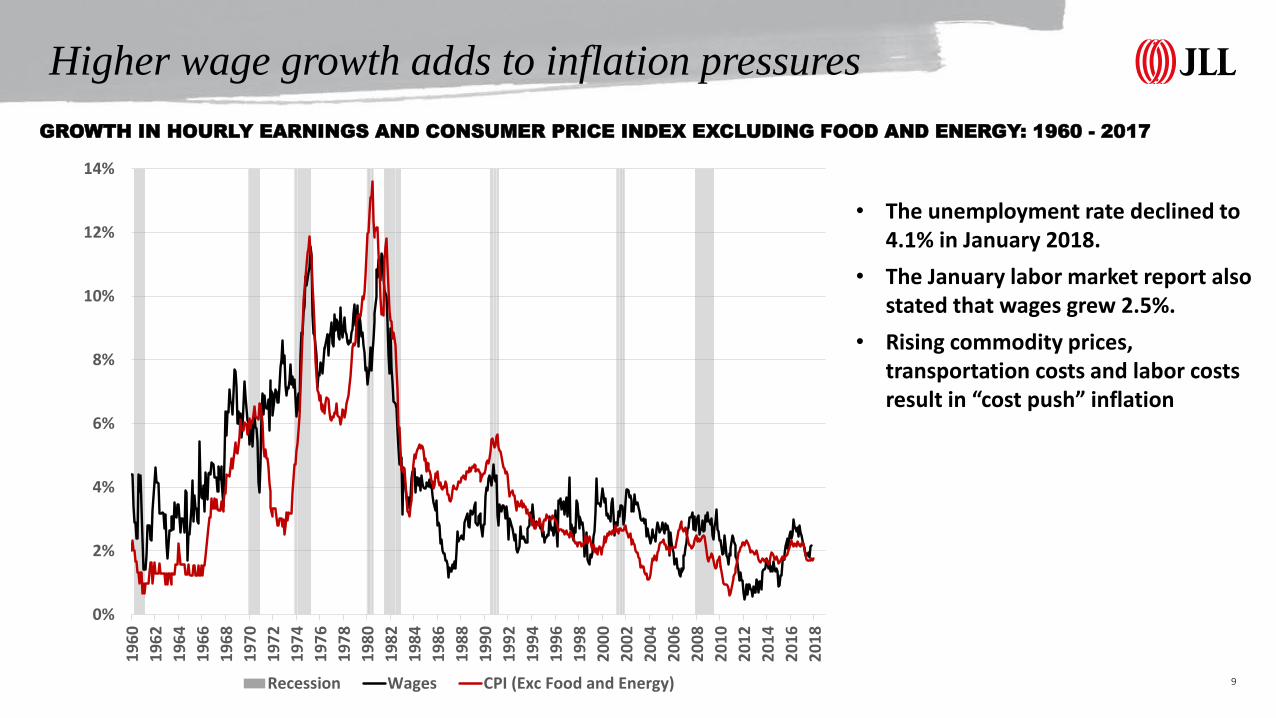
Higher wage growth adds to inflation pressures
GROWTH IN HOURLY EARNINGS AND CONSUMER PRICE INDEX EXCLUDING FOOD AND ENERGY: 1960 - 2017
• The unemployment rate declined to 4.1% in January 2018.
• The January labor market report also stated that wages grew 2.5%.
• Rising commodity prices, transportation costs and labor costs result in “cost push” inflation

0
10
20
30
40
50
60
70
80
90
19
50
19
53
19
56
19
59
19
62
19
65
19
68
19
71
19
74
19
77
19
80
19
83
19
86
19
89
19
92
19
95
19
98
20
01
20
04
20
07
20
10
20
13
20
16
Vo
lum
e In
dex
GDP Total Agriculture Fuels & Mining Manufactured
Manufactured goods leads global trade volume growth
WORLD REAL GDP AND TRADE INDEXES 1950-2015E
Source: WTO, JLL
Japan, Brazil
Korea, Taiwan
ChinaRelative to GDP Growth
GDP 3.7% 1.0
Manufactured Goods 7.0% 1.9
Fuels and Mining Products 3.8% 1.0
Agricultural Goods 3.5% 1.0
Total Trade 5.8% 1.6
1950 - 2015 CAGR Trade is driven by:
• Resources – better to worse endowed
countries
• Demographics – manufacture in low
cost, high demand growth countries
• Trade Agreements – no barriers or
burdens
• Infrastructure – road, rail, ports, fleets
• Technology – information and
communication
Most trade agreements are focused on
manufactured goods, not raw materials
11
0.0
0.5
1.0
1.5
2.0
2.5
3.0
3.5
4.0
4.5
20
05
20
06
20
06
20
07
20
07
20
08
20
08
20
09
20
09
20
10
20
10
20
11
20
11
20
12
20
12
20
13
20
13
20
14
20
14
20
15
20
15
20
16
20
16
20
17
20
17
TEU
Mill
ion
s
Import Export Empty Total Loaded Total
Source: American Association of Port Authorities
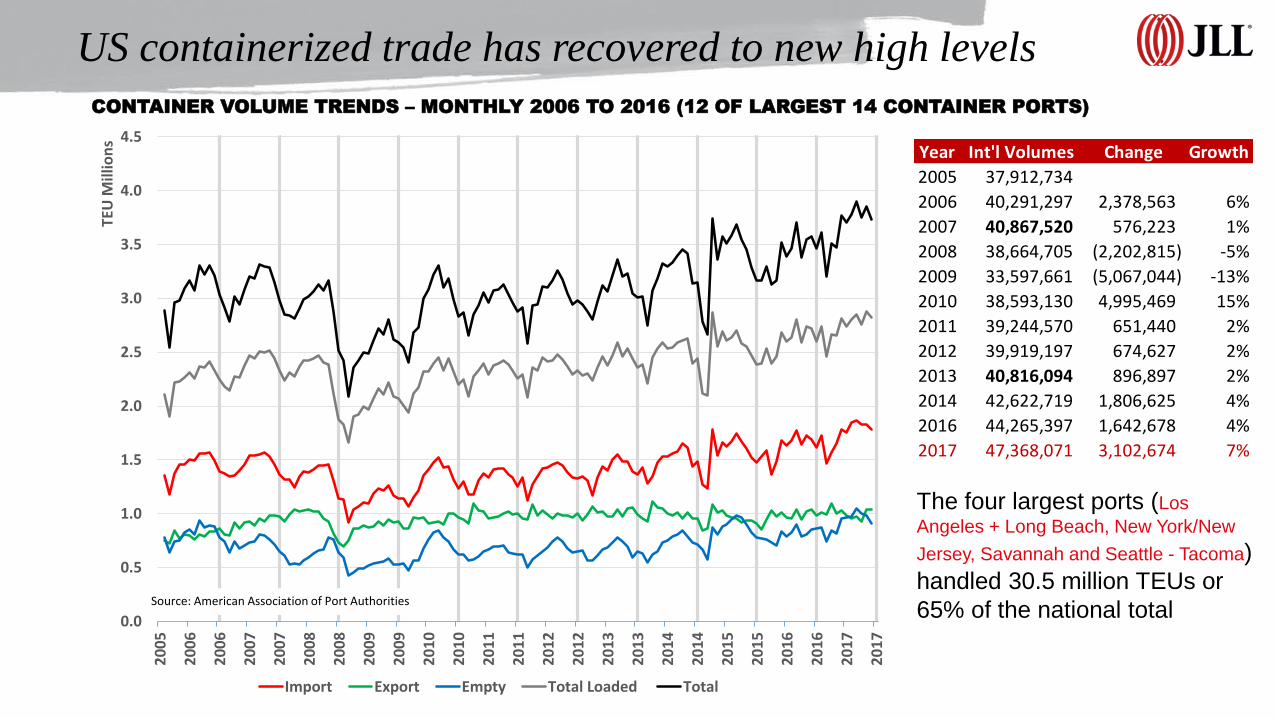
US containerized trade has recovered to new high levels
CONTAINER VOLUME TRENDS – MONTHLY 2006 TO 2016 (12 OF LARGEST 14 CONTAINER PORTS)
The four largest ports (Los
Angeles + Long Beach, New York/New
Jersey, Savannah and Seattle - Tacoma)
handled 30.5 million TEUs or
65% of the national total
Year Int'l Volumes Change Growth
2005 37,912,734
2006 40,291,297 2,378,563 6%
2007 40,867,520 576,223 1%
2008 38,664,705 (2,202,815) -5%
2009 33,597,661 (5,067,044) -13%
2010 38,593,130 4,995,469 15%
2011 39,244,570 651,440 2%
2012 39,919,197 674,627 2%
2013 40,816,094 896,897 2%
2014 42,622,719 1,806,625 4%
2016 44,265,397 1,642,678 4%
2017 47,368,071 3,102,674 7%

Larger ships have lower average container costsEVOLUTION OF CONTAINERSHIP SIZE
Source: Alphaliner, World Shipping Council

Largest ocean carriers then and now
Source: JLL Research
Acquired
Bankrupt
Acquired
Acquired
Acquired
Merging
TOP 20 IN 2012TOP 20 IN 2017
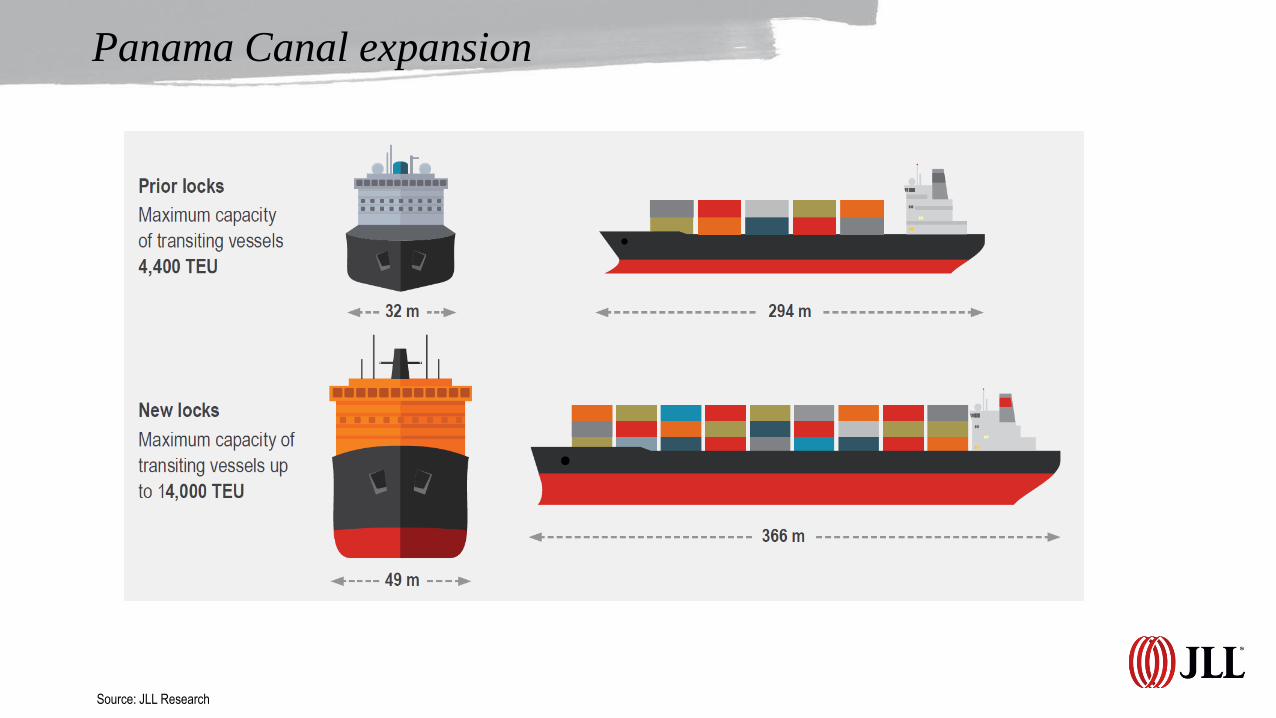
Panama Canal expansion
Source: JLL Research

Accommodating larger vessels
Source: JLL Research
Who pays?
• Federal
Government
• State Governments
• Port Authorities

What it means to handle a 13K TEU vessel service
Source: JLL
13,000 TEU Vessel
95% Full
13,700 lifts to unload and load
77% moved by truck
10,600 one-way truck trips
122 miles of trucks end-to-
end
23% moved by rail
9 unit trains
18 miles of trains end-to-
end
642,200 TEUs per year
93,410,909 sf of DC space
Average Intermodal Shares of Various Ports
Los Angeles/Long Beach 40% New York 25%
Savannah 18% Norfolk 35%

Roadway congestion is getting worse
2020 CONGESTION FORECASTS, WITH TRUCKS
No gas tax increases in 20
years left the Highway Trust
Fund in financial distress
Other considerations:
• FMCSA increased
restrictions on Hours of
Service
• National truck driver
shortage estimated to be
200,000 drivers
• Younger generation prefers
not to spend the night away
from home
• Electronic Logging Devices
(ELD) required as of
April 1, 2018

18
Ecommerce trends
RETAIL AND ECOMMERCE SALES
Source: Census Bureau, JLL
• Ecommerce share of retail
sales has increased from
less than 1% in Q4-1999 to
10.5% in Q4-2017
• Ecommerce is expected to
continue to gain share as
retailers adapt their business
models and re-optimize their
distribution networks
• The goal is to develop a
successful omnichannel
strategy
0%
2%
4%
6%
8%
10%
12%
14%
16%
0
200
400
600
800
1,000
1,200
1,400
1,6001
99
9
20
00
20
01
20
02
20
03
20
04
20
05
20
06
20
07
20
08
20
09
20
10
20
11
20
12
20
13
20
14
20
15
20
16
20
17
Bill
ion
s o
f U
S D
olla
rs
Ecommerce Share (right) Total (left) E-commerce (right)

19
How purchases were made in 2016
CONSUMER SEGMENTS BASED ON SHOPPING BEHAVIOR
Source: American Association of Port Authorities, JLL
A total of 58% of shoppers made purchases online in 2016, a shift away from in store purchases.
Survey of 5,000 shoppers in a Wall Street Journal study
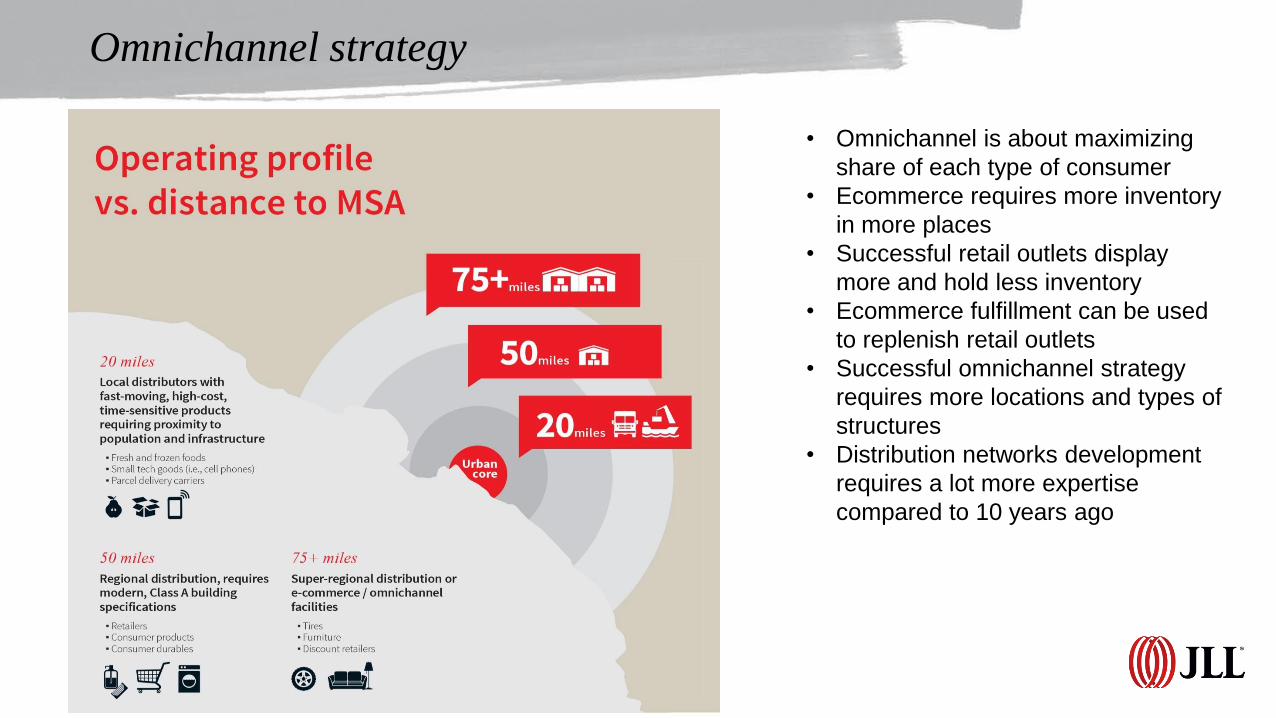
Omnichannel strategy
• Omnichannel is about maximizing
share of each type of consumer
• Ecommerce requires more inventory
in more places
• Successful retail outlets display
more and hold less inventory
• Ecommerce fulfillment can be used
to replenish retail outlets
• Successful omnichannel strategy
requires more locations and types of
structures
• Distribution networks development
requires a lot more expertise
compared to 10 years ago
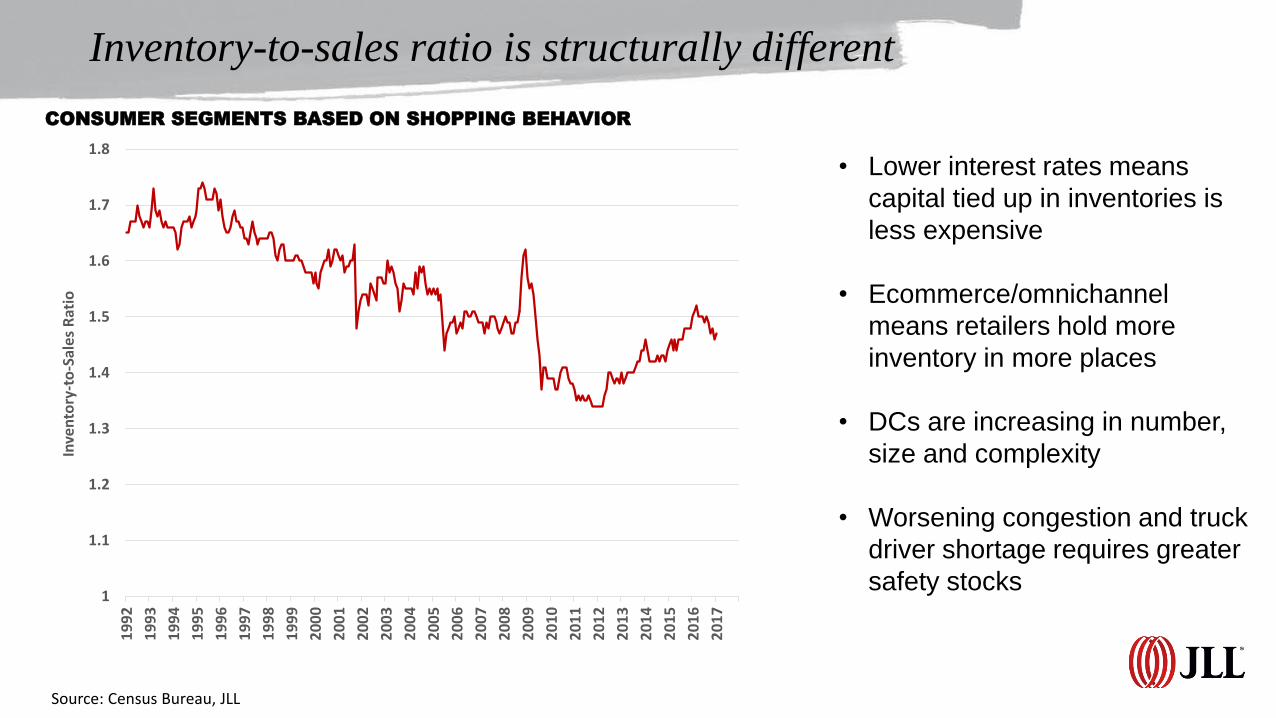
Inventory-to-sales ratio is structurally different
1
1.1
1.2
1.3
1.4
1.5
1.6
1.7
1.8
19
92
19
93
19
94
19
95
19
96
19
97
19
98
19
99
20
00
20
01
20
02
20
03
20
04
20
05
20
06
20
07
20
08
20
09
20
10
20
11
20
12
20
13
20
14
20
15
20
16
20
17
Inve
nto
ry-t
o-S
ale
s R
atio
• Lower interest rates means
capital tied up in inventories is
less expensive
• Ecommerce/omnichannel
means retailers hold more
inventory in more places
• DCs are increasing in number,
size and complexity
• Worsening congestion and truck
driver shortage requires greater
safety stocks
CONSUMER SEGMENTS BASED ON SHOPPING BEHAVIOR
Source: Census Bureau, JLL

Inland hubs are becoming more numerous
• Source: JLL Research
Four Kinds of Inland Hubs:
• DC clusters, e.g., Inland Empire
• Railyards, e.g., Logistics Park Kansas City
• Private sector developments, e.g., Centerpoint
• Public sector operated, e.g., Cordele

Growing global middle class is the largest sustainable source of growth
WORLD POPULATION AND OECD GLOBAL MIDDLE CLASS PROJECTIONS
Source: OECD, US Census Bureau
1.8
3.0
3.8
4.6
5.4
6.9
7.3
7.6
8.08.3
0
1
2
3
4
5
6
7
8
92
01
0
20
11
20
12
20
13
20
14
20
15
20
16
20
17
20
18
20
19
20
20
20
21
20
22
20
23
20
24
20
25
20
26
20
27
20
28
20
29
20
30
Bill
ion
s
Global Middle Class World Population
• For US growth to be
sustained above 3% it will
be necessary to sell into
this market
• US exports are the focus
of the current national
economic policy

The trade deficit value gap
GOODS TRADE DEFICIT IN US$: 2003 – 2016E GOODS TRADE DEFICIT IN METRIC TONS: 2003 – 2016E
$0.00
$0.25
$0.50
$0.75
$1.00
$1.25
20
03
20
04
20
05
20
06
20
07
20
08
20
09
20
10
20
11
20
12
20
13
20
14
20
15
20
16
Trill
ion
s
Balance of Trade Value Import Value Export Value
Source: US Census Bureau
0
200
400
600
800
1,000
1,200
20
03
20
04
20
05
20
06
20
07
20
08
20
09
20
10
20
11
20
12
20
13
20
14
20
15
20
16
Mill
ion
Met
ric
Ton
s
Balance of Trade Volume Import Volume Export Volume
Source: US Census Bureau
• US imports high value per ton goods and exports low value per ton goods
• Imports have been able to support import-oriented infrastructure investment
• To support higher economic growth, the US needs to focus on growing low value per tons

Non-containerized trade trends
• Liquid bulk, petroleum and natural gas, provide
the best opportunities to improve the US trade
deficit
• US must focus on growing agriculture, capital
goods and energy exports
Source: Census Bureau, JLL
0
1
2
3
4
5
6
7
8
92
00
3
20
04
20
05
20
06
20
07
20
08
20
09
20
10
20
11
20
12
20
13
20
14
20
15
20
16
20
17
20
18
Mill
ion
s o
f V
eh
icle
s
US Imports US Exports
0
50
100
150
200
250
20
03
20
04
20
05
20
06
20
07
20
08
20
09
20
10
20
11
20
12
20
13
20
14
20
15
20
16
20
17
Mill
ion
s o
f M
etr
ic T
on
s
Dy Bulk + Break Bulk Exports Dy Bulk + Break Bulk Imports
VEHICLES IMPORTS AND EXPORTS BULK/BREAKBULK IMPORTS AND EXPORTS
0
100
200
300
400
500
600
700
20
03
20
04
20
05
20
06
20
07
20
08
20
09
20
10
20
11
20
12
20
13
20
14
20
15
20
16
20
17
Mill
ion
s o
f M
etr
ic T
on
s
Liquid Bulk Exports Liquid Bulk Imports
LIQUID BULK IMPORTS AND EXPORTS

26
Summary
• The drivers of global trade remain intact
• Unbalanced investment in freight corridors underlies the West to East coast shift
• The three T’s of policy indicate more growth ahead, particularly exports
27
PAGI thanks you for your timeFor more information visit us online at www.us.jll.com/pagi or contact one of our team members:
Mark Levy
+1 703 389 4203 [email protected]
Walter Kemmsies
+1 443 451 2607 [email protected]
Keith Stauber
+1 773 458 1386 [email protected]
Jonathan Walk
+1 202 531 6997 [email protected]
Steve Ostrowski
+1 773 458 1417 [email protected]
Michael Morehead
+1 443 804 9505 [email protected]